Spectral Camouflage Characteristics and Recognition Ability of Targets Based on Visible/Near-Infrared Hyperspectral Images
Abstract
:1. Introduction
2. Acquisition of Spectral Reflectance of Ground Objects
3. Experimental Section
3.1. Experimental Condition
3.2. Experiment 1
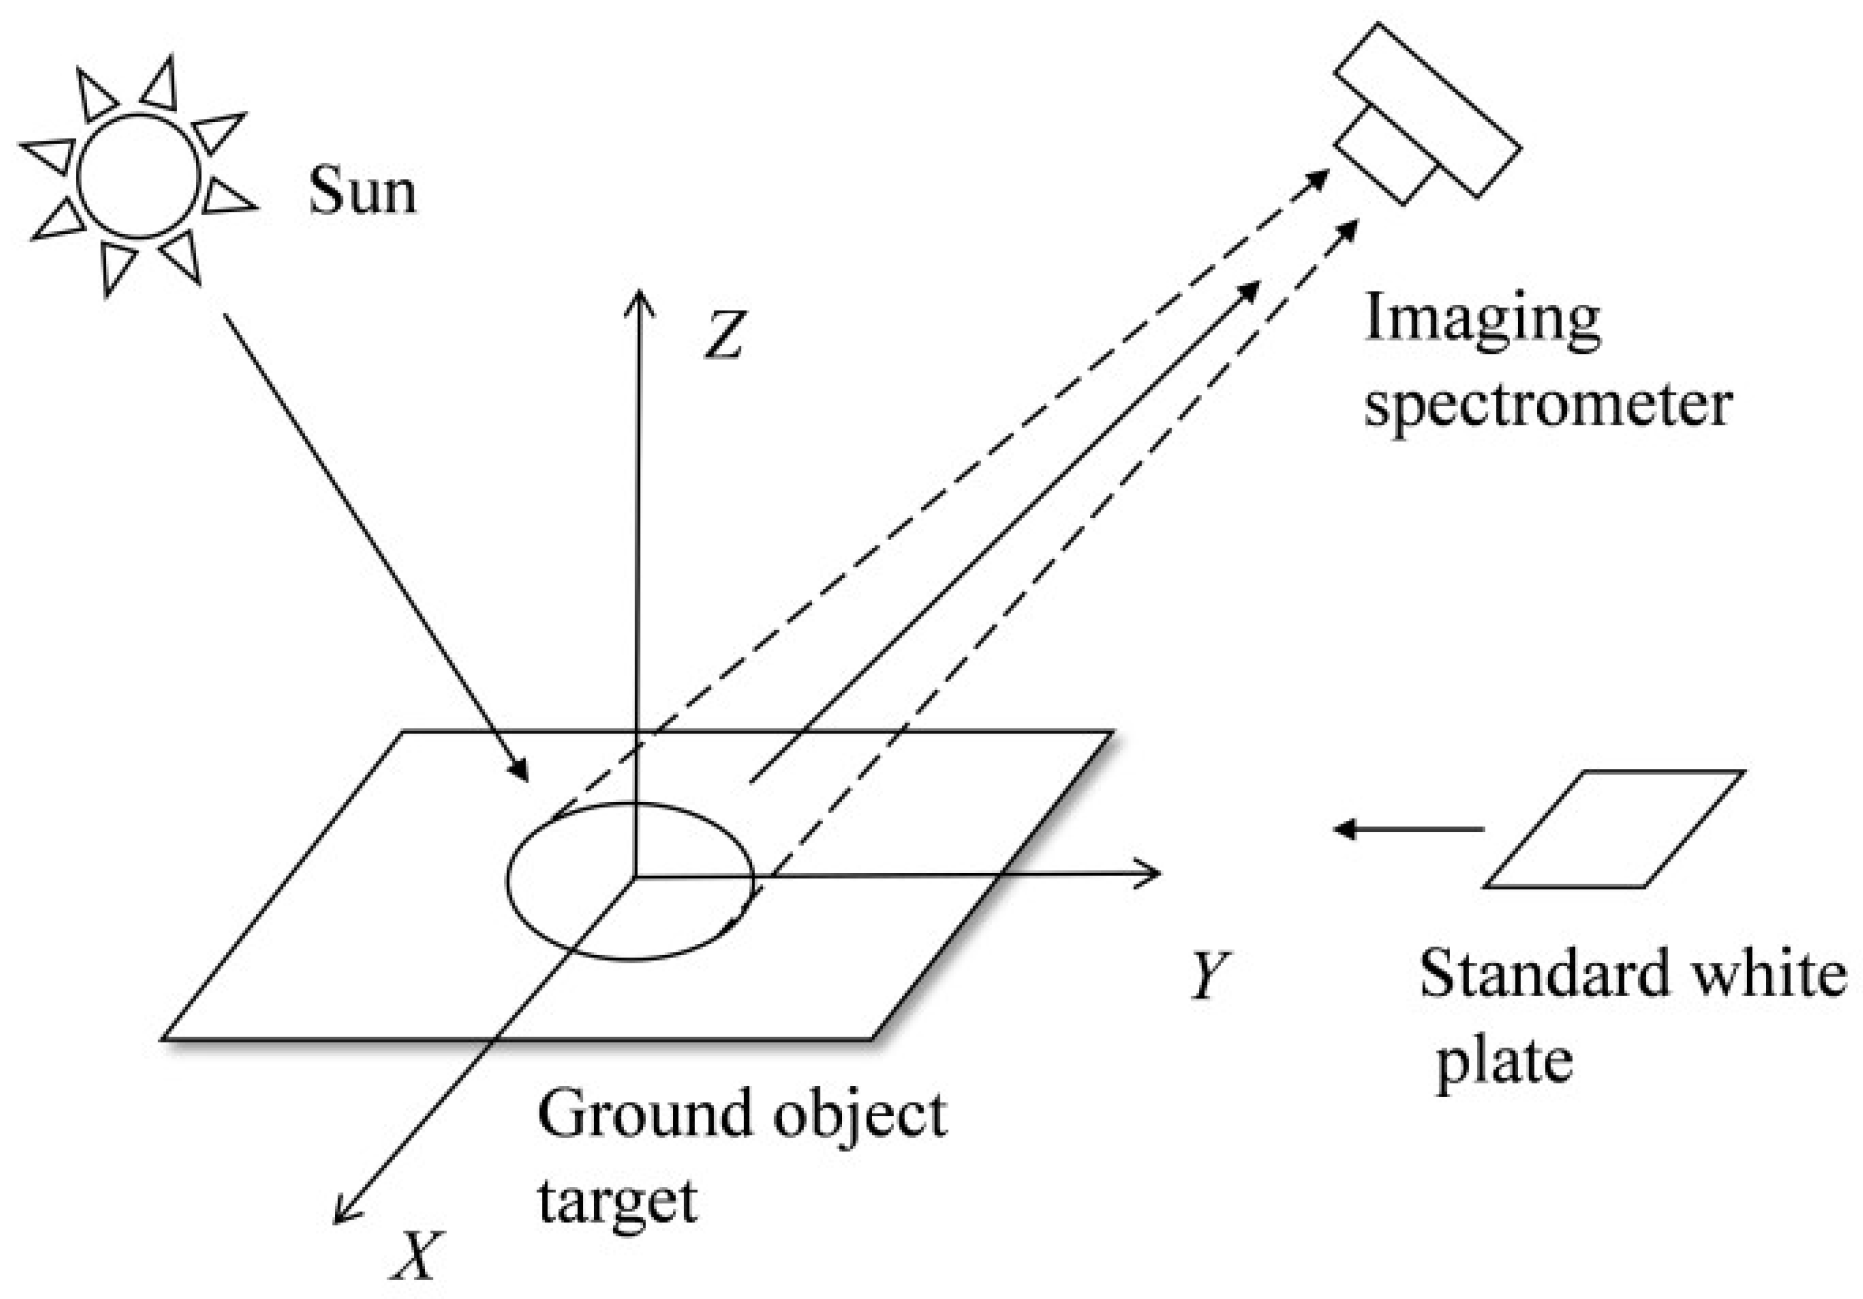
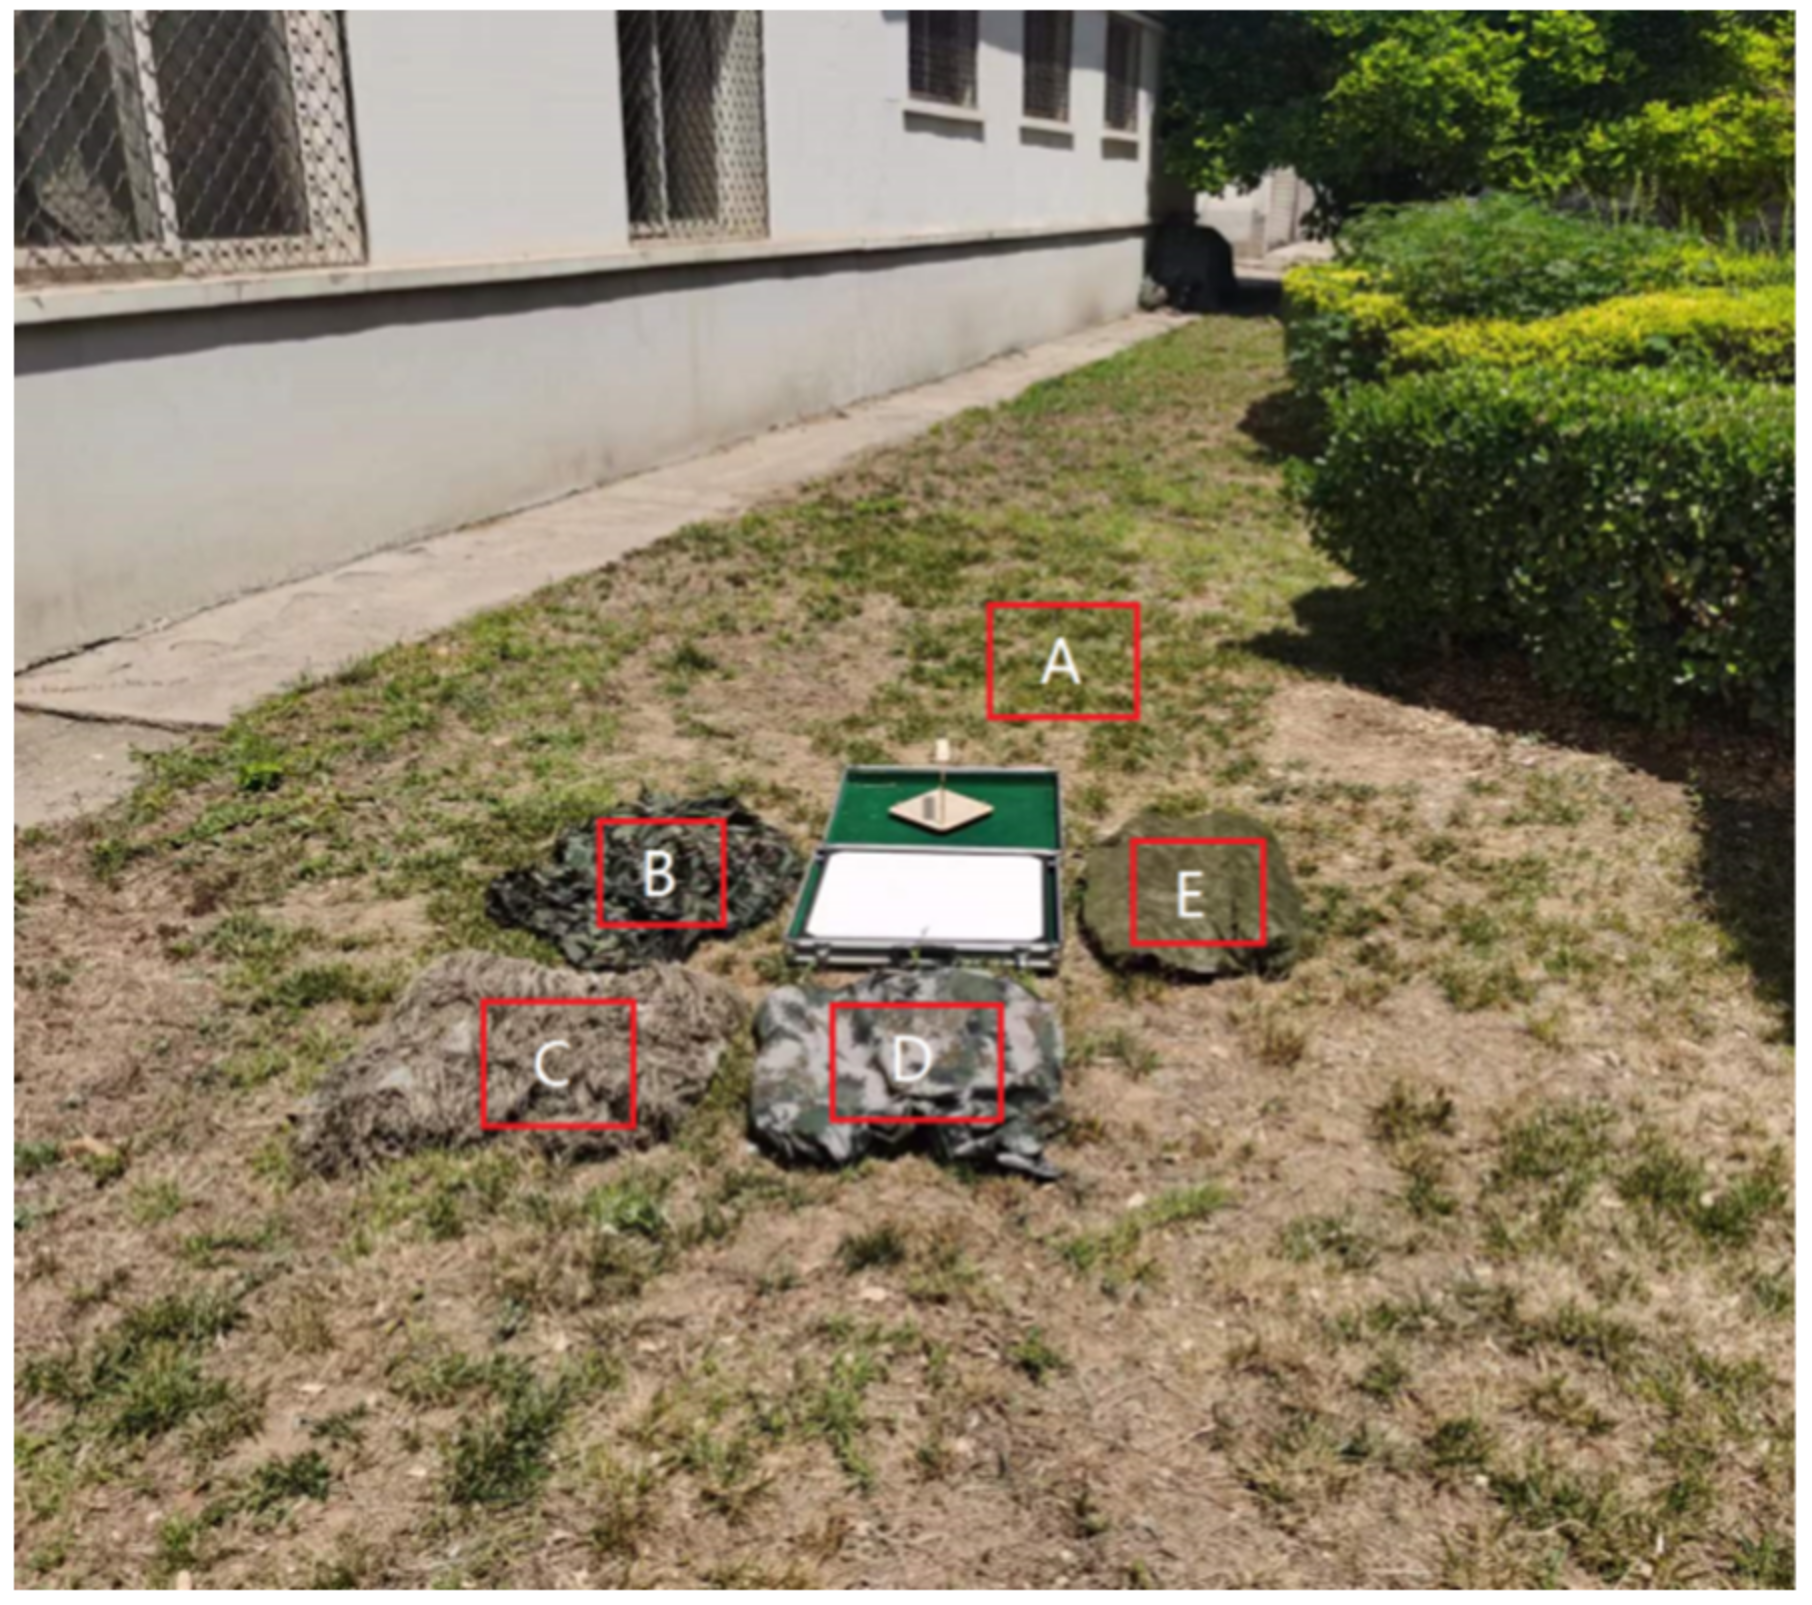
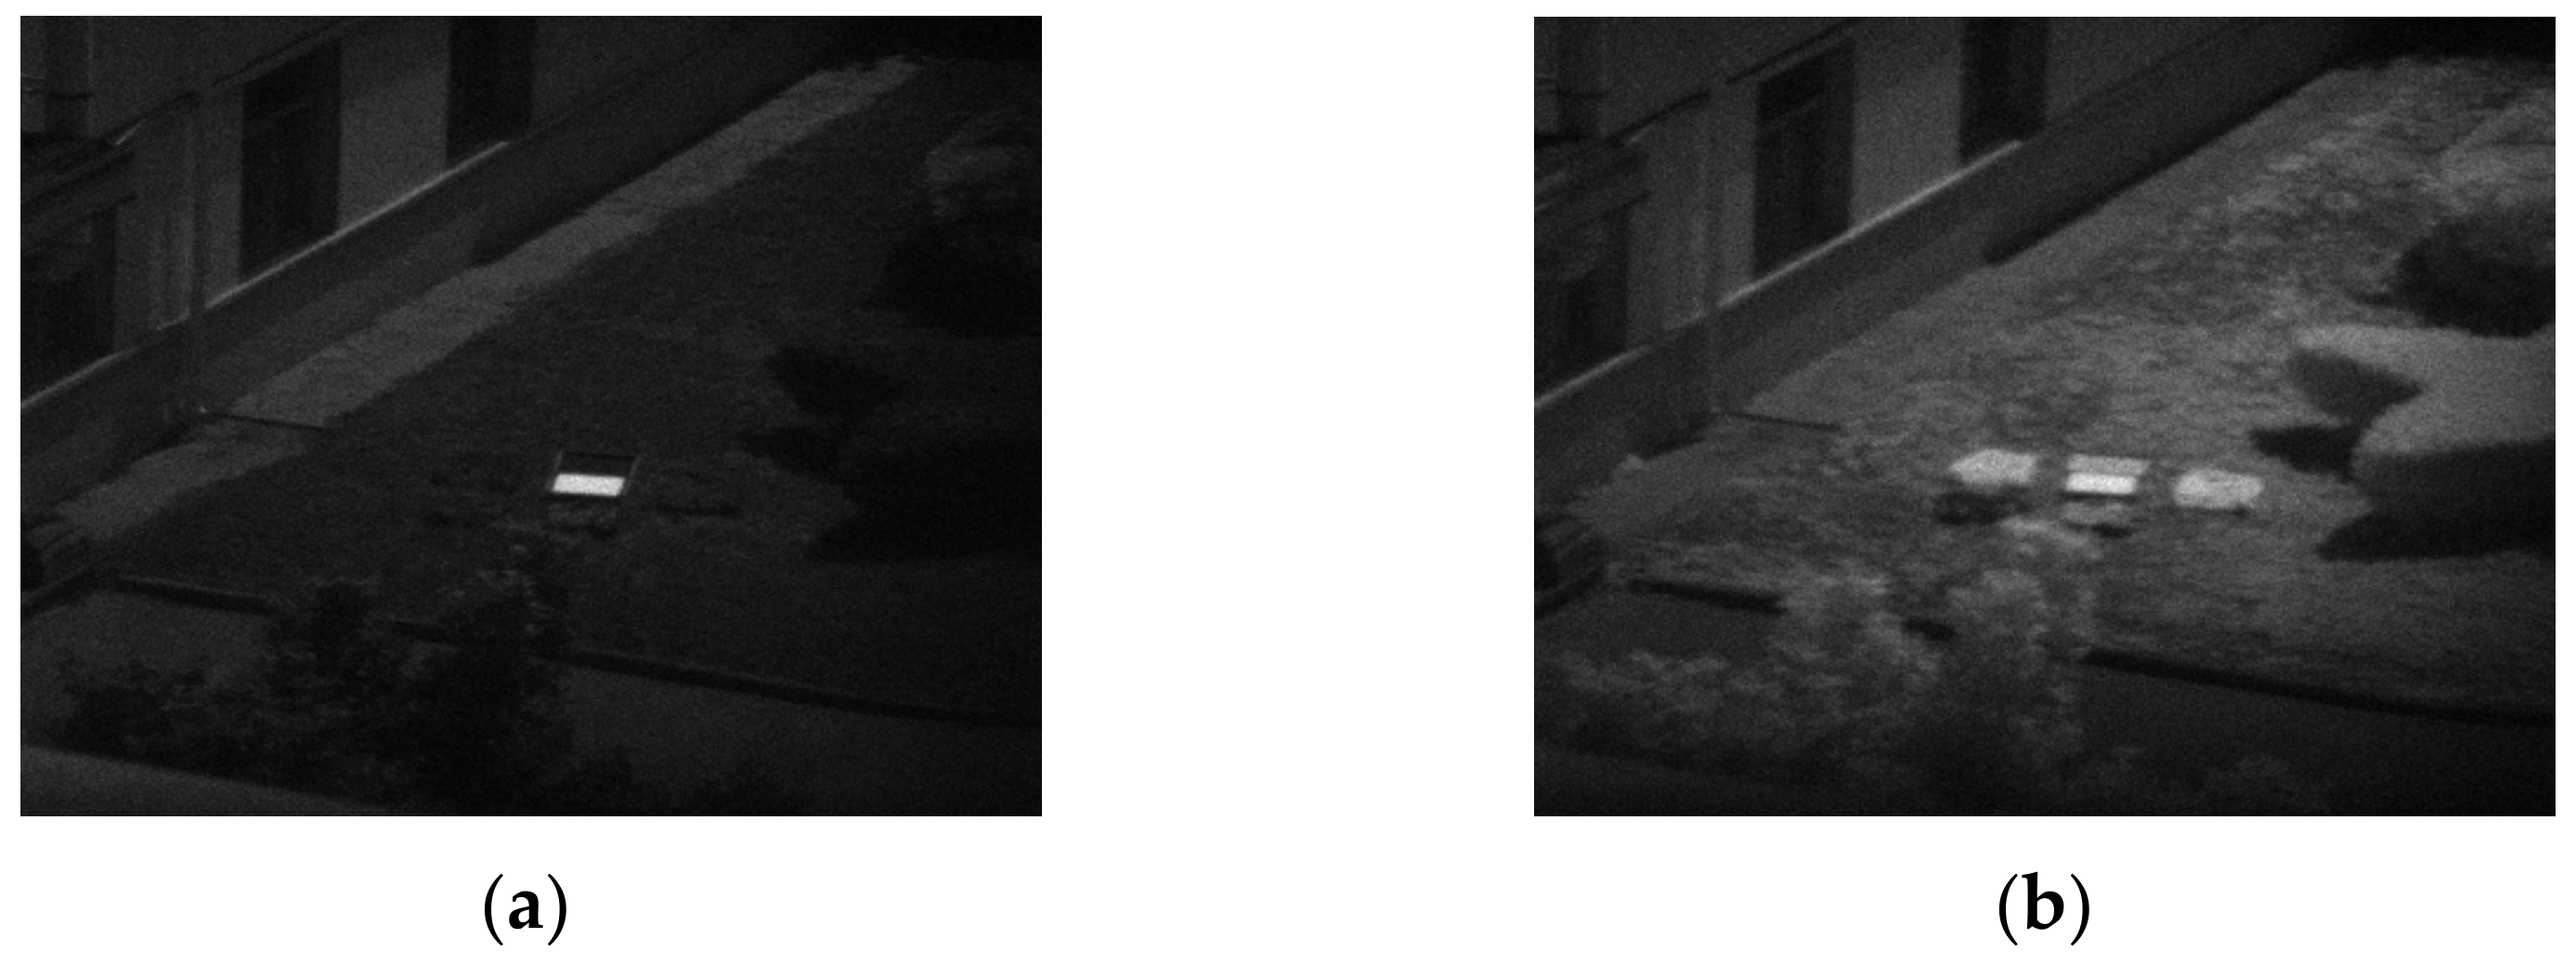
3.2.1. Experimental Process
3.2.2. Result Analysis of Experiment 1
- (1)
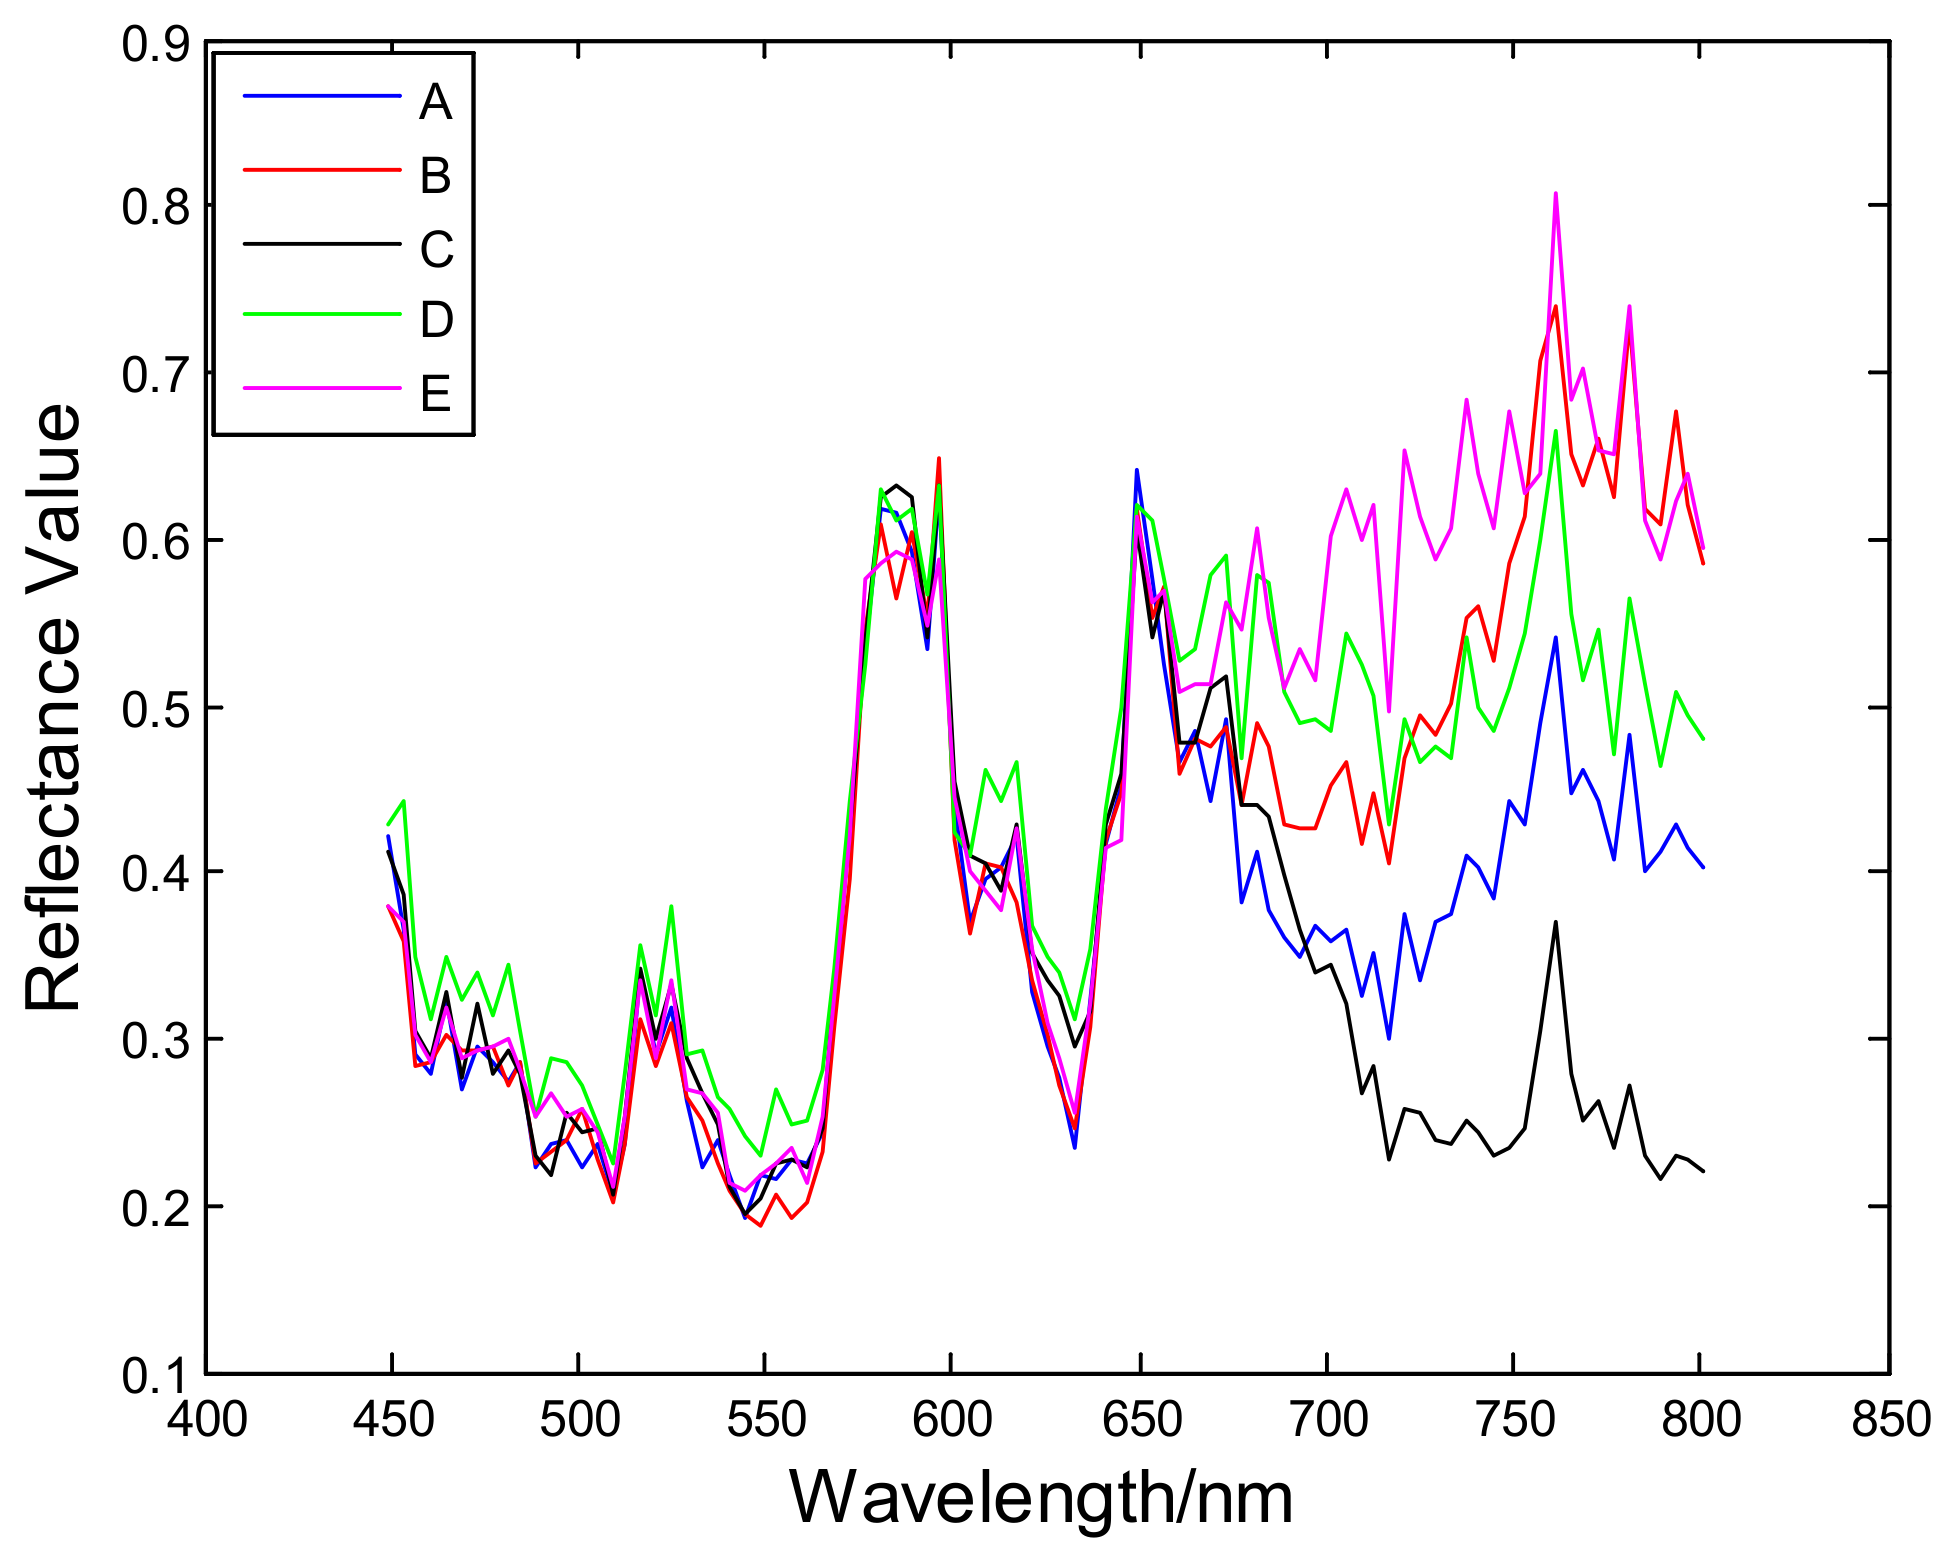
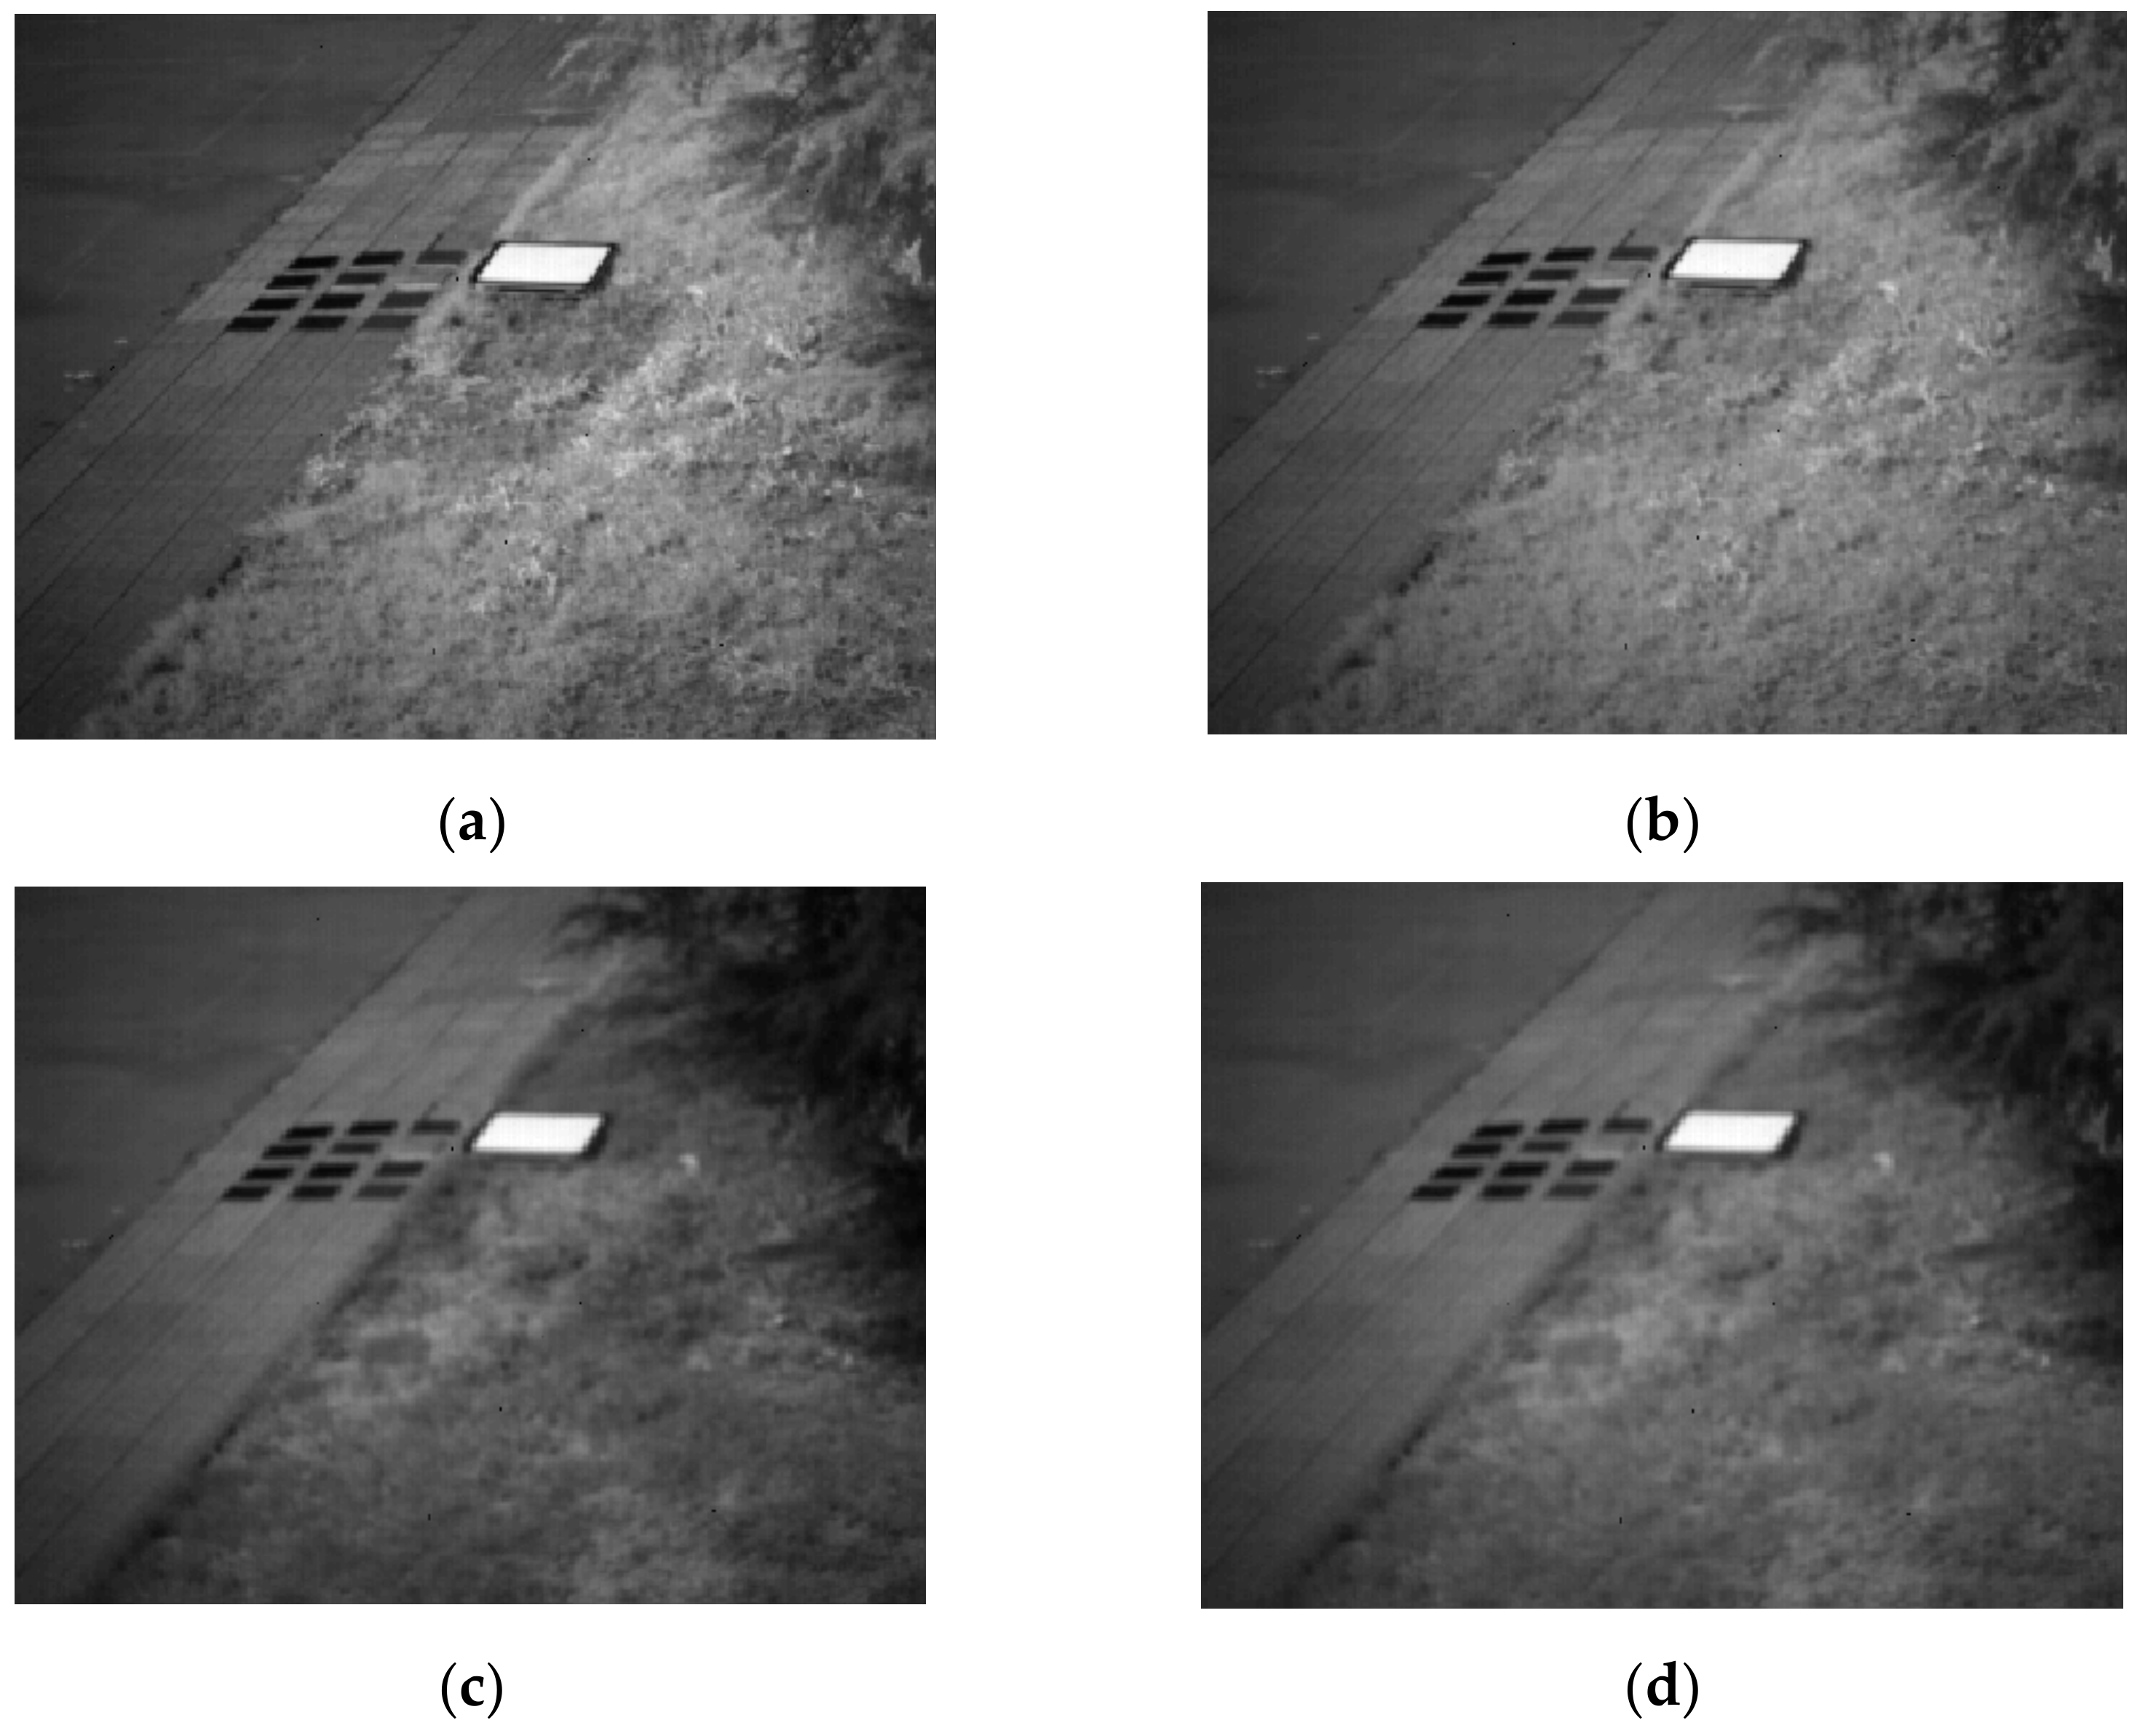
- According to the comparison between the spectral reflectance curve and the similarity of A, B, C, D and E in the visible light band, it can be seen that before 680 nm, the spectral curves of A, B, C, D and E are basically coincident, and the spectral similarity is high, so it is impossible to distinguish the types of objects; from 680 nm to 801 nm, the spectral curves of A, B, C, D and E are gradually different, and the spectral reflectance of B, D, E, three camouflage suits, is higher than that of grass. For C, the spectral reflectance of camouflage clothing is lower than that of grass. The three evaluation methods can reflect more obvious spectral differences. Therefore, the visible light band is the band range after 680 nm to effectively identify camouflage.
- (2)
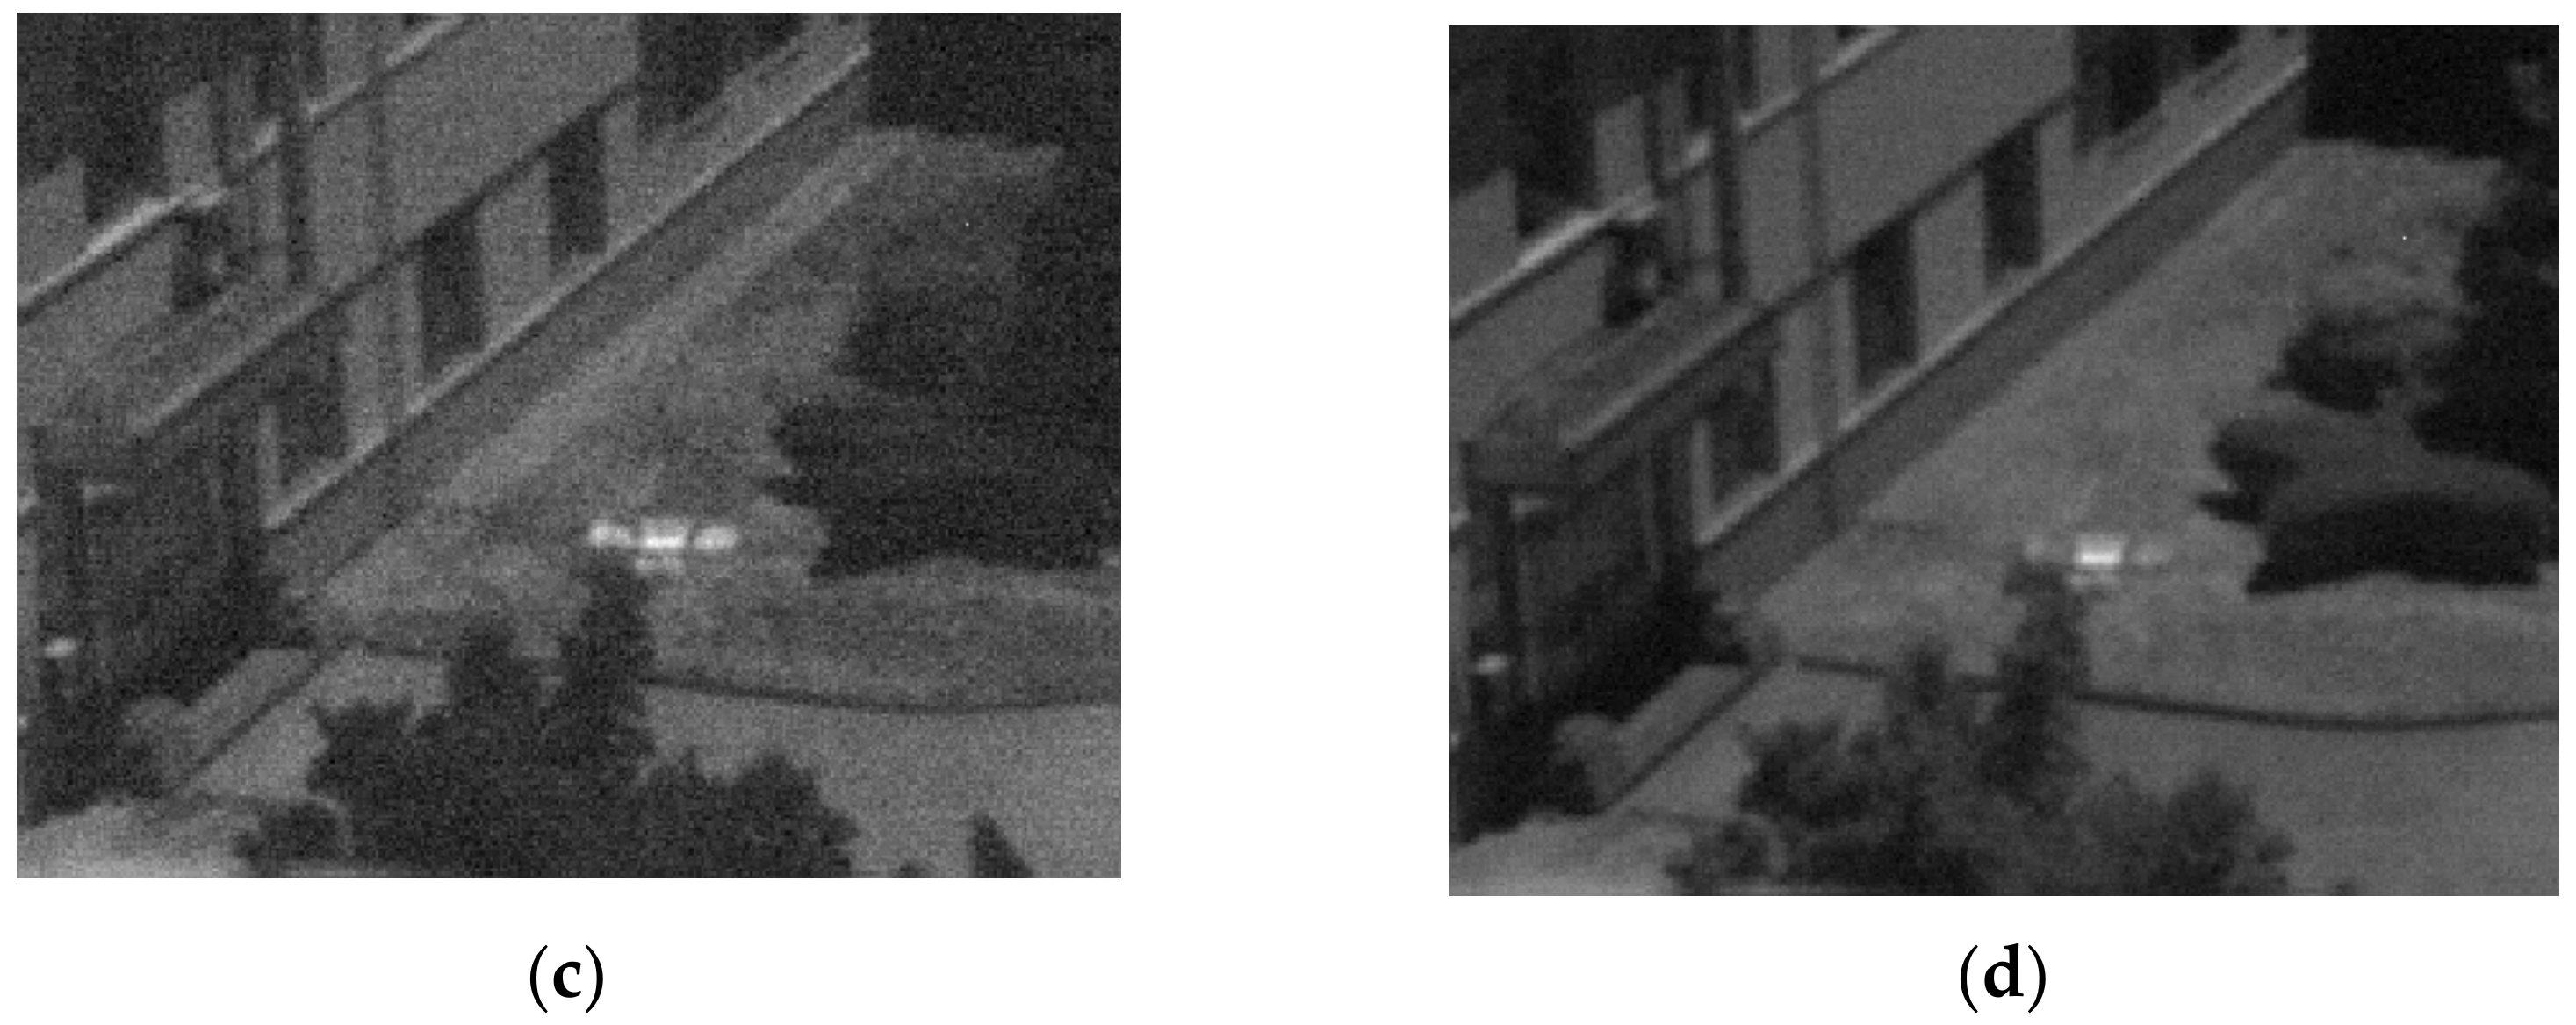
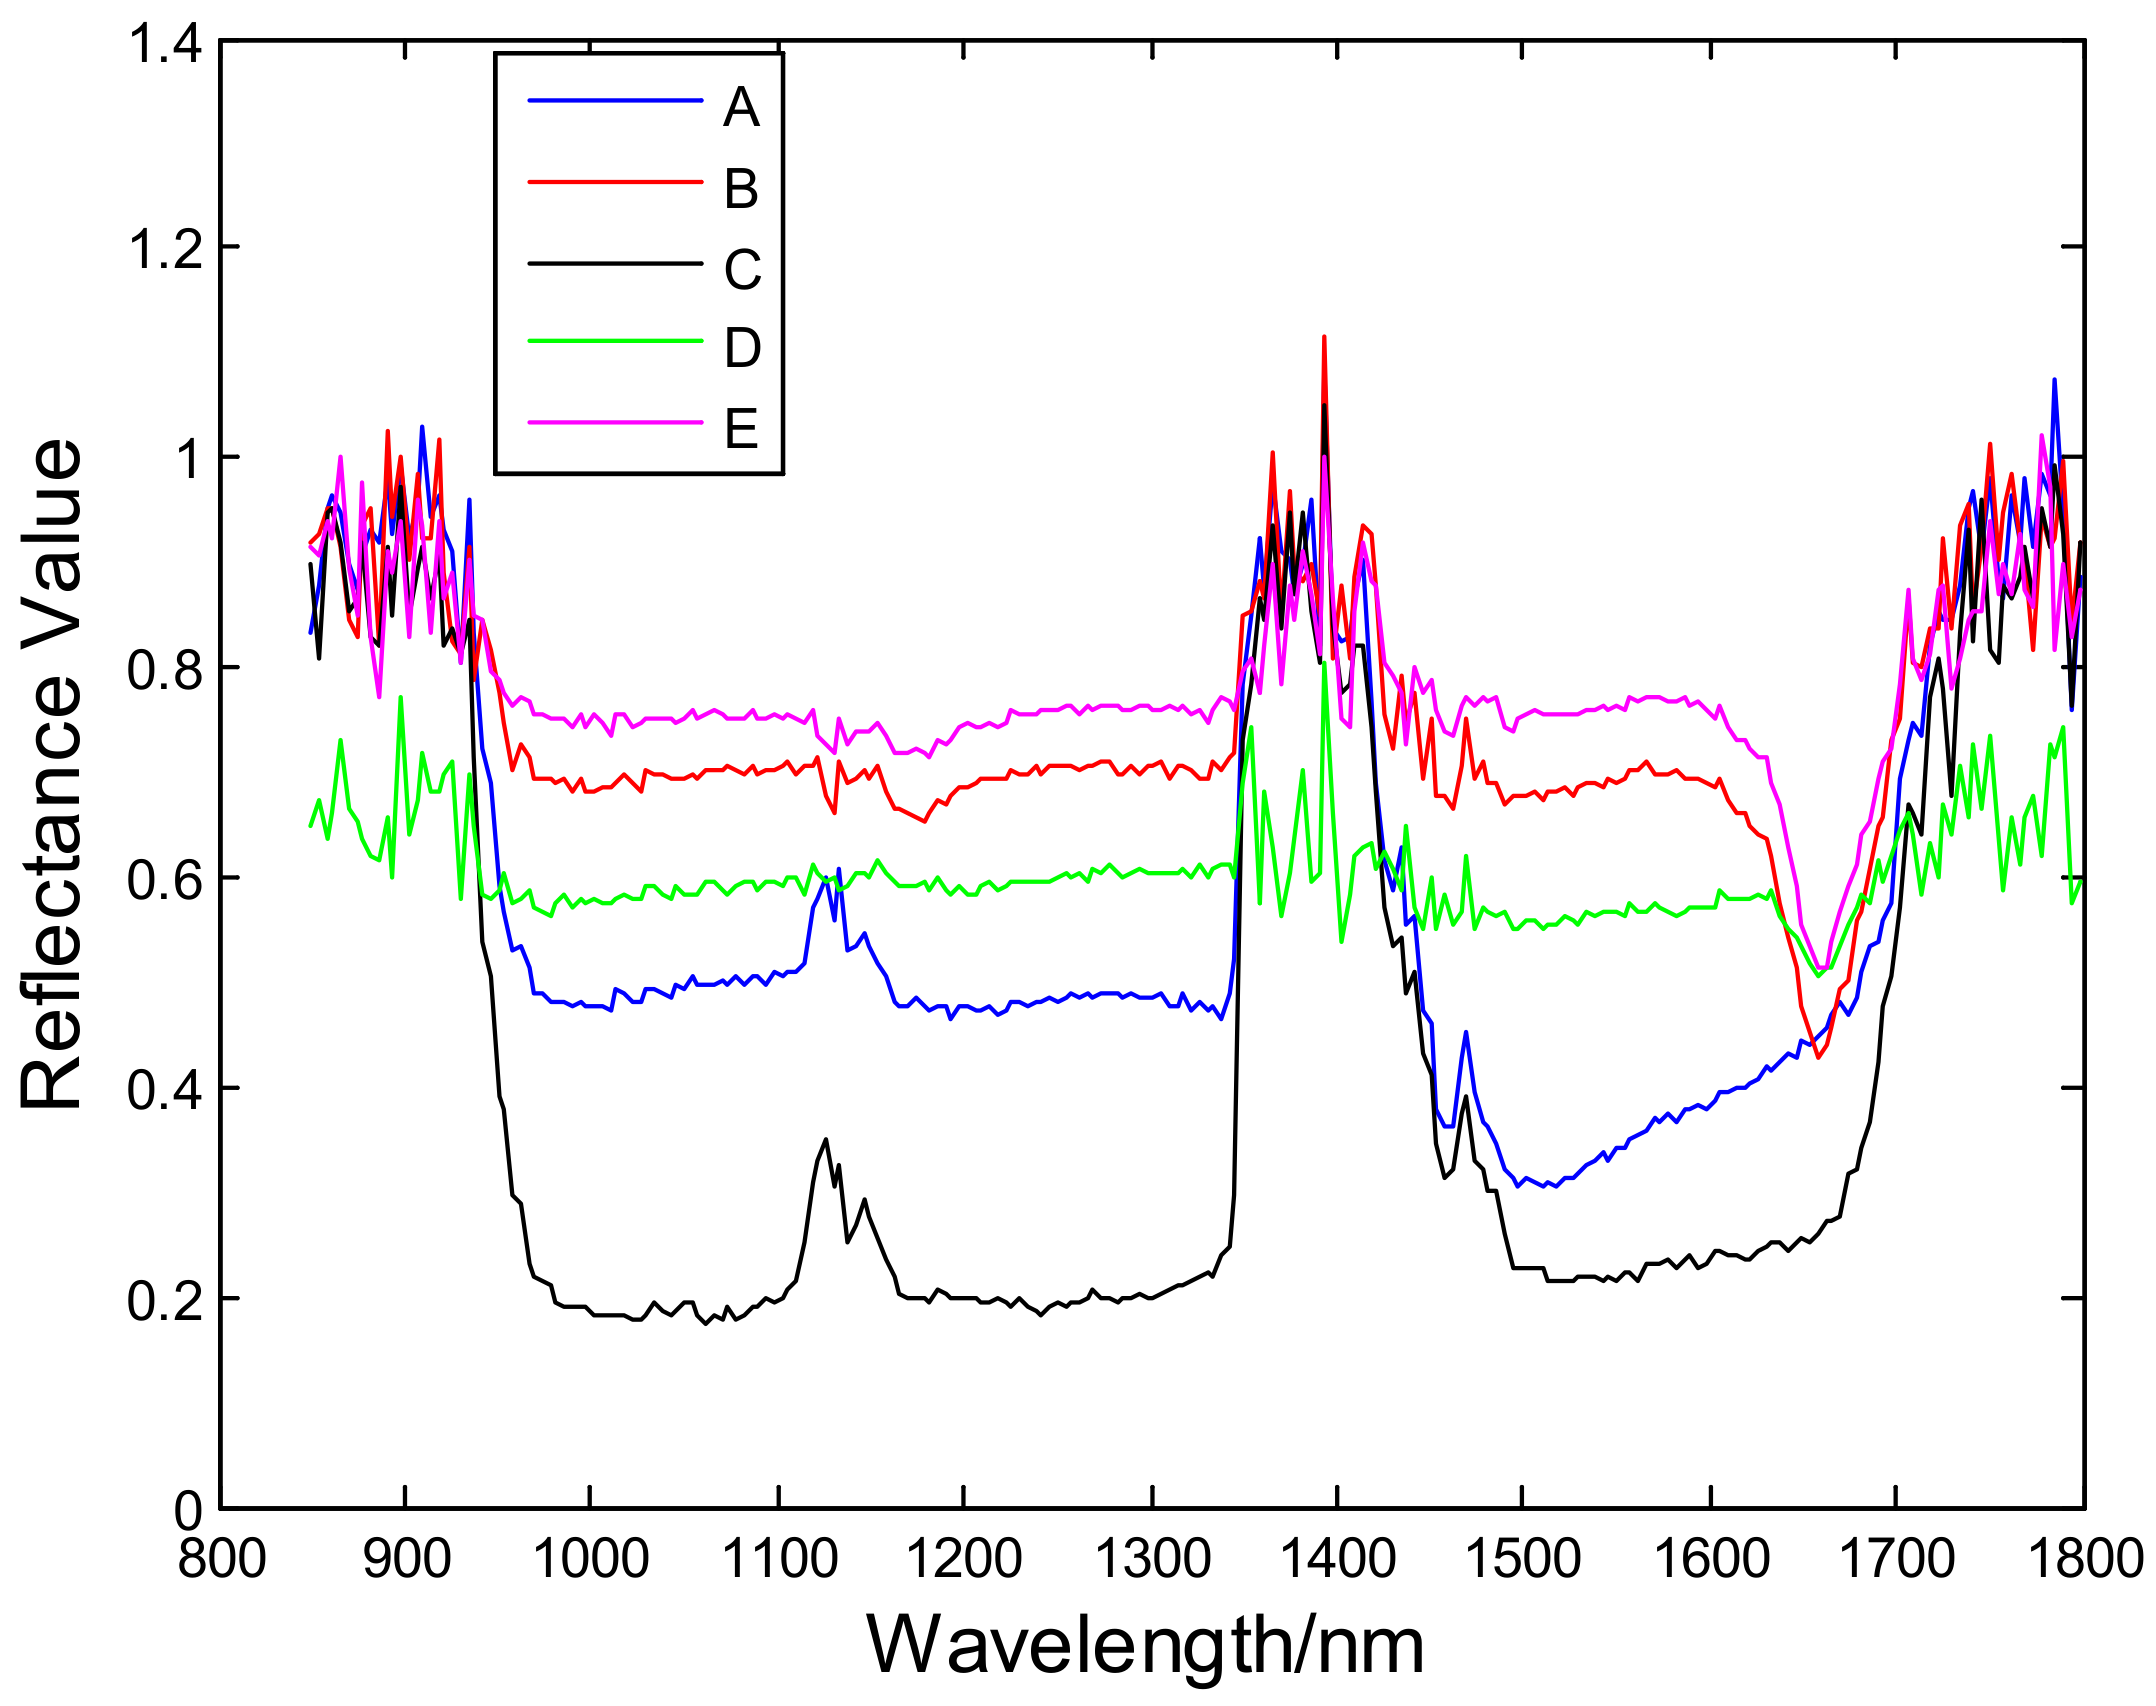
- According to the spectral reflectance curve and similarity comparison of A, B, C, D and E in the near-infrared band, it can be seen that after removing the band with serious noise, the difference of spectral reflectance between camouflage clothing and grass is more obvious than that in visible light band. Therefore, near-infrared spectroscopy can effectively identify the camouflage of the camouflage clothing, excluding the band affected by atmospheric absorption.
- (3)
- From the perspective of the camouflage effect of different camouflage clothing, in the visible light band, the camouflage effect of D camouflage clothing is the best, and that of C camouflage clothing is the worst; in the near infrared band, compared with other types of camouflage clothing, the camouflage effect of D camouflage clothing is also relatively good. Therefore, in general, D camouflage suit is most suitable for camouflage on grass background.
- (4)
- From the perspective of similarity evaluation method, SAM and StDev can better reflect the spectral characteristics of camouflage than the CC method. This is because CC only judges the similarity through the spectral change trend and does not take too much account of the difference in spectral reflectance values.
3.3. Experiment 2
3.3.1. Experimental Process
3.3.2. Result Analysis of Experiment 2
- (1)
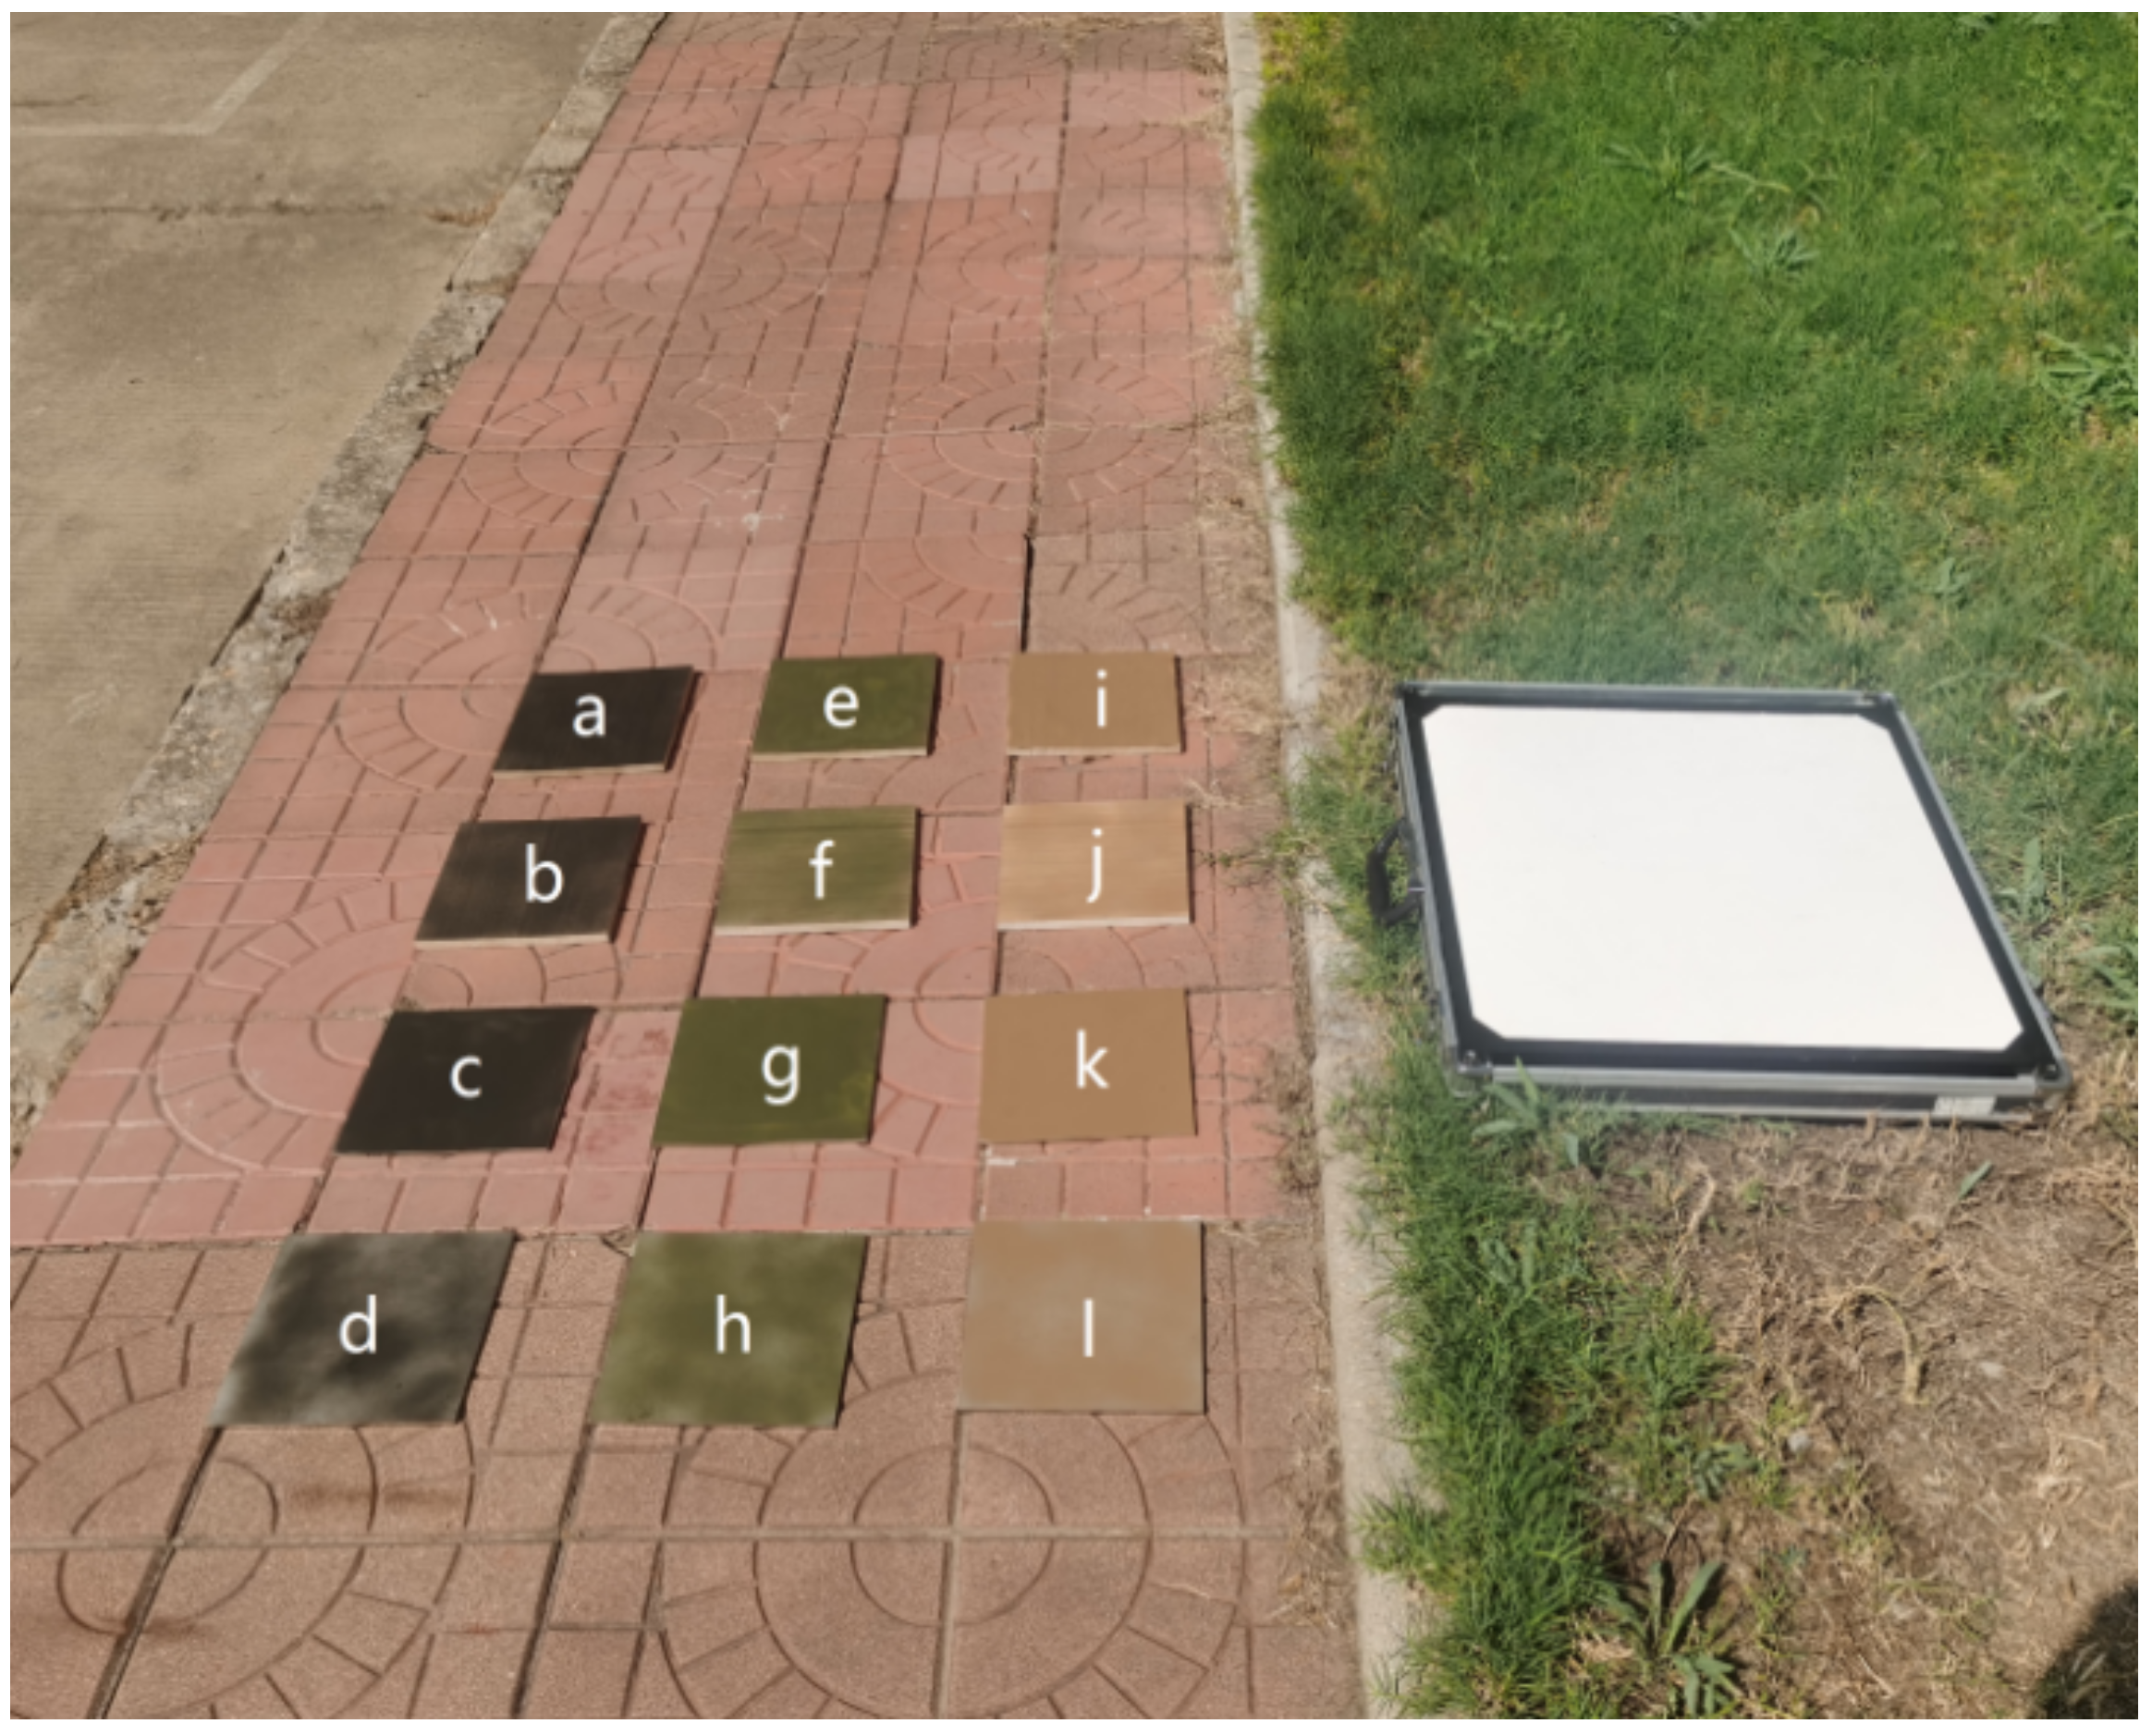
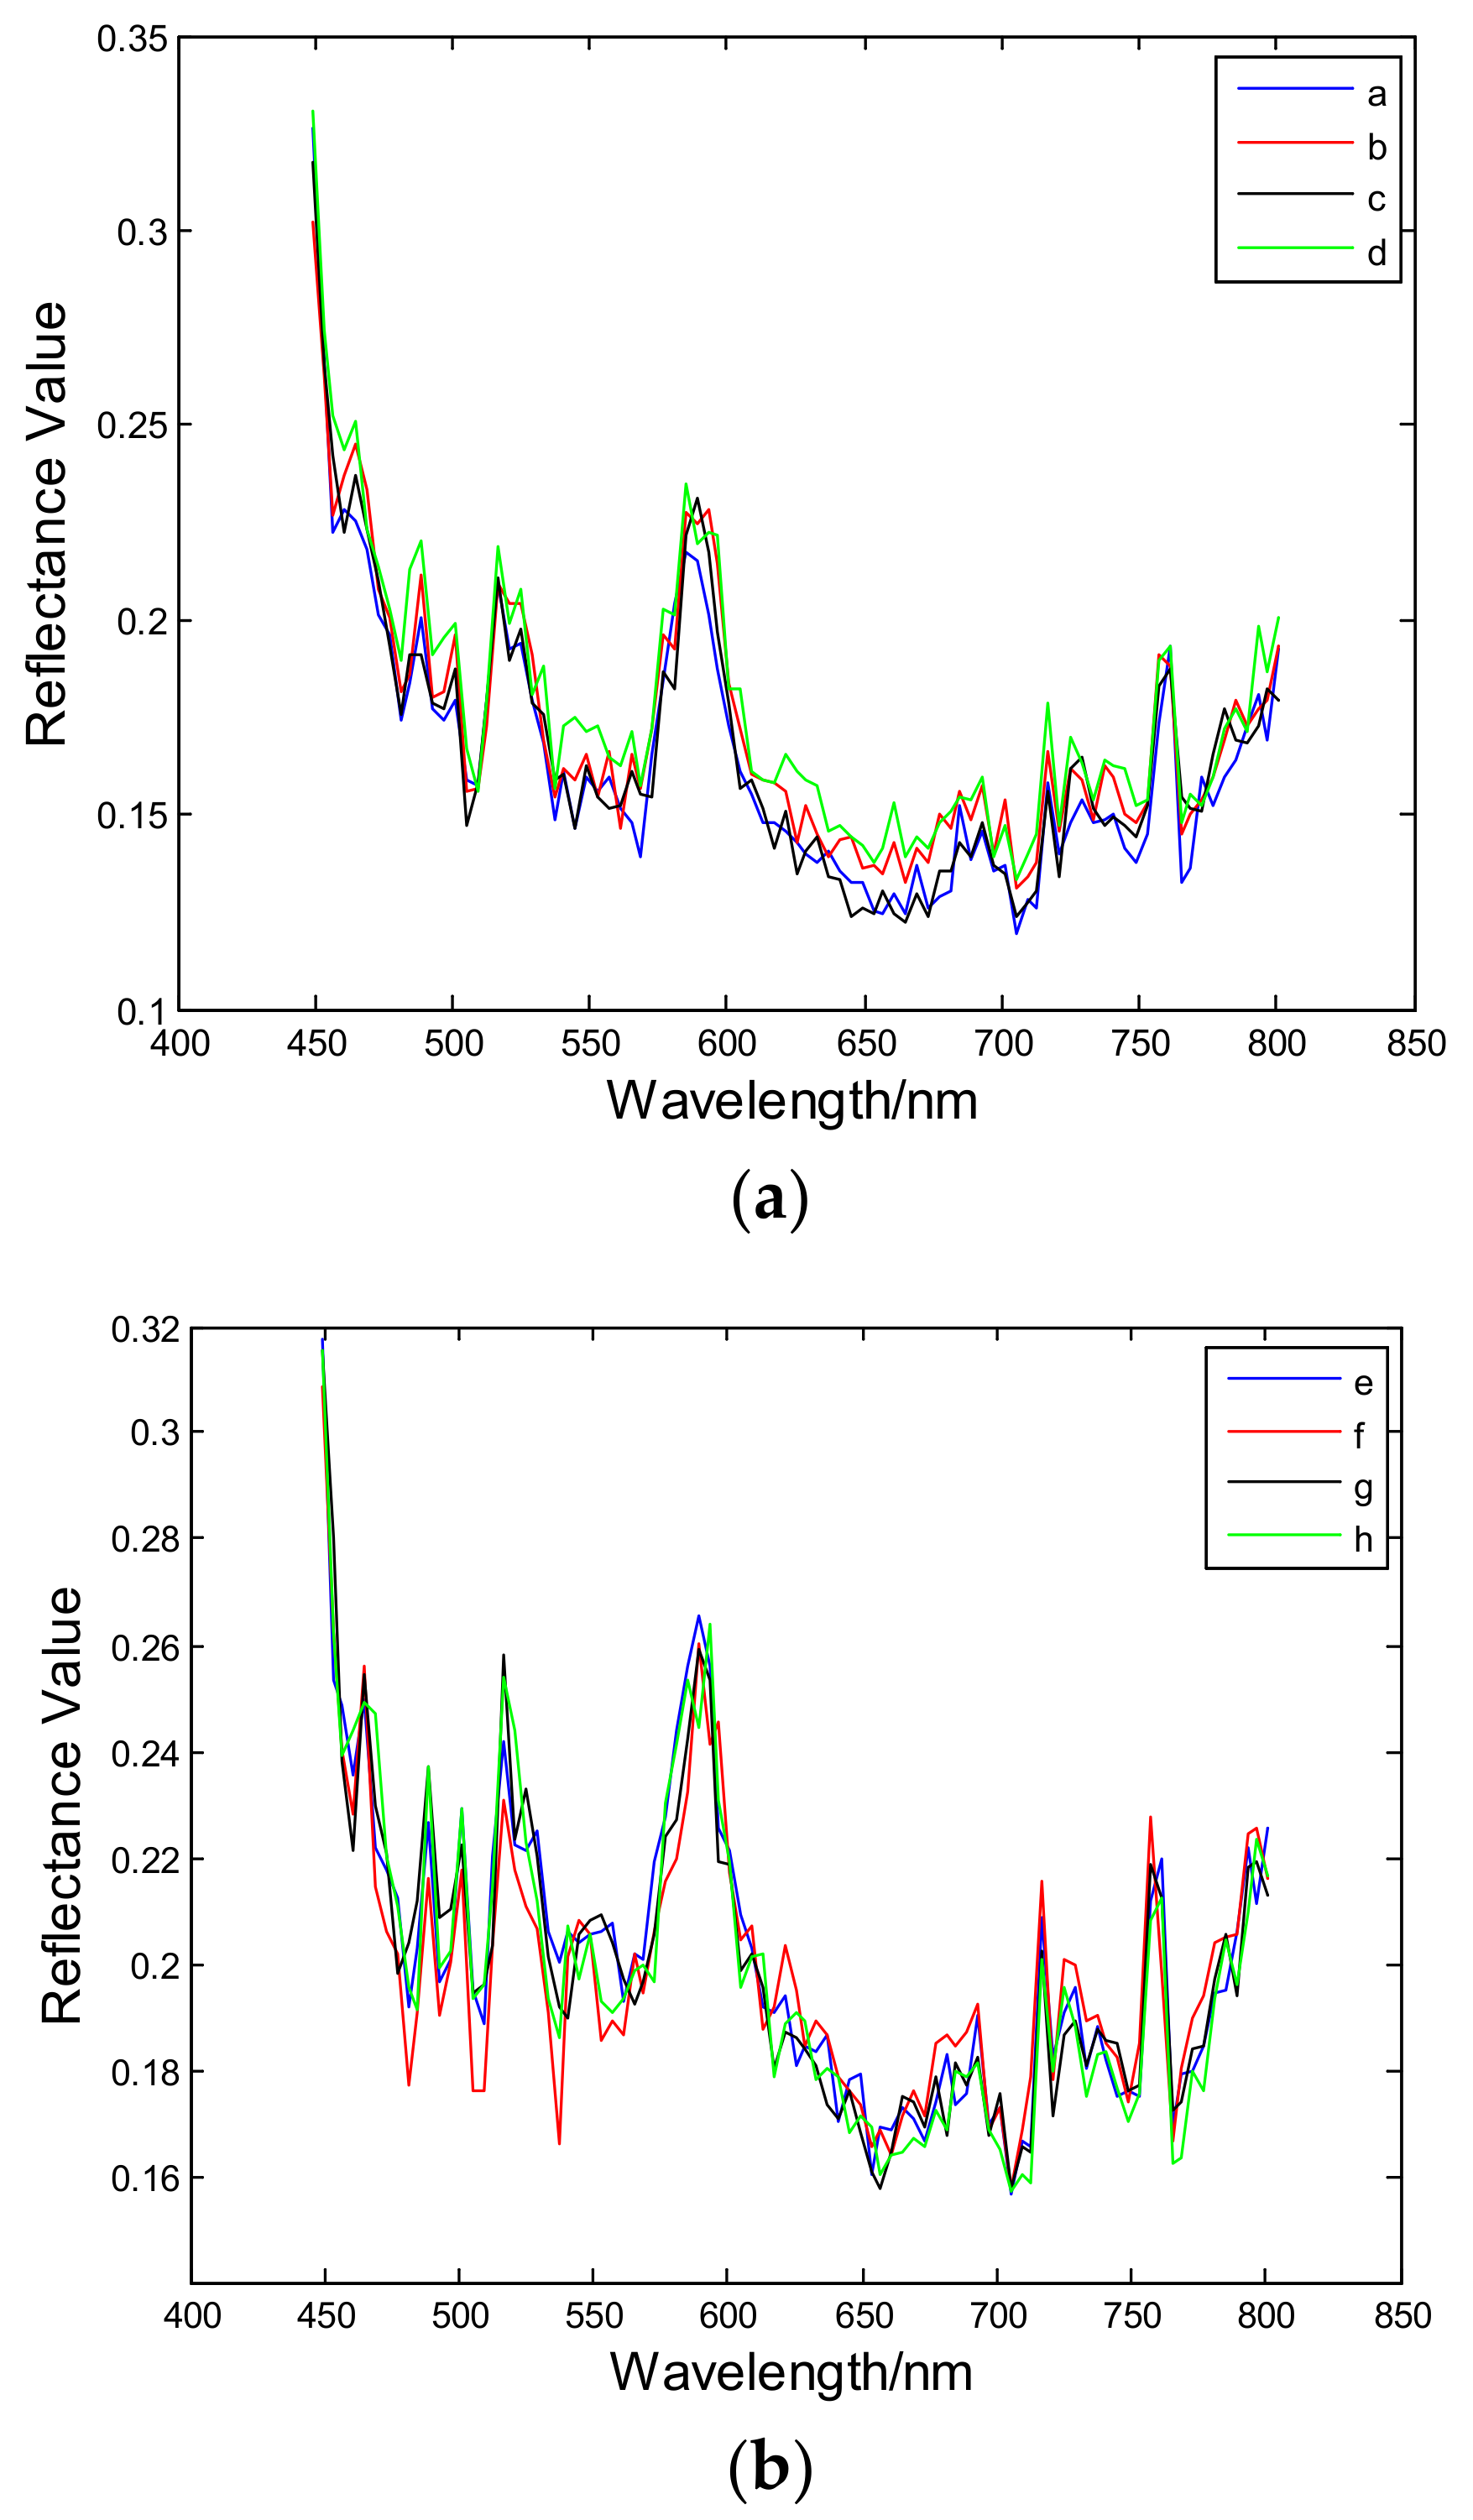
- According to the comparison of the spectral reflectance curve and the similarity of a-l in the visible light band, it can be seen that the spectral similarity between the dark green paint and the military green paint is high, and the camouflage effect is good, no matter whether it is on the board or the steel plate, no matter the SAM, StDev or CC evaluation method; only light desert paint has poor camouflage effect on the board. Therefore, visible light band has poor effect and stability in identifying camouflage methods of surface painting.
- (2)
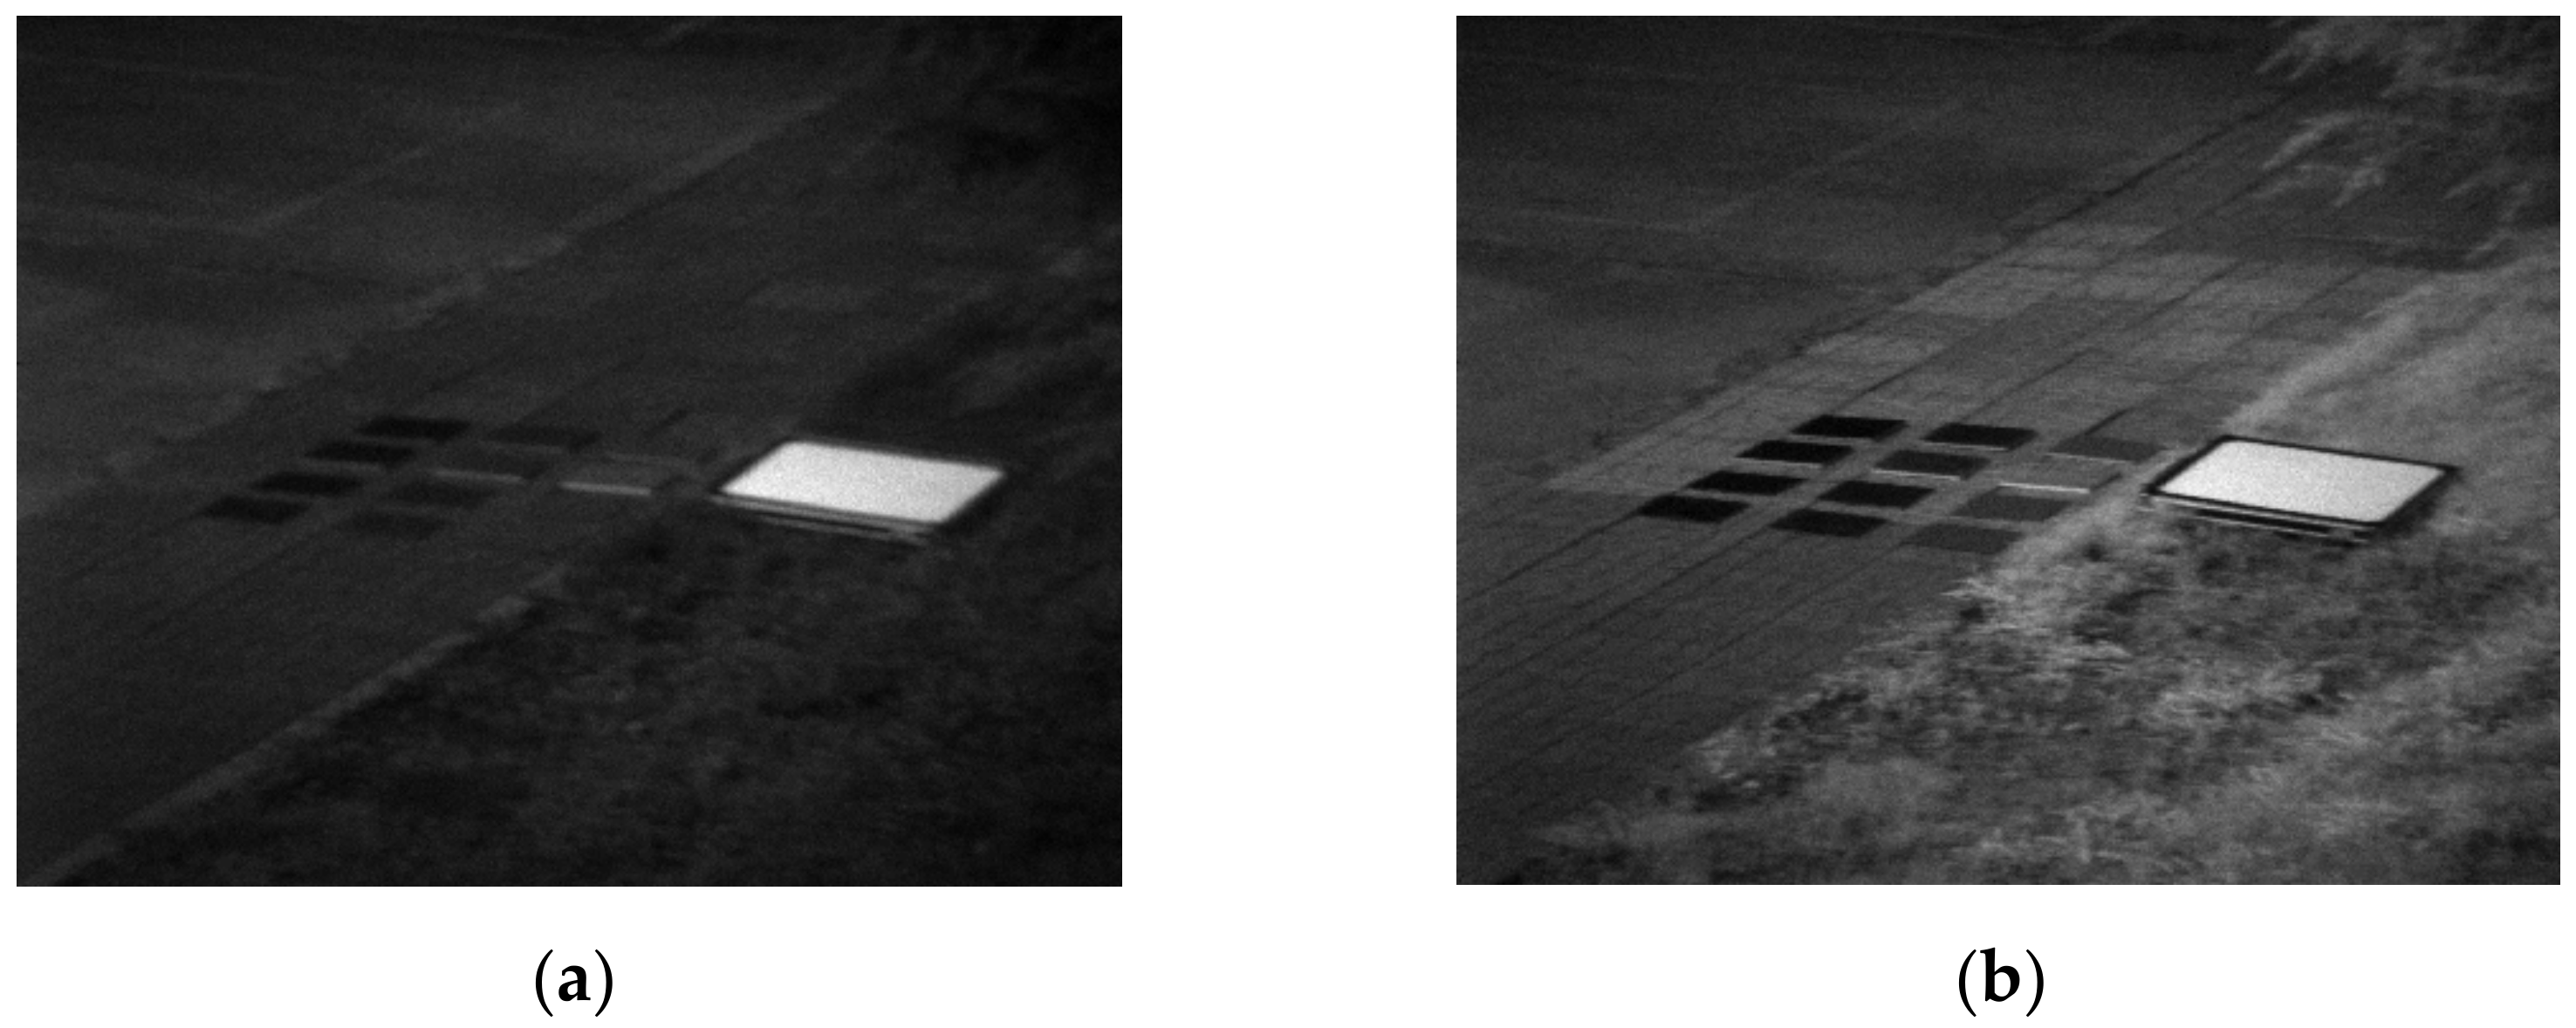
- According to the spectral reflectance curve and similarity comparison of a-l in the near-infrared band, it can be seen that after removing the band with serious noise, the dark green paint camouflage still cannot be recognized in the near-infrared band, and has no recognition effect. However, the light military green paint on the board shows different spectral characteristics. Contrary to the visible light band, it can be recognized in the near-infrared band. The camouflage level of the light desert paint on the board is worse in the near-infrared band, and it can still be recognized. Therefore, the reconnaissance effect of near-infrared spectroscopy in identifying camouflage paint is not obvious.
- (3)
- From the perspective of the camouflage effect of different spray paint, dark green spray paint has the best camouflage effect, which can effectively play the role of camouflage in the visible and near-infrared bands; the second is the military green paint. Although the military green paint can cover the material of the object under the paint in the visible light band, the camouflage effect is not stable under near-infrared hyperspectral detection. The last is desert paint, which may break through its camouflage in both visible and near-infrared bands, with poor overall effect.
4. Discussion and Conclusions
Author Contributions
Funding
Institutional Review Board Statement
Informed Consent Statement
Data Availability Statement
Conflicts of Interest
References
- Jiang, H.; Hu, Y.; Jiang, X.; Zhou, H. Maturity Stage Discrimination of Camellia oleifera Fruit Using Visible and Near-Infrared Hyperspectral Imaging. Molecules 2022, 27, 6318. [Google Scholar] [CrossRef] [PubMed]
- Guan, R.; Li, Z.; Li, T.; Li, X.; Yang, J.; Chen, W. Classification of Heterogeneous Mining Areas Based on ResCapsNet and Gaofen-5 Imagery. Remote Sens. 2022, 14, 3216. [Google Scholar] [CrossRef]
- Mukundan, A.; Huang, C.-C.; Men, T.-C.; Lin, F.-C.; Wang, H.-C. Air Pollution Detection Using a Novel Snap-Shot Hyperspectral Imaging Technique. Sensors 2022, 22, 6231. [Google Scholar] [CrossRef] [PubMed]
- Mruthyunjaya, P.; Shetty, A.; Umesh, P.; Gomez, C. Impact of Atmospheric Correction Methods Parametrization on Soil Organic Carbon Estimation Based on Hyperion Hyperspectral Data. Remote Sens. 2022, 14, 5117. [Google Scholar] [CrossRef]
- Zhang, D.; Zeng, S.; He, W. Selection and Quantification of Best Water Quality Indicators Using UAV-Mounted Hyperspectral Data: A Case Focusing on a Local River Network in Suzhou City, China. Sustainability 2022, 14, 16226. [Google Scholar] [CrossRef]
- Sahachairungrueng, W.; Meechan, C.; Veerachat, N.; Thompson, A.K.; Teerachaichayut, S. Assessing the Levels of Robusta and Arabica in Roasted Ground Coffee Using NIR Hyperspectral Imaging and FTIR Spectroscopy. Foods 2022, 11, 3122. [Google Scholar] [CrossRef] [PubMed]
- Li, N.; Pan, X.; Yang, L.; Huang, Z.; Wu, Z.; Zheng, G. Adaptive CFAR Method for SAR Ship Detection Using Intensity and Texture Feature Fusion Attention Contrast Mechanism. Sensors 2022, 22, 8116. [Google Scholar] [CrossRef] [PubMed]
- Mantau, A.J.; Widayat, I.W.; Leu, J.-S.; Köppen, M. A Human-Detection Method Based on YOLOv5 and Transfer Learning Using Thermal Image Data from UAV Perspective for Surveillance System. Drones 2022, 6, 290. [Google Scholar] [CrossRef]
- Jian, B.-L.; Peng, C.-C. Development of an Automatic Testing Platform for Aviator’s Night Vision Goggle Honeycomb Defect Inspection. Sensors 2017, 17, 1403. [Google Scholar] [CrossRef] [PubMed] [Green Version]
- Hupel, T.; Stütz, P. Adopting Hyperspectral Anomaly Detection for Near Real-Time Camouflage Detection in Multispectral Imagery. Remote Sens. 2022, 14, 3755. [Google Scholar] [CrossRef]
- Lu, Q.; Li, M.; Tian, A. Green Plant Leaf-inspired Smart Camouflage Fabrics for Visible Light and Near-infrared Stealth. J. Bionic Eng. 2022, 19, 788–798. [Google Scholar]
- Zhao, J.; Zhou, B.; Wang, G.; Liu, J.; Ying, J. Camouflage Target Recognition Based on Dimension Reduction Analysis of Hyperspectral Image Regions. Photonics 2022, 9, 640. [Google Scholar] [CrossRef]
- Shi, G.; Huang, H.; Liu, J.; Li, Z.; Wang, L. Spatial-Spectral Multiple Manifold Discriminant Analysis for Dimensionality Reduction of Hyperspectral Imagery. Remote Sens. 2019, 11, 2414. [Google Scholar] [CrossRef] [Green Version]
- Ettabaa, K.S.; Salem, M.B. Adaptive progressive band selection for dimensionality reduction in hyperspectral images. J. Indian Soc. Remote Sens. 2018, 46, 157–167. [Google Scholar]
- Khan, M.J.; Khan, H.S.; Yousaf, A.; Khurshid, K.; Abbas, A. Modern trends in hyperspectral image analysis: A review. IEEE Access 2018, 6, 14118–14129. [Google Scholar] [CrossRef]
- Wise, J.E.; Mars, J.C. Field Reflectance Measurements at Night of Beach and Desert Sands within a Particulate BRDF Model. Remote Sens. 2022, 14, 5020. [Google Scholar] [CrossRef]
- Park, J.; Jeong, J.; Park, Y. Ship Trajectory Prediction Based on Bi-LSTM Using Spectral-Clustered AIS Data. J. Mar. Sci. Eng. 2021, 9, 1037. [Google Scholar] [CrossRef]
- Yadav, S.; Yoneda, M.; Susaki, J.; Tamura, M.; Ishikawa, K.; Yamashiki, Y. A Satellite-Based Assessment of the Distribution and Biomass of Submerged Aquatic Vegetation in the Optically Shallow Basin of Lake Biwa. Remote Sens. 2017, 9, 966. [Google Scholar] [CrossRef] [Green Version]
- Espinoza, C.Z.; Khot, L.R.; Sankaran, S.; Jacoby, P.W. High Resolution Multispectral and Thermal Remote Sensing-Based Water Stress Assessment in Subsurface Irrigated Grapevines. Remote Sens. 2017, 9, 961. [Google Scholar] [CrossRef]



| Wavelength Range | Evaluation Method | B | C | D | E | |
|---|---|---|---|---|---|---|
| 449–801 nm | A | SAM | 0.1789 | 0.2217 | 0.1144 | 0.2190 |
| StDev | 0.0967 | 0.0879 | 0.0813 | 0.1361 | ||
| CC | 0.9673 | 08573 | 09708 | 09733 | ||
| 449–681 nm | A | SAM | 0.0610 | 0.0552 | 0.0881 | 0.1015 |
| StDev | 0.0232 | 0.0242 | 0.0521 | 0.0417 | ||
| CC | 0.9393 | 0.8579 | 0.9389 | 0.9631 | ||
| 681–801 nm | A | SAM | 0.0780 | 0.2427 | 0.0892 | 0.0772 |
| StDev | 0.1653 | 0.1493 | 0.1209 | 0.2297 | ||
| CC | 0.8575 | 0.8790 | 0.8351 | 0.8197 |
| Wavelength Range | Evaluation Method | B | C | D | E | |
|---|---|---|---|---|---|---|
| 950–1350 nm | A | SAM | 0.0633 | 0.2239 | 0.0711 | 0.0784 |
| StDev | 0.2023 | 0.2831 | 0.1015 | 0.2562 | ||
| CC | 0.9970 | 0.9813 | 0.9979 | 0.9974 | ||
| 1450–1698 nm | A | SAM | 0.2478 | 01571 | 0.1638 | 0.2423 |
| StDev | 0.2874 | 0.1317 | 0.1867 | 0.3516 | ||
| CC | 0.8892 | 0.9719 | 0.9607 | 0.9009 |
| Wavelength Range | Evaluation Method | a–c | b–d | e–g | f–h | i–k | j–l |
|---|---|---|---|---|---|---|---|
| 449–801 nm | SAM | 0.0477 | 0.0399 | 0.0408 | 0.0595 | 0.0374 | 0.1447 |
| StDev | 0.0083 | 0.0092 | 0.0084 | 0.0120 | 0.0128 | 0.0815 | |
| CC | 0.9866 | 0.9625 | 09746 | 09874 | 0.9704 | 0.9107 |
| Wavelength Range | Evaluation Method | a–c | b–d | e–g | f–h | i–k | j–l |
|---|---|---|---|---|---|---|---|
| 950–1350 nm | SAM | 0.0744 | 0.0483 | 0.1058 | 0.2283 | 0.0488 | 0.0864 |
| StDev | 0.0054 | 0.0126 | 0.0092 | 0.1210 | 0.0095 | 0.2831 | |
| CC | 0.9701 | 0.988 | 0.9735 | 0.9451 | 09657 | 0.9742 | |
| 1450–1698 nm | SAM | 0.0368 | 0.0404 | 0.1368 | 0.1280 | 0.0354 | 0.0738 |
| StDev | 0.0104 | 0.0150 | 0.0280 | 0.1348 | 0.0127 | 0.2687 | |
| CC | 0.9937 | 0.9860 | 0.9829 | 0.9923 | 0.9765 | 09936 |
Publisher’s Note: MDPI stays neutral with regard to jurisdictional claims in published maps and institutional affiliations. |
© 2022 by the authors. Licensee MDPI, Basel, Switzerland. This article is an open access article distributed under the terms and conditions of the Creative Commons Attribution (CC BY) license (https://creativecommons.org/licenses/by/4.0/).
Share and Cite
Zhao, J.; Zhou, B.; Wang, G.; Ying, J.; Liu, J.; Chen, Q. Spectral Camouflage Characteristics and Recognition Ability of Targets Based on Visible/Near-Infrared Hyperspectral Images. Photonics 2022, 9, 957. https://doi.org/10.3390/photonics9120957
Zhao J, Zhou B, Wang G, Ying J, Liu J, Chen Q. Spectral Camouflage Characteristics and Recognition Ability of Targets Based on Visible/Near-Infrared Hyperspectral Images. Photonics. 2022; 9(12):957. https://doi.org/10.3390/photonics9120957
Chicago/Turabian StyleZhao, Jiale, Bing Zhou, Guanglong Wang, Jiaju Ying, Jie Liu, and Qi Chen. 2022. "Spectral Camouflage Characteristics and Recognition Ability of Targets Based on Visible/Near-Infrared Hyperspectral Images" Photonics 9, no. 12: 957. https://doi.org/10.3390/photonics9120957
APA StyleZhao, J., Zhou, B., Wang, G., Ying, J., Liu, J., & Chen, Q. (2022). Spectral Camouflage Characteristics and Recognition Ability of Targets Based on Visible/Near-Infrared Hyperspectral Images. Photonics, 9(12), 957. https://doi.org/10.3390/photonics9120957


