Article

Mapping the Stability and Dynamics of Optically Injected Dual State Quantum Dot Lasers

by
Michael Dillane
1,2,3,
Benjamin Lingnau
1,
Evgeny A. Viktorov
4 and
Bryan Kelleher
1,2,*
1
Department of Physics, University College Cork, T12 K8AF Cork, Ireland
2
Tyndall National Institute, University College Cork, Lee Maltings, Dyke Parade, T12 R5CP Cork, Ireland
3
Centre for Advanced Photonics & Process Analysis, Munster Technological University, Bishopstown, T12 P928 Cork, Ireland
4
Faculty of Laser Photonics and Optoelectronics, National Research University of Information Technologies, Mechanics and Optics, Kronverksky Pr. 49, 197101 St. Petersburg, Russia
*
Author to whom correspondence should be addressed.
Photonics 2022, 9(2), 101; https://doi.org/10.3390/photonics9020101
Submission received: 30 November 2021 / Revised: 23 January 2022 / Accepted: 26 January 2022 / Published: 10 February 2022
(This article belongs to the Special Issue Nonlinear Dynamics of Semiconductor Lasers and Their Applications)

Abstract

:
Optical injection is a key nonlinear laser configuration both for applications and fundamental studies. An important figure for understanding the optically injected laser system is the two parameter stability mapping of the dynamics found by examining the output of the injected laser under different combinations of the injection strength and detuning. We experimentally and theoretically generate this map for an optically injected quantum dot laser, biased to emit from the first excited state and optically injected near the ground state. Regions of different dynamical behaviours including phase-locking, excitability, and bursting regimes are identified. At the negatively detuned locking boundary, ground state dropouts and excited state pulses are observed near a hysteresis cycle for low injection strengths. Higher injection strengths reveal μ s duration square wave trains where the intensities of the ground state and excited state operate in antiphase. A narrow region of extremely slow oscillations with periods of several tens of milliseconds is observed at the positively detuned boundary. Two competing optothermal couplings are introduced and are shown to reproduce the experimental results extremely well. In fact, the dynamics of the system are dominated by these optothermal effects and their interplay is central to reproducing detailed features of the stability map.

1. Introduction

Optical injection is a key technique in many modern photonic systems and particularly unidirectional optical injection, where light from a primary laser is injected into the cavity of a secondary laser. It is used in high sensitivity signal sensing, to improve coherence of high power lasers, for spectral density enhancement in optical communications, and for arbitrary pulse shaping, among many other applications. Mapping the behaviour of an optically injected laser over control parameter space is thus of central importance for many applications. A stability map where one varies the injection level and the detuning (the frequency of the primary laser minus that of the secondary laser) and generates a diagram characterising the output of the injected device is one of the most effective tools in this regard [1]. Stability maps can take several forms and can be as simple as displaying the region where phase locking is obtained. Indeed, for many applications this is the most important regime, and this simple map is all that is needed. On the other hand, optically injected semiconductor lasers are also rich sources of fundamental non-linear dynamics, and the stability map can also be used to classify regions of different behaviour including, but not limited to, excitability, multistability, oscillatory behaviour, and chaos [1,2,3]. Such regions can be of interest both for fundamental studies and for applications. For example, period 1 dynamics have been used for tunable microwave generation [4,5], chaotic dynamics have attracted attention for random number generation [6], and the potential of excitability for use in neuromorphic photonics has been highlighted in [7] and elsewhere. Thus, a stability map detailing the different dynamical regimes is also of great importance. In [2] an automated, efficient, and quick technique for creating such an experimental map is presented. In [2] the device studied is a two frequency quantum well (QW) based device, but the technique is applicable to any device type. In short, the injection power is swept up and down at fixed values of the detuning. The output power is measured at regular intervals using fast detectors and a fast, real-time oscilloscope. Calculating the mean and standard deviation of the power then allows for easy discrimination of different regions in parameter space and simultaneously allows for identification of hysteretic regions.
Rate equation modelling of the system has proven to be extremely accurate with quantitative agreement between the maps produced experimentally and those arising from the model. A particularly striking example of this agreement is shown in [1] for a single frequency QW based laser. In this example, the map takes the form of a two parameter (injection level and detuning) bifurcation diagram, identifying where qualitative changes in the laser’s behaviour occur. Analytic studies can also be performed, such as those in [3,8,9,10], and in particular, analytic expressions can be found for the two most important bifurcations for the generation of phase locking, namely the saddle node bifurcation and the Hopf bifurcation. In [11,12,13] numerical analyses of the Lyapunov exponents were used to produce the stability maps. One can also perform numerical studies analogous to the experimental technique to produce the mapping as shown in [2]. The superb agreement between experiment and theory allows great trust to be placed in simulations and predictions that arise from theory.
Optically injected InAs/GaAs based quantum dot (QD) lasers have attracted substantial attention in recent years. They display many different dynamical regimes, including several novel regimes heretofore unobserved with other devices, such as optothermal excitability [14], and mixed mode oscillations and canard explosions [15,16]. In [3,9], the stability map for a single mode QD laser is analysed both experimentally and analytically with excellent qualitative agreement between the experimental and analytical figures. The striking similarity to the Class A stability diagram [10] is also discussed. Microscopic rate equation analysis has also been performed [17], again agreeing well with the experiment. This model allows for a more accurate analysis of phase-amplitude coupling going beyond the simplified constant α factor typically assumed. In [18], excellent agreement between experimentally and numerically generated maps for multimode optically injected QD lasers is demonstrated with the importance of including spatial hole-burning emphasised.
A unique characteristic of InAs/GaAs QD lasers is their ability to lase from multiple different energy levels [19,20]. In particular they typically display ground state (GS) emission close to 1300 nm and first excited state (ES) emission at approximately 1215 nm. Each of these states has its own threshold and which state lases depends on many factors including the optical losses and the pump current. A typical evolution as the pump current is increased is presented in [21]. First, the GS threshold is reached, at which GS only light is emitted. This is followed by the ES threshold, where the GS and ES emit simultaneously. Further increasing the pump current typically results in a quenching of the GS emission after which only the ES lases. However, in other cases—such as with short device lengths—there may not be sufficient gain available in the GS to overcome the losses below the ES threshold. Then, as the current is increased, the ES threshold can be reached without any lasing ever being achieved from the GS. In this case, no emission from the GS is found at any pump current. This is the case for the device investigated in this work.
This multi-state structure allows for unique dual state injection scenarios. In particular, one can bias a QD device to emit from the ES only and then inject the device with light at the GS frequency from an external laser. In this configuration, it has been shown that the ES can be made to turn off and the GS to turn on, with the output phase locked to that of the injecting primary laser [21]. This behaviour can be obtained regardless of whether the QD device can be made to emit from the GS while free-running. Several dynamical regimes have been reported and analysed in this configuration, such as fast state switching [22], all-optical gating [23], dual state excitability [24], and neuromorphic bursting [15], with excellent agreement between experiment and theory.
We present a comprehensive combined experimental and theoretical analysis of the stability map for an optically injected dual state QD device. As well as mapping out previously discovered dynamical regions, we uncover new features such as slow oscillations with a period of 10s of milliseconds near the positively unlocked boundary. Optothermal effects are shown to play an important role in the system. Superb agreement is obtained between experiment and theory. We also note a marked absence of chaos in the system.

2. Results

2.1. Experiment

The device under investigation is a 300 μ m QD laser composed of InAs quantum dots on a GaAs. It has the same epitaxial structure as the device used in [14,21] but is significantly shorter (300 μ m here compared to 600–900 μ m in [14,21]). As a result, the device under test here never lases from the GS when free-running, and instead, lases only from the ES. It is pumped at 75 mA (1.3 times threshold at 20.5 °C). A schematic of the experimental setup is shown in Figure 1. The device is mounted and placed on an xyz stage. The primary laser (PL) is a commercial tunable laser source with minimum step size of 0.1 pm (∼0.0178 GHz). Light from the PL is injected into the secondary laser (SL) — the QD laser — via an optical circulator with an isolation greater than 30 dB. A polarisation controller is used to set the polarisation of the injected light and maximise coupling. The light from the SL enters the second port of the circulator and is directed to a filter where the ES and GS are separated. The ES emission is sent directly to a 12 GHz detector connected to a high speed, real-time oscilloscope. 10% of the GS power is sent to a power meter (PM) to monitor alignment and 90% goes directly to another 12 GHz detector, again connected to the oscilloscope.
Typically, one can define the experimental injection level as the ratio of the magnitude of the electric field of the injected light to the magnitude of the electric field of the free running laser. However, in this work, when the device is free-running, the GS is never lasing and so this measurement cannot be used. Instead, we define injection strength as the square root of the power of the PL reaching the facet of the SL normalised to the maximum power of the PL reaching the facet of the SL in the experiment, K = P facet P max facet . Thus, the maximum value of K is 1. Similarly, as the GS mode being injected is always subthreshold, the detuning is also difficult to define. We thus pragmatically define zero detuning to be where the ES is at a minimum power after injection.
The experimental technique to build the stability maps is similar to that of [2], but here we fix the detuning and vary the injection strength for each slice of our map. We record and analyse 20 μ s-long time series of both the GS and ES intensities at regular intervals. Initially the frequency of the PL is set and the power of injected light reaching the facet of the secondary laser from the PL is swept from 0.25 mW to 2.47 mW in 120 equal steps of K. Then, a down sweep is performed where the power reaching the facet is swept from to 2.47 mW to 0.25 mW with the same 120 steps. The wavelength is then decreased in steps of 0.2 pm (∼0.0356 GHz) and the power sweeps are repeated after each step.

2.1.1. Stability Maps

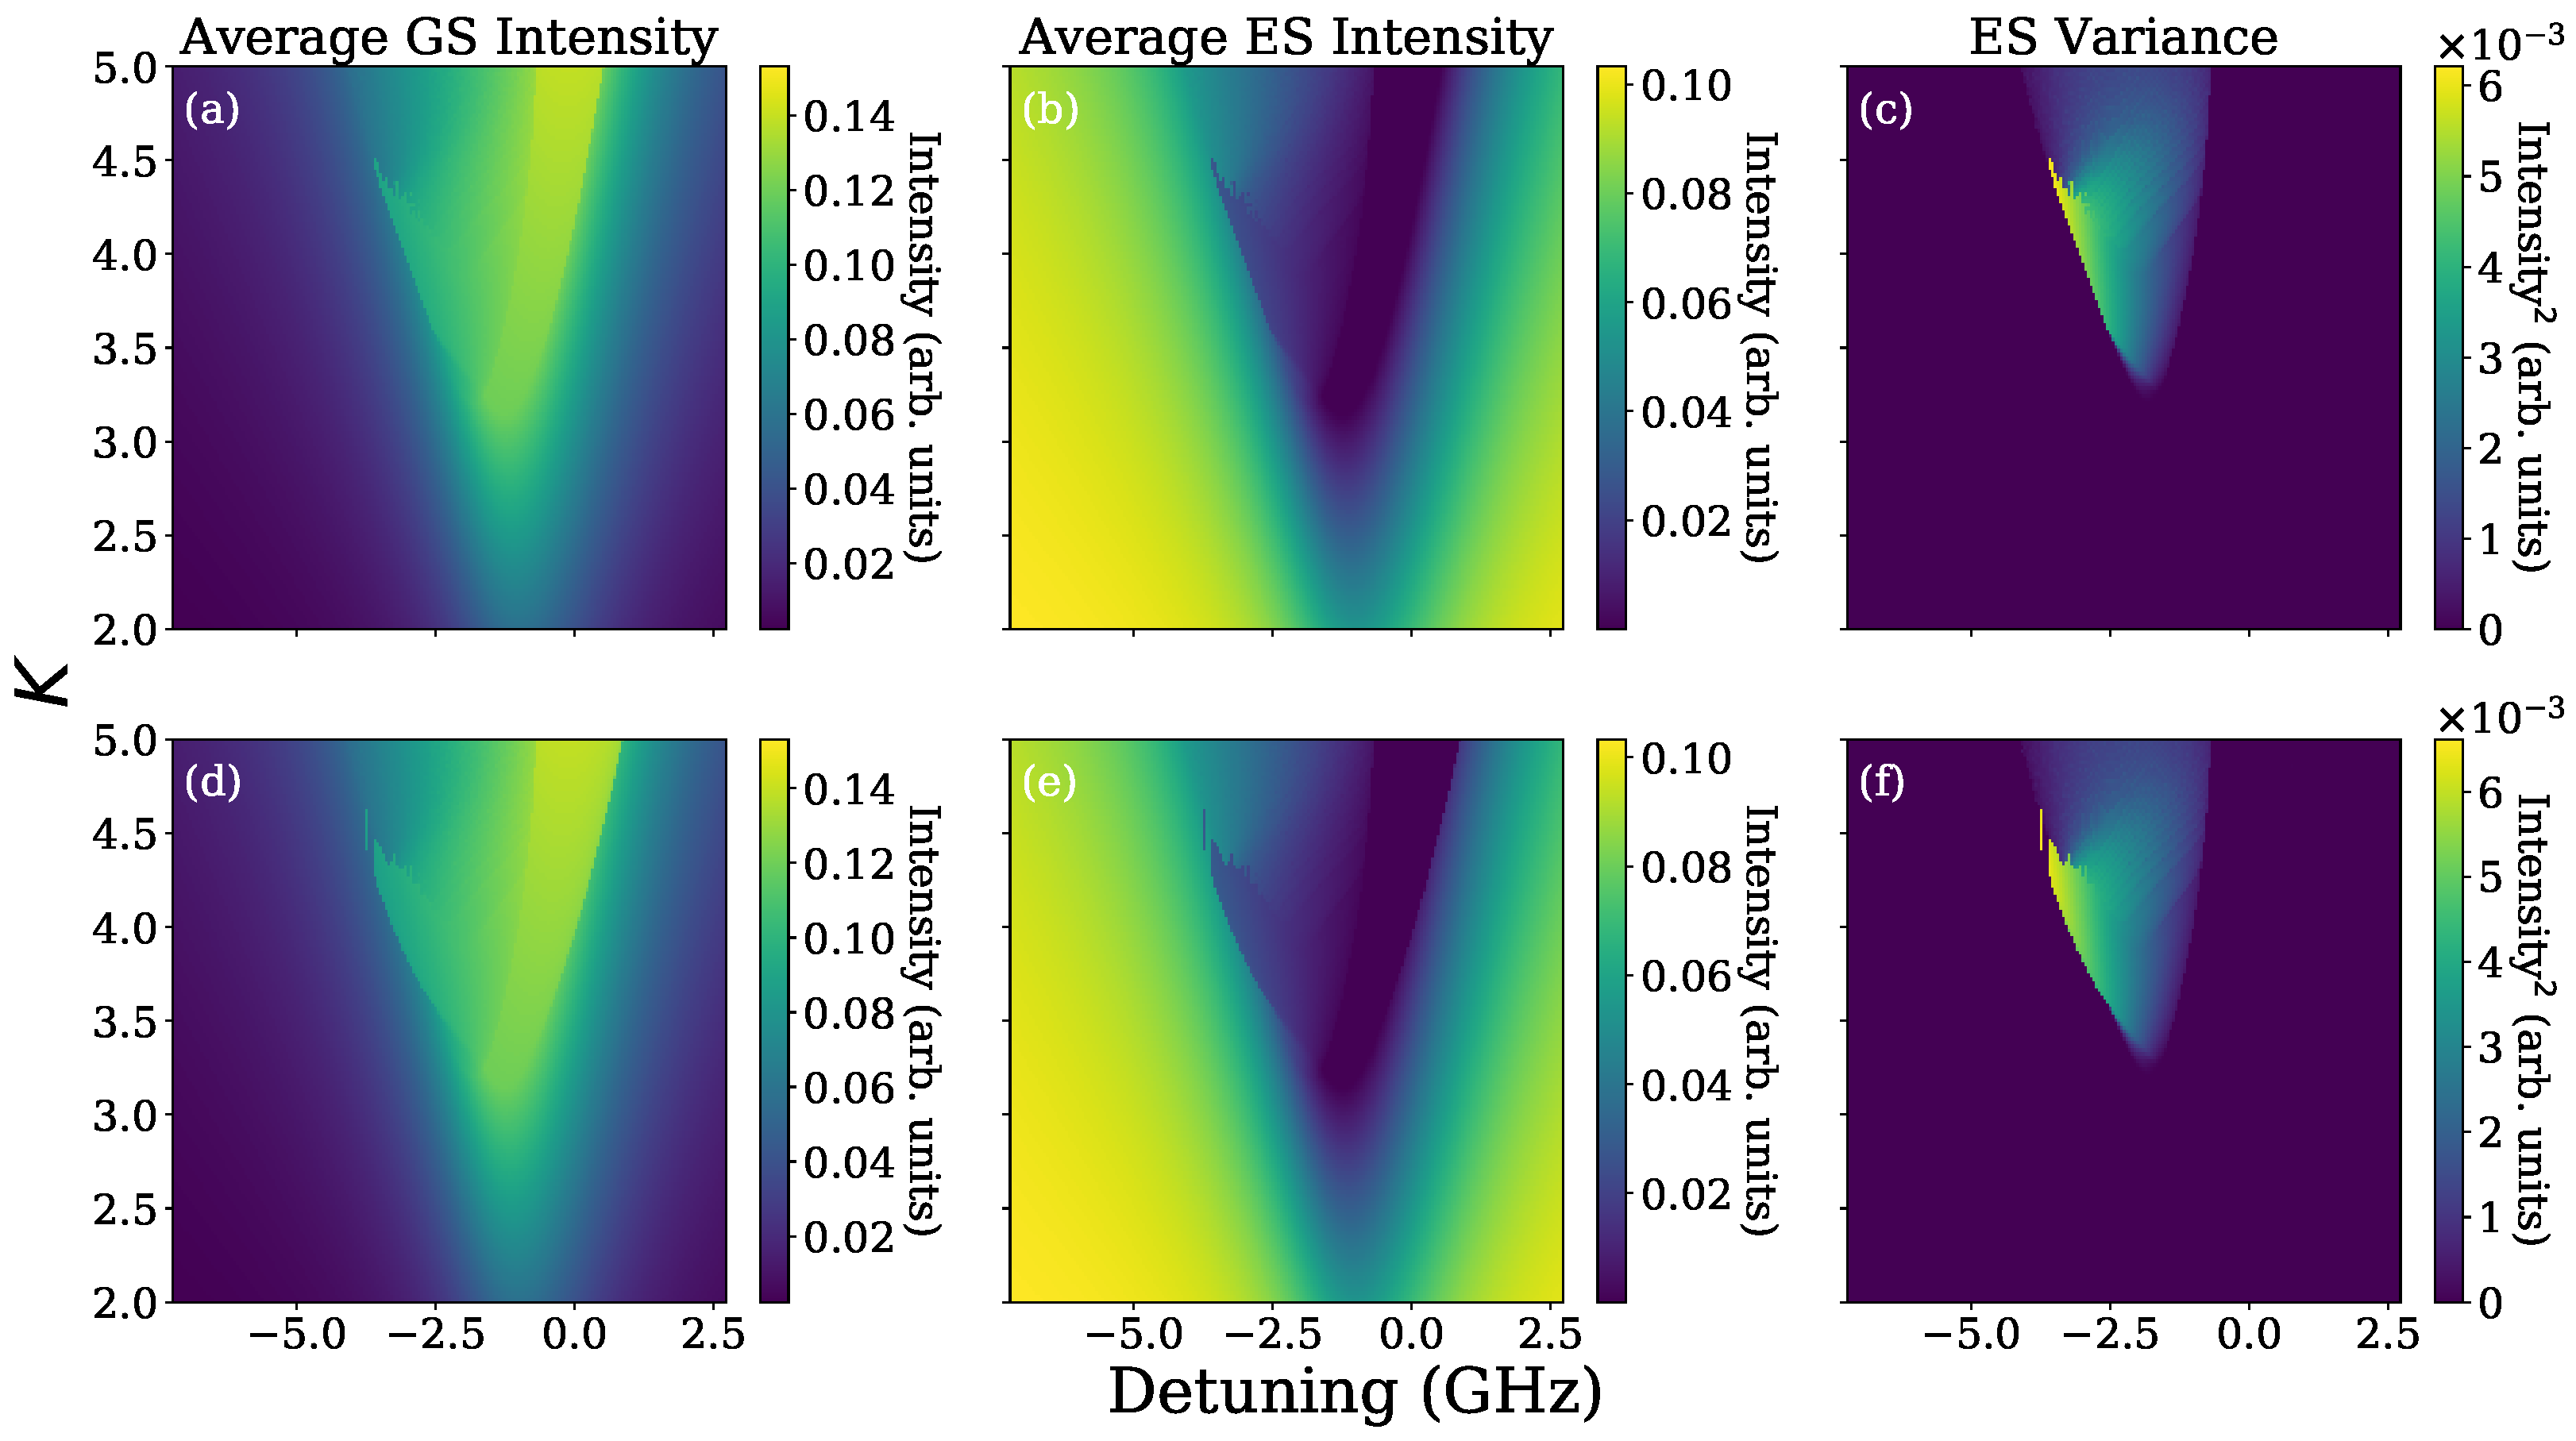
The average power from the GS is plotted in Figure 2a,d and that of the ES is plotted in Figure 2b,e. The variance of the ES output is also calculated and plotted in Figure 2c,f. The variance plots are particularly useful for immediate identification of the constant output regions (dark blue) and areas where the intensity is oscillating (green/yellow). When the ES intensity is constant, that of the GS is also constant, and when the ES intensity is oscillating, that of the GS is also oscillating. The upper panels in all stability map figures in this section show the results generated when the injection sweep is upwards (from low strengths to high strengths) and the lower panels show the corresponding maps for the downward sweep (from high strengths to low strengths).
In Figure 2a, the bright yellow region in the centre is the phase-locked region. Here, only the GS is lasing and the ES is completely quenched as indicated by the corresponding dark blue region in Figure 2b and the zero variance in Figure 2c. To the negative detuning side of the phase locked region there is a broad area of dynamics as indicated by the green and yellow region in the variance in Figure 2c. On the positive boundary of the phase locked region there is a region of very slowly varying GS power, indicated by the non-smooth colouring/speckled pixels in Figure 2a. We defer discussion of this for now and return to it below.
To the positive side of the slowly varying speckled region, the device behaves as a dual state emitter, with both states emitting constant intensities. As the detuning is increased there is a smooth, continuous evolution of both, with the GS power decreasing and the ES power increasing. The same dual state behaviour is mirrored in the negative detuning region to the left of the dynamic oscillatory regime. We interpret this as follows: in the GS only system (or indeed any conventional optical injection system), there are unlocking boundaries outside of which there are only oscillating unlocked solutions. In the limit of large detuning, the oscillations can be physically interpreted as a beating between the injected light and the emission of the secondary laser. However, in our dual state system there is no free-running GS. Thus, this beating cannot arise. The output of our QD SL can then be thought of as a mixture of regenerated injected light [4,25] and ES emission from the secondary laser. We thus distinguish between the phase-locked output (dark blue) in Figure 2b, where the ES is completely off, and the regenerated injected light output of somewhat large detunings where there is dual state emission.
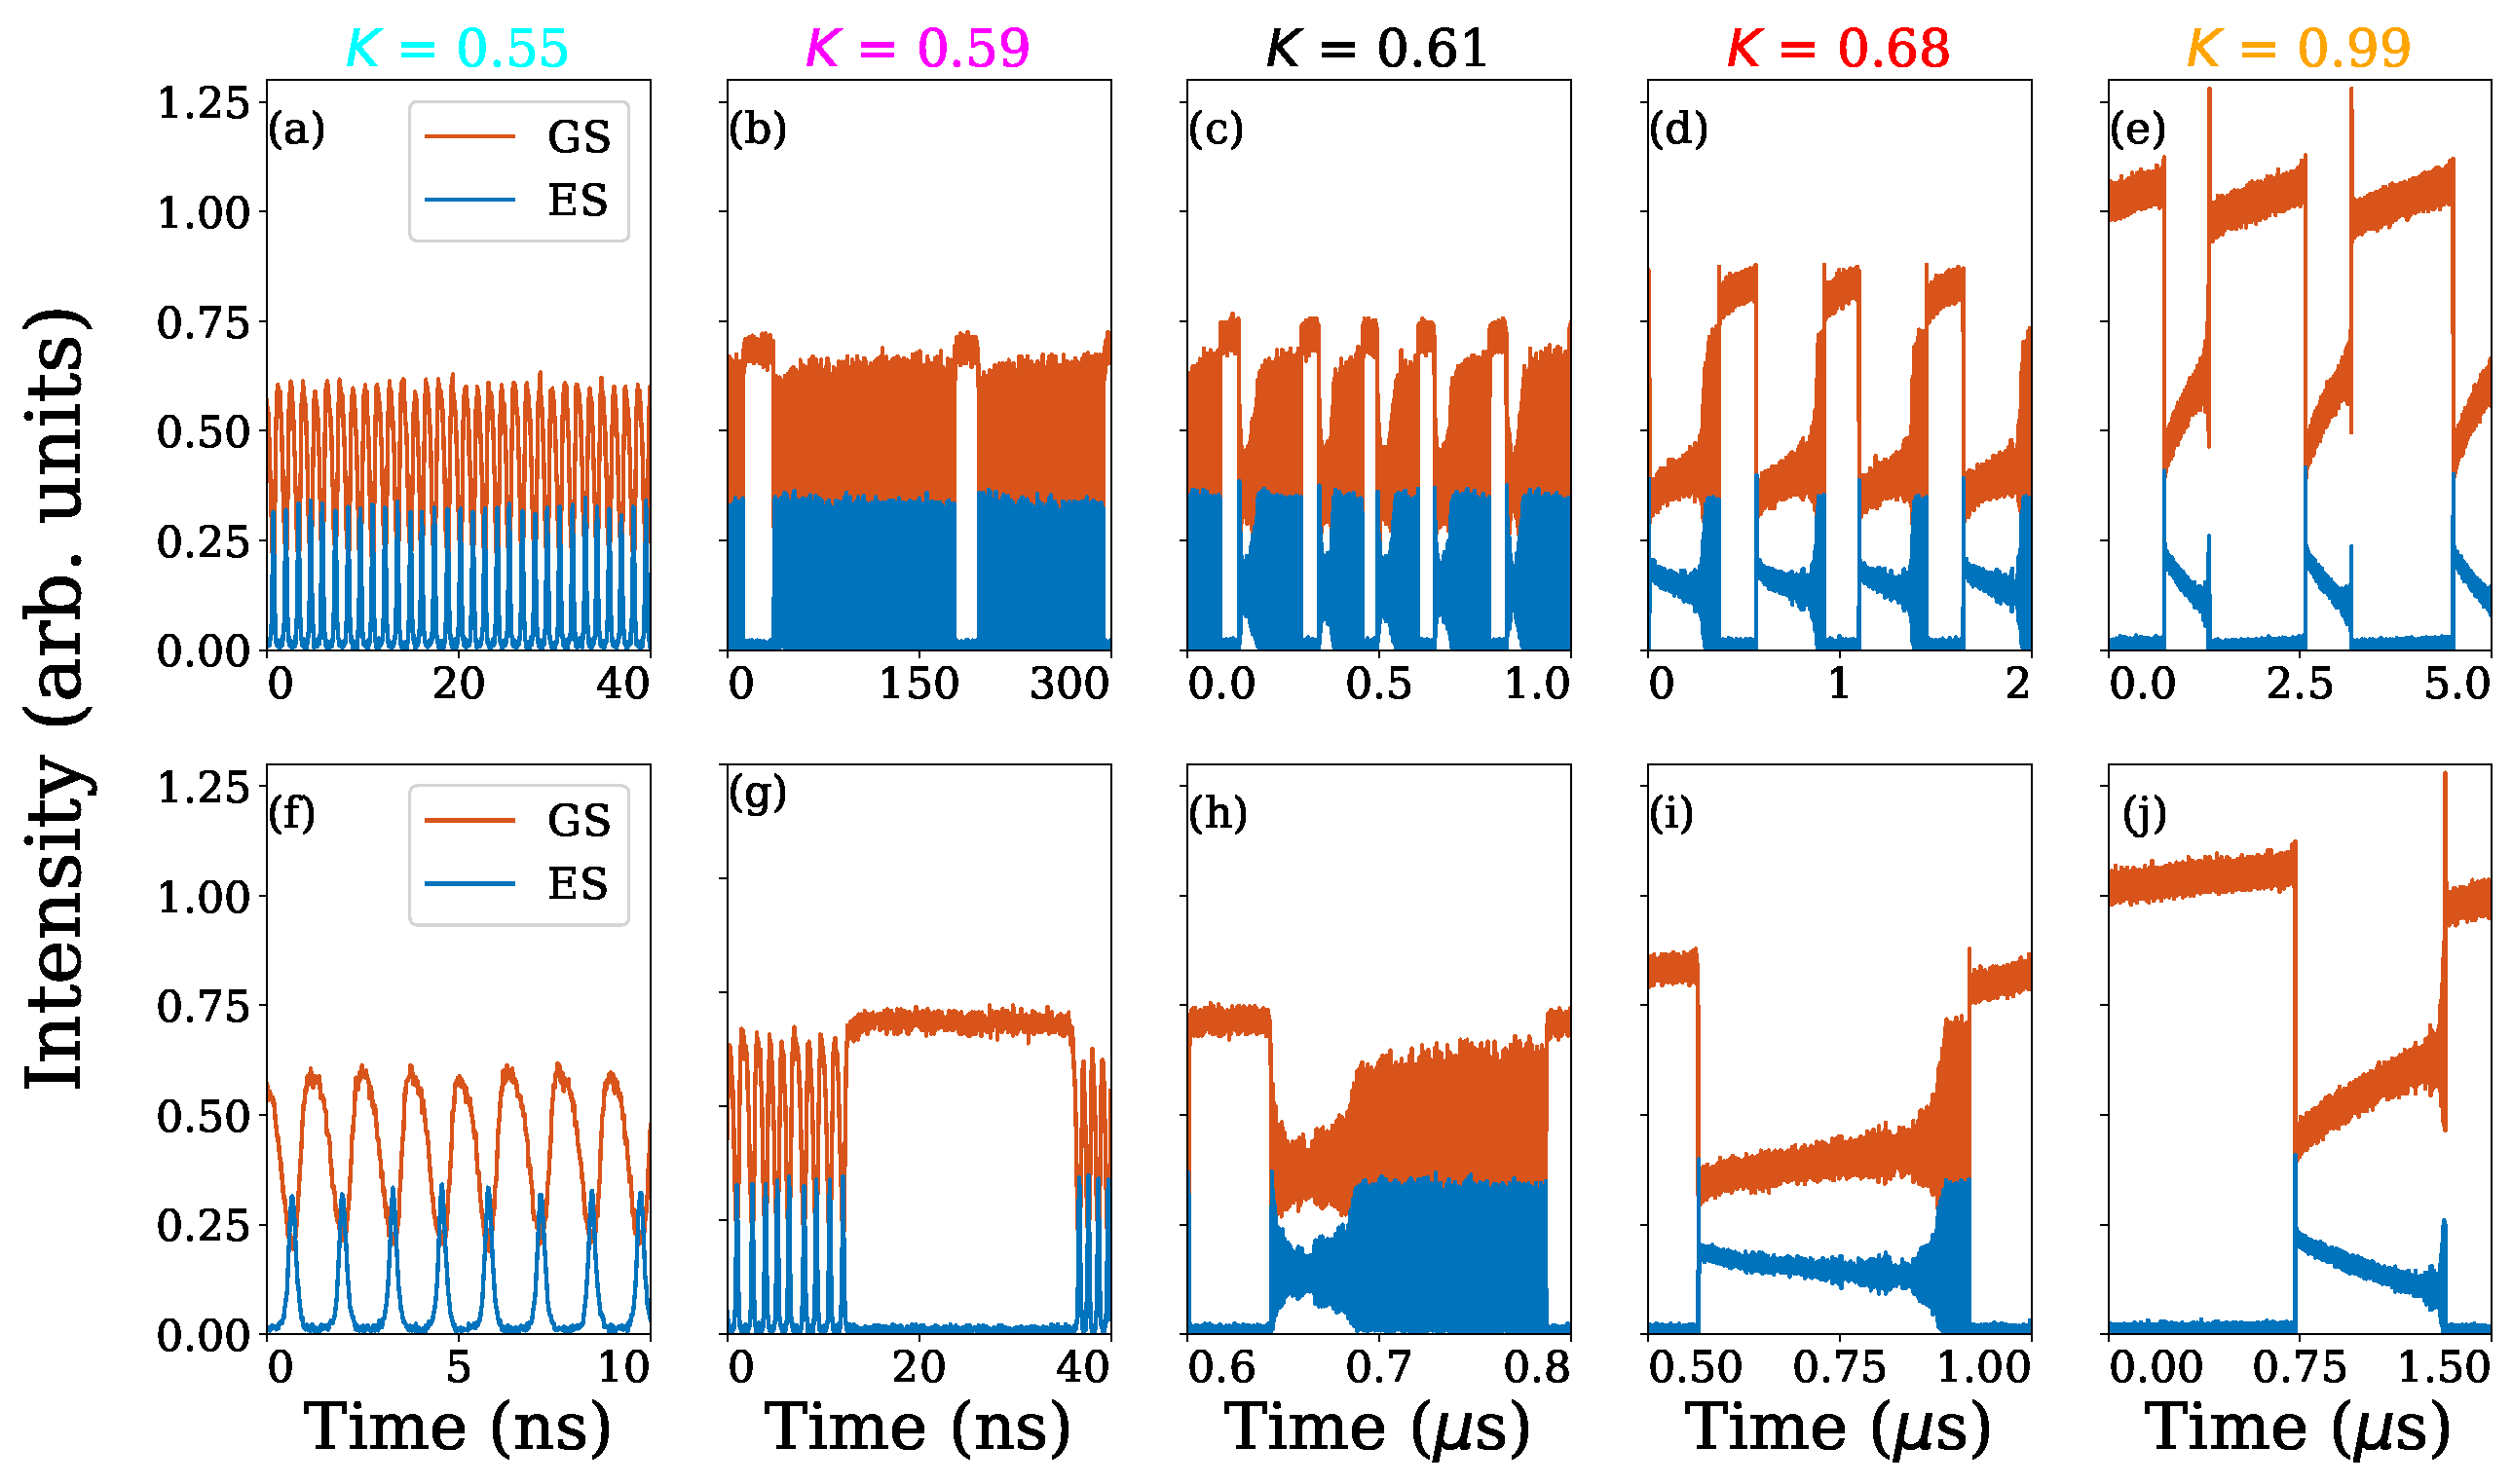
Figure 3 shows just some of traces taken during a single upsweep of the injection strength K for a fixed detuning of −6.9 GHz. The coloured labels correspond to the coloured dots in Figure 4, marking their location on the maps. (The maps in Figure 4 are the same as in Figure 2, with some additional markings to allow for comparison with Figure 3). Figure 3a shows a periodic train of GS dropouts and the corresponding ES pulses as reported in [23,24]. As the injection strength is increased these periodic trains disappear, and in Figure 3b a bursting oscillation is obtained while various mixed mode oscillation (MMO) and bursting MMO regions [26,27] are observed in Figure 3c–e. In Figure 3b there is a switching between a quiescent phase, where the GS is on and the ES is off, and an active phase with oscillations in both states (similar to the dropouts and pulses of Figure 3a). A further increase to K = 0.61 leads to a different bursting dynamic as shown in Figure 3c. In this region, the switching is between a quiescent phase with the GS on and the ES off and an evolving bursting phase. The switch to the bursting phase is via an initial period of decreasing amplitude oscillations, followed by a long series of growing oscillations before a switch back to the quiescent phase. Such evolving bursts were previously reported in [15] and shown to arise via an optothermal coupling. The evolution of the bursting state arises via a determinstic thermal sweep of the detuning leading to slow passages through several bifurcations, breaking underlying bistabilities similar to the generation of excitable square waves in the GS only system in [14]. In Figure 3d K = 0.68 , the trace is qualitatively similar to that in Figure 3c, but in Figure 3d the oscillations following the GS dropout die away quickly and the bursting part of the trace is shorter. Finally, when K is increased to 0.99 as shown in Figure 3e, there are no oscillations following the GS dropout and only a very short region of oscillations preceding the return to the quiescent, GS on phase.

2.1.2. Hysteresis and Bistabilty

In order to identify regions of bistability in the maps, we can compare the upsweep and downsweep figures in Figure 4. The upper panel shows the upsweep with a red line superimposed, marking the boundaries from the downsweep. The lower panel shows the downsweep with a white line superimposed, corresponding to the boundaries of oscillatory behaviour from the upsweep. The boundaries are largely the same, and reveal bistabilities where they differ. The negatively detuned side of the phase-locked region (the red/white line in the centre of each figure) is the same in both cases. At high injection strengths and negative detunings, the two directions match at the boundary between the dynamical region and the regeneration region. However, at moderate injection strengths from approximately K = 0.5 to K = 0.65 , and between detunings of approximately −8.5 GHz and −6 GHz, there is a clear region of hysteresis. This stands out clearly in all of the plots, but most obviously in Figure 4f.
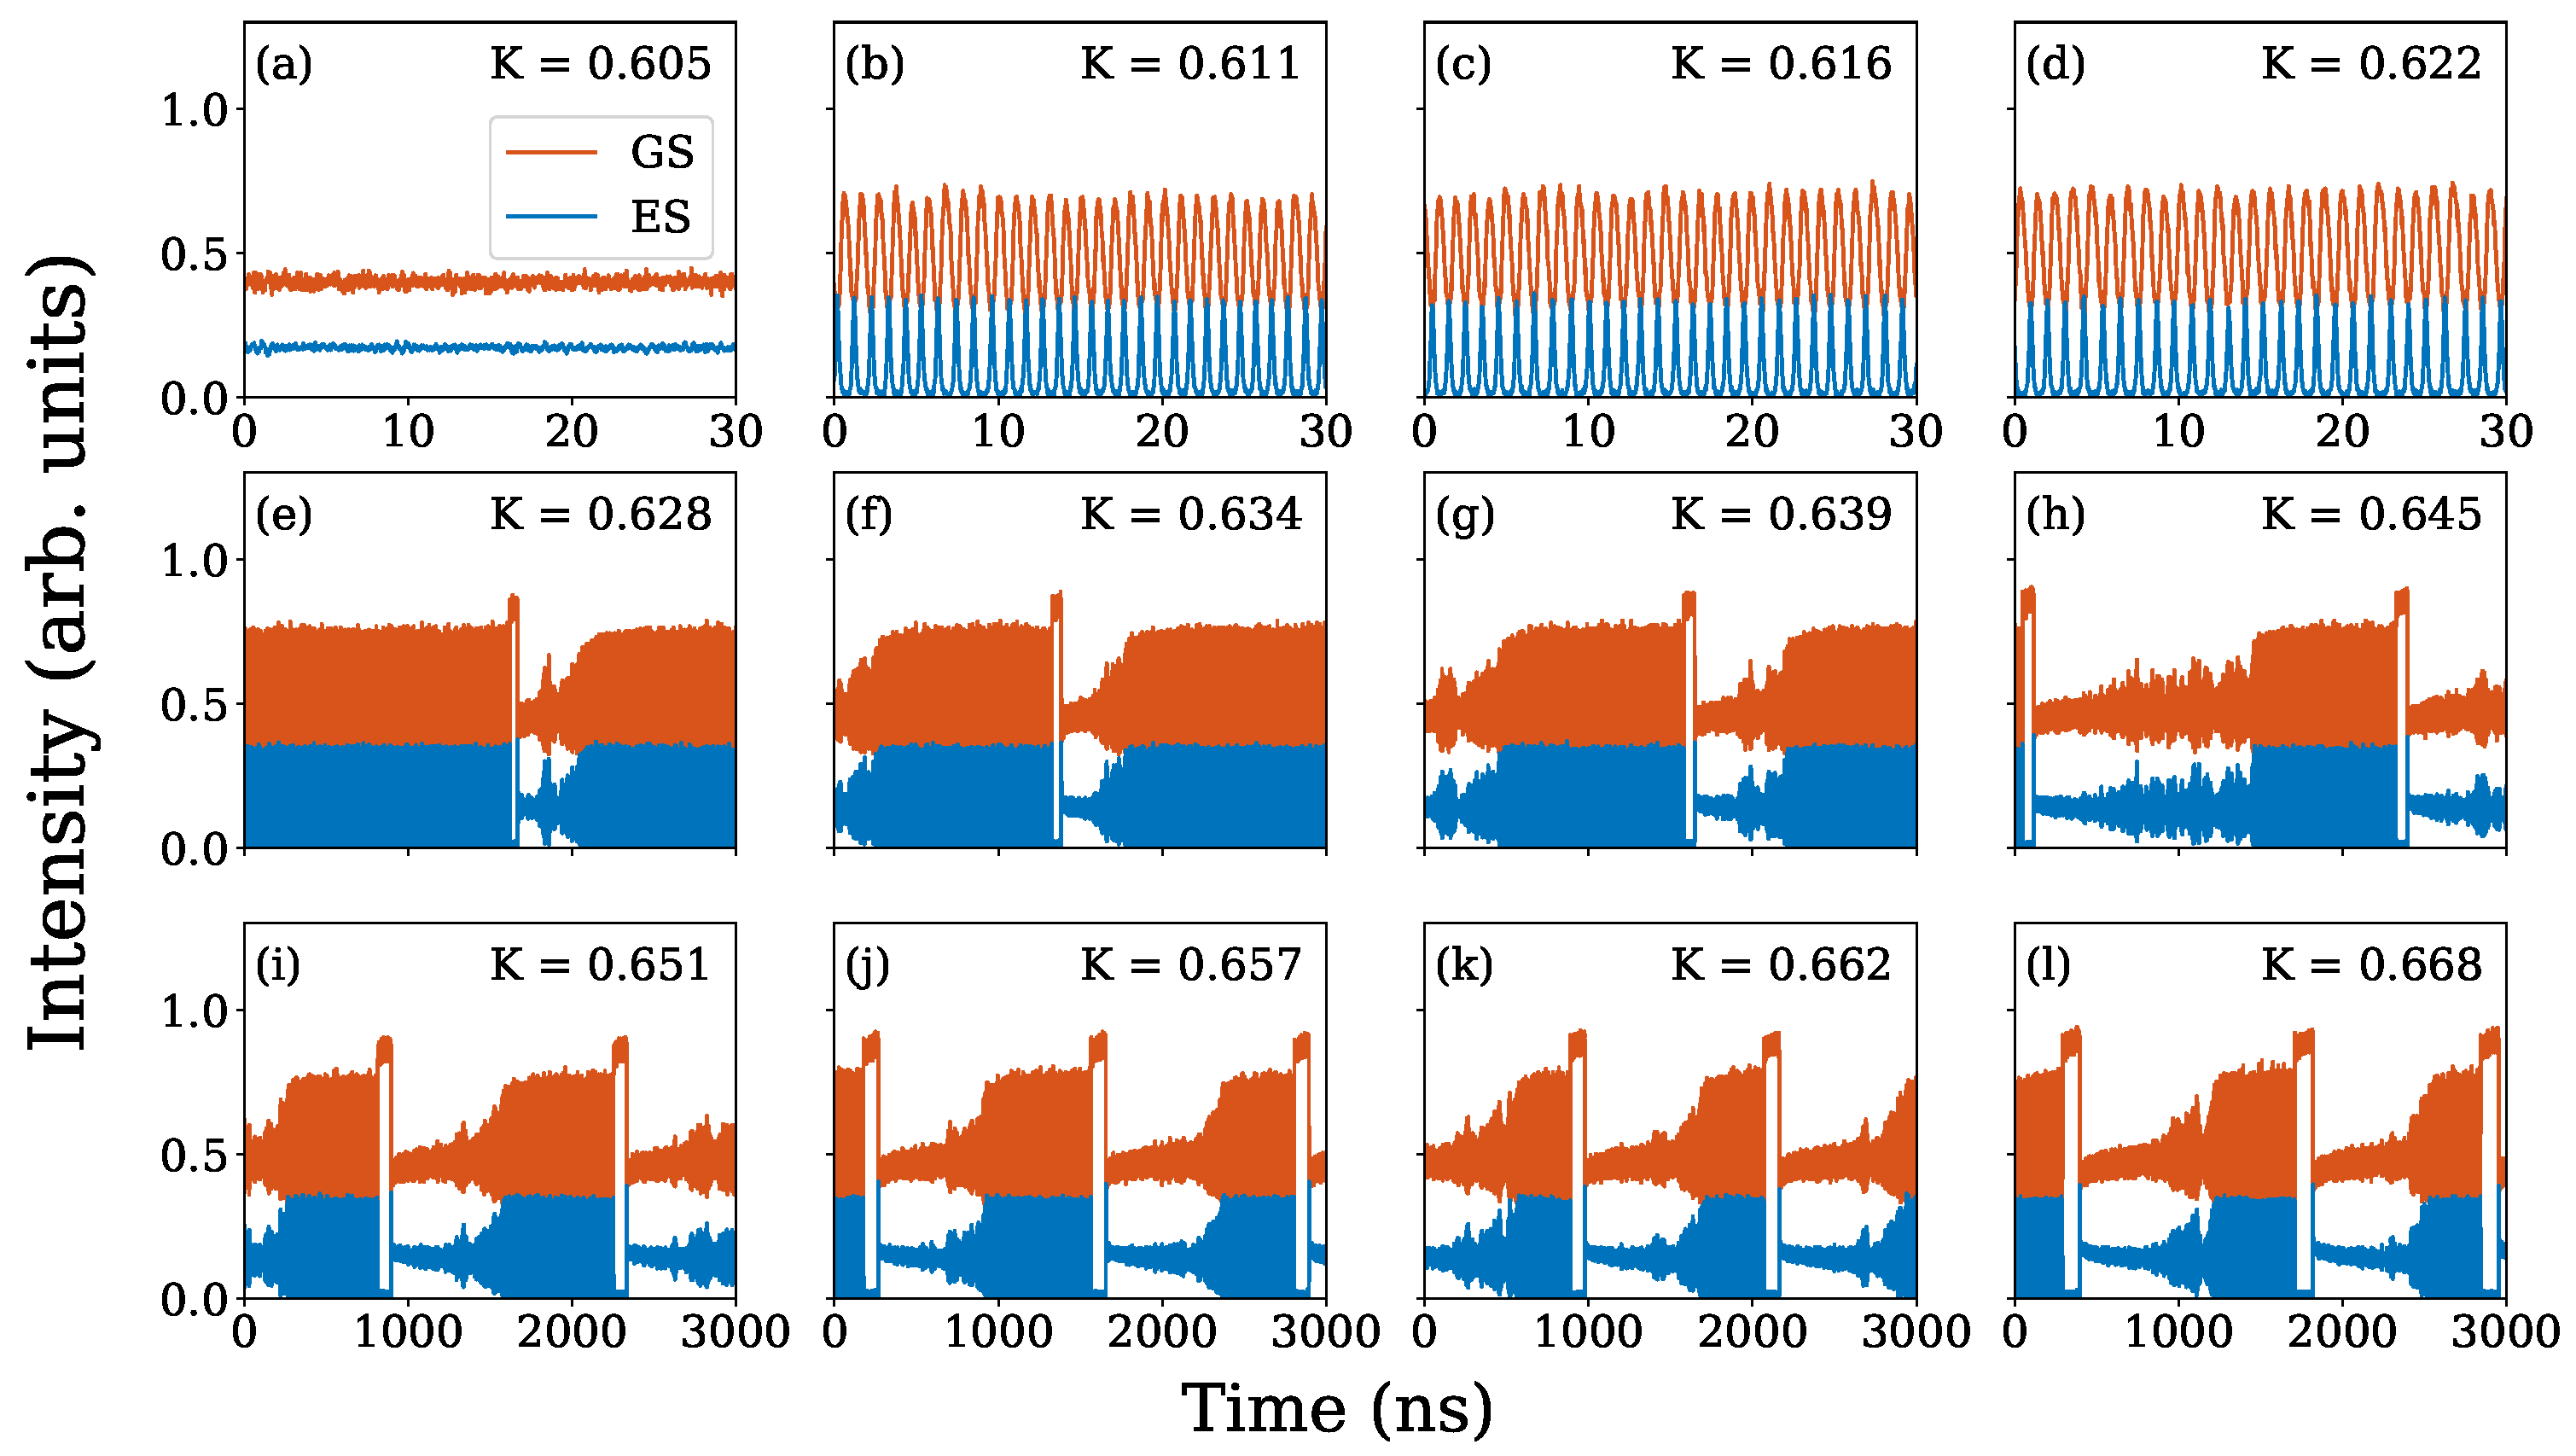
Figure 5 and Figure 6 compare the timetraces from an upsweep and a downsweep, respectively, at a detuning of −8.2 GHz. The sweeps move across the widest part of hysteresis region, just to the right of the almost vertical part of the red line shown in the upper panels in Figure 4. It is important to note that the injection strengths are plotted in the same grid position of both figures for easy comparison. Thus, the upsweep shown in Figure 5 was performed from Figure 5a–l, while the timetraces during the downsweep shown in Figure 6 were collected in reverse, from Figure 5l–a.
In the case of the upsweep in Figure 5a–g, dual state emission is observed (this is in the regenerated region). As K is increased to 0.645, shown in Figure 5h, the GS appears to oscillate with a very small amplitude suggestive of a Hopf bifurcation, before the onset of bursting and MMOs at K = 0.651 shown in Figure 5i. The lifetime of the bursting state decreases as the injection strength is further increased.
Similar MMOs are seen for high injection strengths during the downsweep until K = 0.645. Then, the presence of hysteresis can be seen by comparing the corresponding subplots of Figure 5 and Figure 6. As K is further decreased below 0.645, we do not find continuous wave dual state emission until K = 0.605 . Between these two values, the lifetime of the bursting state continues to increase and the switches to the quiescent phase become more rare. Eventually, trains of GS dropouts and ES pulses are observed, as seen in Figure 6b. These trains were observed for the entire 20 μ s acquisition time of the oscilloscope. As there are fewer quiescent phases, the overall variance is large and is therefore represented as bright yellow in the variance map (Figure 4f). Clearly, the yellow region extends beyond the white line marking the upsweep dynamical boundary, highlighting the hysteresis cycle. In Figure 6a, where K = 0.605, the oscillations disappear, and continuous wave dual state emission is obtained, as is also observed in the upsweep in Figure 5a–g. Thus, we find a bistability between the constant dual state emission (constant ES and regenerated injected light) and dynamic, pulsing behaviour with MMOs.

2.1.3. Slow Oscillations

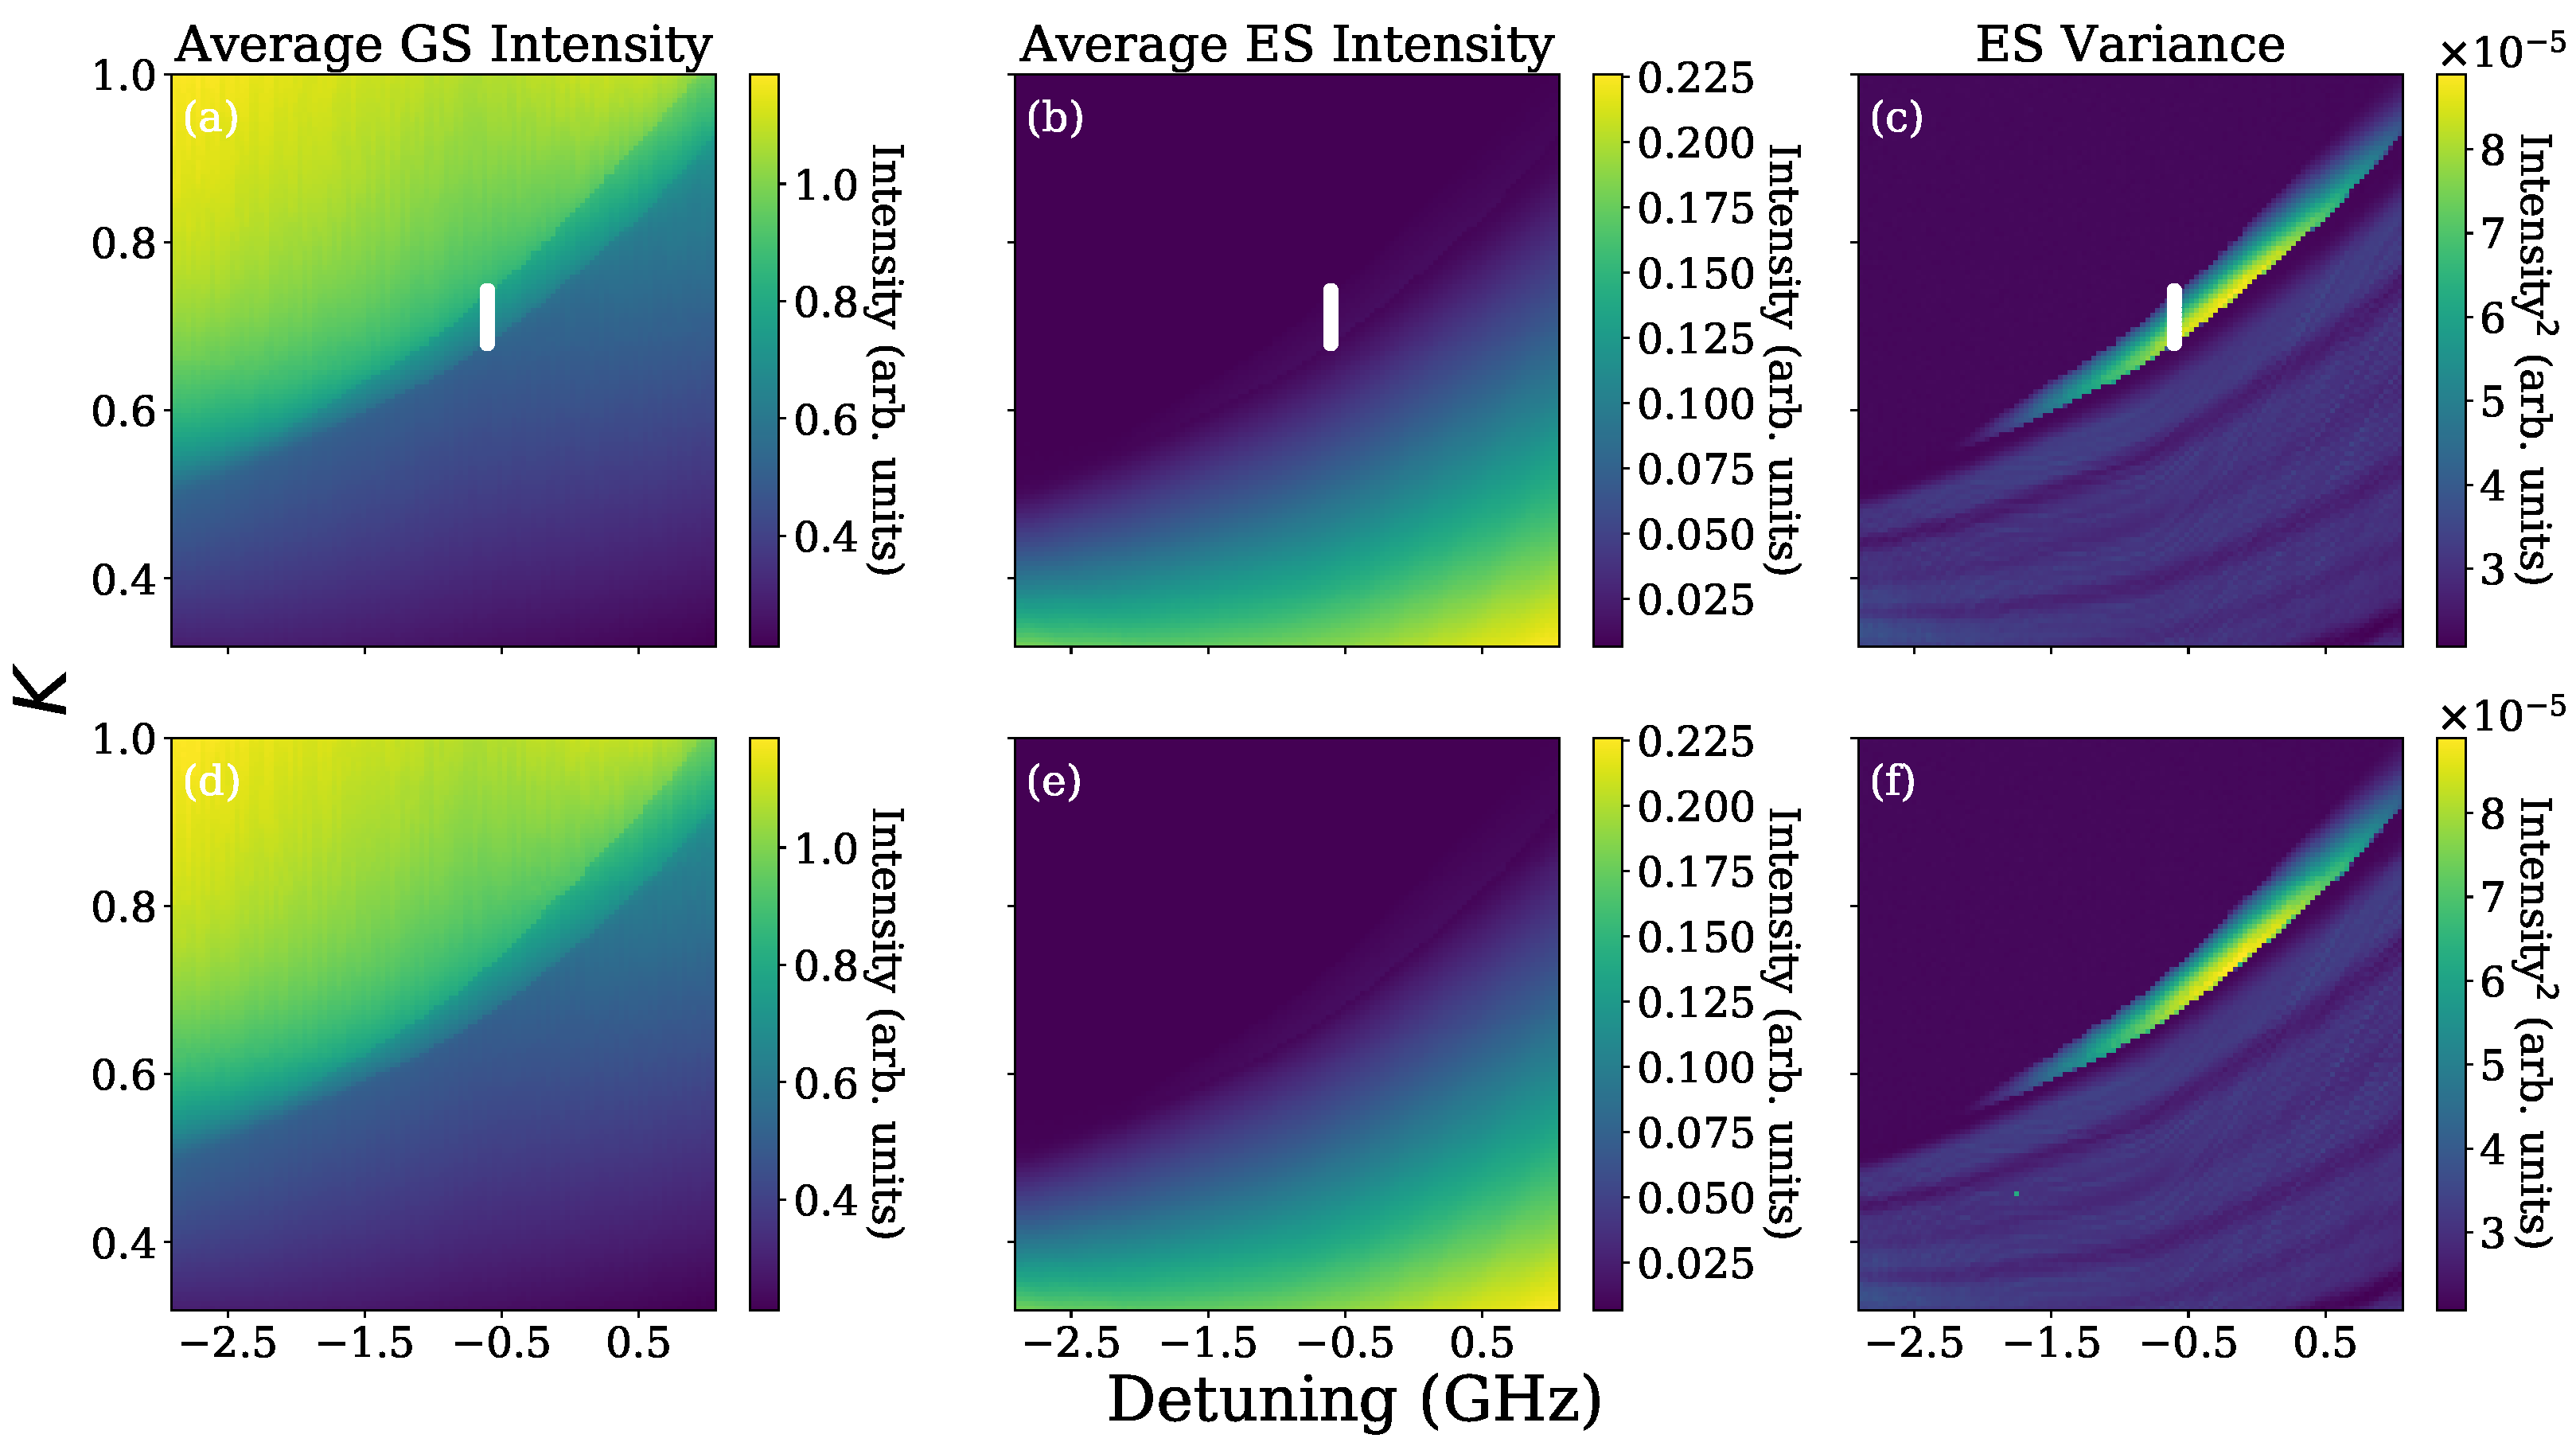
As mentioned above, on the positive detuning side close to the transition between the phase-locked and regeneration regions, there is an area of dynamics indicated by a speckled, non-uniform colour along the diagonal boundary in Figure 2a,d (and also, of course, in Figure 4a,d). In fact, there are essentially two colours, indicating that there are two distinct average GS intensities. The binomial nature of the colouring suggests a slow dynamic of which we only sample a short, nearly constant part within the 20 μ s measurement interval. The sampling window is increased to 1 second and new maps are created and shown in Figure 7. We note that there are also very narrow regions of hysteresis on both the left and right of this region.
Figure 8 shows timetraces from an upsweep at −0.6 GHz marked by white lines in the upper panels of Figure 7. The period of the oscillations is extremely long: approximately 40 ms. The output is strongly dominated by the GS, but very small corresponding oscillations are also observed in the ES as can be seen in Figure 8. The cycle resembles a periodic oscillation between the phase-locked GS output and the dual state regenerated light output.
At the lower injection strength boundary of this region (i.e. at the bottom of the white line), the lower intensity section of the timetrace is longer lived than the upper intensity section, as is clear in Figure 8b. Increasing K, the duty cycle changes, eventually reaching 0.5, as seen in Figure 8h. Continuing to increase the injection strength, the higher GS intensity section becomes longer lived than the lower GS intensity section, as is most clearly seen in Figure 8k. Qualitatively, this behaviour is extremely similar to the optothermal square waves on the negative detuning side in the GS only system [14,16] and to the square wave/bursting phenomena reported here and originally in [15], where optothermal coupling breaks bistabilities. We thus interpret this region as another broken bistability between a low power GS output such as that shown in Figure 8a and a high power GS output such as that shown in Figure 8l. However, and importantly, the oscillations here are ∼100,000 times slower.
The qualitative similarity of the oscillations with the previously investigated optothermal effect is very suggestive. However, even apart from the vast difference in timescales, there is a significant difference that prevents the explanation of the oscillations via the original thermal coupling. Consider the phase locked bistability near the negative detuning boundary of [14]. In that case, the low power solution is on the negatively detuned side of the region and the high power solution on the positive side. The physical source of the coupling in that case is non-radiative carrier recombination. The low-power solution results in high carrier density and an ensuing higher temperature via increased non-radiative recombination. In the high power solution, the carrier density is lower and so the temperature is lower. Thus, higher power leads to lower temperature and vice versa; the deterministic cycle is driven by the low power solution being pushed towards positive detuning and the high power solution pushed towards negative detuning, yielding an anticlockwise phasor cycle as shown in [14,16]. However, in the new region identified in this work, the high power solution is the more negatively detuned of the two. Thus, the high power solution would push the system further towards the negative detuning direction and vice versa for the low power solution, and so the cycle would not arise. Thus, heating due to non-radiative recombinations cannot account for the phenomenon, and a coupling with the opposite sign is required. Such a coupling does exist, as can be seen by considering several important ways in which heating can arise in the device. In particular, reabsorption of light in the device can lead to such heating. In [28,29] both recombinative and re-absorptive heating was included. It is also known that self-absorption arises in QD lasers in particular, due to the wide distribution of states and dot sizes [30]. Thus, for re-absorption, a higher optical power leads to an increased temperature, and so the effect results in an effective detuning sweep in the opposite direction to that of the first optothermal effect, as required. Furthermore, the timescale for the second effect should be significantly longer as the time over which re-absorptive heating is distributed through the device can be of the order of tens of milliseconds, or even longer [28,31]. This matches the observed timescale extremely well. We see below that including such an effect in the model allows for excellent agreement with the experiment.

2.2. Theory

We use a rate equation model to numerically investigate the system. Rate equation models have been used extensively to great effect in studies of optically injected QD lasers, such as in [3,9,32,33] and further references within. Superficially, there are several different models. Of course, all arise from the same starting point: the Maxwell–Bloch equations. The differences then arise via choices about how to describe carrier capture and escape between the carrier reservoir, the excited state(s), and the ground state of the QDs and even whether to treat the electrons and holes separately or together in an excitonic model. Further, one can also consider whether to include effects such as phase-amplitude coupling and inhomogeneous broadening microscopically or phenomenologically, or indeed at all. We necessarily need to extend any model to include two optothermal effects with extremely slow timescales and so, for purposes of computational efficiency, we use an excitonic model for the carrier dynamics, while for the light dynamics we consider the electric field of the GS and the intensity of the ES. Our model is,
E ˙ GS = g ( 1 + i α GS ) ( 2 ρ GS 1 ) κ E GS + 2 i g α ES ( 2 ρ ES 1 ) κ E GS 2 π i ( Δ 0 + Δ 1 + Δ 2 ) E GS + K ,
    I ˙ ES =   4 g ( 2 ρ ES 1 ) 2 κ I ES + β ρ ES / τ ,
      ρ ˙ GS = S rel g | E GS | 2 ( 2 ρ GS 1 ) ρ GS / τ ,
ρ ˙ ES = 1 2 S rel + S cap 2 g I ES ( 2 ρ ES 1 ) ρ ES / τ ,
N ˙ = J 4 S cap N / τ ,
where E GS is the electric field of the GS, I ES is the power of the ES, ρ GS and ρ ES are the occupation probabilities of the GS and ES, respectively, and N is the normalised charge-carrier number in the quantum well reservoir. The rate equation model in Equations (1)–(5) is thus a two state extension of that used in [3,9] where it was used to model GS only QD lasers under optical injection. The scattering terms in Equations (6)–(8), on the other hand, are of the form used in [32,33] and are given by
S rel = S rel ( 1 ρ GS ) ρ ES exp ε GSES k B T ρ GS ( 1 ρ ES ) ,
S cap = S cap ( ρ ES eq ρ ES ) ,
ρ ES eq = 1 + exp ε ES k B T exp N D 2 D 1 1 1 .
There are three Δ terms controlling the detuning in the system. Δ 0 allows us to choose our reference frame. We define Δ 0 δ 0 + δ with δ 0 chosen so that the GS frequency of the free-running laser is at zero. Thus, δ 0 compensates the frequency shift due to the phase–amplitude coupling and the optothermal effects in the free-running laser. Then, δ = 0 is at the central GS frequency of the free-running quantum dot laser and it is δ that defines the x-axis in each of our maps below. The other two terms, Δ 1 and Δ 2 , are used to implement the aforementioned optothermal coupling mechanisms. Δ 1 accounts for heating of the active region due to recombinative heating, while Δ 2 models overall device heating via re-absorption. We implement these two different effects with individual coupling strengths c 1 , 2 , and characteristic time scales γ 1 , 2 in the following two equations,
Δ ˙ 1 = γ 1 ( c 1 [ 2 ( ρ GS ρ GS th ) + 4 ( ρ ES ρ ES th ) + ( N N th ) ] Δ 1 ) ,
Δ ˙ 2 = γ 2 ( c 2 [ | E GS | 2 + I ES ] Δ 2 ) ,
where the subscript “th” denotes the value of the corresponding charge-carrier variable at the laser threshold. (We note that in [14,16] the thermal effect was coupled to the power even though the physical explanation is via the carriers. In the Class A case, this is unavoidable, as the carriers are adiabatically eliminated.) The meaning of all the other parameters used in the equations and their values are given in Table 1.

2.2.1. No Optothermal Effects

It turns out to be quite instructive to first consider the system in the absence of any optothermal effects, then with only one effect, and finally with both effects included, thereby allowing for a comprehensive description of how the observed features emerge. There are many features that are common to all three cases. In particular, there is a large, central, phase-locked region; there are large dual state, regenerated, injected light regions for large magnitude detunings; and for low injection strengths at negative detuning, an antiphase dropout and pulsing dynamic is found in each case.
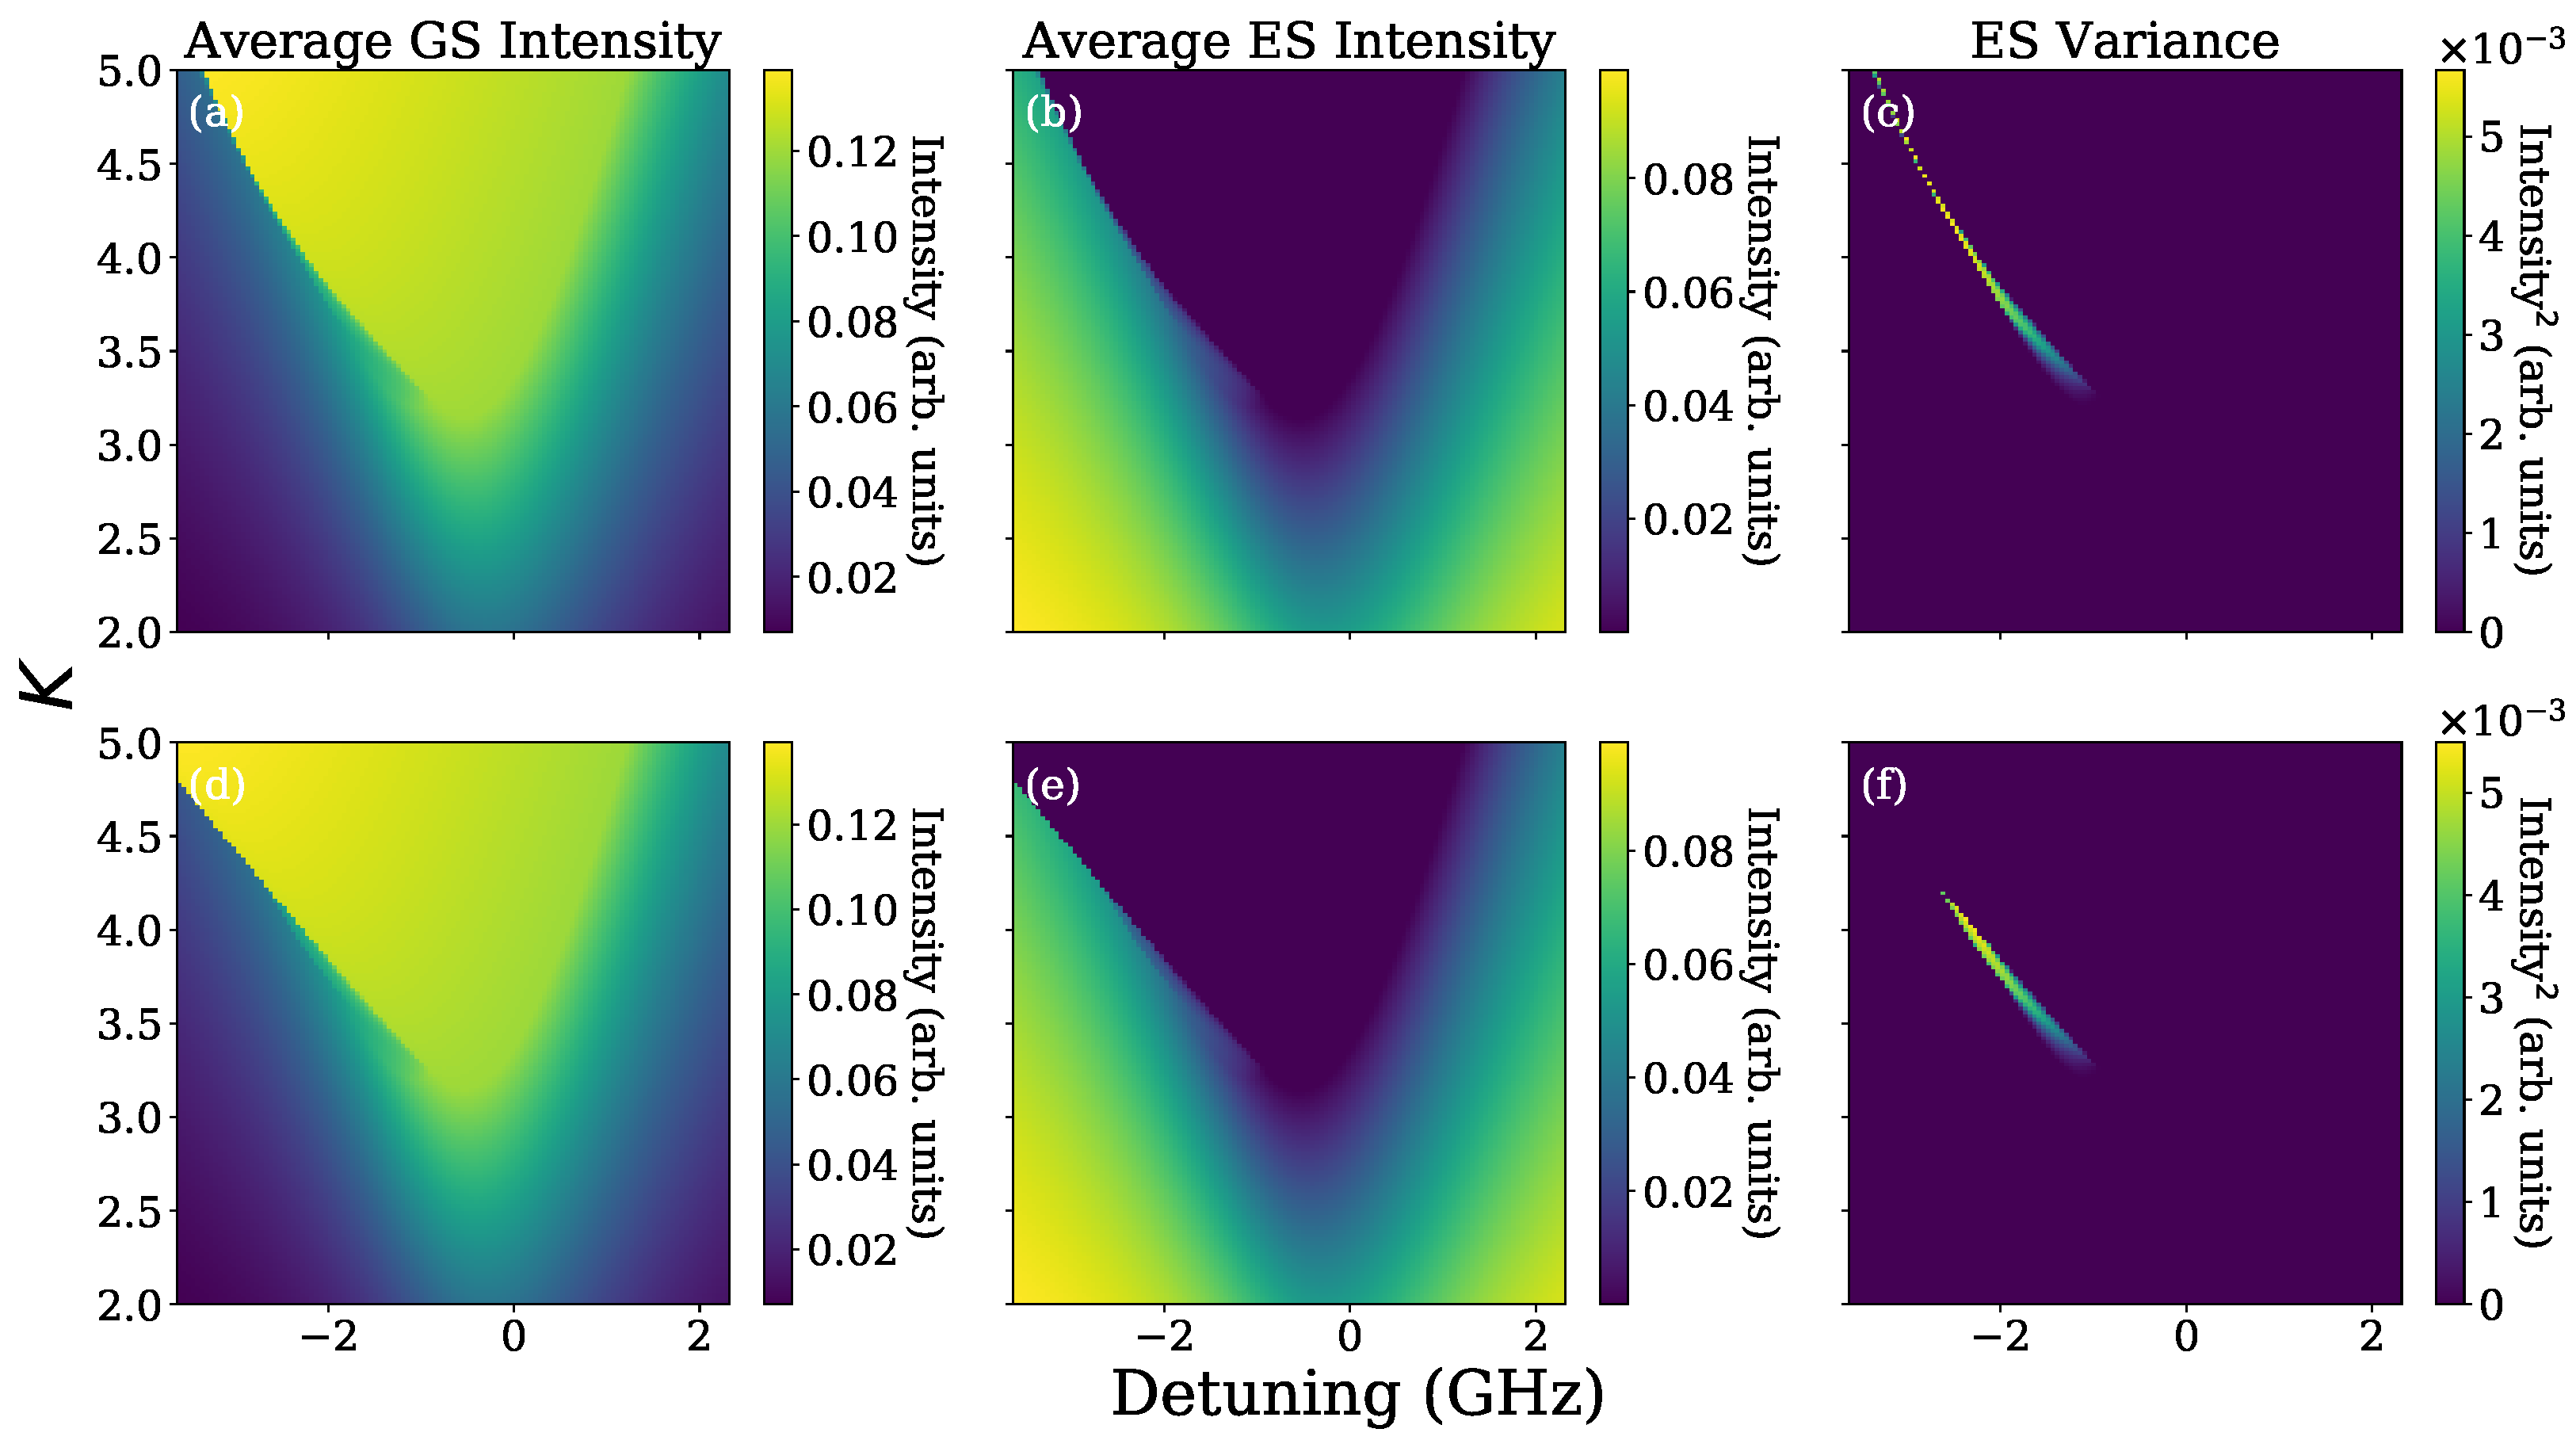
In the absence of any optothermal coupling, there are no square wave phenomena for either negative or positive detuning. Instead, we find multiple bistabilities near the negative detuning boundary. One of these is very clear from Figure 9 in the top left corner of each subplot. Consider the leftmost edge of Figure 9a,d. In the upsweep, the regenerated, two state output persists right up to the top of the figure. Figure 9c shows that the regenerated two state output eventually destabilises via a Hopf bifurcation along the bright line in the top left corner. There is only a very narrow region over which the resulting oscillatory solution exists, after which the system moves to the phase locked output. In the downsweep case, however, the bright yellow phase-locked region extends down to K∼4.8 at the extreme left of Figure 9d. Thus, there is a clear bistability between the phase-locked output and the regenerated two state output over a large region and, indeed, another bistability between the phase-locked output and the oscillating two state output over a small region.
There is another region of hysteresis around K∼4. This is not as easy to see in the figure as it is over a much smaller area. We include a gif in the supplementary material showing the transition from Figure 9c,f, in which the hysteresis is clear. At this injection strength, the phase-locked solution first destabilises into the oscillating GS dropout/ES pulse regime reported in [24] as the injection strength is decreased. This phase-locked/pulsing regime is bistable with the regenerated two state output and its destabilising Hopf induced cycle discussed above (again, as is clear in the supplemental gif). Notably, though, there is not a bistability for positive detuning (where we find the extremely slow dynamic in the experiment).
One might reasonably expect the negative detuning bistabilities from previous GS only analyses [9,17], and some have even already been described in [15,21,32]. In [15], it was shown that the introduction of an optothermal coupling leads to the destruction of high injection strength bistability and that a periodic bursting dynamic is instead obtained. We repeat this analysis here with our model.

2.2.2. First Optothermal Effect

Here, we introduce the first optothermal effect, arising from non-radiative recombinations, and plot the updated maps in Figure 10. As expected, (and again, as was already shown in [15]) this breaks the upper bistability, and yields the periodic bursting square wave regime. The bistability between the phase locked/pulsing output and the dual state/Hopf dynamic is preserved although its precise location and size has changed. However, more intriguing here is the effect that this has on the positive detuning boundary. Now, where before there was no bistability, we find one. It is a bistability between the phase-locked output and the constant dual state output as indicated in Figure 11 near 1 GHz. This arises as the first optothermal effect shears the map so that the two solutions now overlap. It arises in a relatively narrow region precisely where the extremely slow square waves are obtained in the experiment. The appearance of this bistability motivates the introduction of a second optothermal coupling. As discussed in the experimental section above, this coupling must take the opposite sign to the original optothermal effect in order to yield the desired deterministic oscillations.

2.2.3. Second Optothermal Effect

We use a characteristic timescale of γ 2 = 4 μ s 1 for the second optothermal effect, which is not quite as slow as the experiment but allows for a reasonable computation time while maintaining a large enough timescale separation with the existing dynamic timescales. We have verified that an even longer timescale for γ 2 reproduces qualitatively identical dynamics. With the addition of the second optothermal effect, the square wave bursting solutions and the experimentally observed bistability are preserved as shown in Figure 12. We note that the value of c 1 when the two effects are included is different to the one we chose for just one optothermal effect. This is because the second optothermal effect counteracts the first one and so, in order to maintain the same overall shape, c 1 must change when the second coupling is introduced. On the positive detuning side, the new thermal effect yields a region of very slow oscillations in the region where there had been a bistability. The region over which these arise is most clearly seen when looking at the GS variance in Figure 12c,f and in the number of maxima as shown in Figure 13c,f in the narrow lines at the positive detuning boundaries. (In fact, there is even still a very small region of hysteresis as can be seen in Figure 11b in agreement with the experiment.)
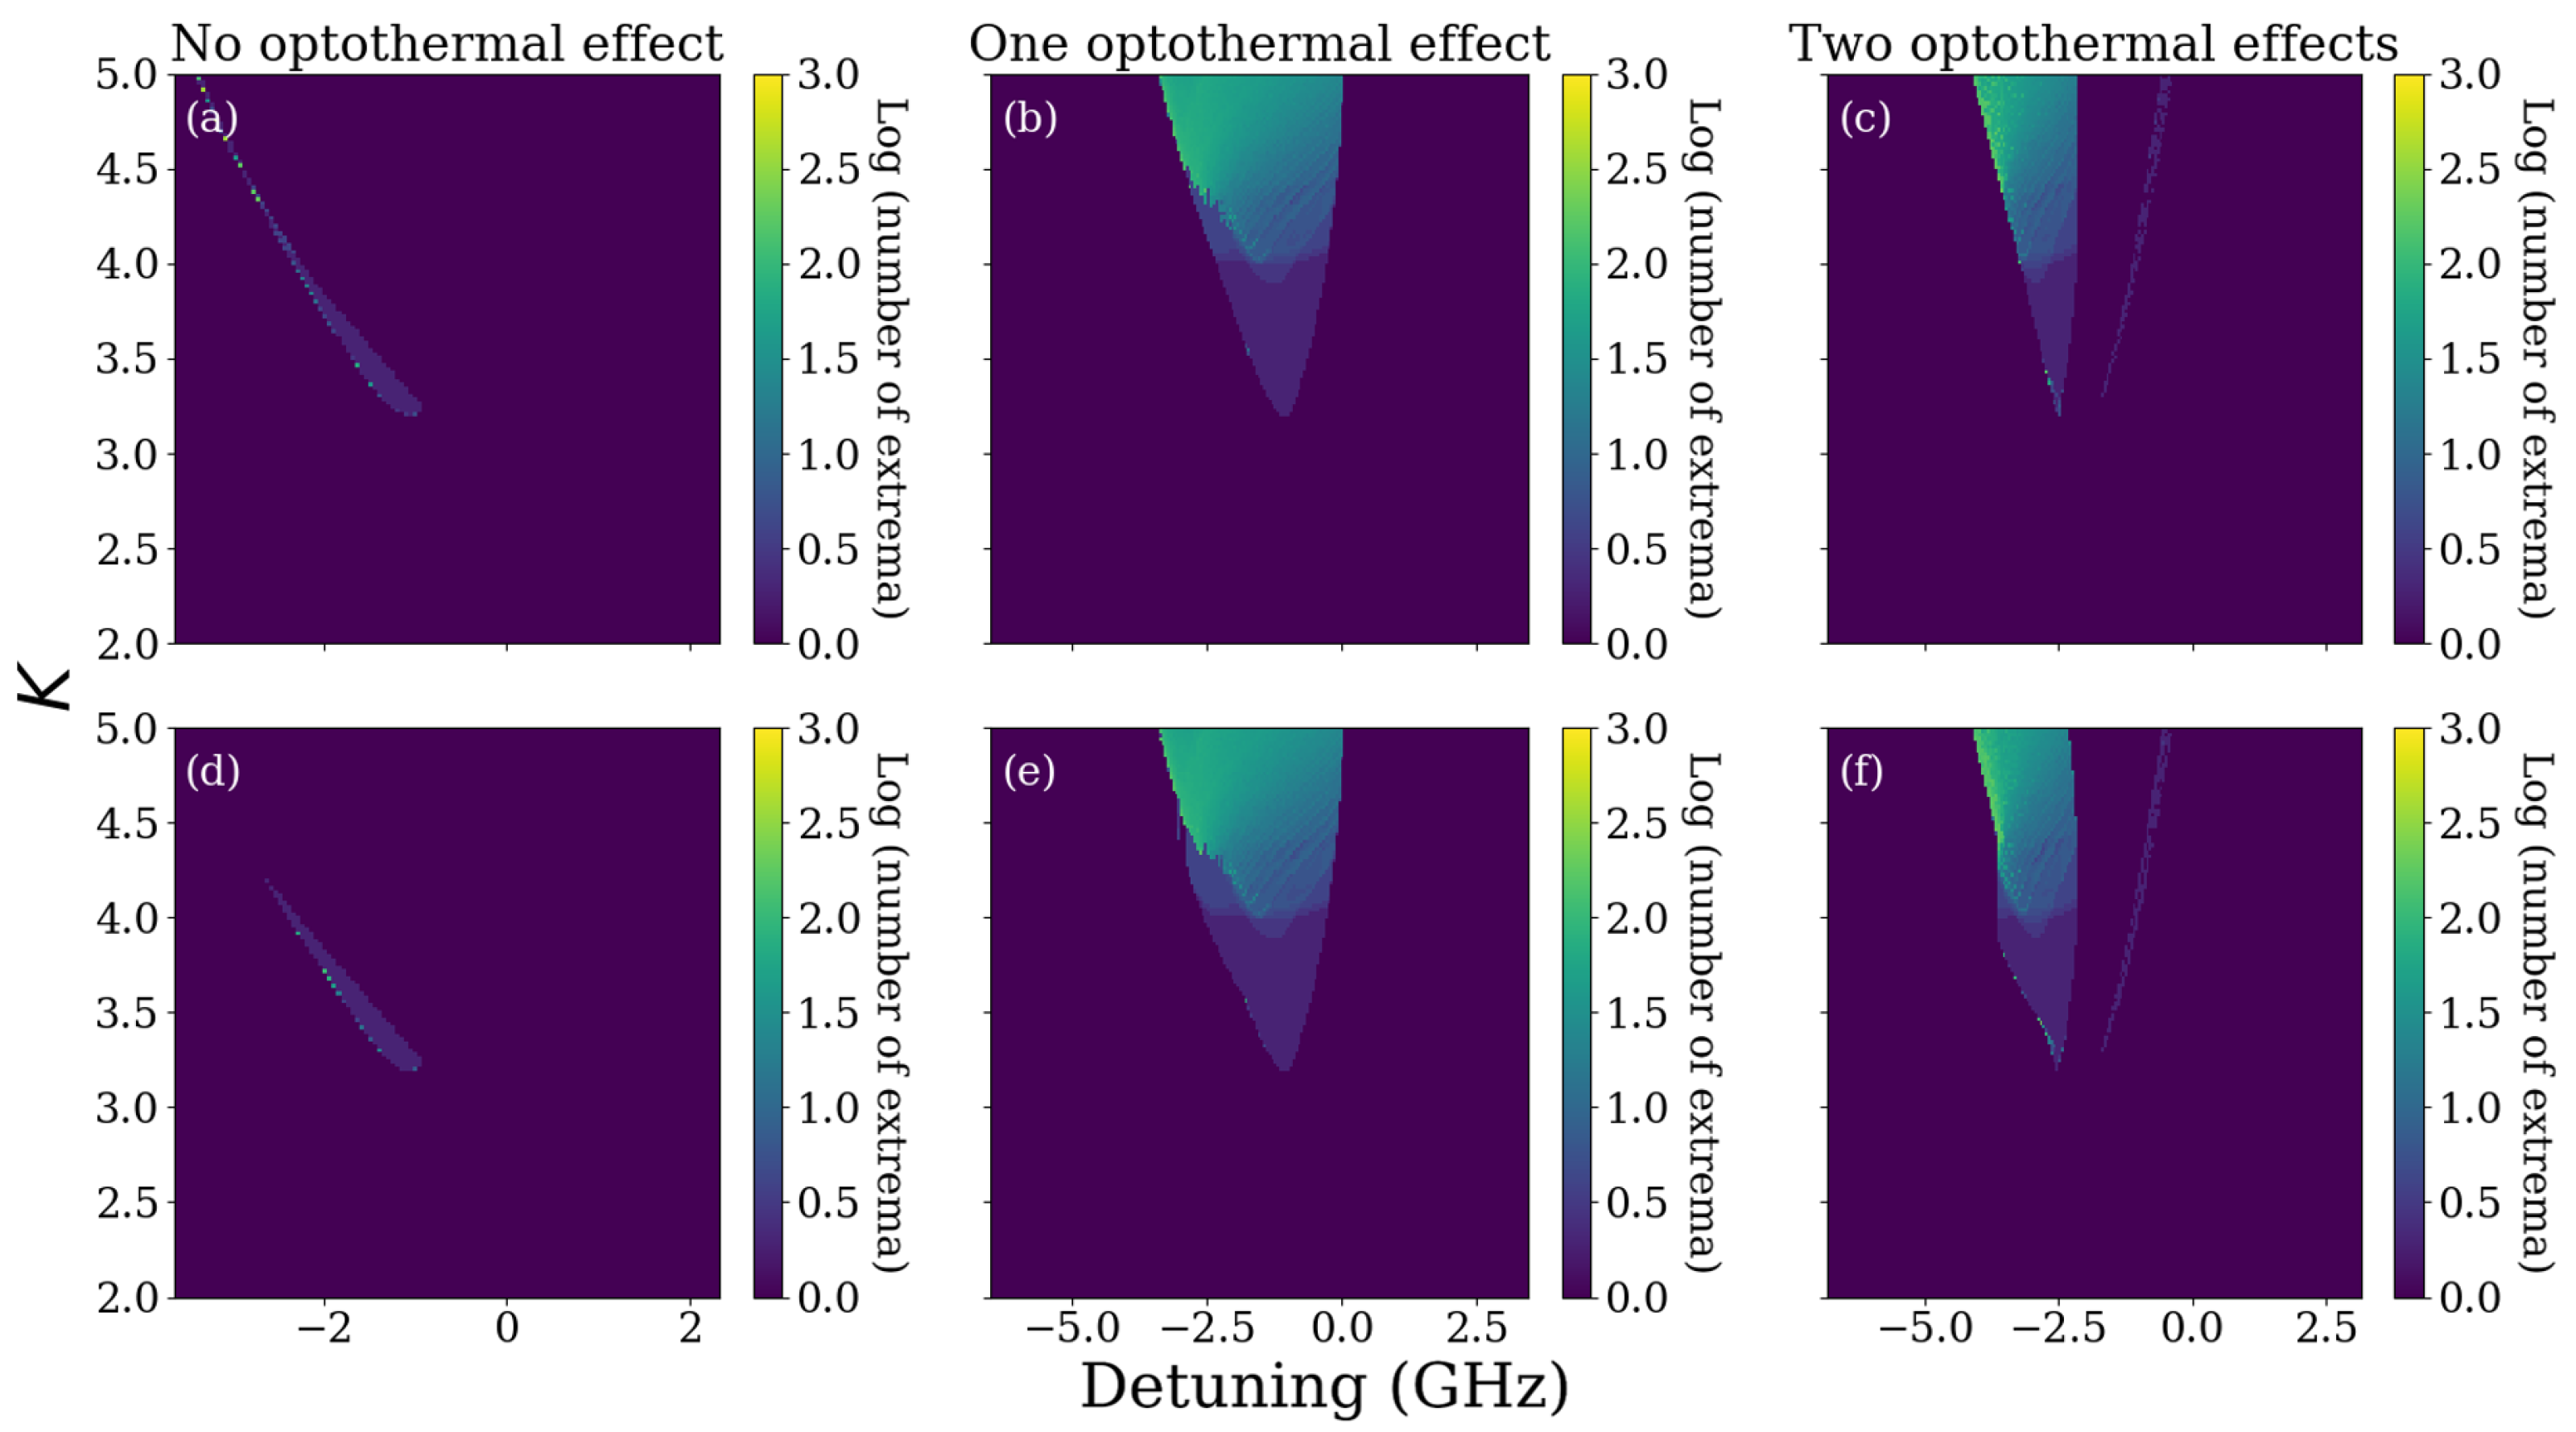
Figure 13 is very instructive in highlighting the evolution of dynamical features with the inclusion of optothermal effects. We plot the number of maxima in the time series when there is no optothermal coupling in Figure 13a,d, when there is recombinative optothermal coupling in Figure 13b,e, and when both optothermal couplings are included in Figure 13c,f. Without optothermal coupling, there are very few regions of dynamics and those that exist do so only over small areas. When one optothermal coupling is included as in Figure 13b,e dynamics become much more prevalent in the system and a large region of dynamics appears in the central region of the map. In Figure 13c,f we find that the two competing optothermal effects endow the system with all of the experimentally observed dynamics. Most notably, as already mentioned, the experimentally observed extremely slow oscillations are found near the positive boundary.
Apart from the dynamical features, there are several distinct features in the shape of experimental map. One of these is the near vertical boundary for negative detuning for K∼0.6 in Figure 1. This feature is recovered with the inclusion of both optothermal effects as seen in the lower panels in Figure 12 and Figure 13c,f for K 4 . A second feature is the shape of the dynamical region (and consequently the phase locked region). In the experiment, there is a large and very asymmetric region of dynamics for negative detuning and a very narrow region of dynamics along the positive detuning boundary. Figure 13 shows the evolution of the dynamics arising in the model as the optothermal effects are included. There is one very narrow region of dynamics for negative detuning when no optothermal coupling is included. There is a large, somewhat symmetric, central region of dynamics when the recombinative optothermal effect is included. Finally, when both optothermal couplings are included, the map is sheared so that the dynamical region is rendered asymmetric, folding back towards negative detuning as the injection strength is increased, just as in the experiment.

2.2.4. Absence of Chaos

As mentioned in the introduction, there is a marked absence of chaos when a QD laser emitting from the ES is optically injected near the GS. We have not observed any chaotic regimes in the experiment or in the numerical studies. The presence of chaos in optically injected QD lasers for the GS only case has been reported several times both experimentally and theoretically, such as in [3,32,34] and we have confirmed it arises using our model by adjusting the parameters to allow for GS only lasing. However, it appears to be absent in the dual state system analysed in this work. While there are multiple maxima in large regions of the map as shown in Figure 13c,f, these correspond only to the bursting dynamics, which is complex but not chaotic.

3. Discussion

We have presented a detailed stability map for the optically injected dual state QD system. This is the first comprehensive experimental map in the literature to the best of our knowledge. We also present the first numerical map taking optothermal effects into account. These effects have dramatic effects on the overall system, but allow for excellent agreement between our experimental and numerical results. Unlike with the optically injected conventional semiconductor laser, optothermal effects play a somewhat prominent role in the map, and there is an array of intact and broken bistabilities due to competing optothermal effects. A particularly beautiful route to an extremely slow square wave dynamic near the positive detuning boundary is obtained. As with the implementation of optothermal effects in other systems, a bistability is broken yielding a deterministic optothermal cycle. However, the bistability only exists due to a different, competing, optothermal coupling in the first place! There is no sign or even hint of the dynamic in the bare system.
The need to consider optothermal effects in this system, and indeed in the conventional GS only system, arose entirely due to experimental findings where unexpected square wave and bursting phenomena were observed. However, the inclusion of optothermal effects in the model is shown here to improve the mapping beyond simply recovering the dynamics, with characteristic shapes and features found in the experiment recovered only when the full system is analysed. This suggests that perhaps including such couplings in other injection systems might be worthwhile.
With a view to the future, QD lasers are particularly suited to photonic integrated circuits, given their potential for isolator free operation on chip due to the enhanced stability to optical feedback [35,36,37]. Novel neuromorphic information processing may be possible using dual state QD lasers, as described recently in [38]. The stability map is an indispensable tool for analysing such applications, revealing the regions and parameter ranges over which dynamics are obtained. In fact, many of the dynamic regions obtained in this system are neuromorphic. The excitable dynamic reported in [24] persists at low injection strength and is of clear relevance while the neuromorphic potential of the optothermal bursting has previously been highlighted in [15].

Supplementary Materials

The following are available online at https://www.mdpi.com/article/10.3390/photonics9020101/s1, supplemental gif.

Author Contributions

Conceptualization, M.D., B.L., E.A.V. and B.K.; methodology, M.D., B.L. and B.K.; software, M.D. and B.L.; validation, M.D., B.L., E.A.V. and B.K.; formal analysis, M.D., B.L. and B.K.; investigation, M.D., B.L. and B.K.; resources, B.L. and B.K.; data curation, M.D. and B.L.; writing—original draft preparation, M.D. and B.K.; writing—review and editing, M.D., B.L., E.A.V. and B.K.; visualization, M.D., B.L., E.A.V. and B.K.; supervision, B.K.; project administration, B.K.; funding acquisition, E.A.V. All authors have read and agreed to the published version of the manuscript.

Funding

E.A.V. acknowledges funding from the Ministry of Science and Higher Education of the Russian Federation (Research Project No. 2019-1442).

Conflicts of Interest

The authors declare no conflict of interest.

References

  1. Wieczorek, S.; Krauskopf, B.; Simpson, T.; Lenstra, D. The dynamical complexity of optically injected semiconductor lasers. Phys. Rep. 2005, 416, 1. [Google Scholar] [CrossRef]
  2. O’Shea, D.; Osborne, S.; Blackbeard, N.; Goulding, D.; Kelleher, B.; Amann, A. Experimental classification of dynamical regimes in optically injected lasers. Opt. Express 2014, 22, 21701. [Google Scholar] [CrossRef] [PubMed]
  3. Kelleher, B.; Goulding, D.; Hegarty, S.; Huyet, G.; Viktorov, E.; Erneux, T. Optically injected single-mode quantum dot lasers. In Quantum Dot Devices; Springer: New York, NY, USA, 2012; pp. 1–22. [Google Scholar]
  4. Chan, S.-C. Analysis of an Optically Injected Semiconductor Laser for Microwave Generation. IEEE J. Quantum Electron. 2010, 46, 421. [Google Scholar] [CrossRef] [Green Version]
  5. Hurtado, A.; Mee, J.; Nami, M.; Henning, I.D.; Adams, M.J.; Lester, L.F. Tunable microwave signal generator with an optically-injected 1310 nm QD-DFB laser. Opt. Express 2013, 21, 10772. [Google Scholar] [CrossRef]
  6. Li, X.-Z.; Chan, S.-C. Random bit generation using an optically injected semiconductor laser in chaos with oversampling. Opt. Lett. 2012, 37, 2163. [Google Scholar] [CrossRef] [Green Version]
  7. Prucnal, P.R.; Shastri, B.J.; de Lima, T.F.; Nahmias, M.A.; Tait, A.N. Recent progress in semiconductor excitable lasers for photonic spike processing. Adv. Opt. Photonics 2016, 8, 228. [Google Scholar] [CrossRef]
  8. Gavrielides, A.; Kovanis, V.; Erneux, T. Analytical stability boundaries for a semiconductor laser subject to optical injection. Opt. Commun. 1997, 136, 253. [Google Scholar] [CrossRef]
  9. Erneux, T.; Viktorov, E.; Kelleher, B.; Goulding, D.; Hegarty, S.; Huyet, G. Optically injected quantum-dot lasers. Opt. Lett. 2010, 35, 937. [Google Scholar] [CrossRef] [Green Version]
  10. Mayol, C.; Toral, R.; Mirasso, C.R.; Natiello, M.A. Class-a lasers with injected signal: Bifurcation set and Lyapunov–potential function. Phys. Rev. A 2002, 66, 013808. [Google Scholar] [CrossRef] [Green Version]
  11. Chlouverakis, K.E.; Adams, M.J. Stability maps of injection-locked laser diodes using the largest Lyapunov exponent. Opt. Commun. 2003, 216, 405. [Google Scholar] [CrossRef]
  12. Bonatto, C.; Garreau, J.C.; Gallas, J.A.C. Self-similarities in the frequency-amplitude space of a loss-modulated CO2 laser. Phys. Rev. Lett. 2005, 95, 143905. [Google Scholar] [CrossRef] [PubMed] [Green Version]
  13. Kelleher, B.; Bonatto, C.; Huyet, G.; Hegarty, S. Excitability in optically injected semiconductor lasers: Contrasting quantum-well-and quantum-dot-based devices. Phys. Rev. E 2011, 83, 026207. [Google Scholar] [CrossRef] [PubMed]
  14. Dillane, M.; Tykalewicz, B.; Goulding, D.; Garbin, B.; Barland, S.; Kelleher, B. Square wave excitability in quantum dot lasers under optical injection. Opt. Lett. 2019, 44, 347. [Google Scholar] [CrossRef] [Green Version]
  15. Kelleher, B.; Tykalewicz, B.; Goulding, D.; Fedorov, N.; Dubinkin, I.; Erneux, T.; Viktorov, E.A. Two-color bursting oscillations. Sci. Rep. 2017, 7, 8414. [Google Scholar] [CrossRef] [Green Version]
  16. Dillane, M.; Robertson, J.; Peters, M.; Hurtado, A.; Kelleher, B. Neuromorphic dynamics with optically injected quantum dot lasers. Eur. Phys. J. B 2019, 92, 1. [Google Scholar] [CrossRef]
  17. Lingnau, B.; Lüdge, K.; Chow, W.W.; Schöll, E. Failure of the α factor in describing dynamical instabilities and chaos in quantum-dot lasers. Phys. Rev. E 2012, 86, 065201. [Google Scholar] [CrossRef] [PubMed] [Green Version]
  18. Lingnau, B.; Dillane, M.; O’Callaghan, J.; Corbett, B.; Kelleher, B. Multimode dynamics and modeling of free-running and optically injected fabry-pérot quantum-dot lasers. Phys. Rev. A 2019, 100, 063837. [Google Scholar] [CrossRef]
  19. Markus, A.; Chen, J.X.; Paranthoën, C.; Fiore, A.; Platz, C.; Gauthier-Lafaye, O. Simultaneous two-state lasing in quantum-dot lasers. Appl. Phys. Lett. 2003, 82, 1818–1820. [Google Scholar] [CrossRef]
  20. Bimberg, D.; Kirstaedter, N.; Ledentsov, N.; Alferov, Z.I.; Kop’Ev, P.; Ustinov, V. Ingaas-gaas quantum-dot lasers. IEEE J. Sel. Top. Quantum Electron. 1997, 3, 196. [Google Scholar] [CrossRef]
  21. Tykalewicz, B.; Goulding, D.; Hegarty, S.P.; Huyet, G.; Dubinkin, I.; Fedorov, N.; Erneux, T.; Viktorov, E.A.; Kelleher, B. Optically induced hysteresis in a two-state quantum dot laser. Opt. Lett. 2016, 41, 1034. [Google Scholar] [CrossRef]
  22. Tykalewicz, B.; Goulding, D.; Hegarty, S.P.; Huyet, G.; Byrne, D.; Phelan, R.; Kelleher, B. All-optical switching with a dual-state, single-section quantum dot laser via optical injection. Opt. Lett. 2014, 39, 4607. [Google Scholar] [CrossRef]
  23. Viktorov, E.A.; Dubinkin, I.; Fedorov, N.; Erneux, T.; Tykalewicz, B.; Hegarty, S.P.; Huyet, G.; Goulding, D.; Kelleher, B. Injection-induced, tunable all-optical gating in a two-state quantum dot laser. Opt. Lett. 2016, 41, 3555. [Google Scholar] [CrossRef] [Green Version]
  24. Dillane, M.; Dubinkin, I.; Fedorov, N.; Erneux, T.; Goulding, D.; Kelleher, B.; Viktorov, E.A. Excitable interplay between lasing quantum dot states. Phys. Rev. E 2019, 100, 012202. [Google Scholar] [CrossRef] [PubMed]
  25. Simpson, T.B.; Liu, J.M.; Huang, K.F.; Tai, K. Nonlinear dynamics induced by external optical injection in semiconductor lasers. Quantum Semiclass. Opt. 1997, 9, 765. [Google Scholar] [CrossRef]
  26. Desroches, M.; Guckenheimer, J.; Krauskopf, B.; Kuehn, C.; Osinga, H.M.; Wechselberger, M. Mixed-mode oscillations with multiple time scales. SIAM Rev. 2012, 54, 211. [Google Scholar] [CrossRef]
  27. Desroches, M.; Kaper, T.J.; Krupa, M. Mixed-mode bursting oscillations: Dynamics created by a slow passage through spike-adding canard explosion in a square-wave burster. Chaos 2013, 23, 046106. [Google Scholar] [CrossRef] [PubMed] [Green Version]
  28. Rzhanov, Y.A.; Richardson, H.; Hagberg, A.A.; Moloney, J.V. Spatiotemporal oscillations in a semiconductor étalon. Phys. Rev. A 1993, 47, 1480. [Google Scholar] [CrossRef]
  29. Abraham, E. Modelling of regenerative pulsations in an InSb etalon. Opt. Commun. 1987, 61, 282. [Google Scholar] [CrossRef]
  30. Bera, D.; Qian, L.; Tseng, T.-K.; Holloway, P.H. Quantum dots and their multimodal applications: A review. Materials 2010, 3, 2260. [Google Scholar] [CrossRef] [Green Version]
  31. Ziegler, M.; Tomm, J.W.; Elsaesser, T.; Erbert, G.; Bugge, F.; Nakwaski, W.; Sarzała, R.P. Visualization of heat flows in high-power diode lasers by lock-in thermography. Appl. Phys. Lett. 2008, 92, 103513. [Google Scholar] [CrossRef]
  32. Meinecke, S.; Lingnau, B.; Röhm, A.; Lüdge, K. Stability of Optically Injected Two-State Quantum-Dot Lasers. Ann. Phys. 2017, 529, 1600279. [Google Scholar] [CrossRef]
  33. Meinecke, S.; Lingnau, B.; Lüdge, K. Increasing stability by two-state lasing in quantum-dot lasers with optical injection. In Physics and Simulation of Optoelectronic Devices XXV. San Francisco, California, United States; Witzigmann, B., Osiński, M., Arakawa, Y., Eds.; International Society for Optics and Photonics (SPIE): Bellingham, WA, USA, 2017; Volume 10098, pp. 67–77. [Google Scholar]
  34. Pausch, J.; Otto, C.; Tylaite, E.; Majer, N.; Schöll, E.; Lüdge, K. Optically injected quantum dot lasers: Impact of nonlinear carrier lifetimes on frequency-locking dynamics. New J. Phys. 2012, 14, 053018. [Google Scholar] [CrossRef]
  35. O’Brien, D.; Hegarty, S.; Huyet, G.; McInerney, J.; Kettler, T.; Laemmlin, M.; Bimberg, D.; Ustinov, V.; Zhukov, A.; Mikhrin, S.; et al. Feedback sensitivity of 1.3/spl mu/m inas/gaas quantum dot lasers. Electron. Lett. 2003, 39, 1819. [Google Scholar] [CrossRef]
  36. O’Brien, D.; Hegarty, S.; Huyet, G.; Uskov, A. Sensitivity of quantum-dot semiconductor lasers to optical feedback. Opt. Lett. 2004, 29, 1072. [Google Scholar] [CrossRef] [PubMed]
  37. Duan, J.; Huang, H.; Dong, B.; Norman, J.C.; Zhang, Z.; Bowers, J.E.; Grillot, F. Dynamic and nonlinear properties of epitaxial quantum dot lasers on silicon for isolator-free integration. Photonics Res. 2019, 7, 1222. [Google Scholar] [CrossRef]
  38. Kelleher, B.; Dillane, M.; Viktorov, E.A. Optical information processing using dual state quantum dot lasers: Complexity through simplicity. Lightw. Sci. Appl. 2021, 10, 238. [Google Scholar] [CrossRef] [PubMed]
Figure 1. Schematic experimental setup. SL is the secondary (QD) laser. PL is the tunable primary laser. Light from the PL is is sent to a circulator and is then injected into the SL. A polarisation controller (PC) is used to maximise coupling. Light from the SL is sent to the circulator and then to a filter where the ES and GS light are separated. The ES light is sent directly to a 12 GHz detector and the GS light goes to a 90/10 splitter. The 10% is sent to a power meter (PM) for alignment control, and the 90% goes to another 12 GHz detector. Both detectors are connected to a high speed real-time oscilloscope. Red lines are GS light; blue lines are ES light; purple lines contain both GS and ES light; and black lines are high speed electrical cables.
Photonics 09 00101 g001
Figure 2. Experimental stability maps. The top panels show results when the injection strength, K, is swept from low to high. The bottom panels show the results when injection strength is swept from high to low. (a,d) show the average GS intensity. (b,e) show the average ES intensity. The ES variance is shown in (c,f). The average ES and GS intensities are calculated for 20 μ s long measurements. The phase locked region is identified as the bright yellow/cyan area in (a,d), where the GS has high output intensity. This corresponds to a quenched ES, shown as dark blue in (b,e). In (c,f) green denotes oscillatory behaviour and dark blue corresponds to constant output. The speckled area on the positively detuned boundary of (a,c) is related to very slow oscillations. A more detailed map of this boundary is shown later.
Photonics 09 00101 g002
Figure 3. The upper panels, (ae) show representative intensity traces for the different dynamical regimes observed during an upsweep where the detuning remains fixed at −6.9 GHz. The injection strength is given above each subfigure. The lower panels (fj) show zooms of the corresponding upper panels. The colour of the font indicating the injection strength corresponds to the colour of dots in Figure 4 which in turn mark the locations on the map where the intensity traces were recorded.
Photonics 09 00101 g003
Figure 4. The same experimental stability maps of average GS and ES intensities, and ES variance, previously shown in Figure 2 but shown again here with markings added for direct comparison with the time traces in Figure 3. The injection strength is swept up in (ac) and down in (df). The coloured dots correspond to the timetraces in Figure 3. For a more obvious identification of hysteresis the boundary of oscillating dynamics observed in the downsweep is plotted on top of the upsweep data as a red line. Similarly the boundary of oscillating dynamics seen in the upsweep is plotted as a white line on the down sweep map. Hysteresis is particularly evident in (f) where the region of oscillating dynamics extends beyond the white line, which marks the boundary observed (c).
Photonics 09 00101 g004
Figure 5. Timetraces from an upsweep in the region of hysteresis at −8.2 GHz detuning. The sweep was performed from panel (a) to panel (l). The injection strength is indicated in each subfigure. The corresponding downsweep timetraces are shown in Figure 6.
Photonics 09 00101 g005
Figure 6. Timetraces from a downsweep in the region of hysteresis at −8.2 GHz detuning. The sweep was performed from panel (l) to panel (a). Hysteresis is clear when comparing the subfigures (bh) here with the corresponding subfigures in Figure 5.
Photonics 09 00101 g006
Figure 7. Experimental maps of the positively detuned side of the unlocking boundary. The top row shows an upsweep and the bottom shows a downsweep. The timetraces used to build this map were 1 second long. Three regions are visible in (a,b) and in (d,e). In (a,d) the large yellow region with high GS intensity is a phase locked region. The blue region is the regenerated light region. The narrow green region in between the yellow and blue regions is where there are slow oscillations between the high and low GS intensity solutions, and thus the average intensity lies somewhere in the middle. (b,e) show a completely quenched ES—dark blue—when the laser is phase locked. The region of slow oscillations is represented by the slightly lighter shade of dark blue. For positive detuning values, dual state emission is clear. The variance shows the region where slow oscillations occur more clearly (c,f). There is a small hysteresis cycle of one to two pixels at both sides. The white lines in the region of slow oscillations in (ac) correspond to the timetraces shown in Figure 8.
Photonics 09 00101 g007
Figure 8. Slow oscillations observed during an upsweep at −0.6 GHz, near the positively detuned side of the unlocking boundary. The sweep is marked by a white line in Figure 7. Comparing (a) and (l), there are two very different GS amplitudes at either side of the region of oscillations. The slow oscillations shown in panels (bk) are between these two intensities, suggesting there is an underlying broken bistability. As K is increased the duty cycle moves from longer lived lower sections as most clearly seen in (b), through 50:50 in (f,g), and on to longer lived upper sections as most clearly seen in (k).
Photonics 09 00101 g008
Figure 9. Stability maps in the absence of any optothermal effects. (ac) show the results for the upsweep. (df) show the corresponding downsweep. Bistabilty 1, the bistability between two phase-locked states, can be seen by comparing the top left corners of (a,d) at high injection strengths. It can also be seen clearly by comparing the top left corners of (b,e) at high injection strengths. Bistability 2, the bistability between a phase locked solution and the dual state output at moderate injection strengths, is clear when looking at the top left corners of the variance plots (c,f). Bistability 3, the low injection strength bistability between a constant (dual state) output and an oscillating (dual state) output, is visible at the bottom of the oscillating regime seen in (c,f). It is even clearer in the supplemental gif.
Photonics 09 00101 g009
Figure 10. Simulated stability maps with one optothermal effect. The top panels show the results from an upsweep and the lower panels show the corresponding downsweep. (a,d) show the average GS intensity and (b,e) show the average ES intensity. (c,f) show the variance in the ES intensity. The region of high variance seen in (c,f) is much larger than in Figure 9 as the large phase locked bistability is broken and is replaced with a square wave regime. γ 1 = 40 μ s 1 , c 1 = 3 ns 1 .
Photonics 09 00101 g010
Figure 11. 1D bifurcation diagrams showing the bistabilities. The many diagonal lines are brought about by the bursting phenonema, where the amplitude is growing even though the input parameter for detuning remains fixed. (a) only one optothermal effect is included. A bistability is created on the positive unlocking boundary. At the negative unlocking boundary, there is a large cycle between the remnants of a bistability, with some of the bistability remaining intact. (b) both optothermal effects are included. The bistability at the positive boundary has been replaced with a limit cycle. In both cases K = 4.5 .
Photonics 09 00101 g011
Figure 12. Simulated maps with two optothermal effects. (a,d) show the average GS intensity and (b,e) show the average ES intensity. (c,f) show the variance in the ES intensity. (ac) show the results for the upsweep. (df) show the corresponding downsweep. γ 1 = 40 μ s 1 , c 1 = 4.5 ns 1 , γ 2 = 4 μ s 1 , and c 2 = 0.7 ns 1 .
Photonics 09 00101 g012
Figure 13. Simulated maps showing the number of maxima in log scale when no optothermal effect is included (a,d), when the non-radiative optothermal effect is included (b,e), and when both the non-radiative and light reabsorption optothermal effects are included (c,f). The top panels show the results from the upsweep and the lower panels show the corresponding downsweep. Chaos is not present in any case.
Photonics 09 00101 g013
Table 1. Parameter values.
SymbolValueMeaning
J 25 ns 1 Normalised pump current
α GS 2Phase-amplitude coupling from the GS
α ES 0.5 Phase-amplitude coupling from the ES
g 80 ns 1 Optical gain coefficient
κ 76 ns 1 Optical loss coefficient
β 10 5 Spontaneous emission factor
τ 1 ns Charge-carrier recombination time
S cap 0.2 ps 1 QD capture rate
S rel 1 ps 1 QD relaxation rate
ε ES 50 meV Confinement energy of the ES
ε GSES 40 meV Energy separation between GS and ES
D 2 D 10.9 Normalised 2D density of states
T 300 K Temperature
γ 1 40 μ s 1 Characteristic time scale of non-radiative thermal effects
γ 2 4 μ s 1 Characteristic time scale of reabsorption thermal effects
Publisher’s Note: MDPI stays neutral with regard to jurisdictional claims in published maps and institutional affiliations.