Review

Vital Signs Monitoring Based on Interferometric Fiber Optic Sensors

1
Shenzhen Research Institute, The Hong Kong Polytechnic University, Shenzhen 518000, China
2
Photonics Research Center, Department of Electronic and Information Engineering, The Hong Kong Polytechnic University, Hong Kong, China
*
Author to whom correspondence should be addressed.
Photonics 2022, 9(2), 50; https://doi.org/10.3390/photonics9020050
Submission received: 15 October 2021 / Revised: 20 December 2021 / Accepted: 22 December 2021 / Published: 18 January 2022
(This article belongs to the Special Issue Biomedical Optics and Its Applications)

Abstract

:
Due to the improvement of living standards, people’s attention to health has gradually increased. More and more people are willing to spend money and time on health management. This article reviews work on the vital signs monitoring system based on fiber optic interferometers, including the design of sensor structures, signal demodulation methods and data analysis. After a large number of trials, the system can achieve long-term stable heart rate (HR), respiration rate (RR) and body temperature monitoring, and the collected data can be used for health analysis. Due to the high sensitivity, low cost, and light weight of the interferometric fiber optic sensor, it can be integrated under a mattress or a cushion, which is very suitable for daily use. The system has great application prospects in the field of healthcare.

1. Introduction

In recent decades, with economic development and social progress, people’s health awareness has gradually increased, and more and more attention has been paid to medical care. Daily health tracking can enable people to understand their physical condition. Heartbeat, respiration, body temperature, blood pressure (BP), blood oxygen, etc. are all important health indicators of the human body. Among the various vital sign parameters, heartbeat and respiration are particularly important; they are closely related to a variety of senile diseases, such as chronic obstructive pulmonary disease and congestive heart failure [1]. In areas where the population is seriously aging and medical resources are scarce, monitoring equipment for vital signs is particularly necessary. Many schemes for measuring vital signs signals have been developed in recent decades. In the current medical system, an electrocardiogram (ECG) is the most widely used heart health monitoring method [2]. Through multiple electrodes attached to the body, it can record the electrical activity signals of the heart. For respiratory monitoring, spirometer, capnometry and impedance pneumography are the most used methods [3]. However, a spirometer can interfere with natural breathing, making continuous RR monitoring difficult. The capnometry method can also cause discomfort due to the contact required. Impedance pneumography requires special equipment for analysis. Therefore, these heartbeat and breathing monitoring devices are not suitable for daily household use. Ballistocardiography (BCG) is another cardiac measurement technique, which reflects the mechanical information of the heart, and there is no need to stick any patches on the body during measurement. It is hopeful that it can be used as a substitute for an ECG in the consumer field. In addition, respiration can also be extracted from the BCG signal detected while in the sitting or lying position. Using the difference in the frequency of heartbeat and respiration, it is possible to monitor both HR and RR through one monitoring system.
In the past decade, many non-wearable vital signs monitoring programs have emerged. For example, G. Vinci et al. proposed a vital signs monitoring program based on the six-port interferometer radar principle, which can detect the subject’s respiration and heartbeat from the reflected original radar signal [4]. D. Shao et al. used a single camera to track the movement of facial features to obtain BCG [5]. This method can also obtain photoplethysmography (PPG) based on the reflected light from the same facial area. Hassan et al. obtained the BCG signal by measuring the head movement caused by the heart blood ejection and estimated the heartbeat by calculating the movement of multiple feature points [6]. However, these methods also have some limitations. Radar-based systems are easily affected by electromagnetic interference (EMI). Camera-based systems are susceptible to motion artifacts and may introduce privacy issues.
Fiber optic sensors (FOS) can avoid the problems of the above-mentioned sensors, and have high sensitivity; therefore, they are attracting a lot of attention [7]. Researchers have proposed many different options for monitoring vital signs. Z. Chen et al. proposed and demonstrated the feasibility of using a microbend multimode fiber optic sensor for the simultaneous measurement of HR and RR [8]. A.G. Leal-Juniora et al. developed a sensor based on polymer optical fiber, which is embedded in the user’s clothes as a smart textile solution that can be used to measure breathing rate and HR at the same time [9]. Their intensity-based sensors can measure HR and breathing rate, but they are not as sensitive as wavelength-based sensors. Ł. Dziuda et al. used an optical strain sensor based on fiber Bragg grating, monitoring the respiration and cardiac activity of a patient during magnetic resonance imaging (MRI) [10]. S. Koyama et al. proposed a sensor based on plastic FBG to measure vital signs such as pulse rate and BP [11]. Under the same applied pressure, the plastic FBG sensor deforms more than the silica glass FBG sensor, and the Bragg wavelength shift length becomes longer, which results in higher detection sensitivity. However, the cost of FBG-based sensors is too high and not suitable for widespread use. Due to the high cost of the FBG sensors and the limited sensitivity of the intensity-based sensors, researchers chose the interferometric FOS for vital signs monitoring. Researchers have dedicated much time and effort to the design of sensor structures [12,13,14,15,16,17,18,19,20,21,22,23], demodulation methods [12,24,25,26,27,28,29,30,31,32,33,34,35,36] and the application of vital signs monitoring [12,13,14,16,18,19,20,21,22,23,35,36,37,38,39,40,41,42,43,44,45].

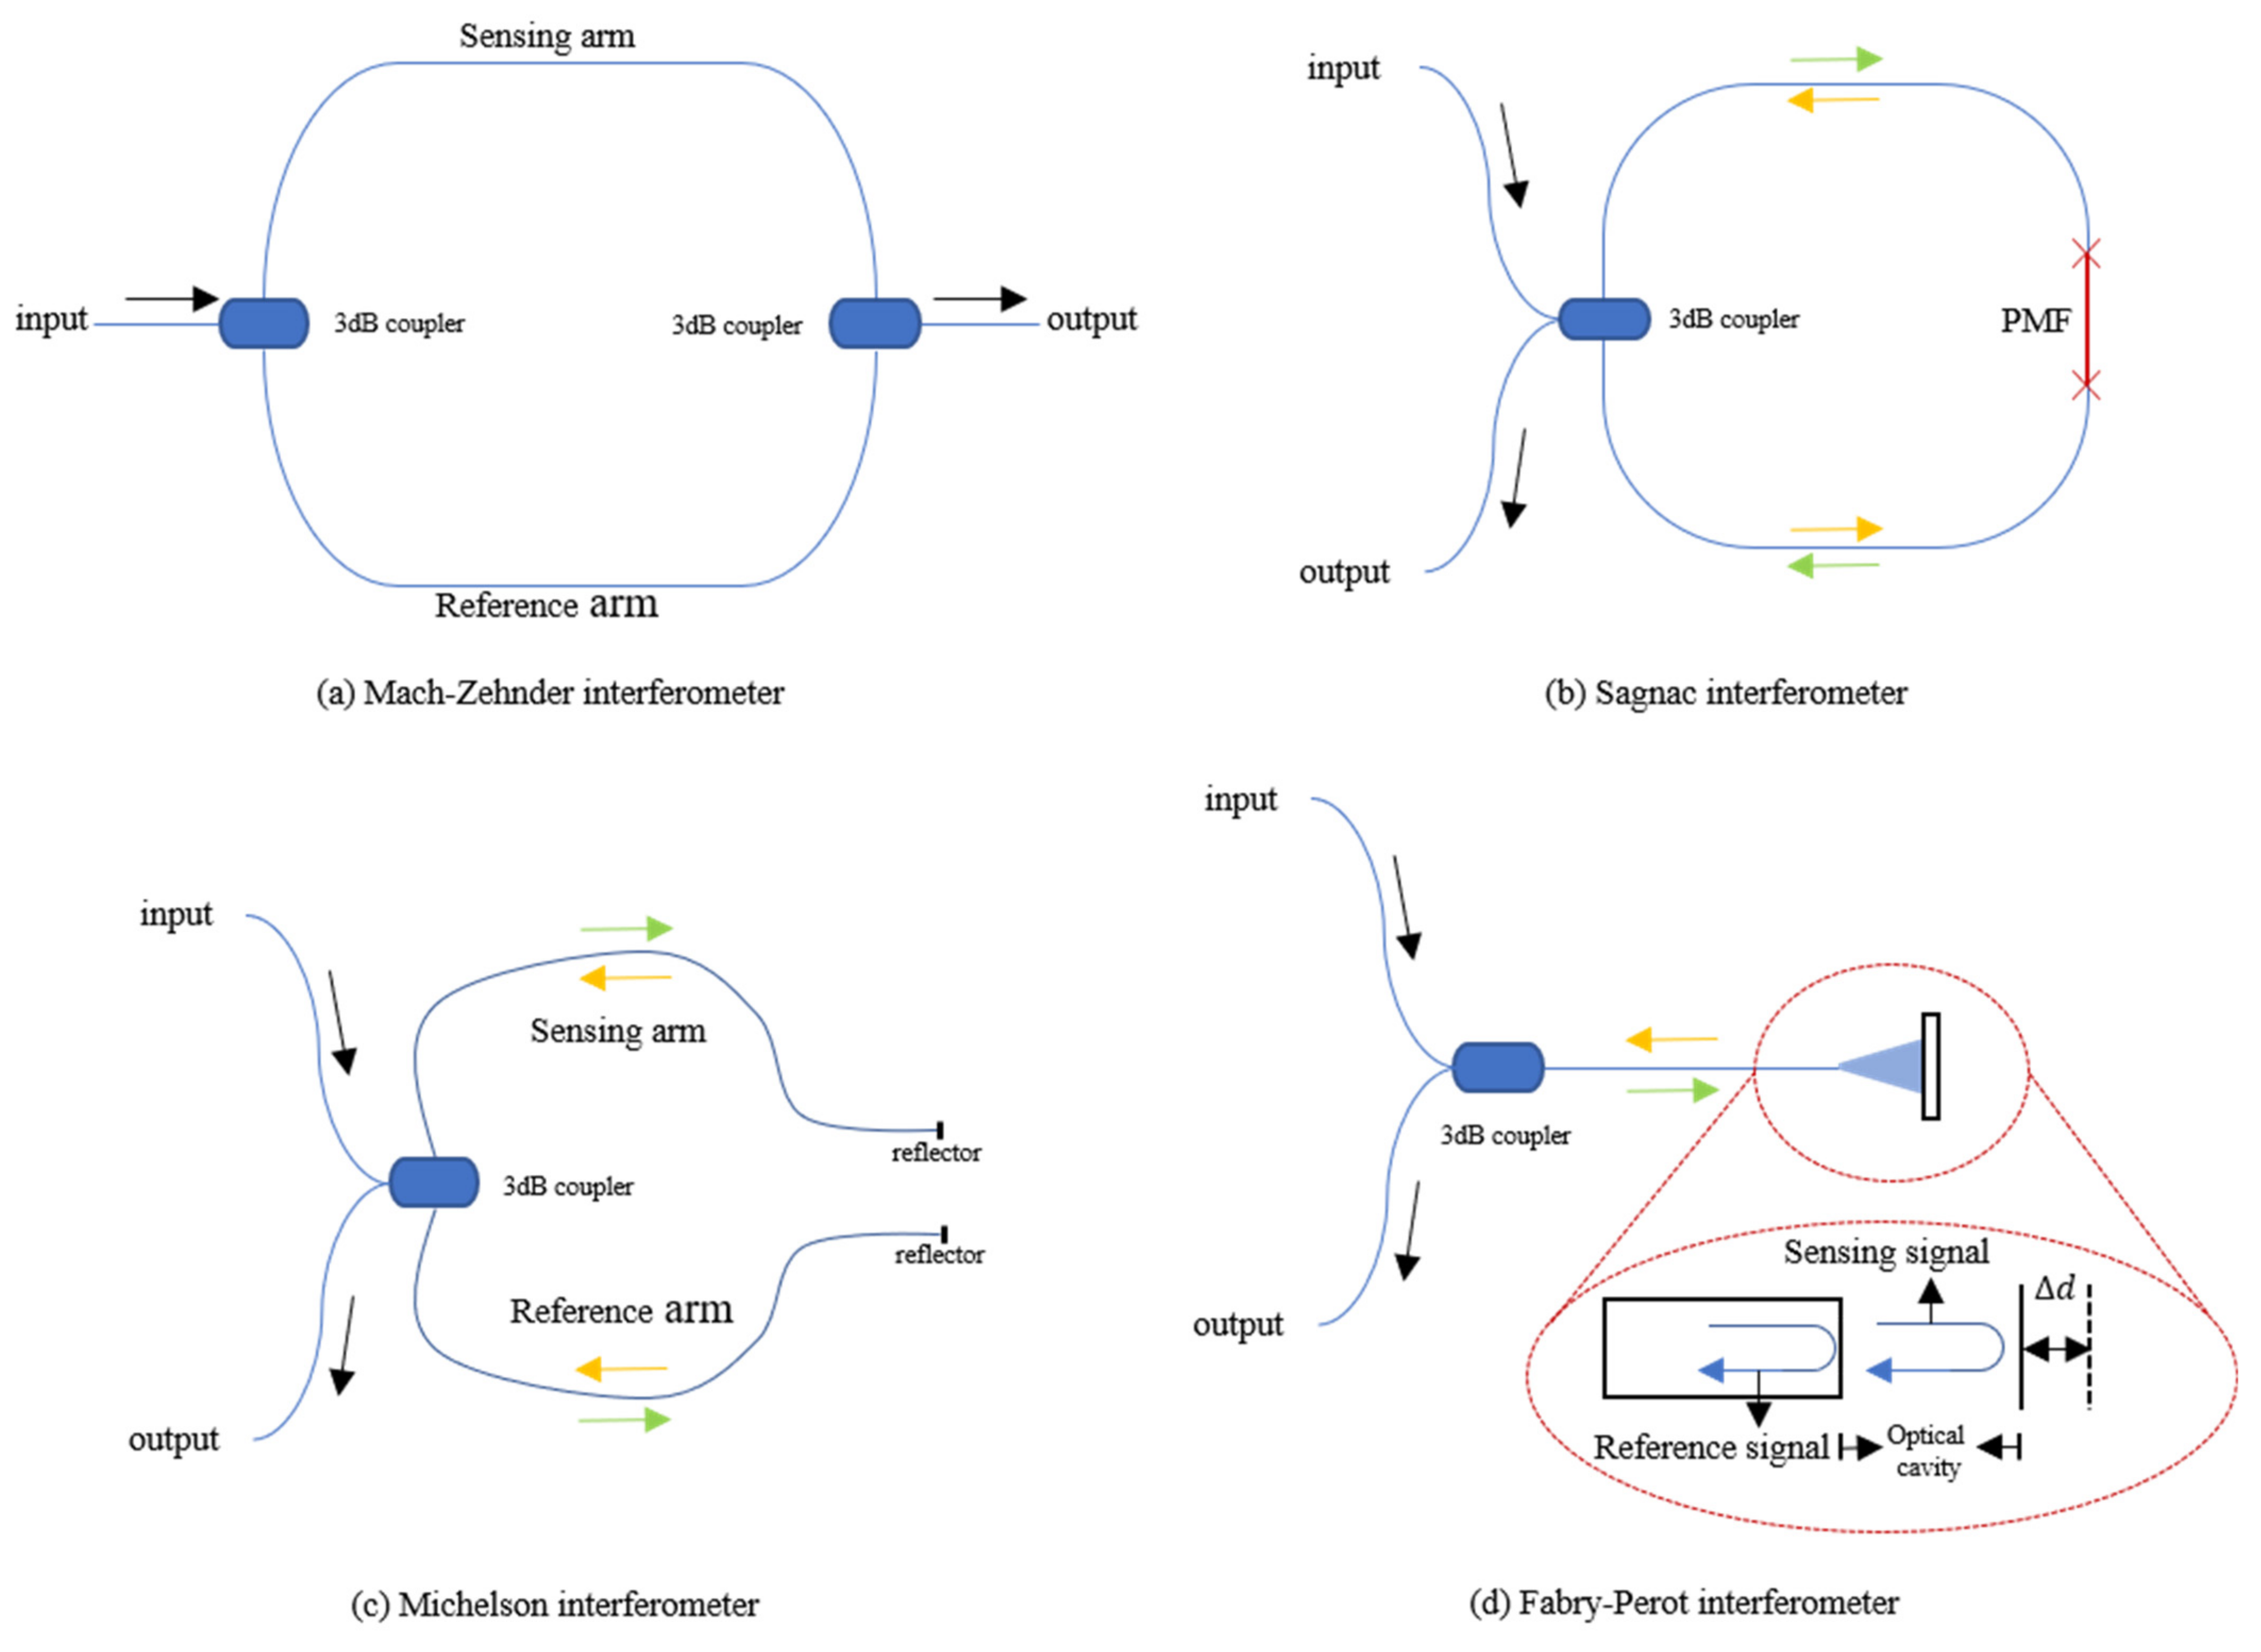
2. Structures and Principles of Interferometric FOS

The work of the interferometer used for vital signs monitoring is caused by the interference of two light beams, which propagate through one or more optical fibers by different optical paths. Beam splitting and beam combining are often realized by couplers. There are four types of interferometers, which are Fabry–Pérot, Mach–Zehnder, Michelson and Sagnac interferometers. The following will describe their main characteristics and differences in their applications as optical fiber sensors.

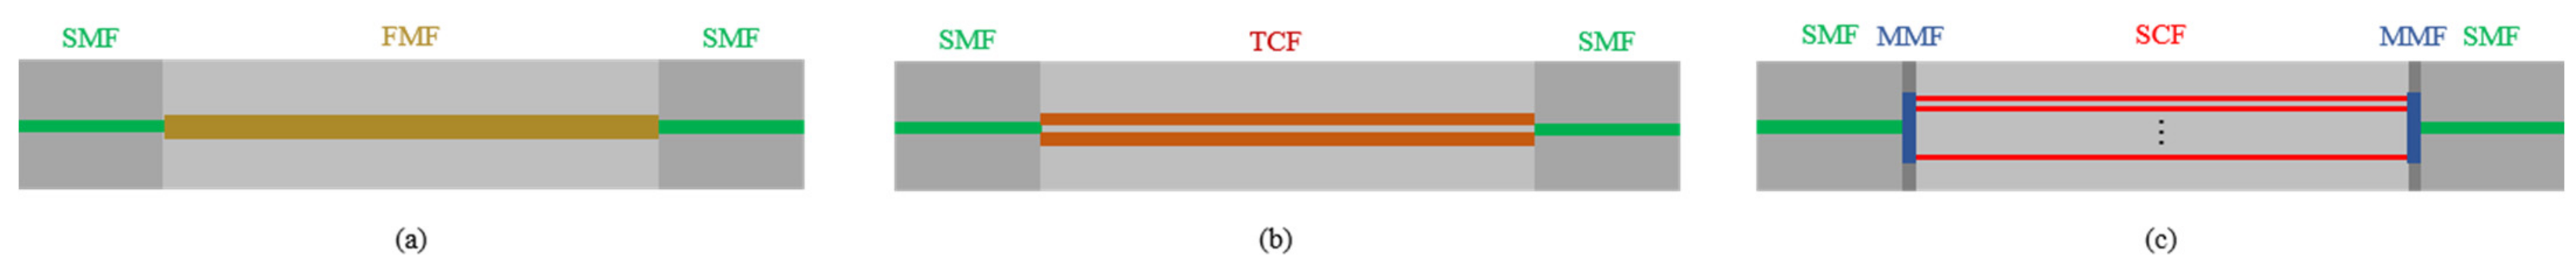
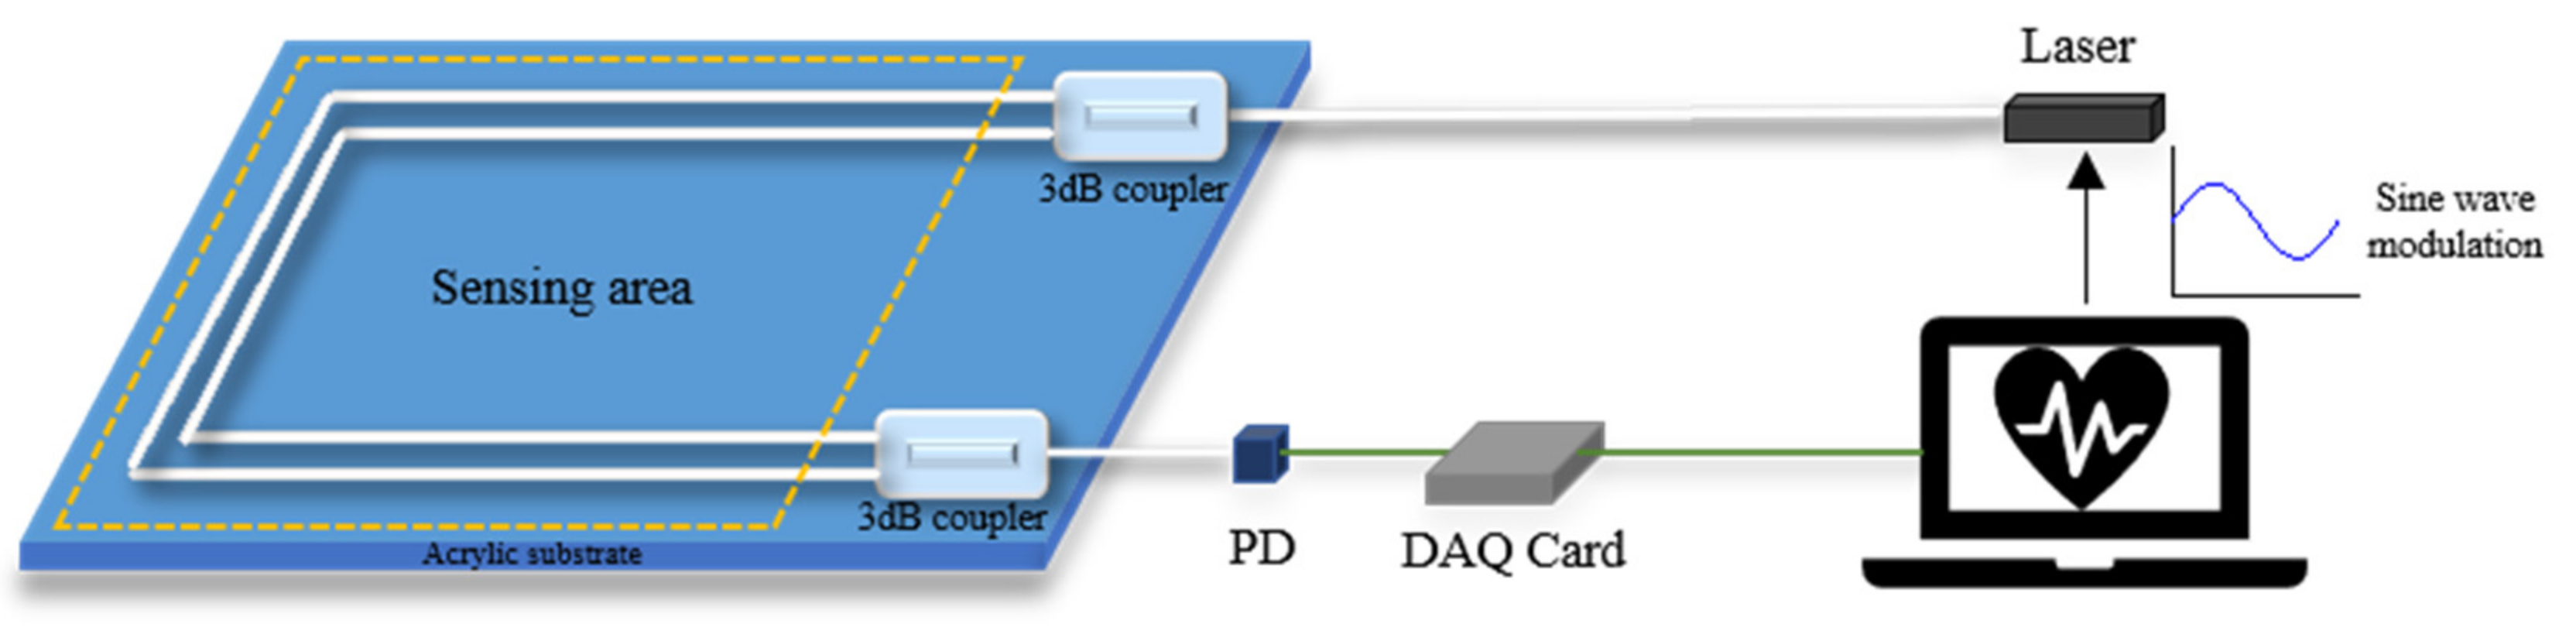
2.1. Optical Fiber Mach–Zehnder Interferometer

The Mach–Zehnder interferometer (MZI) is mainly composed of two 3 dB couplers and several sections of single-mode fiber (SMF). The sensor structure is shown in Figure 1a. When the sensing system is working, the laser injected from one end is divided into two beams of equal intensity through the first coupler, entering the reference arm and the sensing arm, respectively, and then recombining through the second coupler. Since the difference in the length of the two arms is introduced in the manufacturing process of the sensor, there is a phase difference when the two beams of light meet at the second coupler. For sensing, the reference arm is kept isolated from any external changes as much as possible while the sensing arm feels the influence of external changes. External factors (temperature, pressure, etc.) can directly cause changes in the length and refractive index of the optical fiber sensing arm of the MZI. In the end, the change of the interference signal comes from the optical path difference, and the photodetector (PD) can be used to detect these changes.
As mentioned above, the arm length difference was introduced when the sensor was manufactured. W. Lyu et al. have conducted a lot of research on FOS for vital signs detection based on MZI [12,13,14]. After experimental testing, when the Δ L of FOS based on MZI is 5 mm, its free spectral range can achieve satisfactory results in actual use. The length of the sensing arm and reference arm can range from 60/60.5 cm to 200/200.5 cm to obtain a good BCG signal, depending on the size and purpose of the sensor.
In addition to the traditional MZI, F. Tan et al. proposed in-line interferometers based on few-mode fiber (FMF) and multi-core fiber (MCF) for vital signs monitoring [15]. The structure of the FMF interferometer is to use two sections of SMF spliced at both ends of the FMF, as shown in Figure 2a. The offset between SMF and FMF is used for mode excitation to form mode interference. The researchers have conducted research on both two-mode fiber and four-mode fiber, and compared the spectra under different offset distances. Considering the extinction ratio and the insertion loss with offset distance, the size of the in-line interferometer is optimized. SMF will be spliced on both ends with the best offset distance. Both FMF-based sensors can simultaneously achieve HR and RR monitoring with acceptable accuracy. C. Ke et al. applied this structure for the same purpose [16]. They used the multimode between two single-mode fibers and obtained satisfactory results. R. Wang et al. used an FMF-based interferometer to focus on the analysis of respiration, such as RR, tidal volume (TV) and minute ventilation (MV) [37].
For the MCF interferometer, F. Tan et al. employed twin-core fiber (TCF) [46], and W. Chen et al. adopted seven-core fiber (SCF) [38]. The structures are shown in Figure 2b,c, respectively. Based on the coupling mode theory, power exchange occurs between the cores in the MCF. This kind of crosstalk between cores can be explained by supermodel theory. Due to the difference in propagation constants, the coupling characteristics between supermodes can be used to develop FOS with excellent performance. In the SCF, a section of multimode fiber (MMF) is spliced between the SMF and SCF at the incident end to expand the light field and excite all the cores in the SCF. A section of the same MMF is spliced at the output end to collect light from the SCF into the SMF and obtain the mode interference spectrum. For the two cores of TCF, inter-mode interference will also occur. Sensors based on this principle are very sensitive to small pressure changes in the vertical direction of the two cores. The ideal frequency spectrum for vital signs monitoring was obtained through various experiments. J. Zhang et al. used a TCF-based sensor to measure the human body’s BCG and breathing signals after exercise and analyzed the HR changes during the 3-min recovery process [47]. W. Chen et al. used the SCF to develop a sensor for HR and RR monitoring with a small size and high sensitivity [38]. In their experiment, the HR and RR measurement results between the proposed sensor system and the reference monitor are in good agreement, and the SD is 1.17 beats per minute and 2.16 breaths per minute, respectively.
For TCF, because it can achieve better performance, F. Tan et al. have conducted further research [46]. Since the two cores are very close, they will exchange power, which can be described by supermodel theory. In the sensor production process, a slight offset was introduced between SMF and TCF to obtain a better frequency spectrum. Detailed experiments have been carried out on the offset direction between SMF and TCF and the spectra at different offset distances from 0 to 10 µm. In addition, the length of TCF has also been optimized through experiments. After comparing the output spectra under different offset distances and the length of TCF, the optimal offset distance and the length of TCF are determined and used to monitor vital signs after exercise.

2.2. Optical Fiber Sagnac Interferometer

The structure of the Sagnac interferometer (SI) is shown in Figure 1b. The basic principle is to detect the different phase shifts of the two beams of light transmitted in opposite directions through the interference effect under the action of external factors. The beam enters the coupler through one end of the fiber, and then splits into two beams with the same intensity. The two beams of light move in opposite directions through the fiber and return to the coupler to interfere. This kind of interferometer has high sensitivity to rotation and is mainly used in fiber optic gyroscopes. J. Qu et al. conducted some research on the use of SI-based sensors for vital signs monitoring [17]. Since this situation cannot introduce the rotation of the sensor, the sensor introduces a phase difference through a single-mode polarization-maintaining fiber (PMF) inserted into the Sagnac loop. Due to the special structure of PMF, it has two polarization modes, including vertical and horizontal polarization modes. The phase velocities of these two modes are slightly different, therefore, the light will have a phase difference during transmission. In the interferometer, the incident light of the laser is split into two opposite beams by a 3 dB coupler and propagates in the SI. After passing through the PMF, a phase difference between the two beams is formed, and finally, they interfere when they return to the 3 dB coupler. The interference signal received by a PD at the end includes heartbeat and respiration information. C. Ke et al. applied this structure in their smart mattress to detect vital signs. The small difference is that their SI uses SMF and dispersion-shifted fiber [18]. To achieve better performance, J. Qu et al. have carried out related experiments on the impact of PMF of different lengths on vital signs signals. Insert PMF with lengths of 0.5, 1.5 and 2.5 m into the Sagnac loop, and observe the change in sensor sensitivity.

2.3. Optical Fiber Michelson Interferometer

FOS based on the Michelson interferometer (MI) can also be used to monitor vital signs, and the structure is similar to MZI, as shown in Figure 1c. The 3 dB coupler connects the laser and PD on one side with the sensing and reference arm, and the other side of the two arms is covered with silver. The manufacturing method and working principle of MI are almost the same as MZI because it is almost half of MZI in configuration. The main difference is whether there is a reflector on the arms. As MI adopts reflection mode, it is compact and convenient in experimental use. However, the difference in fiber length between the two arms of the MI must be adjusted within the coherence length of the light source. D. Zazula et al. used Morlet wavelet-based transform to separate BCG and phonocardiographic (PCG) components of the heart activity detected by a MI FOS [19]. S. Šprager et al. realized high-sensitivity and high-precision HR signal detection through the same principle [20].

2.4. Optical Fiber Fabry-Perot Interferometers

The fiber Fabry–Perot Interferometer (FFPI) is also a practical solution for vital signs monitoring, and its structure is shown in Figure 1d. The core component is an optical cavity composed of a pair of parallel reflecting surfaces with a distance of several micrometers to centimeters. After the incident light passes through the 3 dB coupler, it passes through the optical fiber to reach the cavity. Part of the light is reflected back at the end of the fiber cavity as a reference signal, and the rest of the light is reflected after passing through the cavity. The two beams of reflected light pass through the optical fiber and interfere in the coupler. The output interference signal is related to the length of the microcavity.
S. Pullteap et al. have developed a high-sensitivity vital signs monitor based on FFPI to measure two interesting parameters, HR and BP [21]. Compared with medical digital sphygmomanometers, the average error of systolic and diastolic blood pressure and HR measured by the FFPI sensor is less than 2%. P. Samartkit et al. investigated an FFPI-based sensor for the simultaneous measurement of HR and pulse pressure [22]. The output is demodulated by fringe counting, and HR and pulse pressure information are obtained simultaneously through fringe pattern analysis and Kirchhoff–Love’s plate theory, respectively. Y. Li et al. introduced an FFPI based on ethyl alpha-cyanoacrylate (EtCNA) for HR monitoring [23]. The FFPI is fixed in the capillary tube by using an EtCNA binder. Due to the low Young’s modulus of EtCNA, the sensor can detect low-frequency vibration with high sensitivity.

2.5. The Comparison of Different Interferometers for Vital Signs Monitoring

Interferometry in optics is one of the most sensitive detection techniques known. The above four interferometers are sensors that use the phase change of light waves in the optical fiber caused by external factors to detect various parameters. Their comparison is shown in Table 1. Both MZI and MI are dual-beam interferometers with very similar structures. However, since MI needs to be coated on the fiber end face, it is slightly more difficult to manufacture than MZI. The two types of sensors require a sufficient length of optical fiber to make the sensing area large enough; therefore, the size is relatively large. They can be wrapped around the wrist or integrated into a cushion for vital signs monitoring. SI is very sensitive in detecting the rotation perpendicular to the loop plane, which is suitable for making gyroscopes. It has no obvious advantages in vital signs monitoring. The FFPI-based sensor is the most compact, suitable for pulse and body temperature measurement of the arm or wrist.

3. Demodulation Schemes

In the field of vital signs monitoring, all four fiber optic interferometers can be applied. Although the optical fiber interferometer has great advantages in weight and sensitivity; the signal attenuation caused by its structure will also affect the signal quality and cannot be used for long-term stable vital signs measurement. The interferometer should have the highest sensitivity when the optical path difference between the two arms is π/2. When the phase difference is π, the signal change can hardly be detected. In the experiment, even if the optical path difference between the two arms is adjusted to π/2 in advance, the optical path difference between the two arms cannot be maintained at π/2 in the static state due to the slowly random phase drift noise and temperature changes. In order to solve this problem and make the FOS based on interferometer work stably, many demodulation schemes have been proposed [24,25,26,27,28,29,30,31,32,33,34]. However, there are some problems when demodulating vital signs signals based on optical fiber interferometers. Some signal demodulation schemes are too large to be integrated into a compact vital signs monitor, such as phase demodulation based on piezoelectric transducer (PZT). Researchers mainly applied three more practical methods to solve the signal fading problem and achieved the expected results.

3.1. PGC Demodulation Scheme

Phase generated carrier (PGC) technology, as a high dynamic range and good linearity homodyne detection scheme, was experimentally demonstrated in 1982 [26]. B. Liu et al. applied the PGC-DCM demodulation algorithm to demodulate the acoustic signal from a diaphragm-based long cavity Fabry–Perot interferometers sensor [27]. T. Chang et al. proposed a novel phase compensation scheme based on the PGC-arctan algorithm, which overcomes the limitation of the amplitude range from −π/2 for arbitrary signals and established a Michelson interferometer measurement system [28]. It is currently one of the most important passive modulation and demodulation technologies in the field of interferometric optical fiber sensing. There are two modulation methods in the PGC scheme, including internal and external modulation, which generate the carrier signal by modulating the frequency of laser and driving the PZT wrapped with one arm of the interferometer, respectively. As the large size of PZT is difficult to be integrated into a cushion or mattress-type interferometer, the internal modulation is adopted in the experiment. The structure of the vital signs monitor based on the PGC demodulation scheme is shown in Figure 3. Usually, a high-frequency sinusoidal carrier signal (usually 3 to 10 times higher than the desired signal) is added to the phase term of the output signal of the interferometer to reduce the effect of detection sensitivity caused by random phase shift [29]. The light source can use a vertical-cavity surface-emitting laser (VCSEL), and its wavelength can be modulated by the tuning driven voltage to generate a high-frequency carrier signal in the interferometer. The modulated interference signal detected by PD can be given as:
I = A + B   cos C cos ω 0 t + φ t ,
where constant A is the direct current component, constant B is related to the mixing efficiency of the interferometer, C and ω 0 are the amplitude and frequency of modulation signal, φ t is composed of required signal and phase shift.
After obtaining the interference signal I , the measured signal can be recovered from the carrier by two methods of differential cross multiplication (DCM) or arctan (Arctan). After a series of signal processing by MATLAB, both heartbeat and respiration signals can be obtained without the signal fading problem.

3.2. Moving-Coil Phase Compensation Scheme
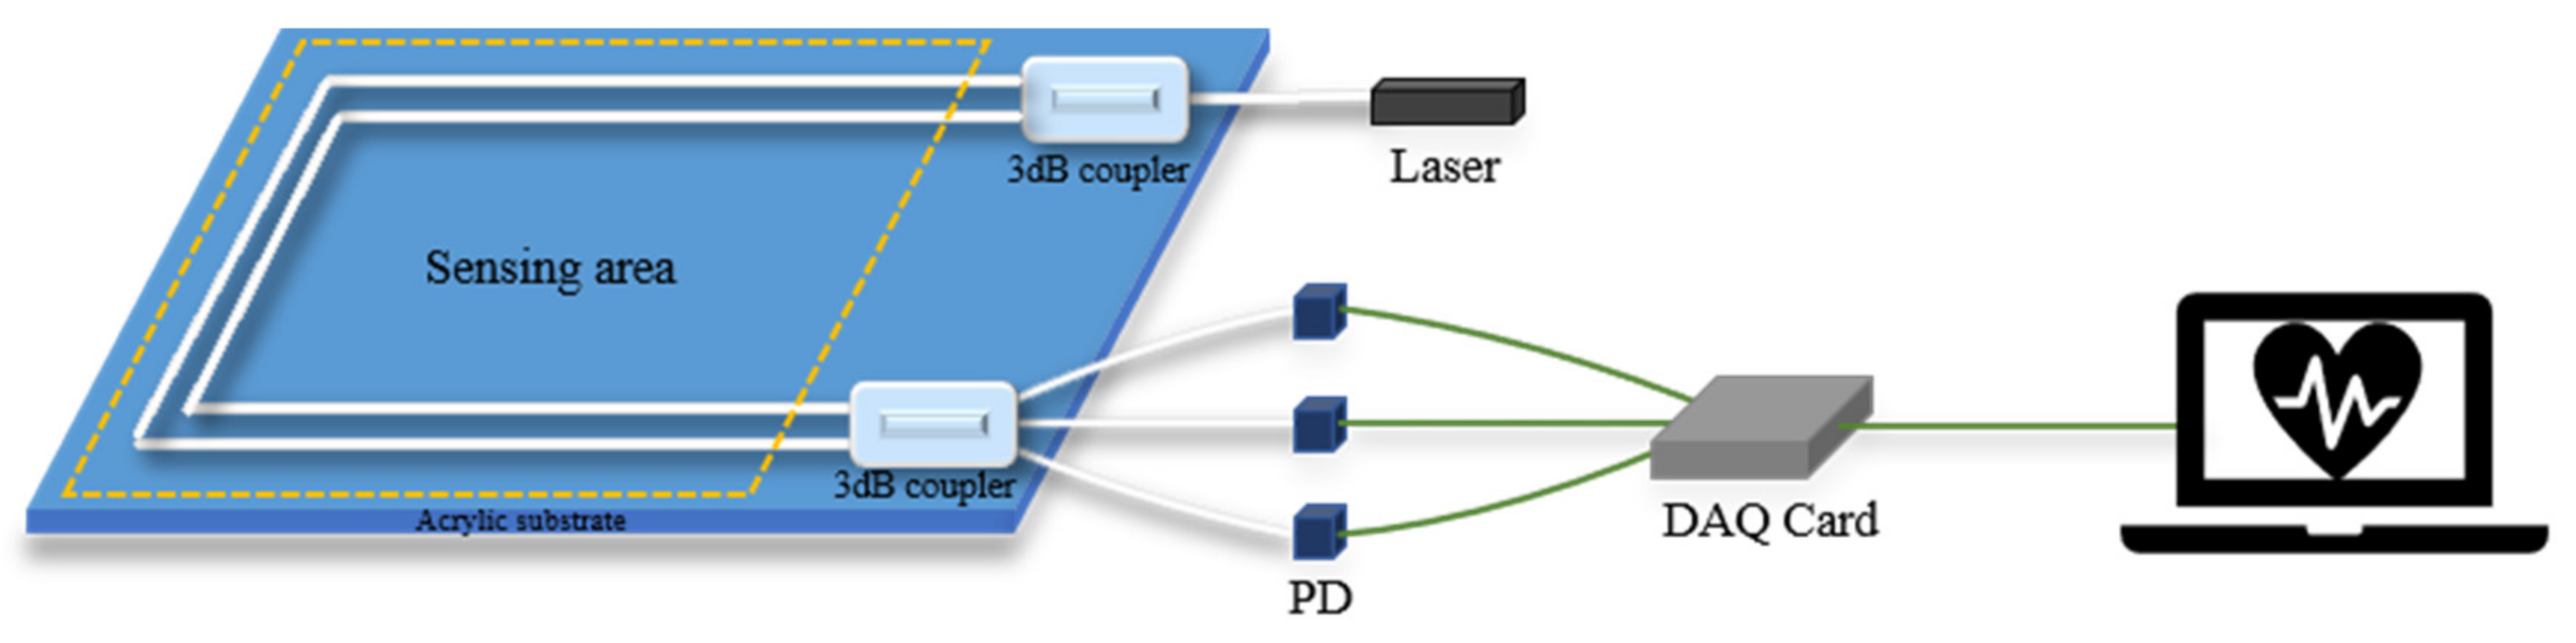
In order to reduce the cost of the vital signs monitoring system, S. Chen et al. have proposed a phase compensation method based on a moving-coil transducer [35]. The system consists of three parts: an optical fiber MZI-based vital signs monitor, a phase shifter and a proportional-integral-derivative controller (PID). The phase shifter can compensate for the phase drift derived from low-frequency ambient noise and keep the output of the interferometer in quadrature.
The phase shifter used in the system is a moving-coil transducer with a small size, and the reference arm of MZI is fixed on the phase shifter. A tiny displacement, which is perpendicular to the fixed optical fiber, is generated by the phase shifter with the variation of driven current, and then the output intensity of MZI will change accordingly with the introduced phase difference.
The structure of the closed-loop control system is shown in Figure 4. The optical fiber MZI can detect the weak vibration signal containing vital signs information from the subject sitting on the sensing area of a cushion. The electrical signal from the PD will be divided into two channels, channel 1 (CH1) and channel 2 (CH2). CH1 is the raw data, and CH2 is obtained by a low-pass filter. The signal from CH2 is fed into the PID controller as the process variable. The PID controller outputs the control variable, U t , to adjust driven current of phase shifter according to the formula [48]:
U t = K P e t + 1 T I e t d t + T D d e t d t ,
where K P , T I and T D represent the coefficients of the proportional, integral and derivative controller set in the PID controller. e t represents the difference between the process variable and set point. The set point is the desired value, which is set as the quadrature point of the MZI. Finally, the phase shifter can compensate for the low-frequency signal drift and output stable heartbeat signals with good performance.

3.3. 3 × 3 Coupler Demodulation Scheme

Considering the ease of use and cost, W. Lyu et al. used a new MZI structure based on a 3 × 3 coupler [12,13]. This scheme was proposed to solve the signal fading problem in 1980 [30]. O.T. Kamenev et al. used this scheme for the fiber optic MZI-based strainmeter [31], and D. Xu et al. used the same scheme to measure the phase and frequency noise of the Michelson interferometer [32]. S. Park et al. have achieved nanometer-scale displacement or vibration measurement using an interferometer based on a 3 × 3 fiber circulator [33,34]. The structure is shown in Figure 5. In this sensor, a 1 × 2 coupler of the traditional MZI is replaced with a 3 × 3 coupler so that it has three outputs with a phase difference of 120°, and the signals are received by three PDs.
The output light intensity of the interferometer is:
I k = D + I 0 cos φ t k 1 2 π / 3 ,
where, φ t = ϕ t + ψ t , D is the average value of output light intensity, I 0 is the peak intensity of interference fringes, k is the number of the output light paths, k = 1 ,   2 ,   3 , φ t is the phase difference signal of the sensor, that is, the signal to be measured, ψ t is the phase difference caused by environmental changes.
The required signal can be obtained through MATLAB program demodulation:
V o u t = 3 φ t = 3 ϕ t + ψ t ,
V o u t is the output signal of the 3 × 3 coupler demodulation scheme. Usually, ψ t is regarded as a slow change quantity, which can be filtered out through a high-pass filter. Finally, we can get ϕ t , which is the BCG signal.

3.4. The Comparison of Three Demodulation Schemes

The system based on PGC demodulation can demodulate the original signal well. Due to the need for a signal generator, the cost is too high to be suitable for the development of commercial products. Since the bias point is kept in the quadrature point, the BCG waveform from this sensor with a phase compensation system is best. This device will be used in BCG waveform detail research, which is very important in the research of disease diagnosis. However, the signal obtained by this scheme is only BCG information, and breathing information is lost. The system based on the 3 × 3 coupler demodulation scheme can recover the breathing and heartbeat signals at the same time, which is very important in sleep analysis. This system has great potential in the field of sleep monitoring.

4. Application of Vital Signs Monitoring
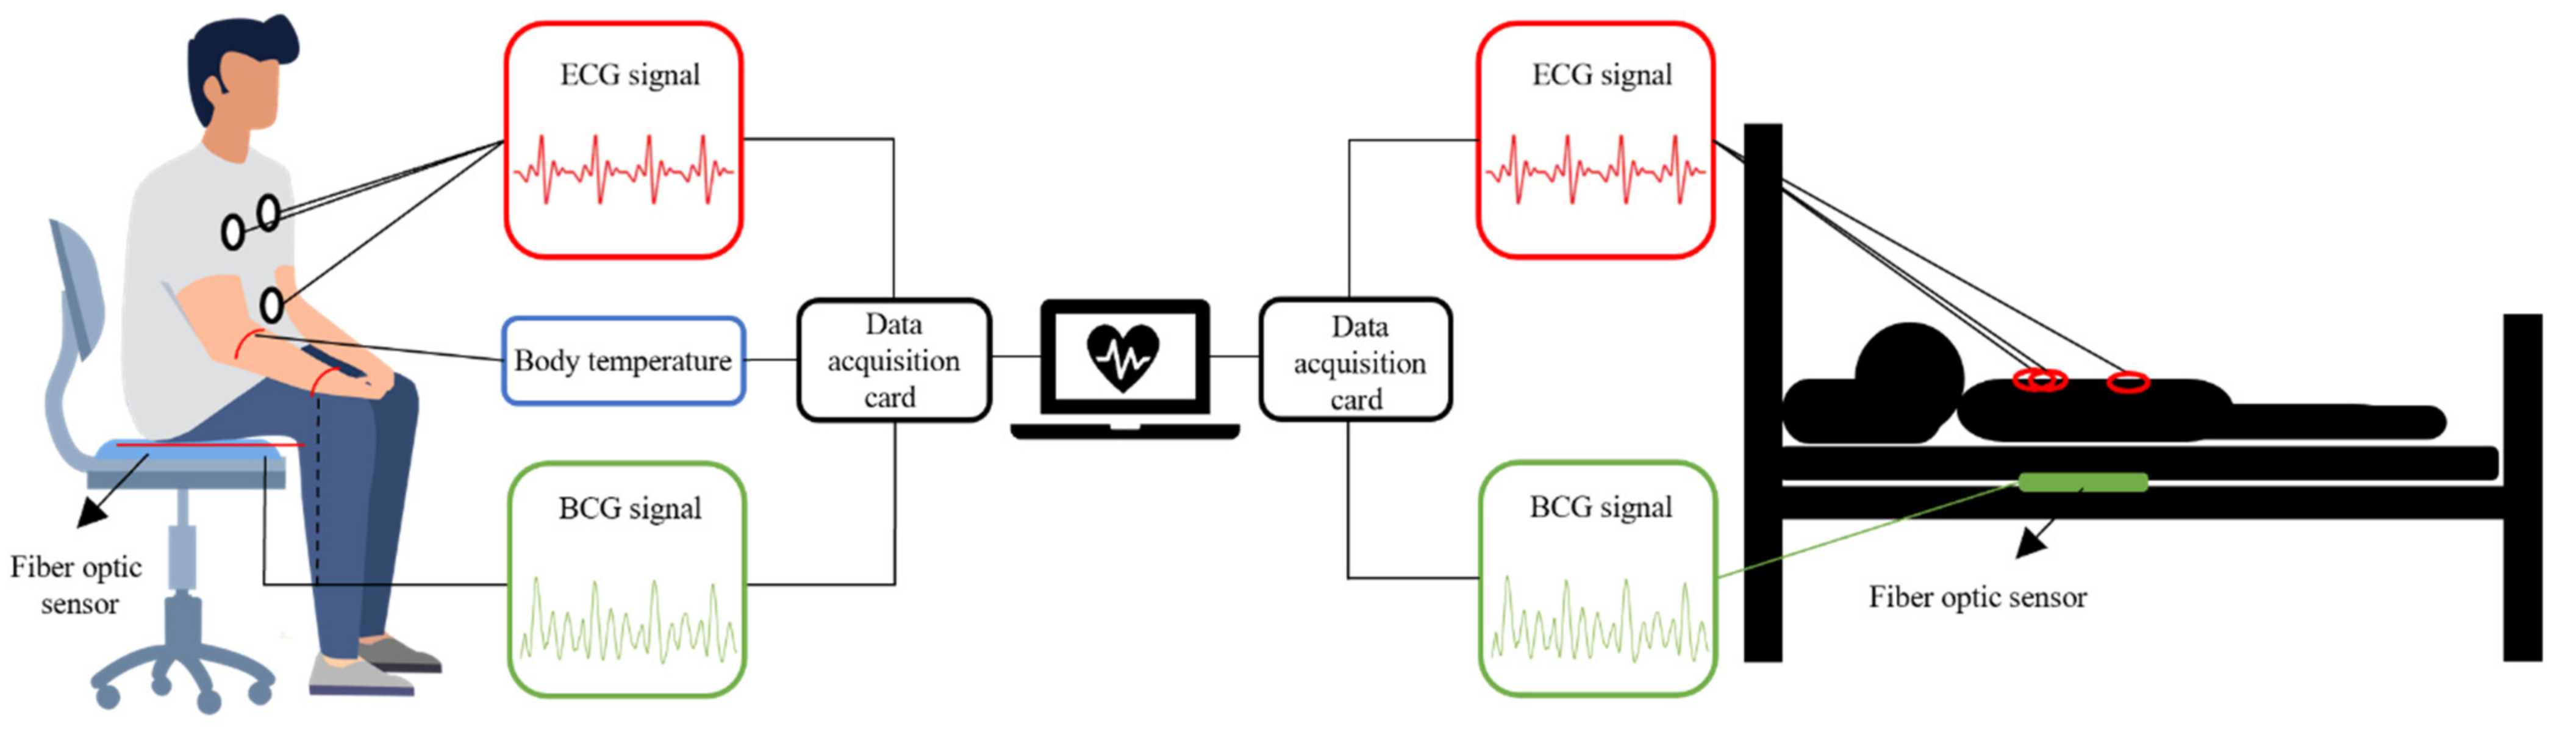
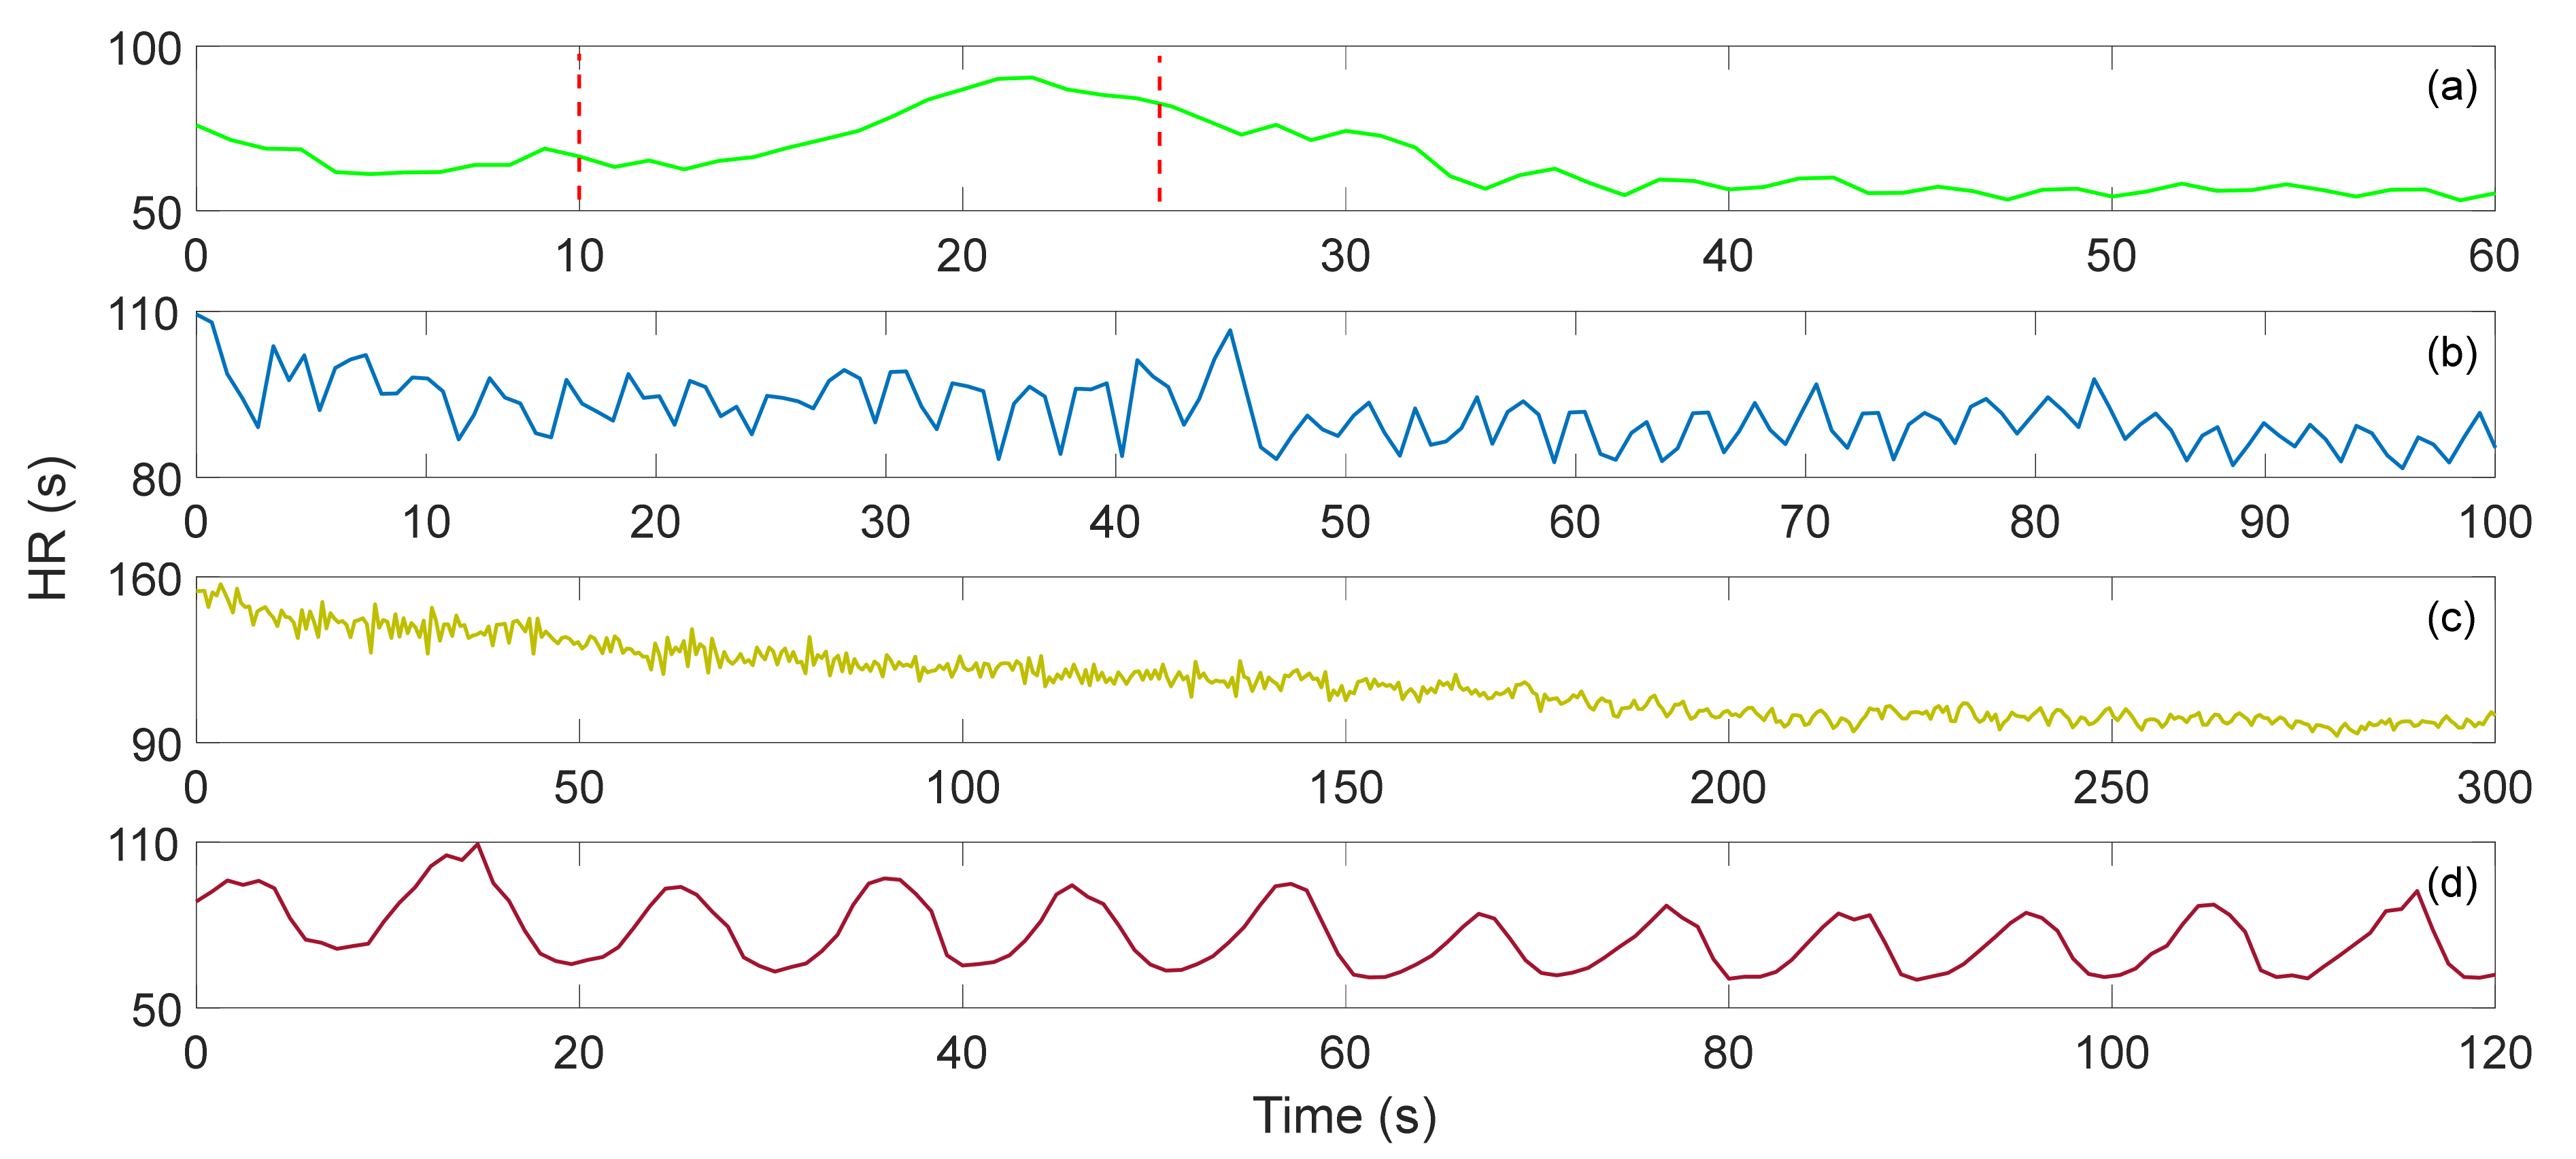
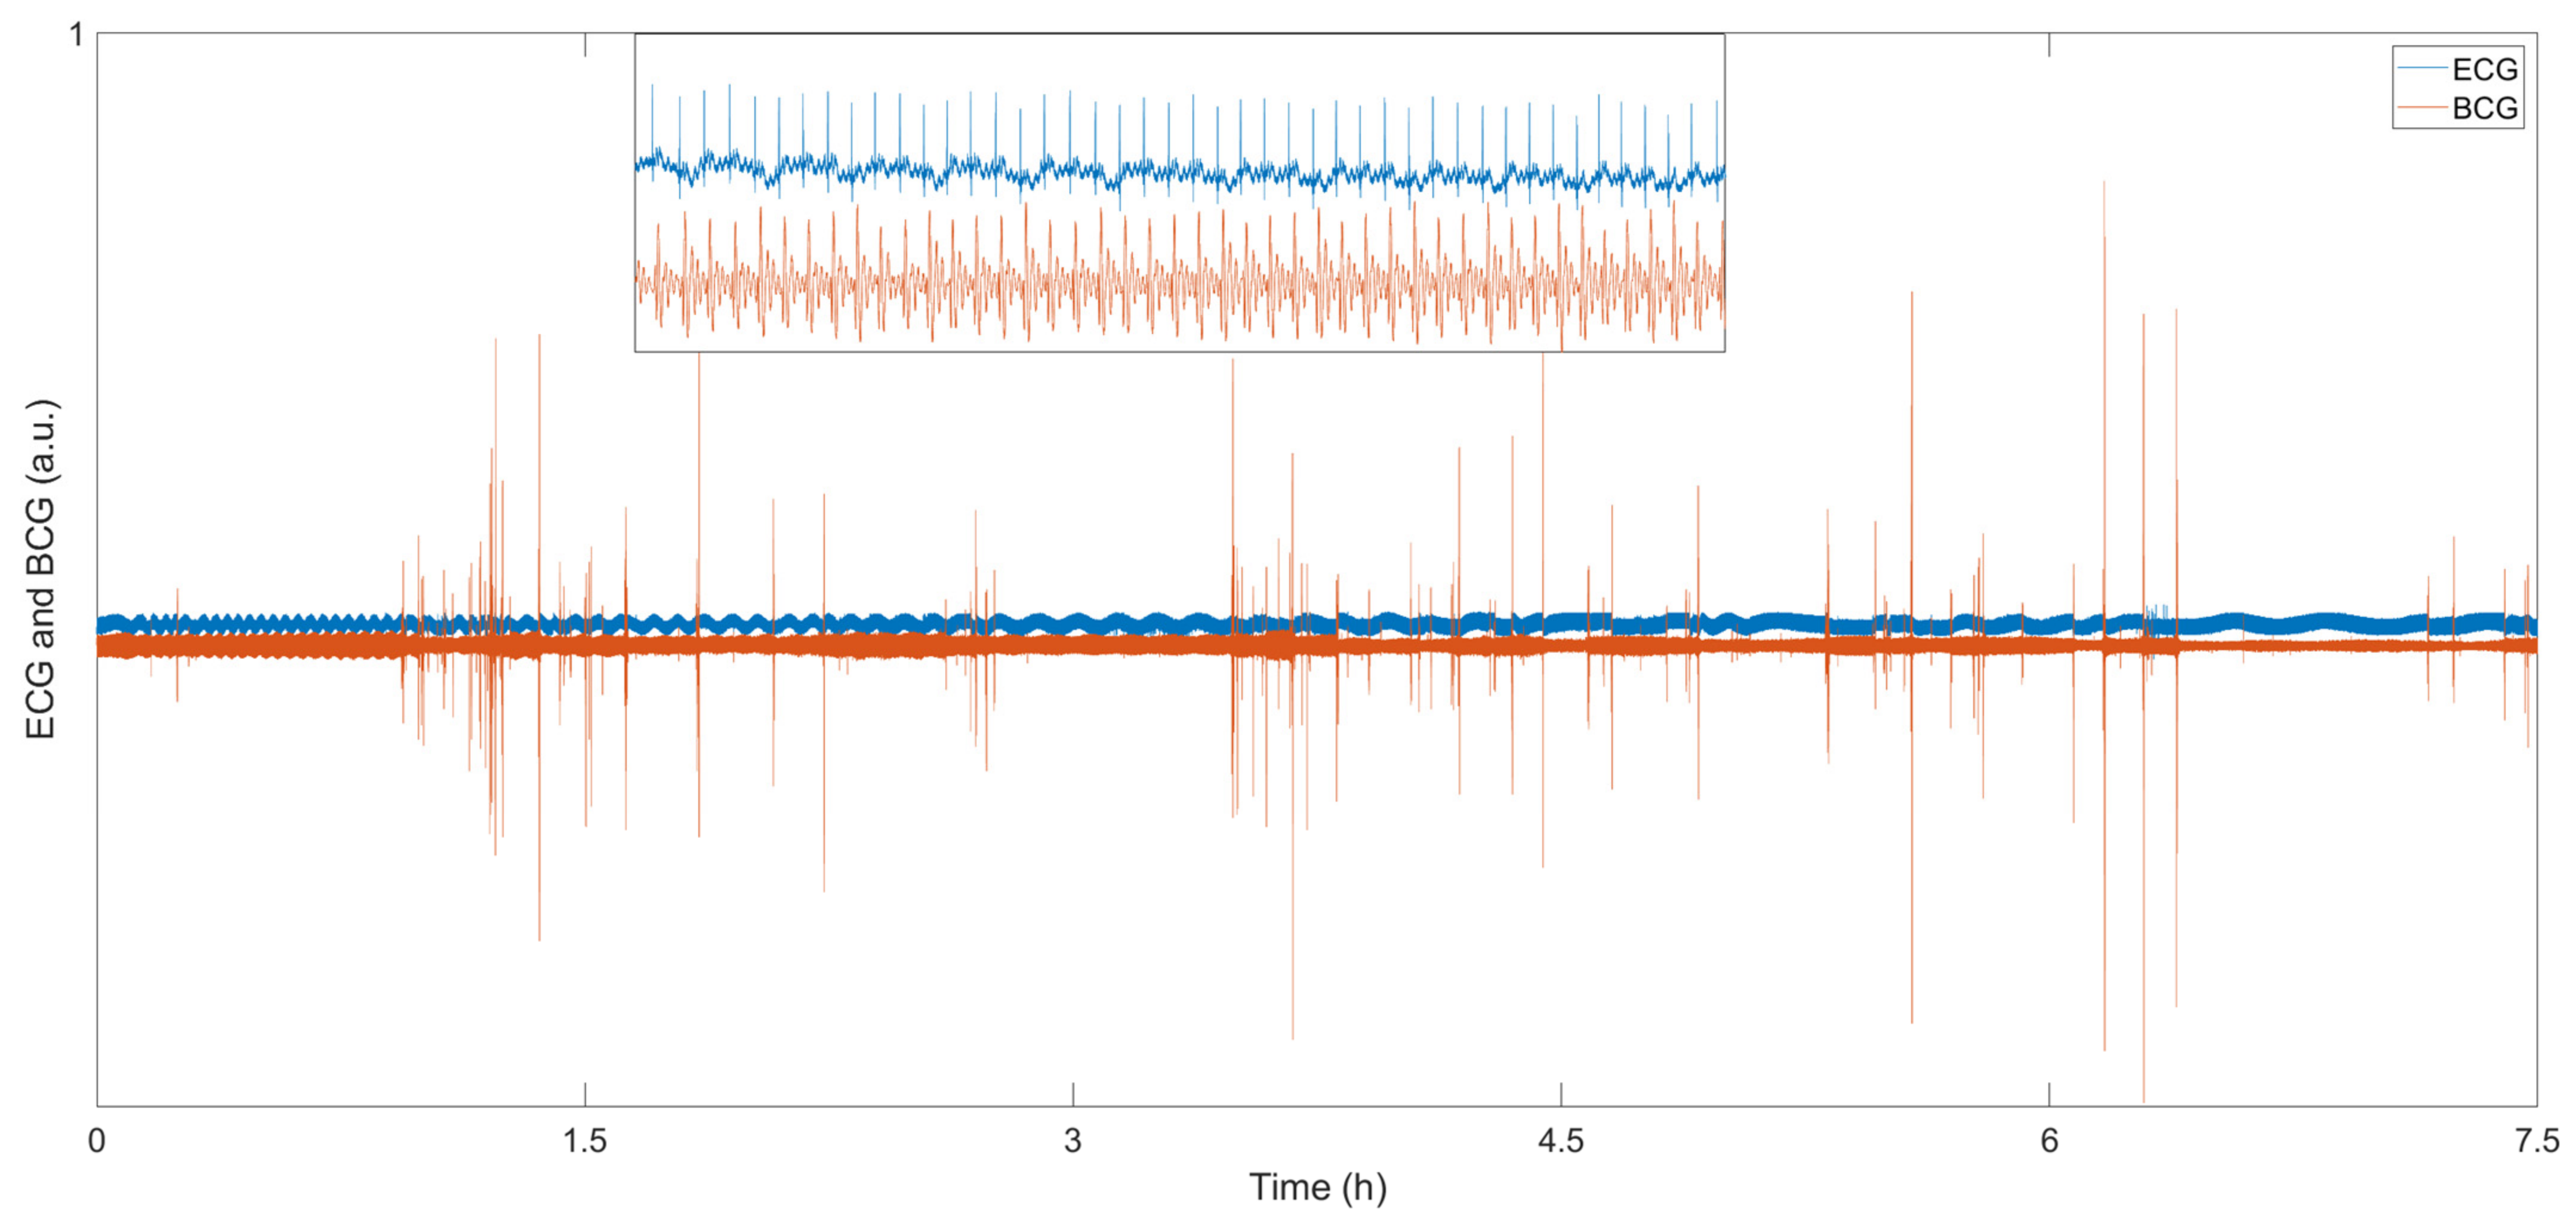
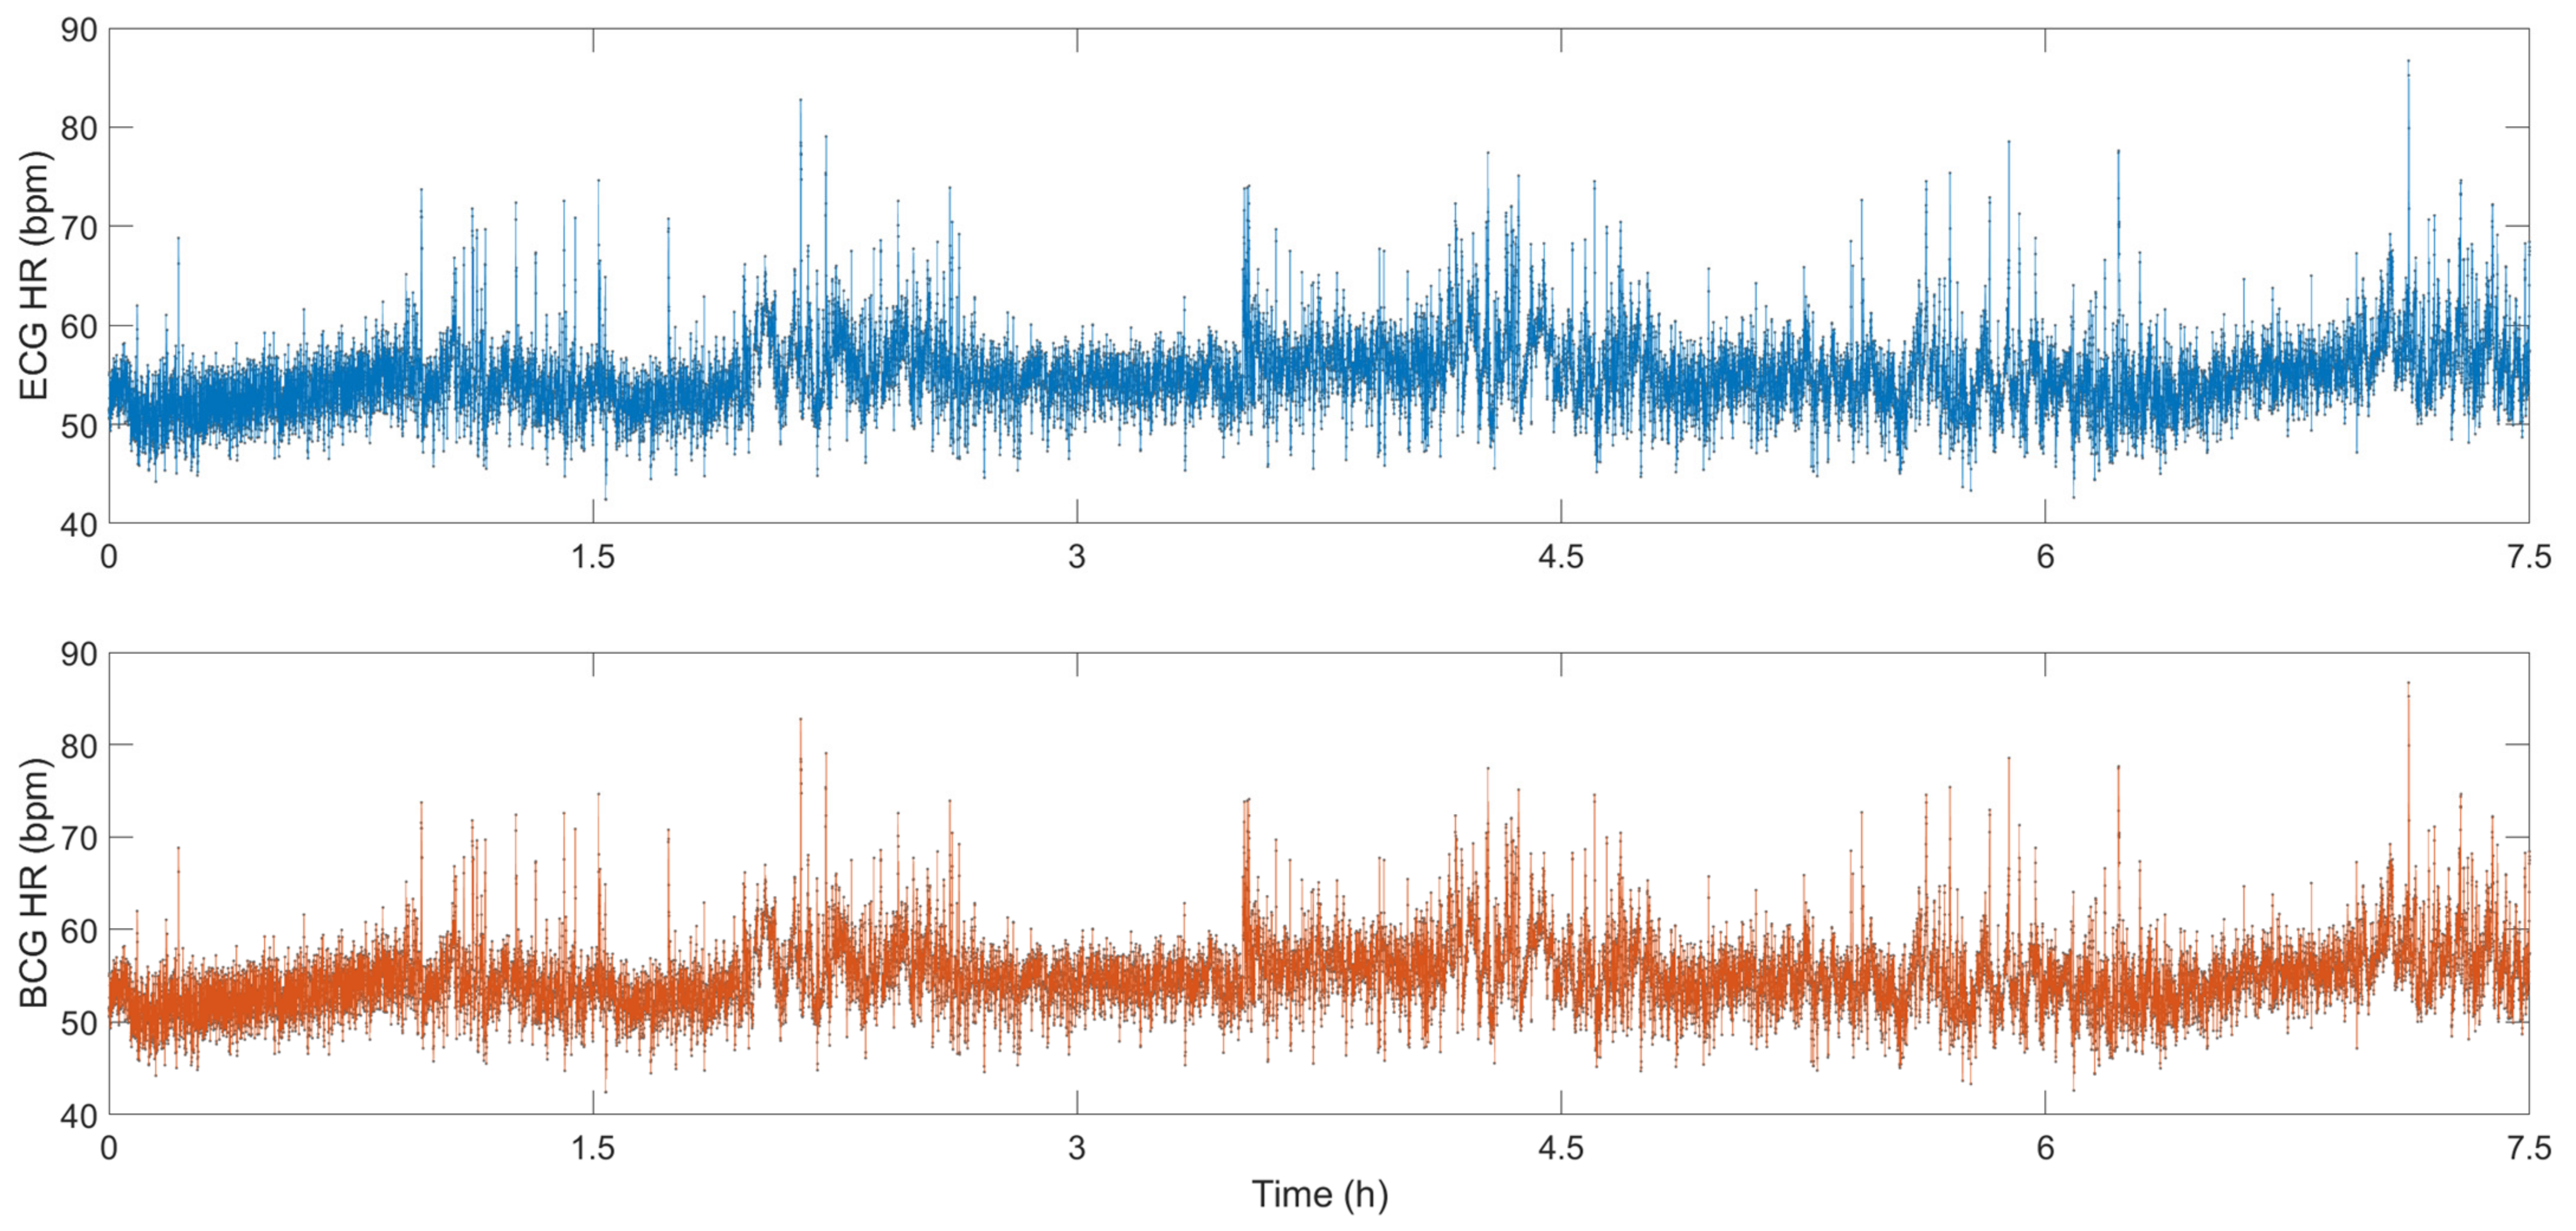
The demodulated signal is the vital sign information, which can be BCG waveform, respiration waveform or body temperature according to the purpose of the sensor.
The BCG signal measured by the optical fiber interferometer-based vital sign monitoring system contains multiple peaks, and each peak has a specific physiological meaning; the most obvious is the I, J, and K peaks. Therefore, the extraction and analysis of these peaks are very important because they are related to the health of the heart. Monitoring heart information throughout the day, including rest, exercise and sleep, is very important to understand people’s health. When using PGC or the 3 × 3 coupler demodulation scheme, the result will also contain respiration information. It is easy to separate the heartbeat from the breathing signal by the frequency difference.
In addition to heart monitoring, body temperature monitoring is also very important for health. Many diseases are closely related to body temperature. Hyperthermia may present with sweating, flushing, tachycardia, fatigue, lightheadedness, headache, muscle cramps, nausea, hypotension, syncope, confusion and coma. Hypothermia may also present with shivering, respiratory depression, cardiac dysrhythmias, impaired mental function, mydriasis, hypotension and muscle dysfunction, which can progress to cardiac arrest or coma. Deaths from hypothermia are twice as frequent as deaths from hyperthermia [49].
The vital signs monitoring system based on interference FOS is shown in Figure 6. The FOS for heart monitoring can be placed under a mat [12,13,35,36] or a mattress [14,18,19,20,38,39]. Some researchers have also made wearable sensors that can be attached to the body [37] or worn on the wrist [21,22,23]. Sensors used for body temperature monitoring need to be in direct contact with the skin, such as on an arm, in order to measure accurate results [4,5].

4.1. Heart Rate

As we all know, the resting HR of a healthy person (the HR measured when a person is at rest and not affected by the external environment) is relatively stable. Tachycardia can cause heart damage, and arrhythmia is prone to occur. Excessive HR can lead to stroke, heart failure and a serious risk of death [50,51]. This is also highly correlated with BP, and people with hypertension tend to have a high HR [52]. HR can predict not only the mortality of coronary heart disease but also the mortality of non-cardiovascular diseases. Therefore, daily HR monitoring is very important.
Heart rate variability (HRV) is a physiological phenomenon representing the variation in the heart’s beat-to-beat time interval. The analysis of HRV can be used to evaluate the activation of the sympathetic and parasympathetic rhythm of the body. HRV has emerged as a reliable and non-invasive marker for assessing cardiac autonomic imbalance and is deviated in many pathological conditions, including heart failure [53], diabetes [54,55], hypertension [56] and myocardial infarction [57]. Due to its more accessible application for monitoring in contrast to the inconvenience of attaching electrodes to the skin in ECG measurement, BCG helps doctors to evaluate the HR dynamics of patients in the long term.
M. Życzkowskia et al. investigated three interferometers, Mach–Zehnder, Sagnac and Michelson, to monitor heart activity [58]. However, due to early sensor technology and difficulty in eliminating motion artifacts, an accurate heart rate was not calculated. S. Šprager et al. rolled up a 4 m long optical fiber in a spiral and tightly attached it to the human chest to monitor the resting heart rate [59]. In addition to the static HR, since it changes with exercise intensity, HR monitoring after exercise is also very important. W. Lyu et al. have conducted some interesting experiments based on MZI. They carried out four different exercise intensity experiments of paced respiration, dynamic squat exercise (DSE), Valsalva maneuver (VM) and running exercise [12]. When performing paced respiration, the subject breathes six times per minute (0.1 Hz), and DSE is to perform 40 squats as fast as possible. The VM starts when the data is recorded for 10 s and released after 15 s. The data of running exercise was recorded after the subjects run several hundred meters quickly. Figure 7 show the HR after four different exercises. The correlation between the HR calculated by ECG signal and the HR calculated by BCG signal is 0.9862, and the error between the two is less than 3 bpm. Comparing the calculation results of the gold standard ECG, the sensor based on the optical fiber interferometer can be used for heart rate monitoring. In Figure 7a, the time between the two red lines show the subject performs the VM for 15 s. During this period, HR gradually increased and returned to normal after the tension was released. The average HR of the entire VM and recovery process was 63.959 s. Figure 7b,c presents the HR variations after DSE and running, respectively. Since running is more intense, the initial HR measured was faster. As the rest time becomes longer, HR gradually decreased. The average HR values of DSE and running were 91.296 s and 113.701 s, respectively. Figure 7d show the HR during the paced respiration. The average HR during the whole process was 74.497 s. It increased when the subject inhaled and decreased when he exhaled. This is called respiratory sinus arrhythmia (RSA), and it reflects changes in the regulation of the heart’s autonomic nerves.

4.2. Respiration

Obstructive sleep apnea is a common and potentially fatal sleep disorder that affects at least 4% of men and 2% of women worldwide [60]. Respiratory volume monitors can provide real-time RR and respiration volume information, which are significant indicators for the diagnosis of obstructive sleep apnea [61]. Continuous breath assessment has been recognized as essential for the diagnosis of certain diseases and patient safety, especially for patients after surgery. Among respiratory parameters, RR is usually expressed as breaths per minute. TV refers to the amount of air moving in and out of the lungs in each breath. It provides information regarding the depth of breath. MV refers to the amount of air moved by the person in one minute, which can be obtained by the product of RR and TV. Real-time monitoring of RR, TV and MV plays a vital role in the diagnosis of obstructive sleep apnea and postoperative diseases.
So far, many researchers around the world have developed various technologies and instruments for continuous RR and TV monitoring, such as blood oxygen saturation (SpO2) [62], electrocardiogram (ECG) morphology [63], airflow [64] and abdominal exercise [65]. The methods currently used for clinical RR and TV monitoring usually involve specialized equipment, including spirometry, impedance pulmonography, inductive plethysmography and photoplethysmography [66]. However, these methods are difficult to convert to daily use due to high costs, skill or inconvenience.
R. Wang et al. proposed a respiratory monitoring system based on FMF-MZI sensors, which can monitor important respiratory parameters such as RR, TV and MV through a wearable design [37]. They carefully considered the curvature sensitivity and the best linear working area of the fiber optic sensor through experimental design to achieve the maximum sensitivity of accurate respiratory monitoring. Through the wearable design, the sensor can be easily worn on the human abdomen for long-term continuous monitoring. Their experimental results show that the sensitivity of the breathing sensor when working in the linear region was as high as 8.53 dB/m−1. The monitoring results are very consistent with those measured by standard clinical spirometers. The maximum difference of TV estimation was 0.2 L, and the overall error of MV was less than 5%. They also simulated apnea scenarios in experiments to verify the possibility of their system to detect apneas. Whether breath-holding during inhalation or exhalation, they can analyze the correct results through the waveform. Using Fast Fourier Transform (FFT) to analyze the respiratory frequency distribution, the respiratory frequency spectrum of different volunteers was determined as different, which shows that this sensor can distinguish the respiratory characteristics of different individuals.
X. Li proposed a respiration sensor based on a multimode fiber MZI and connected it to the plastic film in the oxygen mask [40]. By detecting the change in optical power caused by the macroscopic bending applied to the SMS part during each inhalation and exhalation process, the breathing state can be monitored. The sensor can distinguish different types of breathing conditions, including regular and irregular breathing states.
F.C. Favero et al. reported a respiration sensor based on a reflective photonic crystal fiber interferometer, which can be used to monitor human respiration regardless of the respiration frequency [41]. When the subject purposefully stops breathing within a few seconds, the interference pattern will shift. This system can be used to assess a person’s health or to assist in diagnosing the progress of sleep apnea syndrome. J. Mathew et al. developed a novel miniature optical breathing sensor based on an Agarose infiltrated photonic crystal fiber interferometer [42]. The sensor determines the respiration pattern in real-time by detecting the relative humidity change between inhalation and exhalation. It can also analyze the RR and respiration state during respiration.

4.3. Sleeping

In recent years, young people have become more and more stressed, and many of the elderly suffer from respiratory diseases. More and more people have begun to pay attention to health indicators during sleep, hoping to have more high-quality sleep.
Sleep problems are one of the most common medical problems today. Polysomnography (PSG), as the current standard for sleep analysis, is expensive, invasive and complicated. Therefore, it is important to find a reliable and unobtrusive method for long-term home use. Recently, methods based on BCG have shown potential in sleep analysis. S. Nurmi evaluated the usability and performance of BCG-based methods in qualitative and quantitative sleep analysis [43]. Using PSG as a reference, they analyzed the HR, HRV, respiratory rate, respiratory rate variability, respiratory depth and exercise of 20 subjects for sleep stage detection.
For sleep monitoring, the BCG system does not need to affix uncomfortable patches to the body, nor does it require a wired connection on the body; therefore, it can monitor the sleep state in real-time without affecting sleep. W. Lyu et al. conducted some sleep monitoring experiments using an MZI-based FOS [14]. Figure 8 show the sleep data for 7.5 h, the blue line is the ECG signal, and the red line is the BCG signal. The small image at the top of the figure shows the detailed information of ECG and BCG from 10,100 s to 10,150 s. This sensor can detect tiny body movements during sleep due to the high sensitivity of the optical fiber interferometer. Compared with the BCG signal, the ECG signal is very stable all night, and the weak body movement during sleep has almost no effect on the signal. In the BCG signal, the signal amplitude increases significantly during body movement. Researchers can easily analyze the sleep status using the BCG signal. S. Šprager et al. adopted frequency domain analysis to evaluate body movement due to the difference in the frequency of breathing, heartbeat and body movement [59]. M. Nishyama et al. measured breathing and body movement during sleep based on a hetero-core fiber [39]. The sensor contains a single-mode fiber with a 9 μm core and a hetero-core fiber with a 5 μm core. Their results show that sensors based on light interferometers can be used successfully for sleep monitoring.
Figure 9 show the HR calculated from the ECG signal and the BCG signal. During sleep, the HR fluctuates around 55 bpm. When the subject’s body has small movements, the HR will also increase rapidly. As the body calms down, the HR returns to approximately 55 bpm. The correlation between the HR calculated by the ECG signal and the HR calculated by the BCG signal is 0.9907, and the error between the two is less than 1 bpm, which shows that the HR monitoring system based on FOS can be a good substitute for the traditional ECG system for sleep monitoring.
Experiments by a large number of researchers have proved that the vital signs monitoring system based on FOS has shown an accuracy of HRV close to that of ECG equipment, and it can be used as a reliable device for HR analysis. Moreover, it is small, light and low in cost, providing satisfactory development in the field of intelligent health monitoring.

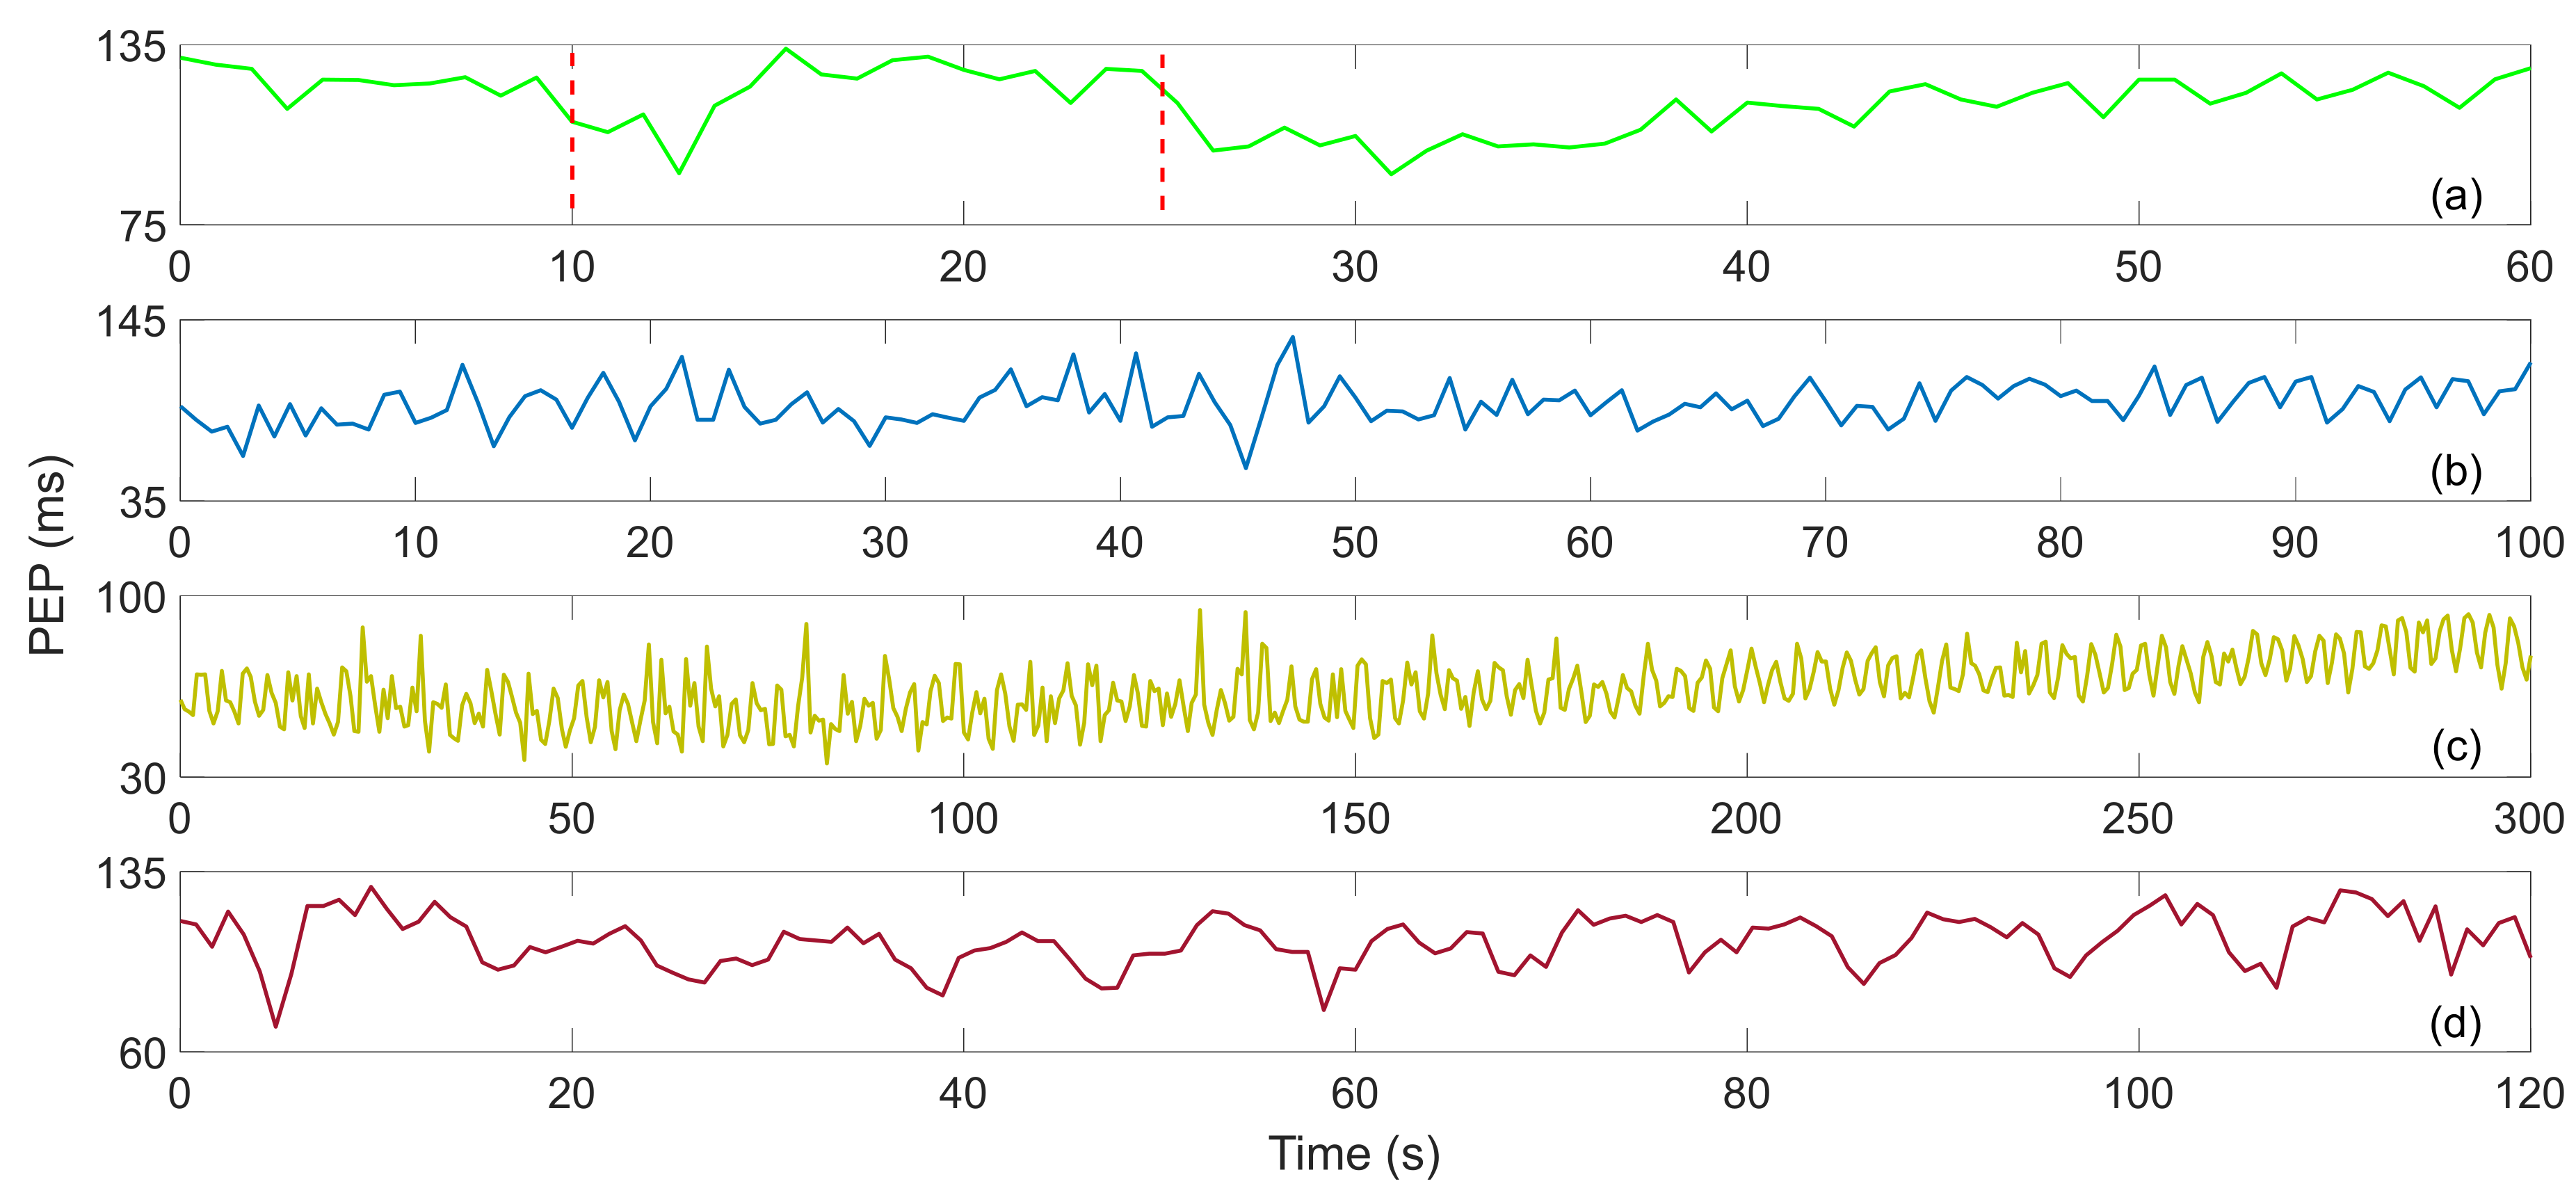
4.4. Myocardial Contractility

The pre-ejection period (PEP) is one of the basic systolic intervals, and it is an important indicator for evaluating myocardial contractility. Many cardiovascular diseases (CVD) are related to this period, such as heart failure and myocardial infarction [67]. PEP is defined as the time interval between the Q wave of an ECG and the B wave of an impedance electrocardiogram (ICG) [68,69]. Due to the large inconvenience and high cost of measuring equipment, it is difficult for ICG to realize home use. Some studies have shown that the time interval between the J wave of BCG and the R wave of ECG (RJ interval) can be used to replace the traditional QB interval. The relationship between the two is as follows [70]:
R J = 1.05 · P E P + 138
W. Lyu et al. studied the RJ interval measurement of BCG based on an optical fiber MZI. In order to verify its feasibility, they first adjusted the myocardial contractility through VM, and obtained satisfactory experimental results [13]. Then they added DSE, paced respiration and performing three exercises [12]. Figure 10 show the PEP after four different exercises. In Figure 10a, the PEP suddenly decreases when the VM starts, which may be caused by deep breathing. During the whole VM period, the PEP remained stable, and after the strain was released, it dropped suddenly and then gradually recovered. The average value of PEP was 116.344 ms. In Figure 10b, the value of PEP fluctuated drastically during the recovery process of DSE, showing no obvious trend, with an average value of 93.9704 ms. The PEP also fluctuated sharply after running, and the overall trend gradually increased during the recovery process. The variation is shown in Figure 10c, and the average value is 63.9383 ms. Figure 10d show the PEP trend during the paced respiration, which fluctuates up and down with respiration. The trend is basically the same as that of HR during paced respiration, and the average value of PEP is 106.2365 ms.

4.5. Body Temperature

The normal range of body temperature is generally accepted between 36.1 °C and 37.2 °C. A body temperature over 38 °C most often means the person has a fever caused by an infection or illness. It can be measured by the tympanic route, axillary, rectally and orally. Fever can be caused by many diseases, including viral, bacterial and parasitic infections, such as flu, the common cold, meningitis, appendicitis, malaria and COVID-19. Cancer is one of the killers of human health today, and it brings a series of threats to people’s health and life [71]. At present, the treatment of cancer uses radiotherapy, chemotherapy and surgical resection as the main methods, which may cause irreparable damage to the patient’s body [72,73]. Hyperthermia is a treatment method that heats body tissues to a maximum of 45 °C destroying and killing cancer cells while causing almost no harm to normal tissues.
Cao et al. reported a high-performance biocompatible temperature sensor based on a Fabry–Perot (FP) cavity filled with ethanol [44]. The experimental results show that the wavelength shift is proportional to the change. The linear temperature response greatly improves the measurement accuracy and makes the measurement easier. The sensitivity of the sensor is 0.429 nm/°C. Wang et al. proposed an easier-to-manufacture optical temperature sensor, which was achieved using MZI based on SMF [45]. A section of SMF was sandwiched between two SMF with a small offset, thus forming an SMF–SMF–SMF structure. Then the structure was coated with silicone oil and sealed in a capillary tube for temperature measurement. Their sensor had a high temperature sensitivity of 8.962 nm/°C. They tested the performance of the sensor regarding human body temperature measurement through experiments, and the results are shown in Figure 11. The black point and the red point are the standard temperatures (measured by a thermometer) and the measured temperatures (measured by an optical fiber sensor), respectively. The results show that the two sets of temperatures have good consistency. Although the sensitivity of the sensors used by the researchers is different, they all meet the needs of body temperature monitoring.

5. Conclusions

In conclusion, an optical fiber interferometer has many advantages such as high sensitivity, low cost, immunity to electromagnetic interference, etc., and has great potential for application in the field of biomedicine. This article reviewed the vital signs monitoring system based on an optical fiber interferometer, which mainly includes sensor structure, interferometric signal demodulation method and vital sign signals analysis. A large amount of experimental data shows that the sensor can achieve the accurate measurement of HR and respiration.
Compared with other cardiovascular detection technologies, such as ECG and ICG, BCG has the advantages of being non-invasive and providing convenient detection. The research on the physiological significance of ECG signals is very mature, and the physiological importance of BCG signals requires further study. We can use the accurate BCG signal to explore the physiological significance of each peak and combine the patient’s body temperature to provide a reference for the doctor’s diagnosis, using breathing rate and HR information to analyze an individuals’ fatigue state and sleep quality.
For future work, researchers can continue to improve the performance of the monitoring system. Most of the current research results are based on static measurements. However, when the subject has subtle body movements, the signal will be destroyed to varying degrees. Therefore, filtering out noise signals and restoring vital signs signals is very important for practical applications.

Author Contributions

Conceptualization, W.L. and S.C.; methodology, F.T.; software, W.L.; validation, W.L., S.C. and F.T.; formal analysis, W.L.; investigation, W.L.; resources, W.L., S.C. and F.T.; data curation, W.L.; writing—original draft preparation, W.L.; writing—review and editing, W.L., S.C., F.T. and C.Y.; visualization, W.L. and S.C.; supervision, C.Y.; project administration, C.Y.; funding acquisition, C.Y. All authors have read and agreed to the published version of the manuscript.

Funding

This research was funded by the Research Grants Council, University Grants Committee, grant number 15200718, and the National Natural Science Foundation of China, grant number 61971372.

Data Availability Statement

Obtained experimental data are available from the corresponding author upon reasonable request.

Conflicts of Interest

The authors declare no conflict of interest.

References

  1. Zhang, F.; Yu, Y.; Zhong, J. Research status and development prospects of human vital signs monitoring clothing. IOP Conf. Ser. Earth Environ. Sci. 2019, 233, 042031. [Google Scholar] [CrossRef]
  2. Finocchiaro, G.; Sheikh, N.; Biagini, E.; Papadakis, M.; Sinagra, G.; Pelliccia, A.; Rapezzi, C.; Sharma, S.; Olivotto, I. The electrocardiogram in the diagnosis and management of patients with hypertrophic cardiomyopathy. Heart Rhythm 2020, 17, 142–151. [Google Scholar] [CrossRef]
  3. Liu, H.; Allen, J.; Zheng, D.; Chen, F. Recent development of respiratory rate measurement technologies. Physiol. Meas. 2019, 40, 07TR01. [Google Scholar] [CrossRef] [PubMed] [Green Version]
  4. Vinci, G.; Lindner, S.; Barbon, F.; Mann, S.; Hofmann, M.; Duda, A.; Weigel, R.; Koelpin, A. Six-port radar sensor for remote respiration rate and heartbeat vital-sign monitoring. IEEE Trans. Microw. Theory Tech. 2013, 61, 2093–2100. [Google Scholar] [CrossRef]
  5. Shao, D.; Tsow, F.; Liu, C.; Yang, Y.; Tao, N. Simultaneous monitoring of ballistocardiogram and photoplethysmogram using a camera. IEEE Trans. Biomed. Eng. 2016, 64, 1003–1010. [Google Scholar] [CrossRef] [PubMed] [Green Version]
  6. Hassan, M.A.; Malik, A.S.; Fofi, D.; Saad, N.M.; Ali, Y.S.; Meriaudeau, F. Video-based heartbeat rate measuring method using ballistocardiography. IEEE Sens. J. 2017, 17, 4544–4557. [Google Scholar] [CrossRef]
  7. Ramakrishnan, M.; Rajan, G.; Semenova, Y.; Farrell, G. Overview of Fiber Optic Sensor Technologies for Strain/Temperature Sensing Applications in Composite Materials. Sensors 2016, 16, 99. [Google Scholar] [CrossRef] [Green Version]
  8. Chen, Z.; Lau, D.; Teo, J.T.; Ng, S.H.; Yang, X.; Kei, P.L. Simultaneous measurement of breathing rate and heart rate using a microbend multimode fiber optic sensor. J. Biomed. Opt. 2014, 19, 057001. [Google Scholar] [CrossRef]
  9. Leal-Junior, A.G.; Diaz, C.R.; Leitão, C.; Pontes, M.J.; Marques, C.; Frizera, A. Polymer optical fiber-based sensor for simultaneous measurement of breath and heart rate under dynamic movements. Opt. Laser Technol. 2019, 109, 429–436. [Google Scholar] [CrossRef]
  10. Dziuda, Ł.; Krej, M.; Skibniewski, F.W. Fiber Bragg grating strain sensor incorporated to monitor patient vital signs during MRI. IEEE Sens. J. 2013, 13, 4986–4991. [Google Scholar] [CrossRef]
  11. Koyama, S.; Haseda, Y.; Ishizawa, H.; Okazaki, F.; Bonefacino, J.; Tam, H.-Y. Measurement of Pulsation Strain at the Fingertip Using a Plastic FBG Sensor. IEEE Sens. J. 2021, 21, 21537–21545. [Google Scholar] [CrossRef]
  12. Lyu, W.; Xu, W.; Yang, F.; Chen, S.; Tan, F.; Yu, C. Non-invasive measurement for cardiac variations using a fiber optic sensor. IEEE Photonics Technol. Lett. 2021, 33, 990–993. [Google Scholar] [CrossRef]
  13. Lyu, W.; Tan, F.; Chen, S.; Yu, C. Myocardial contractility assessment using fiber optic sensors. In Proceedings of the Asia Communications and Photonics Conference, Chengdu, China, 2–5 November 2019; p. M4A-152. [Google Scholar]
  14. Lyu, W.; Chen, S.; Tan, F.; Yu, C. Non-invasive heart rate variability measurement during sleep based on fiber optic sensor. In Proceedings of the 2021 26th Optoelectronics and Communications Conference, Hong Kong, China, 3–7 July 2021; p. JS3F-2. [Google Scholar]
  15. Tan, F.; Lyu, W.; Chen, S.; Liu, Z.; Yu, C. Contactless vital signs monitoring based on few-mode and multi-core fibers. Opto-Electron. Adv. 2020, 3, 190034. [Google Scholar] [CrossRef]
  16. Ke, C.; Cai, Y.; Zhao, T.; Li, Z. Research on intelligent mattress based on improved SMS structure sensing fiber. J. Phys. Conf. Ser. 2021, 1082, 022023. [Google Scholar] [CrossRef]
  17. Qu, J.; Shen, Y.; Xu, W.; Tan, F.; Yu, C.; Yu, C. Non-invasive vital signs monitoring based on polarization maintaining fiber and Sagnac interferometer. In Proceedings of the 24th OptoElectronics and Communications Conference/International Conference Photonics in Switching and Computing, OECC/PSC 2019, Fukuoka, Japan, 7–11 July 2019; p. 8817846. [Google Scholar]
  18. Ke, C.; Cai, Y.; Zhao, T.; Li, Z. Research on Smart Mattress Based on Fiber Unbalanced Sagnac Loop. IOP Conf. Ser. Earth Environ. Sci. 2021, 769, 042039. [Google Scholar] [CrossRef]
  19. Zazula, D.; Đonlagić, D.; Šprager, S. Application of fibre-optic interferometry to detection of human vital signs. J. Laser Health Acad. 2012, 2012, 27–32. [Google Scholar]
  20. Šprager, S.; Đonlagić, D.; Zazula, D. Heartbeat detection applying activity index on optical interferometric signal. In Proceedings of the 11th WSEAS international conference on Instrumentation, Measurement, Circuits and Systems, and Proceedings of the 12th WSEAS International Conference on Robotics, Control and Manufacturing Technology, and Proceedings of the 12th WSEAS International Conference on Multimedia Systems & Signal Processing, Rovaniemi, Finland, 18–20 April 2012; pp. 77–82. [Google Scholar]
  21. Pullteap, S.; Samartkit, P. A High Sensitivity of Vital Signs Detector using Fiber Optic-based Fabry-Perot Interferometer. ECTI Trans. Electr. Eng. Electron. Commun. 2020, 18, 98–106. [Google Scholar] [CrossRef]
  22. Samartkit, P.; Pullteap, S.; Seat, H.C. Validation of Fiber Optic-Based Fabry–Perot Interferometer for Simultaneous Heart Rate and Pulse Pressure Measurements. IEEE Sens. J. 2020, 21, 6195–6201. [Google Scholar] [CrossRef]
  23. Li, Y.; Dong, B.; Chen, E.; Wang, X.; Zhao, Y. Heart-rate monitoring with an ethyl alpha-cyanoacrylate based fiber fabry-perot sensor. IEEE J. Sel. Top. Quantum Electron. 2020, 27, 1–6. [Google Scholar] [CrossRef]
  24. Priest, R.G. Analysis of fiber interferometer utilizing 3 × 3 fiber coupler. IEEE Trans. Microw. Theory Tech. 1982, 30, 1589–1591. [Google Scholar] [CrossRef] [Green Version]
  25. Jackson, D.; Priest, R.; Dandridge, A.; Tveten, A.B. Elimination of drift in a single-mode optical fiber interferometer using a piezoelectrically stretched coiled fiber. Appl. Opt. 1980, 19, 2926–2929. [Google Scholar] [CrossRef]
  26. Dandridge, A.; Tveten, A.B.; Giallorenzi, T.G. Homodyne demodulation scheme for fiber optic sensors using phase generated carrier. IEEE Trans. Microw. Theory Tech. 1982, 30, 1635–1641. [Google Scholar] [CrossRef] [Green Version]
  27. Liu, B.; Lin, J.; Liu, H.; Ma, Y.; Yan, L.; Jin, P. Diaphragm based long cavity Fabry–Perot fiber acoustic sensor using phase generated carrier. Opt. Commun. 2017, 382, 514–518. [Google Scholar] [CrossRef]
  28. Chang, T.; Lang, J.; Sun, W.; Chen, J.; Yu, M.; Gao, W.; Cui, H.-L. Phase compensation scheme for fiber-optic interferometric vibration demodulation. IEEE Sens. J. 2017, 17, 7448–7454. [Google Scholar] [CrossRef]
  29. Udd, E.; Spillman, W.B., Jr. Fiber Optic Sensors: An Introduction for Engineers and Scientists; John Wiley & Sons: Hoboken, NJ, USA, 2011. [Google Scholar]
  30. Sheem, S.K. Optical fiber interferometers with [3 × 3] directional couplers: Analysis. J. Appl. Phys. 1981, 52, 3865–3872. [Google Scholar] [CrossRef]
  31. Kamenev, O.T.; Petrov, Y.S.; Podlesnykh, A. Use of 3 × 3 Coupler in the Fiber Optic Strainmeter Based on Mach-Zehnder Interferometer. In Proceedings of the KnE Energy, VII International Conference on Photonics and Information Optics (PhIO), Moscow, Russia, 24–26 January 2018; pp. 388–392. [Google Scholar]
  32. Xu, D.; Yang, F.; Chen, D.; Cai, H.; Qu, R. Laser phase noise measurement by using an adjustment-free Michelson interferometer based on 3×3 optical coupler. In Proceedings of the Asia Communications and Photonics Conference, Hong Kong, China, 19–23 November 2015; p. ASu3C.4. [Google Scholar]
  33. Park, S.; Lee, J.; Kim, Y.; Lee, B.H. Nanometer-scale vibration measurement using an optical quadrature interferometer based on 3× 3 fiber-optic coupler. Sensors 2020, 20, 2665. [Google Scholar] [CrossRef] [PubMed]
  34. Park, S.; Rim, S.; Kim, Y.; Lee, B.H. Noncontact photoacoustic imaging based on optical quadrature detection with a multiport interferometer. Opt. Lett. 2019, 44, 2590–2593. [Google Scholar] [CrossRef]
  35. Chen, S.; Tan, F.; Lyu, W.; Yu, C. Ballistocardiography monitoring system based on optical fiber interferometer aided with heartbeat segmentation algorithm. Biomed. Opt. Express 2020, 11, 5458–5469. [Google Scholar] [CrossRef]
  36. Yang, F.; Lyu, W.; Pan, C.; Yang, S.; Tan, F.; Chen, S.; Yu, C. Contactless vital signs monitoring based on optical fiber Mach-Zehnder interferometer aided with passive homodyne demodulation methods. In Proceedings of the Asia Communications and Photonics Conference, Beijing, China, 24–27 October 2020; p. M4A-79. [Google Scholar]
  37. Wang, R.; Zhao, J.; Sun, Y.; Yu, H.; Zhou, N.; Zhang, H.; Jia, D. Wearable respiration monitoring using an in-line few-mode fiber Mach-Zehnder interferometric sensor. Biomed. Opt. Express 2020, 11, 316–329. [Google Scholar] [CrossRef]
  38. Chen, W.; Zhang, Y.; Yang, H.; Qiu, Y.; Li, H.; Chen, Z.; Yu, C. Non-invasive measurement of vital signs based on seven-core fiber interferometer. IEEE Sens. J. 2021, 21, 10703–10710. [Google Scholar] [CrossRef]
  39. Nishyama, M.; Miyamoto, M.; Watanabe, K. Respiration and body movement analysis during sleep in bed using hetero-core fiber optic pressure sensors without constraint to human activity. J. Biomed. Opt. 2011, 16, 017002. [Google Scholar] [CrossRef] [PubMed] [Green Version]
  40. Li, X.; Liu, D.; Kumar, R.; Ng, W.P.; Fu, Y.-q.; Yuan, J.; Yu, C.; Wu, Y.; Zhou, G.; Farrell, G. A simple optical fiber interferometer based breathing sensor. Meas. Sci. Technol. 2017, 28, 035105. [Google Scholar] [CrossRef] [Green Version]
  41. Favero, F.C.; Pruneri, V.; Villatoro, J. Microstructured optical fiber interferometric breathing sensor. J. Biomed. Opt. 2012, 17, 037006. [Google Scholar] [CrossRef]
  42. Mathew, J.; Semenova, Y.; Farrell, G. A miniature optical breathing sensor. Biomed. Opt. Express 2012, 3, 3325–3331. [Google Scholar] [CrossRef] [Green Version]
  43. Nurmi, S.; Saaresranta, T.; Koivisto, T.; Meriheinä, U.; Palva, L. Validation of an Accelerometer Based BCG Method for Sleep Analysis; Department of Electrical Engineering and Automation, Aalto University: Espoo, Finland, 2016. [Google Scholar]
  44. Cao, K.; Liu, Y.; Qu, S. Compact fiber biocompatible temperature sensor based on a hermetically-sealed liquid-filling structure. Opt. Express 2017, 25, 29597–29604. [Google Scholar] [CrossRef]
  45. Wang, S.; Lv, R.; Zhao, Y.; Qian, J. A Mach-Zehnder interferometer-based High Sensitivity Temperature sensor for human body monitoring. Opt. Fiber Technol. 2018, 45, 93–97. [Google Scholar] [CrossRef]
  46. Tan, F.; Chen, S.; Lyu, W.; Liu, Z.; Yu, C.; Lu, C.; Tam, H.Y. Non-invasive human vital signs monitoring based on twin-core optical fiber sensors. Biomed. Opt. Express 2019, 10, 5940–5951. [Google Scholar] [CrossRef] [PubMed]
  47. Zhang, J.; He, Y.; Tan, F.; Chen, S.; Lyu, W.; Yang, F.; Yu, C. IJK complex detection within BCG signal based on multi-core fiber sensors. In Proceedings of the Asia Communications and Photonics Conference/International Conference on Information Photonics and Optical Communications 2020 (ACP/IPOC), Beijing, China, 24–27 October 2020; p. S3G-3. [Google Scholar]
  48. Ang, K.H.; Chong, G.; Li, Y. PID control system analysis, design, and technology. IEEE Trans. Control Syst. Technol. 2005, 13, 559–576. [Google Scholar]
  49. Cheshire, W.P., Jr. Thermoregulatory disorders and illness related to heat and cold stress. Auton. Neurosci. 2016, 196, 91–104. [Google Scholar] [CrossRef] [Green Version]
  50. Kovoor, P.; Ricciardello, M.; Collins, L.; Uther, J.B.; Ross, D.L. Risk to patients from radiation associated with radiofrequency ablation for supraventricular tachycardia. Circulation 1998, 98, 1534–1540. [Google Scholar] [CrossRef]
  51. Hajar, R. Risk factors for coronary artery disease: Historical perspectives. Heart Views 2017, 18, 109–114. [Google Scholar] [CrossRef] [PubMed]
  52. Julius, S.; Palatini, P.; Nesbitt, S.D. Tachycardia: An important determinant of coronary risk in hypertension. J. Hypertens. Suppl. 1998, 16, S9–S15. [Google Scholar]
  53. Stein, P.K.; Rich, M.W.; Rottman, J.N.; Kleiger, R.E. Stability of index of heart rate variability in patients with congestive heart failure. Am. Heart J. 1995, 129, 975–981. [Google Scholar] [CrossRef]
  54. Burger, A.J.; Charlamb, M.; Weinrauch, L.A.; D’Elia, J.A. Short-and long-term reproducibility of heart rate variability in patients with long-standing type I diabetes mellitus. Am. J. Cardiol. 1997, 80, 1198–1202. [Google Scholar] [CrossRef]
  55. Ewing, D.J.; Neilson, J.M.; Shapiro, C.M.; Stewart, J.A.; Reid, W. Twenty four hour heart rate variability: Effects of posture, sleep, and time of day in healthy controls and 5 Ballistocardiography 153 comparison with bedside tests of autonomic function in diabetic patients. Br. Heart J. 1991, 65, 239–244. [Google Scholar] [CrossRef] [Green Version]
  56. Konrady, A.O.; Rudomanov, O.G.; Yacovleva, O.I.; Shlyakhto, E.V. Power spectral components of heart rate variability in different types of cardiac remodelling in hypertensive patients. Med. Sci. Monit. 2001, 7, 58–63. [Google Scholar] [PubMed]
  57. Kleiger, R.E.; Miller, J.P.; Bigger, J.T., Jr.; Moss, A.J. Decreased heart rate variability and its association with increased mortality after acute myocardial infarction. Am. J. Cardiol. 1987, 59, 256–262. [Google Scholar] [CrossRef]
  58. Życzkowski, M.; Szustakowski, M.; Ciurapiński, W.; Uziębło-Życzkowska, B. Interferometric fiber optics based sensor for monitoring of the heart activity. Acta Phys. Pol. A 2011, 120, 782–784. [Google Scholar] [CrossRef]
  59. Sprager, S.; Donlagic, D.; Zazula, D. Estimation of heart rate, respiratory rate and motion by using optical interferometer as body sensor. In Proceedings of the Proceedings of the IASTED International Conference on Signal and Image Processing, Dallas, TX, USA, 14–16 December 2011; pp. 280–287. [Google Scholar]
  60. Tran, V.P.; Al-Jumaily, A.A. Non-contact real-time estimation of intrapulmonary pressure and tidal volume for chronic heart failure patients. In Proceedings of the 2016 38th Annual International Conference of the IEEE Engineering in Medicine and Biology Society (EMBC), Orlando, FL, USA, 16–20 August 2016; pp. 3564–3567. [Google Scholar]
  61. Voscopoulos, C.; Ladd, D.; Campana, L.; George, E. Non-invasive respiratory volume monitoring to detect apnea in post-operative patients: Case series. J. Clin. Med. Res. 2014, 6, 209. [Google Scholar] [CrossRef] [Green Version]
  62. Kermit, M.; Eide, Å.J.; Lindblad, T.; Waldemark, K. Treatment of obstructive sleep apnea syndrome by monitoring patients airflow signals. Pattern Recognit. Lett. 2000, 21, 277–281. [Google Scholar] [CrossRef]
  63. Leonard, P.; Beattie, T.; Addison, P.; Watson, J. Standard pulse oximeters can be used to monitor respiratory rate. Emerg. Med. J. 2003, 20, 524–525. [Google Scholar] [CrossRef] [Green Version]
  64. Sayadi, O.; Weiss, E.H.; Merchant, F.M.; Puppala, D.; Armoundas, A.A. An optimized method for estimating the tidal volume from intracardiac or body surface electrocardiographic signals: Implications for estimating minute ventilation. Am. J. Physiol.-Heart Circ. Physiol. 2014, 307, H426–H436. [Google Scholar] [CrossRef] [PubMed]
  65. Lafortuna, C.L.; Passerini, L. A new instrument for the measurement of rib cage and abdomen circumference variation in respiration at rest and during exercise. Eur. J. Appl. Physiol. Occup. Physiol. 1995, 71, 259–265. [Google Scholar] [CrossRef]
  66. Reyes, B.A.; Reljin, N.; Kong, Y.; Nam, Y.; Chon, K.H. Tidal volume and instantaneous respiration rate estimation using a volumetric surrogate signal acquired via a smartphone camera. IEEE J. Biomed. Health Inform. 2016, 21, 764–777. [Google Scholar] [CrossRef]
  67. Fraser, A.G.; Angelini, G.D.; Ikram, S.; Butchart, E.G. Left atrial ball thrombus: Echocardiographic features and clinical implications. Eur. Heart J. 1988, 9, 672–677. [Google Scholar] [CrossRef] [PubMed]
  68. Lewis, R.P.; Rittogers, S.E.; Froester, W.F.; Boudoulas, H. A critical review of the systolic time intervals. Circulation 1977, 56, 146–158. [Google Scholar] [CrossRef] [Green Version]
  69. Forouzanfar, M.; Baker, F.C.; Colrain, I.M.; Goldstone, A.; de Zambotti, M. Automatic analysis of pre-ejection period during sleep using impedance cardiogram. Psychophysiology 2019, 56, e13355. [Google Scholar] [CrossRef] [PubMed]
  70. Etemadi, M.; Inan, O.T.; Giovangrandi, L.; Kovacs, G.T. Rapid assessment of cardiac contractility on a home bathroom scale. IEEE Trans. Inf. Technol. Biomed. 2011, 15, 864–869. [Google Scholar] [CrossRef]
  71. Huang, K.; Shen, Y.; Zhang, F.; Wang, S.; Wei, X. Evaluation of effects of thymidylate synthase and excision repair cross-complementing 1 polymorphisms on chemotherapy outcome in patients with gastrointestinal tumors using peripheral venous blood. Oncol. Lett. 2016, 11, 3477–3482. [Google Scholar] [CrossRef] [PubMed] [Green Version]
  72. Onseng, K.; Johns, N.P.; Khuayjarernpanishk, T.; Subongkot, S.; Priprem, A.; Hurst, C.; Johns, J. Beneficial effects of adjuvant melatonin in minimizing oral mucositis complications in head and neck cancer patients receiving concurrent chemoradiation. J. Altern. Complement. Med. 2017, 23, 957–963. [Google Scholar] [CrossRef] [PubMed]
  73. Young, J.S.; Simmons, J.W. Chemotherapeutic medications and their emergent complications. Emerg. Med. Clin. 2014, 32, 563–578. [Google Scholar] [CrossRef] [PubMed]
Figure 1. (a) Structure of optical fiber Mach–Zehnder interferometer; (b) Structure of optical fiber SI based on PMF; (c) Structure of optical fiber Michelson interferometer; (d) Structure of optical fiber Fabry–Perot interferometer.
Photonics 09 00050 g001
Figure 2. (a)The schematic diagram of FMF in-line interferometers based on the structure of SMF-FMF-SMF; (b) the schematic diagram of TCF in-line interferometer based on SMF-TCF-SMF; (c) the schematic diagram of SCF in-line interferometer based on the structure of SMF-MMF-SCF-MMF-SMF.
Photonics 09 00050 g002
Figure 3. Structure of PGC demodulation scheme-based vital signs monitoring system.
Photonics 09 00050 g003
Figure 4. Structure of closed loop control system based on a moving coil transducer.
Photonics 09 00050 g004
Figure 5. Optical fiber interferometer based on the 3 × 3 coupler demodulation scheme.
Photonics 09 00050 g005
Figure 6. Interferometric FOS based vital signs monitoring system.
Photonics 09 00050 g006
Figure 7. (a) Valsalva maneuver HR, (b) dynamic squat exercise HR, (c) running exercise HR, (d) paced respiration HR [12].
Photonics 09 00050 g007
Figure 8. BCG and ECG sleep signals [14].
Photonics 09 00050 g008
Figure 9. HR signals calculated from BCG and ECG [14].
Photonics 09 00050 g009
Figure 10. (a) Valsalva maneuver PEP, (b) dynamic squat exercise PEP, (c) running exercise PEP, (d) paced respiration PEP [12].
Photonics 09 00050 g010
Figure 11. The performance test results of the proposed sensor over four people [45].
Photonics 09 00050 g011
Table 1. The comparison of four interferometers for vital signs monitoring.
InterferometersManufacturingSizeCostFeasibility
Mach–Zehnder
interferometer
EasyLargeLowFeasible
Sagnac
interferometer
MediumLargeLowFeasible
Michelson
interferometer
MediumLargeLowFeasible
Fabry–Perot
interferometers
DifficultSmallHighFeasible
Publisher’s Note: MDPI stays neutral with regard to jurisdictional claims in published maps and institutional affiliations.

