Article

On Directly Modulated Reflective Semiconductor Optical Amplifier with Assistance of Birefringent Fiber Loop

by
Fokion N. Karadimoglou
1,
Kyriakos E. Zoiros
1,
Zoe V. Rizou
2,* and
Antonios Hatziefremidis
3
1
Lightwave Communications Research Group, Department of Electrical and Computer Engineering, Democritus University of Thrace, 67 100 Xanthi, Greece
2
Department of Electrical and Computer Engineering, University of Western Macedonia, 50 131 Kozani, Greece
3
Department of Aerospace Science and Technology, National Kapodistrian University of Athens, 34 400 Psahna, Evias, Greece
*
Author to whom correspondence should be addressed.
Photonics 2022, 9(3), 147; https://doi.org/10.3390/photonics9030147
Submission received: 31 January 2022 / Revised: 25 February 2022 / Accepted: 26 February 2022 / Published: 2 March 2022

Abstract

:
Reflective Semiconductor Optical Amplifiers (RSOAs) are essential devices for the development of new generation networks that rely on the convergence of optical and RF communications. Despite their proven potential for direct modulation, RSOAs’ electro-optic response is limited by their finite bandwidth, which hinders their employment both for signal amplification and modulation at the data rates envisioned by the target applications. In this paper, we elaborate on exploiting a Birefringent Fiber Loop (BFL) to enhance the operation of RSOAs as intensity modulators. We apply a mathematically and computationally reduced model to simulate the RSOA response in the time domain, and correlate it with that of the BFL in the frequency domain. We validate the model’s predictions by an extensive comparison of the simulation against experimental results. The reasonable theoretical findings allow us to establish the employed model as an efficient tool for describing electrically driven RSOA operation and its improvement by means of optical notch filtering. Furthermore, we evaluate and quantify the performance of the scheme and the potential range of RSOA direct modulation capability extension enabled by the BFL, which complies with the experimentally observed trends. The outcomes of this thorough study highlight the BFL supportive role in rendering feasible RSOAs’ direct modulation at data rates beyond those deemed possible by their nominal modulation bandwidth.

1. Introduction

Reflective Semiconductor Optical Amplifiers (RSOAs) constitute operation- and cost-effective transceivers for data amplification and modulation required in full-duplex optical access networks [1], radio over fiber systems [2] and microwave photonics [3]. These applications benefit from RSOAs’ attractive features, which include wavelength-agile broadband operation, high gain at low driving currents, high modulation linearity, bidirectional signal propagation inside the same active cavity, ability for remote seeding, and a versatile fiber interface [4]. Still, RSOAs’ electro-optical (E/O) modulation bandwidths and maximum supported bit rate are limited by the finite and relatively long carrier lifetime of the gain medium, as observed experimentally [5] and verified theoretically [6]. Among the various methods that have been proposed to bypass this fundamental hurdle and enhance RSOAs’ direction modulation capability (see [7] and relevant references cited therein), optical equalization through filtering has attracted considerable research interest [8]. The reason for this fact is that the specific solution exploits the physical by-product that accompanies the direct modulation of RSOA, namely spectral broadening due to self-phase modulation (SPM) [9]. Thus, through the proper discrimination of the frequency components generated by this nonlinear effect, the impairments associated with them can be suppressed and the RSOA low modulation bandwidth can be compensated for. This approach is simple in concept, all-optical in nature, straightforward to apply, efficient in use and amenable to implementation by employing different technologies [10,11,12,13,14,15,16,17]. In this context, we have proposed applying the specific technique by means of a Birefringent Fiber Loop (BFL), which is characterized by the ease of construction from off-the-shelf fiber components, a potentially stable operation, and flexibly tunable characteristics, first to conventional SOAs [18,19,20] and more recently to RSOAs as well [21]. In this paper, we further elaborate on this topic with dual purpose: First, we aim to validate and establish a model for robustly simulating the operation of the RSOA-BFL combination. This is achieved by describing the RSOA response in the time domain using a mathematically and computationally reduced model [22,23], and correlating it with the BFL response in the frequency domain [24]. The model’s results are then extensively compared against the experimental ones reported in [21]. Second, we want to to assess and quantify the performance of the scheme and the potential range of RSOA bandwidth extension enabled by the BFL. The conducted study’s findings support our experimental observations, and together with our previous relevant works establish the BFL as a viable technological option for accelerating the response of directly modulated RSOAs towards better satisfying the increasing needs of RSOA target applications.

2. Setup and Modeling

2.1. Setup

Figure 1a shows the block diagram of a directly modulated RSOA followed by a serially connected BFL.
An electrical data signal induces through the RSOA impedance a peak current deviation, ± I m , superimposed on the RSOA fixed current, I d c , which is physically indispensable in order for the RSOA to function and chosen to lie on the linear part of the optical power-driving current (P-I) curve [25]. In this manner, the aggregate current is varied between an upper and a lower extreme from the dc bias, i.e., I d c + I m and I d c I m , respectively (Figure 1b). This variation alters analogously the RSOA gain, which is perceived by a lightwave beam of constant power in time, i.e., Continuous Wave (CW), after traveling twice inside the RSOA cavity. Accordingly, the RSOA driving the current modulation is mapped on the CW signal, which carries the original information but converted into optical form. Normally, an exact copy of the injected electrical signal should be transferred at the RSOA output. Nevertheless, because the RSOA modulation bandwidth is typically smaller than the equivalent bandwidth of the electrical excitation, the profile of the encoded signal after the RSOA is impaired (Figure 1c). A characteristic example of this is when the RSOA is modulated by non-return-to-zero (NRZ) data, which is the simplest data format. In this case, increasing the repetition rate, B r e p , quickly scales the equivalent bandwidth that equals half this quantity beyond the modulation bandwidth, B m o d , of the RSOA, which exhibits a low-pass filter response (Figure 1d) [26]. Thus, the key to allowing the RSOA to be modulated beyond its limited modulation bandwidth is to compensate for the RSOA response by a filter characteristic whose slope is in the opposite direction to that of the RSOA, i.e., high pass. This can be achieved by using a BFL right after the RSOA, whose comb-like response against the wavelength satisfies this requirement; i.e., the wavelength response maximum, λ m a x , is offset to the left-hand side of the encoded signal’s position, λ e n c , so that the transmission is decreased with increasing wavelength (Figure 1e). Equivalently, the BFL eliminates the lower-frequency components in the RSOA spectrum broadened due to SPM while leaving the higher-frequency ones, which are converted by the slope of the BFL spectral response into amplitude changes that counteract those at the RSOA output. As a result, the lack of uniformity between pulses of the same binary content and the poor distinction between pulses of different binary content is reduced. In this manner, the profile of the encoded signal becomes a closer replica of the digital information carried by the applied RSOA current (Figure 1f).

2.2. Modeling

2.2.1. RSOA Input

The RSOA receives from its optical input port a CW light beam of constant power P C W , while its total driving current, which results from the combination of the dc current and the current induced by a NRZ pseudorandom binary sequence (PRBS) of length N and repetition period T r e p = 1 / B r e p applied to the RSOA electrical interface, is expressed as
I ( t ) = ( I d c I m ) + 2 I m H ( t ) 1 e t 2 / t r 2 H ( t T ) 1 e ( t T ) 2 / t r 2
where H ( t ) is Heaviside step function, I d c , I m and the RSOA current at transparency, I 0 , define the modulation depth, I m / ( I d c I 0 ) , which is smaller than unity [27], and t r is the electrical pulse rise time, which is a small fraction of T p e r .

2.2.2. RSOA Response

The power of the encoded signal that exits the RSOA is expressed as
P R S O A ( t ) = | E R S O A ( t ) | 2
where the corresponding electric field, E R S O A ( t ) , which is normalized so that it represents power, is given by [23]
E R S O A ( t ) = P C W exp 1 j α L E F h t 2 L R S O A n g / c
where α L E F is the RSOA linewidth enhancement factor, L R S O A is the RSOA active region length, n g is the group refractive index of the semiconductor material and h ( t ) is the RSOA integrated gain response, which obeys the following one-dimensional ordinary differential equation [23]
d h ( t ) d t = h ( t ) Γ a N 0 L R S O A I ( t ) I 0 1 T c a r exp 2 h ( t ) 1 P s a t T c a r P C W
where Γ is RSOA confinement factor, a is RSOA differential gain, N 0 is RSOA carrier density at transparency, T c a r is RSOA carrier lifetime, I 0 is RSOA current required for transparency, and P s a t is RSOA material saturation power.

2.2.3. BFL Response

The BFL field transfer function, T B F L ( λ ) , is given by [24]
T B F L ( λ ) = exp [ j Ψ ( λ ) / 2 ] + j sin [ Ψ ( λ ) / 2 ]
where
Ψ ( λ ) = 2 π B L B F L / λ + Δ λ B L B F L / λ 2
In Equations (5) and (6), B and L B F L are the BFL’s birefringence and polarization maintaining (PM) fiber total length, respectively, which define the Free Spectral Range ( F S R ) of the BFL response, F S R = λ 2 / Β L B F L , and the BFL detuning defined as Δ λ = λ e n c λ n o t c h , where λ e n c is the spectral position of the input CW beam to be encoded and λ n o t c h ( F S R / 2 ) is that of the nearest notch. Since by physical principle λ e n c < λ n o t c h , this implies that Δ λ < 0 , with | Δ λ | [ 0 , F S R / 2 ] .

2.2.4. RSOA-BFL Output

The power of the encoded signal that emerges from the RSOA and BFL cascade is derived by convolving the RSOA output from (3) with the BFL response from (5). Since (5) is wavelength dependent while (3) is time dependent, it is necessary to transfer (3) in the spectral domain and subsequently convert the convolution product back in the time domain. This is achieved by taking the Fourier transform and its inverse, respectively, as follows:
E B F L ( t ) = F 1 { F E R S O A ( t ) T B F L ( λ ) }
where E B F L ( t ) is the electric field of the encoded signal at the BFL output, while the operators F{.} and F 1 {.} stand for the Fast Fourier Transform (FFT) and Inverse FFT, respectively, which are both available and executed in Matlab. Finally, the power of the encoded signal after the BFL is
P B F L ( t ) = | E B F L ( t ) | 2

2.2.5. Solution

Equation (4) is solved using Euler’s numerical method, with the initial conditions h ( t = 0 ) = Γ a N 0 [ ( I d c / I 0 ) 1 ] L R S O A , to calculate the electric field of the encoded signal at the RSOA output from (3). The knowledge of E R S O A ( t ) and of T B F L ( λ ) from (5) allows us to find E B F L ( t ) from (7). This process is conducted for the optical input, electrical data, RSOA and BFL default parameters values listed in Table 1.
In particular, the value of the RSOA carrier lifetime is extracted by setting the 3 dB cut-off frequency of the RSOA E/O response, which is given by the following closed-form expression [23]
f 3 d B = 3 2 π T c a r 1 + W 2 P C W P s a t exp 2 g ¯ 0 L R S O A + 2 P C W P s a t
where W[.] is Lambert’s function available in Matlab [17,29] and g 0 = Γ a N 0 { [ ( I d c I m ) / I 0 ] 1 } is the RSOA steady-state gain coefficient, equal to the measured one, 0.89 GHz, then solving for T c a r .

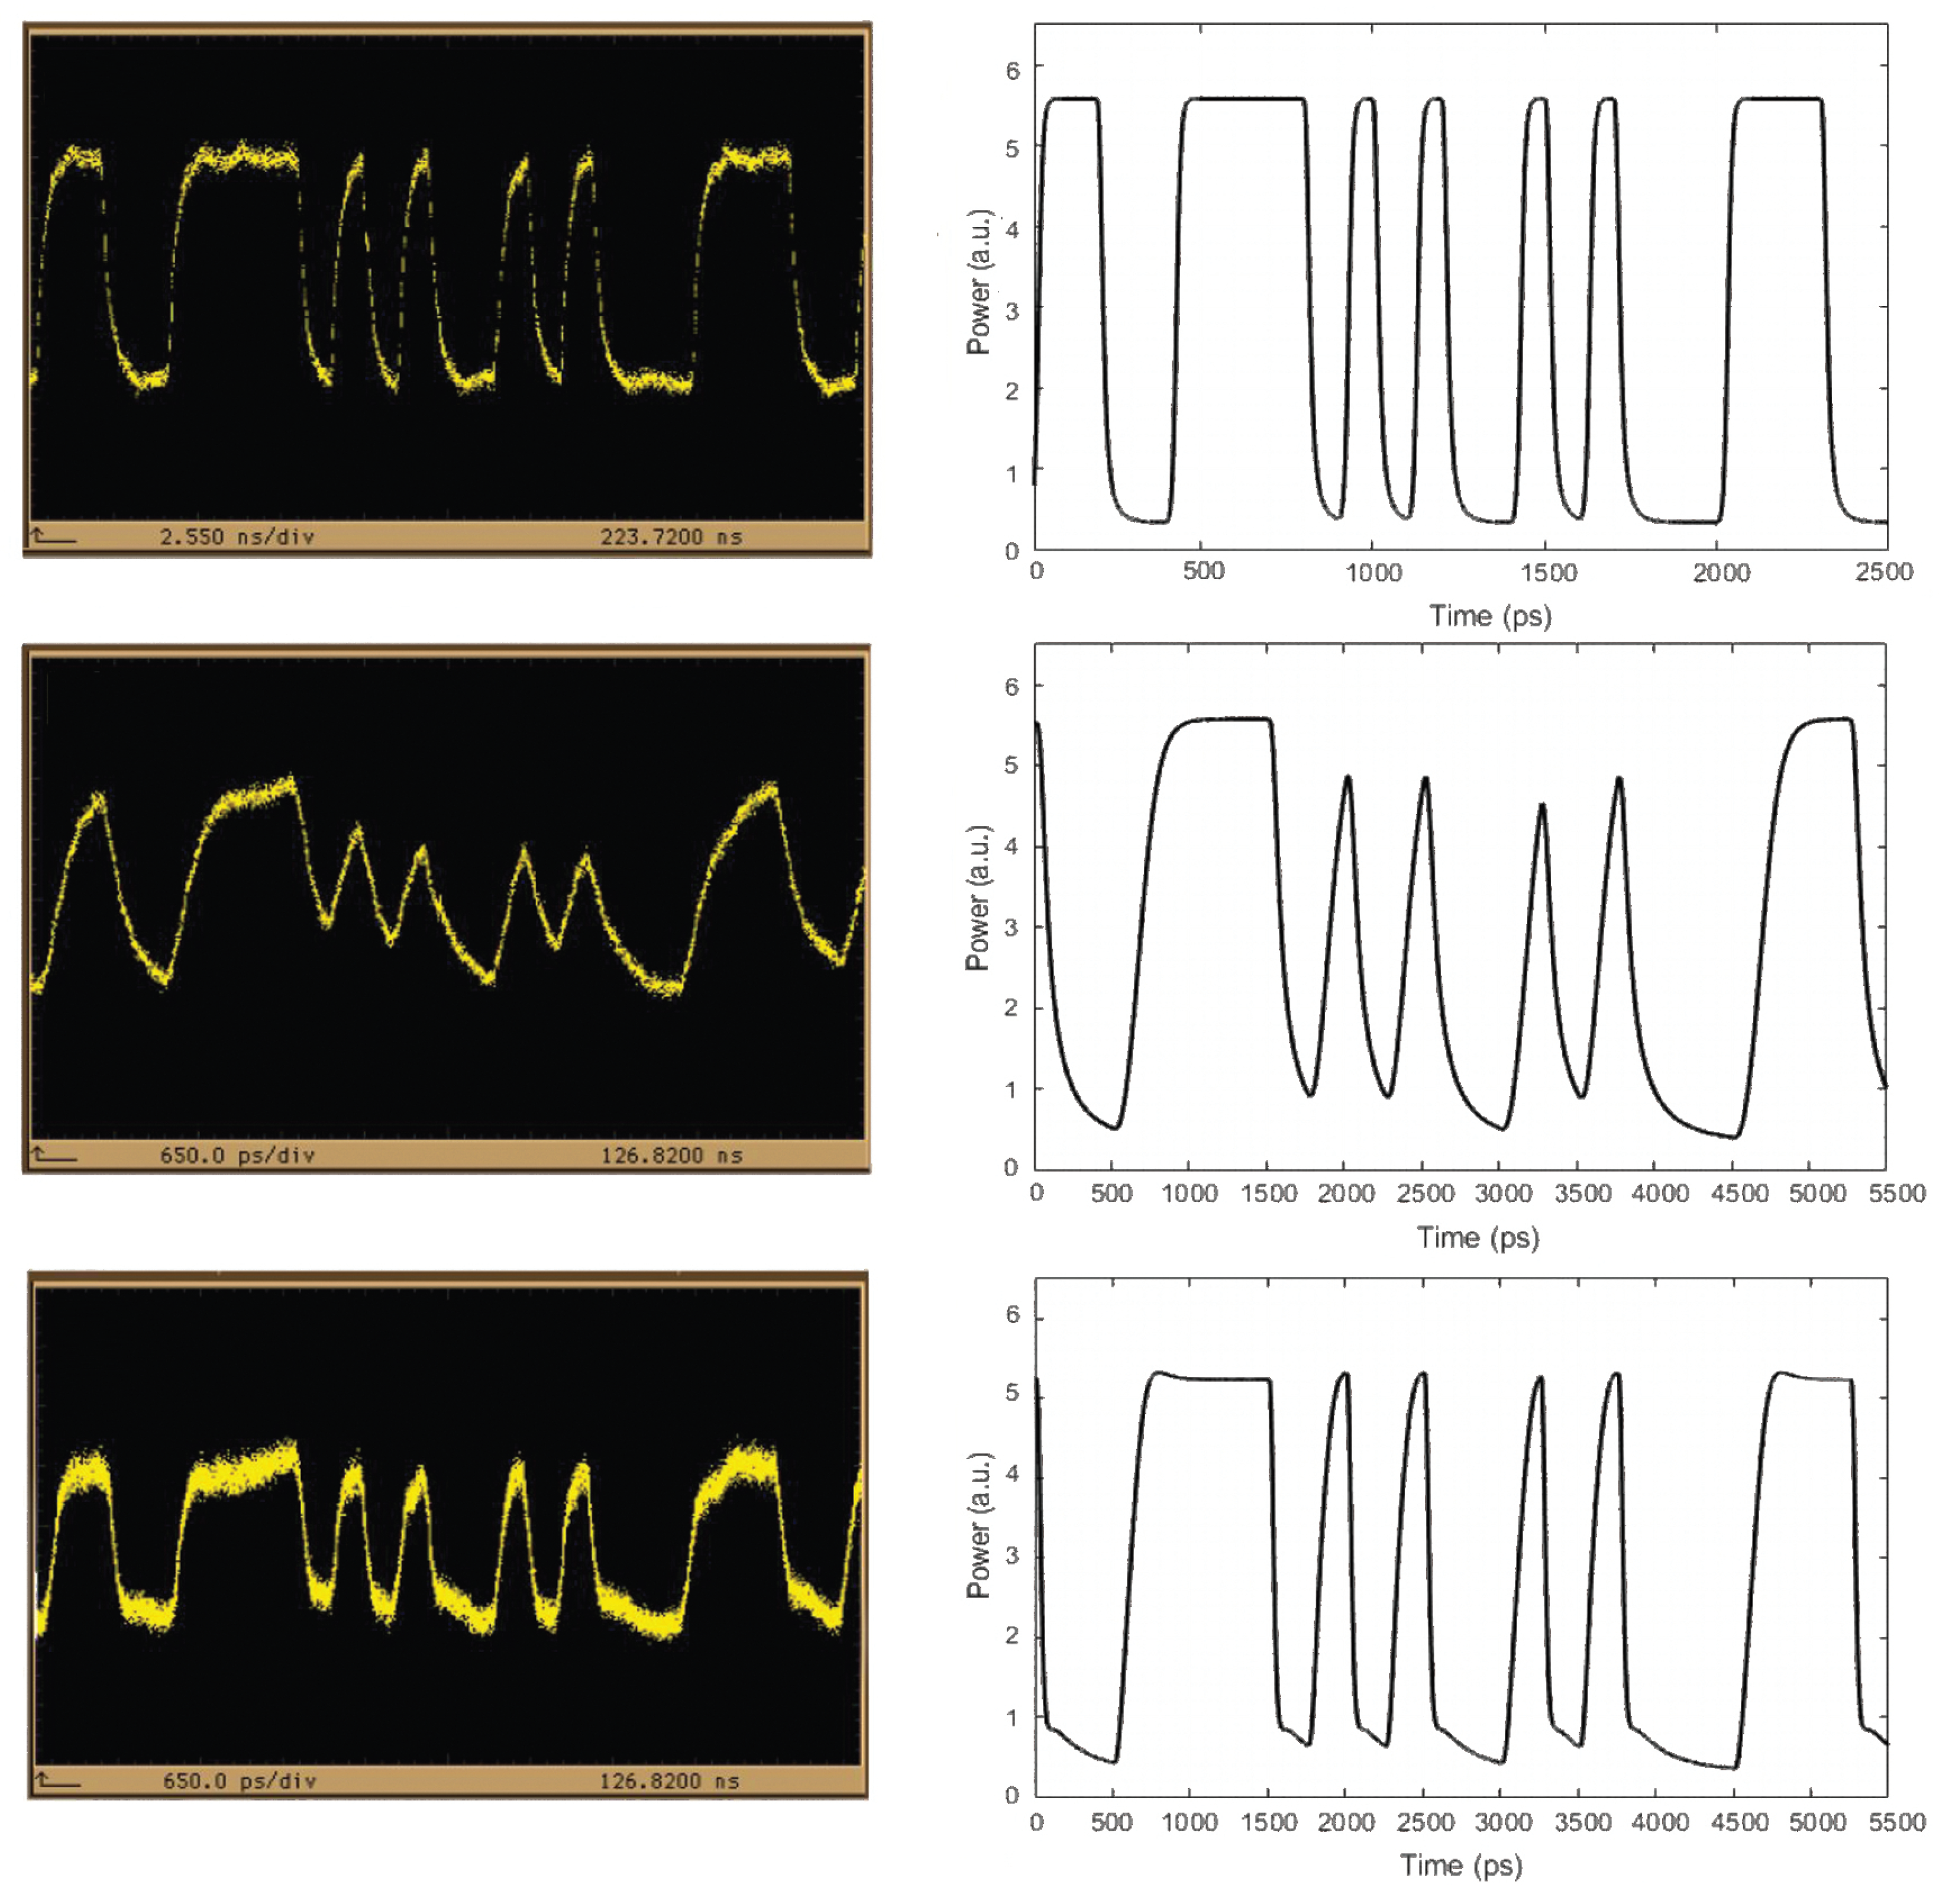
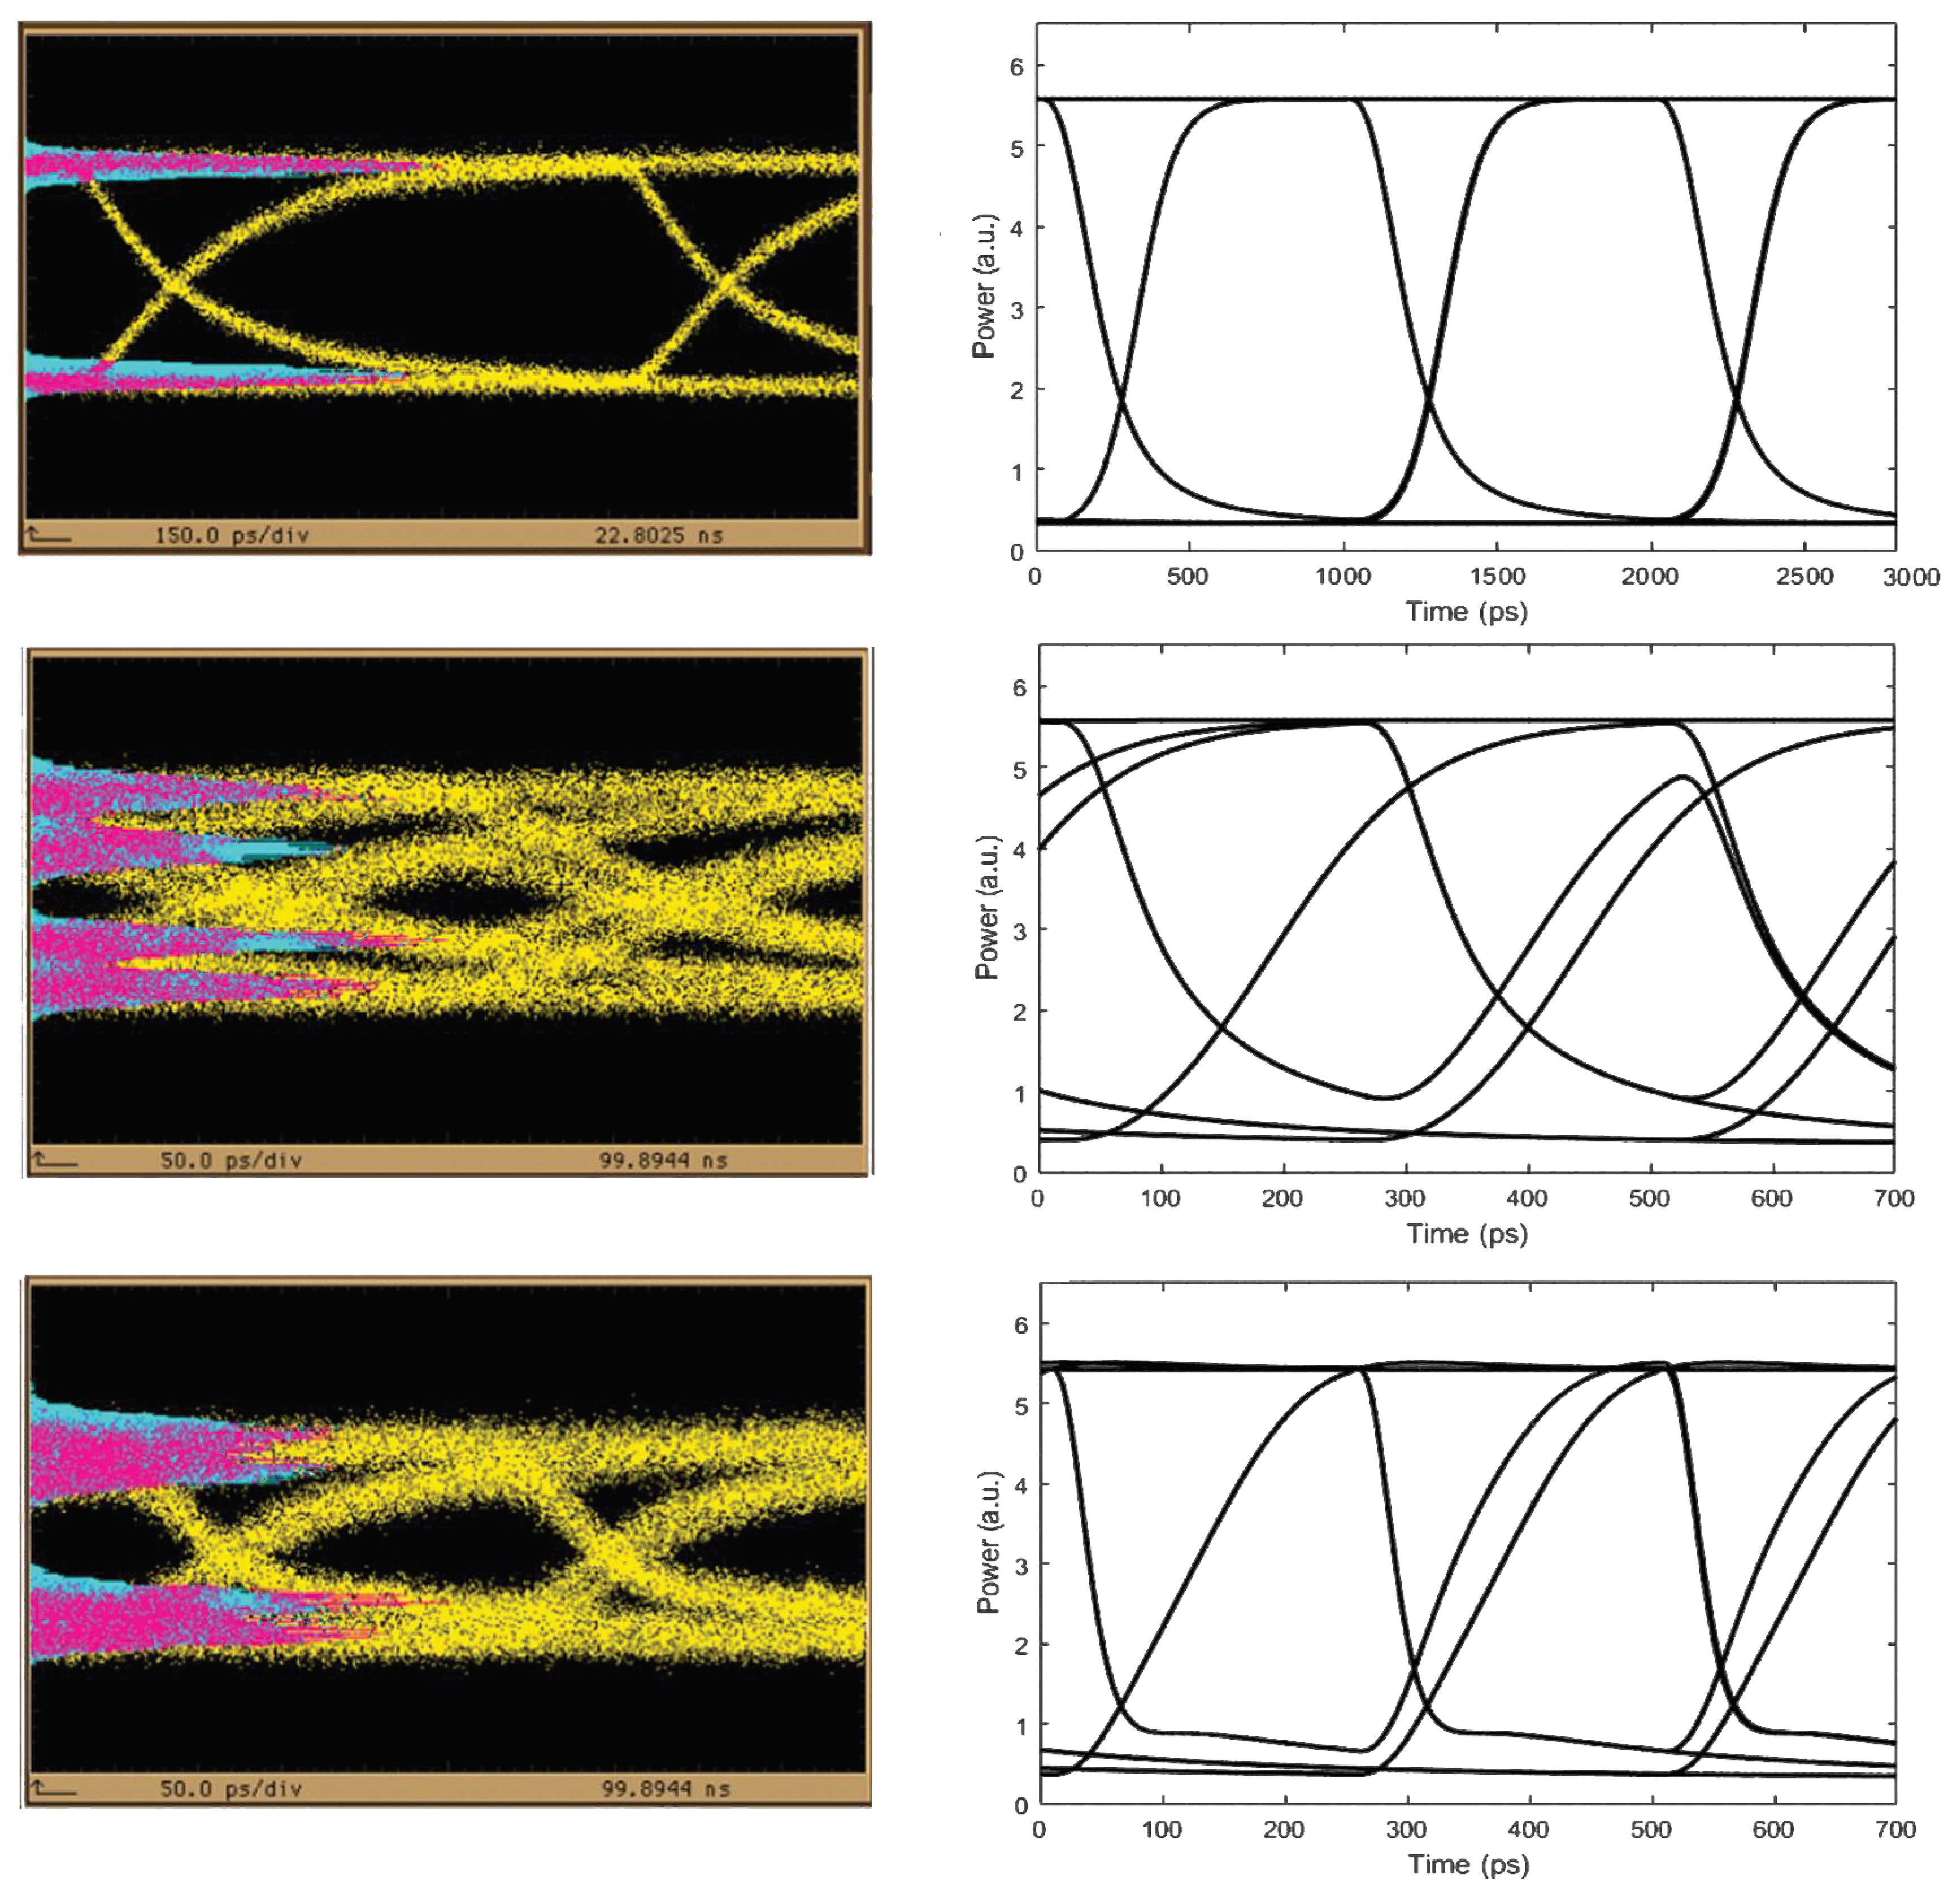
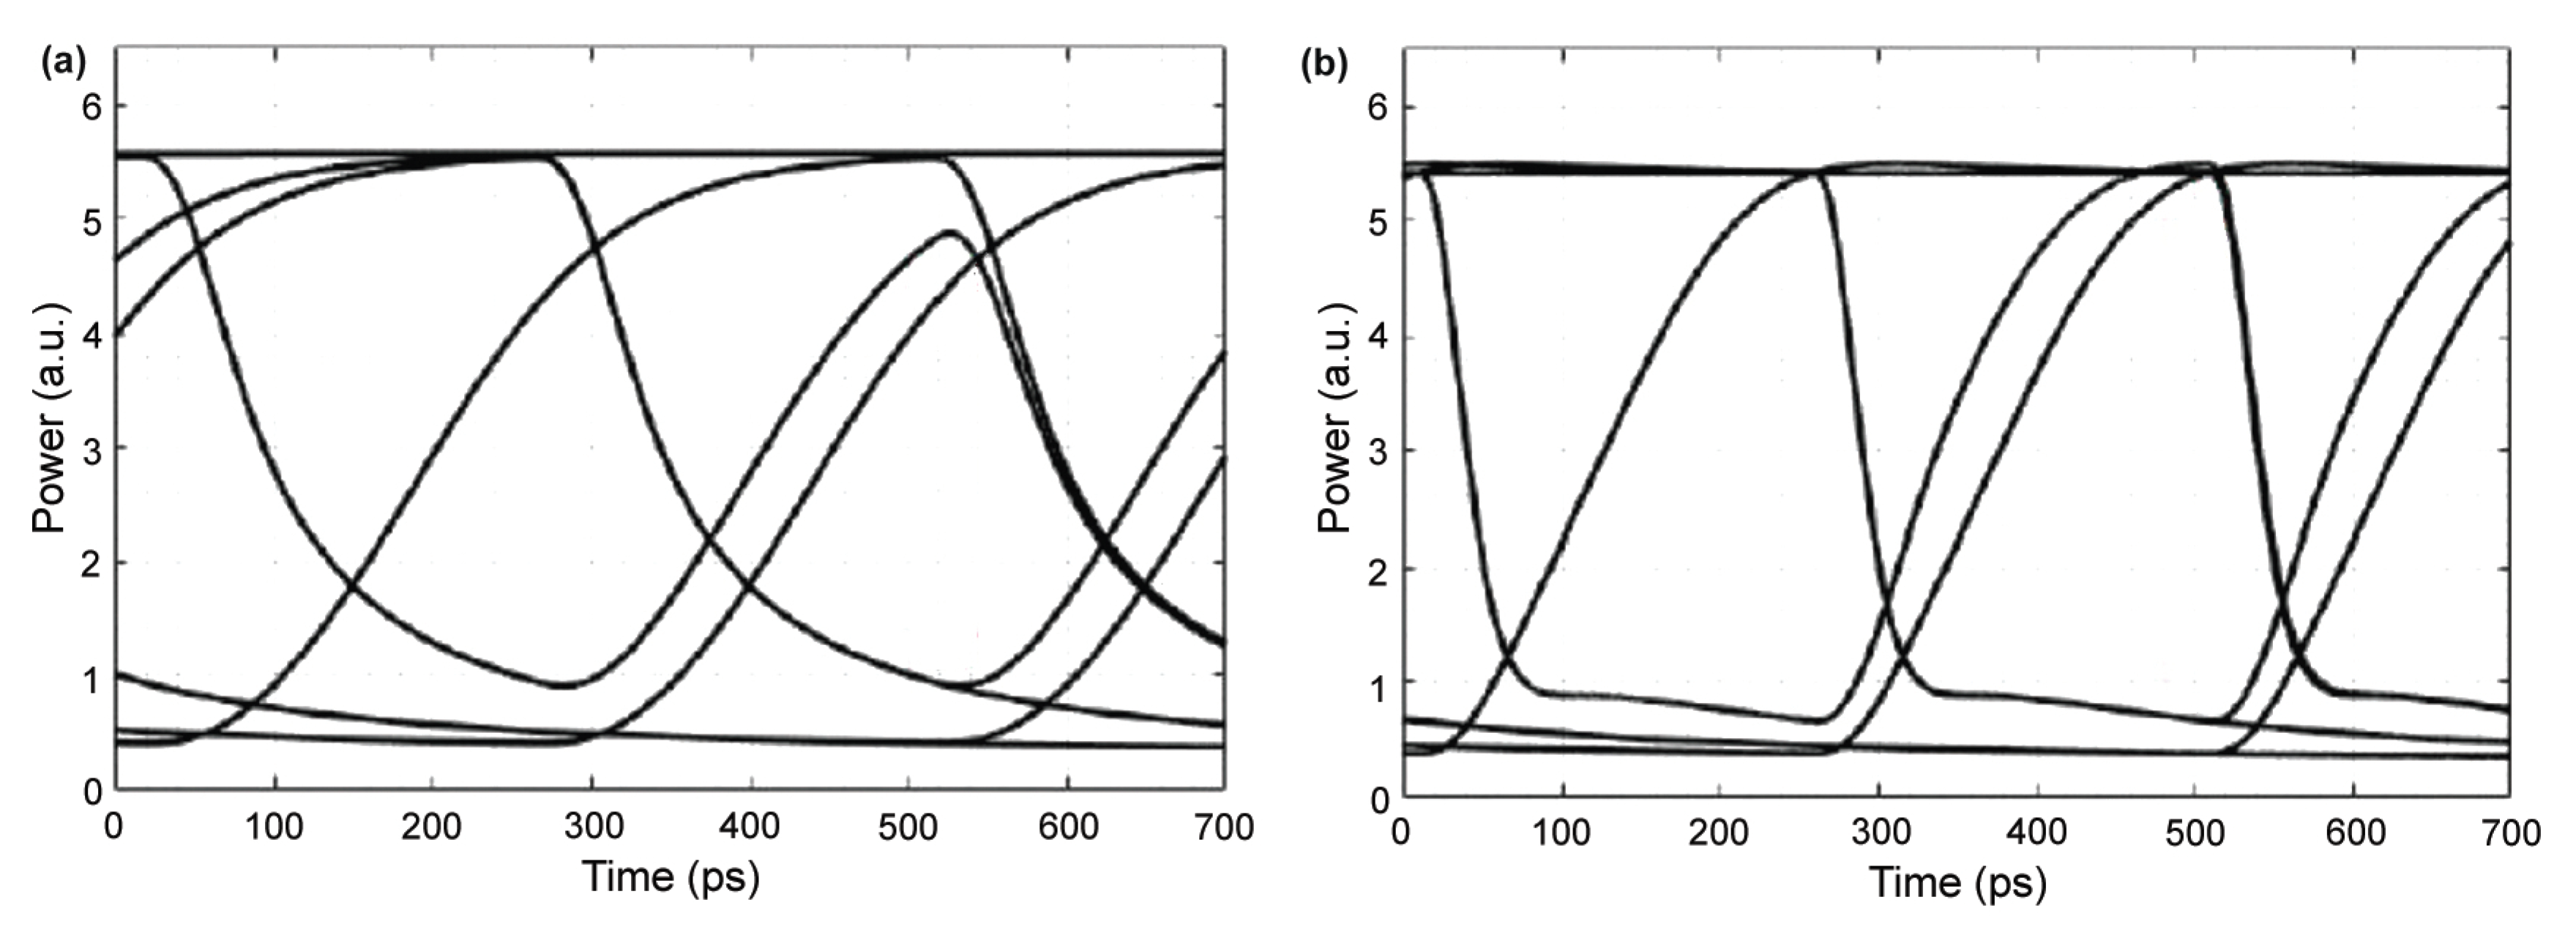
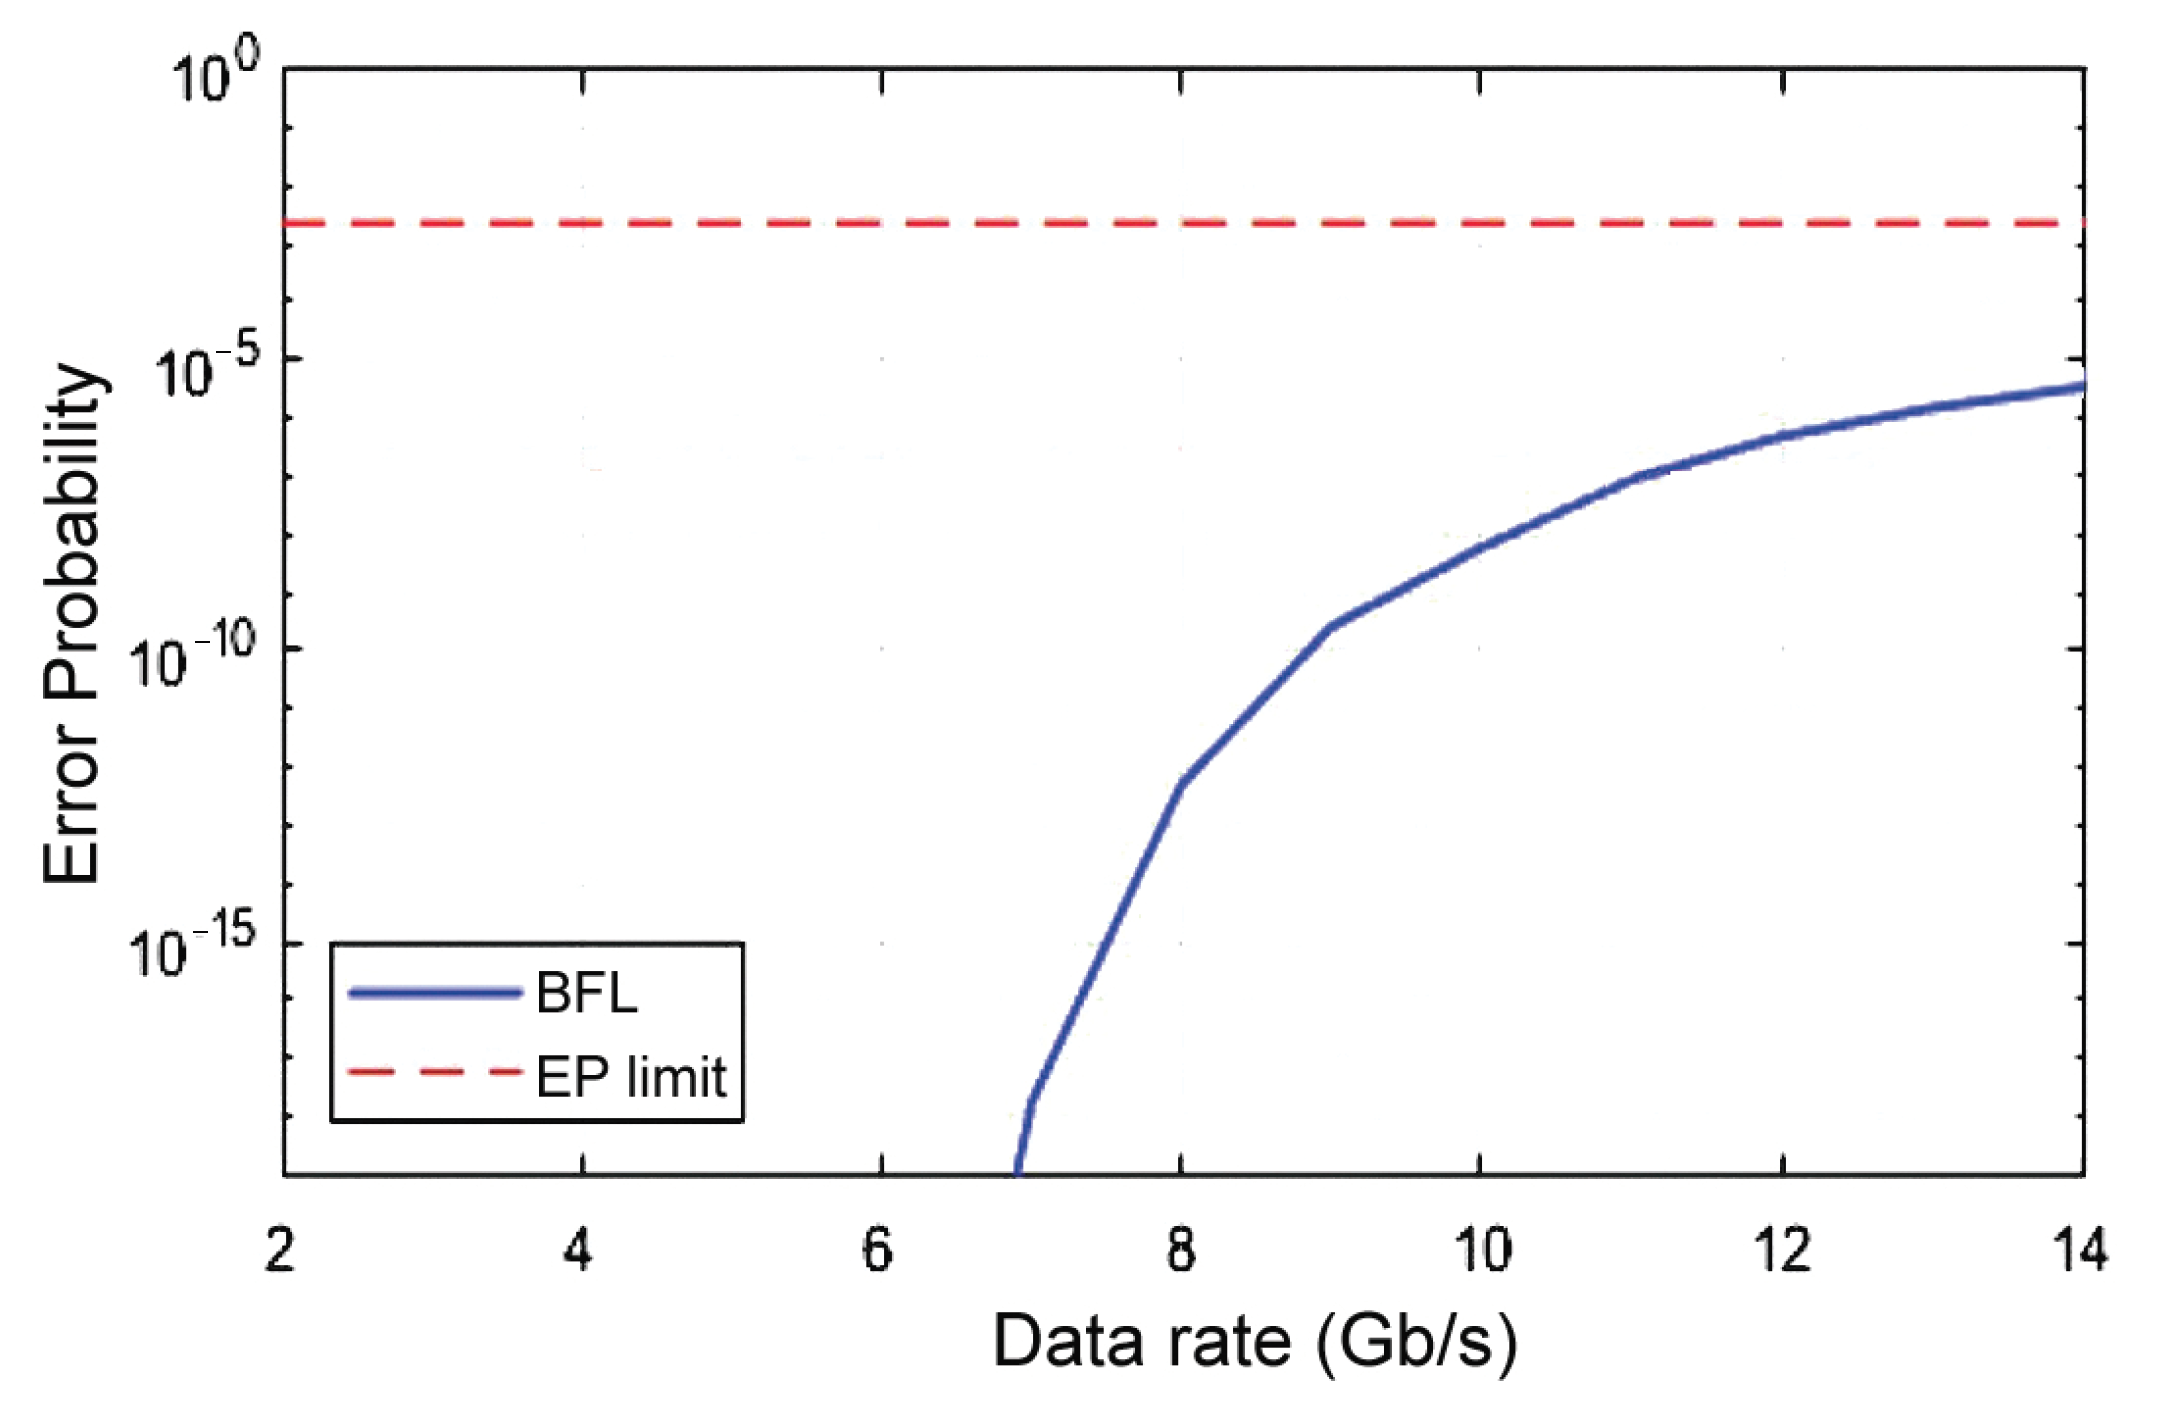
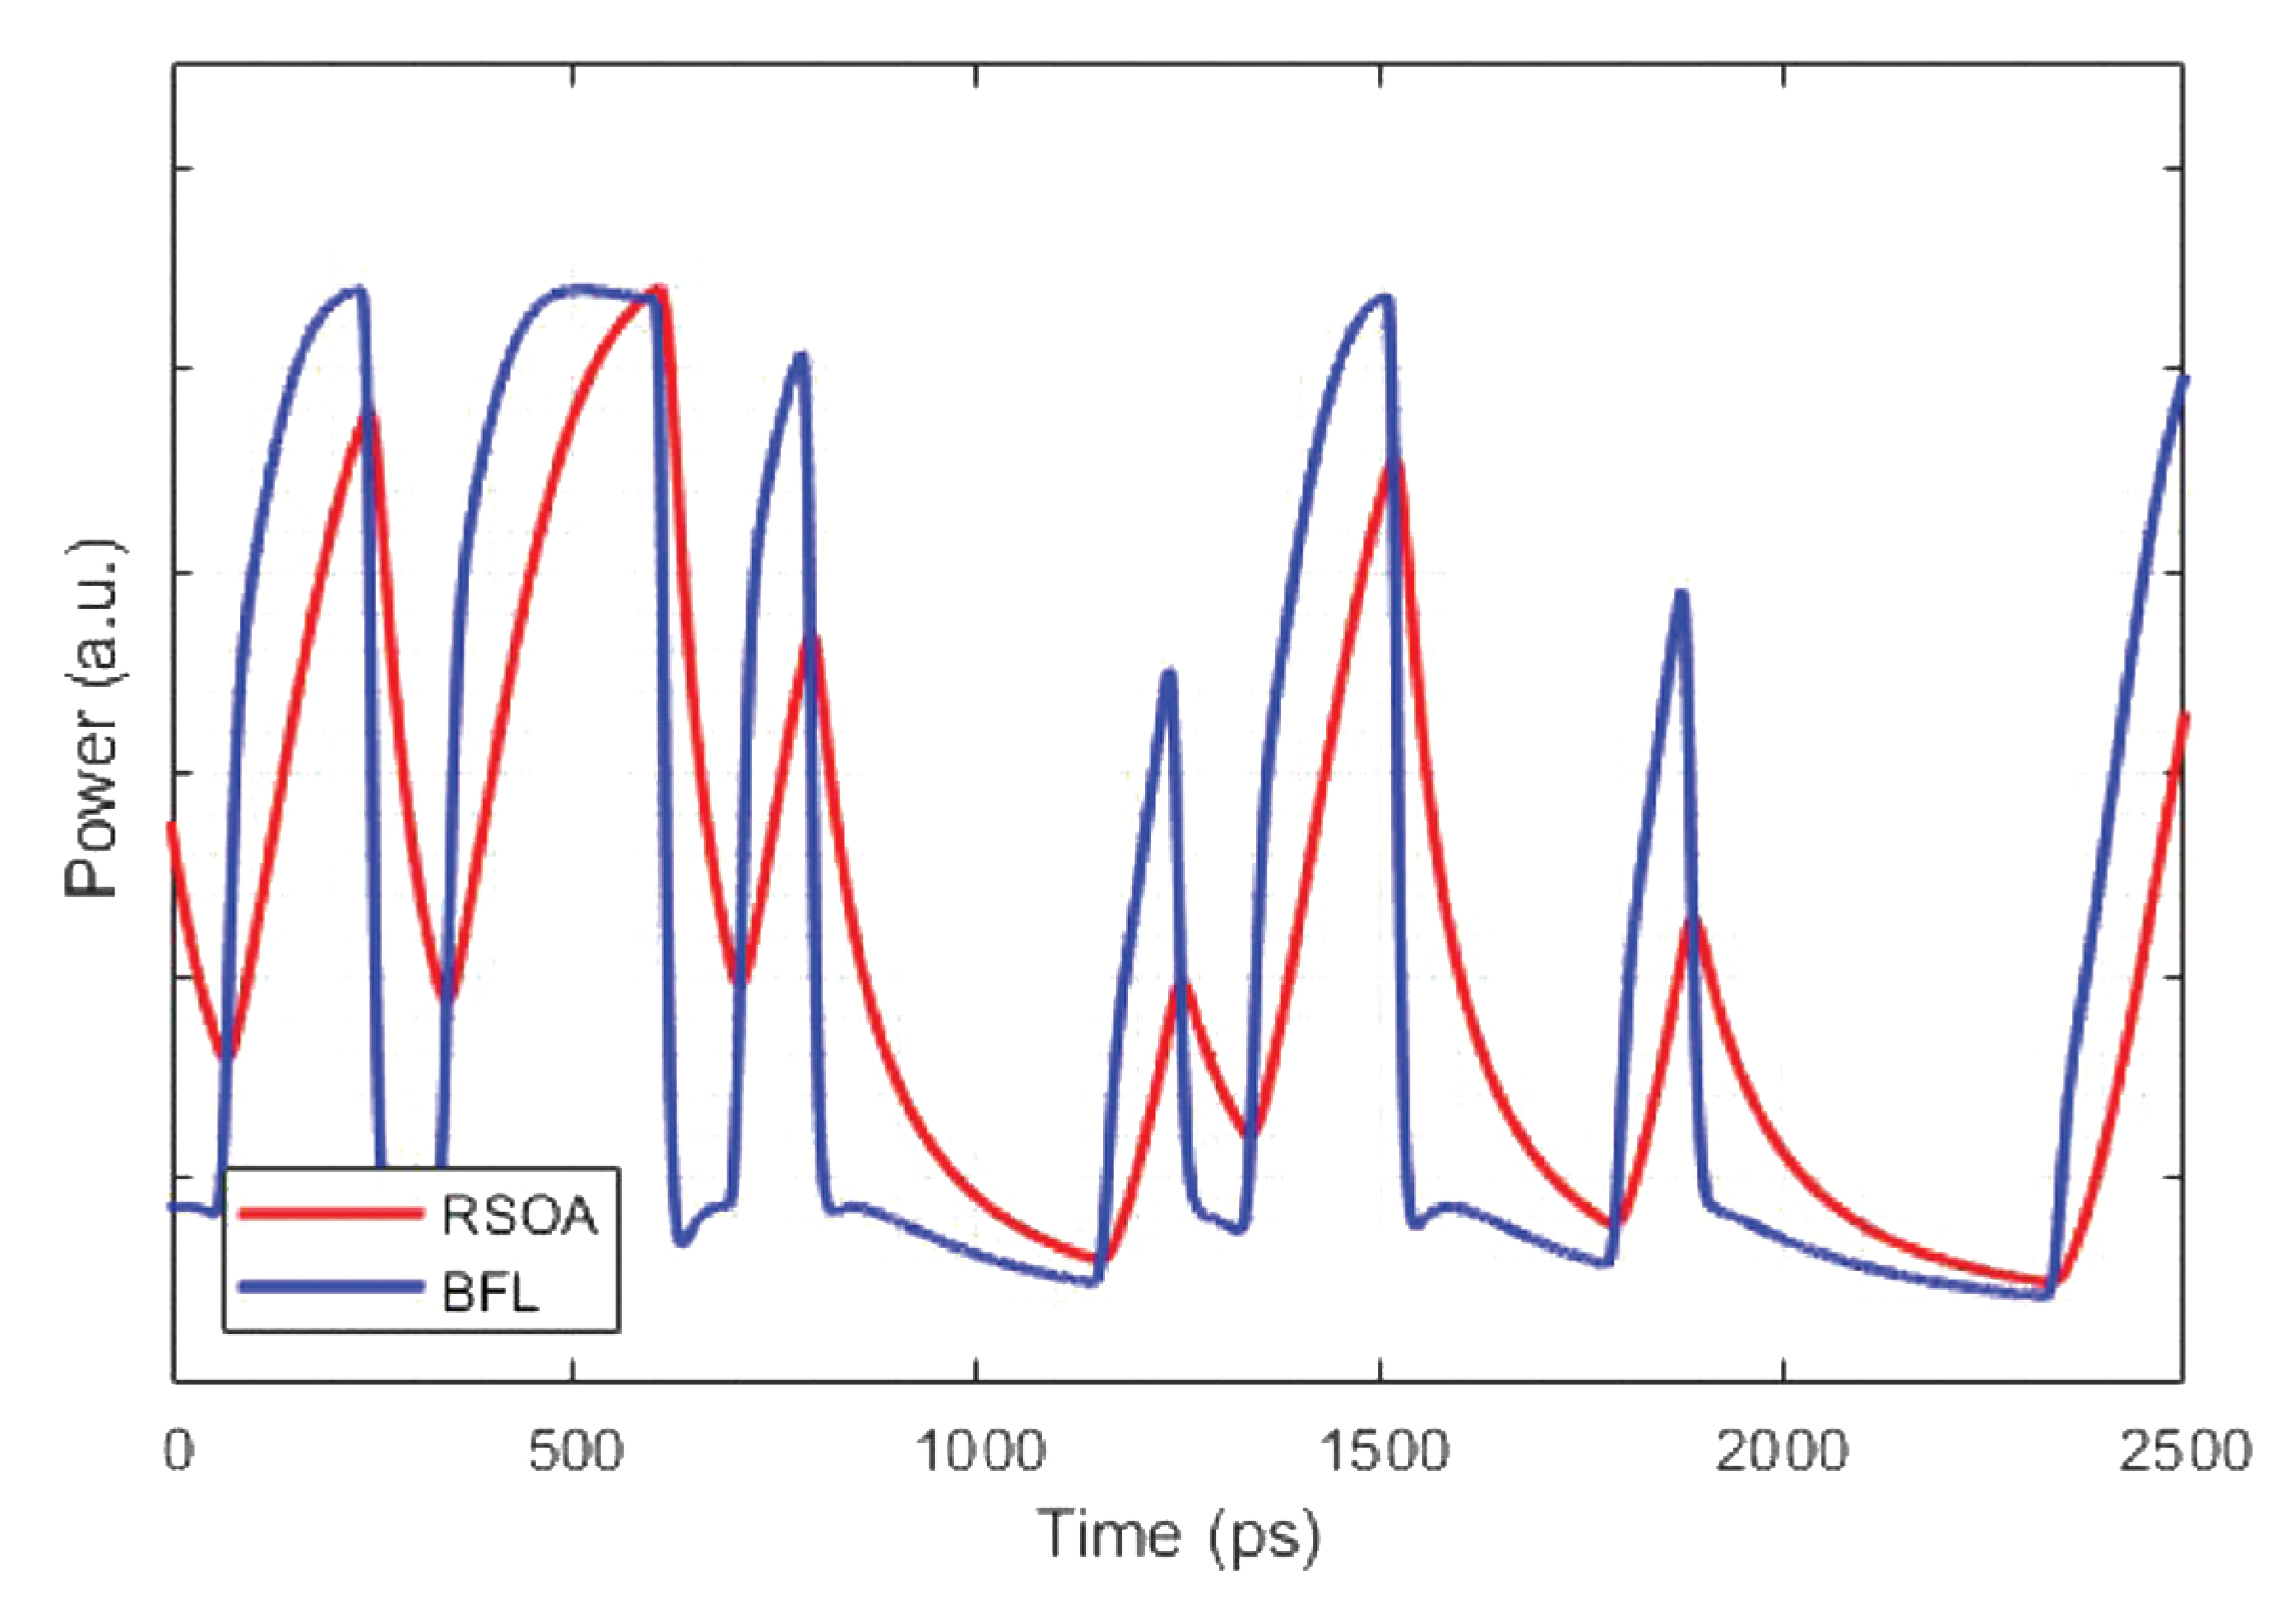
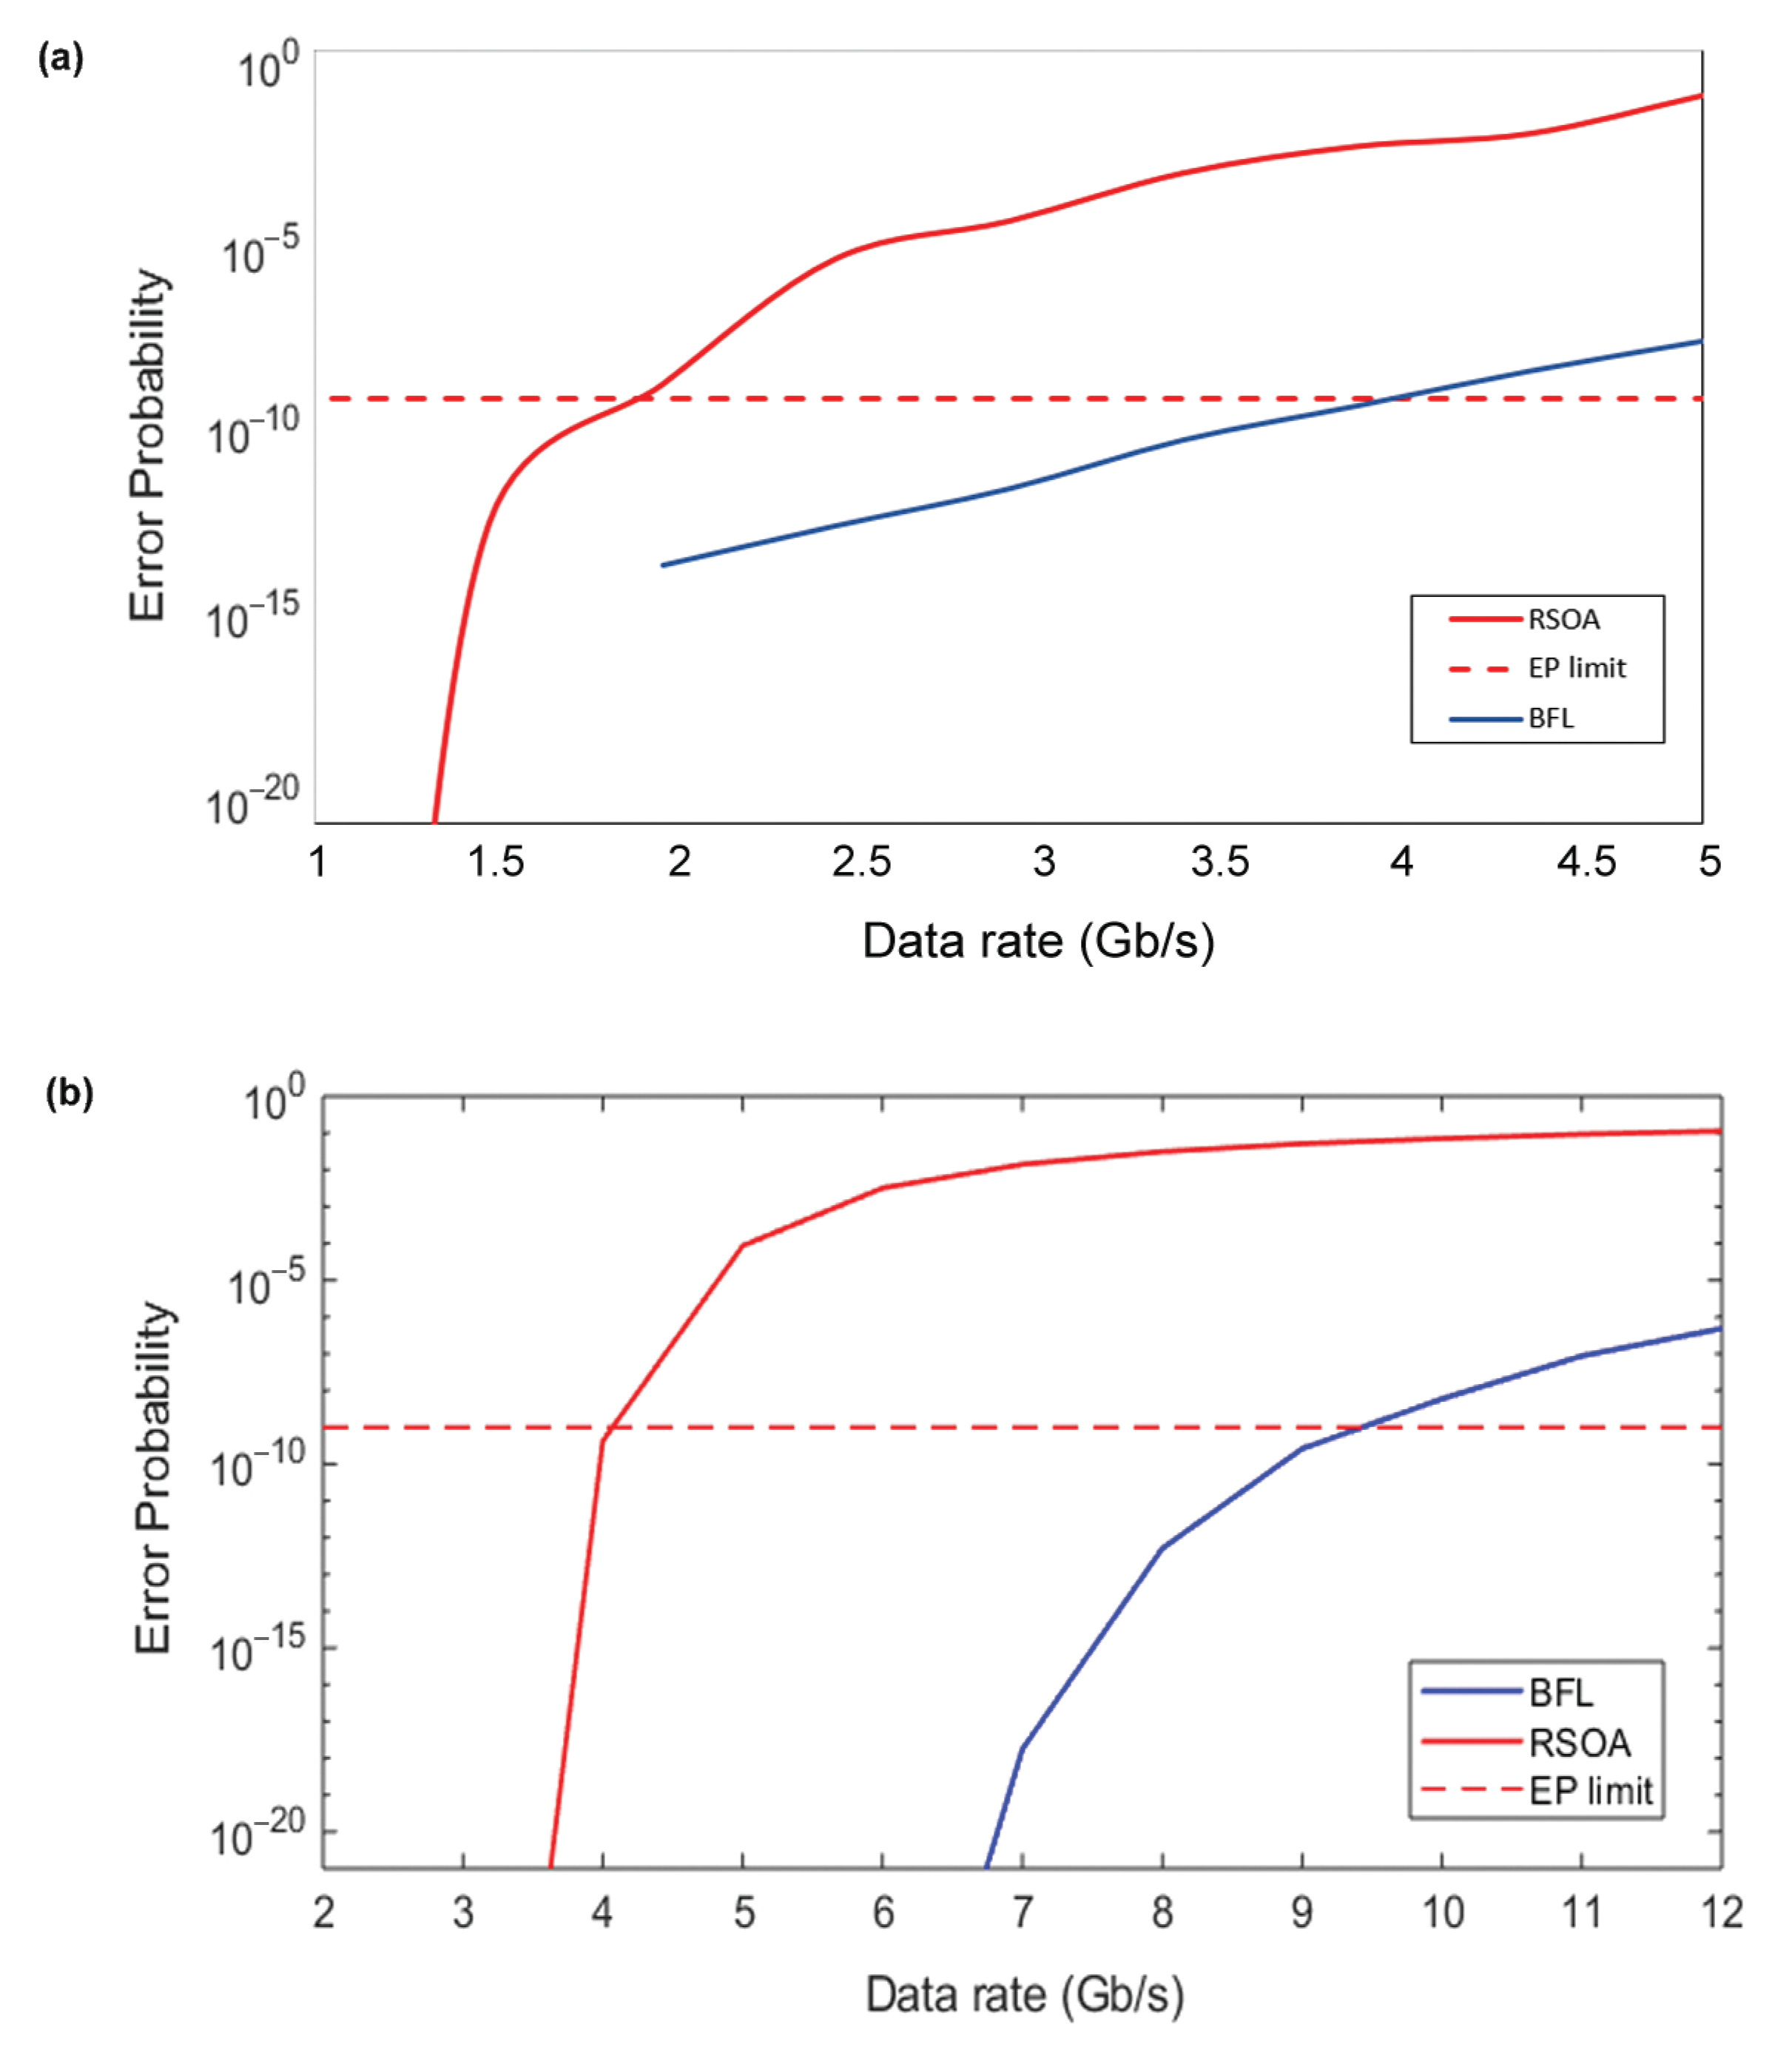
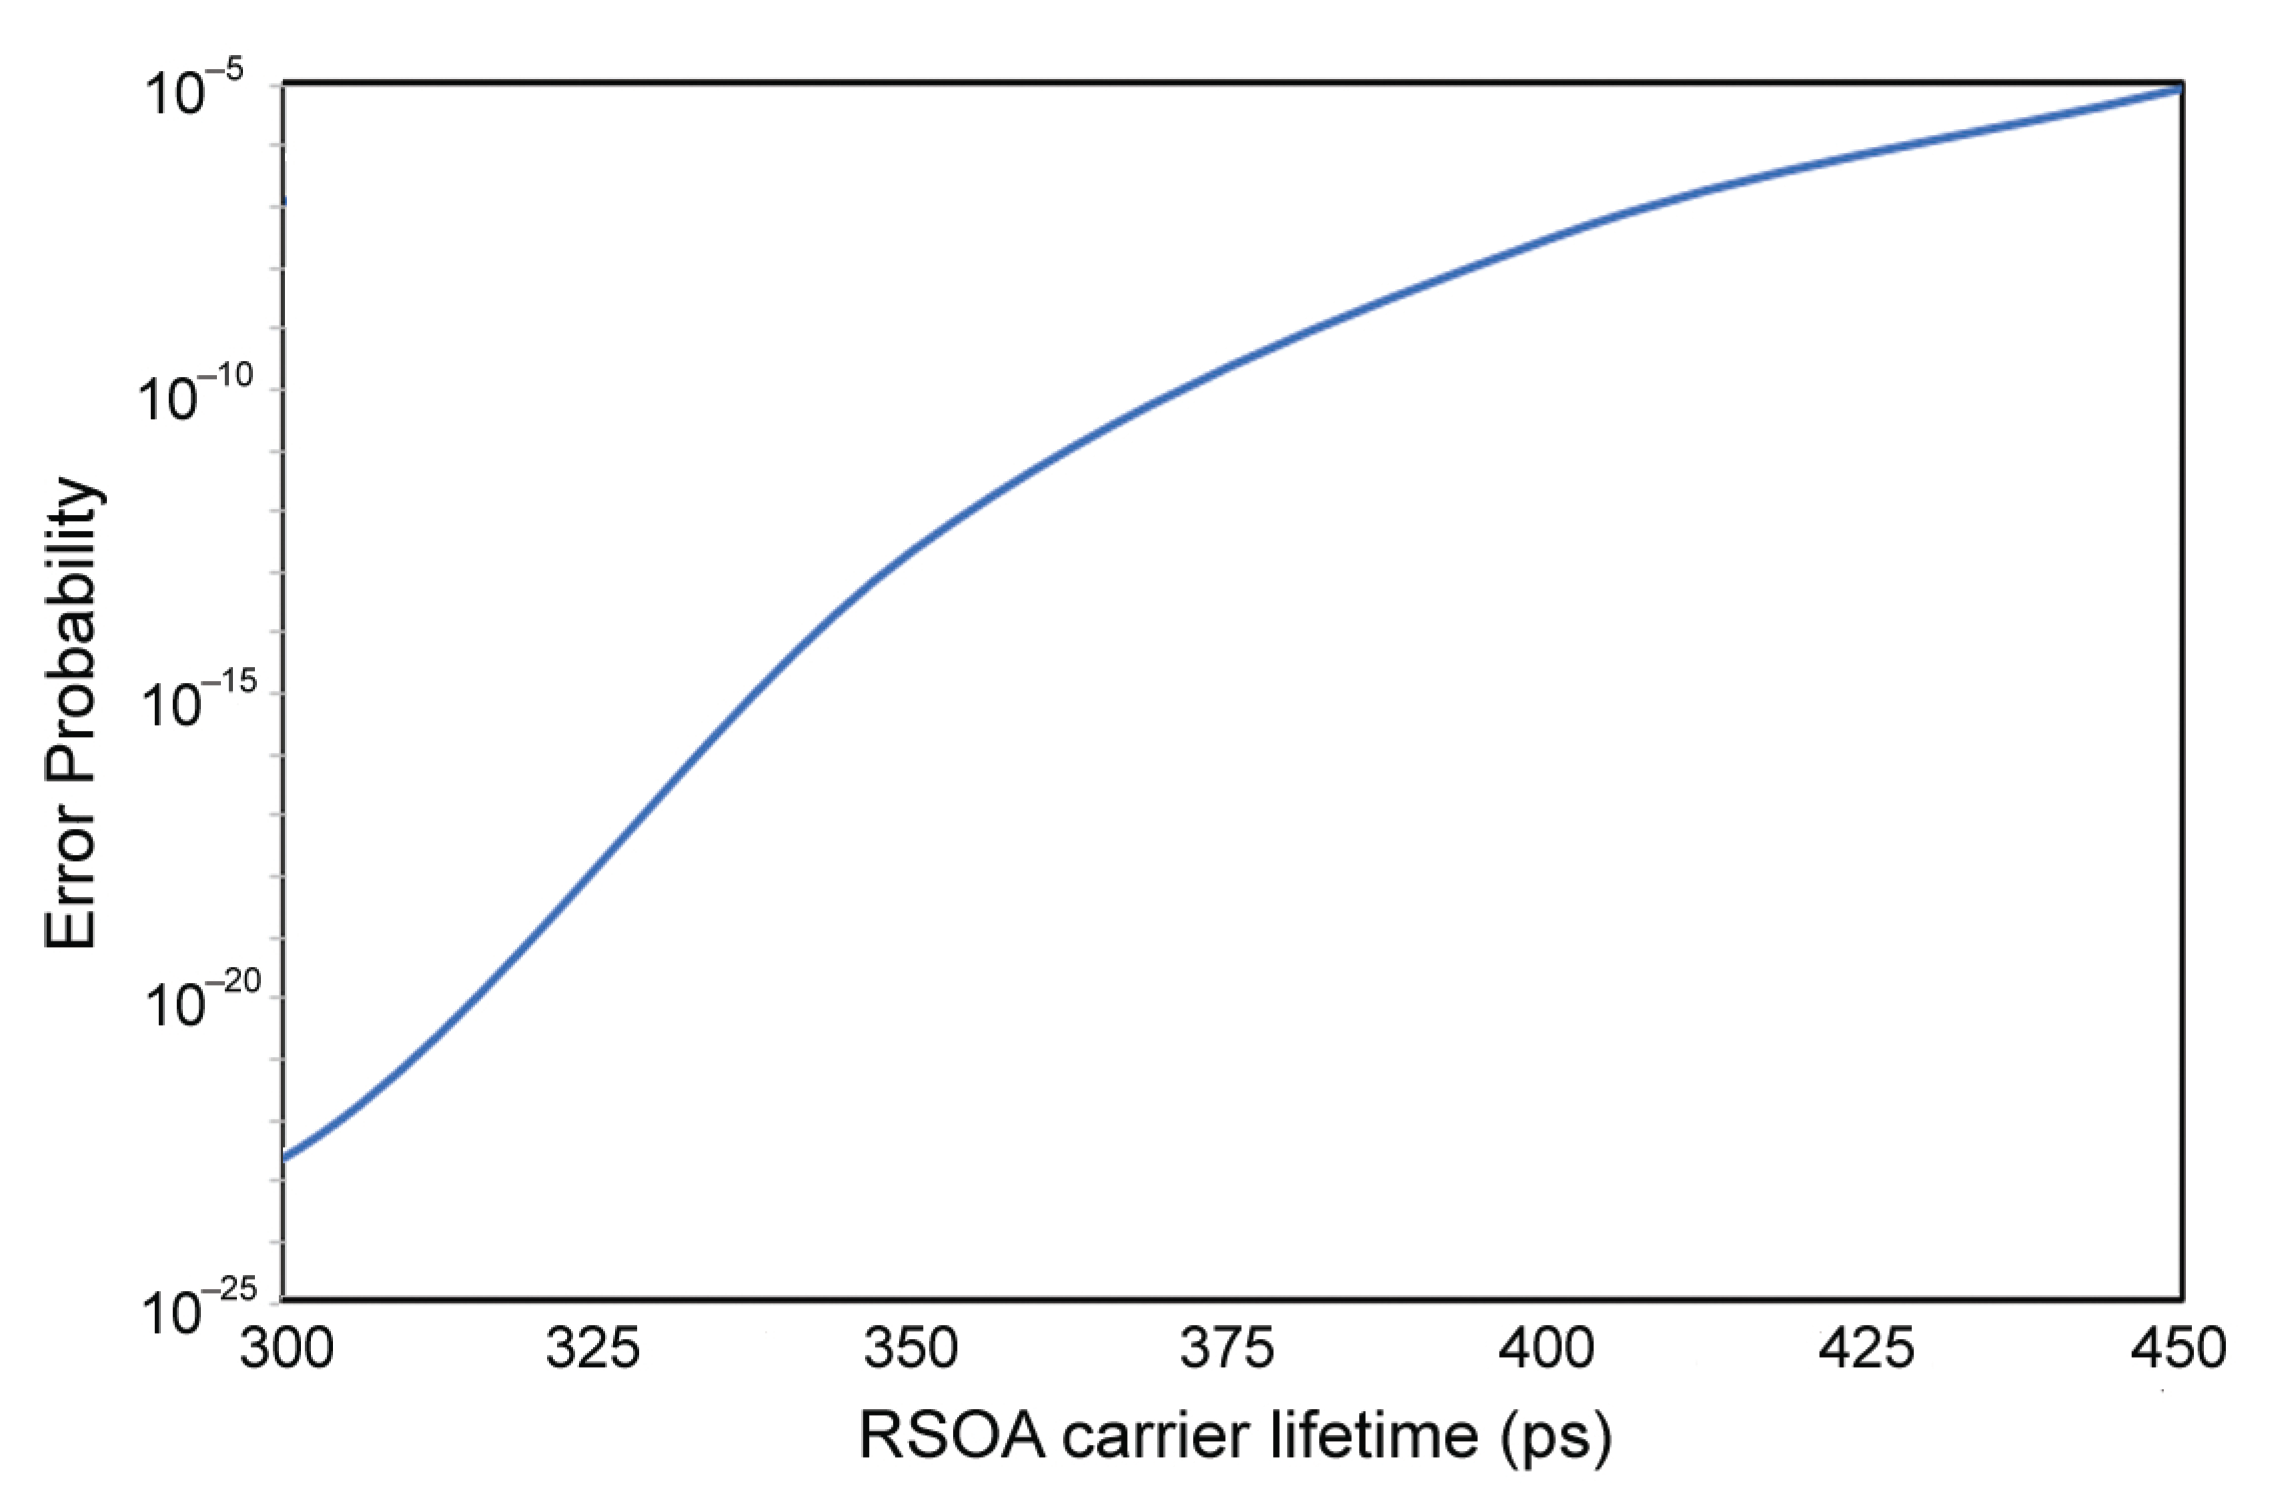
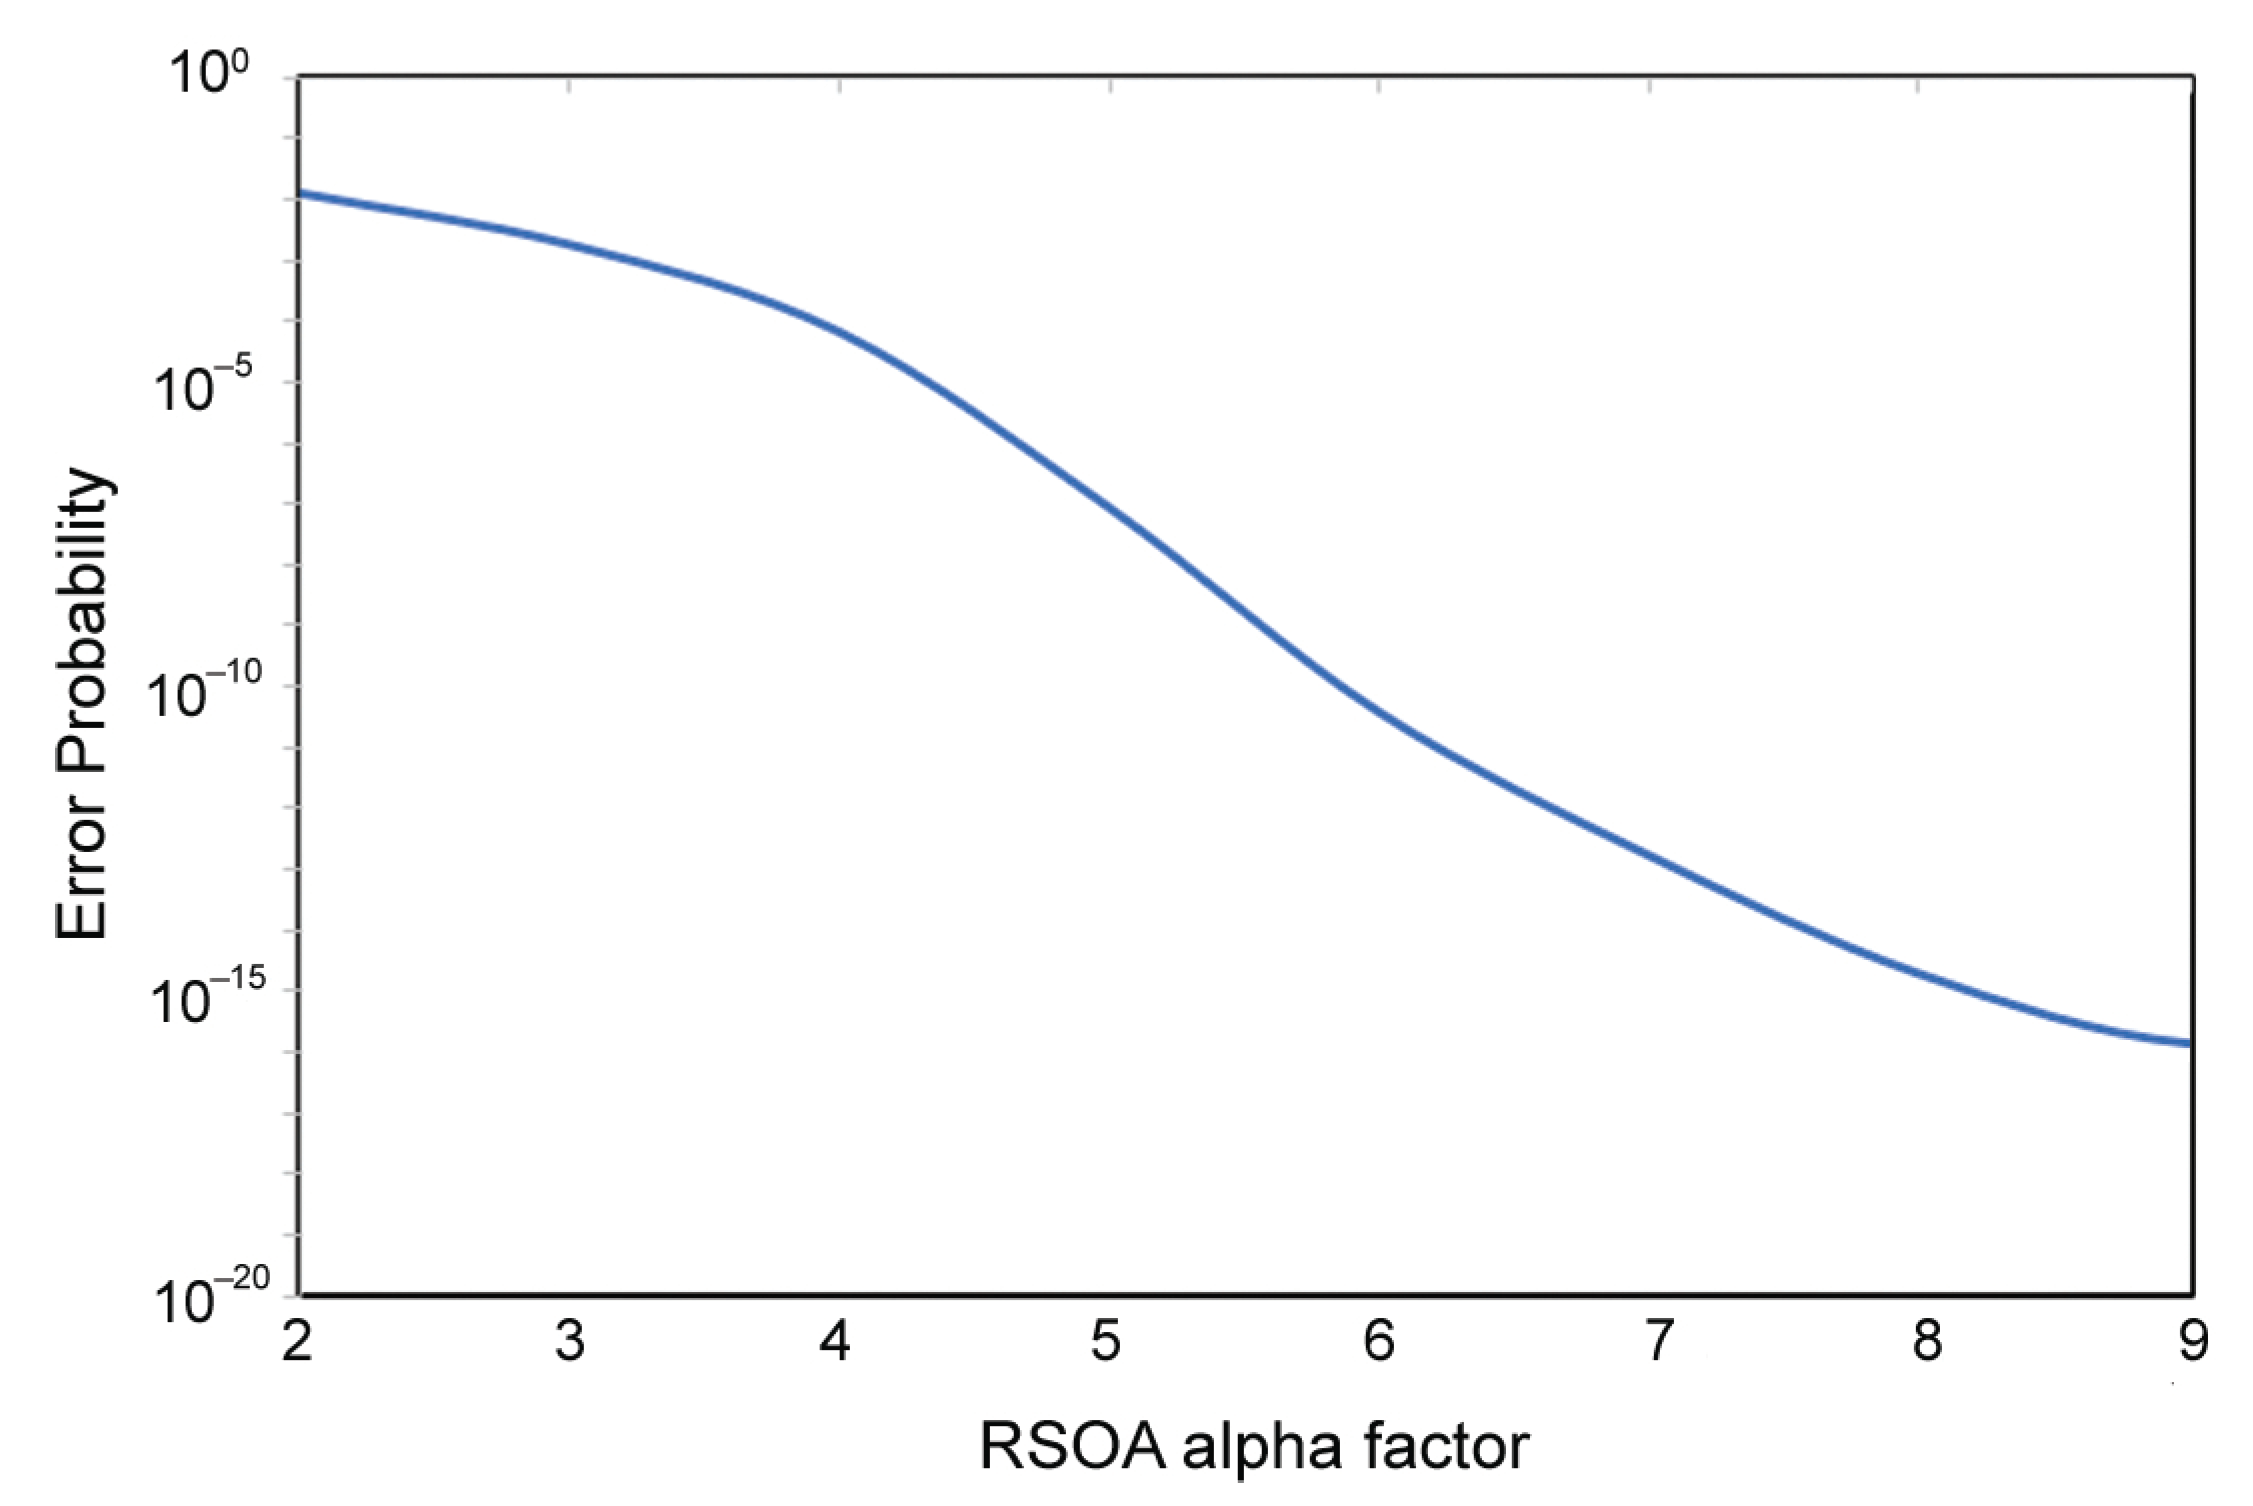
3. Model Validation and Results

The model formulated in Section 2 is validated by a comparison to experimental data available from [21].
First, we compared the theoretical BFL transfer function obtained from Equation (5) against the measured one. Figure 2 verifies that the two curves are identical, since both have a comb-like form, consist of continuous maxima (peaks) of uniform wavelength spacing, or F S R = 0.87 nm, and minima (notches) located in between at F S R / 2 intervals, and exhibit an amplitude difference between peaks and notches, or Peak-to-Notch Contrast Ratio (PNCR), of the order of 25 dB.
Second, we considered the theoretical RSOA E/O response for benchmarking against the experiment. In [17], we concisely derived this response using and combing material from the relevant references cited therein that have suitably applied small-signal analysis. For the sinusoidal modulation current used when this response was measured experimentally [21], the RSOA E/O transfer function is reduced to T R S O A ( ω ) = D ( 0 ) / 2 D ( ω ) , where D ( ω ) = 1 j ω T c a r + W 2 P C W P s a t exp 2 g ¯ 0 L R S O A + 2 P C W P s a t . By substituting the fitted value of the carrier lifetime as well as the values of the rest of the involved parameters from Table 1, this function is plotted against frequency in Figure 3. From this figure, we note that the simulated curve indeed exhibits the low-pass filter characteristic of directly modulated RSOAs [26]. On the other hand, there is a discrepancy between the theoretical and experimental RSOA modulation responses as we go beyond the 3 dB bandwidth. Nevertheless, this fact will not compromise the essence of the model’s predictions because this response is only complementary and not critical for the purposes of modeling. In fact, this function is not directly involved in the calculations of the RSOA and BLF outputs, which in turn are determined by the time-dependent RSOA integrated power gain and the frequency-dependent BFL response, respectively. Additionally, with regard to the principle of operation, the RSOA output is not the absolute but the shifted (due to SPM) frequency content, which is filtered-out and translated into RSOA compensated impairments by the action of BFL. Provided that the BFL response has the opposite slope and is efficiently tailored by properly selecting its FSR and detuning, the BFL can handle this spectral shift and extend the RSOA direct modulation rate. More details in the experimental RSOA modulation response could be captured if the model were improved to include effects such as device parasitics related to RSOA packaging, impedance mismatching and electrical coupling losses related to RSOA driving circuitry, etc. [6,7]. In this case, however, the developed model would be much more sophisticated than the reduced one employed in this work. Such a complexity could be tolerated only if the goal were to design a special-type RSOA with exceptional modulation capabilities compared to those normally exhibited by the majority of available devices, which is beyond the scope of this paper.
Third, we modeled the RSOA when directly modulated and compared the theoretical and experimental waveforms at different encoding data rates of 1 Gb/s and 4 Gb/s, both for the RSOA alone and with the assistance of the BFL. The obtained set of results is depicted in Figure 4 for the same representative segment of NRZ data as in the experiment, i.e., 1100111101010010100011100, which is employed for the sake of a convenient and clear demonstration. These results are complemented by the corresponding eye diagrams in Figure 5, in which the experimental part refers to a 2 31 1 bit-long PRBS, while the theoretical part refers to a 2 7 1 bit-long PRBS so that simulation is affordable with the available computational resources. Note that the 2 7 1 bit-long PRBS is appropriate for correctly capturing and investigating the pattern effects that limit the directly modulated RSOA performance and are combated by the BFL. In fact, the minimum PRBS order required for this purpose is analogous to the RSOA carrier lifetime and data rate, as expressed in [30]. Using the values of 408 ps and (maximum considered) 14 Gb/s, respectively, results in a 7-order PRBS, or equivalently in a PRBS of length 2 7 1 = 127 bits, which is exactly what we used in our simulations. The comparison confirms that the profile of the theoretical waveforms is identical to that of the experimental ones, while the former reproduces well the trend of the latter, i.e., the encoded pulse stream resembles the applied electrical excitation at the lower rate of 1 Gb/s, while it is deformed at the higher rate of 4 Gb/s due to the induced pattern dependence. Moreover, the BFL combats the pattern-dependent distortions and improves the quality of the encoded signal. On the other hand, the theoretical and experimental eye diagrams are not exactly the same. This discrepancy is due to the different ways that they have been obtained. Specifically, the former are actually the so-called pseudo-eye diagrams (PEDs) [31], which are formed by superimposing each simulated encoded bit within a single period and monitoring the outcome, while the latter are recorded after following the standard process specified for this purpose [32] with the aid of a Pulse Pattern Generator and a Digital Communications Analyzer (DCA). Thus, in the first case, the effect of any impairments, such as distortion due to pattern effects and noise, is inevitably smoothened, so that PEDs are not as informative as the classical eye diagrams. Still, they are useful as they can capture and make evident the operating features of the system under consideration that are critical for its performance. The validity of the theoretical outcomes is further supported by the excellent matching between the calculated and measured Amplitude Difference ( A D ) level between encoded marks. In fact, the model predicts that A D is dropped from 1.21 dB after the RSOA to 0.10 dB after the BFL, or by 1.11 dB, while in the experiment the corresponding A D was 1.55 dB vs. 0.34 dB, or a reduction by 1.21 dB [21]. Therefore, the model correctly and accurately captures the change of the RSOA A D , which is made acceptable owing to the BFL action.
The information derived from the extensive model validation concurs thus the BFL potential to allow for RSOA direct modulation at 4 Gb/s. This is also evident from the results shown in Figure 6 and Figure 7, and is consistent with the relevant measurements (see Figure 12 in [21]).
Since the BFL aims at enhancing the RSOA modulation bandwidth, we further explored to what extent this is possible. For this purpose, we calculated the Error Probability ( E P ) from E P = 0.5 erfc ( Q / 2 ) , where erfc ( x ) is the error function and Q = ( P 1 P 0 ) / ( σ 1 + σ 0 ) is the Q-factor, where P 1 , 0 and σ 1 , 0 are the mean and the standard deviation of the peak power of the encoded marks (‘1’) and spaces (‘0’), respectively [32]. Figure 8 shows that the use of the BFL can extend the RSOA direct modulation rate even above the experimentally derived [21] of 11 Gb/s while keeping the E P below the Forward Error Correction (FEC) acceptable limit of 3.8 × 10 3 [33]. The theoretically specified maximum data rate does not contradict that in [21], since the former is in principle more optimistic while the latter was obtained under inherently tighter conditions. A more realistic prediction would be possible if the simulation included effects such as those mentioned earlier, which have been neglected in the employed RSOA reduced model. Although such an intricate model would help reduce the said discrepancy between theory and experiment, adding more complexity would not fundamentally alter the main conclusions drawn in this work. In fact, what is more important is not the absolute increase in the RSOA direct modulation data rate but the thorough confirmation, through validated theoretical results, of enabling this owing to the BFL. To this end, the BFL potential is further enhanced by the upward prediction for the maximum supportable data rate, and is complemented by the encoded pulses waveforms and eye diagrams depicted in Figure 9 and Figure 10, respectively.
Finally, it would be useful to observe the E P dependence on the modulation rate with and without BFL, both theoretically and experimentally. This is shown in Figure 11, where the limit for an acceptable E P is set to 10 9 , according to the standard requirements in digital communication systems [32], and also in order to heavily stress the scheme and further assess its operating capability under tight conditions. From this figure, we can make the following observations: First, owing to the BFL, the E P is improved and becomes acceptable for a modulation rate being at least twice that without the BFL both in theory and experiment. Second, the theoretical E P is better than the experimental one, and this also holds for the E P improvement. This difference in the E P , which is subsequently reflected by the maximum supported data rate as well as on the form of the simulated RSOA output, is attributed to the different ways employed to derive the experimental and theoretical E P . Specifically, and as described in [21], the experimental E P was found using voltage samples from the encoded data histograms that were recorded with a diagnostic instrument (DCA) of limited sampling efficiency. This inevitably affected the acquired information and accordingly the E P , which could not be perfectly reconstructed subject to the (pseudo-) randomly occurring pattern effects. A (less cost-effective) Bit Error Rate Tester capable of sampling data directly at the line rate would help resolve this information gap issue related to the frequency of occurring events. In contrast, although the theoretical E P was found using the same basic formula, still due to the statistical approach followed to calculate the Q-factor, and from it the E P , the latter was comparatively overestimated. Nevertheless, the observed trends and drawn conclusions still hold and highlight the BFL critical role in rendering feasible a faster RSOA direct modulation.
Further insight into the operation of the RSOA-BFL pair can be gained by using the theoretical formalism to predict the scheme’s behavior as critical parameters are varied. Two such critical parameters are the RSOA carrier lifetime and alpha factor, whose effect on the E P is shown in Figure 12 and Figure 13, respectively. From these figures, it can be seen that the E P is improved as the RSOA carrier lifetime is decreased and the alpha factor is increased. This improvement is physically explained by noting that a faster carrier lifetime enhances the maximum amplitude difference between encoded marks [34], which is the primary goal pursued via the BLF-enabled optical notch filtering. Similarly, a higher alpha factor naturally results in stronger spectral broadening due to SPM (as mathematically implied by the phase of the electric field in Equation (3)), which in turn helps the BFL exploit this effect and subsequently overcome the pattern-dependent performance limitations of the directly modulated RSOA more efficiently. Finally, the optimization of the RSOA-BFL design could be assisted by employing genetic algorithms for parameters extraction [35] and alternative metrics for performance evaluation [7].
In post-filtering techniques that are implemented with optical modules, such as the BFL, and used to enhance the direct modulation capability of RSOAs, an important figure-of-merit is the net gain ( N G ) [17]. The N G is the difference between the RSOA average gain (which hence incorporates the RSOA average output and input power) and the BFL reduction in the amount of amplification that the RSOA would provide if it were alone. When running the model, we found that the N G varies from 9.46 dB to 8.67 dB for a modulation range between 4 Gb/s and 11 Gb/s, respectively. These values imply that the encoded signal could travel inside a standard single-mode fiber at distances which lie within the reach of the target applications that exploit RSOAs as intensity modulators [26]. The practical needs of these applications can be sufficiently served by modulation rates in the order of 11 Gb/s at least for the midterm. Such applications, such as those concisely mentioned at the beginning of Section 1, exploit RSOAs’ attractive features of their wavelength-agnostic, self-seeding, and uncooling operation to enable two-way fiber-based transmissions. Thus, in the downlink direction, a sender (for instance, a central office) sends lightwave-modulated data, which may also be an optical version of an RF signal, and these are first amplified by an RSOA before arriving at the receiver (for instance, at a subscriber premises or at a mobile base station). In the opposite uplink direction, the signal from a physical or hardware entity controls the injection current of the RSOA and through the (external) modulation of the latter is imprinted on a CW optical signal that was delivered together with the downstream data. In this manner, the end-users’ information is contained in the upstream data that are returned to the sender, and the loop of the optical distribution network configuration is closed.

4. Conclusions

In conclusion, we presented a thorough treatment on the bypassing of RSOA limited modulation bandwidth using a BFL. For this purpose, we suitably modeled the RSOA response and combined it with that of the BFL, thus obtaining simulation results that correctly reproduce the trend of the experimental ones. In this manner, we demonstrated the employed model’s validity and its efficiency for describing and predicting RSOAs’ behavior when being directly modulated. Additionally, we investigated and quantified BFL’s assistance in extending the rate of RSOA electrical excitation with an acceptable performance. The derived outcomes contribute to establishing the BFL as a viable technological solution for enhancing RSOAs direct modulation capability.

Author Contributions

F.N.K. conducted the simulation and interpreted the obtained results; K.E.Z. conceived the initial idea and wrote the paper; Z.V.R. interpreted the obtained results, reviewed the results and the manuscript; A.H. reviewed the results and the manuscript. All authors have read and agreed to the published version of the manuscript.

Funding

This research received no external funding.

Conflicts of Interest

The authors declare no conflict of interest.

References

  1. Saliou, F.; Simon, G.; Chanclou, P.; Pizzinat, A.; Lin, H.; Zhou, E.; Xu, Z. WDM PONs based on colorless technology. Opt. Fiber Technol. 2015, 26, 126–134. [Google Scholar] [CrossRef]
  2. Udvary, E. Performance optimization of RSOA based mm-wave radio-over-fibre access network. Opt. Quantum Electron. 2021, 53, 1–14. [Google Scholar] [CrossRef]
  3. Meehan, A.; Connelly, M.J. Experimental characterization and modeling of the improved low frequency response of a current modulated bulk RSOA slow light based microwave phase shifter. Opt. Commun. 2015, 341, 241–244. [Google Scholar] [CrossRef]
  4. Totović, A.; Gvozdić, D. Traveling-wave and reflective semiconductor optical amplifiers. In Handbook of Optoelectronic Device Modeling and Simulation; CRC Press: Boca Raton, FL, USA, 2017; pp. 631–696. [Google Scholar]
  5. Cho, K.Y.; Takushima, Y.; Chung, Y.C. 10-Gb/s operation of RSOA for WDM PON. IEEE Photon. Technol. Lett. 2008, 20, 1533–1535. [Google Scholar] [CrossRef]
  6. Totović, A.R.; Crnjanski, J.V.; Krstić, M.M.; Gvozdić, D.M. Numerical study of the small-signal modulation bandwidth of reflective and traveling-wave SOAs. J. Light. Technol. 2015, 33, 2758–2764. [Google Scholar] [CrossRef]
  7. Babić, J.; Totović, A.; Crnjanski, J.; Krstić, M.; Mašanović, M.; Gvozdić, D. Exploiting Inductive Peaking for Enhancing the RSOA’s Large-Signal Modulation Performance. J. Light. Technol. 2021, 39, 3502–3510. [Google Scholar] [CrossRef]
  8. Rizou, Z.V.; Zoiros, K.E. Semiconductor optical amplifier dynamics and pattern effects. In Handbook of Optoelectronic Device Modeling and Simulation; CRC Press: Boca Raton, FL, USA, 2017; pp. 771–796. [Google Scholar]
  9. de Valicourt, G.; Pommereau, F.; Poingt, F.; Lamponi, M.; Duan, G.; Chanclou, P.; Violas, M.; Brenot, R. Chirp reduction in directly modulated multi-electrode RSOA devices in passive optical networks. IEEE Photon. Technol. Lett. 2010, 22, 1425–1427. [Google Scholar] [CrossRef]
  10. Kim, H. 10-Gb/s operation of RSOA using a delay interferometer. IEEE Photon. Technol. Lett. 2010, 22, 1379–1381. [Google Scholar] [CrossRef]
  11. Presi, M.; Chiuchiarelli, A.; Corsini, R.; Choudury, P.; Bottoni, F.; Giorgi, L.; Ciaramella, E. Enhanced 10 Gb/s operations of directly modulated reflective semiconductor optical amplifiers without electronic equalization. Opt. Express 2012, 20, B507–B512. [Google Scholar] [CrossRef] [Green Version]
  12. Su, T.; Zhang, M.; Chen, X.; Zhang, Z.; Liu, M.; Liu, L.; Huang, S. Improved 10-Gbps uplink transmission in WDM-PON with RSOA-based colorless ONUs and MZI-based equalizers. Opt. Laser Technol. 2013, 51, 90–97. [Google Scholar] [CrossRef]
  13. Zhang, M.; Wang, D.; Cao, Z.; Chen, X.; Huang, S. Suppression of pattern dependence in 10 Gbps upstream transmission of WDM-PON with RSOA-based ONUs. Opt. Commun. 2013, 308, 248–252. [Google Scholar] [CrossRef]
  14. Shim, H.K.; Kim, H.; Chung, Y.C. 20-Gb/s polar RZ 4-PAM transmission over 20-km SSMF using RSOA and direct detection. IEEE Photon. Technol. Lett. 2015, 27, 1116–1119. [Google Scholar] [CrossRef]
  15. Bindhaiq, S.; Zulkifli, N.; Supa’at, A.M. The transmission of symmetric 40 Gb/s TWDM-based NG-PON2 utilizing delay interferometer (DI) for RSOA bandwidth enhancement. Opt. Fiber Technol. 2016, 30, 65–71. [Google Scholar] [CrossRef]
  16. Shim, H.K.; Kim, H.; Chung, Y.C. Effects of electrical and optical equalizations in 28-Gb/s RSOA-based WDM PON. IEEE Photon. Technol. Lett. 2016, 28, 2537–2540. [Google Scholar] [CrossRef]
  17. Rizou, Z.V.; Zoiros, K.E. Theoretical analysis of directly modulated reflective semiconductor optical amplifier performance enhancement by microring resonator-based notch filtering. Appl. Sci. 2018, 8, 223. [Google Scholar] [CrossRef] [Green Version]
  18. Zoiros, K.; Morel, P. Enhanced performance of semiconductor optical amplifier at high direct modulation speed with birefringent fiber loop. AIP Adv. 2014, 4, 077107. [Google Scholar] [CrossRef] [Green Version]
  19. Zoiros, K.E.; Morel, P.; Hamze, M. Performance improvement of directly modulated semiconductor optical amplifier with filter-assisted birefringent fiber loop. Microw. Opt. Technol. Lett. 2015, 57, 2247–2251. [Google Scholar] [CrossRef]
  20. Engel, T.; Rizou, Z.V.; Zoiros, K.E.; Morel, P. Semiconductor optical amplifier direct modulation with double-stage birefringent fiber loop. Appl. Phys. B Lasers Opt. 2016, 122, 158. [Google Scholar] [CrossRef]
  21. Rizou, Z.V.; Zoiros, K.E.; Rampone, T.; Sharaiha, A. Reflective semiconductor optical amplifier direct modulation capability enhancement using birefringent fiber loop. Appl. Sci. 2020, 10, 5328. [Google Scholar] [CrossRef]
  22. Duill, S.O.; Barry, L.P. Improved reduced models for single-pass and reflective semiconductor optical amplifiers. Opt. Commun. 2015, 334, 170–173. [Google Scholar] [CrossRef] [Green Version]
  23. Antonelli, C.; Mecozzi, A.; Hu, Z.; Santagiustina, M. Analytic study of the modulation response of reflective semiconductor optical amplifiers. J. Light. Technol. 2015, 33, 4367–4376. [Google Scholar] [CrossRef]
  24. Rizou, Z.V.; Zoiros, K.E.; Hatziefremidis, A.; Connelly, M.J. Performance tolerance analysis of birefringent fiber loop for semiconductor optical amplifier pattern effect suppression. Appl. Phys. B Lasers Opt. 2015, 119, 247–257. [Google Scholar] [CrossRef]
  25. Udvary, E.; Berceli, T. Improvements in the linearity of semiconductor optical amplifiers as external modulators. IEEE Trans. Microw. Theory Technol. 2010, 58, 3161–3166. [Google Scholar] [CrossRef]
  26. Gebrewold, S.A. Reflective Semiconductor Optical Amplifiers (RSOAs) as Colorless Sources in Access Networks. Ph.D. Thesis, ETH Zurich, Zurich, Switzerland, 2016. [Google Scholar]
  27. Shen, T.; Agrawal, G. Pulse-shape effects on frequency chirping in single-frequency semiconductor lasers under current modulation. J. Light. Technol. 1986, 4, 497–503. [Google Scholar] [CrossRef]
  28. Hamze, M. Study of Different SOA Structures Impact on the Transmission of IMDD OOFDM Signals. Ph.D. Thesis, Université de Bretagne Occidentale (UBO), Brest, France, 2015. [Google Scholar]
  29. Corless, R.M.; Gonnet, G.H.; Hare, D.E.; Jeffrey, D.J.; Knuth, D.E. On the LambertW function. Adv. Comput. Math. 1996, 5, 329–359. [Google Scholar] [CrossRef]
  30. Xu, J.; Zhang, X.; Mørk, J. Investigation of patterning effects in ultrafast SOA-based optical switches. IEEE J. Quantum Electron. 2009, 46, 87–94. [Google Scholar] [CrossRef]
  31. Gutiérrez-Castrejón, R.; Dülk, M.; Guekos, G. Novel scheme for optical time-division demultiplexing using a delayed interferometer. Opt. Commun. 2001, 192, 245–254. [Google Scholar] [CrossRef]
  32. Agrawal, G.P. Fiber-Optic Communication Systems; John Wiley & Sons: Hoboken, NJ, USA, 2012; Volume 222. [Google Scholar]
  33. Hui, R.; O’Sullivan, M. Fiber Optic Measurement Techniques; Academic Press: Cambridge, MA, USA, 2009. [Google Scholar]
  34. Stathi, G.; Rizou, Z.; Zoiros, K. Simulation of directly modulated RSOA. In Proceedings of the 2017 International Conference on Numerical Simulation of Optoelectronic Devices (NUSOD), Copenhagen, Denmark, 24–28 July 2017; pp. 145–146. [Google Scholar]
  35. Vujičić, Z.; Dionísio, R.P.; Shahpari, A.; Pavlović, N.B.; Teixeira, A. Efficient dynamic modeling of the reflective semiconductor optical amplifier. IEEE J. Sel. Top. Quantum Electron. 2013, 19, 3000310. [Google Scholar] [CrossRef]
Figure 1. Illustration of RSOA directly modulated by NRZ data followed by serially connected BFL. (a) Block diagram. (b) P-I curve. (c) Stand-alone RSOA temporal output profile. (d) RSOA electrical modulation response. (e) BFL spectral response. (f) BFL-assisted RSOA temporal output profile.
Photonics 09 00147 g001
Figure 2. BFL response curves: (a) experimental and (b) theoretical. The upper and lower horizontal dash-dotted lines denote the maximum and minimum spectral responses, respectively, whose difference defines the Peak-to-Notch-Contrast Ratio (PNCR).
Photonics 09 00147 g002
Figure 3. RSOA modulation response curves: theoretical (dashed line) and experimental (solid line). The horizontal dashed-dotted line denotes the 3 dB modulation bandwidth.
Photonics 09 00147 g003
Figure 4. Encoded signal waveforms. Upper row: RSOA output at 1 Gb/s. Middle row: RSOA output at 4 Gb/s. Lower row: BFL output at 4 Gb/s. Left column: Experimental results. Right column: Simulation results. Experimental results time scale—Upper row: 2.55 ns/div; Middle row: 650 ps/div; and Lower row: 650 ps/div.
Photonics 09 00147 g004
Figure 5. Encoded signals eye diagrams. Upper row: RSOA output at 1 Gb/s. Middle row: RSOA output at 4 Gb/s. Lower row: BFL output at 4 Gb/s. Left column: Experimental results. Right column: Simulation results. Experimental results time scale—Upper row: 150 ps/div; Middle row: 50 ps/div; and Lower row: 50 ps/div.
Photonics 09 00147 g005
Figure 6. Simulated encoded signal waveforms at RSOA output and BFL output at 4 Gb/s.
Photonics 09 00147 g006
Figure 7. Simulated encoded signal eye diagrams at (a) RSOA output and (b) BFL output at 4 Gb/s.
Photonics 09 00147 g007
Figure 8. Error Probability ( E P ) vs. RSOA direct modulation data rate. E P limit is set to the corresponding FEC value of 3.8 × 10 3 .
Photonics 09 00147 g008
Figure 9. Encoded signal waveforms at RSOA output and BFL output at 11 Gb/s.
Photonics 09 00147 g009
Figure 10. Encoded signal eye diagrams at RSOA output (left column) and BFL output at 11 Gb/s (right column). Upper row: Experimental results. Lower row: Simulation results.
Photonics 09 00147 g010
Figure 11. Error Probability ( E P ) vs. RSOA direct modulation data rate at the RSOA and BFL output: (a) experimental and (b) theoretical. E P limit is set to 10 9 .
Photonics 09 00147 g011
Figure 12. Error probability vs. RSOA carrier lifetime.
Photonics 09 00147 g012
Figure 13. Error probability vs. RSOA alpha factor.
Photonics 09 00147 g013
Table 1. Simulation parameters default values.
SymbolDefinitionValueUnitReference
P C W CW input power−5dBm[21]
λ e n c Encoded signal wavelength1560nm[21]
T p e r Electrical data pulse repetition period250 & 1000ps[21]
t r Electrical data pulse rise time17% of repetition periodps[21]
I m RSOA modulation current20mAFitting
(steady-
state)
I d c RSOA dc bias current70mAFitting
(steady-
state)
I 0 RSOA transparency current45mAFitting
(steady-
state)
α L E F RSOA linewidth enhancement factor5-[28]
Γ RSOA confinement factor0.17-[28]
aRSOA differential gain 6.9 × 10 20 m 2 [28]
N 0 RSOA carrier density at transparency 5.8 × 10 23 m 3 [28]
n g RSOA semiconductor material group
refractive index
3.6-[28]
L R S O A RSOA active region length713um[28]
T c a r RSOA carrier lifetime408psFitting
(dynamic)
P s a t RSOA semiconductor material
saturation power
3.2dBm[28]
BBFL birefringence 3.3 × 10 4 -[21]
L B F L BFL PM total length8.5m[21]
Δ λ BFL detuning−0.08nm[21]
Publisher’s Note: MDPI stays neutral with regard to jurisdictional claims in published maps and institutional affiliations.

