Review

Cavity-Enhanced Frequency Comb Vernier Spectroscopy

by
Chuang Lu
1,
Jerome Morville
2,
Lucile Rutkowski
3,
Francisco Senna Vieira
1 and
Aleksandra Foltynowicz
1,*
1
Department of Physics, Umeå University, 901 87 Umeå, Sweden
2
Univ Lyon, Université de Claude Bernard Lyon 1, CNRS, Institut Lumière Matière, F-69622 Villeurbanne, France
3
Univ Rennes, CNRS, IPR (Institut de Physique de Rennes)-UMR 6251, F-35000 Rennes, France
*
Author to whom correspondence should be addressed.
Photonics 2022, 9(4), 222; https://doi.org/10.3390/photonics9040222
Submission received: 25 February 2022 / Revised: 17 March 2022 / Accepted: 21 March 2022 / Published: 28 March 2022
(This article belongs to the Special Issue Modern Spectroscopic Techniques for Trace Detection)

Abstract

:
Vernier spectroscopy is a frequency comb-based technique employing optical cavities for filtering of the comb and for enhancement of the interaction length with the sample. Depending on the ratio of the cavity free spectral range and the comb repetition rate, the cavity transmits either widely spaced individual comb lines (comb-resolved Vernier spectroscopy) or groups of comb lines, called Vernier orders (continuous-filtering Vernier spectroscopy, CF-VS). The cavity filtering enables the use of low-resolution spectrometers to resolve the individual comb lines or Vernier orders. Vernier spectroscopy has been implemented using various near- and mid-infrared comb sources for applications ranging from trace gas detection to precision spectroscopy. Here, we present the principles of the technique and provide a review of previous demonstrations of comb-resolved and continuous-filtering Vernier spectroscopy. We also demonstrate two new implementations of CF-VS: one in the mid-infrared, based on a difference frequency generation comb source, with a new and more robust detection system design, and the other in the near-infrared, based on a Ti:sapphire laser, reaching high sensitivity and the fundamental resolution limit of the technique.

1. Introduction

Optical frequency combs provide an unprecedented combination of resolution and bandwidth for spectroscopy. The spectrum of a comb is an array of equidistant and narrow laser lines. In a femtosecond mode-locked comb generator, the mode frequencies are related to the Fourier transform of a time-domain train of pulses with a repetition rate frep. A comb in the spectral domain can be expressed as νn = nfrep + fceo, where n is an integer of the order of tens of thousands to millions, frep is the mode spacing and fceo is the carrier-envelope offset frequency. Controlling these two radio frequencies enables control of the entire comb spectrum.
Various detection schemes have been developed to measure molecular spectra using frequency combs. In general, the spectrometers are based either on dispersive elements, such as gratings [1] or virtually imaged phase arrays [2], or on time-domain Fourier transform spectroscopy, employing either mechanical Michelson interferometers [3] or the dual comb approach [4]. To achieve high absorption sensitivity, enhancement cavities are used to increase the interaction length with the sample [1,5,6,7]. The cavity can also act as a filter for the comb, to create subsets of the original comb with a larger mode spacing. This concept is utilized in Vernier spectroscopy [8,9], where the ratio of the cavity free spectral range, FSR, and frep is chosen such that the transmitted comb lines, or groups of comb lines, can be resolved using a low-resolution spectrometer. The mismatched comb and cavity modes form a pattern similar to the Vernier scale, which gave its name to the technique. By scanning either the cavity FSR or comb frep, all comb modes can be sequentially coupled into the cavity and recorded in transmission. This removes the bandwidth limitation imposed by the dispersion of the cavity mirrors when the comb is tightly locked to the cavity for use with Fourier transform spectrometers [6,7].
In this paper, we describe the principles of Vernier spectroscopy, review the previous demonstrations of the techniques, and demonstrate two improved systems in the mid- and near-infrared range, pushing the limits of robustness and resolution of the technique. The different comb–cavity filtering approaches are described in Section 2. In Section 3, we review the previous demonstrations of Vernier spectroscopy based on comb-resolved and continuous-filtering schemes. In Section 3.1, about comb-resolved Vernier spectroscopy, we also include some spectroscopic works in which the cavity was used only as a filter, but the sample was kept outside the cavity (in a cell or free space). In Section 4 and Section 5, we describe the new continuous-filtering Vernier spectrometers: one operating around 3.3 µm, based on a difference-frequency generation source and a simple and robust spectrometer, and the other operating around 780 nm, based on a Ti:sapphire laser, reaching the best sensitivity and resolution demonstrated so far with the technique.

2. Principles of Vernier Filtering

In this section we describe the different regimes of comb–cavity matching. Section 2.1 describes the perfect match condition, which has often been used together with a tight lock or a dither lock in combination with dispersive and Fourier transform spectrometers [7,10,11,12]. In Vernier filtering, depending on the mismatch between the cavity FSR and comb frep, the cavity transmits either isolated comb modes, which is the basis of comb-resolved Vernier filtering described in Section 2.2, or isolated groups of comb modes called Vernier orders, in an approach known as continuous-filtering described in Section 2.3.

2.1. Comb–Cavity Coupling at Perfect Match

Because of the intracavity dispersion caused by the reflective coatings of the mirrors and by the refractive index of the intracavity medium, the cavity FSR, i.e., the spacing of the cavity modes, varies with the optical frequency. The resonance frequencies of the cavity can be locally approximated by nFSR + f0, where FSR = c/(2L) (for a linear cavity with length L, where c is the speed of light), and where f0 originates from the intracavity dispersion. This resembles the structure of the comb frequencies. The perfect comb–cavity matching condition, corresponding to a one-to-one mapping, is when frep = FSR and fceo = f0. This condition implies that every comb mode is coupled into a cavity resonance, and the cavity output contains the original comb, in the range allowed by the cavity dispersion, as shown in Figure 1a.
Sustaining the perfect comb–cavity matching condition over time requires active stabilization using either a tight lock or a dither lock. In the tight lock case, the comb modes are kept in resonance with their corresponding cavity modes using, e.g., the Pound–Drever–Hall stabilization scheme [13,14]. The transmitted bandwidth is limited by the cavity dispersion. Any remaining relative comb–cavity phase jitter translates into an intensity noise on the amplitudes of the transmitted comb modes. In Fourier transform spectroscopy, this noise can be reduced using balanced detection [7]. In the dither lock case [10], the cavity FSR or comb frep is periodically dithered around the perfect match condition with an amplitude much larger than the cavity mode linewidth and the cavity output is integrated over times longer than the dither period. A slow feedback is applied to keep the transmission centered within the dither window. This type of locking overcomes the spectral bandwidth limitation imposed by the cavity dispersion since all combs are transmitted through the cavity at some point within the dither period, but it suffers in general from low transmitted power.

2.2. Comb-Resolved Filtering

Comb-resolved Vernier filtering relies on comb–cavity mismatch such that mfrep = qFSR, where m and q are integers of different values. The fraction m/q is called the Vernier ratio [8]. This condition implies that every mth comb mode is transmitted through every qth cavity resonance simultaneously. Provided that m is lower than the cavity finesse, all other modes are strongly suppressed [8]. The comb filtered by the cavity is a subset of the original comb with a mode spacing increased by a factor of m. This allows the comb modes to be resolved once the spectrometer resolution is better than mfrep, which is typically in the few GHz to few tens of GHz range and can be achieved using a diffraction grating or other dispersive spectrometers.
Figure 1b shows the filtering scheme for a Vernier ratio of 4/3. The comb modes that are initially reflected (shaded bars) can be sequentially tuned into resonance by scanning the cavity FSR or comb frep and each subset of the comb modes can be synchronously acquired using a detector array or a monochromator. The FSR/frep scanning approach, together with spectral interleaving, allows the full bandwidth of the comb to be transmitted, not limited by the intracavity dispersion, without the need to adjust the comb fceo to the cavity f0. However, when a detector array or a camera is used to record the transmitted spectrum, the number of recorded spectral elements is limited by the area of the detector [8,15].
In the case when m >> 1, as shown in Figure 1c, very few comb lines are transmitted through the cavity. In a specific case when m is larger than the number of incident comb modes, only one comb mode is transmitted through the cavity at a time, and a single detector is sufficient to record it. In this case the transmitted bandwidth is limited to less than mfrep.
The main advantage of the comb-resolved filtering method is that when the individual transmitted comb modes are resolved by the spectrometer, and the frep and fceo are known, the frequency scale of the recorded absorption spectra is given by the comb mode frequencies, and the resolution is ultimately limited by the linewidth of the comb modes [16,17]. This makes this approach suitable for precision spectroscopy at a metrological level. For optimal performance in terms of stability and amplitude noise, this method requires narrow linewidth lasers and either active locking to maintain the comb–cavity coupling, or a controlled comb–cavity sweep at a suitable speed. In the case of active locking, the comb and the cavity are stabilized to each other at each step of the FSR/frep scan [15,18]. In the swept case, the scan speed should be adjusted with respect to the cavity response time. In the adiabatic regime, under which the cavity transfer function is Lorentzian, the passage of the comb line through the cavity resonance should be longer than the cavity ringdown time [19]. This sets the adiabatic speed limit to [20,21]
W c a v = Γ C τ R D = 2 π Γ C 2 ,
where Γ C is the cavity mode full width at maximum and τ R D = 1 / ( 2 π Γ C ) is the cavity ringdown time.

2.3. Continuous Filtering

The continuous-filtering regime occurs when m (the integer number in the nominator of the Vernier ratio defined in the previous section) is larger than the cavity finesse, so that the cavity transmission contains groups of comb modes called Vernier orders (VOs) rather than individual comb modes, as shown in Figure 2. The continuous-filtering regime is usually not described in terms of the Vernier ratio (which is very close to an integer), but rather by the detuning ΔL from the perfect match length, LPM = c/(2frep), where | Δ L | < LPM/F, with F the cavity finesse [9]. The center frequency of the kth Vernier order is given by ν k = c ( k δ f 0 / f rep ) / ( 2 | Δ L | ) , where δ f 0 is the mismatch between the comb and cavity offset frequencies. The term δ f 0 / f rep is < 1 and can be neglected for k >> 1. The separation of consecutive Vernier orders is given by F S R V = c / ( 2 | Δ L | ) [9]. The ratio of FSRV and frep is given by LPM/ | Δ L | , which is usually much larger than the value of m in the comb-resolved Vernier filtering case (since m in the continuous-filtering case must be larger than the cavity finesse, F). Thus the VO spacing is usually of the order of a few THz and can be resolved using a low-resolution grating. Usually, one of the Vernier orders is measured using a single detector, while other orders are blocked. Similar to comb-resolved Vernier filtering, the comb modes that form the VOs can be continuously swept across the comb spectrum by scanning either the comb frep or the cavity FSR. The entire bandwidth of the comb can be recorded in this way, with no bandwidth limitation imposed by intracavity dispersion or the detection system.
The scanning speed of the VO is a factor of LPM/ | Δ L | higher than the corresponding scanning speed of the individual comb modes [20]. Thus the adiabatic scanning speed for CF-VS is [21]
W C F V S = W c a v L PM | Δ L | = 2 π Γ C 2 L PM | Δ L | .
Since the individual comb modes are not resolved, the absolute frequency scale provided by the comb modes is lost, and the spectral resolution is limited to the width of the VO, given by Γ V = F S R V / F = c / ( 2 F | Δ L | ) [9]. Usually, the relative frequency scale calibration is performed using a low-finesse etalon with a known FSR.
The minimum number of comb modes in a VO for which the relative intensity modulation during the scanning is below 10−6 is 5 [9], which sets the best achievable resolution to 5FSR. The setup described in Section 5 below is the first demonstration of a CF-VS system operating at this resolution limit. The fact that the VO contains at least five comb modes implies inherent immunity to the phase-to-amplitude noise conversion, since the noise contributions that originate from the comb modes at the two wings of a VO have opposite signs and cancel each other out [9].
In the adiabatic limit, the intensity of the VO in the presence of intracavity absorption is given by [20,22]
I T ( ν k ) = ν k F S R V / 2 ν k + F S R V / 2 T V A ( ν , ν k ) I 0 ( ν ) F S R d ν ,
where I0(ν) is the spectral density of the comb envelope and T V A ( ν , ν k ) is the envelope of the VO, given by [22]
T V A ( ν , ν k ) = e α ( ν ) L PM [ 1 r e α ( ν ) L PM ] 2 × T res c 1 + { ν ν k [ c ϕ ( ν ) / 4 π ] ( L PM / Δ L ) c / ( 4 F Δ L ) + [ c α ( ν ) / 4 π ] ( L PM / Δ L ) } 2 ,
where, in turn, α ( ν ) and ϕ ( ν ) are the absorption and dispersion coefficients of the analyte (in units of cm−1), and T res c = t 2 / ( 1 r ) 2 is the on-resonance transmission through the cavity, with t and r being the transmission and reflection coefficients of the cavity mirrors. The shape of the envelope depends on the sign of ΔL, and the absorption lines are stronger for negative values of ΔL [20]. We note that Equation (4) is written in a form similar to Ref. [22], which, however, contains a number of typos. When the scanning speed of the VO is faster than that determined by the adiabatic limit, Equation (4) needs to be modified by inserting a correction factor for the cavity finesse, as described in Ref. [21].

3. Previous Demonstrations

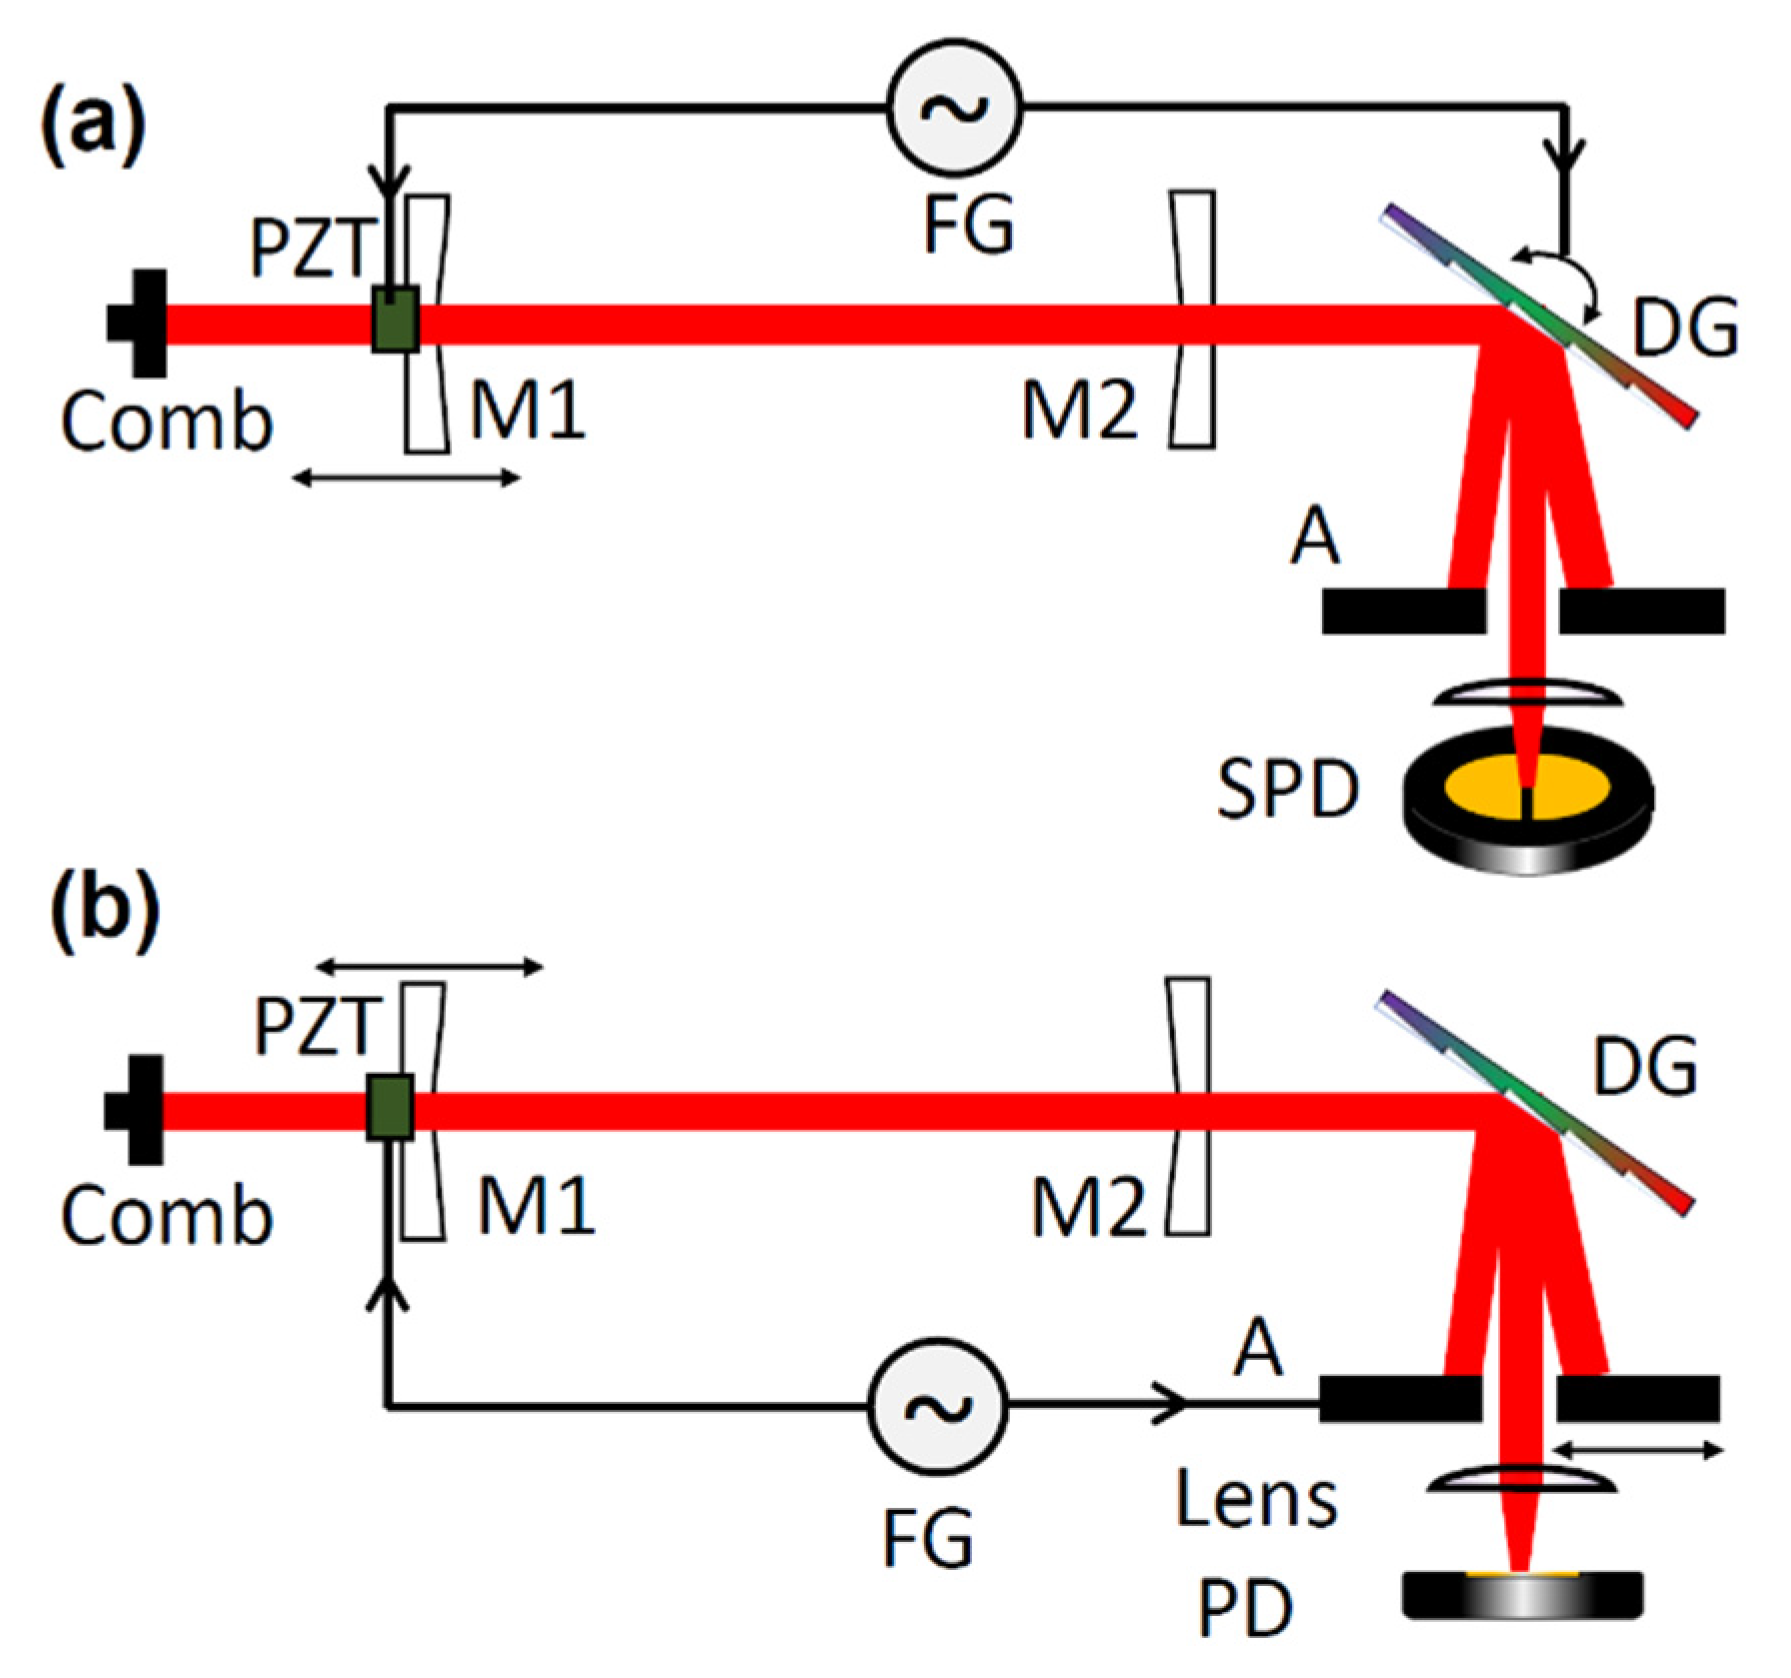
In this section we summarize the previous demonstrations of Vernier spectroscopy operating in the comb-resolved regime (Section 3.1) and in the continuous-filtering regime (Section 3.2). Typical detection schemes are schematically shown in Figure 3 and Figure 4. The key parameters of all the demonstrations are summarized in Table 1 and Table 2, respectively, in the order in which they appear in the text below. In the tables, the first column states the reference to the paper and the publication year; the second column lists the used comb source and its repetition rate; the third column shows the bandwidth and center wavelength of the recorded molecular spectra, and—in Table 2—the resolution of the spectrometer; the fourth column states the cavity finesse and FSR, and—in Table 1—the used Vernier ratio m/q; the fifth column shows the sensitivity of the spectrometer in terms of noise equivalent absorption (NEA) and/or figure of merit (FoM); the sixth column lists the target species, where in Table 1 we indicate if the sample was in the cavity or in a cell (in Table 2 all species were in the cavity); the last column refers to the detection scheme used. The NEA is defined as the noise on the baseline in a given integration time, divided by the interaction length with the sample, while the FoM is equal to NEA(T/M)1/2, where T is the acquisition time and M is the number of independent spectral elements. We report only those numbers that were provided by the authors.
Table 1. Summary of comb-resolved Vernier spectroscopy demonstrations. See text for details.
PaperLaser Source
and frep
RangeCavity Finesse, FSR and Vernier RatioSensitivityTarget
Species
Detection Scheme
[8]
2007
Ti:sapphire
1 GHz
4 THz
@ 0.785 µm
F = 3000
FSR = 1 GHz
m/q = 69/68
NEA = 5 × 10⁻⁶ cm−1 @ 10 ms
4000 elements
O2
in cavity
Figure 3a
[23] *
2014
Er:fiber
250 MHz
5 THz
@ 1.53 µm
F = 30,000
FSR = 250 MHz
m/q = 500/499
NEA = 8 × 10⁻⁸ cm−1 @ 1 s
FoM = 1.2 × 10⁻⁹ cm−1 Hz−1/2
C2H2
in cavity
Figure 3a
[15]
2015
Er:fiber +
Tm-Ho amp.
250 MHz
0.032 THz
@ 2 µm
F = 100
FSR = 4.5 GHz
m/q = 18/1
Not reportedCO2
in cavity
Figure 3a
[24]
2018
Same as above1.8 THz
@ 1.96 µm
0.03 THz steps
Same as aboveNot reportedCO2
in cavity
Figure 3a
[25]
2021
Tm:fiber
400 MHz
0.15 THz
@ 1.97 µm
F = 200
FSR = 6.25 GHz
m/q = 25/1
Not reported12/13CO2
in cavity
Figure 3a
[26]
2014
Ti:sapphire-pumped intracavity DFG
1 GHz
0.2 THz
@ 4.33 µm
F = 8000
FSR = 150 MHz
m/q = 3/20
Not reportedCO2
in 2 m air path
Single
InSb
detector
[18]
2015
Er:fiber
250 MHz
4 THz
@ 1.543 µm
F = 200
FSR = 9.5 GHz
m/q = 38/1
FoM = 2.6 × 10⁻⁵ cm−1 Hz−1/2H13C14N
in 0.5 cm cell
Figure 3b
[16]
2019
Er:fiber
250 MHz
1.7 THz
@ 1.578 µm
F = 18,000
FSR = 267 MHz
m/q = 16/15
NEA ** = 1 × 10⁻⁸ cm−1 @ 2000 sCO
in cavity ††
Figure 3b
[27]
2016
Er:fiber
250 MHz
0.85 THz
@ 1.53 µm
0.12 THz steps
F = 300
FSR = 1 GHz
m/q = 4/1 (or higher)
NEA§ = 8.45 × 10⁻⁴ cm−1 @ 0.1 sC2H2
in 14.2 cm cell
Fiber spectrometer
[28]
2016
Er:fiber
250 MHz
3 THz
@ 1.55 µm
1 THz steps
F = 50,000
FSR = 1 THz
m/q = 400/1
FoM = 2.7 × 10⁻⁹ cm−1 Hz−1/2C2H2
in 33 m multipass cell
Figure 3c
[17]
2020
Er:fiber
250 MHz
4 THz
@ 1.53 µm
F = 50,000
FSR = 600 GHz
m/q = 2400/1
Not reportedC2H2
in 10 cm cell§§
Figure 3c
[29]
2022
GaSb-based ICL
9.7 GHz
1 THz
@ 3.636 µm
F = 3050
FSR = 4.83 GHz
m/q =250/502
NEA = 7.8 × 10⁻⁶ cm−1 @ 1 sHFC-152a–1,1-Difluoroethane
in cavity
Figure 3d
* Comb lines were not resolved by the spectrometer. Sampling point spacing smaller than frep was obtained by spectral interleaving. § Calculated using the value of absorption noise of 0.012 from Figure 5d in the paper and path length of 14.2 cm. Recalculated from the value of 2.2 × 10⁶ Hz−1/2 stated in the paper, defined as in Ref. [30], using the data in Figure 6 in the paper, HITRAN line parameters, and the provided signal-to-noise ratio on a comb mode of 400. ** Taken from Figure 4c in the paper. †† Absorption and dispersion spectra were measured via cavity mode broadening and shift. §§ Also showed cavity mode profile measurements.
Table 2. Summary of continuous-filtering Vernier spectroscopy demonstrations. See text for details.
PaperLaser Source
and frep
Range and ResolutionCavity Finesse and FSRSensitivityTarget
Species
Detection Scheme
[10]
2008
Er:fiber
99 MHz
3.2/1.6 THz
@ 1.525 µm
ΓV = 10/5 GHz
F = 6300
FSR = 396 MHz
Not reportedC2H2Single
InGaAs
detector
[9]
2014
Ti:sapphire
90 MHz
39 THz
@ 0.79 µm
ΓV = 4/1 GHz
F = 300
FSR = 90 MHz
NEA = 1.7 × 10⁻⁸ cm−1 @ 100 ms
FoM = 6 × 10⁻¹¹ cm−1 Hz−1/2
O2 and H2O in airFigure 4a
[20]
2017
Ti:sapphire
90 MHz
60 THz
@ 0.79 µm
ΓV = 2 GHz
F = 3000
FSR = 90 MHz
NEA = 2 × 10⁻⁸ cm−1 @ 1 s
FoM = 1.1 × 10⁻¹⁰ cm−1 Hz−1/2
O2 and H2O in airFigure 4a
[31]
2016
Tm:fiber-pumped OPO
125 MHz
11 THz
@ 3.2 µm
(in 16 steps)
ΓV = 10 GHz
F = 300
FSR = 250 MHz
NEA = 6.2 × 10⁻⁷ @ 2 ms
FoM = 3.3 × 10⁻⁹ cm−1 Hz−1/2
H2O and CH4 in airGrating and single HgCdTd
detector
[22]
2017
Tm:fiber-pumped OPO
125 MHz
7.2 THz
@ 3.25 µm
ΓV = 7–8 GHz
F = 300
FSR = 250 MHz
NEA = 5.2 × 10⁻⁸ cm−1 @ 1 s
FoM = 1.7 × 10⁻⁹ cm−1 Hz−1/2
CH4 and H2O in airFigure 4a
[32]
2019
Er:fiber
250 MHz
1.6 THz
@ 1.57 µm
ΓV = 6.6 GHz
F = 760
FSR = 250 MHz
NEA = 4 × 10⁻⁷ cm−1 @ 25 ms
FoM = 2.6 × 10⁻⁸ cm−1 Hz−1/2
for 3.8 cm flame diameter
H2O and OH
in a flame
Figure 4a
[33]
2020
Er:fiber
125 MHz
1.2 THz
@ 1.578 µm
ΓV = 4.4 GHz
F = 1050
FSR = 250 MHz
NEA = 5.5 × 10⁻⁸ cm−1 @ 50 ms
FoM = 7.4 × 10⁻¹⁰ cm−1 Hz−1/2
CO2 in airFigure 4a
[21]
2021
Er:fiber
125 MHz
1.7 THz
@ 1.575 µm
ΓV = 6.6 GHz
and
2.7 THz
@ 1.650 µm
ΓV = 13 GHz
@ 1575 nm
F = 760
and
@ 1650 nm
F = 370
FSR = 250 MHz
@ 1575 nm
NEA = 5 × 10⁻⁹ cm−1 @ 1 s
FoM = 4 × 10⁻¹⁰ cm−1 Hz−1/2
and
@ 1650 nm
NEA = 1 × 10⁻⁷ cm−1 @ 1 s
FoM = 8 × 10⁻⁹ cm−1 Hz−1/2
CO2 and CH4Figure 4b
This work MIRYb:fiber-pumped DFG
125 MHz
3.7 THz
@ 3.36 µm
ΓV = 4.5 GHz
F = 430
FSR = 125 MHz
NEA = 6.1 × 10⁻⁷ cm−1 @ 50 ms
FoM = 4.8 × 10⁻⁹ cm−1 Hz−1/2
CH4Figure 5
This work NIRTi:sapphire
91 MHz
3 THz
@ 0.78 µm
ΓV = 0.9 GHz
F = 16,400
FSR = 182 MHz
NEA = 4 × 10⁻¹⁰ cm−1 @ 1000 s
FoM = 2.1 × 10⁻¹⁰ cm−1 Hz−1/2
H2O in airFigure 7

3.1. Comb-Resolved Vernier Spectroscopy

3.1.1. Grating-Based Vernier Spectrometers

The first demonstration of Vernier spectroscopy by Gohle et al. [8] was based on a 1 GHz Ti:sapphire laser with stabilized frep, and an external cavity that was used to both filter the comb and to enhance the absorption length. The detection system consisted of a high-resolution diffraction grating in a Czerny–Turner arrangement and a CCD camera. A mirror between the grating and the camera was rotated synchronously with the cavity length scan, as depicted in Figure 3a, and the interleaved spectrum had a 1 GHz sampling point spacing. The system was used to detect absorption and dispersion spectra of O2 at around 760 nm, in good agreement with theoretical predictions. This work demonstrated the high-resolution, wide bandwidth and fast-acquisition capability of Vernier spectroscopy, achieving a detection sensitivity of 5 × 10⁻⁶ cm−1 in 10 ms, limited by the residual phase noise. The recorded range was limited by the size of the CCD camera, and no active locking was employed to enable averaging of the spectra.
Later, Zhu et al. [23] implemented a similar detection system in the near-infrared region, using a 250 MHz Er:fiber comb and a Czerny–Turner spectrometer with a scanned mirror and a CCD camera to measure the absorption spectra of acetylene. The filtered comb lines were not resolved by the spectrometer—the final spectral resolution was 0.5 GHz, twice the frep of the laser, limited by the used combination of the spot size and the signal-to-noise ratio on the camera and the scanning speed. The frequency scale was thus not self-calibrated and the intensity of the acetylene spectra was visibly distorted. The detection sensitivity was improved compared to the first demonstration, but again no active lock was employed to enable averaging.
In the first demonstration by Gohle et al. [8], the sampling point spacing in the final spectrum was equal to the comb frep. To decrease the sampling point spacing, one can sequentially tune both the comb frep and the cavity FSR and interleave the resulting spectra. This was done by Siciliani de Cumis et al. [15,24], who combined the tuning of the frep of a high-power 2 μm comb (fully stabilized 250 MHz Er:fiber comb shifted to 2 μm in a Tm-Ho amplifier) and the FSR of a 3 cm long Vernier cavity to measure high precision spectra of CO2 with a sampling point spacing of 35 MHz. The transmitted comb modes were resolved using a diffraction-limited grating dispersive spectrometer (Fastie–Ebert monochromator) and detected using a CCD camera. The spectrometer limited the simultaneous acquisition range to 1 cm−1 [15], but much larger spectral coverage was obtained by stitching the individual spectra [24]. A dither lock based on an error signal derived from the cavity transmission was implemented to ensure that the transmitted comb modes were on resonance with the cavity modes and to enable precision scanning and averaging. Using this spectrometer, the authors retrieved line positions and shifts of the CO2 lines with sub-MHz precision [15], and later on other line parameters of these transitions [24]. More recently, they used a spectrometer based on the same principle but a different comb source (fully stabilized 400 MHz Tm:fiber laser) to determine the fractional isotopic ratios of 13C/12C in a CO2 sample with 3% precision [25].

3.1.2. Other Spectrometers Employing Vernier Filtering

The first implementation of comb-resolved Vernier filtering in the mid-infrared range was done by Galli et al. [26] using a fully stabilized 1 GHz comb emitting around 4.3 µm, based on intracavity difference frequency generation in a Ti:sapphire laser. A Vernier cavity was used to filter one comb mode at a time, and the comb modes were sequentially recorded using a single InSb photodiode. The spectrometer was used to record the 200 GHz wide spectra of atmospheric CO2 in a 2 m long free-space path between the laser source and the Vernier cavity.
Hébert et al. [18] combined a Vernier cavity and a spectrometer based on a virtually imaged phased array (VIPA), schematically shown in Figure 3b, to record the individual modes of a fully stabilized 250 MHz Er:fiber comb. The cavity length was stabilized to the comb at each step of the FSR scan using a dither lock, and the final spectrum had a sample point spacing of 250 MHz. A 4 THz wide absorption spectrum of H13C14N was measured in a 5 cm long cell placed after the Vernier cavity. The frequency accuracy of the spectrometer was confirmed by a good agreement of center frequencies and widths with previous high-precision measurements (125 MHz and 360 MHz, respectively).
The combination of a fully controlled 250 MHz Er:fiber comb, Vernier cavity and a VIPA spectrometer was also used by Kowzan et al. [16] to perform cavity mode width and mode shift spectroscopy. The comb and the high finesse cavity were stabilized to a 1564 nm narrow-linewidth continuous wave (CW) external cavity diode laser. A precision scan of the cavity allowed the 14 kHz wide profiles of the cavity modes with 3 kHz sampling point spacing to be recorded. The center frequencies of the cavity modes were determined with Hz level precision, limited by the linewidth of the comb modes. This is, to date, the highest resolution and precision demonstrated directly with a comb-based system. The absorption and dispersion spectra of a CO sample contained inside the cavity were recorded via the measurement of the broadening and shift of the individual cavity mode profiles. The center frequencies of the CO transitions were found with uncertainties down to 10 MHz, and the pressure shift coefficients were in good agreement with previous measurements.
A different approach was employed by Coluccelli et al. [27] to measure the high-precision spectra of acetylene at 1.5 μm. The spectrometer was based on a fully stabilized 250 MHz Er:fiber comb, a Vernier cavity, and a fiber spectrometer that provided spectral-to-spatial mapping of the resolved comb modes. The fiber spectrometer produced a speckle pattern of the comb light that was recorded using an InGaAs camera. The contrast of the spectra retrieved by the image recognition algorithm was found to be higher when a smaller number of modes illuminated the fiber. This limited the simultaneous coverage of the spectrometer to below 1 nm (the bandwidth of the incident comb was reduced to this value using an in-fiber filter), and a couple of spectra were stitched together to achieve 7 nm coverage. The C2H2 sample was contained in a 14.2 cm long cell placed after the Vernier cavity, and center frequencies of the P-branch lines were found with 3.5 MHz uncertainties.

3.1.3. Vernier Spectroscopy Based on Micro-Cavities or Chip-Scale Combs

Comb-resolved Vernier filtering becomes particularly convenient to implement when either the cavity FSR or the comb frep is large (>10 GHz), which is the case for micro-cavities or chip-scale comb sources, respectively. Gambetta et al. [28] exploited the large FSR of a micro-cavity resonator (1 THz) to filter the comb modes of a fully stabilized 250 MHz Er:fiber comb, as shown in Figure 3c. The comb bandwidth was reduced to less than the cavity FSR using a tunable filter, so that a single comb mode was transmitted at a time through the scanning Fabry–Perot micro-cavity resonator (SMART). The selected single comb mode was sent through a 33 m long multipass cell filled with C2H2 before reaching a photodiode. A spectrum spanning 3 THz was composed by stitching a couple of consecutive spectra, and the center frequencies of the P-branch lines were found with rms deviation of 2 MHz with respect to HITRAN. An interleaved spectrum with 19.5 MHz sampling point spacing was recorded over a smaller range of 0.27 THz range at different pressures. The figure of merit was comparable to that obtained by Zhu et al. [23] in the same spectral range even though the sample was not in the cavity.
In an improved version of the SMART spectrometer [17], the bandwidth limitation was removed by the use of a grating to separate the simultaneously transmitted comb modes. Two photodiodes were used to detect two different modes diffracted by the grating: one was used as a reference to identify the transmission order with the help of a co-propagating narrow linewidth CW laser, while the second was placed on a translation stage to detect up to six consecutive comb lines spanning 4 THz of bandwidth. Spectra of C2H2 were recorded in a 10 cm long cell placed before the micro-cavity, with frequency precision similar to the previous work. To characterize the resolution of the spectrometer, 380 kHz wide profiles of a test cavity were measured in reflection over a 300 GHz range with ~80 kHz sampling points spacing in 200 ms. The retrieved cavity mode widths were in excellent agreement with those obtained using a CW laser, and confirmed that the resolution of the spectrometer was of the order of 50 kHz, given by the linewidth of the comb modes.
So far, there has been only one demonstration of Vernier spectroscopy based on a chip-scale frequency comb. Sterczewski et al. [29] developed a compact spectrometer based on a free-running 9.7 GHz GaSb-based interband cascade laser (ICL) emitting around 3.64 µm and a 3 cm long Vernier cavity, as shown in Figure 3d. The length of the cavity containing the sample, was tuned so that a single comb mode was transmitted at a time and measured using a single HgCdTd photodiode after the cavity. The absorption spectra of difluoromethane spanning 1 THz of bandwidth (limited by the emission spectrum of the comb) were recorded with 2 ms temporal resolution, and with the relative frequency scale calibrated using the known value of frep. Spectra were coherently averaged, showing white noise behavior up to 200 ms. The fast acquisition of broadband spectra in the mid-infrared region opens up for real-time sensing of hydrocarbons.

3.2. Continuous-Filtering Vernier Spectroscopy

The concept of cavity filtration without resolving the comb modes was first implemented by Thorpe and Ye [10] using a fully stabilized 99 MHz Er:fiber comb. The mismatch between the comb and the cavity was kept small enough so that the spacing of the Vernier orders remained larger than the comb spectral bandwidth. Under these conditions, only one Vernier order was transmitted, and a 4 THz wide spectrum of C2H2 was recorded in 2 ms using a single photodiode. The frequency scale was not calibrated and no averaging was demonstrated.
The first demonstration of stabilized and calibrated continuous-filtering Vernier spectroscopy (CF-VS) was by Rutkowski and Morville [9] using a 90 MHz Ti:sapphire laser. In this work, the consecutive VOs were separated by a diffraction grating mounted on a galvo scanner rotating synchronously with the FSR scan, as shown in Figure 4a. One VO was selected and spatially stabilized using the difference output of a split photodiode to generate an error signal fed back to the cavity length. The VO intensity was detected using the summing output of the split photodiode. The relative frequency scale was calibrated using a signal of an etalon with a known FSR measured using a portion of the comb sampled after the grating. The absolute frequency scale was calibrated by comparing the positions of absorption lines in the experimental spectrum with the HITRAN database. Spectra of H2O and O2 spanning 39 THz around 800 nm were recorded in 100 ms using an open-to-air cavity with a moderate finesse (~300), and the achieved detection sensitivity was higher than that of any of the comb-resolved Vernier spectrometers. In the following work [20], the authors introduced a mathematical model of the Vernier transmission spectrum that accurately reproduced the absorption spectrum of H2O measured under different FSR/frep mismatch conditions. The sensitivity and resolution of the spectrometer were improved using a cavity with a higher finesse (~3000), the spectral coverage was extended to 60 THz, and the possibility of averaging successive spectra was demonstrated. Later, a closed cavity with a finesse of 17,000 was implemented in this setup and used to measure the spectrum of N2 produced in a discharge source [34]. This improved spectrometer is described in detail in Section 5.
Khodabakhsh et al. [22,31] implemented CF-VS in the mid-infrared region using a 125 MHz Tm:fiber pumped doubly resonant optical parametric oscillator emitting around 3.3 µm, and a low finesse (~300) Vernier cavity. In the first demonstration [31], the VOs after the cavity were separated using a grating and the selected VO was recorded using a HgCdTd photodiode. The grating was manually rotated to record an 11 THz wide spectrum of H2O and CH4 in 16 steps, with a detection sensitivity of 40 ppb for CH4 in 2 ms. In the following work [22], a detection system based on a similar idea as in the work of Rutkowski and Morville [9,20] was implemented. Because of the lack of a suitable split photodiode in the 3.3 µm range, a D-mirror and two photodiodes were used to obtain an error signal for VO stabilization. The feedback was sent to the frep of the Tm:fiber pump laser. The stabilization allowed spectra spanning 7.2 THz of bandwidth around 3.3 µm in 25 ms to be recorded, with the relative frequency scale calibrated using an etalon with a known FSR. Spectra of CH4, as well as dry and laboratory air, were recorded, and the model of the Vernier spectrum was used to retrieve the concentrations via multiline fitting. Averaging and white noise behavior were demonstrated up to 10 s, and the detection sensitivity for CH4 was 360 ppt Hz−1/2.
The fast acquisition rate enabled by CV-FS was utilized by Lu et al. [32] to monitor time-dependent H2O and OH concentrations in a premixed methane/air flat flame. The setup was based on a 250 MHz Er:fiber comb, a Vernier cavity open to air, and a detection system based on a quadrant photodiode and feedback to the Er:fiber laser oscillator. The flat flame burner was placed in the middle of the cavity, and the air/fuel ratio was modulated with a square wave to induce periodic changes in the combustion product concentrations. The concentrations of H2O and OH were retrieved with 25 ms time resolution and percent-level precision using multiline fitting to the recorded high-temperature spectra. The steady-state concentrations followed the trend predicted by one-dimensional flame simulations.
A similar CV-FS spectrometer was used by Głuszek et al. [33] in combination with a compact fully fiberized 125 MHz Er:fiber comb to validate the laser’s performance for broadband spectroscopy. The spectra of atmospheric CO2 were recorded and the achieved sensitivity was of the same order as in previous implementations of Vernier spectroscopy based on commercial Er:fiber comb sources [23,32].
In all CF-VS works mentioned above, the synchronization of the FSR/frep scan and the grating rotation required active control to ensure fixed direction of the VO after the grating. An error signal was obtained using position-sensitive detection, and fast feedback to the actuators that control the FSR or frep was needed to compensate for the different responses of the actuators. Moreover, the load on the galvo scanner limited the scan rate to 20 Hz. Lu et al. [21] designed a new detection system for CF-VS that required no stabilization and allowed a much faster scan rate. In this new design, the grating was kept at a fixed position, and a moving aperture (a chopper wheel with custom-made slit), passively synchronized with the FSR scan, was used to select one VO, as shown in Figure 4b. The slit size was smaller than the VO separation and larger than the VO beam diameter, which yielded a sufficient degree of tolerance to the different responses of the chopper and the PZT used to scan the cavity FSR, removing the requirement for stabilization. The selected VO was imaged on a single photodiode using a lens. The spectrometer was based on the compact 125 MHz Er:fiber comb (same as in Ref. [33]) using both direct emission from the laser at 1.57 µm, and emission shifted to 1.65 µm in a polarization-maintaining fiber. Spectra of CO2 and CH4 were recorded in these two spectral ranges, respectively, with acquisition rates up to 100 Hz At these rates, the scanning speed was above the adiabatic limit, therefore a correction to Equation (4) was introduced to account for the decrease of the absorption signal. The achieved absorption sensitivity was better than in previous demonstrations based on Er:fiber combs.
In Section 4, we describe a new implementation of CF-VS in the mid-infrared region, based on a difference frequency generation source and a simplified detection scheme with neither high-bandwidth feedback nor a moving aperture.

3.3. Other Applications Employing Vernier Filtering

Vernier filtering has been exploited in numerous applications other than molecular spectroscopy, ranging from astrocombs [35,36,37,38,39] to long-distance measurements [40] and temperature sensing [41], and listing all of them is beyond the scope of this review. Below we mention two works that utilize not only the passive cavity filtering, but also the tunability offered by the Vernier filtering.
The spacing of the Vernier orders is inversely proportional to the detuning of the cavity length from the perfect match condition. Zhang et al. [42] exploited this property in a high-sensitivity optical fiber strain sensor. The laser source was a home-made Er:fiber laser with a repetition rate of 18.8 MHz. It was coupled to an 11 m long fiber resonator (FSR = 19 MHz, finesse = 28) on which the strain was exerted. Measuring the variation of FSRV as a function of the strain yielded information on the cavity length variation.
Hardy et al. [43] used the Vernier filtering inside the cavity of an ns OPO to obtain a single-mode idler emission around 4.2 µm. This resulted in a broadly tunable mid-infrared laser source, which was applied to multi-wavelength differential absorption LIDAR sensing of atmospheric CO2.

4. Mid-Infrared Continuous-Filtering Vernier Spectroscopy Based on a DFG Source

The only previous demonstration of CF-VS in the mid-infrared (MIR) region was based on an OPO [22], and required a couple of feedback loops to operate. First, the length of the OPO cavity needed to be actively synchronized with the length of the pump laser cavity. Second, the spectrometer required active synchronization of the FSR scan with the rotation of the grating. In this section, we describe the first demonstration of CF-VS in the MIR based on a difference frequency generation (DFG) source. DFG sources based on pump and signal originating from a single laser are inherently offset frequency free. This makes perfect matching to cavities problematic since the cavity offset frequency is not zero. However, Vernier spectroscopy, which relies on sequential coupling to the cavity, is very suitable for DFG sources. The DFG-based CF-VS system described below uses a rotating grating, a fixed aperture and a proper choice of imaging lenses, which remove the requirement of active stabilization of the FSR/frep scan. The sensitivity achieved with this more compact system is comparable to that of the previous demonstration based on the OPO.

4.1. Experimental Setup

The DFG source is based on a 125 MHz Yb:fiber pump laser (MenloSystems, Orange High Power), and has been described in detail in Refs. [44,45]. The signal, obtained by shifting part of the pump laser power in a nonlinear fiber, was combined with the pump in a PPLN crystal to produce an idler tunable within the 2.7–4.2 µm range. Compared to Ref. [45], the current driver of the oscillator was replaced with a low-noise current driver, which reduced the intensity noise in the 10–300 kHz range, previously used to stabilize the position of the delay in the pump arm with the method of Ref. [46]. The delay stabilization was thus replaced with a conventional dither lock: the pump diode current of the Yb:fiber oscillator was modulated at 7 kHz, which modulates the soliton/signal wavelength via modulating the pump power, which in turn translates into modulation of the idler power. A small portion of the idler was sampled with a pellicle beam splitter and detected using a HgCdTd photodiode. The signal of the photodiode was demodulated in a lock-in amplifier, whose first harmonic output was used as an error signal sent to a proportional-integrator (PI) controller. The PI controller sent a correction signal to the PZT attached to the retroflector in the pump delay arm to keep the idler power at maximum.
The setup is illustrated in Figure 5. The MIR idler propagated through free space and was mode-matched to the TEM00 modes of a cavity with a finesse around 400 at 3.3 µm using a telescope (L1, L2). The cavity was 120 cm long (FSR of 125 MHz matched to frep) and made of two mirrors (CM1, CM2) with a 5 m radius of curvature. An open-ended gas container with an inlet for the gas sample was positioned between the cavity mirrors. Two mass flow controllers (MFC1, MFC2) were used to set the flow rates of 45 ppm CH4 and pure N2 that were premixed and sent to the gas container. One of the cavity mirrors was mounted in a holder fixed on a translation stage (TS) to tune the cavity length around LPM. The other mirror was attached to a PZT mounted in another holder to dither the cavity length, allowing the scanning of the cavity resonances, and thus the frequencies of VOs. Sinusoidal modulation generated by a low-noise function generator (FG) was applied to the PZT via a high-voltage amplifier (HVA). After the cavity, the beam was re-collimated by a lens (L3) and incident onto a diffraction grating (DG, 450 lines/mm, GR1325-45031, Thorlabs) mounted on a galvo scanner (GS), driven by the same function generator as the PZT. The polarization of the beam was adjusted using a half-wave plate to maximize the diffraction efficiency of the grating. The grating dispersed the consecutive VOs and one VO was spatially filtered with an iris.
For optimization of the cavity FSR and galvo scans, a part of the beam after the iris was directed on a split HgCdTe detector (SPD, Vigo systems) using a 50/50 pellicle beam splitter (BS1) mounted on a flip holder (shown in the yellow-shaded box in Figure 5). The differential output of the split detector was used to synchronize the rotation of the galvo scanner with the scan of the cavity PZT. The phase of the signal sent to the galvo scanner and the gain of the signal sent to the HVA were adjusted to obtain a stable output from the SPD during the scan. Since the slit size of the iris was larger than the beam diameter but smaller than the spatial separation between two VOs, the synchronization had a degree of tolerance for the different responses of the galvo scanner and the PZT sufficient to remove the requirement of active stabilization. The focused beam was kept within the active area of the detector using a proper choice of imaging lenses (L3 and L4). After the optimization, the SPD was not used, and BS1 was flipped down.
The optimized beam was divided by another pellicle beam splitter (BS2), whose transmission was focused with a lens (L5, 5 cm focal length) onto a DC-coupled HgCdTe detector (PD1, Vigo systems, PVI-4TE-6) to acquire the spectrum. The reflected beam of the BS2 was sent through a 3 mm thick uncoated silicon window (Thorlabs, WG80503, FSR ≈ 14 GHz), and focused by a similar lens (L6) onto another HgCdTe detector (PD2) for frequency calibration. The outputs of both detectors were digitized using a data acquisition card (DAQ, National Instruments, PCI-6122) with a 500 kS/s sampling rate, which was triggered by the TTL output of the function generator.
To compensate for slow drifts of the cavity length and/or the laser frep, a slow feedback loop was implemented using the signal of PD1 (depicted in the blue box in Figure 5), similar to that performed in Ref. [21]. The Vernier signal was demodulated using a lock-in amplifier (LIA) referenced to the modulation from the FG that drives the PZT and the GS scans. The first harmonic output of the LIA was sent to a PI controller (Newport, LB1005). The correction signal from the PI controller was summed with the modulation signal that controlled the cavity FSR. The stabilization control ensured that the desired spectral range was centered within the acquisition window over a long period of time.

4.2. Procedures

To evaluate the performance of the spectrometer, we measured absorption spectra of CH4. The center wavelength of the idler was tuned to 3.3 µm yielding a spectral power of ~110 mW. To avoid absorption saturation, the 45 ppm CH4 sample was diluted in pure N2 using flow rates of 400 mL/min and 9.1 mL/min, respectively, to yield 1 ppm CH4 concentration. During the data acquisition, these flow rates were maintained. The cavity length was detuned by ΔL = −80 μm from the perfect match length to yield a spectral resolution of Γv = 4.5 GHz. The scan rate, i.e., the frequency of the modulation signal applied to the FG, was set to 20 Hz. This rate is the maximum achievable with the galvo-scanner assembly used. The PI controller for active stabilization was then turned on to prevent long-term drifts. For measurement of background spectra, the gas tube was filled with pure N2 with a flow rate of 400 mL/min. The frequency scale was calibrated using the etalon signal, as described in Ref. [21].
We estimated the scanning speed for the spectral region of interest from the time separation of the zero crossings of the etalon signal. The average scanning speed in the recorded range was 0.57(3) THz/ms, where the uncertainty is 2/3 of the difference between the maximum and minimum values. For a finesse of 400, the adiabatic limit is 9.2 THz/ms calculated using Equation (2), thus the scanning speed was safely below the limit and the unmodified Vernier model given by Equation (4) is valid.

4.3. Results

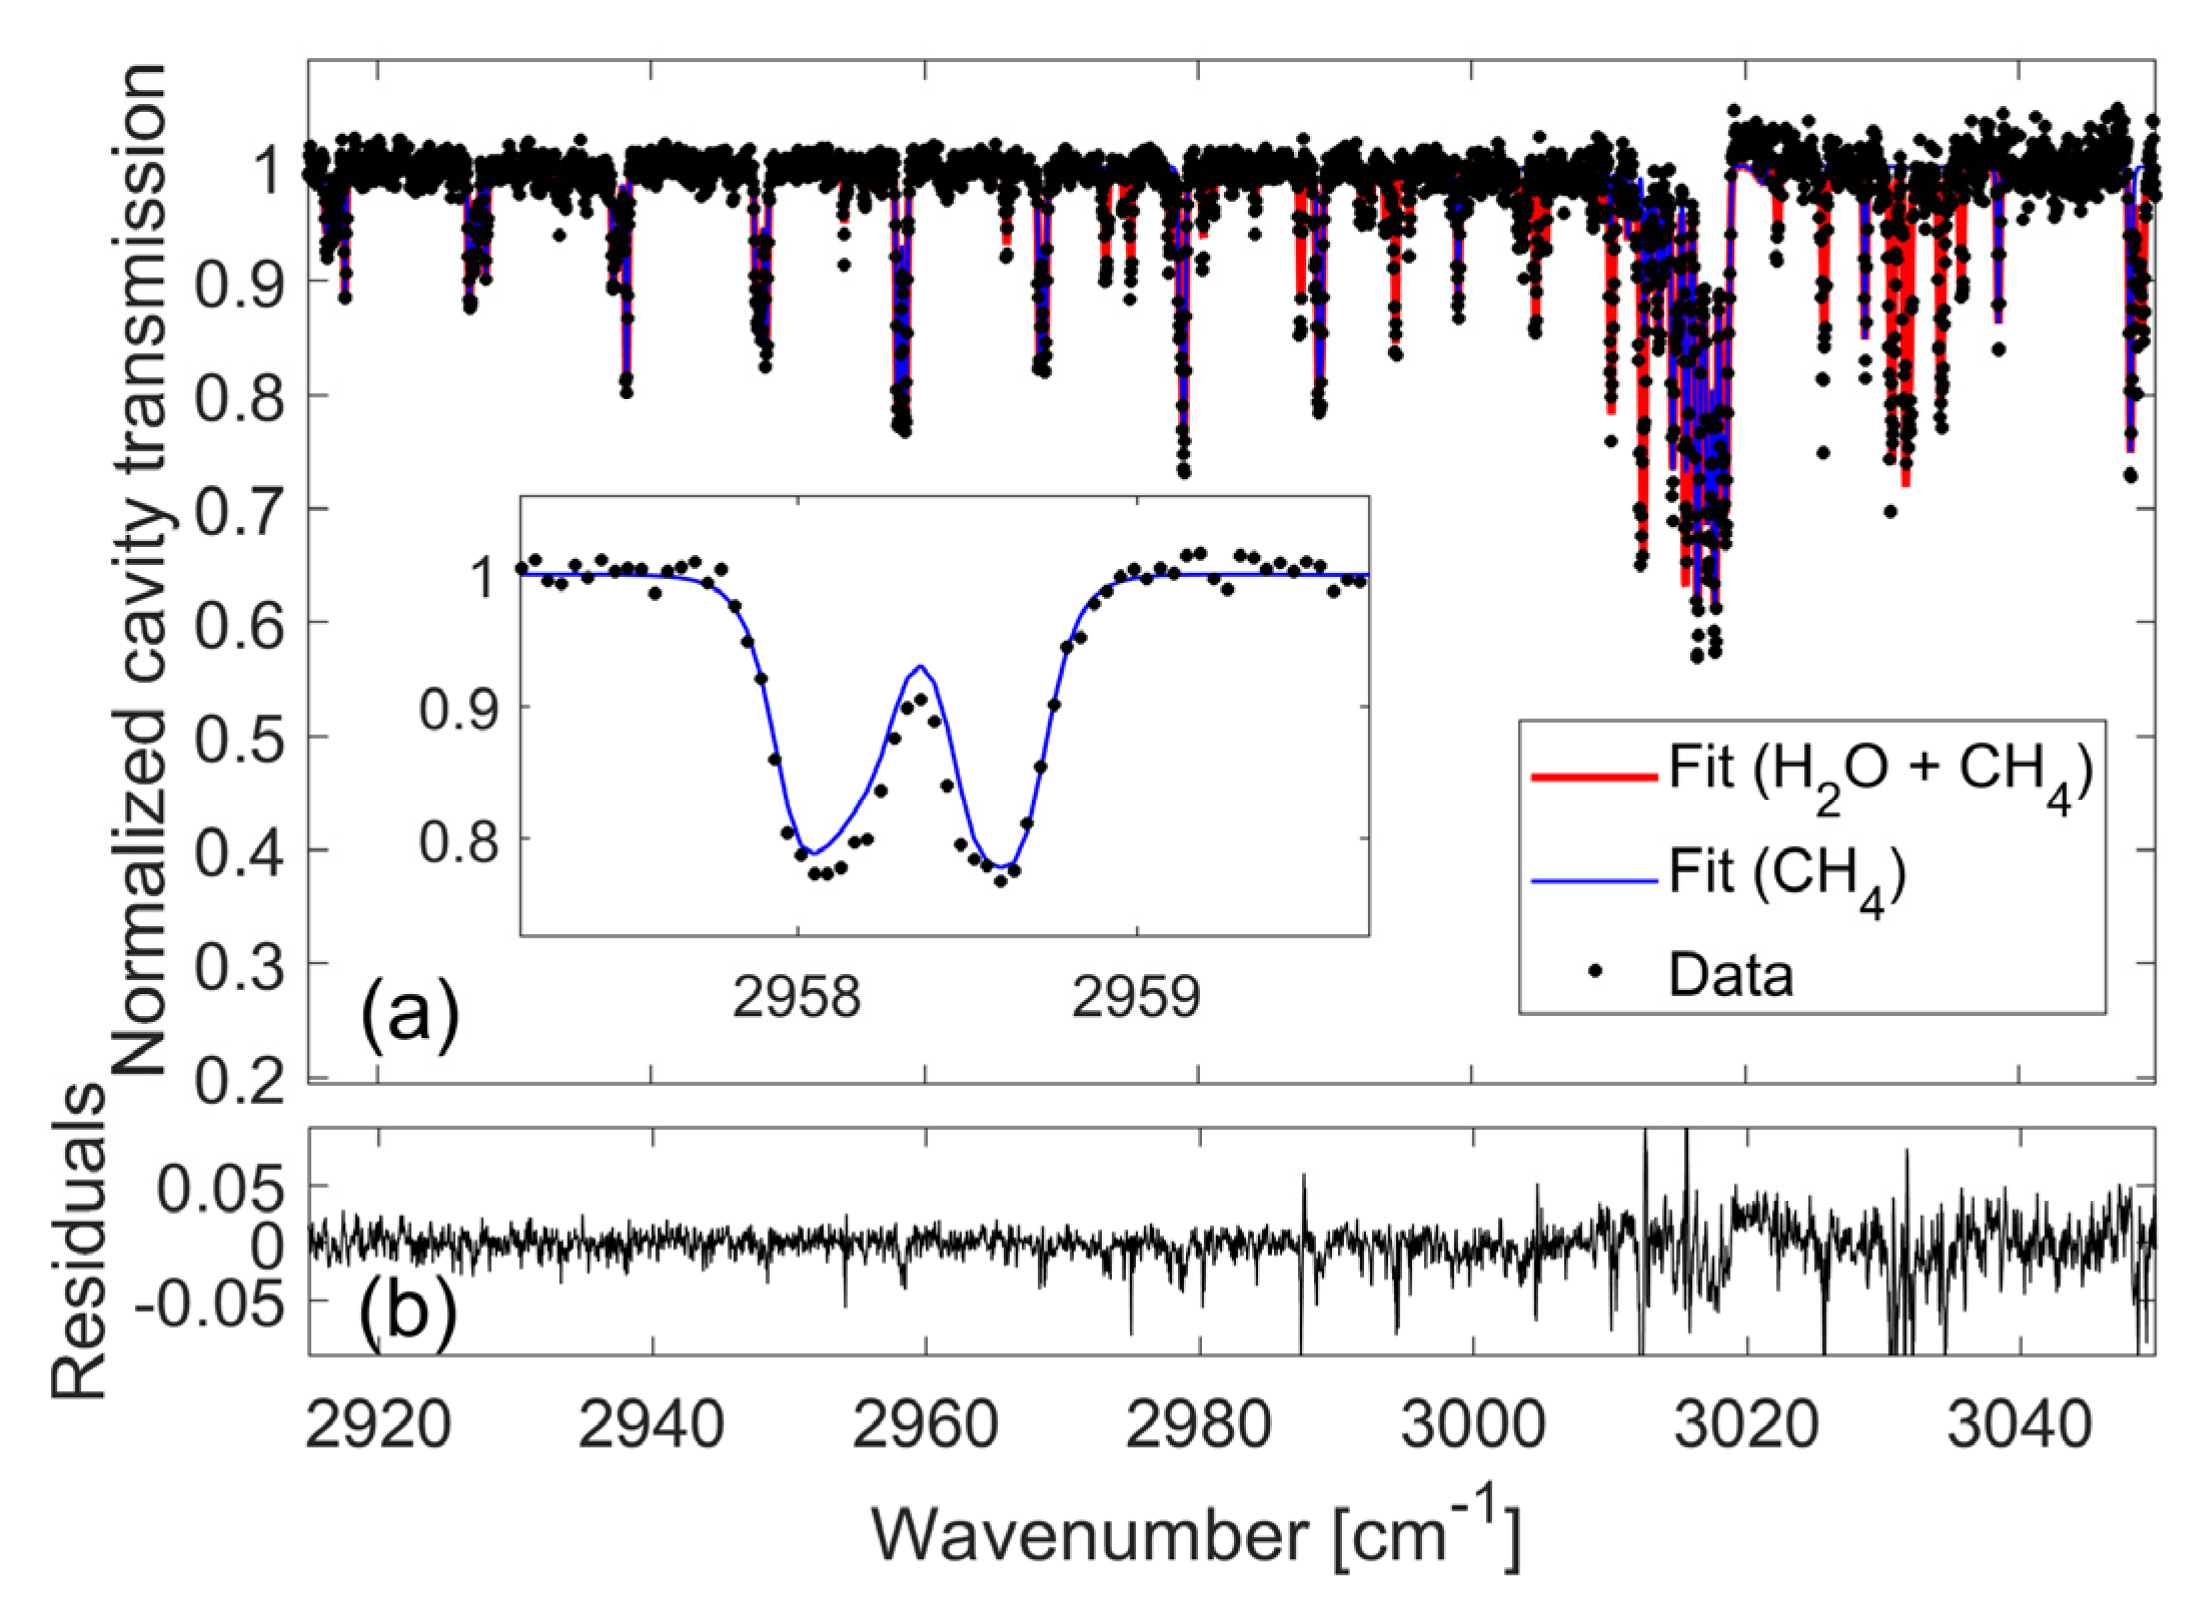
Figure 6a shows a normalized absorption spectrum of 1 ppm of CH4 in N2 at atmospheric pressure recorded in 25 ms (markers). Water absorption lines were also observed in the spectrum, which we attribute to the presence of air at the two ends of the gas container. Hence, we fitted a model of a Vernier spectrum [Equation (4)] that includes both methane and water absorption lines. The fit is shown by the curves in Figure 6a, where the combined fit of water and methane is shown in red, while the methane fit alone is shown in blue. The inset shows a zoom on a spectral region where there are no water absorption lines. The baseline remaining after the background normalization was corrected with a slowly varying function, as detailed in Ref. [21]. In the model, the CH4 and H2O line parameters were taken from the HITRAN2016 database [47]. The pressure and temperature that determine the line broadening were set to 760 Torr and 295 K, respectively, and ΔL was fixed to the expected value of −80 μm. Since the finesse of the cavity was not known with sufficient accuracy, we fixed the CH4 concentration to 1 ppm, and used H2O concentration and finesse as free parameters in the fit. The retrieved H2O concentration was 265(20) ppm, and the finesse was 421(3). The uncertainties are the standard deviations of 20 values retrieved from consecutive scans. As evidenced by the residuals shown in Figure 6b, the general agreement between the data and the fit is good. The absorption features of both species are clearly distinct. The structure in the residuals originates from the remaining etalon fringes after the baseline correction and from uncertainties in the frequency scale calibration.
The standard deviation of the noise on the baseline (i.e., the ratio of two consecutive background spectra), was 9.8 × 10⁻³ in 50 ms. This yields an NEA of 6.1 × 10⁻⁷ cm−1 in 50 ms, calculated assuming a path length of LPM F/π = 160 m, and an FoM of 4.8 × 10⁻⁹ cm−1 Hz−1/2 for 820 spectral elements. This implies that absorption sensitivity comparable to that reported in Ref. [22] (see Table 2) is obtained using a more compact comb source and detection system. The slight increase in the noise level compared to the previous demonstration was caused by the higher intensity noise in the DFG source.

5. Near-Infrared Continuous-Filtering Vernier Spectroscopy: High Sensitivity and Resolution Close to the Doppler Limit

In this section we present an improved version of the spectrometer based on a Ti:sapphire laser, which provides a combination of high sensitivity and high resolution. This spectrometer has already been used for spectroscopy of N2 produced in a hollow-cathode sputtering discharge source [36], but was not described in detail in that work. Here, the reactant gas was disconnected and the cavity was instead open to ambient air. The results presented below were obtained with weak water transitions at reduced pressure to emphasize both the averaging capability and spectral resolution at the theoretical limit of the continuous-filtering Vernier approach.

5.1. Experimental Setup

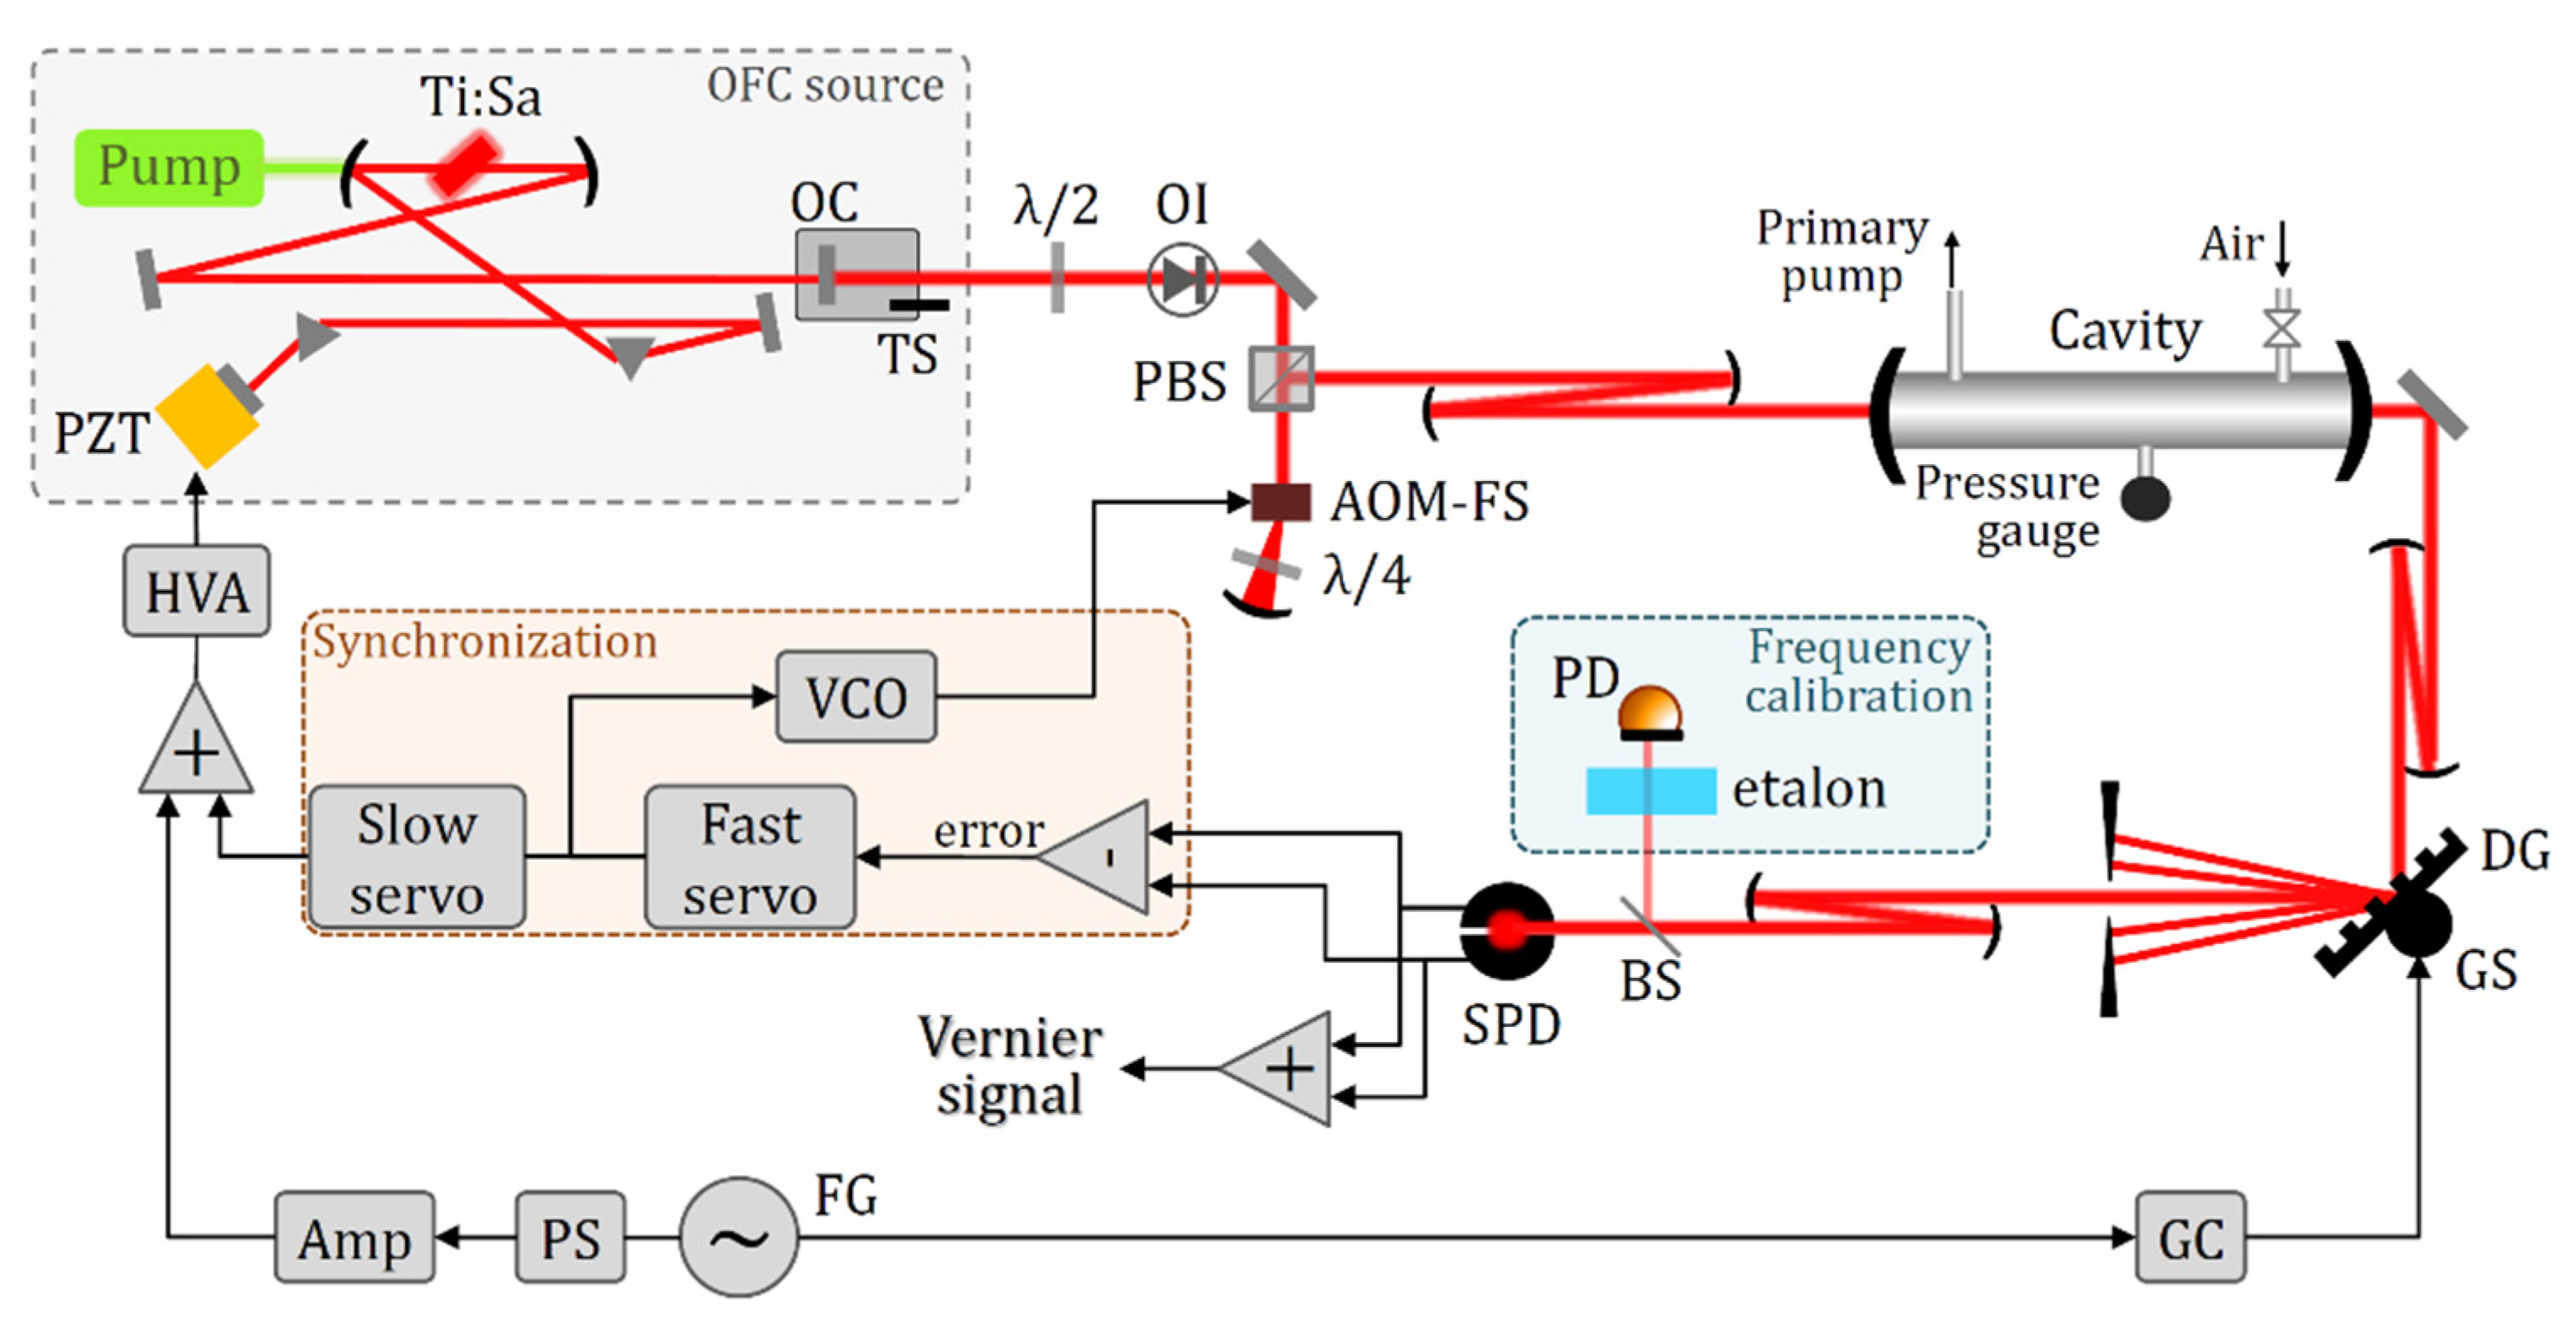
A schematic drawing of the experimental setup is shown in Figure 7. The frequency comb was generated by a Ti:sapphire oscillator centered around λc = 800 nm and delivering 400 mW of average power when pumped with 4.5 W at 532 nm. A pair of prisms used for laser dispersion compensation enabled the adjustment of the central wavelength and the bandwidth of the comb to 100 nm around λc. In contrast to our previous work [20], the Vernier orders were here controlled entirely via the comb mode positions. To this end, the end-mirror of the comb cavity was glued on a PZT-actuator driven by a low-bandwidth (<1 kHz) high-voltage amplifier (HVA). On the other side of the cavity, the output coupler (OC) mount was fixed on a translation stage that was used first to find the perfect match condition (2frep = FSR) and then to adjust the desired mismatch, ΔL. With this arrangement, the laser repetition rate could be varied over 1% around its nominal value at 91 MHz.
The linearly polarized output beam passed through an optical isolator (OI) with a horizontal polarization at the output. A half-wave plate (λ/2) in front of the isolator was used to optimize the output power. The beam then passed through an acousto-optic modulator frequency shifter (AOM-FS), to which a tunable radio frequency signal (100 MHz ± 25 MHz) generated by a voltage-controlled oscillator (VCO) was applied. This allowed us to control the comb teeth position over 100 MHz with a bandwidth higher than 100 kHz. To prevent a spatiospectral chirp of the beam which would prevent a good coupling to the TEM00 mode of the cavity over the full spectrum, we used a double-pass configuration [48]. The beam passed first through a polarizing beam-splitter (PBS) and was focused with a lens in the AOM crystal. The first-order diffracted beam passed through a quarter-wave plate (λ/4) and was reflected back by a curved mirror placed at its exact radius from the crystal. This way, all spectral components of the beam were perfectly retro-reflected in the AOM and the first-order diffracted beam at the second pass had a vertical polarization and was reflected by the PBS. The device did not induce an appreciable change of the spectral shape and its overall transmission efficiency was slightly higher than 60%.
The incident beam on the cavity had an average power of 250 mW and was mode matched to the TEM00 cavity modes by a telescope made of two concave mirrors to avoid chromatic aberration and to prevent small residual fringes on the baseline of the measured spectrum, typically observed when lenses are used. The linear cavity was formed by two high-reflectivity concave mirrors with a radius of curvature of 0.5 m separated by a fixed length of 82.3 cm leading to an FSR close to twice the adjustable laser frep. Reflection coefficients were specified higher than 99.98% around 780 nm corresponding to a cavity finesse close to 15,000. Both mirror substrates were wedged and antireflection coated. The mirrors were placed inside adjustable holders mounted on both sides of a vacuum cell on which a pressure gauge was fixed, with a gas inlet and a gas outlet connected to a primary pump. All measurements presented here were realized with ambient air.
The exiting TEM00 mode was expanded using two concave mirrors to produce a large collimated beam covering the entire surface of a diffraction optical grating (DG, 1200 l/mm) mounted on a galvo-scanner (GS). The selected VO was then shaped with two concave mirrors to fill the area of the split-photodiode (SPD, Pacific Silicon Sensor, QP1-6-TO52, 3 MHz bandwidth) in order to optimize the error signal derived from the subtraction of the two photocurrents. The Vernier signal was obtained from the sum of the photocurrents. Before the SPD, a beam splitter (BS) picked off 10% of the beam power and directed it through a solid glass etalon with FSR of 75 GHz to derive a signal for relative frequency calibration.
The frequency scan of the VO was generated by sending a sinusoidal signal from a frequency generator (FG) to the galvo-scanner. The same signal, adjusted in phase and amplitude, was also sent to the laser PZT. To compensate for high-frequency instabilities of the environment, the error signal from the SPD was sent through a fast servo and applied to the VCO controlling the comb teeth position. This correction signal was also sent to a slow servo and summed with the sinusoidal signal applied to the slow laser PZT to compensate for low-frequency instabilities.

5.2. Procedures

To evaluate the sensitivity and resolution of the spectrometer, the center of the laser emission spectrum was tuned close to 780 nm, at the tail of the high-energy side of the 3ν + δ band of water vapor, just below the oxygen A-band. Between 12,800 and 12,900 cm−1, the strongest water line intensities are 10−25 cm [48], so the highest absorption coefficient is expected to be close to 10−7 cm−1 at standard pressure and temperature. The cell pressure was fixed around 100 mbar yielding transition linewidths of roughly 1.5 GHz. The resolution limit of the continuous Vernier filtering is reached when five comb modes are comprised in the Vernier order linewidth [9]. For a cavity FSR of 180 MHz, the resolution limit is thus 900 MHz, close to half of the linewidth of transitions.
Before the measurement, the cavity was evacuated with the primary pump and the cavity ringdown time was measured over the probed spectral range by switching off the RF power to the AOM-FS once a VO beam was locked on the SPD. The ringdown time was found to be 14.4 µs, constant to within 1% across the entire probed range. This corresponds to a cavity finesse of F = 16,467(160). The cavity cell was then opened to ambient air to reach the desired pressure.
Since the cavity length was fixed, the comb was detuned from the perfect match condition by shifting the frep. To do that, frep was monitored with a fast photodiode using a weak beam leaking from the entrance polarizer of the optical isolator. The output signal was sent to a fast analog-digital converter with a sampling frequency of 200 MHz and frep was measured using a Fourier transform with ±25 Hz accuracy. The laser output coupler mirror was moved by +20 µm from the perfect match condition, corresponding to a change of frep of 1 kHz. This is equivalent to changing the Vernier cavity length by ΔL = −10 μm, which yields a resolution of Γv = 909 MHz.
The selected VO was then locked on the SPD and a 2 Hz sinusoidal signal was applied to the galvo-scanner and the laser PZT, with an amplitude adjusted to reach the desired scanning range of ~100 cm−1. At these settings the scanning was in the adiabatic limit. The Vernier and etalon signals were acquired using an analog-digital converter at the sampling frequency of 200 kHz. The etalon trace was used to retrieve a relative frequency scale at each scan to enable long-time averaging.

5.3. Results

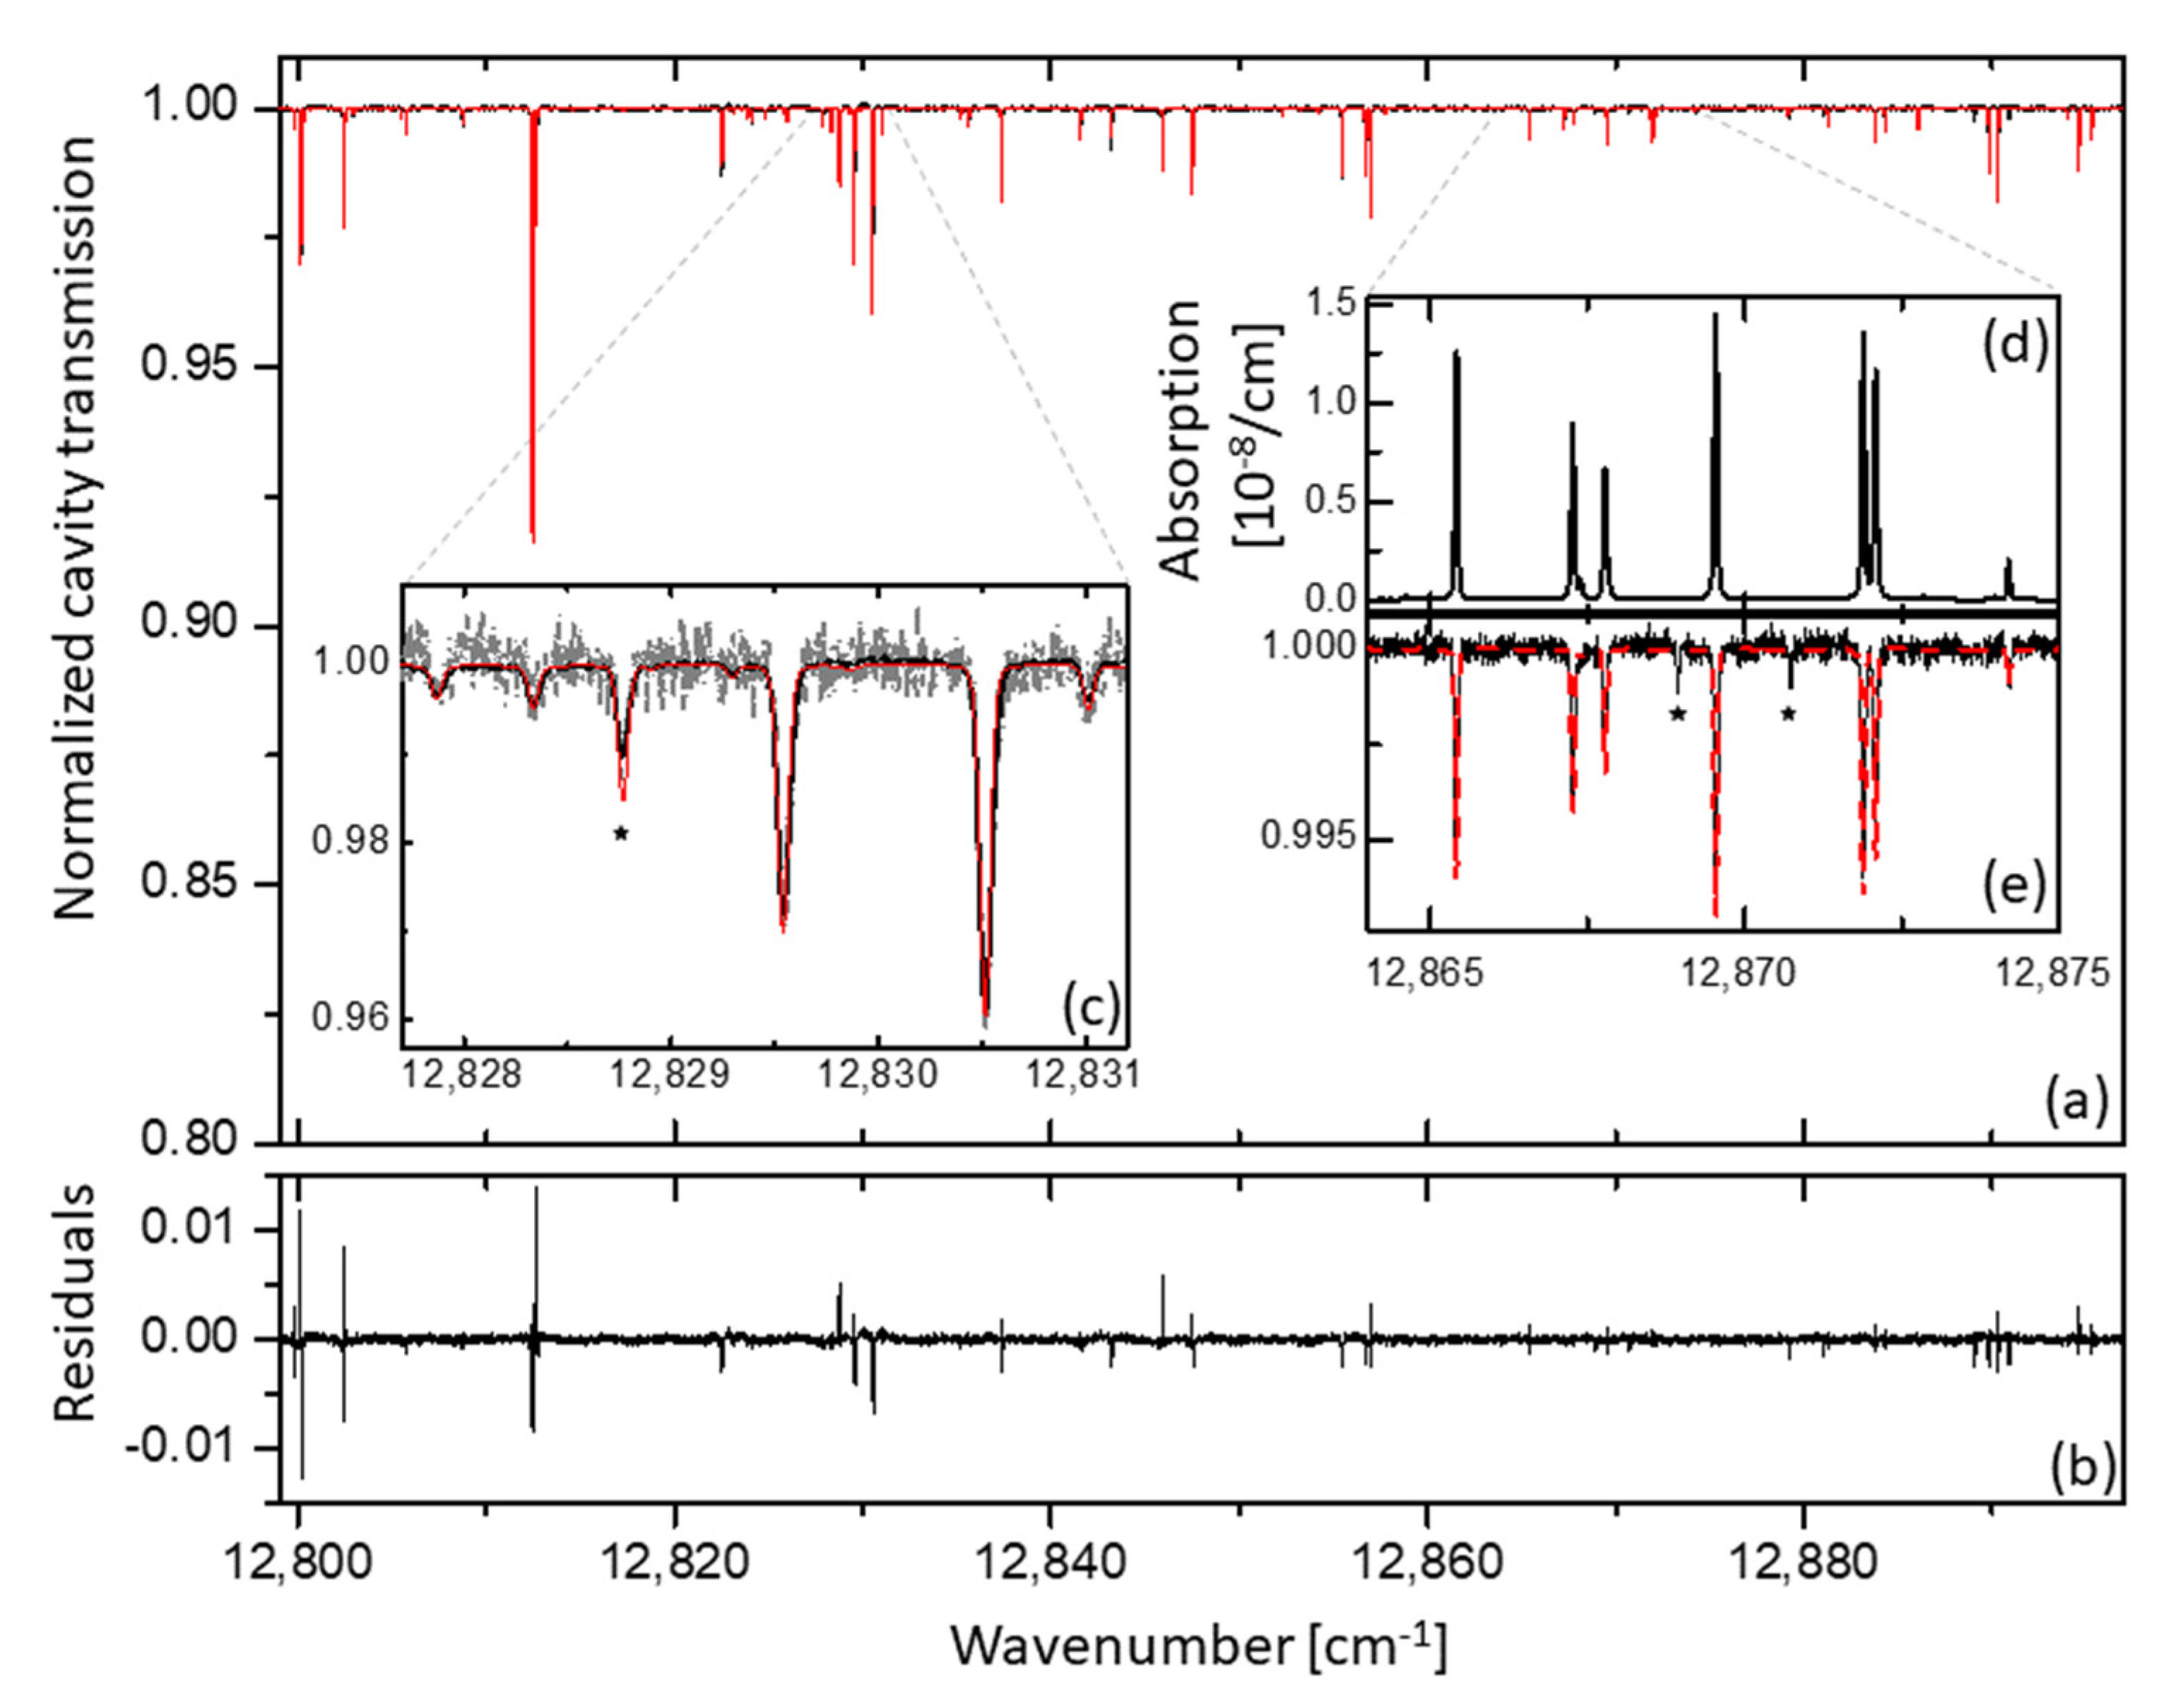
Figure 8a shows a normalized cavity transmission spectrum (in black) recorded with the cavity filled with 129 mbar of ambient air, together with a fit of a water spectrum based on Equation (4) and line parameters from the HITRAN2016 database [47] (in red). The spectrum was averaged 2000 times, corresponding to a total acquisition time of 16.7 min. The water concentration was a free parameter in the fit, together with a slowly varying baseline, which had been removed. The general agreement is good, as shown on the residual plot of Figure 8b. However, the spikes in the residuum indicate slight inaccuracies in the frequency scale that can be attributed to uncertainties in determination of the zero-crossing positions of the etalon trace. This is particularly observable on the low frequency side of the spectrum, where the scanning speed is slower. Moreover, inaccuracies in the HITRAN parameters cannot be excluded in this spectral range of extremely low line intensities [49]. The black star in Figure 8c indicates a water line for which the discrepancies between the spectrum (in black) and the fit (in red) can be attributed to the HITRAN database. Figure 8e shows a zoom of the normalized cavity transmission comprising the weakest water lines and Figure 8d shows the corresponding water absorption coefficient from the fit. The two black stars in Figure 8e highlight two oxygen lines (from the (1-1) hot band of the doubly forbidden X 3 Σ g b 1 Σ g + system) that were not taken into account in the model. Surprisingly, the relative water concentration output from the fit is 7.6%, nearly seven times larger than expected for 50% humidity in ambient air. Water desorption from the cell walls cannot explain this discrepancy as the cell was evacuated before the measurement. After repeating the measurement, we concluded that this large amount of water originated from a small leak at the welds of the water cooling system surrounding the sputtering discharge source. The leak was not observed in the previous discharge experiments [36] since the pressure was much lower (1.3 mbar) and the discharge probably destroyed any water molecules.
Figure 8c shows a comparison of the spectrum averaged 2000 times (black curve) and 10 times (grey dashed curve) in a reduced spectral window. The former spectrum is well centered within the noise fluctuations of the latter, testifying to the coherent averaging process over this duration. The relative noise on the baseline was 7.5 × 10⁻³ for a single scan spectrum (1 average) and 1.67 × 10⁻⁴ for the spectrum averaged 2000 times. Thus the decrease of the noise on the baseline follows perfectly well the square root law for a white-noise-dominated system. The NEA extracted from the baseline noise of the 2000 times averaged spectrum was 4 × 10⁻¹⁰ cm−1 in 1000 s, calculated assuming a path length of LPM F/π = 4300 m. This is the lowest NEA demonstrated with CF-VS, and it corresponds to an FoM = 2.1 × 10⁻¹⁰ cm−1 Hz−1/2 (for 3300 independent spectral elements). The high absorption sensitivity allowed the measurement of the absorption coefficient of the order of 10−9–10−8 cm−1 range with a high signal-to-noise ratio and <1 GHz resolution (Figure 8d).

6. Conclusions

In this paper, we provided a review of the principles and previous demonstrations of Vernier spectroscopy in the comb-resolved and continuous-filtering regime, and we demonstrated two new developments of the CF-VS technique in the near- and mid-infrared ranges.
In the 15 years since its first demonstration, Vernier spectroscopy has proven to be a versatile technique combining the high sensitivity provided by optical cavities with the broad spectral coverage of the comb sources and fast acquisition times, and the number of demonstrations and applications of the technique is steadily growing. Comb-resolved VS [8], which provides absolute frequency calibration, is particularly suitable for precision measurements of molecular spectra, and spectra with resolution limited only by the comb mode linewidths have been demonstrated [16,17]. The technique has been implemented mostly in the near-infrared wavelength range around 1.5 µm [16,18,23,27,28] and 2 µm [15], with bandwidths up to 4–5 THz [8,17,18,23], often limited by the detection system rather than the comb source. Comb-resolved Vernier measurements in the mid-infrared region beyond 2 µm with frequency precision on par with the near-infrared demonstrations remain to be shown. We note that, while in most demonstrations the sample was kept in the cavity to enhance the interaction length with the sample [8,15,16,23,29], in some works the cavity was used only to filter the comb and the sample was kept either in a cell [18,26,27] or in a free-space path [26], therefore not benefitting from the enhanced interaction length. The acquisition times of single spectra were usually short, down to a few ms [8,27,29], and in some works long-term averaging was implemented to reach high signal-to-noise ratios [15,16]. Figures of merit down to 10−9 cm−1 Hz−1/2 have been demonstrated [23,28]. Most recently, comb-resolved VS based on a chip-scale ICL emitting around 3.6 µm has been demonstrated [29], opening up for the real-time sensing of hydrocarbons, alas, without absolute frequency calibration. One can envision employing combs based on quantum cascade lasers [50] in a similar setup to reach even longer wavelengths.
Continuous-filtering VS provides better absorption sensitivity than the comb-resolved VS because of its immunity to frequency-to-amplitude noise conversion, and figures of merit in the 6 × 10⁻¹¹–10−9 cm−1 Hz−1/2 range have been demonstrated [9]. Since the detection system is based on a single photodiode that records a selected Vernier order scanned across the entire comb bandwidth, much wider spectral coverages have been achieved, up to 60 THz around 0.8 µm in 1 s [20] and 7 THz around 3.3 µm in 25 ms [22]. The technique has been implemented in the near-infrared range around 0.8 µm [9] and 1.5 µm [32,33], and in the mid-infrared range around 3.3 µm [22], and was used for trace gas detection at atmospheric conditions and in a flame [32], with the sample always inside the cavity. The acquisition rates were usually of the order of 20 Hz, and long-term averaging has been implemented to increase the signal-to-noise ratio [20,22]. The two systems described in this work offer a number of improvements over the previous demonstrations. The near-infared system reaches a record sensitivity of 4 × 10⁻¹⁰ cm−1 in 1000 s in combination with spectral resolution below 1 GHz, at the theoretical limit of the technique. The mid-infrared system, on the other hand, offers a similar performance to the previous demonstration in the same wavelength range [22], but achieves it using a more compact and robust comb source and detection system. A similar detection system can be combined with other compact mid-infrared comb sources that nowadays exist in the 3–12 µm range [51,52,53]. In the future, the sensitivity of the CF-VS can be further increased by the use of cavities with a higher finesse, and the frequency precision can be improved by better calibration of the relative frequency scale, e.g., using etalons with higher contrast and/or smaller FSR. The compact and robust implementation of the CF-VS and the fast acquisition rate makes the technique suitable for in situ time-resolved measurements for atmospheric sensing or in combustion and plasma environments.

Author Contributions

The mid-infrared spectrometer was implemented at Umeå University by C.L. and F.S.V., and the near-infrared spectrometer was implemented at Lyon University by J.M. The review part was written by A.F., L.R. and C.L. Conceptualization, A.F., C.L., L.R. and J.M.; methodology, C.L., F.S.V. and J.M.; software, C.L.; formal analysis, C.L. and J.M.; investigation, C.L., J.M. and F.S.V.; writing—original draft preparation, A.F., C.L., J.M. and L.R.; visualization, C.L., L.R. and J.M.; supervision, A.F. and J.M.; project administration, A.F.; funding acquisition, A.F. and J.M. All authors have read and agreed to the published version of the manuscript.

Funding

This research was funded by the Knut and Alice Wallenberg Foundation, grant number KAW 2015.0159 and by the CNRS program “Défi Instrumentation aux Limites”, grant number 154957.

Institutional Review Board Statement

Not applicable.

Informed Consent Statement

Not applicable.

Data Availability Statement

The data will be provided from the corresponding author upon reasonable request.

Acknowledgments

The authors at Umeå University thank Grzegorz Soboń for providing the low-noise current driver for the DFG source.

Conflicts of Interest

The authors declare no conflict of interest. The funders had no role in the design of the study; in the collection, analyses, or interpretation of data; in the writing of the manuscript, or in the decision to publish the results.

References

  1. Gherman, T.; Romanini, D. Mode-locked cavity-enhanced absorption spectroscopy. Opt. Express 2002, 10, 1033–1042. [Google Scholar] [CrossRef] [PubMed] [Green Version]
  2. Diddams, S.A.; Hollberg, L.; Mbele, V. Molecular fingerprinting with the resolved modes of a femtosecond laser frequency comb. Nature 2007, 445, 627–630. [Google Scholar] [CrossRef] [PubMed]
  3. Mandon, J.; Guelachvili, G.; Picque, N. Fourier transform spectroscopy with a laser frequency comb. Nat. Photon. 2009, 3, 99–102. [Google Scholar] [CrossRef]
  4. Schiller, S. Spectrometry with frequency combs. Opt. Lett. 2002, 27, 766–768. [Google Scholar] [CrossRef] [PubMed] [Green Version]
  5. Thorpe, M.J.; Moll, K.D.; Jones, R.J.; Safdi, B.; Ye, J. Broadband cavity ringdown spectroscopy for sensitive and rapid molecular detection. Science 2006, 311, 1595–1599. [Google Scholar] [CrossRef] [Green Version]
  6. Bernhardt, B.; Ozawa, A.; Jacquet, P.; Jacquey, M.; Kobayashi, Y.; Udem, T.; Holzwarth, R.; Guelachvili, G.; Hansch, T.W.; Picque, N. Cavity-enhanced dual-comb spectroscopy. Nat. Photon. 2010, 4, 55–57. [Google Scholar] [CrossRef]
  7. Foltynowicz, A.; Ban, T.; Maslowski, P.; Adler, F.; Ye, J. Quantum-noise-limited optical frequency comb spectroscopy. Phys. Rev. Lett. 2011, 107, 233002. [Google Scholar] [CrossRef] [Green Version]
  8. Gohle, C.; Stein, B.; Schliesser, A.; Udem, T.; Hansch, T.W. Frequency comb Vernier spectroscopy for broadband, high-resolution, high-sensitivity absorption and dispersion spectra. Phys. Rev. Lett. 2007, 99, 263902. [Google Scholar] [CrossRef] [Green Version]
  9. Rutkowski, L.; Morville, J. Broadband cavity-enhanced molecular spectra from Vernier filtering of a complete frequency comb. Opt. Lett. 2014, 39, 6664–6667. [Google Scholar] [CrossRef]
  10. Thorpe, M.J.; Ye, J. Cavity-enhanced direct frequency comb spectroscopy. Appl. Phys. B 2008, 91, 397–414. [Google Scholar] [CrossRef] [Green Version]
  11. Kassi, S.; Didriche, K.; Lauzin, C.; Vaernewijckb, X.D.D.; Rizopoulos, A.; Herman, M. Demonstration of cavity enhanced FTIR spectroscopy using a femtosecond laser absorption source. Spectroc. Acta Part A Molec. Biomolec. Spectr. 2010, 75, 142–145. [Google Scholar] [CrossRef] [PubMed]
  12. Grilli, R.; Mejean, G.; Kassi, S.; Ventrillard, I.; Abd-Alrahman, C.; Romanini, D. Frequency comb based spectrometer for in situ and real time measurements of IO, BrO, NO2, and H2CO at pptv and ppqv levels. Environ. Sci. Technol. 2012, 46, 10704–10710. [Google Scholar] [CrossRef] [PubMed]
  13. Drever, R.W.P.; Hall, J.L.; Kowalski, F.V.; Hough, J.; Ford, G.M.; Munley, A.J.; Ward, H. Laser phase and frequency stabilization using an optical resonator. Appl. Phys. B 1983, 31, 97–105. [Google Scholar] [CrossRef]
  14. Foltynowicz, A.; Maslowski, P.; Fleisher, A.J.; Bjork, B.J.; Ye, J. Cavity-enhanced optical frequency comb spectroscopy in the mid-infrared application to trace detection of hydrogen peroxide. Appl. Phys. B 2013, 110, 163–175. [Google Scholar] [CrossRef] [Green Version]
  15. Siciliani de Cumis, M.; Eramo, R.; Coluccelli, N.; Cassinerio, M.; Galzerano, G.; Laporta, P.; De Natale, P.; Cancio Pastor, P. Tracing part-per-billion line shifts with direct-frequency-comb Vernier spectroscopy. Phys. Rev. A 2015, 91. [Google Scholar] [CrossRef]
  16. Kowzan, G.; Charczun, D.; Cygan, A.; Trawinski, R.S.; Lisak, D.; Maslowski, P. Broadband optical cavity mode measurements at Hz-Level precision with a comb-based VIPA spectrometer. Sci. Rep. 2019, 9, 1–10. [Google Scholar] [CrossRef] [PubMed]
  17. Vicentini, E.; Gambetta, A.; Coluccelli, N.; Wang, Y.; Laporta, P.; Galzerano, G. Direct-frequency-comb spectroscopy by a scanning Fabry-Pérot microcavity resonator. Phys. Rev. A 2020, 102, 033510. [Google Scholar] [CrossRef]
  18. Hébert, N.B.; Scholten, S.K.; White, R.T.; Genest, J.; Luiten, A.N.; Anstie, J.D. A quantitative mode-resolved frequency comb spectrometer. Opt. Express 2015, 23, 13991–14001. [Google Scholar] [CrossRef]
  19. Romanini, D.; Ventrillard, I.; Méjean, G.; Morville, J.; Kerstel, E. Introduction to cavity enhanced absorption spectroscopy. In Cavity-Enhanced Spectroscopy and Sensing; Gagliardi, G., Loock, H.-P., Eds.; Springer: Berlin, Germany, 2014. [Google Scholar]
  20. Rutkowski, L.; Morville, J. Continuous Vernier filtering of an optical frequency comb for broadband cavity-enhanced molecular spectroscopy. J. Quant. Spectr. Radiat. Transf. 2017, 187, 204–214. [Google Scholar] [CrossRef] [Green Version]
  21. Lu, C.; Senna Vieira, F.; Głuszek, A.; Silander, I.; Soboń, G.; Foltynowicz, A. Robust, fast and sensitive near-infrared continuous-filtering Vernier spectrometer. Opt. Express 2021, 29, 30155–30167. [Google Scholar] [CrossRef]
  22. Khodabakhsh, A.; Rutkowski, L.; Morville, J.; Foltynowicz, A. Mid-infrared continuous-filtering Vernier spectroscopy using a doubly resonant optical parametric oscillator. Appl. Phys. B 2017, 123, 1–12. [Google Scholar] [CrossRef]
  23. Zhu, F.; Bounds, J.; Bicer, A.; Strohaber, J.; Kolomenskii, A.A.; Gohle, C.; Amani, M.; Schuessler, H.A. Near-infrared frequency comb Vernier spectrometer for broadband trace gas detection. Opt. Express 2014, 22, 23026–23033. [Google Scholar] [CrossRef] [PubMed] [Green Version]
  24. Siciliani de Cumis, M.; Eramo, R.; Coluccelli, N.; Galzerano, G.; Laporta, P.; Cancio Pastor, P. Multiplexed direct-frequency-comb Vernier spectroscopy of carbon dioxide 2ν1 + ν3 ro-vibrational combination band. J. Chem. Phys. 2018, 148, 114303. [Google Scholar] [CrossRef]
  25. Siciliani de Cumis, M.; Eramo, R.; Jiang, J.; Fermann, M.E.; Cancio Pastor, P. Direct comb Vernier spectroscopy for fractional isotopic ratio determinations. Sensors 2021, 21, 5883. [Google Scholar] [CrossRef] [PubMed]
  26. Galli, I.; Bartalini, S.; Cancio, P.; Cappelli, F.; Giusfredi, G.; Mazzotti, D.; Akikusa, N.; Yamanishi, M.; De Natale, P. Mid-infrared frequency comb for broadband high precision and sensitivity molecular spectroscopy. Opt. Lett. 2014, 39, 5050–5053. [Google Scholar] [CrossRef] [PubMed]
  27. Coluccelli, N.; Cassinerio, M.; Redding, B.; Cao, H.; Laporta, P.; Galzerano, G. The optical frequency comb fibre spectrometer. Nat. Commun. 2016, 7, 1–11. [Google Scholar] [CrossRef]
  28. Gambetta, A.; Cassinerio, M.; Gatti, D.; Laporta, P.; Galzerano, G. Scanning micro-resonator direct-comb absolute spectroscopy. Sci. Rep. 2016, 6, 1–8. [Google Scholar] [CrossRef] [Green Version]
  29. Sterczewski, L.A.; Chen, T.-L.; Ober, D.C.; Markus, C.R.; Canedy, C.L.; Vurgaftman, I.; Frez, C.; Meyer, J.R.; Okumura, M.; Bagheri, M. Cavity-enhanced Vernier spectroscopy with a chip-scale mid-infrared frequency comb. arXiv 2021, arXiv:2112.03977. [Google Scholar] [CrossRef]
  30. Coddington, I.; Swann, W.C.; Newbury, N.R. Coherent dual-comb spectroscopy at high signal-to-noise ratio. Phys. Rev. A 2010, 82, 043817. [Google Scholar] [CrossRef] [Green Version]
  31. Khodabakhsh, A.; Ramaiah-Badarla, V.; Rutkowski, L.; Johansson, A.C.; Lee, K.F.; Jiang, J.; Mohr, C.; Fermann, M.E.; Foltynowicz, A. Fourier transform and Vernier spectroscopy using an optical frequency comb at 3–5.4 μm. Opt. Lett. 2016, 41, 2541–2544. [Google Scholar] [CrossRef]
  32. Lu, C.; Senna Vieira, F.; Schmidt, F.M.; Foltynowicz, A. Time-resolved continuous-filtering Vernier spectroscopy of H2O and OH radical in a flame. Opt. Express 2019, 27, 29521–29533. [Google Scholar] [CrossRef] [PubMed] [Green Version]
  33. Głuszek, A.; Senna Vieira, F.; Hudzikowski, A.; Wąż, A.; Sotor, J.; Foltynowicz, A.; Soboń, G. Compact mode-locked Er-doped fiber laser for broadband cavity-enhanced spectroscopy. Appl. Phys. B 2020, 126. [Google Scholar] [CrossRef]
  34. Western, C.M.; Carter-Blatchford, L.; Crozet, P.; Ross, A.J.; Morville, J.; Tokaryk, D.W. The spectrum of N2 from 4500 to 15,700 cm−1 revisited with PGOPHER. J. Quant. Spectr. Radiat. Transf. 2018, 219, 127–141. [Google Scholar] [CrossRef] [Green Version]
  35. Murphy, M.T.; Udem, T.; Holzwarth, R.; Sizmann, A.; Pasquini, L.; Araujo-Hauck, C.; Dekker, H.; D’Odorico, S.; Fischer, M.; Hansch, T.W.; et al. High-precision wavelength calibration of astronomical spectrographs with laser frequency combs. Mon. Not. R. Astron. Soc. 2007, 380, 839–847. [Google Scholar] [CrossRef]
  36. Li, C.H.; Benedick, A.J.; Fendel, P.; Glenday, A.G.; Kartner, F.X.; Phillips, D.F.; Sasselov, D.; Szentgyorgyi, A.; Walsworth, R.L. A laser frequency comb that enables radial velocity measurements with a precision of 1 cm s−1. Nature 2008, 452, 610–612. [Google Scholar] [CrossRef] [Green Version]
  37. Braje, D.A.; Kirchner, M.S.; Osterman, S.; Fortier, T.; Diddams, S.A. Astronomical spectrograph calibration with broad-spectrum frequency combs. Eur. Phys. J. D 2008, 48, 57–66. [Google Scholar] [CrossRef] [Green Version]
  38. McCracken, R.A.; Depagne, E.; Kuhn, R.B.; Erasmus, N.; Crause, L.A.; Reid, D.T. Wavelength calibration of a high resolution spectrograph with a partially stabilized 15-GHz astrocomb from 550 to 890 nm. Opt. Express 2017, 25, 6450–6460. [Google Scholar] [CrossRef]
  39. Ma, Y.X.; Meng, F.; Liu, Y.Z.; Zhao, F.; Zhao, G.; Wang, A.M.; Zhang, Z.G. Visible astro-comb filtered by a passively stabilized Fabry-Perot cavity. Rev. Sci. Instrum. 2019, 90, 013102. [Google Scholar] [CrossRef] [Green Version]
  40. Lešundák, A.; Voigt, D.; Cip, O.; van den Berg, S. High-accuracy long distance measurements with a mode-filtered frequency comb. Opt. Express 2017, 25, 32570–32580. [Google Scholar] [CrossRef] [Green Version]
  41. Xu, Z.W.; Shu, X.W. Fiber Optic Sensor Based on Vernier Microwave Frequency Comb. J. Light. Technol. 2019, 37, 3503–3509. [Google Scholar] [CrossRef]
  42. Zhang, L.; Lu, P.; Chen, L.; Huang, C.; Liu, D.; Jiang, S. Optical fiber strain sensor using fiber resonator based on frequency comb Vernier spectroscopy. Opt. Lett. 2012, 37, 2622–2624. [Google Scholar] [CrossRef]
  43. Hardy, B.; Raybaut, M.; Dherbecourt, J.B.; Melkonian, J.M.; Godard, A.; Mohamed, A.K.; Lefebvre, M. Vernier frequency sampling: A new tuning approach in spectroscopy—application to multi-wavelength integrated path DIAL. Appl. Phys. B 2012, 107, 643–647. [Google Scholar] [CrossRef]
  44. Soboń, G.; Martynkien, T.; Mergo, P.; Rutkowski, L.; Foltynowicz, A. High-power frequency comb source tunable from 2.7 to 4.2 μm based on difference frequency generation pumped by an Yb-doped fiber laser. Opt. Lett. 2017, 42, 1748–1751. [Google Scholar] [CrossRef]
  45. Sadiek, I.; Hjältén, A.; Senna Vieira, F.; Lu, C.; Stuhr, M.; Foltynowicz, A. Line positions and intensities of the ν4 band of methyl iodide using mid-infrared optical frequency comb Fourier transform spectroscopy. J. Quant. Spectr. Radiat. Transf. 2020, 255, 107263. [Google Scholar] [CrossRef]
  46. Silva de Oliveira, V.; Ruehl, A.; Masłowski, P.; Hartl, I. Intensity noise optimization of a mid-infrared frequency comb difference-frequency generation source. Opt. Lett. 2020, 45, 1914–1917. [Google Scholar] [CrossRef] [PubMed]
  47. Gordon, I.E.; Rothman, L.S.; Hill, C.; Kochanov, R.V.; Tan, Y.; Bernath, P.F.; Birk, M.; Boudon, V.; Campargue, A.; Chance, K.V.; et al. The HITRAN2016 molecular spectroscopic database. J. Quant. Spectr. Radiat. Transf. 2017, 203, 3–69. [Google Scholar] [CrossRef]
  48. Chang, C.-H.; Heilmann, R.K.; Schattenburg, M.L.; Glenn, P. Design of a double-pass shear mode acousto-optic modulator. Rev. Sci. Instrum. 2008, 79, 033104. [Google Scholar] [CrossRef] [PubMed]
  49. Vasilchenko, S.; Mikhailenko, S.N.; Campargue, A. Water vapor absorption in the region of the oxygen A-band near 760 nm. J. Quant. Spectr. Radiat. Transf. 2021, 275, 107847. [Google Scholar] [CrossRef]
  50. Hugi, A.; Villares, G.; Blaser, S.; Liu, H.C.; Faist, J. Mid-infrared frequency comb based on a quantum cascade laser. Nature 2012, 492, 229–233. [Google Scholar] [CrossRef]
  51. Timmers, H.; Kowligy, A.; Lind, A.; Cruz, F.C.; Nader, N.; Silfies, M.; Ycas, G.; Allison, T.K.; Schunemann, P.G.; Papp, S.B.; et al. Molecular fingerprinting with bright, broadband infrared frequency combs. Optica 2018, 5, 727–732. [Google Scholar] [CrossRef]
  52. Krzempek, K.; Tomaszewska, D.; Gluszek, A.; Martynkien, T.; Mergo, P.; Sotor, J.; Foltynowicz, A.; Sobon, G. Stabilized all-fiber source for generation of tunable broadband fCEO-free mid-IR frequency comb in the 7–9 μm range. Opt. Express 2019, 27, 37435–37445. [Google Scholar] [CrossRef]
  53. Krzempek, K.; Tomaszewska, D.; Foltynowicz, A.; Sobon, G. Fiber-based optical frequency comb at 3.3 μm for broadband spectroscopy of hydrocarbons Invited. Chin. Opt. Lett. 2021, 19, 08140. [Google Scholar] [CrossRef]
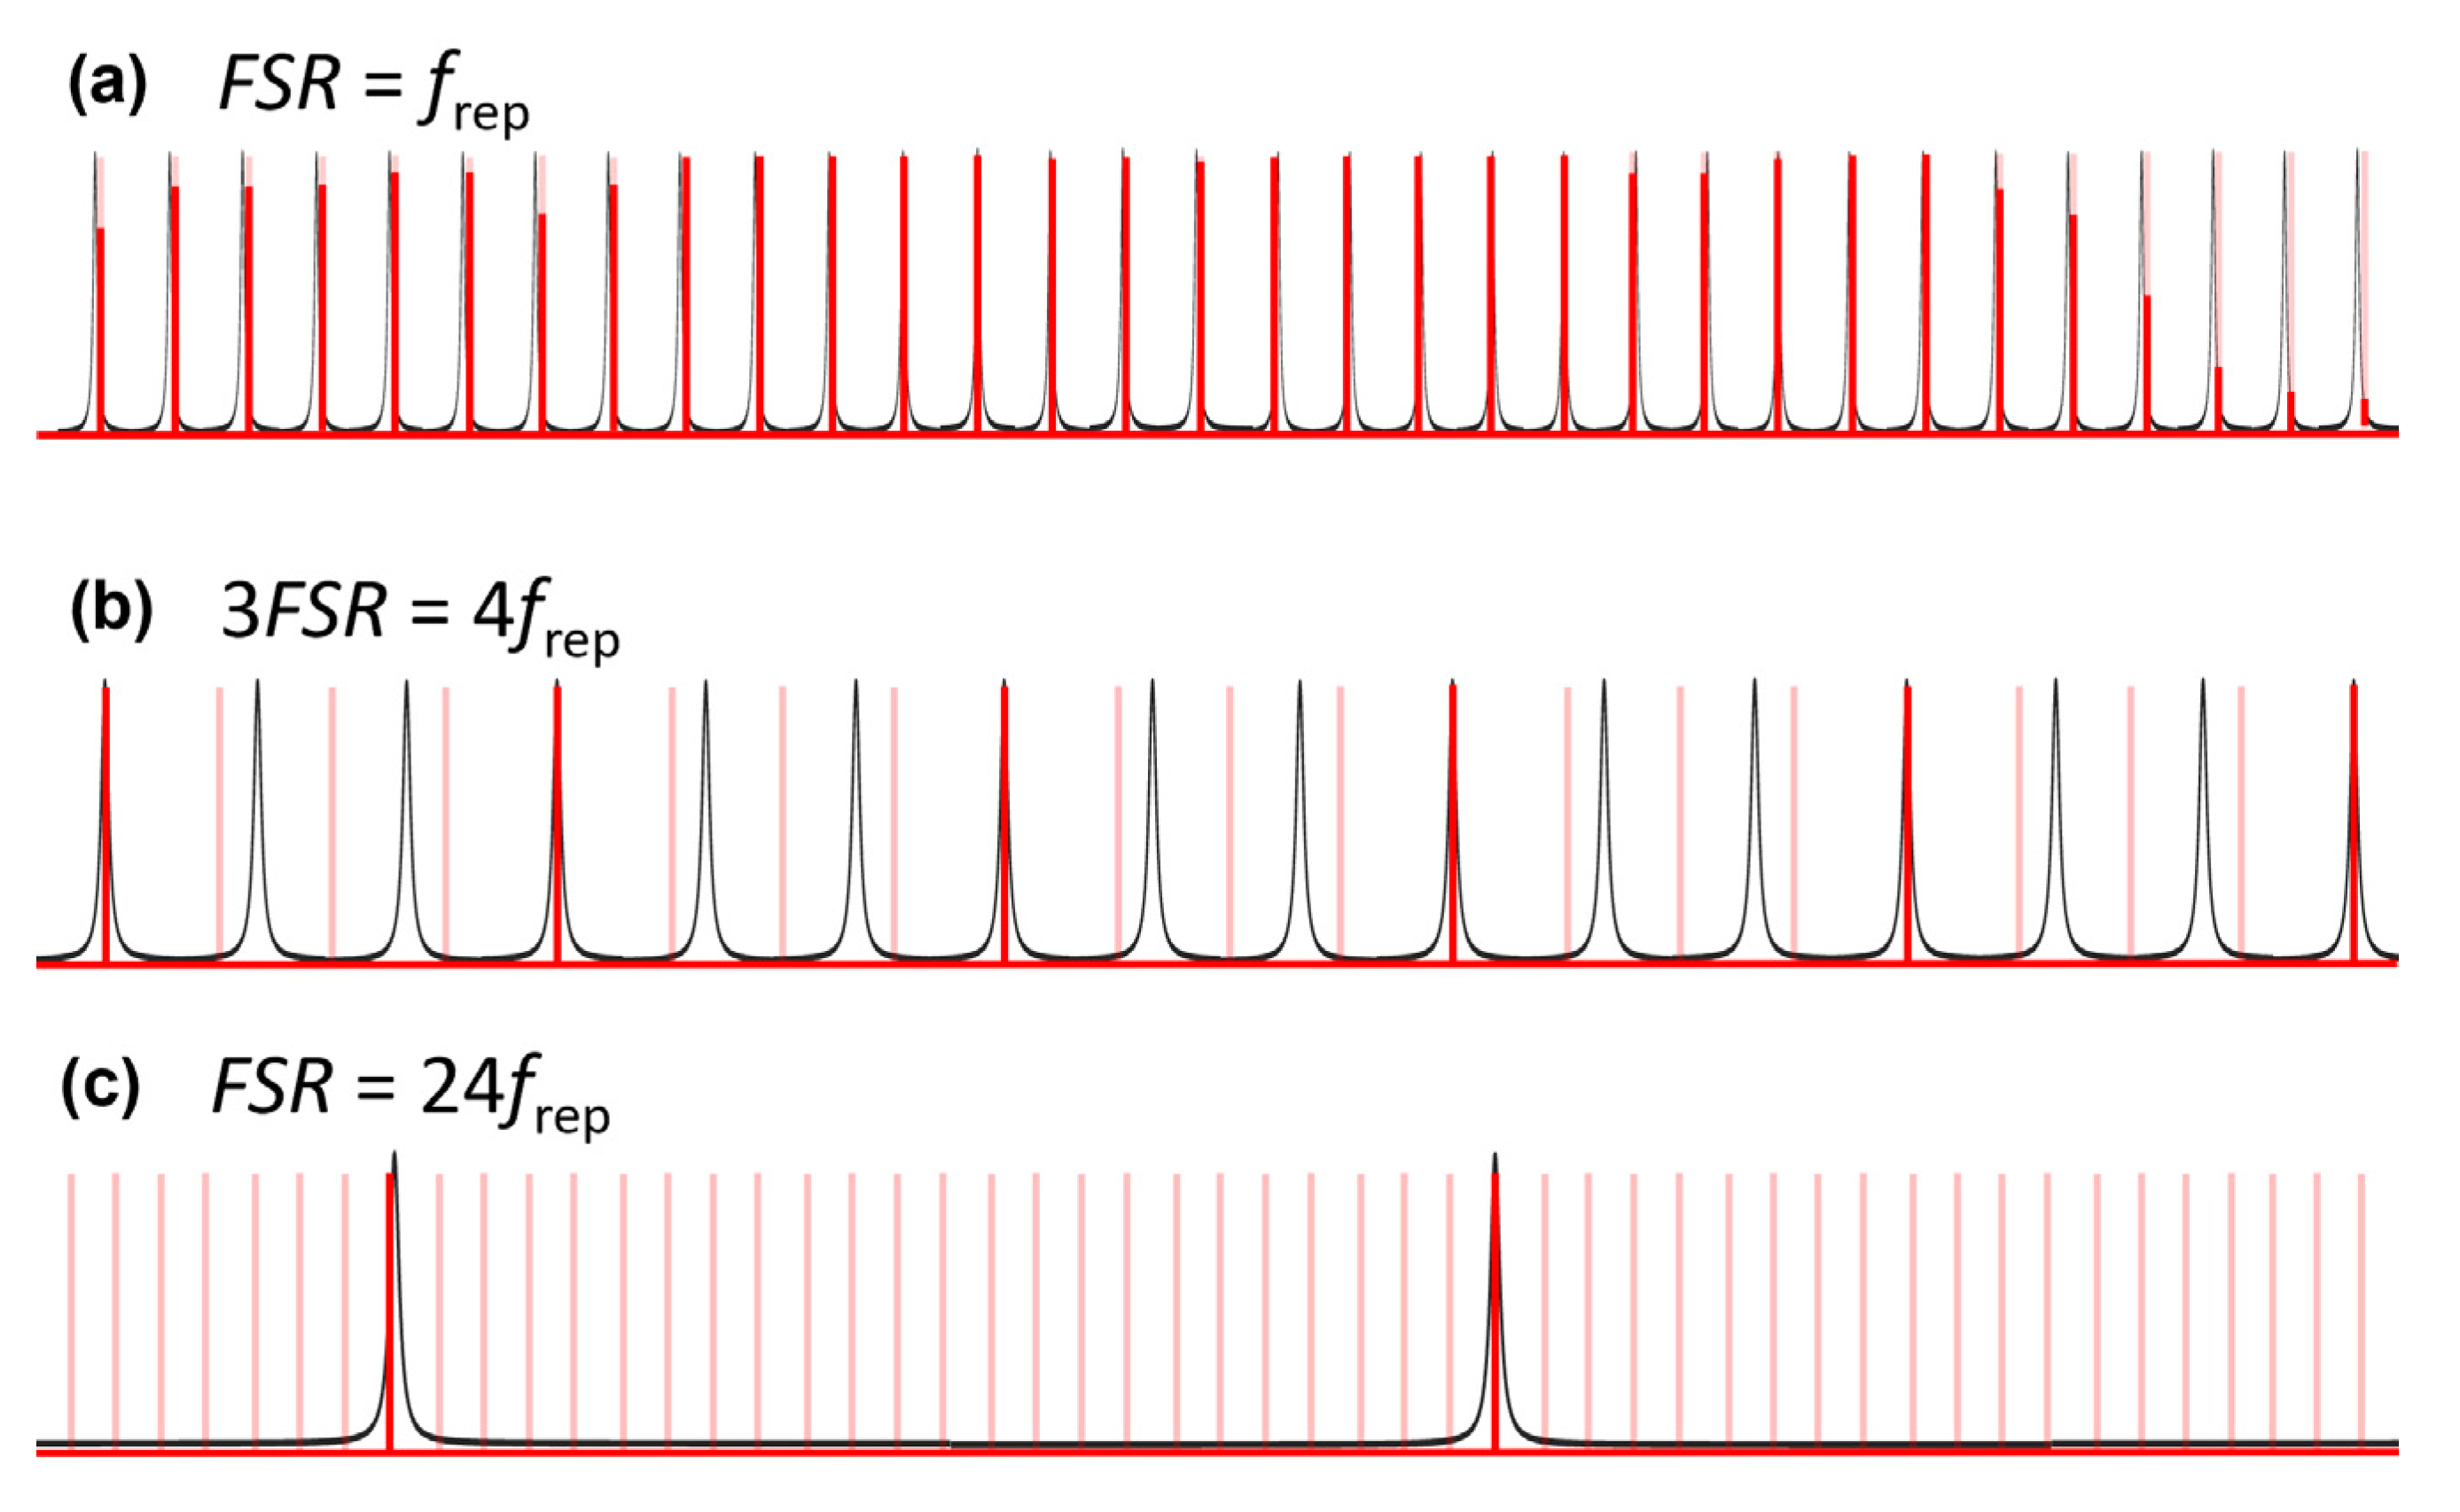
Figure 1. Comb–cavity coupling in (a) the perfect match case including the influence of cavity dispersion, and for two different Vernier ratios: (b) 4/3 and (c) 24/1. The cavity resonances are depicted by the solid black curves, and the comb modes are shown by the red bars (the incident comb spectrum is shown by the shaded bars, while the transmitted modes are shown by the solid bars).
Photonics 09 00222 g001
Figure 2. Continuous filtering of a comb by a cavity with LPML = 17 (note that typically this ratio is of the order of a few thousand). Several neighboring comb modes (red solid bars) are partially transmitted through their corresponding cavity resonances (black solid curves), creating Vernier orders with envelopes shown by the blue dashed curve.
Photonics 09 00222 g002
Figure 3. Typical detection schemes of comb-resolved Vernier spectroscopy. (a) Spectrometer based on an fs laser, diffraction grating, a rotating element, and a detector array. M1,2: cavity mirrors; PZT: piezo transducer; DG: diffraction grating; FG: frequency generator. (b) Spectrometer based on an fs laser, virtually imaged phase array (VIPA), stationary diffraction grating and a detector array. (c) Spectrometer based on an fs laser and a microcavity with a single photodiode detection (PD). (d) Spectrometer based on a chip-scale comb. The upper panels in (c,d) show the comb–cavity matching.
Photonics 09 00222 g003
Figure 4. Typical detection schemes of continuous-filtering Vernier spectroscopy: (a) spectrometer based on a diffraction grating rotating synchronously with the Vernier order scan; (b) spectrometer based on a fixed diffraction grating and a moving aperture synchronized with the Vernier order scan. M1,2: cavity mirrors; PZT: piezo transducer; DG: diffraction grating; FG: frequency generator; A: aperture; SPD, split photodiode; PD: photodiode.
Photonics 09 00222 g004
Figure 5. Schematic of the mid-infrared CF-VS setup. L1–6: spherical lenses; L1–6: plano-convex lenses; PZT: piezo transducer; CM1–2: cavity mirrors; TS: translation stage; λ/2: half-wave plate; DG: diffraction grating; GS: galvo scanner; GC: galvo controller; PS: phase shifter; BS1–2: pellicle beam splitters; SPD: split photodiode; PD1–2: HgCdTe photo detectors; SE: 3 mm thick silicon etalon; FG: function generator; LIA: lock-in amplifier; PI: proportional integral controller; HVA: high voltage amplifier; DAQ: multichannel data acquisition card.
Photonics 09 00222 g005
Figure 6. (a) Normalized spectrum (single scan) of methane and water (black markers) together with a fit of the model (red—both species, blue—only methane) and (b) fit residuals.
Photonics 09 00222 g006
Figure 7. Schematic of the near-infrared CF-VS setup: PZT: piezo transducer; OC: output coupler; TS: translation stage; OI: optical isolator; λ/2: half-wave plate; PBS: polarizing beam splitter; λ/4: quarter-wave plate; AOM-FS: acousto-optic modulator frequency shifter; DG: diffraction grating; GS: galvo scanner; BS: beam splitter; PD: photodiode; SPD: split photodiode; VCO: voltage-controlled oscillator; HVA: high voltage amplifier; FG: frequency generator; GC: galvo controller; PS: phase shifter.
Photonics 09 00222 g007
Figure 8. (a) Normalized cavity transmission spectrum (black curve, 2000 averages) and the corresponding fit of water spectrum (red curve). (b) Residuals of the fit. (c) Zoom of panel (a) showing the spectrum averaged 2000 times (black curve) and averaged 10 times (grey dashed curve) together with the fit to demonstrate the coherent averaging. (d) Absorption coefficient corresponding to the spectrum shown in panel (e). (e) Zoom of panel (a) where weak water lines are observed. The lines marked with black stars in panels (c,e) are discussed in the text.
Photonics 09 00222 g008
Publisher’s Note: MDPI stays neutral with regard to jurisdictional claims in published maps and institutional affiliations.