Abstract
This study aims to highlight the problems with implementing optical techniques (laser tweezers, diffuse light scattering and laser diffractometry) in clinical hemorheological practice. We provide the feasibility of these techniques to assess microrheological effects of various molecular mechanisms affecting RBC aggregation and deformability. In particular, we show that they allow assessment of changes in RBC aggregation in whole blood samples both on the level of single cells and on the level of large ensembles of cells. Application of these methods allows for studying the mechanisms of RBC aggregation because they are sensitive to changes in the medium which surrounds the RBC (i.e., blood plasma, serum or model solutions of blood plasma proteins) and to changes in the cellular properties of RBCs (i.e., effects on the cell membrane due to glycoprotein inhibition).
1. Introduction
Alterations of blood rheological properties are associated with various pathologies and may lead to multiple disorders of blood microcirculation. This can lead to significant decreases in the efficiency of blood transport functions and complicates the treatment of various diseases, such as cardiovascular diseases (e.g., arterial hypertension), diabetes mellitus, nephropathy, etc. [1,2,3,4]. Pathological changes in blood rheology also occur in circulatory disorders (e.g., ischemia and reperfusion), pulmonary disorders, connective tissue disorders and sickle cell decease [5,6,7]. Recently, it was reported that the development of severe acute respiratory syndrome coronavirus infection (SARS-CoV-2) is accompanied by acute inflammation with significant disturbances in blood rheological behavior [8]. Therefore, blood rheological parameters may serve as additional novel indicators of the stability and integrity of the microcirculatory system. Their assessment provides new diagnostic information, which helps to improve the quality of the treatment.
Blood is a non-Newtonian fluid because it contains both noncellular and cellular interacting fractions. The noncellular fraction is blood plasma—the aqueous solution of different molecules, mostly proteins. As for the Newtonian liquid, blood plasma viscosity is an important diagnostic parameter [9]. The cellular fraction includes several types of cells, among which erythrocytes (red blood cells, RBCs) are the most abundant. Normally, RBCs account for 40–45% of the total blood volume (i.e., hematocrit parameter) while all other cells represent less than 1%. Therefore, the physiological conditions of RBC and peculiarities of their interaction with each other—as well as with other blood cells and vascular endothelium—greatly affects blood’s rheological behavior. One of the key processes of blood rheology regulation is spontaneous aggregation of RBCs, which happens at the direct contact between cells under low shear forces and at stasis and leads to the formation of RBC aggregates, so-called rouleaux. This is a reversible process, as aggregates are easily dispersed due to shear stress in the blood flow. Normally, even low shear stress (about hundred mPa) is sufficient to disaggregate RBC rouleaux. However, ing some diseases, the interaction forces that drive RBC aggregation increase, and the hydrodynamic strength of such aggregates gets higher. This decreases microcirculation, resulting in disorders in blood perfusion. Parameters that characterize the aggregation process in vitro are called aggregation parameters of RBCs (APs). The most commonly measured APs in modern hematological practice are: the ratio of the number of RBCs participating in the aggregation to the total number of cells (aggregation index), characteristic time of aggregation, average hydrodynamic strength of RBC aggregates (the minimum shear stress required to prevent aggregation) and others. The magnitude of the APs depends on the content of the media that surrounds the RBCs (depending mostly on the concentration of proaggregant molecules such as fibrinogen, globulins or synthetic polysaccharide dextrans) and also on the properties of the RBCs’ membranes [10]. All these parameters are obtained by diffuse light scattering on whole blood samples, which characterizes aggregation on the level of a huge number of RBCs and represents the mean value of the properties averaged across ensembles of the cells in the experimental chamber. Recently, with the rapid development of laser techniques, a specific parameter was proposed for assessing RBC interaction on the single-cell level during measurement of interaction forces (Fint) arising between RBCs in highly diluted suspensions [11,12,13,14]. One of the problems specific to the assessment of these parameters using optical techniques is the uncertainty of the efficiency of these methods for evaluating the effects of cellular and noncellular factors on RBC interaction. For example, there is a lack of quantitative data on the dependence of APs, measured by various optical techniques, on changes in the macromolecular content of blood plasma. This is a severe limitation of the usage of these methods in routine clinical hematology.
Another important microrheological parameter determining blood circulation is RBC deformability: the ability of RBCs to change their shape under external shear stress when passing through capillaries with diameter less than or equal to their size [15]. When RBC deformability is impaired (which is observed at several pathologies, such as metabolic disorders, obesity, cardiovascular deceases, infections, inflammation, etc. [16]) the RBC cannot pass through narrow capillaries. This leads to massive sludging of blood near the capillary entrance, which significantly impairs microcirculation, leading to a decrease in tissue perfusion and oxygenation. Without proper treatment, this may lead to irreversible tissue necrosis. Therefore, more and more hematological clinical protocols mandate testing of RBC deformation [17]. Nowadays, there are several techniques for measuring RBC deformability. One of the first-developed approaches is the aspiration of RBCs into the volume of a micro-pipette [18]. Another common technique is atomic-force microscopy (AFM) [19,20]. These techniques were used intensively to study RBC deformability during normal conditions and in pathology. However, they face several disadvantages in clinical practice. First of all, these techniques are implemented only at the single-cell level and, thus, routine measurements are difficult to perform and are very time-consuming. Secondly, especially for AFM, RBCs undergo high external mechanical stress, which they physiologically do not experience during blood circulation. Laser diffractometry of RBCs—also referred as ektacytometry—is an alternative optical method that measures RBC deformation of a large population of RBCs under shear flow. Several commercially available systems can perform such measurements: laser optical rotational cell analyzer (LORRCA; R&R Mechatronics, Zwaag, The Netherlands) [21], laser aggregometer and deformometer of erythrocytes (LADE; Reomedlab, Moscow, Russia) and RBC aggregometer and deformometer (RheoScan AnD-300; RheoMeditech, Seoul, Korea) [22]. The final aim of the present work is to test whether a diffractometry technique based on the RheoScan AnD-300 is able to evaluate the effects of different molecular agents targeted to change RBC deformability.
2. Materials and Methods
2.1. Blood Sampling and Preparation
The blood for all measurements was drawn from the cubital veins of healthy male donors on an empty stomach. All tubes for blood samples contained EDTA (EDTA K-3 tube, 1.2 mg/1 mL of blood, 4 mL) as an anti-coagulant agent. Immediately after blood sampling, blood plasma was extracted by centrifugation of the whole blood according to the following protocol: (1) centrifugation of the whole blood for 5 min at 600× g to separate the platelet-rich plasma (PRP); (2) two times centrifugation of PRP for 5 min at 11,000× g to remove platelets and obtain platelet-poor plasma (PPP). Centrifugation was performed at room temperature. In each experiment we used the blood of different individuals: laser tweezers and laser diffractometry measurements were performed on the blood of an individual donor; laser aggregometry measurements involved two groups (control and experimental) with 3 donors in each group. In every experiment all measurements were performed at least 3 times to calculate mean values and standard deviations. All experiments were performed within 3 h after blood sampling. Recommendations for hemorheological laboratories developed by the international expert group created for hemorheological research standardization [23] were followed. The study was approved by the ethics committees of M.V. Lomonosov Moscow State University. All volunteers were informed of the purpose of the study and gave written informed consent in accordance with the Declaration of Helsinki.
2.2. Laser Tweezers for Single-Cell-Level Measurements of Interaction Forces between Two RBCs
Laser tweezers (LT) were used to measure interaction forces (Fint) between two interacting RBCs. The schematic layout of the experimental setup is given in Figure 1. A custom two-channel optical trapping system based on two Nd:YAG lasers (1064 nm, 200 mW, Shanghai Dream Lasers Technologies, Shanghai, China) and a high numerical aperture water-immersion objective (N.A. = 1.00, ×100, Olympus, Tokyo, Japan) was used. One of the optical traps could be moved using a motorized mirror, placed in the conjugate plane of the back-aperture of the objective, allowing for accurate moving of the optical trap with controlled speed. The experimental chamber with the sample was located on the motorized XYZ platform. The chamber consisted of a cover slip placed 100 µm above a microscope slide. About 100 µL of the sample was pipetted into the volume between the cover slip and the microscope slide. After that, the chamber was sealed on both sides to prevent vaporization and induction of undesirable flows. For the experiments with media that did not contain albumin, the microscope slide surface was coated with 5 µL of 1% solution of human serum albumin (HSA) in distilled water and then dried. This procedure was necessary to avoid adhesion of the cells to the glass surface.
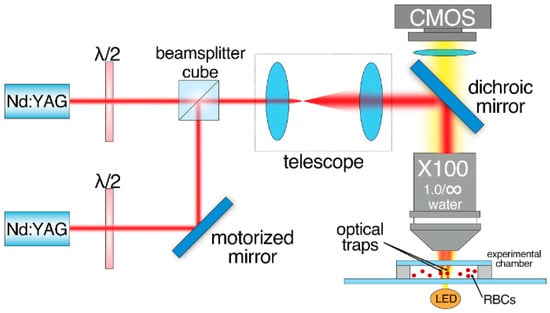
Figure 1.
Schematic layout of the two-channeled laser tweezers (LT) used to measure interaction forces Fint between two RBCs.
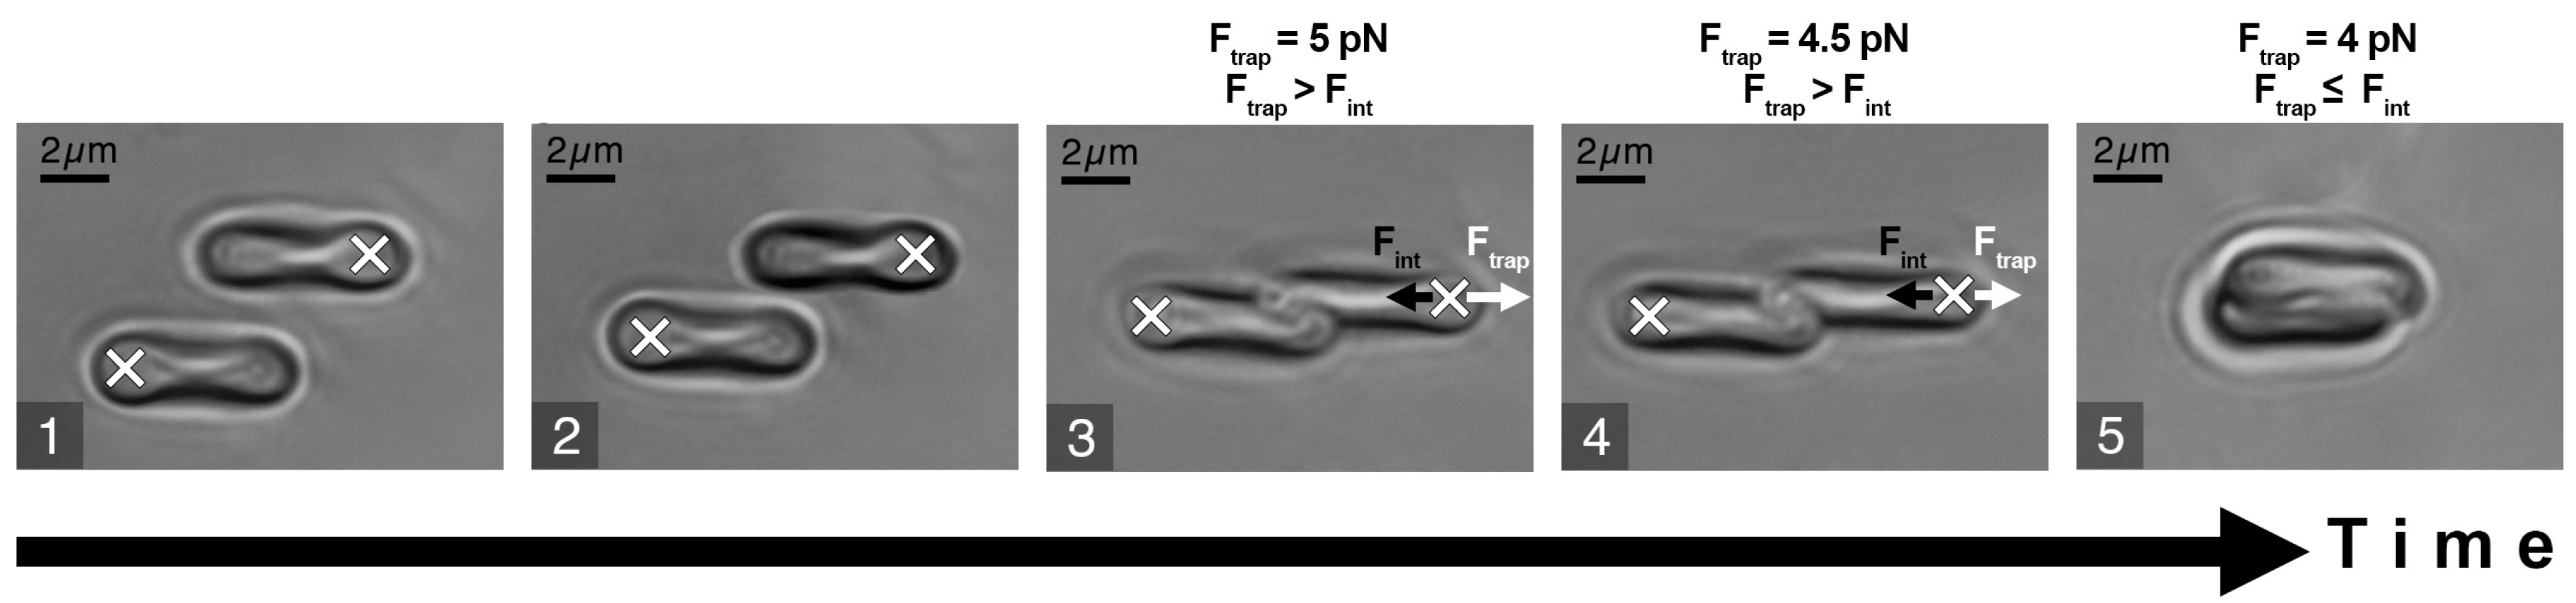
The experimental sample was prepared by diluting the RBCs (3 times washed (3000× g, 3 min) in PBS (Gibco, pH 7.4, Thermo Fischer Scientific, New York, NY, USA)) in platelet-poor plasma at 0.5% hematocrit. The stepwise protocol of the Fint measurement procedure is schematically presented in Figure 2. It included the following steps: (1) two different RBCs were trapped with LT and manipulated to maintain parallel orientation; (2) one RBC was then brought into initial contact with another one to form a doublet. As the interaction forces between RBCs depend on the initial area of cell contact [24], this was visually controlled to be 25–30% of the surface area. The time period while two cells maintained the contact area was about 10 s; (3) one of the laser traps was moved in order to separate the interacting cells; (4) step 3 was repeated while the trapping beam power and, subsequently, magnitude of the trapping force Ftrap (the direction of Ftrap is designated by a white arrow in Figure 2) was step-wisely decreased in order to find the minimal Ftrap sufficient to disperse the doublet; (5) the beam power was further decreased until Ftrap became insufficient to split the doublet and the trapped RBC escaped the trap, forming a complete aggregate. At this point, beam power was fixed, and we assumed the corresponding value of Ftrap to be equal to the RBC interaction force Fint (designated as a short black arrow in Figure 2).
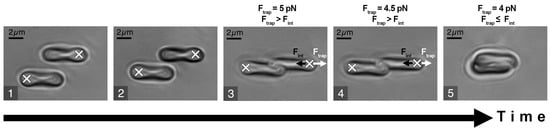
Figure 2.
Schematic representation of RBC interaction force (Fint) measurement procedure: white crosses describe the positions of the optical traps: white arrows point at the direction of the trapping force (Ftrap); short black arrows point at the direction of Fint. (1) Two cells are trapped and orientated in parallel; (2) cells are brought into contact, forming a doublet; (3) attempt to separate the cells by moving the laser trap and (4) simultaneously decreasing laser power to measure the minimal trapping force required to separate the cells; (5) below the minimal trapping force, the cell escapes the trap and overlaps the other one. The obtained minimal trapping force is assumed to be equal to the RBC interaction force.
Prior to the force measurements, the LT were calibrated to establish the relationship between laser beam power and the magnitude of the trapping force. The calibration was performed by comparing the trapping force and the viscous drag force, the latter affecting the trapped RBCs in the environmental liquid flow induced by moving the motorized platform holding the chamber with the sample. For more details, please refer to Supplementary Material (Figure S1). LT experiments were performed at room temperature (20–22 °C).
2.3. Diffuse Light Scattering Technique in the Assessement of RBC Aggregation Properties in Whole Blood Samples
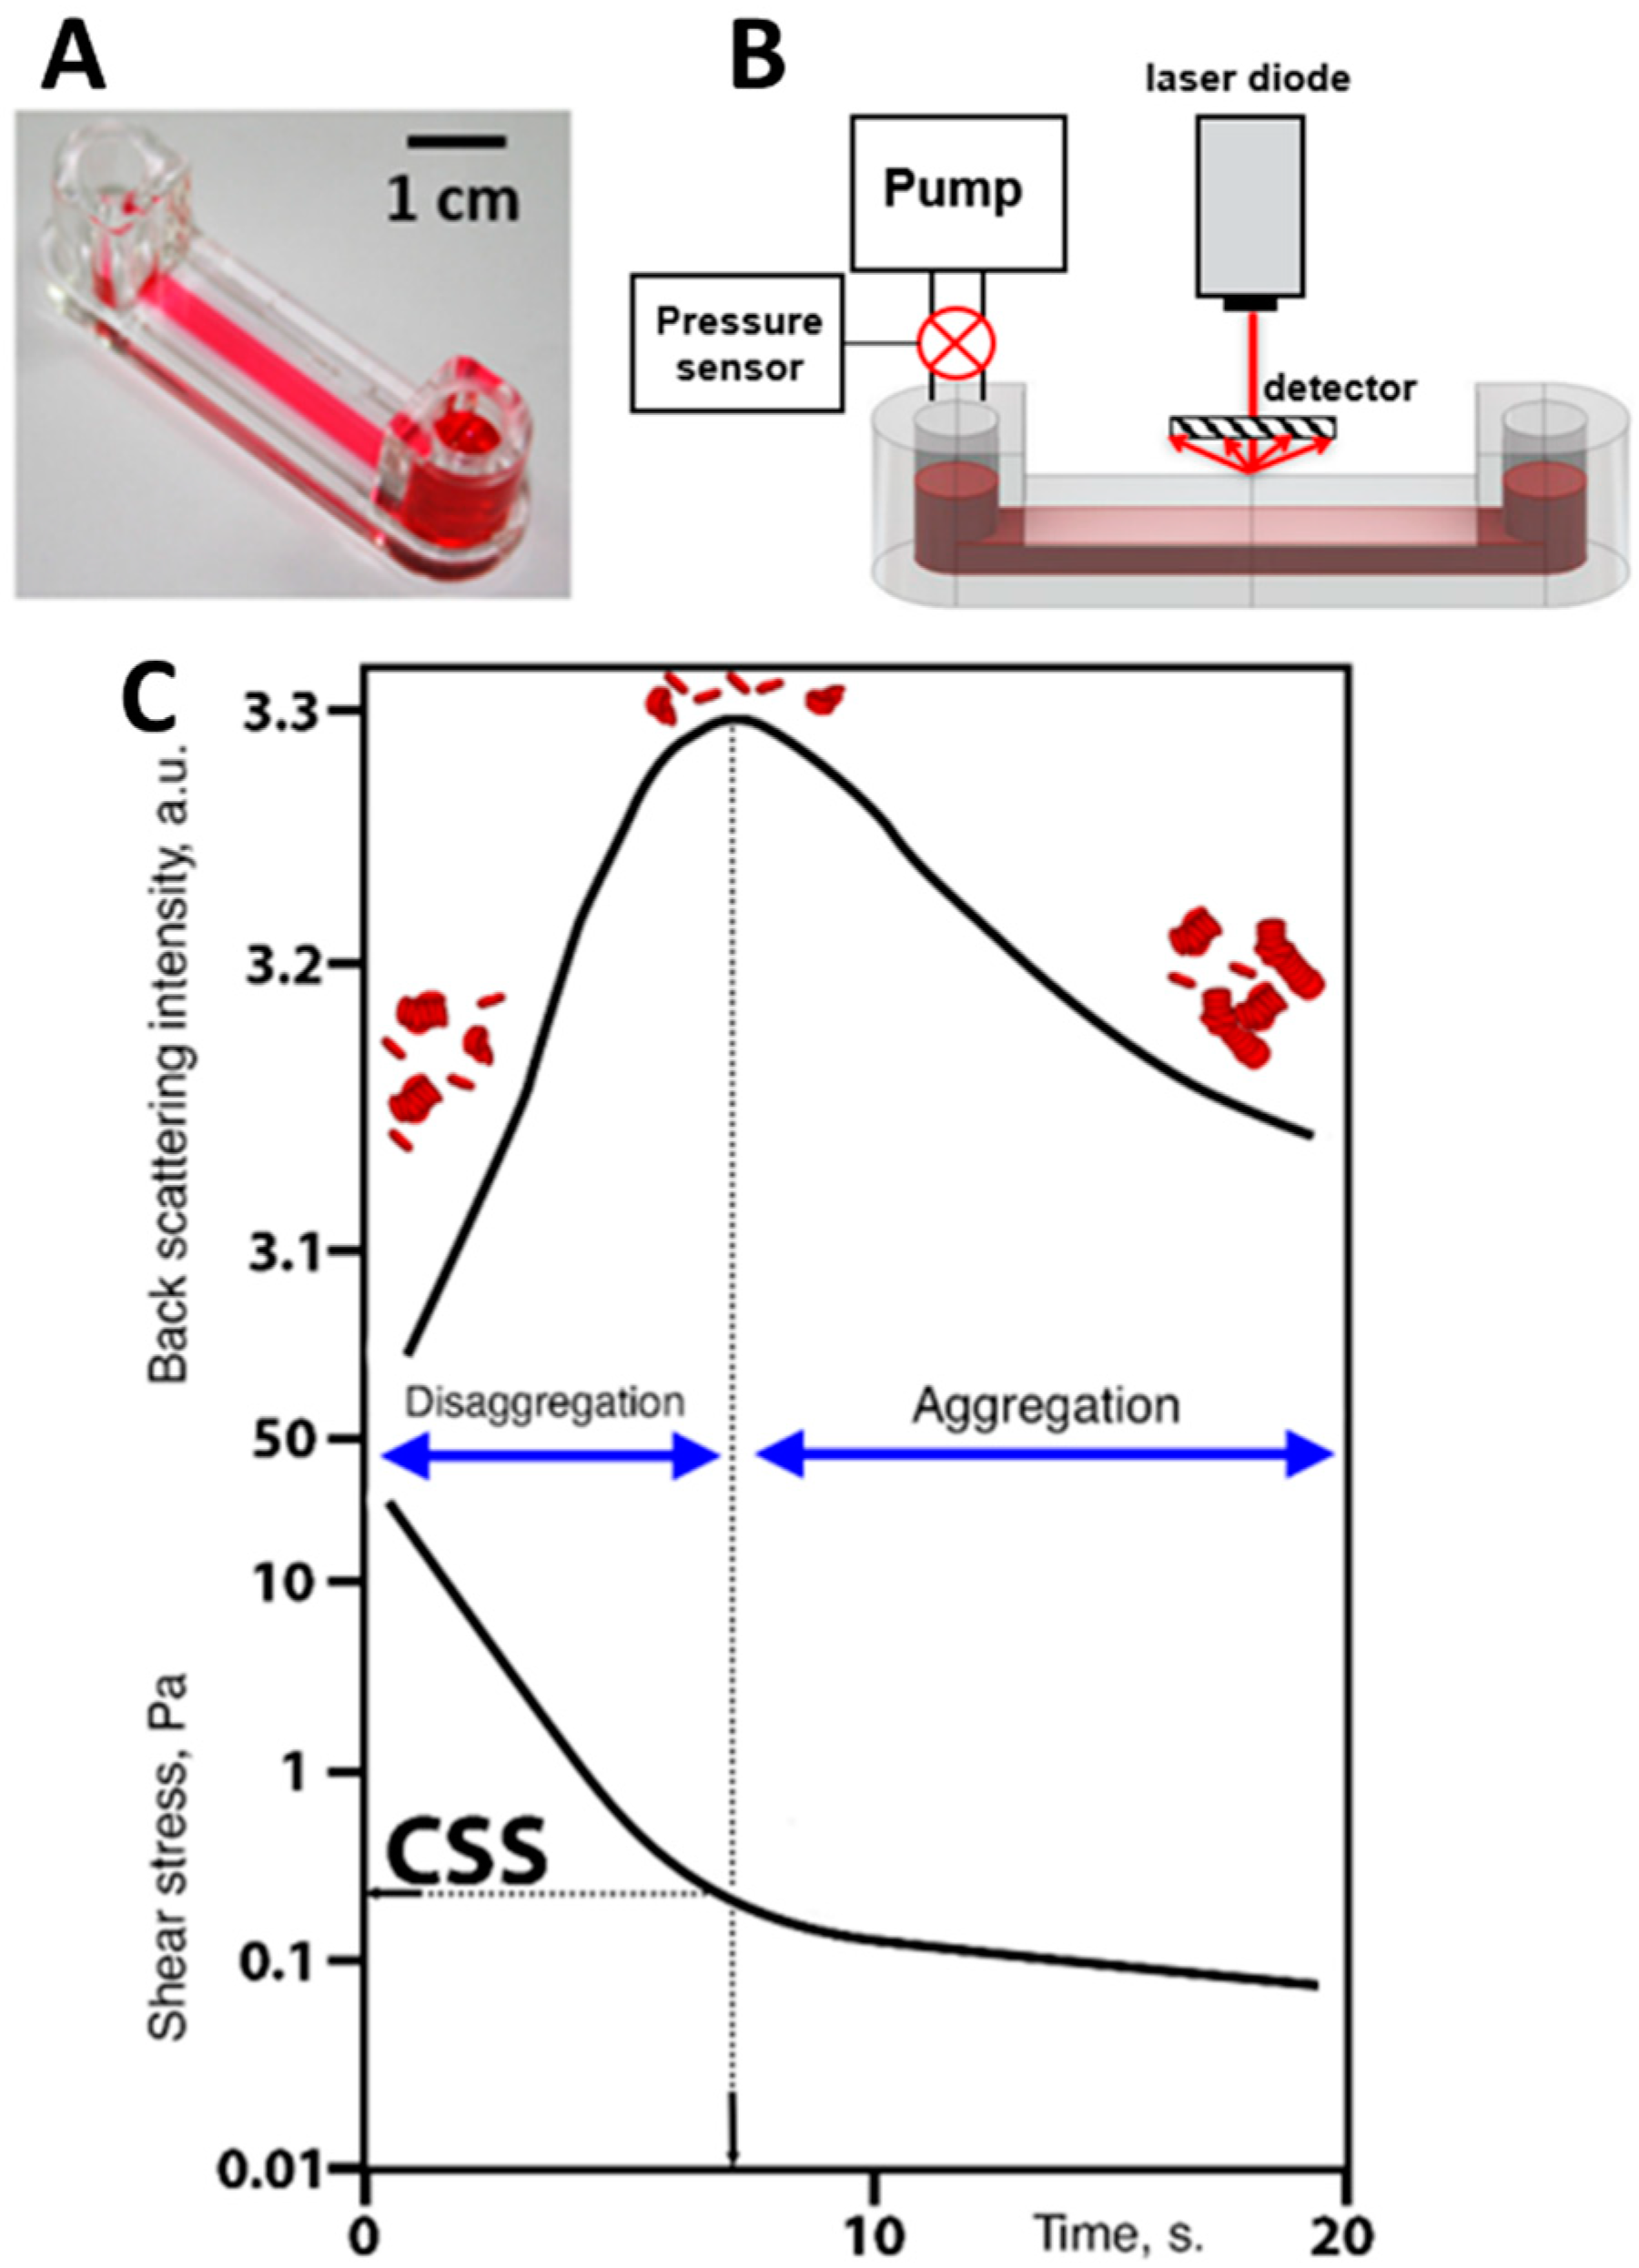
All diffuse light scattering measurements were performed using blood samples with hematocrit normalized at 40%. This was implemented using the laser aggregometer RheoScan AnD-300 (RheoMeditech, Seoul, Korea) to measure RBC aggregation parameters in the samples of whole blood (i.e., characterizing RBC aggregation in a large ensemble of cells). Three RBC aggregation parameters were measured: aggregation index (AI) and characteristic aggregation time (T1/2) (both of which refer to static parameters of aggregation as no blood-flow was involved during the measurements) and critical shear stress (CSS; which characterizes the minimal shear stress required to prevent aggregation and thus can be referred to as average hydrodynamical strength of RBC aggregates). The description of AI and T1/2 measurement procedures is provided in Figure 3. They involve flat transparent plastic cuvettes (C-01, RheoMeditech, Seoul, Korea), a photo of which is given in Figure 3A, and the schematic layout is shown in Figure 3B. The microchip represents a thin, flat, plastic chip with a microchamber (0.5 cm diameter, 0.3 mm height), in which a thin metal stirring bar is capable of rotating under the action of an external magnetic field in order to disperse the aggregates. An 8 µL volume of whole blood sample was injected into the chamber with a pipette via a special inlet. During measurement, we registered the aggregation kinetics, which represents the time dependence of intensity of the laser light (λ = 637 nm) scattered forward by the sample of blood (Figure 3C). At the beginning of the measurement, the stirring bar rotated at a high speed and, thereby, dispersed all RBC aggregates in the chamber. During this, the intensity of forward-scattered light is minimal (area t < 0 on the aggregation kinetics curve). At t = 0, the bar rotation was halted. Consequently, spontaneous aggregation immediately started, with an increasing number and size of aggregates in the blood sample. This leads to an increase in forward-scattered light intensity (area t > 0). After 2 min, the intensity reached the maximum magnitude showing that most of RBCs in the chamber have aggregated. The aggregation parameters are determined from the aggregation kinetics curve using special computer software.
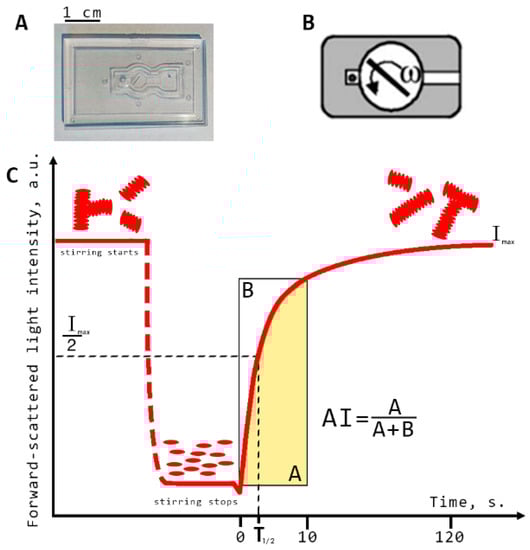
Figure 3.
Schematic representation of diffuse light scattering for assessing the parameters of RBC aggregation: aggregation index (AI) and characteristic aggregation time (T1/2). (A) photo of the experimental microchip; (B) schematic layout of the microchip; (C) RBC spontaneous aggregation kinetics curve measured with RheoScan AnD-300 with schematic indication of the aggregation indices: Imax, forward scattered light intensity at maximum RBC aggregation; AI, ratio of the RBCs participating in aggregation during the first 10 s of measurement in relation to the total number of cells; T1/2, characteristic aggregation time, defined as the time required to reach half the value of the maximum light intensity for measurements with a duration of 120 s.
Aggregation index (AI, %) is defined as the ratio of the area below the curve of the aggregation kinetics (A) to the total area (A + B) over for the first 10 s time interval. AI indicates the normalized quantity of aggregated RBCs during the first 10 s of the experiment. Average characteristic time of aggregate formation (T1/2, s) is defined as the time required to reach the half-maximum value of light intensity for measurements with a duration of 120 s. This parameter indicates the characteristic time required to reach the 50% level of aggregation.
Implementation of diffuse light scattering to assess the dynamic parameter of RBC aggregation measured under flow conditions is schematically represented in Figure 4. Critical shear stress (CSS)—the parameter characterizing the average hydrodynamic strength of RBC aggregates in whole blood samples—was measured by RheoScan AnD-300 using the flow microchip K-01 (RheoMeditech, Seoul, Korea) (Figure 4A). The schematic layout of the chip presented in Figure 4B demonstrates two 500 µL chambers connected with a flat-slit microchannel (0.2 mm height, 4 mm width, 40 mm length). CSS is measured in Pascals (Pa) and equals the shear stress required to initiate forced disaggregation of RBC aggregates in flow.
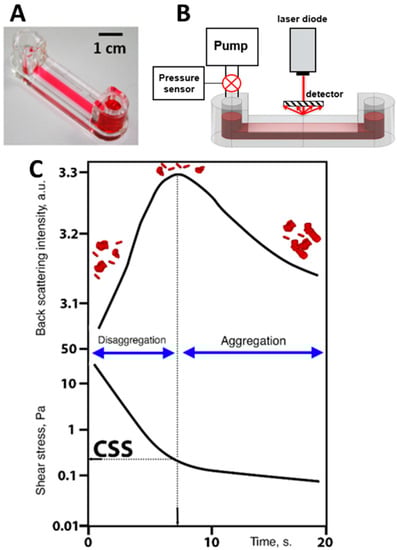
Figure 4.
Schematic representation of diffuse light scattering for assessing hydrodynamic strength of RBC aggregates in terms of critical shear stress (CSS). (A) Photo of the experimental chip; (B) schematic layout of the experimental chip with the microfluid channel with shear-scanning based on measuring back-scattered light intensity; (C) graphs of time-dependencies of back-scattered light intensity and shear stress in the microfluidic channel; two graphs are compared to determine CSS: the critical value of shear stress between disaggregation (region of high back scattering due to small sizes of the scattering objects) and aggregation (region of low back-scattered light intensity due to increasing sizes of RBC aggregates).
All measurements were performed at 37 °C. A 0.5 mL portion of the whole blood was put into the chamber. The RBC aggregates in the microchannel are subjected to the continuously decreasing shear stress. Viscous forces occurring in the microchannel lead to the dispersion of RBC aggregates in shear flow, with shear stresses ranging from 20 to 0 Pa. The CSS measurement process is illustrated in Figure 4C. The channel is illuminated by the diode laser (λ = 637 nm), and the backscattered light intensity is measured by the photodetector. At the beginning of the measurement procedure (the first 10 s) the flow rate and shear stress in the microchannel are high; therefore, the forced disaggregation process prevails and the RBCs get mostly disaggregated. This leads to an increase in backscattered light intensity as the average size of the scattering particles decreases. At a certain point in time, the shear stress in the microchannel becomes insufficient to prevent reversible aggregation of the cells. Aggregation forces start to overcome the disaggregation caused by the shear flow. The RBC aggregates are intensively formed, their average size increases, and, consequently, the back-scattered light intensity starts to decrease. The value of shear stress that corresponds to the maximum magnitude of the intensity of light back-scattered from the blood in the microchannel is assumed to be the CSS and related to the minimum shear stress that prevents the formation of RBC aggregates—in other words, it is the minimal shear stress required for disrupting the aggregates in the sample under shear flow. Thus, CSS can be referred to as the average hydrodynamic strength of RBC aggregates under flow conditions.
More details on the aggregation parameters measured by RheoScan AnD-300 are available in the publications of its developers [25,26].
2.4. Laser Diffractometry for Assessing RBC Deformability
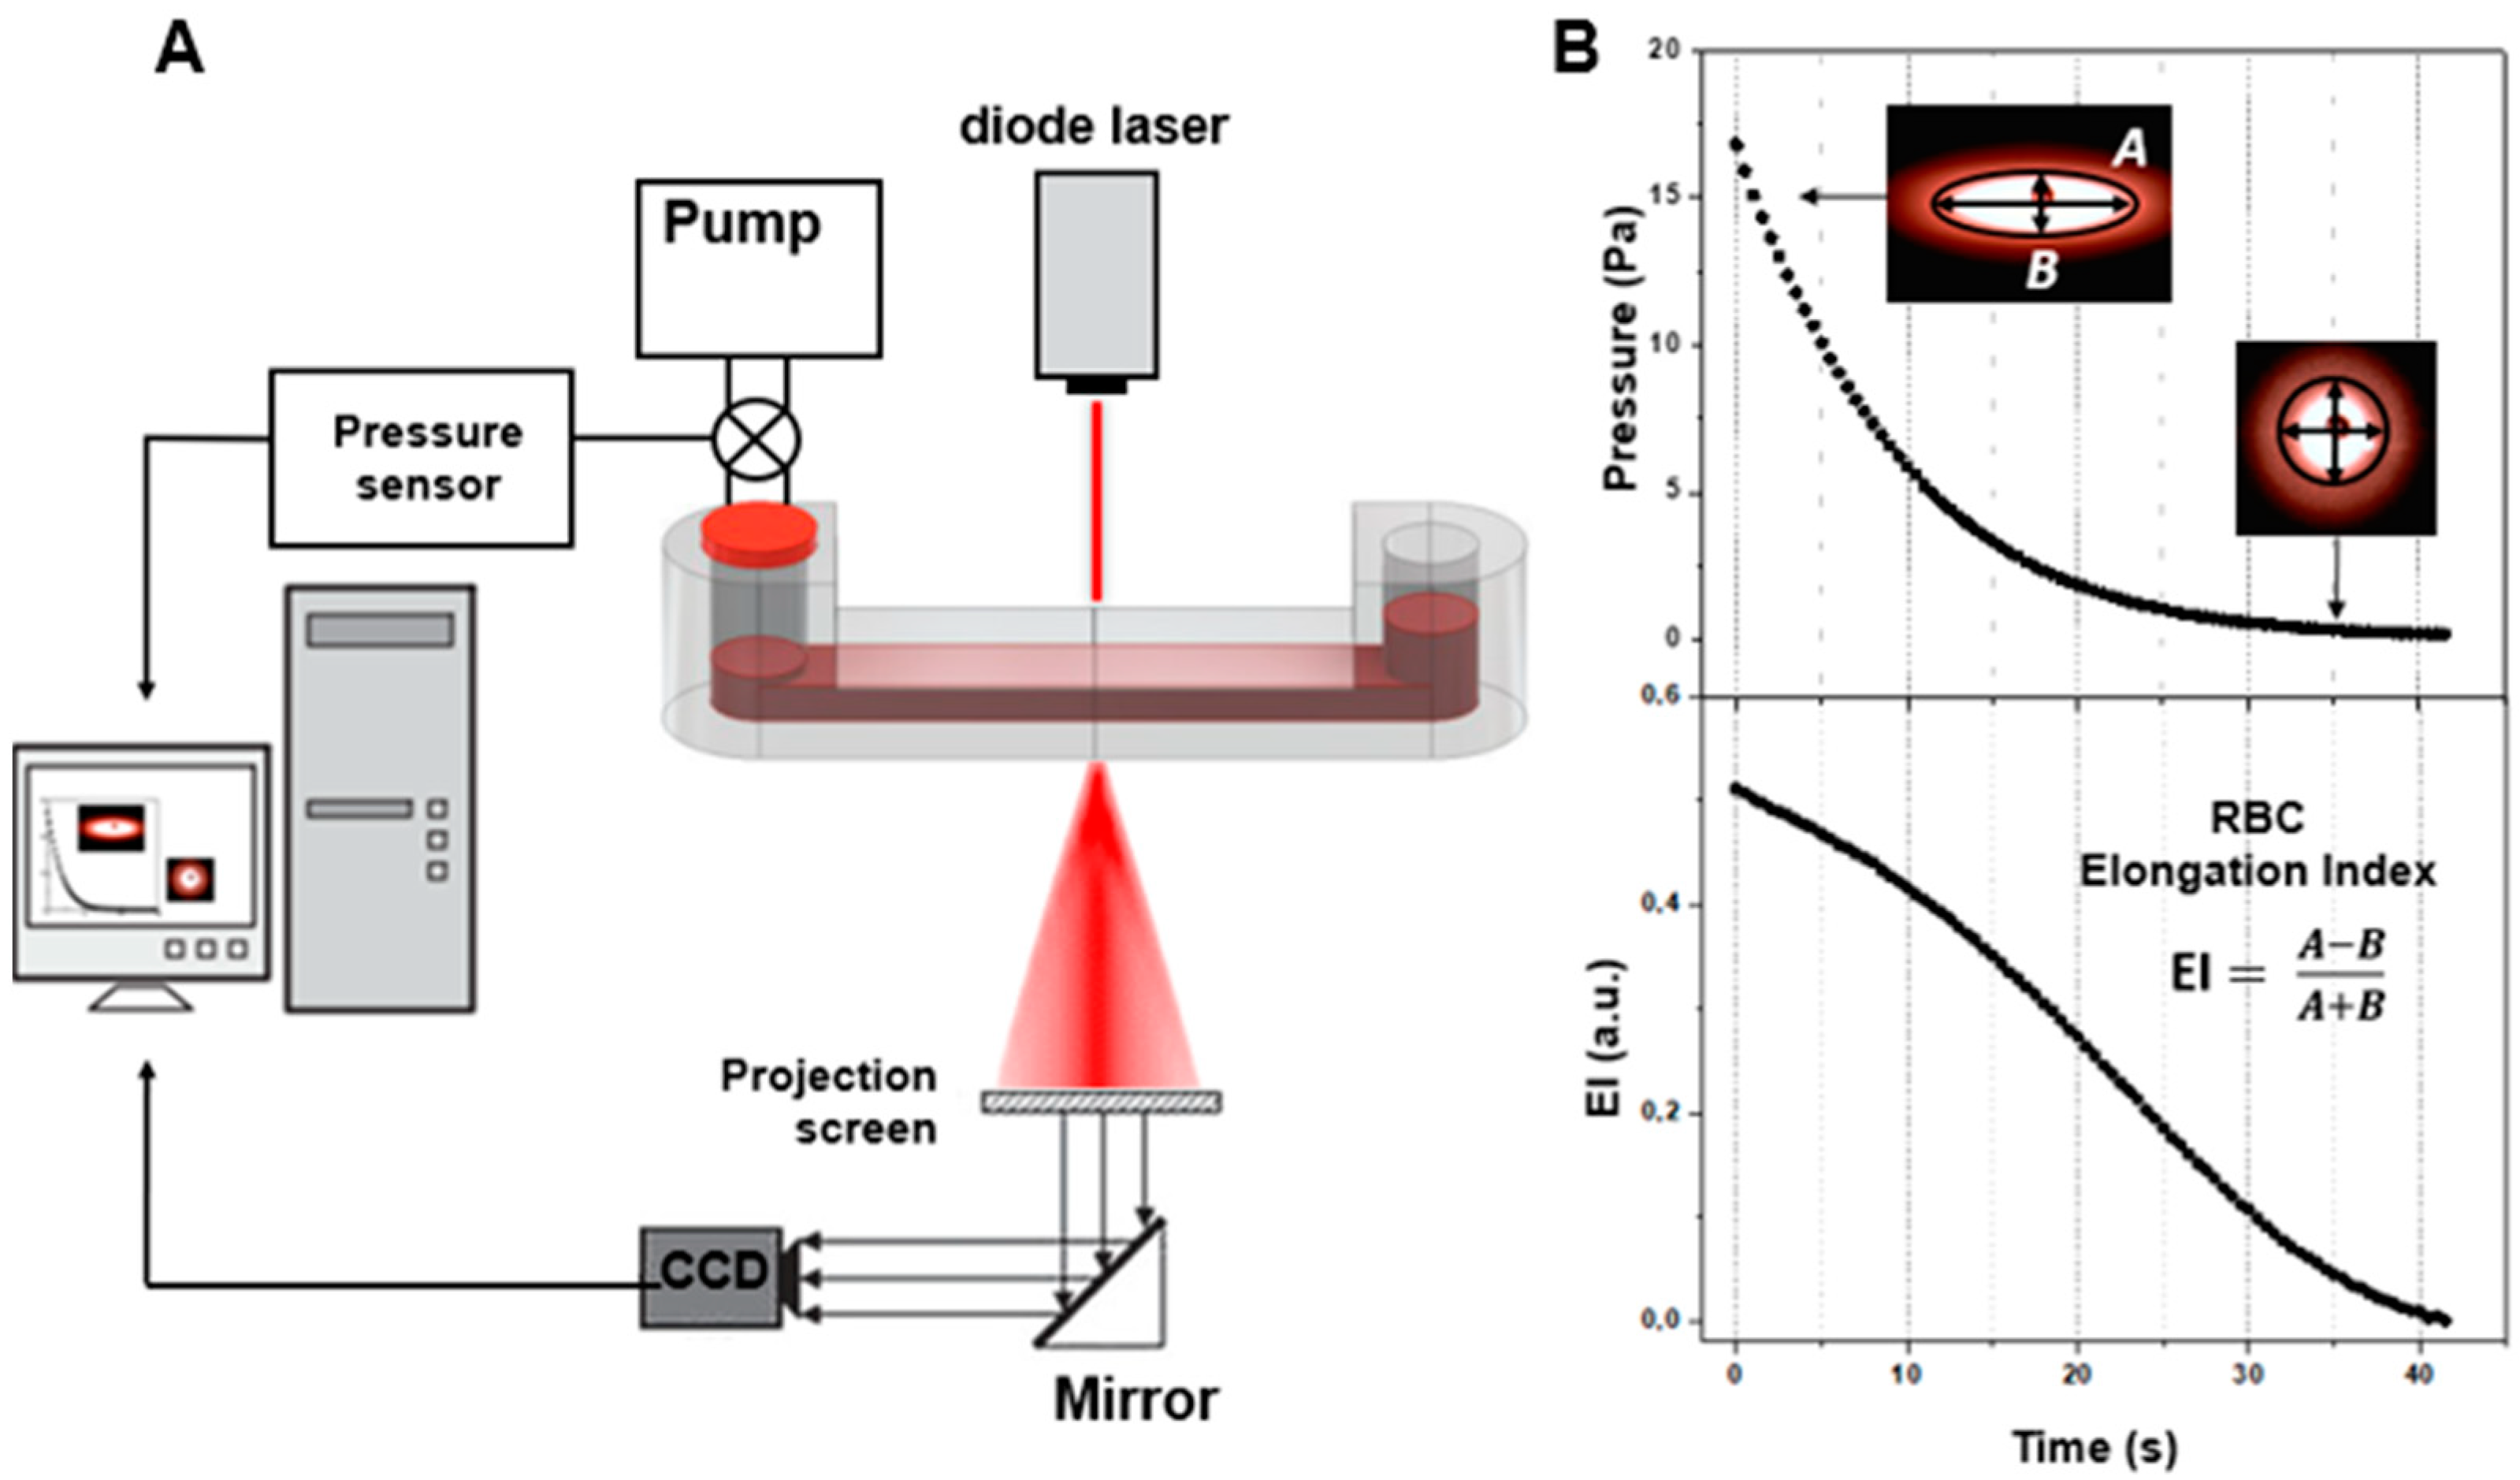
Laser diffractometry for assessing RBC deformability was conducted using the RheoScan AnD-300 with the same microchip as used for CSS measurements (Figure 5). The difference was that the experiments were performed with 300 times dilution of donors’ blood in polyvinylpyrrolidone to avoid multiple scattering of the laser light. This allows for the obtaining of a high-quality diffraction pattern upon laser-illumination of the blood-cell suspension flowing in the microchannel of the chip (Figure 5B). The diffraction pattern obtained results from the superposition of many partial diffraction patterns produced by concurrently illuminated individual RBCs; its shape depends on the shape and orientation of these cells in the microchannel. The diluted RBC suspension is sheared in the microchannel under continuously decreasing pressure, ranging from 20 to 0 Pa. The direct laser beam passing through the sheared sample is blocked, and the diffraction pattern produced by the deformed cells is registered by the CCD camera for subsequent analysis. The deformation of RBCs under shear stress arising in the microchannel results in the elongation of the diffraction pattern in the direction perpendicular to cell stretching. In the condition that all cells are equally deformed, the shape of the diffraction pattern becomes deformed in such a way that its lines of equal intensity (isointensity lines) are close to elliptical. The elongation index (EI)—defined as the ratio of the difference between the major and minor axes of the ellipse, which approximates a certain isointensity line of the diffraction pattern to their sum—is measured. Dependence of the EI on the shear stress characterizes the ability of red blood cells to deform while passing through thin blood vessels and capillaries. For more details, please refer to the publications of the RheoScan AnD-300 developers’ group on this topic [27,28].
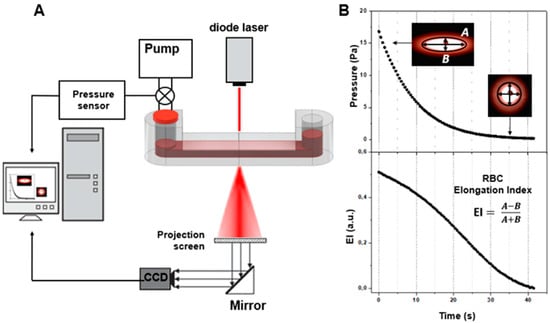
Figure 5.
Schematic representation of laser diffractometry for assessing RBC deformability. (A) Schematic layout of the experimental setup utilizing the fluidic chip with the microchannel filled with 300 times diluted blood under shearing stress illuminated with a laser (637 nm) source; (B) formation and analysis of diffraction patterns, and assessing RBC deformability in terms of the elongation index (EI), which is dependent on shear stress.
3. Results
3.1. Results of the Single-Cell Measurements of RBC Interaction Force (Fint) Performed with Laser Tweezers (LT)
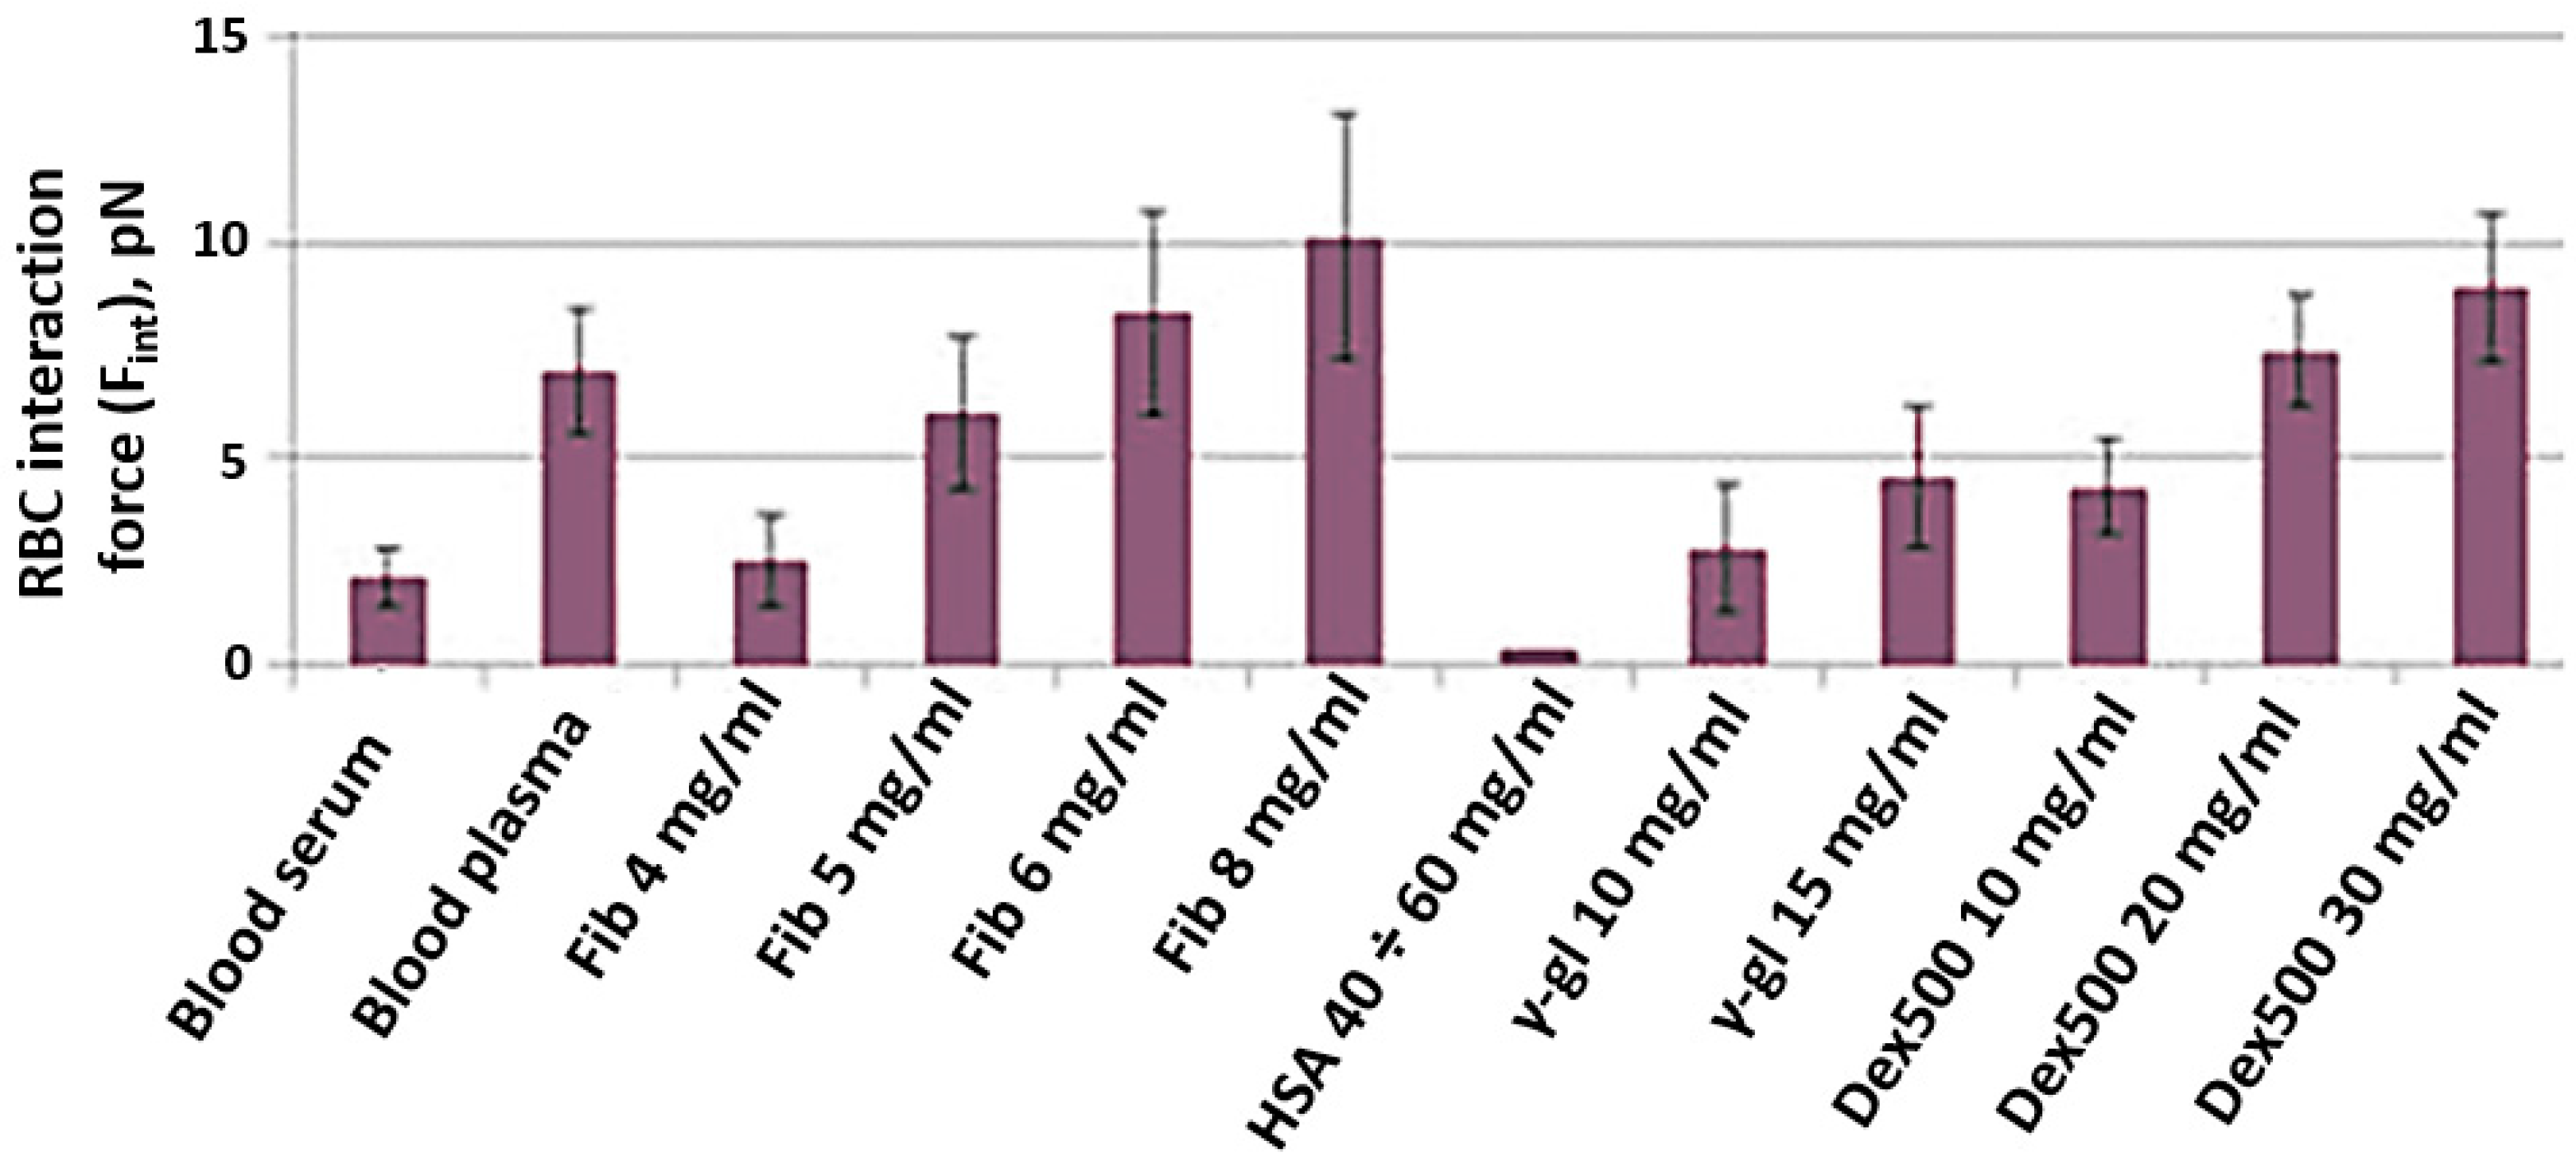
The results of Fint in vitro measurements are presented in Figure 6. Fint was measured in different media: autologous blood serum (platelet-poor plasma deprived of fibrinogen); autologous blood plasma with physiologically normal concentrations of plasma proteins; various lines of PBS solutions with different macromolecules: fibrinogen (Sigma Aldrich, F3879, Merck, Darmstadt, Germany); human serum albumin (HSA, Sigma Aldrich, A9511, Merck, Darmstadt, Germany); human γ-globulin (Sigma Aldrich, G4386, Merck, Darmstadt, Germany); dextran 500 kDa (Dex500, Sigma Aldrich, 31392, Merck, Darmstadt, Germany). First of all, for all studied solutions, Fint was found to be in the range of 1–10 pN, which corresponds to our own previous results as well as the results reported by some other researchers. Secondly, Fint of RBCs in serum (2.2 ± 0.9 pN) was shown to be significantly lower than that in plasma (6.3 ± 1.2 pN). This fact points out the crucial role of fibrinogen as the major natural RBC proaggregant and proves that laser tweezer measurements are sensitive to the effect of this key RBC aggregation modulator. The RBC aggregation-inducing effect of fibrinogen was also pronounced in the model PBS solution: Fint increased almost linearly with fibrinogen concentration. The difference is that in plasma RBCs, interaction force reaches saturation at 6–8 mg/mL, while in the model PBS solution saturation was not achieved. As expected, the addition of HSA to PBS model solution in the range of physiological concentrations did not induce RBC aggregation at all: the interaction between RBCs was so weak that it was impossible to measure Fint. PBS containing γ-globulin induced RBC aggregation. However, an increase in Fint by addition of γ-globulins was significantly less-pronounced than for fibrinogen. The proaggregant effect of the synthetic macromolecule Dex500 in model PBS solution can be characterized as an average between the effects of γ-globulin and fibrinogen: the values of Fint corresponding to those in blood plasma were achieved only a Dex500 concentration of 20 mg/mL.

Figure 6.
RBC interaction force (Fint), measured in vitro with laser tweezers in different media—autologous blood serum; autologous blood plasma and model PBS solution of different macromolecules at various concentrations: Fib, fibrinogen (data was taken from our previous publication [24] for better representation and convenience for the reader); HSA, human serum albumin; γ-gl, gamma-globulin from human serum; Dex500, dextran 500 kDa. Blood was from a healthy male individual. Measurements were performed on N = 10 pairs of RBCs in each sample. Diagrams show the mean values; error bars designate the mean square deviations, including the laser tweezer calibration error.
3.2. Results of the Measurements of RBC Aggregation Parameters in Whole Blood Samples Performed Using Diffuse Light Scattering
In Section 3.1, we presented novel results of single-cell measurements of RBC interaction forces in media with different molecular content. In other words, we studied the sensitivity of laser tweezers on the role of extracellular factors mediating RBC aggregation. In general, diffuse light scattering and RheoScan AnD-300 have already been applied to study the effects of fibrinogen, HSA, γ-globulins and dextrans with various molecular masses on the aggregation of RBCs in whole blood samples. To discover new opportunities to implement diffuse light scattering in microrheological investigations, we performed a pilot study of the effects of two commercially available drugs targeted to reduce the interaction between blood cells (commonly referred to as RBC aggregability). The results of this study are provided in Figure 7.

Figure 7.
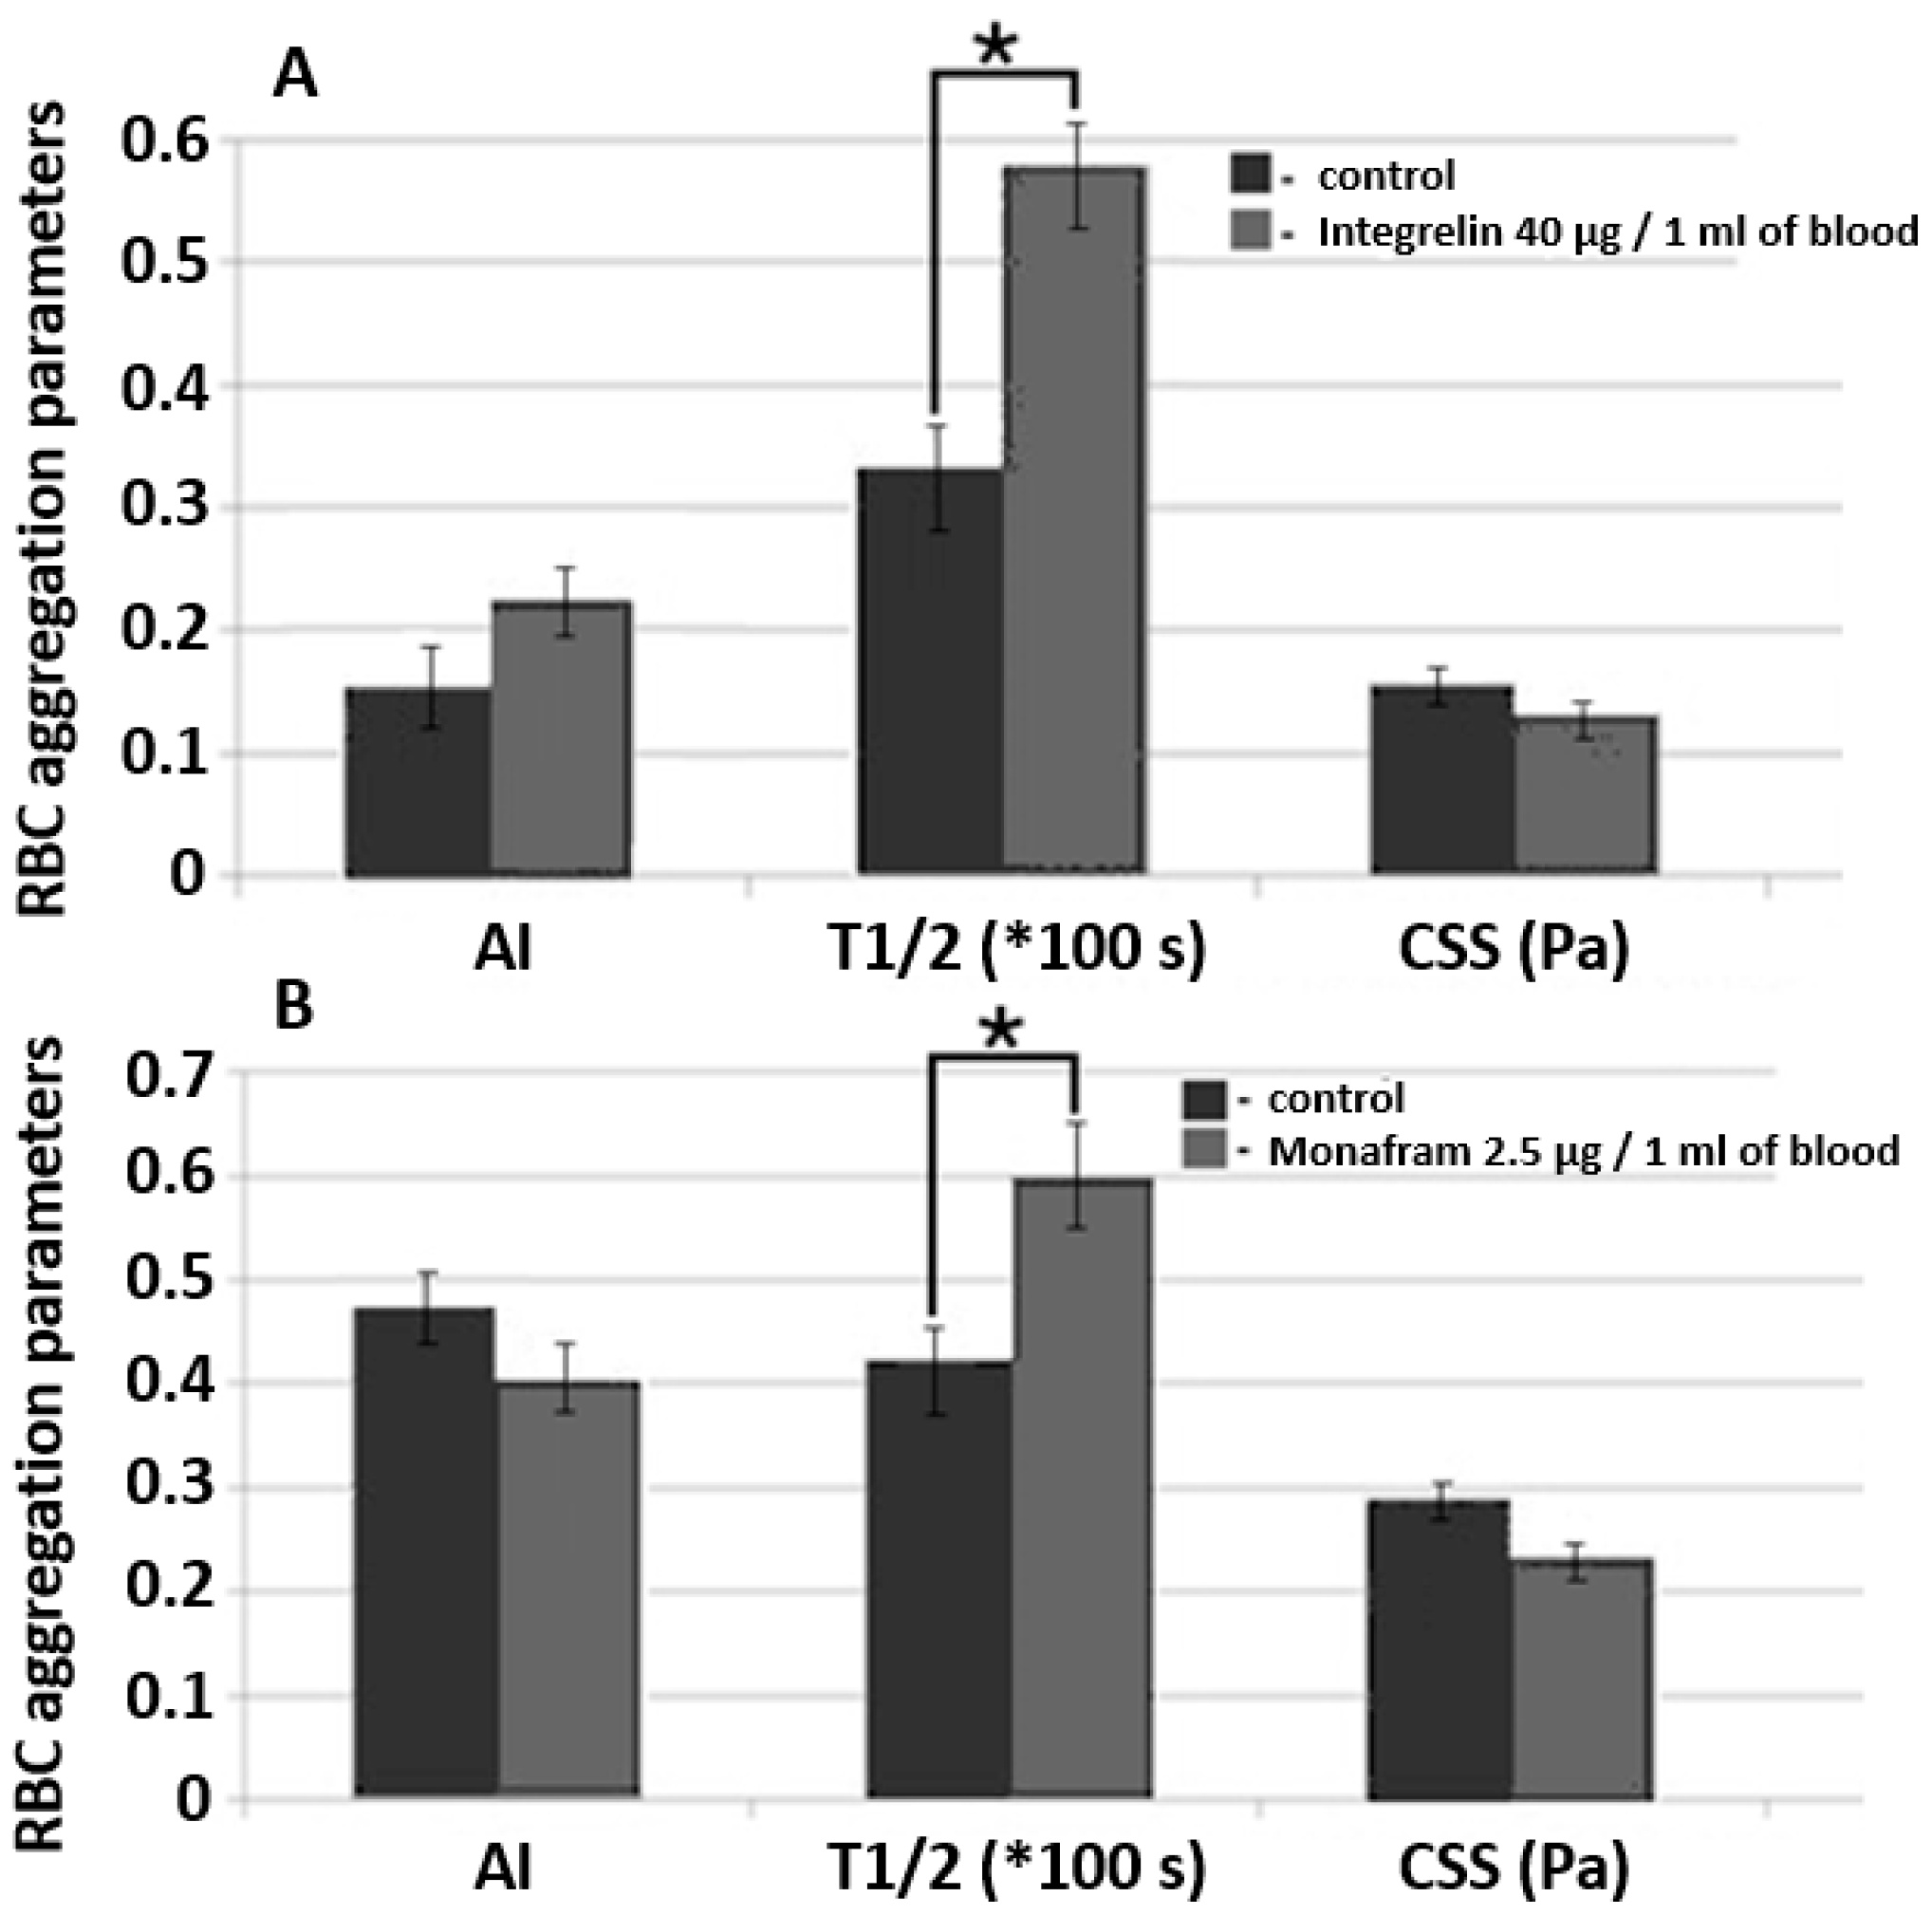
A comparative diagram of RBC aggregation parameters measured using diffuse light scattering implemented by RheoScan And-300 aggregometer in samples of whole blood supplemented with glycoprotein IIb/IIIa agonist commercial pharmaceuticals Integrelin (A) and Monafram (B). Blood incubation time was 30 min at 37 °C. Control and experimental groups included 3 different donors in each group. Data averaging was performed within each group. The mean values and error bars designate standard deviations; * p < 0.05 (t-test); AI, RBC aggregation index; T1/2, characteristic time of aggregate formation; CSS, critical shear stress, sufficient to prevent spontaneous aggregation (hydrodynamic strength of the aggregate). The parameters are presented under one scale, measurement units for each parameter are indicated in brackets.
We studied the effects of Integrelin (Figure 7A) and Monafram (Figure 7B) in vitro. Both substances decrease cell—cell interaction by preventing the linking of adhesive ligands (namely, fibrinogen) with glycoprotein complexes IIb/IIIa. Integrelin is an antiplatelet pharmaceutical that contains eptifibatide as an active agent. Eptifibatide is a peptide inhibitor of glycoproteins IIb/IIIa. When eptifibatide binds glycoproteins IIb/IIIa on the cell surface, it blocks this receptor from recognizing other adhesive molecules, resulting in a decrease in cell–cell interaction. Monafram consists of F(ab)2 fragments of anti-glycoprotein IIb/IIIa monoclonal antibody FraMon (CRC64). Being a glycoprotein IIb/IIIa agonist, it acts similarly to eptifibatide and is used to decrease the aggregation activity of platelets. We chose these drugs to verify the sensitivity of diffuse light scattering to determine the effects of mediating RBC aggregability in whole blood measurements.
In every experiment, each group (the control and the experimental) included 3 donors. Concentration was determined according to calculations based on the protocols of intravenous administration of these drugs in clinical practice [29]. The incubation time of the blood samples supplemented with Integrelin or Monafram was 30 min at 37 °C. In both Integrelin (40 µg/1 mL of blood) and Monafram (2.5 µg/1 mL of blood), the time of aggregate formation, T1/2, was statistically significantly (p < 0.05, t-test) increased in comparison with the control: 57.9 ± 2.9 s (control 33.5 ± 3.6 s) for Integrelin; 60.0 ± 4.0 s (control 40.2 ± 2.0 s) for Monafram. The behavior of AI after 30 min of incubation of inhibitors with blood samples was different: for Integrelin, AI increased from 15.8 ± 3.3% to 23.0 ± 4.2%, while for Monafram it decreased from 47.7 ± 4.5% to 40.0 ± 5.2%. The differences for AI are not statistically significant (t-test). For both inhibitors, we discovered a statistically insignificant yet observable reduction of hydrodynamic strength of RBC aggregates: for Integrelin CSS it decreased to 131 ± 10 mPa (control 157 ± 15 mPa); for Monafram CSS it decreased to 238 ± 23 mPa (control 293 ± 20 mPa). The effect of inhibitors of glycoprotein complexes IIb/IIIa was more pronounced on characteristic time (T1/2) of RBC aggregate formation. In this case, the differences were statistically significant. This can be explained by that fact that T1/2 is a parameter of RBC aggregation kinetics and depends on the early phase of RBC interaction—formation of linear aggregates—and also on the later phase, when complex three-dimensional aggregates are formed. Meanwhile, CSS and AI characterize RBC interaction in general, including both linear and three-dimensional aggregate formation and dispersion. Such a difference in T1/2 values demonstrates that glycoprotein inhibition mostly affects early stages of RBC aggregation, precisely when cells are in plane–parallel contact. This corresponds to results obtained by another group [30]. Control values are different because each experiment involved different donors within the group.
To summarize, it is clearly seen that lasers allow for assessing changes in RBC aggregation in whole blood both on the level of single cells (using laser tweezers) or on the level of huge ensembles of cells. Usage of these methods allows for studying the mechanisms of RBC aggregation because they are sensitive to the noncellular effects of the changes in the medium which surrounds the RBCs (i.e., blood plasma, serum or model solution) and to the changes in the cellular properties of RBCs (i.e., effects of glycoprotein inhibition on the cell membrane).
3.3. Results of the Measurements of RBC Deformability Performed Using Laser Diffractometry
We performed measurements of RBC deformability under the effects of two stress hormones—noradrenaline (Sigma Aldrich, A7257, Merck, Darmstadt, Germany) and adrenaline (Sigma Aldrich, E4250, Merck, Darmstadt, Germany). It has been reported that they possess opposite effects on RBC deformability. Noradrenaline impairs the rheologic properties of RBCs by decreasing membrane fluidity and, correspondingly, deformability due to the changes in the structure of membrane proteins or their interactions in the membrane [31,32]. On the contrary, the exposure of RBCs to adrenaline results in a concentration-dependent increase in RBC membrane fluidity [33]. Based on this data, we decided to perform a laser diffractometry test of the effects of noradrenaline and adrenaline on RBC deformability.
RBCs were washed 3 times in phosphate-buffered saline PBS, administered into aliquots of noradrenaline and adrenaline at desired concentrations and incubated for 15 min at 37 °C. The experimental solutions of hormones were achieved by dilution of dry powders of noradrenaline and adrenaline in PBS at high concentrations with subsequent dilution with PBS until the desired concentrations were obtained. After incubation, the cells were gently sedimented without washing, supernatant was taken, and the remaining RBCs were resuspended in 0.14 mM polyvinylpyrrolidone (PVP360, Sigma Aldrich, Merck, Darmstadt, Germany; viscosity: 30 cP at 37 °C; pH = 7.4; osmolarity: 290 mOsm/L) at 1%-hematocrit. The obtained suspension was then measured using RheoScan AnD-300.
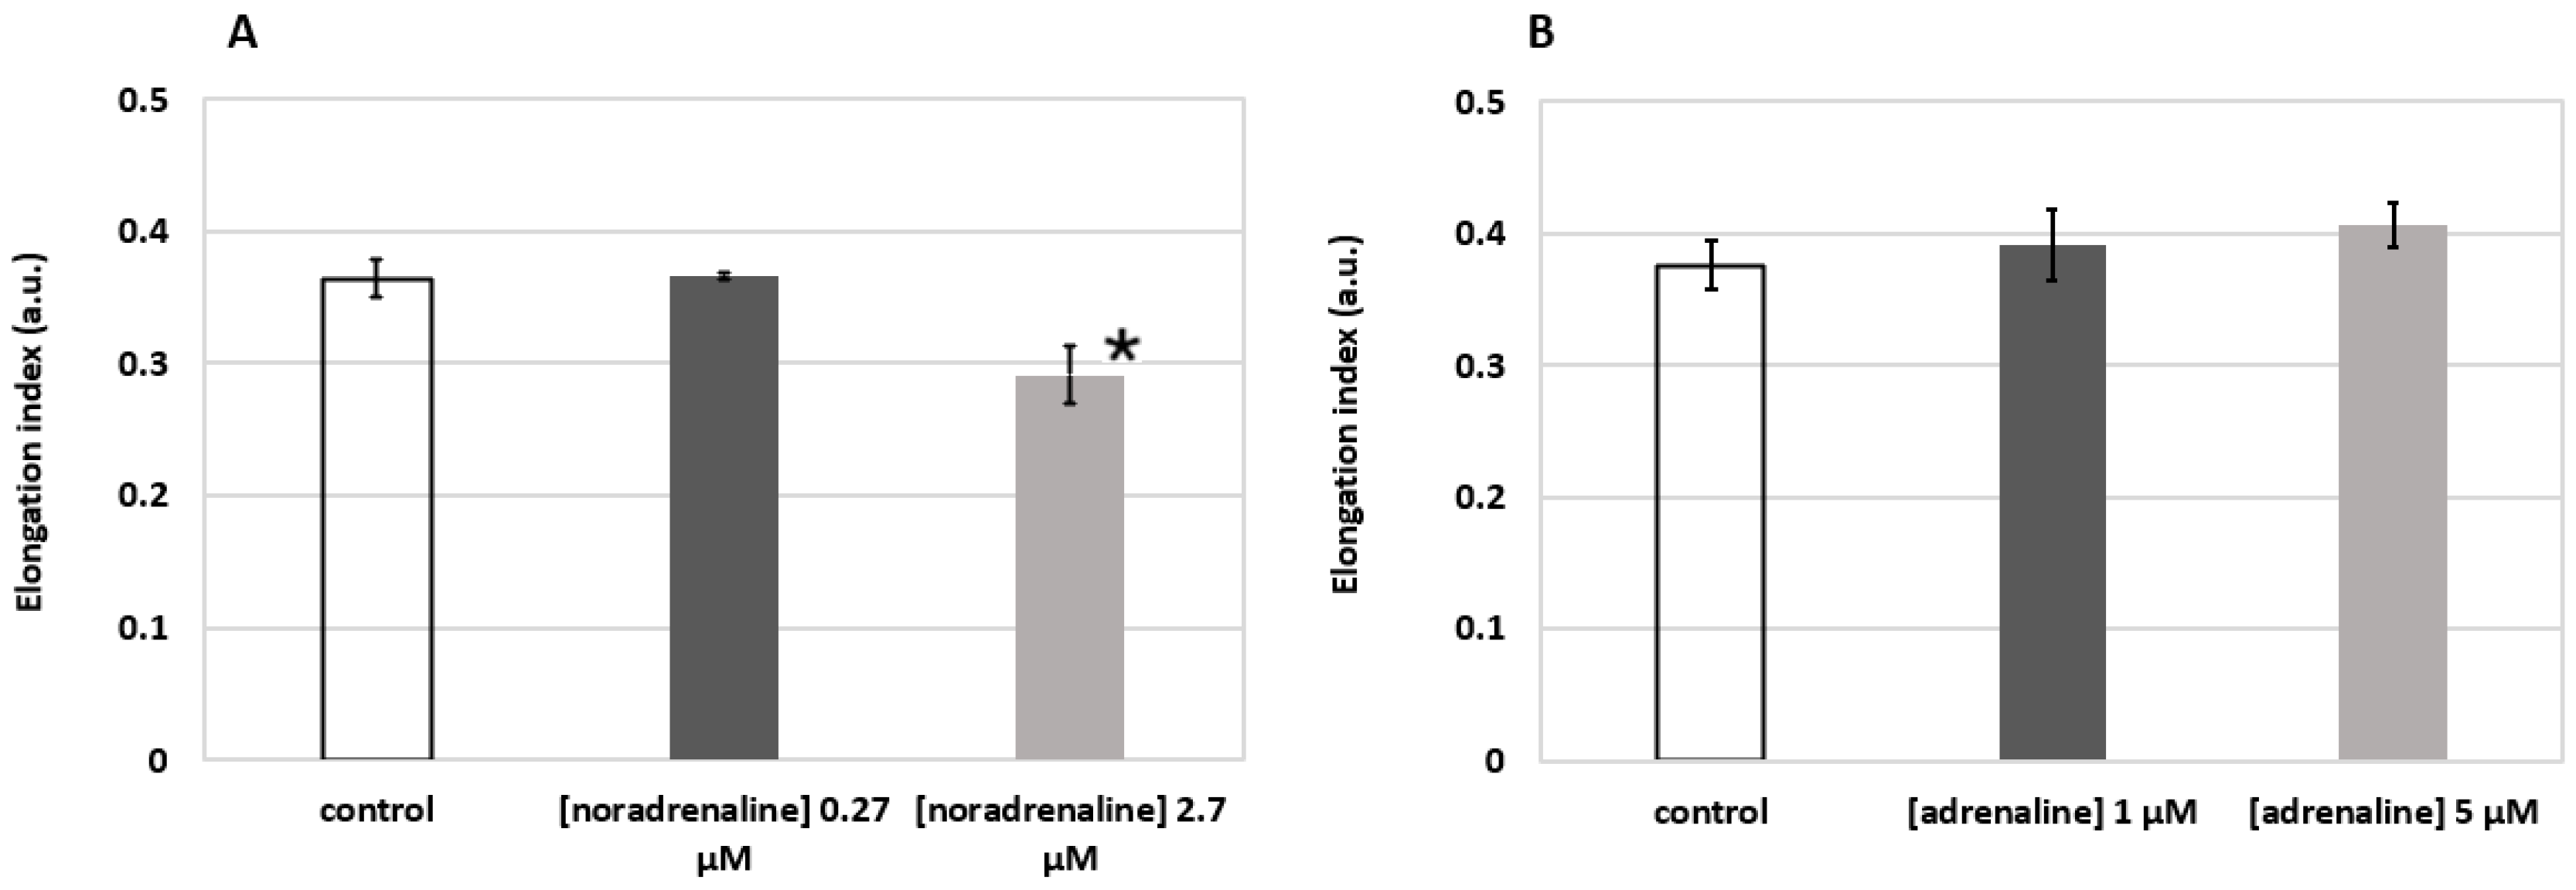
The results shown in Figure 8 demonstrate the elongation index (EI) of RBCs at the applied external shear stress of 3 Pa. One can see that incubation of RBCs in solution of noradrenaline (Figure 8A) at 2.7 µM concentration led to a statistically significant (p < 0.05, t-test) decrease in RBC deformability (0.291 ± 0.022 vs. 0.364 ± 0.014 in the control group). This corresponds to the data in the literature [31]. The effect of adrenaline (Figure 8B), on the contrary, points out a clear trend of increasing RBC deformability, which generally corresponds with the results of other groups [33,34]. Thus, we can see that laser diffractometry allows for assessing either decreases or increases in RBC deformability induced by activation of various metabolic pathways.
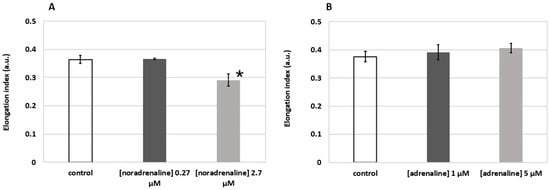
Figure 8.
Changes in RBC deformability induced by metabolic hormones noradrenaline (A) and adrenaline (B) assessed by laser diffractometry using RheoScan AnD-300. Incubation time 15 min at 37 °C. Elongation index refers to the elongation of RBCs when 3 Pa external shear stress is applied. Blood was from a healthy male individual. Measurements were performed three times; bars represent mean values; error bars designate standard deviations; * p < 0.05 (t-test).
4. Discussion
Blood is a unique type of tissue because it is constantly flowing. From this perspective, both cellular and noncellular factors should be in good balance to support optimal rheological properties to maintain microcirculation and perfusion. There are many conditions that may affect blood rheology in different ways: temperature effects [35]; changes in blood plasma protein concentration; microrheological age-related changes in RBCs [14]; and pathological alterations. Thus, it is necessary to be able to assess the role of different factors in controlling blood rheological behavior in routine clinical practice in theranostics of many diseases accompanied with hemorheological disorders. Optical techniques have great potential to fulfill this demand. The temperature effects on blood rheology have been intensively studied for decades [36]. In our previous work, we demonstrated the sensitivity of laser tweezers, diffuse light scattering and RBC diffractometry to changes in blood rheology depending on the temperature [35]. The next stage of this complex study is to characterize the sensitivity of laser optics to plasma protein concentration factors. The results of the current study demonstrate that their sensitivity to proteins and macromolecules that are reported to be major inducers of RBC aggregation is quite high. In most cases these are acute-phase proteins, such as fibrinogen and γ-globulins. From the literature, it is well known that blood rheological behavior strongly depends on the content of proteins of the acute phase fraction [37]. We can see (Figure 6) that both in autologous media (plasma\serum) and in model solutions (PBS) the presence of fibrinogen or γ-globulin significantly strengthens the interaction of RBCs, and we can track this on the single-cell level by measuring the interaction force Fint using laser tweezers. Probing RBC interaction in the model solution of synthetic macromolecule dextran 500 kDa showed that an increase in Dex500 concentration leads to a significant increase in Fint, which corresponds to the data on Dex500 as a strong proaggregant [38]. However, there are several blood plasma proteins that are present in blood plasma in normal physiological conditions, for example, haptoglobins, and C-reactive protein, whose role in the regulation of blood rheology is still uncertain or controversial [39]. This topic is additionally complicated by phenomena when a plasma protein changes its role from aggregation inducer to inhibitor depending on the concentration of other proteins. For example, human serum albumin, which normally does not significantly affect RBC aggregation, at certain fibrinogen concentration provides a synergistic effect on immunoglobulin-induced aggregation [40].
The main disadvantage of LTs is the small quantity of cells measured. As the average time of RBC searching and Ftrap measurement is about 5 min, no more than 10 pairs of RBCs are measured in each sample. The main advantage of LTs is the ability to manipulate single cells without mechanical contact and negligible heating effect. Overall, this field of hemorheology requires further study involving various techniques. Recent advances in the design of microchannel and microfluidics machinery allow implementation of lasers in single-cell studies of cellular biomechanics under flow conditions. Overall, this field of hemorheology requires further studies involving various techniques. In [41] it was demonstrated that femtosecond laser sources can be used to fabricate microchannels in monolith plastic chips with accurate control of channel geometry and, therefore, support the desired flow conditions. The configuration of the laser system and the fabrication material accommodates single-cell measurements of RBC biomechanical properties under flow using multiple channel optical tweezers. Such an approach is very promising in correspondence to the modern visions of hemorheological diagnosis in the “lab-on-a-chip” philosophy.
It has already been reported that devices based on diffuse light scattering are capable of assessing the hemorheological effects of plasma proteins [21,22]. Moreover, such devices are widely and successfully used in clinical practice in routine diagnostics of cardiovascular disease [42], acute coronary syndrome [43], coronary heart disease, diabetes mellitus [44] and more. Now this technique takes a step forward into assessing RBC aggregability mediated by RBC cellular properties, namely membrane composition. Here we demonstrated that some aggregation parameters measured by diffuse light scattering are sensitive to the effects of antiaggregant drugs: glycoprotein IIb/IIIa agonist pharmaceuticals Integrelin and Monafram suppress RBC aggregation by binding the receptor and preventing fibrinogen-induced aggregation. However, this field is additionally complicated with the fact that mechanisms of RBC aggregation are not understood completely. Modern fundamental studies in this field point to the principal duality of RBC mechanisms of aggregation involving the depletion layer theory [45] and the molecular cross-bridging model [13]. Diffuse light scattering is a very convenient, simple and fast technique for obtaining the parameters of RBC aggregation on a huge number of cells simultaneously. Use of diode laser light with low intensity does not affect the intrinsic properties of cells. It should be noted that since the measurements are based on the registration of the scattering signal from a large number of RBCs in the blood sample, the concentration of the cells in the sample significantly affects the scattering signal, which complicates the possibility of comparing the results obtained from different samples. The important requirement and limitation for these measurements is to bring the blood samples to an equal hematocrit.
Laser diffractometry of RBCs is a solid technique to test the red cells for their deformability on the level of large ensembles of cells [46] and can also be used to study the molecular mechanisms driving RBC deformation. Nowadays, studies of metabolic effects modulating RBC deformability are of particular interest [47]. According to recent studies [48] the mechanisms underlying RBC deformability are mediated by the conformational changes in the structure of proteins responsible for the attachment of the actin–spectrin cytoskeleton to the inner surface of the membrane (namely, band 3 complexes, protein 4.2 and others). Some of the severe hematological diseases are accompanied by decreased RBC deformability. For example, hereditary spherocytosis, which is accompanied by significantly decreased RBC deformability due to the loss of inner membrane surface due to massive transformation of RBCs from discocytes into spherocytes [49]. Today, the treatment of such pathologies is very complicated due to lack of knowledge on the mechanisms for improving RBC deformability. In the present work, we demonstrated that laser diffractometry was an effective method to probe the opposing effects of stress hormones: noradrenaline decreased average RBC deformability (Figure 8A) and adrenaline increased deformability (Figure 8B). Such a result is of a particular benefit for hematological clinical practice. We are able to use laser diffractometers in vitro for a search and characterization of physiological metabolites or synthetic drugs that can potentially increase RBC deformability in cases of pathological impairment. However, one of the problems with laser diffractometry is a dependence of the diffraction pattern on the shearing geometry of the flow occurring in the experimental chamber [28]. In some cases, this complicates the interpretation of the experimental data. To overcome this problem, we should extend the usage of diffractometers with different shearing geometries in studies of RBC deformability and compare the obtained results. Additionally, the problem of diffractometry data interpretation can be solved by developing advanced, novel algorithms of diffraction pattern analysis, which, for instance, are presented by Nikitin et al. in their works [50,51].
The general problem for all laser optical approaches is the interaction of the laser beam with RBCs. In most cases, the laser source is chosen according to the minimum phototoxicity caused by light absorbance. Thus, the excitation wavelength range is chosen in the red or near-infrared bands of the spectrum. However, during the trapping of RBCs with near infrared laser tweezers, the RBCs are deformed and can take various shapes depending on the power and polarization of the trapping beam and duration of the experiment [52]. We can clearly state that the effects of interaction between probing laser beam and RBCs should be considered in order to avoid possible morphological alterations in the cell. The importance of biological safety during laser trapping is discussed in [53]. In this work, the authors study the rotation and deformation of RBCs using optical trapping in tapered fiber probes. This technique allows simultaneous assessment of the rotational and deformation properties of RBCs and also potentially provides information on the interaction between deformed cells.
5. Conclusions
Optical techniques demonstrate high effectiveness in assessing the parameters of RBC aggregation and deformability. These methods allow for studying the fundamental mechanisms of RBC aggregation and deformation both on the single-cell level (using laser tweezers) and on the level of large ensembles of cells (diffuse light scattering and laser diffractometry). In particular, the results of our measurements of RBC paired-interaction force in different media—autologous blood serum and plasma and various model PBS solutions with different macromolecules (fibrinogen, human γ-globulin and dextran)—clearly show the crucial role of fibrinogen as the major natural RBC proaggregant and prove that laser tweezer measurements are sensitive to the effect of this key RBC aggregation modulator. The RBC aggregation-inducing effect of fibrinogen was also shown to be pronounced in model PBS solution, and γ-globulin also demonstrated the inducing effect on RBC aggregation in the model PBS solution. However, an increase in RBC paired-interaction force by the addition of γ-globulins is significantly lower than that of fibrinogen. The proaggregant effect of synthetic macromolecule Dex500 in model PBS solution can be characterized as an average between the effects of γ-globulin and fibrinogen. Our ability to assess the changes in RBC deformability induced by metabolic hormones noradrenaline and adrenaline opens possibilities for the practical application of this technique for correcting blood microrheological properties in clinics.
Supplementary Materials
The following supporting information can be downloaded at: https://www.mdpi.com/article/10.3390/photonics9040238/s1, Figure S1: The calibration of the laser tweezers set up by comparing the optical trapping force with the viscous drag force.
Author Contributions
Conceptualization, A.P. and A.L.; methodology, K.L.; validation, A.L. and K.L.; experiments, A.S., P.E. and K.L.; writing—original draft preparation, A.S.; writing—review and editing, A.P., A.L., K.L. and P.E.; visualization, A.S. and P.E.; supervision, A.L.; project administration and funding acquisition, A.P. All authors have read and agreed to the published version of the manuscript.
Funding
This research was funded by Russian Science Foundation, grant number 20-45-08004.
Institutional Review Board Statement
The study was conducted in accordance with the Declaration of Helsinki, and approved by the Ethics Committee of Medical Research and Educational Center of M.V. Lomonosov Moscow State University (protocol No. 6 15.06.2021).
Informed Consent Statement
Informed consent was obtained from all subjects involved in the study.
Data Availability Statement
All the necessary data are provided in the figures in the present paper and in its Supplementary Materials.
Acknowledgments
The authors thank Alexei V. Muravyov from K.D. Ushinskiy Yaroslavl State Pedagogical University (Yaroslavl, Russia) and Sehyun Shin from School of Mechanical Engineering, Korea University (Seoul, Korea) for the fruitful discussions.
Conflicts of Interest
The authors declare that the research was conducted in the absence of any commercial or financial relationships that could be construed as a potential conflict of interest.
References
- Singh, M.; Shin, S. Changes in erythrocyte aggregation and deformability in diabetes mellitus: A brief review. Indian J. Exp. Biol. 2009, 47, 7–15. [Google Scholar] [PubMed]
- Li, Q.; Li, L.; Li, Y. Enhanced RBC Aggregation in Type 2 Diabetes Patients. J. Clin. Lab. Anal. 2015, 29, 387–389. [Google Scholar] [CrossRef] [PubMed]
- Toker, S.; Rogowski, O.; Melamed, S.; Shirom, A.; Shapira, I.; Berliner, S.; Zeltser, D. Association of components of the metabolic syndrome with the appearance of aggregated red blood cells in the peripheral blood. An unfavorable hemorheological finding. Diabetes Metab. Res. Rev. 2005, 21, 197–202. [Google Scholar] [CrossRef] [PubMed]
- Lee, H.; Na, W.; Lee, S.B.; Ahn, C.W.; Moon, J.S.; Won, K.C.; Shin, S. Potential Diagnostic Hemorheological Indexes for Chronic Kidney Disease in Patients With Type 2 Diabetes. Front. Physiol. 2019, 10, 1062. [Google Scholar] [CrossRef] [PubMed]
- Nash, G.B. Blood rheology and ischaemia. Eye 1991, 5, 151–158. [Google Scholar] [CrossRef] [PubMed]
- Nemeth, N.; Deak, A.; Szentkereszty, Z.; Peto, K. Effects and influencing factors on hemorheological variables taken into consideration in surgical pathophysiology research. Clin. Hemorheol. Microcirc. 2018, 69, 133–140. [Google Scholar] [CrossRef] [Green Version]
- Yaylali, Y.T.; Kilic-Toprak, E.; Ozdemir, Y.; Senol, H.; Bor-Kucukatay, M. Impaired Blood Rheology in Pulmonary Arterial Hypertension. Heart Lung Circ. 2018, 28, 1067–1073. [Google Scholar] [CrossRef]
- Renoux, C.; Fort, R.; Nader, E.; Boisson, C.; Joly, P.; Stauffer, E.; Robert, M.; Girard, S.; Cibiel, A.; Gauthier, A.; et al. Impact of COVID-19 on red blood cell rheology. Br. J. Haematol. 2021, 2019, 2019–2022. [Google Scholar] [CrossRef]
- Baskurt, O.K.; Meiselman, H.J. Blood rheology and hemodynamics. Semin. Thromb. Hemost. 2003, 29, 435–450. [Google Scholar]
- Baskurt, O.K.; Neu, B.; Meiselman, H. Red Blood Cell Aggregation; CRC Press: Boca Raton, FL, USA, 2012; ISBN 9781439841815. [Google Scholar]
- Fernandes, H.P.; Fontes, A.; Thomaz, A.; Castro, V.; Cesar, C.L.; Barjas-Castro, M.L.; Heloise, P.F.; Adraiana, F.; Andre, T.; Vagner, C.; et al. Measuring red blood cell aggregation forces using double optical tweezers. Scand. J. Clin. Lab. Investig. 2013, 73, 262–264. [Google Scholar] [CrossRef]
- Lee, K.; Danilina, A.V.; Kinnunen, M.; Priezzhev, A.V.; Meglinski, I. Probing the red blood cells aggregating force with optical tweezers. IEEE J. Sel. Top. Quantum Electron. 2016, 22, 365–370. [Google Scholar] [CrossRef]
- Lee, K.; Wagner, C.; Priezzhev, A.V. Assessment of the “cross-bridge”—Induced interaction of red blood cells by optical trapping combined with microfluidics. J. Biomed. Opt. 2017, 22, 091516. [Google Scholar] [CrossRef] [PubMed]
- Ermolinskiy, P.; Lugovtsov, A.; Yaya, F.; Lee, K.; Kaestner, L.; Wagner, C.; Priezzhev, A. Effect of red blood cell aging in vivo on their aggregation properties in vitro: Measurements with laser tweezers. Appl. Sci. 2020, 10, 7581. [Google Scholar] [CrossRef]
- Huisjes, R.; Bogdanova, A.; van Solinge, W.W.; Schiffelers, R.M.; Kaestner, L.; van Wijk, R. Squeezing for life—Properties of red blood cell deformability. Front. Physiol. 2018, 9, 656. [Google Scholar] [CrossRef] [PubMed]
- Stuart, J.; Nash, G.B. Red cell deformability and haematological disorders. Blood Rev. 1990, 4, 141–147. [Google Scholar] [CrossRef]
- Franck, P.; Buijs, P.; Meenhuis, A.; Dane, M.; Postma, C.; Spaans, A.; Gijsbertha, N.; Kuypers, F.A.; Hudig, C.; Kerkhoffs, J.L. The ektacytometric elongation Index (EI) of erythrocytes, validation of a prognostic, rheological biomarker for patients with sickle cell disease. Eur. J. Haematol. 2022; ahead of press. [Google Scholar]
- Evans, E.; Ritchie, K.; Merkel, R. Sensitive force technique to probe molecular adhesion and structural linkages at biological interfaces. Biophys. J. 1995, 68, 2580–2587. [Google Scholar] [CrossRef] [Green Version]
- Brust, M.; Aouane, O.; Thiebaud, M.; Flormann, D.; Verdier, C.; Kaestner, L.; Laschke, M.W.; Selmi, H.; Benyoussef, A.; Podgorski, T.; et al. The plasma protein fibrinogen stabilizes clusters of red blood cells in microcapillary flows. Sci. Rep. 2014, 4, 4348. [Google Scholar] [CrossRef] [Green Version]
- Carvalho, F.A.; Santos, N.C. Atomic force microscopy-based force spectroscopy—Biological and biomedical applications. IUBMB Life 2012, 64, 465–472. [Google Scholar] [CrossRef]
- Hardeman, M.R.; Dobbe, J.G.G.; Ince, C. The Laser-assisted Optical Rotational Cell Analyzer (LORCA) as red blood cell aggregometer. Clin. Hemorheol. Microcirc. 2001, 25, 1–11. [Google Scholar]
- Shin, S.; Yang, Y.; Suh, J.S. Measurement of erythrocyte aggregation in a microchip stirring system by light transmission. Clin. Hemorheol. Microcirc. 2009, 41, 197–207. [Google Scholar] [CrossRef]
- Baskurt, O.K.; Boynard, M.; Cokelet, G.C.; Connes, P.; Cooke, B.M.; Forconi, S.; Liao, F.; Hardeman, M.R.; Jung, F.; Meiselman, H.J.; et al. New guidelines for hemorheological laboratory techniques. Clin. Hemorheol. Microcirc. 2009, 42, 75–97. [Google Scholar] [CrossRef] [PubMed] [Green Version]
- Lee, K.; Khokhlova, M.D.; Lyubin, E.V.; Priezzhev, A.V.; Meglinsky, I.; Fedyanin, A.A. Optical tweezers study of red blood cell aggregation and disaggregation in plasma and protein solutions. J. Biomed. Opt. 2016, 21, 035001. [Google Scholar] [CrossRef] [PubMed]
- Shin, S.; Yang, Y.; Suh, J.S. Microchip-based cell aggregometer using stirring-disaggregation mechanism. Korea Aust. Rheol. J. 2007, 19, 109–115. [Google Scholar]
- Shin, S.; Hou, J.X.; Suh, J.S. Measurement of cell aggregation characteristics by analysis of laser-backscattering in a microfluidic rheometry. Korea Aust. Rheol. J. 2007, 19, 61–66. [Google Scholar]
- Shin, S.; Hou, J.X.; Suh, J.S.; Singh, M. Validation and application of a microfluidic ektacytometer (RheoScan-D) in measuring erythrocyte deformability. Clin. Hemorheol. Microcirc. 2007, 37, 319–328. [Google Scholar]
- Baskurt, O.K.; Hardeman, M.R.; Uyuklu, M.; Ulker, P.; Cengiz, M.; Nemeth, N.; Shin, S.; Alexy, T.; Meiselman, H.J. Comparison of three commercially available ektacytometers with different shearing geometries. Biorheology 2009, 46, 251–264. [Google Scholar] [CrossRef]
- Rathod, K.; Antoniou, S.; Avari, P.; Ding, N.; Wright, P.; Knight, C.; Jain, A.; Mathur, A.; Smith, E.; Weerackody, R.; et al. Eptifibatide is associated with significant cost savings and similar clinical outcomes to abciximab when used during primary percutaneous coronary intervention for ST-elevation myocardial infarction: An observational cohort study of 3863 patients. JRSM Cardiovasc. Dis. 2017, 6, 1–8. [Google Scholar] [CrossRef]
- Sokolova, I.; Gafarova, M.; Khokhlova, M.; Muravyev, A.; Lyubin, E.; Skryabina, M.; Fedyanin, A.; Krasnova, T.; Shahnazarov, A. Glycoprotein IIB-IIIA inhibitor, monafram decelerate the early phase of red blood cells aggregation. J. Cell. Biotechnol. 2016, 2, 15–22. [Google Scholar] [CrossRef] [Green Version]
- Valensi, P.; Gaudey, F.; Parries, J.; Attali, J.R. Glucagon and noradrenaline reduce erythrocyte deformability. Metabolism 1993, 42, 1169–1172. [Google Scholar] [CrossRef]
- Minetti, G.; Low, P.S. Erythrocytes signal transduction pathways and their possible functions. Curr. Opin. Hematol. 1997, 4, 116–121. [Google Scholar] [CrossRef]
- Tuvia, S.; Moses, A.; Gulayev, N.; Levin, S.; Korenstein, R. β-Adrenergic agonists regulate cell membrane fluctuations of human erythrocytes. J. Physiol. 1999, 516, 781–792. [Google Scholar] [CrossRef] [PubMed]
- Muravyov, A.V.; Tikhomirova, I.A. Role molecular signaling pathways in changes of red blood cell deformability. Clin. Hemorheol. Microcirc. 2013, 53, 45–59. [Google Scholar] [CrossRef] [PubMed]
- Ermolinkiy, P.B.; Maslyanitsina, A.I.; Lugovtsov, A.E.; Priezzhev, A.V. Temperature dependencies of the aggregation properties of rbc in dextran solutions in vitro. J. Biomed. Photonics Eng. 2020, 6, 020501. [Google Scholar] [CrossRef]
- Baskurt, O.K.; Hardeman, M.R.; Rampling, M.W.; Meiselman, H.J. (Eds.) Handbook of Hemorheology and Hemodynamics; IOS Press: Amsterdam, The Netherlands, 2007; ISBN 9781586037710. [Google Scholar]
- Weng, X.; Cloutier, G.; Beaulieu, R.; Roederer, G.O. Influence of acute-phase proteins on erythrocyte aggregation. Am. J. Physiol. 1996, 271, H2346–H2352. [Google Scholar] [CrossRef]
- Neu, B.; Wenby, R.; Meiselman, H.J. Effects of dextran molecular weight on red blood cell aggregation. Biophys. J. 2008, 95, 3059–3065. [Google Scholar] [CrossRef] [Green Version]
- Flormann, D.; Kuder, E.; Lipp, P.; Wagner, C.; Kaestner, L. Is there a role of C-reactive protein in red blood cell aggregation? Int. J. Lab. Hematol. 2015, 37, 474–482. [Google Scholar] [CrossRef]
- Ben-Ami, R.; Barshtein, G.; Mardi, T.; Deutch, V.; Elkayam, O.; Yedgar, S.; Berliner, S. A synergistic effect of albumin and fibrinogen on immunoglobulin-induced red blood cell aggregation. Am. J. Physiol.-Heart Circ. Physiol. 2003, 285, H2663–H2669. [Google Scholar] [CrossRef] [Green Version]
- Bellini, N.; Vishnubhatla, K.; Ramponi, R.; Osellame, R.; Bragheri, F.; Ferrara, L.; Minzioni, P.; Cristiani, I. Trapping and stretching of single cells in an optofluidic chip fabricated by a femtosecond laser. Opt. Express 2010, 18, 4679–4688. [Google Scholar] [CrossRef]
- Lugovtsov, A.E.; Gurfinkel, Y.I.; Ermolinskiy, P.B.; Maslyanitsina, A.I.; Dyachuk, L.I.; Priezzhev, A.V. Optical assessment of alterations of microrheologic and microcirculation parameters in cardiovascular diseases. Biomed. Opt. Express 2019, 10, 3974. [Google Scholar] [CrossRef]
- Kim, J.; Chung, H.; Cho, M.; Lee, B.-K.; Karimi, A.; Shin, S. The role of critical shear stress on acute coronary syndrome. Clin. Hemorheol. Microcirc. 2013, 55, 101–109. [Google Scholar] [CrossRef] [Green Version]
- Maslianitsyna, A.; Ermolinskiy, P.; Lugovtsov, A.; Pigurenko, A.; Sasonko, M.; Gurfinkel, Y.; Priezzhev, A. Multimodal Diagnostics of Microrheologic Alterations in Blood of Coronary Heart Disease and Diabetic Patients. Diagnostics 2021, 11, 76. [Google Scholar] [CrossRef] [PubMed]
- Zhang, Z.W.; Neu, B. Role of macromolecular depletion in red blood cell adhesion. Biophys. J. 2009, 97, 1031–1037. [Google Scholar] [CrossRef] [PubMed] [Green Version]
- Groner, W.; Mohandas, N.; Bessis, M. New optical technique for measuring erythrocyte deformability with the ektacytometer. Clin. Chem. 1980, 26, 1435–1442. [Google Scholar] [CrossRef] [PubMed]
- Brun, J.-F.; Varlet-Marie, E.; Myzia, J.; de Mauverger, E.R.; Pretorius, E. Metabolic Influences Modulating Erythrocyte Deformability and Eryptosis. Metabolites 2022, 12, 4. [Google Scholar] [CrossRef]
- Mohandas, N.; Gallagher, P.G. Red cell membrane: Past, present, and future. Blood 2008, 112, 3939–3948. [Google Scholar] [CrossRef] [Green Version]
- Perrotta, S.; Gallagher, P.G.; Mohandas, N. Hereditary spherocytosis. Lancet 2008, 372, 1411–1426. [Google Scholar] [CrossRef]
- Nikitin, S.Y.; Ustinov, V.D.; Yurchuk, Y.S.; Lugovtsov, A.E.; Lin, M.D.; Priezzhev, A.V. New diffractometric equations and data processing algorithm for laser ektacytometry of red blood cells. J. Quant. Spectrosc. Radiat. Transf. 2016, 178, 315–324. [Google Scholar] [CrossRef]
- Nikitin, S.Y.; Ustinov, V.D.; Shishkin, S.D. Band point algorithms for measuring diffraction pattern parameters in laser ektacytometry of red blood cells. Quantum Electron. 2021, 51, 353–358. [Google Scholar] [CrossRef]
- Ermolinskiy, P.B.; Lugovtsov, A.E.; Semenov, A.N.; Priezzhev, A.V. Red blood cell in the field of a beam of optical tweezers. Quantum Electron. 2022, 52, 22–27. [Google Scholar] [CrossRef]
- Liu, X.; Huang, J.; Li, Y.; Zhang, Y.; Li, B. Rotation and deformation of human red blood cells with light from tapered fiber probes. Nanophotonics 2017, 6, 309–316. [Google Scholar] [CrossRef]


Publisher’s Note: MDPI stays neutral with regard to jurisdictional claims in published maps and institutional affiliations. |
© 2022 by the authors. Licensee MDPI, Basel, Switzerland. This article is an open access article distributed under the terms and conditions of the Creative Commons Attribution (CC BY) license (https://creativecommons.org/licenses/by/4.0/).