Article

On Optically Modulated Reflective Semiconductor Optical Amplifier Pattern-Dependent Overshoot Mitigation Using a Birefringent Fiber Loop

1
Lightwave Communications Research Group, Department of Electrical and Computer Engineering, Democritus University of Thrace, 67100 Xanthi, Greece
2
Department of Electrical and Computer Engineering, University of Western Macedonia, 50131 Kozani, Greece
*
Author to whom correspondence should be addressed.
Photonics 2022, 9(4), 248; https://doi.org/10.3390/photonics9040248
Submission received: 30 December 2021 / Revised: 24 March 2022 / Accepted: 6 April 2022 / Published: 9 April 2022

Abstract

:
Reflective semiconductor optical amplifiers (RSOAs) are key elements for modern optical communications. Despite their widespread deployment, their performance when intended for ultrafast data amplification is limited by their inherently slow gain dynamics. In this paper, we propose to employ a birefringent fiber loop (BFL) to compensate for the RSOA pattern-dependent behavior and extend its operation well beyond that allowed by its nominal optical modulation bandwidth. We apply a reduced model to describe the RSOA response and quantify the RSOA output distortion by means of a non-return-to-zero data pulse overshoot. We validate the outcomes of this model in the time domain both for the RSOA alone and with the assistance of the BFL by an extensive comparison to available measurements. The excellent matching between simulation and experimental results allows us to further investigate the impact of critical operating parameters and derive specifications for them so that the performance of the scheme against the overshoot is made acceptable. The theoretical predictions confirm the ability of the BFL to enhance the RSOA direct amplification capability and hence establish it as a frequency discriminator for complementing RSOAs’ versatile and scalable operation.

1. Introduction

Reflective semiconductor optical amplifiers (RSOAs) have enjoyed a wide popularity and have been established as a key technology for modern lightwave applications where information must be conveyed in two distinct transmission directions [1]. RSOAs conveniently serve this need by using the same signal entrance and exit, which greatly reduces the functional complexity and cost at the expense of device special construction [2]. However, RSOAs’ optical modulation bandwidth and related carrier lifetime are naturally finite [3], which makes the RSOAs’ response to a given optical data input depend on the binary content of preceding data, or pattern-dependent. This fact, combined with RSOAs’ inherently strong gain saturation [4] incurred by the bidirectional operating mode, compromises RSOAs’ attractive features and limits the incoming signals’ intensity, temporal and spectral characteristics that can be handled by these modules. A feasible and efficient way to address this problem involves suitably acting on the spectral components of the optically amplified data signal by means of optical filtering [5]. Recently, we experimentally showed that this specific method can be employed for improving the pattern-dependent performance of an RSOA driven by non-return-to-zero (NRZ) data, which, compared to other formats, are easier to generate and subsequently handle by SOAs [6], using a birefringent fiber loop (BFL) [7]. Because the BFL design, implementation and function are simple, straightforward and versatile, respectively, it may be favored over other alternatives, which are more sophisticated to build, operate and control [8]. In this paper, we extend the aforementioned work by theoretically exploring and quantifying the extent of the BFL capability to allow for the optical modulation by NRZ data of an RSOA with acceptable performance against the overshoot despite the pattern-dependence of the latter. For this purpose, we exploit a reduced model [9] that allows us to derive the RSOA response to an optical excitation from the solution of a single standard differential equation in the time domain, which greatly reduces the computational complexity. By validating the simulation results with an experiment, we subsequently specify the RSOA driving and the BFL tuning conditions that together enable the RSOA to operate at higher speeds than that permitted by its nominal optical modulation bandwidth. The outcomes of this work not only complement the experimental ones but also justify the BFL choice as an optical notch filter for assisting the use of RSOAs as optical amplification elements in target applications.
The novelty and impact of the work presented in this paper is supported by the following points that distinguish it from other works of similar nature:
(a)
The basic metric employed to quantify the performance of the BFL-assisted RSOA, i.e., the overshoot ( O V S ), has not been adopted or investigated for this purpose before, at least to the best of our knowledge. In fact, the O V S has not been considered either for RSOA optical modulation or for investigating the possibility of improving the performance of RSOA using BFL filtering. However, this metric is critical for properly characterizing the behavior of active devices [10], such as the RSOA, both alone and with the aid of the BFL. This means that other experimental and theoretical studies that have exploited optical filtering technologies to compensate for the pattern effects in semiconductor optical amplifiers and their modified versions may be incomplete, as they have not fully captured the severity of the single (R)SOA performance degradation, on one hand, and the extent of performance improvement enabled by frequency-discrimination-based optical equalization, on the other hand.
(b)
The suitability of the reduced model employed to describe the operation of the optically modulated RSOA has been tested either for electrical modulation [11], which from a physical perspective is a totally different function of the RSOA than that considered in our work, or for a train of consecutive input pulses [9], which is a much more relaxed condition for driving the RSOA than ours. In fact, after a couple of repetitive pulses, the RSOA is brought into an equilibrium that prevents pattern effects from manifesting, whilst when subject to pulses of alternating binary content, the RSOA response is not uniform, which provokes the pattern effects.
Therefore, our work fills the gap in knowledge that follows from (a) and (b) by completing the optically modulated RSOA performance evaluation through considering and examining the O V S , which is done after validating the model that is employed for this purpose. Both issues remained open in the literature, so addressing them in this work contributes to advancing the relevant field and constitutes a point of reference for other works in the future, which may be undertaken given the increasingly important role of RSOAs in modern photonic applications.

2. Setup and Modeling

2.1. Setup

Figure 1 shows the block diagram of the RSOA followed by the BFL. The RSOA receives NRZ data pulses in optical form, which are introduced into the RSOA from its rightmost, front facet and travel along the RSOA active region until they reach its leftmost, rear edge, where they are reflected and return back to the RSOA entrance. Normally, the RSOA should raise the pulses’ amplitude level while preserving their initial shape so that the output sequence is an amplified replica of the input one. However, when the RSOA is driven by intense pulses deep into the saturated region of operation, then the amplified pulses’ profile is not uniform. The reason is that the pulse leading edge encounters an elevated carrier density and hence experiences a higher gain and amplification. In contrast, the pulse trailing edge encounters a reduced carrier density after the latter has been depleted by the pulse front end and hence experiences a lower gain and amplification [12]. Because the speed at which the RSOA gain dynamics are varied is finite, an O V S , or spike above the pulse high level, manifests at the pulse leading edge [13]. This effect is perceptible at the beginning of consecutive pulses whose binary content corresponds to the “ON” digital encoding state, i.e., for “marks” [14]. Additionally, when the pulse width, or repetition period in the case of the NRZ format, is shorter than the RSOA carrier lifetime, which holds especially as data rates get higher, the magnitude of this transient behavior differs between pulses [15]. Nevertheless, the pattern-dependent overshoot and the resultant amplified pulse deformation can be combated by suitably acting on the spectral components which accompany this effect, due to self-phase modulation (SPM). In fact, SPM induces spectral components which are shifted to longer wavelengths, i.e., red-shifted, to an extent that is analogous to the overshoot magnitude [16]. Thus, by using after the RSOA an optical filter to act on these red-shifted components inversely as strong as their broadening, the overshoot sharpness as well as the overshoot variations can be suppressed, with positive impact on the amplified pulse shape. The BFL is such a filter whose comb-like response exhibits alternating maxima (peaks) or minima (notches) separated by the free spectral range ( F S R ) and located along a cosinusoidal envelope. The first characteristic allows us to tailor the BFL response so that the data carrier lies near, but to the right-hand side of the BFL transparent wavelength, while the red-shifted components are pushed to fall near the notches. The second one allows us to alleviate the uneven overshoot without impairing the data carrier. In this manner, the RSOA performance can be enhanced provided that the BFL is properly designed with regard to its F S R and detuning, which is done in the following Section.

2.2. Modeling

2.2.1. RSOA Input

The power of the signal inserted in the RSOA is formulated so that it suitably describes the corresponding experimental RSOA driving condition [7]. To this aim, it is expressed as
P i n ( t ) = P C W P m + k = 1 N A k P p ( t k T p e r )
where A k is the kth equiprobable bit “1” or “0” of period T p e r , which is the inverse of the date rate, inside a NRZ pseudorandom binary sequence (PRBS) of length N = 2 7 1 and mean power P C W , which drives and keeps the RSOA into a given saturation level. The RSOA is optically modulated around P C W by an optical signal whose peak power is P m . This means that the total power variation maximum is P m a x = P C W + P m , which defines the pulse “high” level, or the peak power of encoded “1”s, P 1 , while the minimum is P m i n = P C W P m , which defines the pulse “low” level, or the peak power of encoded “0”s, P 0 . Since the pulses average power is defined as P a v g = ( P 1 + P 0 ) / 2 , which reduces to P 1 / 2 when “0” bits are assumed to carry no optical power, as is the practical case [7], while by principle of operation P C W P a v g , therefore P 1 = 2 P C W .
The pulse shape is rectangular-like of finite rise time t r , which occupies a small portion of the pulse repetition period [7], as described by
P p ( t ) = 2 P m 1 exp ( t 2 / t r 2 ) 0 t < T p e r 2 P m exp ( t T p e r ) 2 / t r 2 ) t > T p e r

2.2.2. RSOA Response

The power of the amplified signal that exits the RSOA is expressed as
P R S O A ( t ) = | E R S O A ( t ) | 2
where the corresponding electric field, E R S O A ( t ) , which is normalized so that it represents power, is given by [9]
E R S O A ( t ) = P i n ( t 2 L R S O A n g / c ) exp 1 j α L E F h t 2 L R S O A n g / c
where α L E F is the RSOA linewidth enhancement factor, n g is the group refractive index of the semiconductor material and h ( t ) is the RSOA gain response integrated over its length, L R S O A . Note that the shift in time by twice the RSOA one-way transit time, L R S O A n g / c , where c is the speed of light in vacuum, appears in the arguments of P i n ( t ) and h ( t ) because the signal inserted in the RSOA takes a double pass inside it.
h ( t ) satisfies the following one-dimensional ordinary differential equation, which is derived after assuming RSOA has negligible internal losses and perfect reflectivity [9]:
d h ( t ) d t = h ( t ) Γ a N o I d c / I o 1 L R S O A T c a r exp 2 h t 1 P s a t T c a r P i n ( t )
where Γ is the RSOA confinement factor, a is the RSOA differential gain, N o is the RSO carrier density at transparency, I d c is the RSOA bias current, I o is the RSOA current required for transparency, T c a r is the RSOA carrier lifetime and P s a t is the RSOA material saturation power. Equation (2) is valid provided that the RSOA round-trip propagation time is smaller than the applied pulse duration [9]. This condition is satisfied for RSOA active region lengths shorter than 1 mm and input signal rates that extend up to 10 Gb/s, which both are the case in this work.

2.2.3. BFL Response

The BFL field transfer function, T B F L ( λ ) , is given by [17]
T B F L ( λ ) = exp [ j Ψ ( λ ) / 2 ] + j sin [ j Ψ ( λ ) / 2 ]
where
Ψ ( λ ) = 2 π B L B F L / λ + Δ λ B L B F L / λ 2
In Equations (6) and (7), B and L B F L are the BFL’s birefringence and polarization maintaining fiber (PMF) total length, respectively, while Δ λ [ 0 , F S R / 2 ] is the BFL detuning, defined as | Δ λ | = λ d a t a λ n o t c h , or the absolute difference between the spectral positions of the data carrier, λ d a t a , and the nearest notch, λ n o t c h ( F S R / 2 ) .

2.2.4. RSOA-BFL Output

The power of the signal that is produced at the end of the RSOA and BFL serial interconnection is obtained by convolving the RSOA output from (4) with the BFL response from (6). For this purpose, it is necessary to transfer (4) in the spectral domain, where (6) lies due to the BFL filtering operation, and then convert the outcome back in the time domain. This can be done by taking the Fourier transform and its inverse, respectively, as follows:
E B F L ( t ) = F 1 { F E R S O A ( t ) T B F L ( λ ) }
where E B F L ( t ) is the electric field of the signal at the BFL output, while operators F{.} and F 1 {.} denote the fast Fourier transform (FFT) and inverse FFT, respectively, which are both available and executed in MATLAB software. Finally the power of the amplified signal at the BFL exit is
P B F L ( t ) = | E B F L ( t ) | 2

2.2.5. Numerical Solution

The calculation of the power of the signals at the RSOA and BFL outputs given by (3) and (9), respectively, requires the knowledge of the RSOA output electric field from (4). This in turn can be found by numerically solving (5) using Euler’s method, which involves splitting the pulse from (1) and (2) into a sufficient number (200) of small temporal segments (1 ps) and applying the initial condition h ( t = 0 ) = Γ a N o [ ( I d c / I o ) 1 ] L R S O A , with P C W as a free parameter. Knowing E R S O A ( t ) together with T B F L ( λ ) from (6) and (7), with Δ λ as a free parameter, then allows us to find E B F L ( t ) from (8). This process was conducted for the data signal, RSOA and BFL default parameters values listed in Table 1, which are consistent with the related experiment [7], as well as the RSOA device static characterization [18] and modeling [19]. The simulation results were obtained for a data rate of 5 Gb/s, as in the relevant experiment [7], unless otherwise mentioned, (for example when the impact of the data rate on the performance of the scheme was investigated).
In Table 1, T c a r and P s a t are excluded from the given references since their numerical values were not known in advance. Instead, finding their values required the proper fitting of simulations to experimental results, as detailed in the following.
More specifically, T c a r is directly associated to the RSOA 3 dB optical modulation bandwidth [1], f R S O A , which can be derived from the analytic expression of the RSOA response in the frequency domain:
T R S O A ( f ) = G C W 1 + 2 ln ( G o / G C W ) G C W 1 j 2 π f T c a r 1 + G C W 2 ln ( G o / G C W ) G C W 1 j 2 π f T c a r
where G C W and G o are the RSOA CW gain and unsaturated gain, respectively.
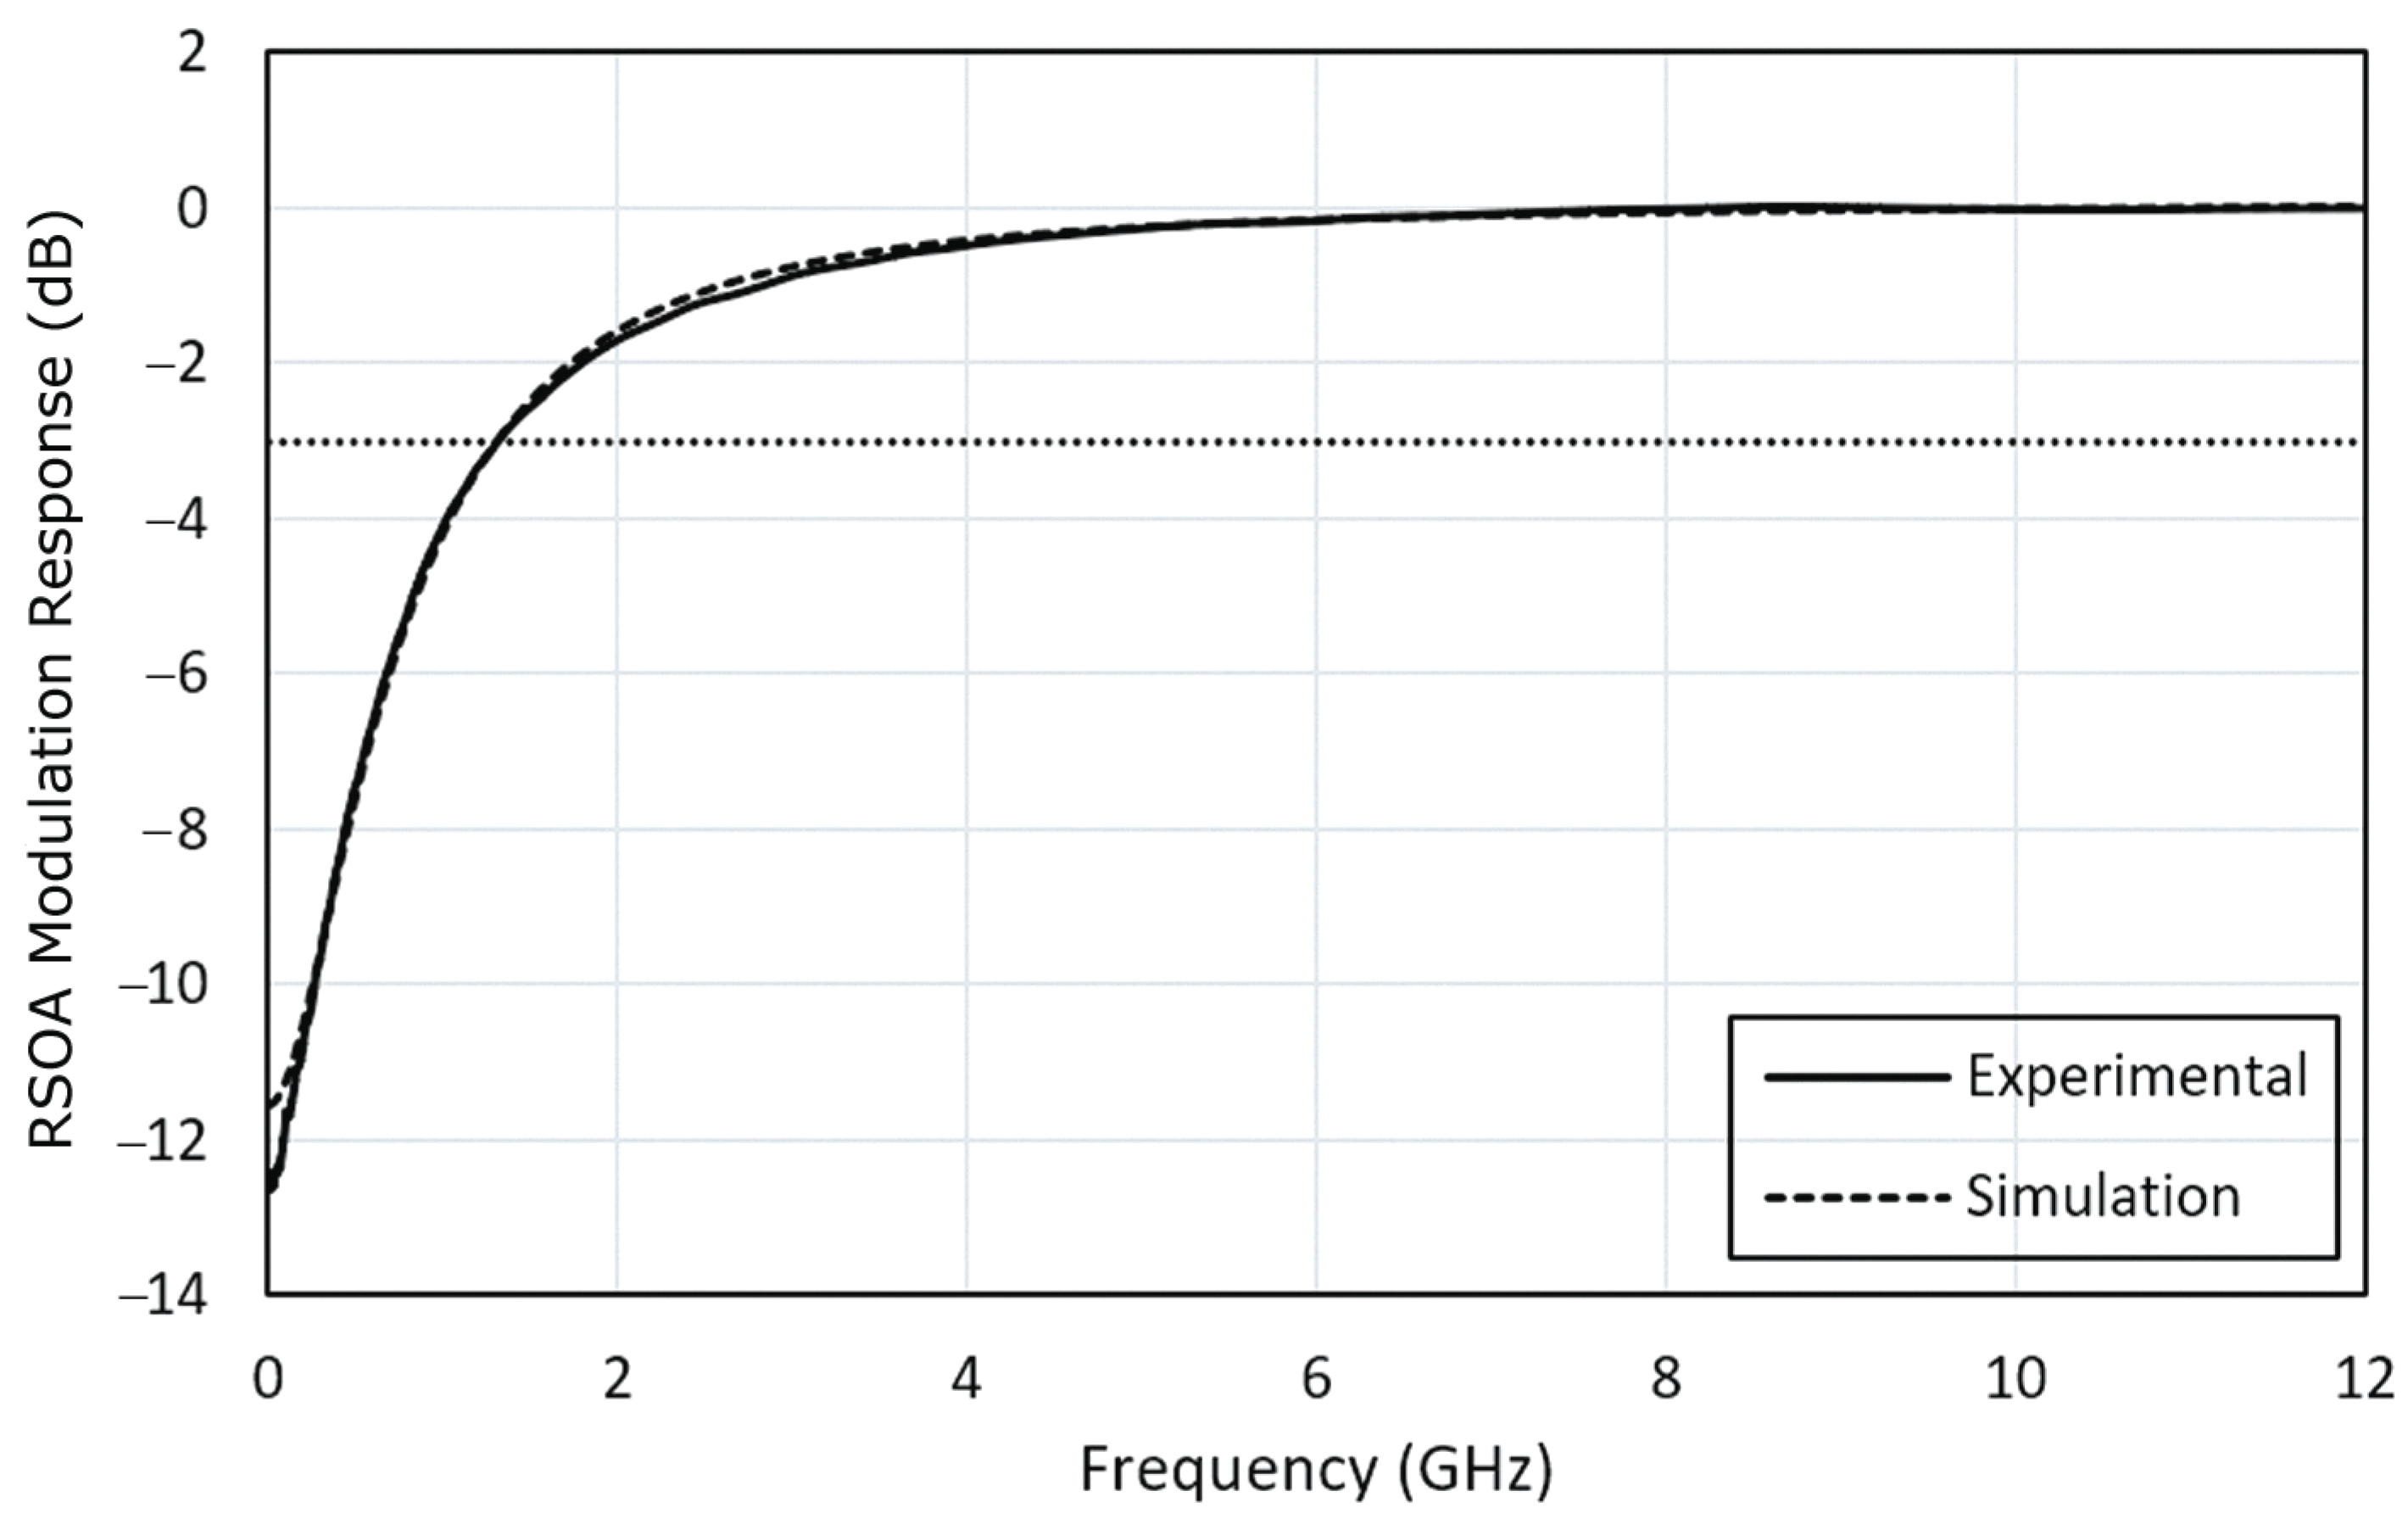
Equation (10) was derived after applying on (5) a small-signal analysis as in [20], and it was similar to that reported in [21] for conventional SOAs except for the multiplication factor “2” in the middle term of both nominator and denominator. This is consistent with the finding [11] that the response of a perfectly reflective RSOA modeled by (5) is that of a single-pass SOA with double length, halved saturation power and identical gain coefficient. The squared modulus of (10), | T R S O A ( f ) | 2 , is plotted in Figure 2 for the same RSOA gain dynamics as in the experiment in [7], i.e., for P C W = 5 dBm and I d c = 70 mA. From this figure, we observe that the theoretical and measured curves coincide and correspond to a highpass filter response characteristic with f R S O A = 1.32 GHz if the RSOA carrier lifetime is adjusted to T c a r = 248.9 ps, which is a value representative of real RSOA devices.
P s a t , on the other hand, was extracted by considering the overshoot of the amplified pulses. This metric is defined as [10]
O V S ( % ) = ( P s p i k e P h i g h ) / P h i g h × 100 %
where P s p i k e denotes the peak power of the spike over the high level of peak power P h i g h of the amplified pulse, as shown in Figure 3. Thus, we scanned P s a t seeking for the calculated O V S values to agree with the experimental ones, and we found that this happened when the RSOA saturation power was numerically tuned to P s a t 17 dBm. The value of P s a t obtained in this way was compliant with that of state-of-art RSOA technology [22,23] and hence was employed in the simulations.

3. Model Validation

The model formulated in the previous section was thoroughly validated by a comparison to an extensive set of experimental results available from [7]. The reason for doing this is that this specific model had not been tested for RSOA optical modulation by a pseudorandom sequence of NRZ data. This means that it was not known in advance whether the model would produce meaningful results, and thus a validation procedure was necessary in order to check and verify this. Moreover, the model was not employed individually, but in combination with that of the BFL. Thus, transferring the RSOA response, which was obtained from running the model, to the frequency domain and correlating it with that of the BFL was not a trivial task. In other words, this did not guarantee a priori that when returning into the time domain the simulation results would match the experimental ones, unless the former were compared to the latter.
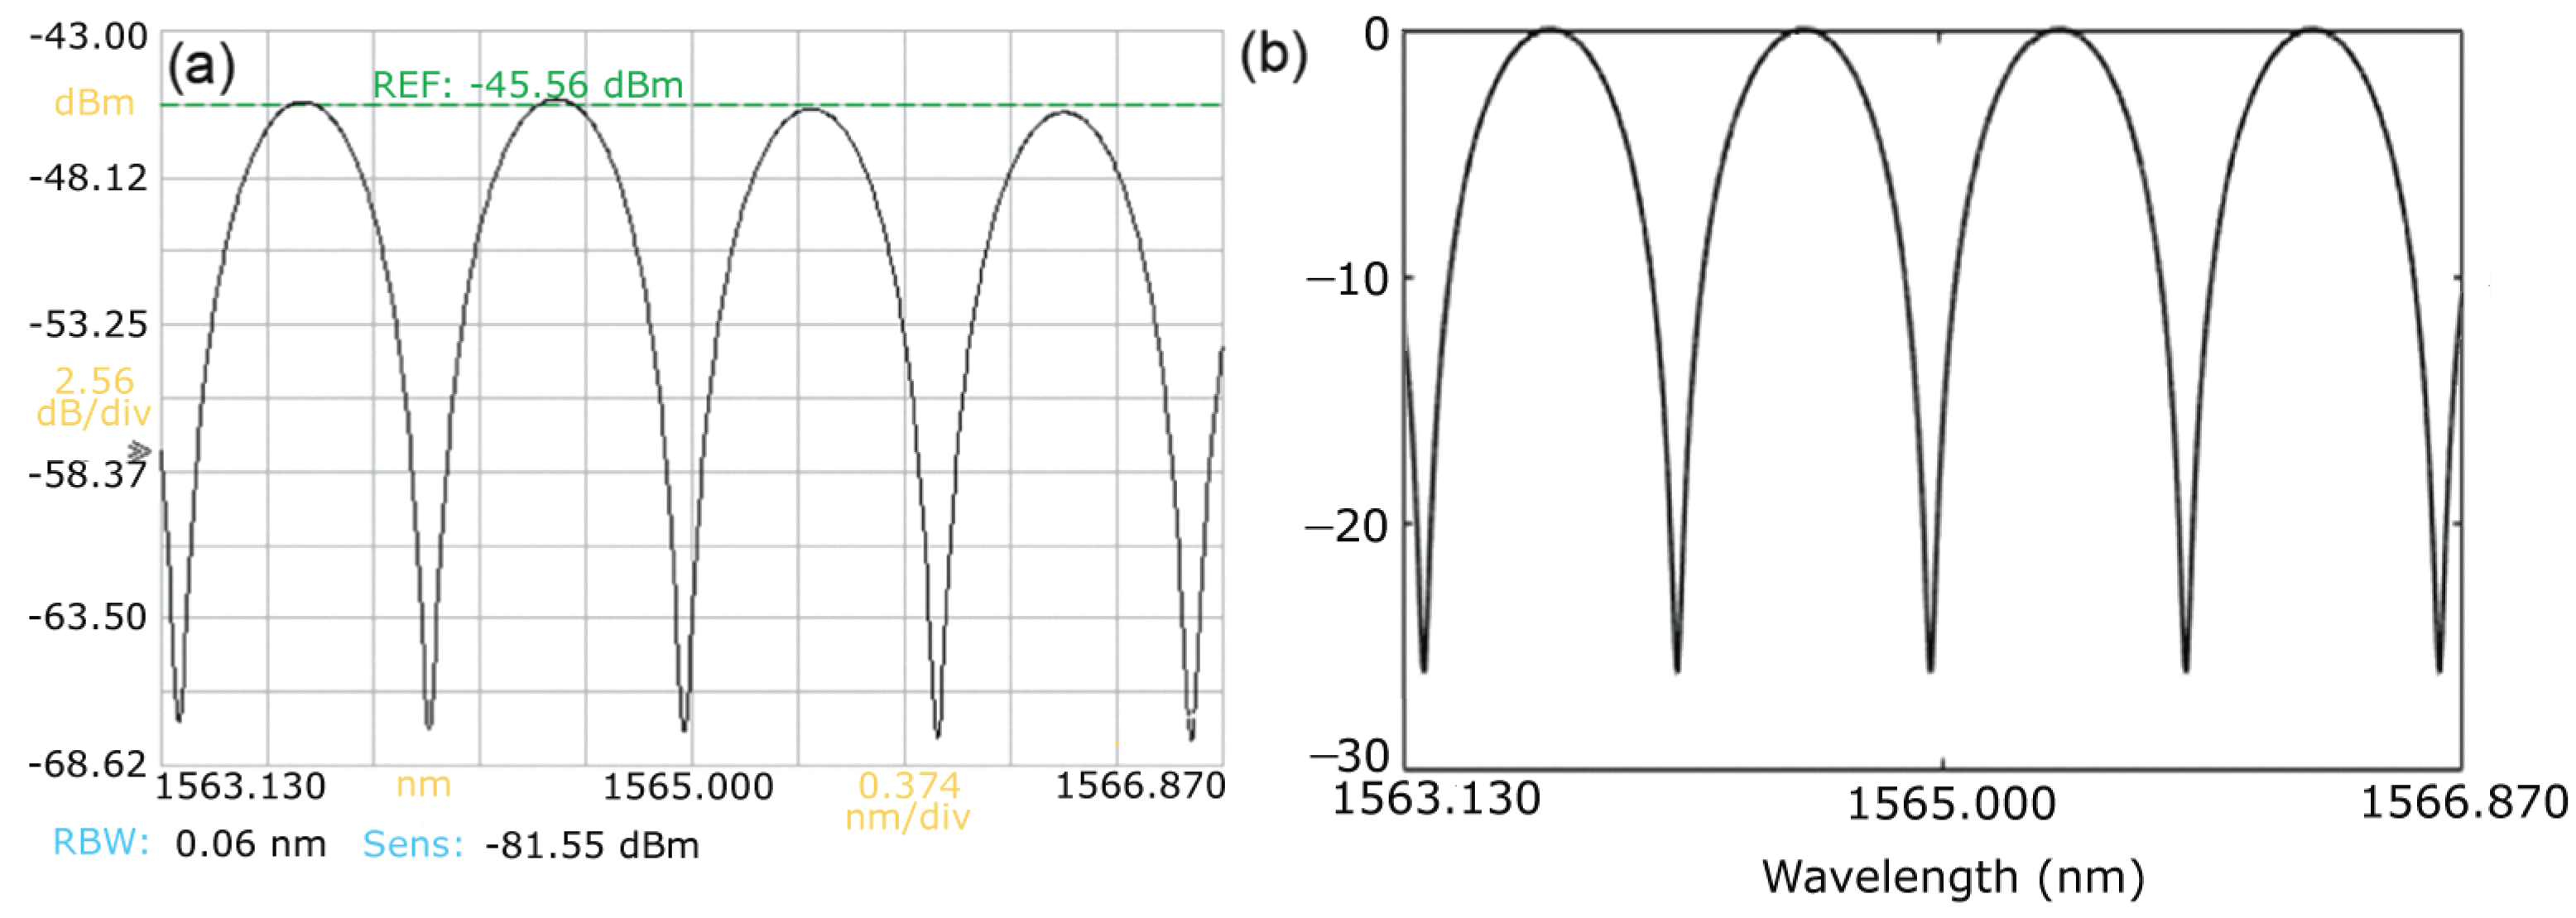
The first step was to ensure that the BFL transfer function simulated using Equations (6) and (7) exhibited the same characteristics as the measured one. Figure 4 confirms that the BFL theoretical response is identical to the experimental one. In fact, both curves have the same comb-like form, consist of consecutive maxima (peaks) having the same wavelength distance, or F S R = 0.87 nm, minima (notches) situated halfway at F S R / 2 and an amplitude difference between peaks and notches, or a peak-to-notch contrast ratio (PNCR), over 20 dB.
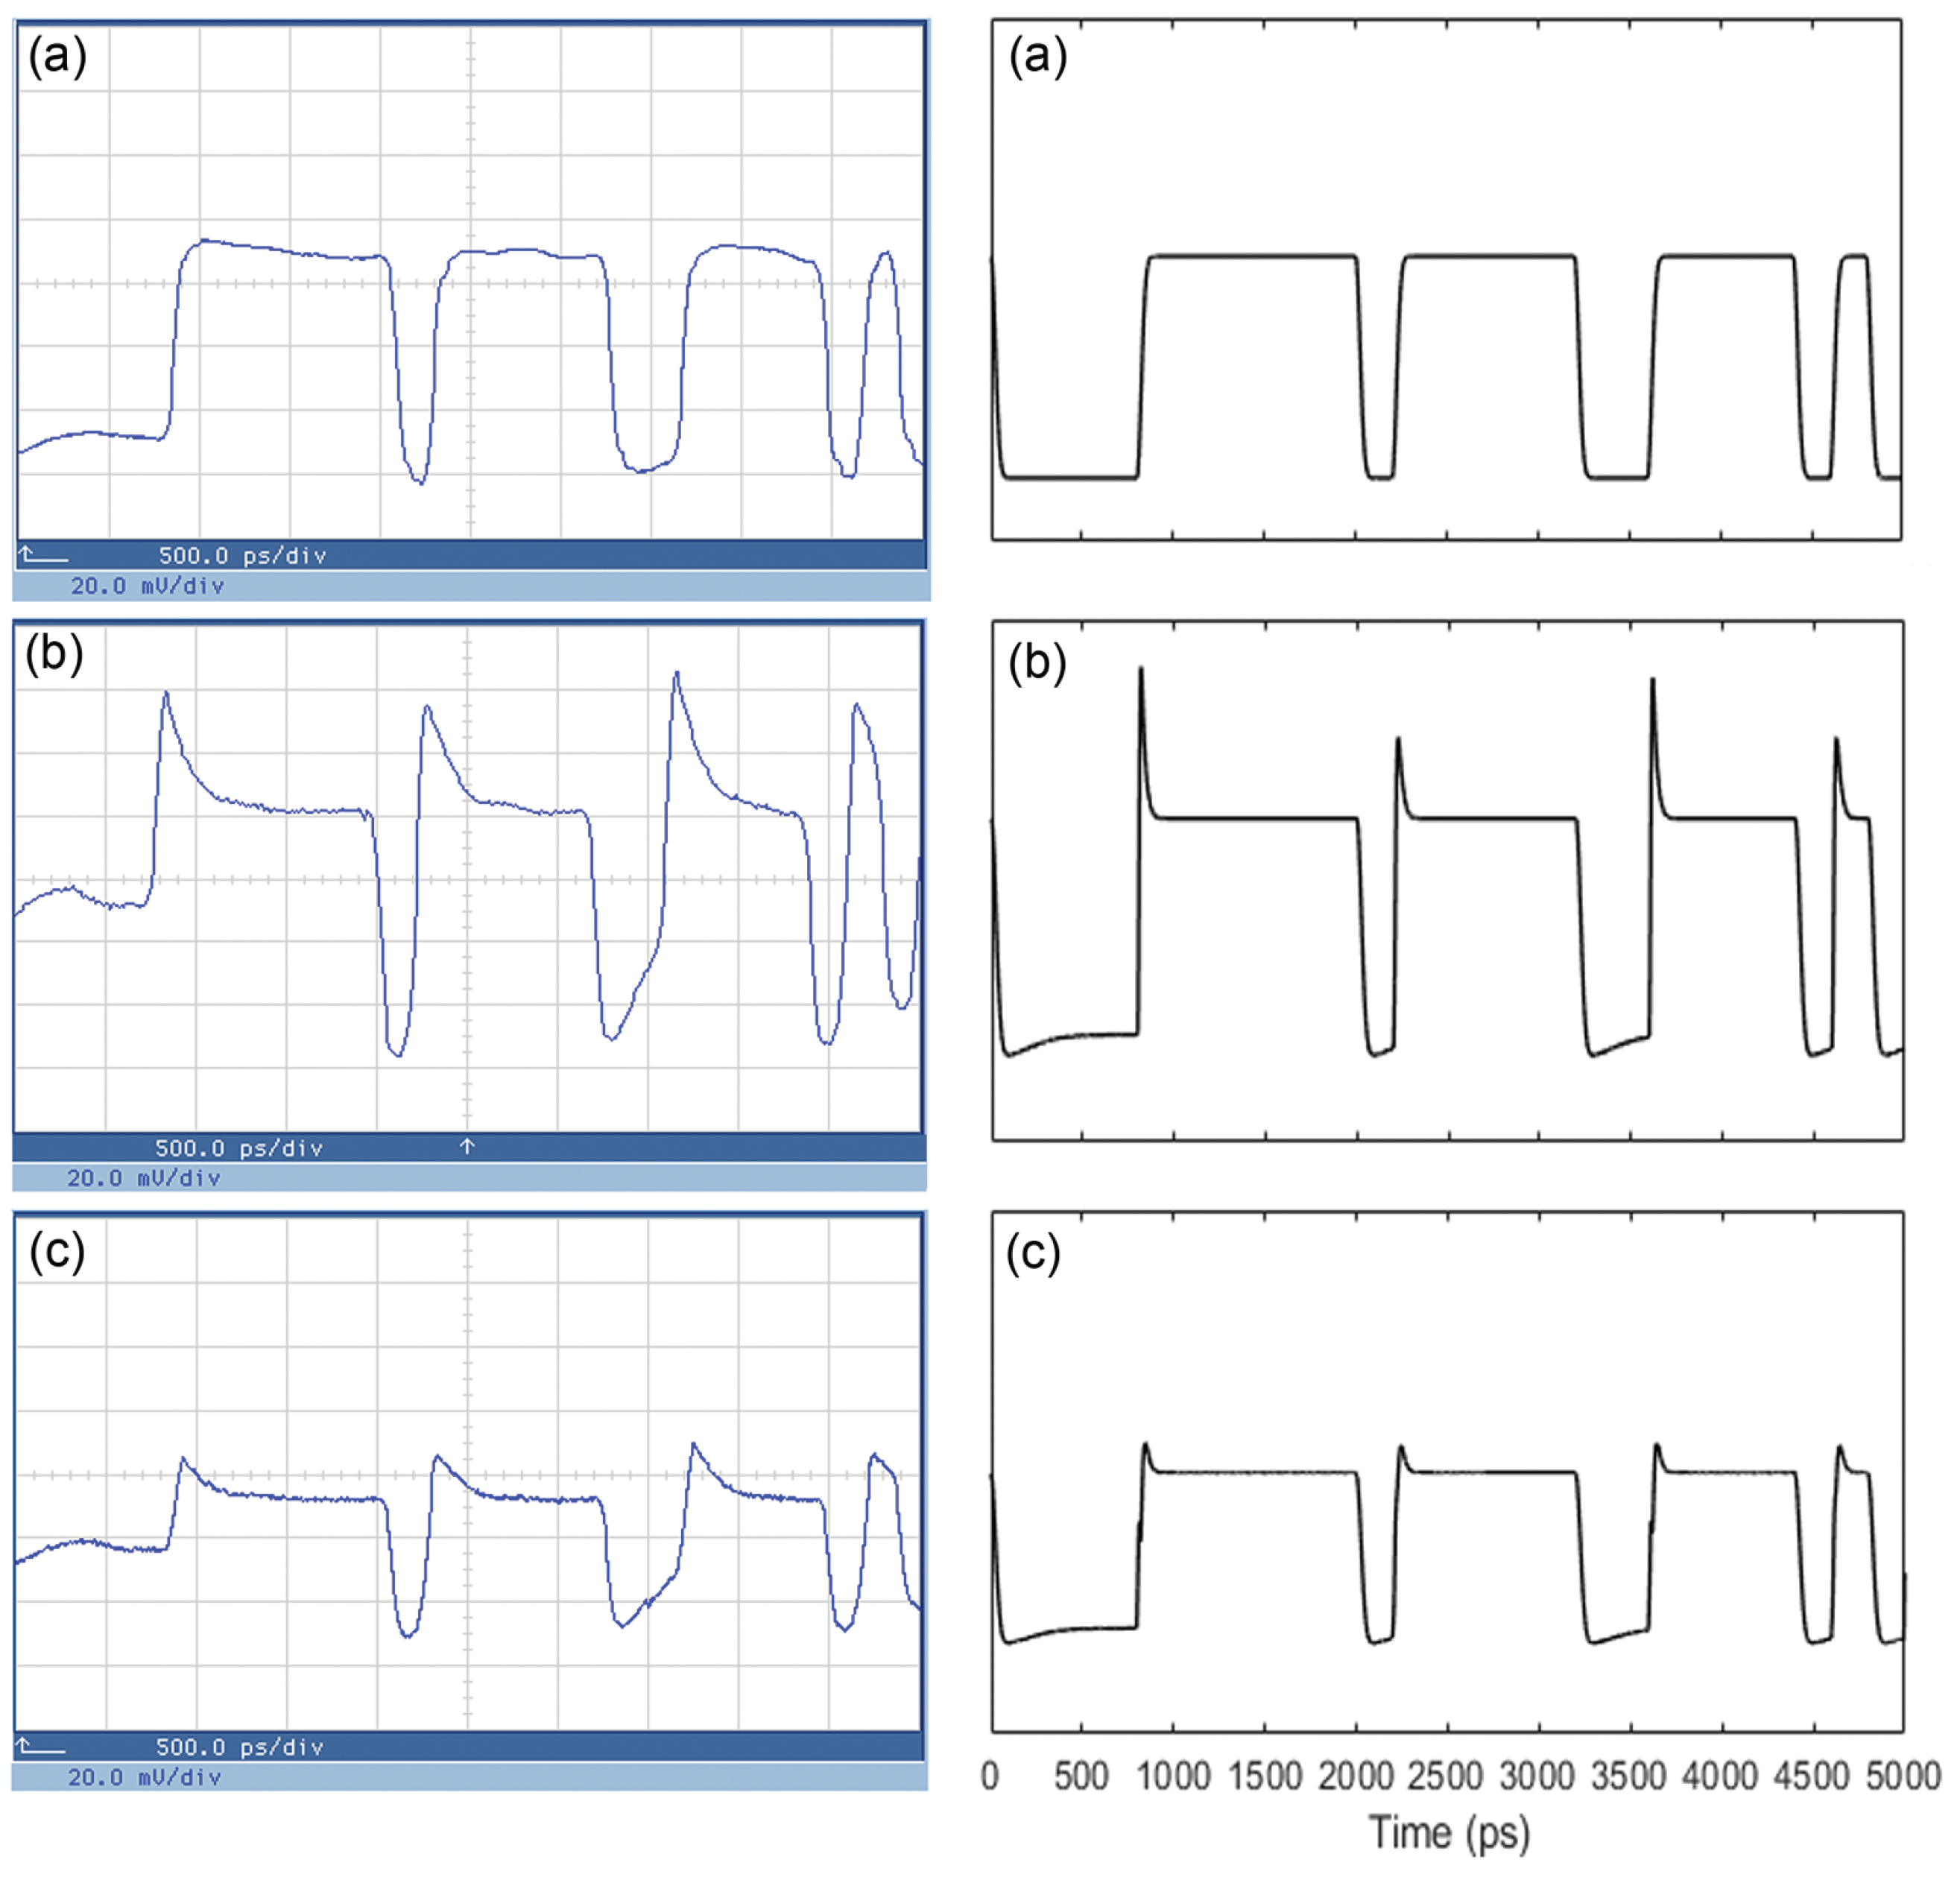
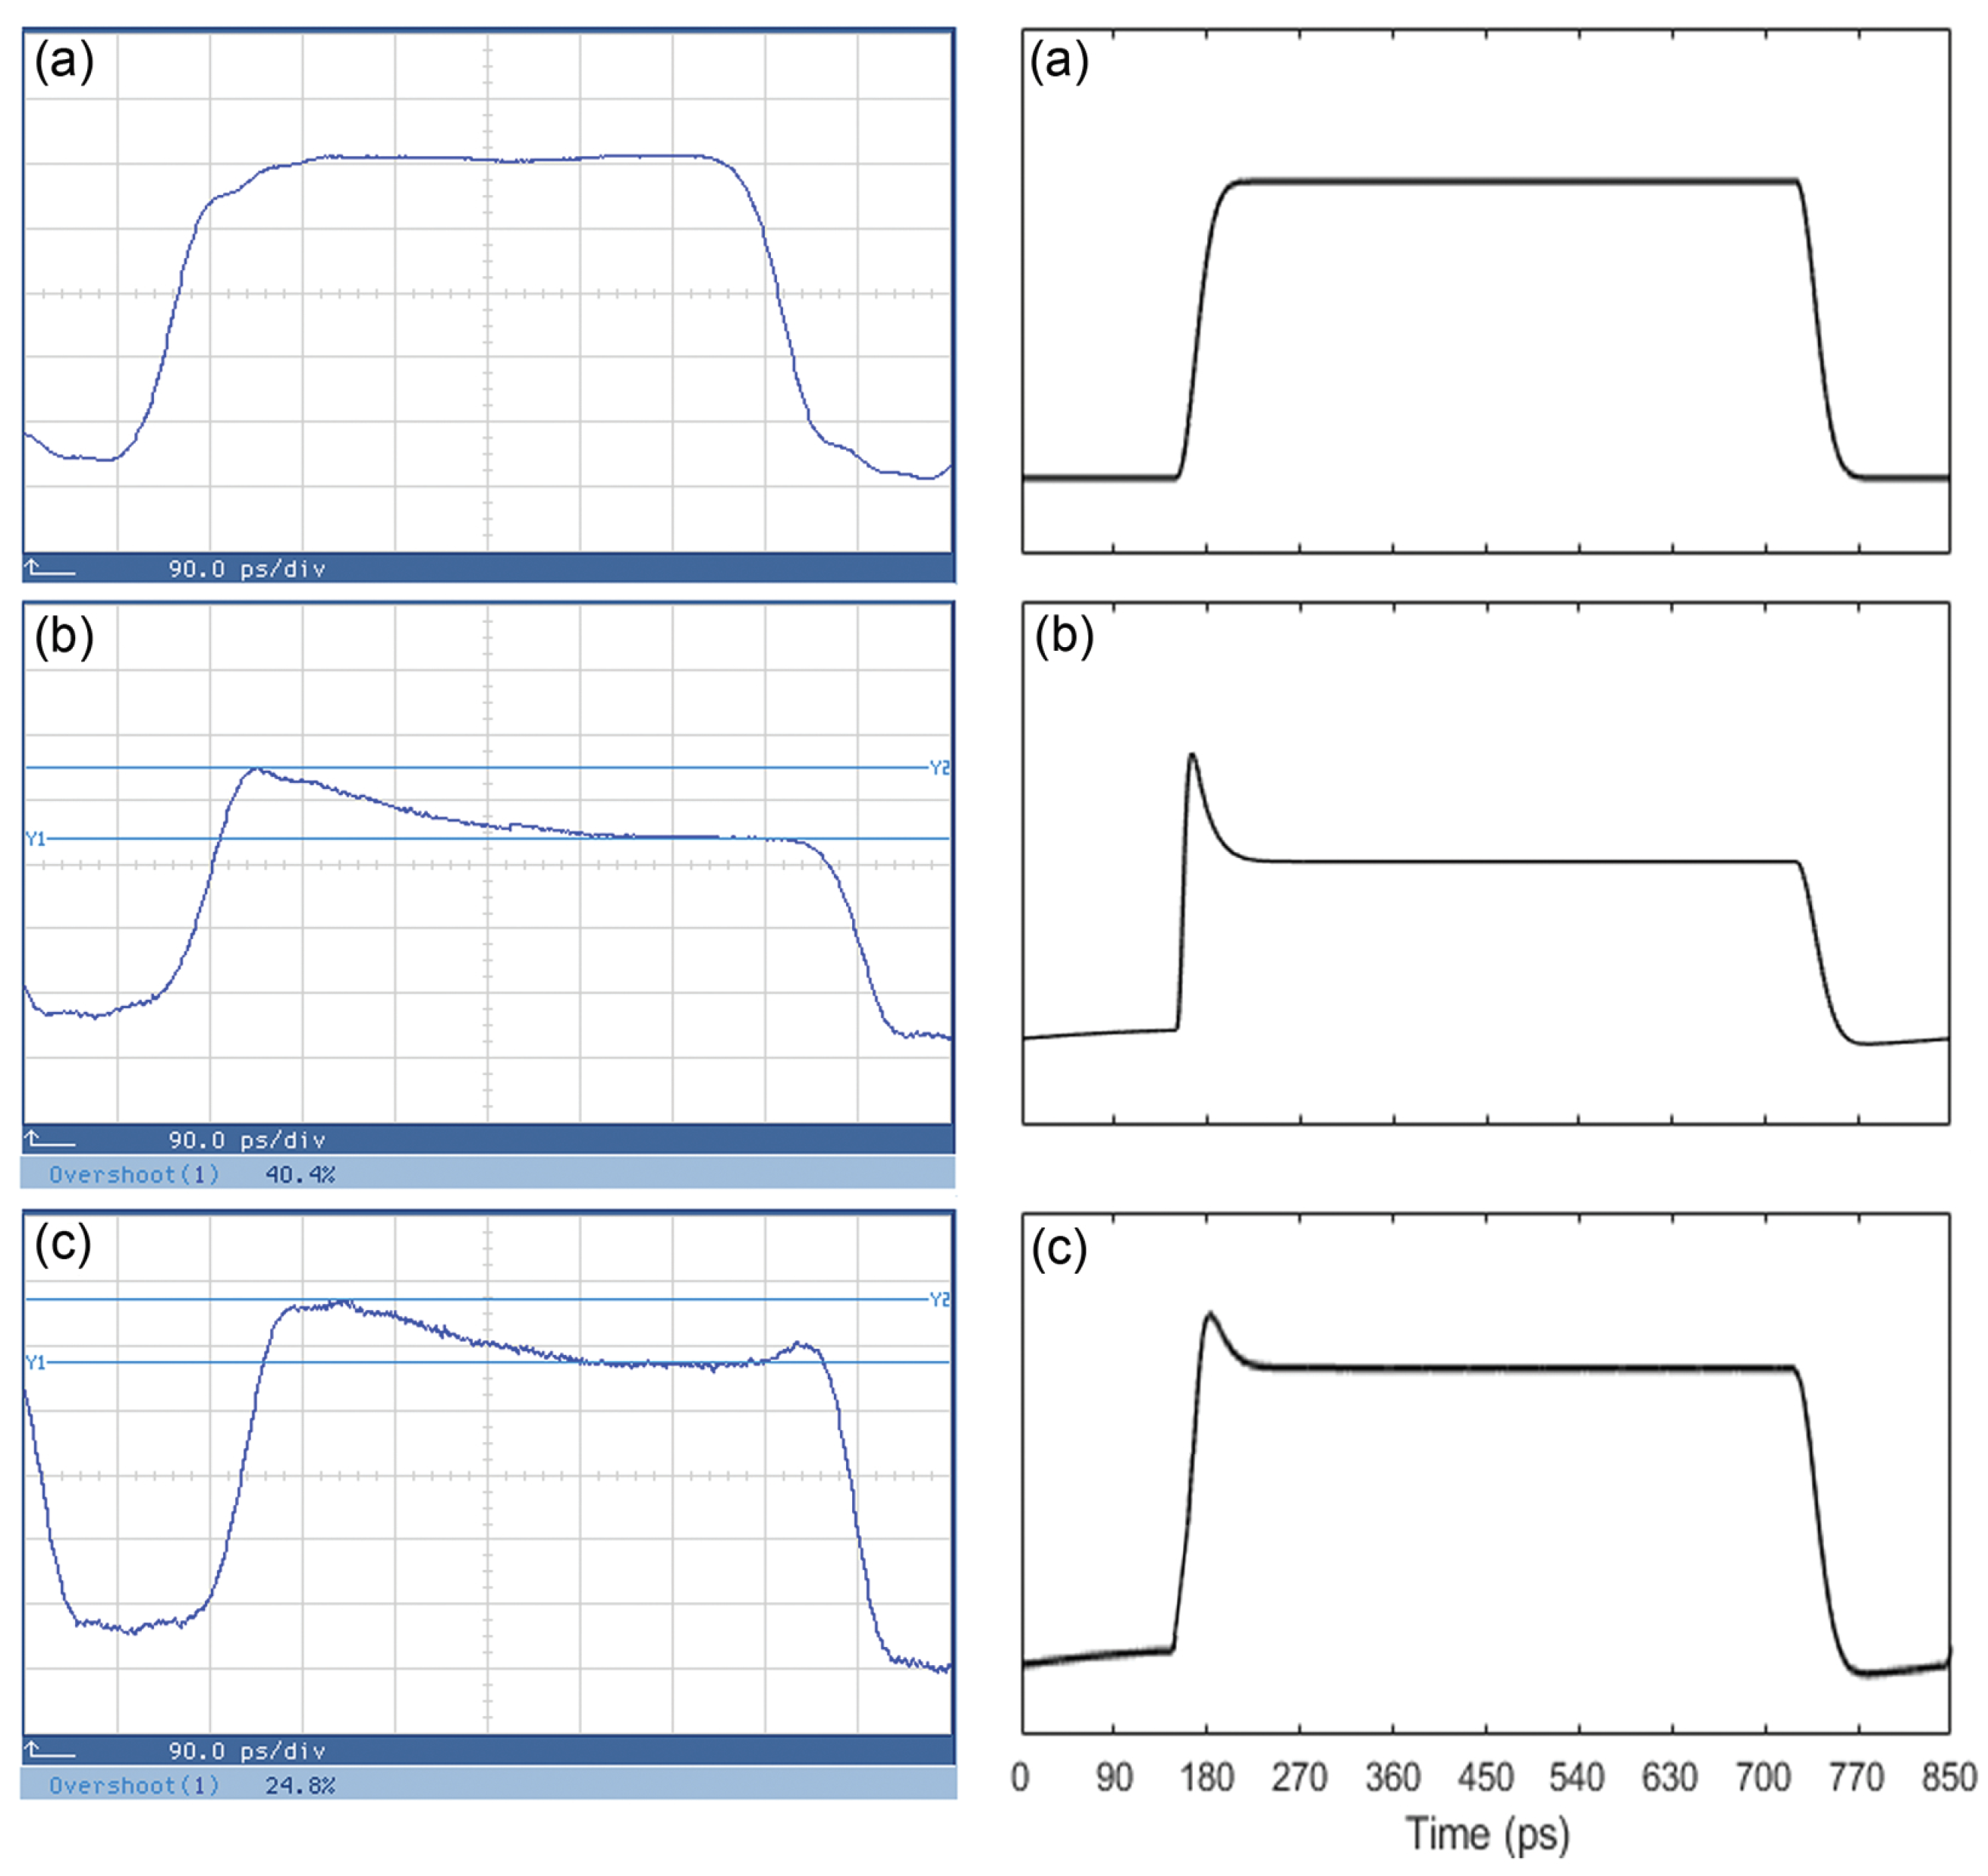
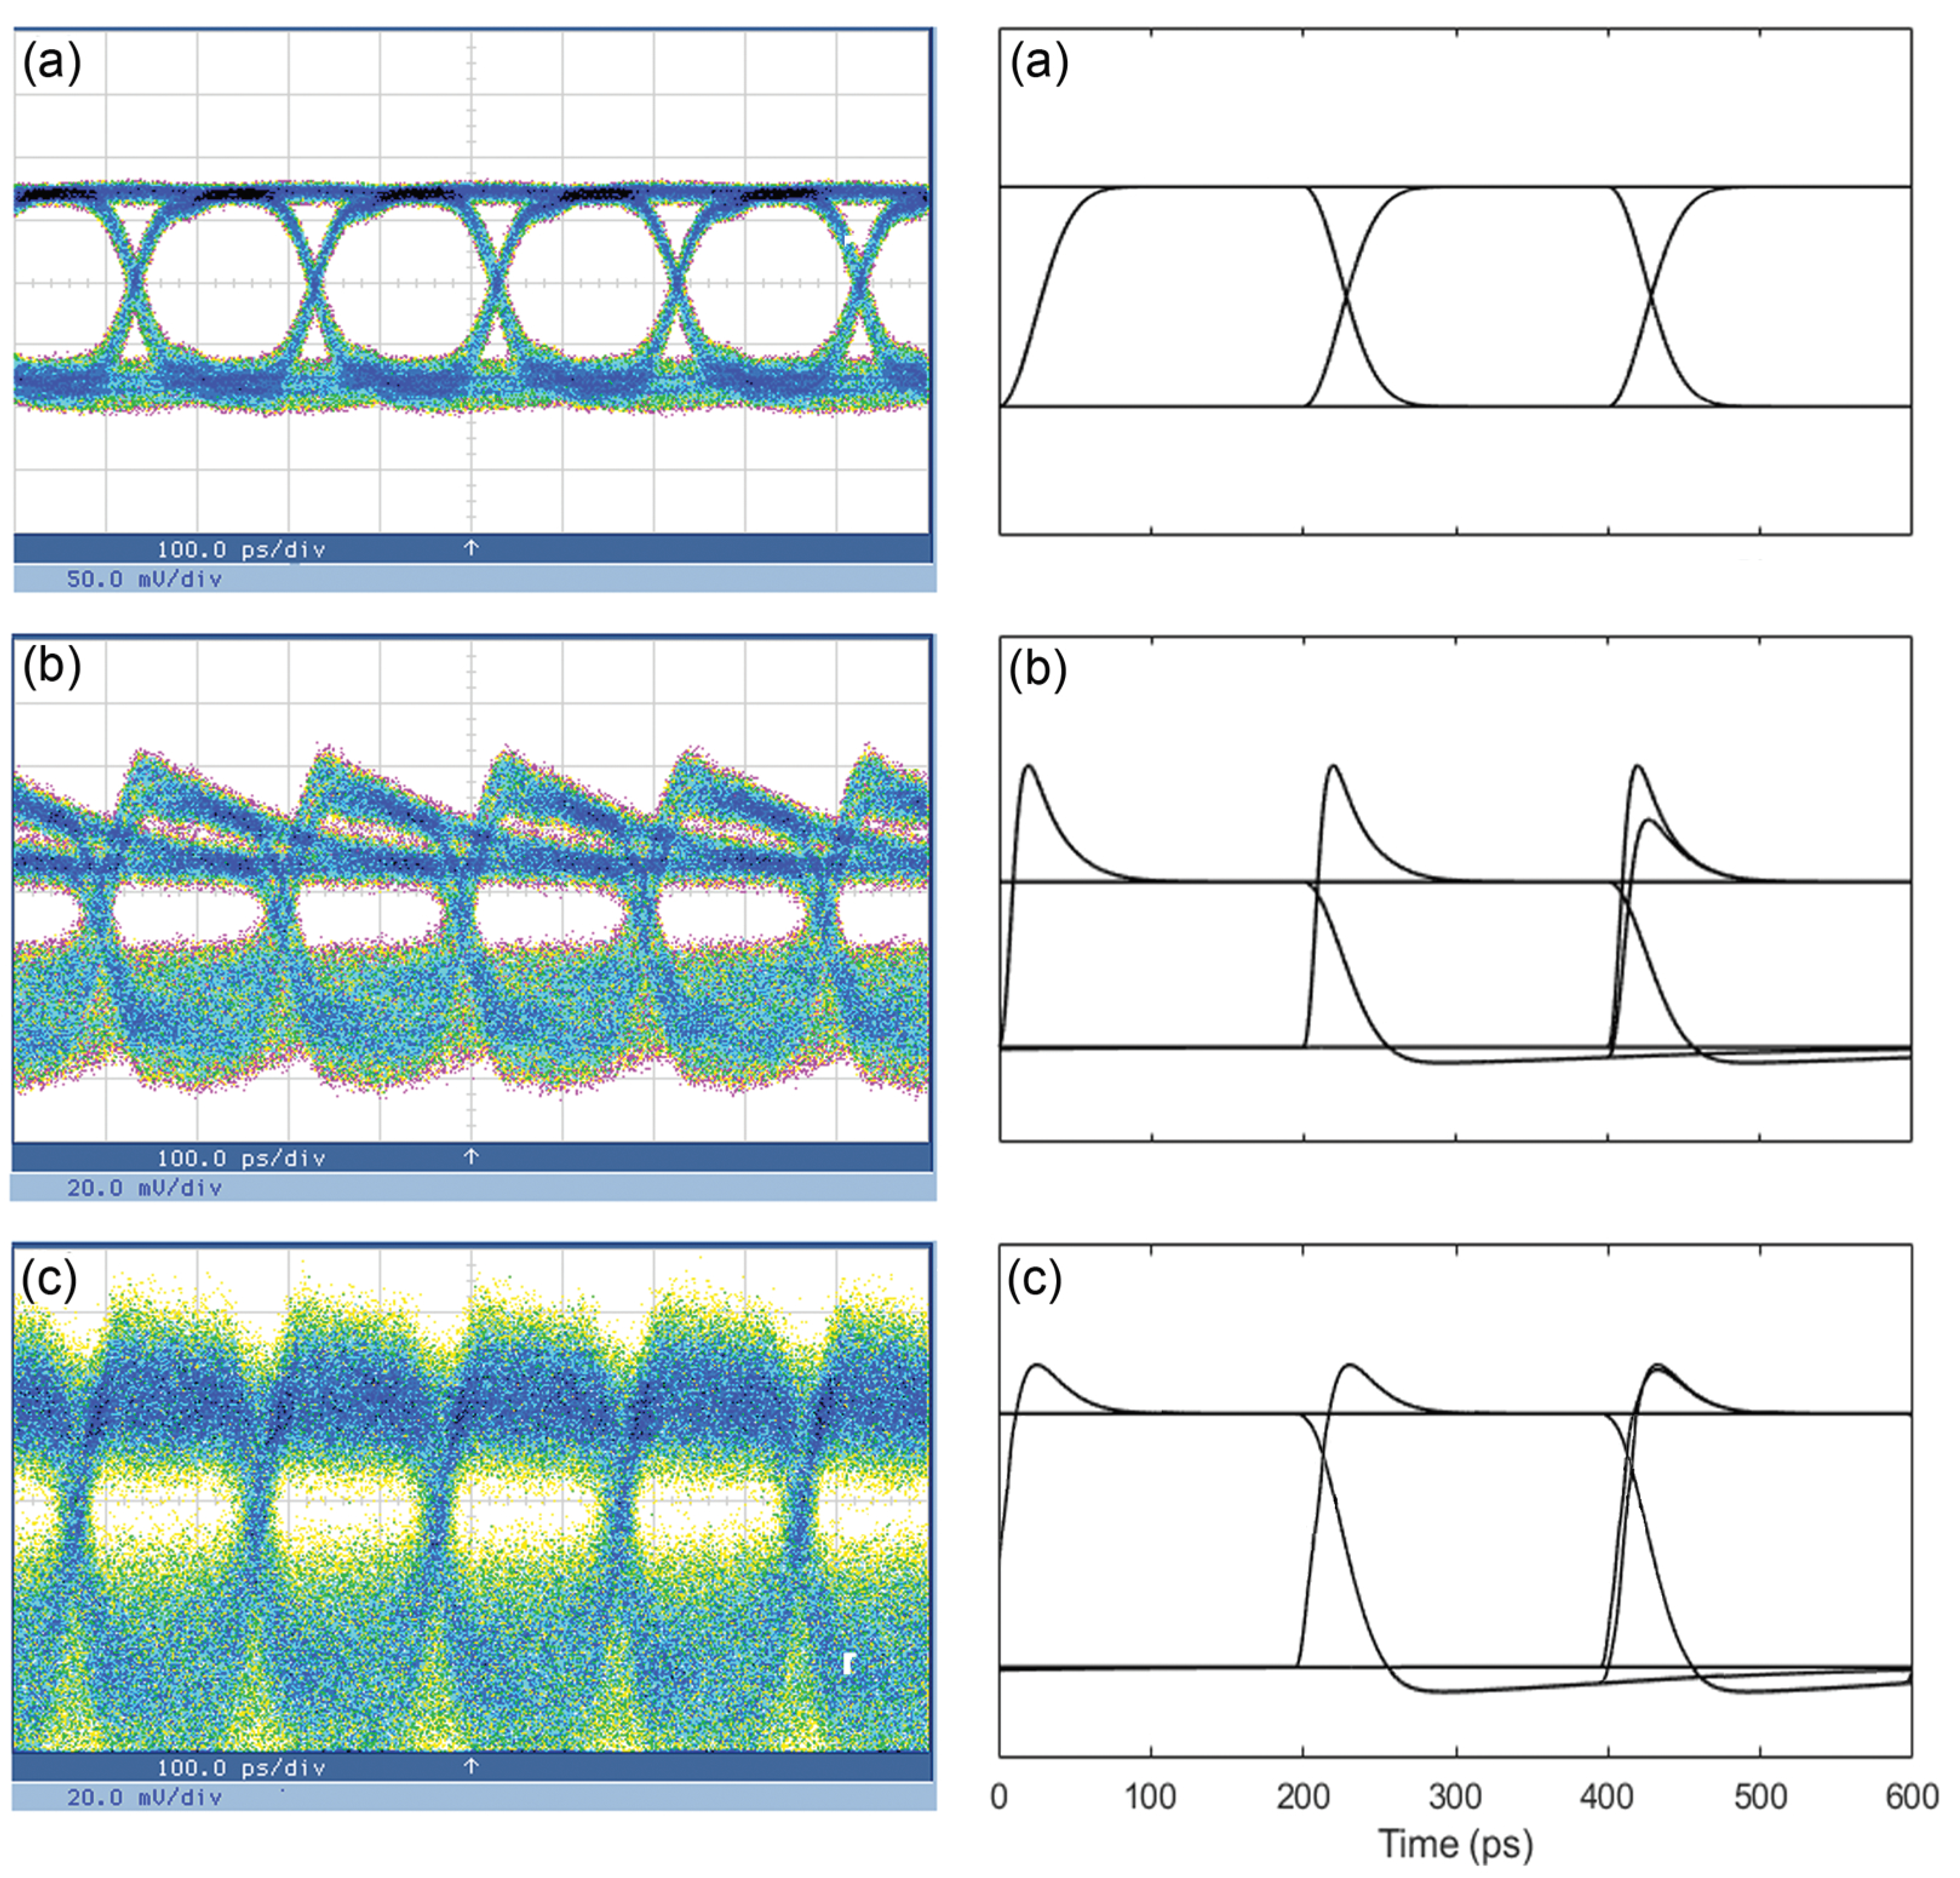
Next, we proceeded by checking to what extent the model results matched the experimental ones obtained in the time domain and predicted with high accuracy the O V S employed as the main performance metric. For this purpose, we inserted into the model the same values of the involved parameters, which have been compiled in Table 1. Then, Figure 5 shows that there is an excellent agreement between the simulated and real data waveforms. In fact, the model captures the strong distortion on the front edge of high-level encoded pulses at the RSOA output, as well as the noticeable alleviation of this impairment by the BFL. Figure 6 shows that the model also reproduces with high fidelity the profile of consecutive such pulses. Furthermore, the model quantifies correctly the corresponding O V S and its trend. Specifically, the model quantifies the O V S at the RSOA and BFL outputs to be 47% and 21%, respectively. Both values are in excellent line with the measured ones that were found to be over 40% and below 25%, respectively, [7]. Moreover, Figure 7 shows that the model generates pseudo-eye diagrams (PEDs) [24] that closely resemble the experimental ones and exhibit similar characteristics, i.e., the pronounced asymmetry and closure of the (pseudo-)eye at the RSOA output is canceled by the BFL so that the (pseudo-)eye acquires a form and an opening similar to that before the RSOA. Finally, we reset the CW power to −7 dBm and ran the model focusing on a string of high-level pulses. Figure 8 shows that the profile of the simulated waveform at the output of the RSOA when the latter is not saturated is identical to that at the BFL output when the RSOA is saturated. Since that specific approach was followed during the experiment to specify the RSOA input power dynamic range (IPDR), i.e., the extent of the powers which drive the RSOA in the linear amplification regime without pattern-dependent degradation of its operation [25], this means that the employed model predicts the specific metric well. Overall, the model confirms the experimentally drawn conclusions that using the BFL considerably improves the amplified pulses profile that was severely distorted by the saturated RSOA and reduces the overshoot below rendering it acceptable. Therefore, we can feel both quantitatively and qualitatively confident that the model is valid and suitable for further exploring the performance of the BFL-assisted RSOA amplification scheme, which is done in the following section.

4. Performance Investigation

After the model validation by experiment, a concise study and analysis was conducted to investigate and assess the impact of key RSOA and BFL parameters on the O V S .
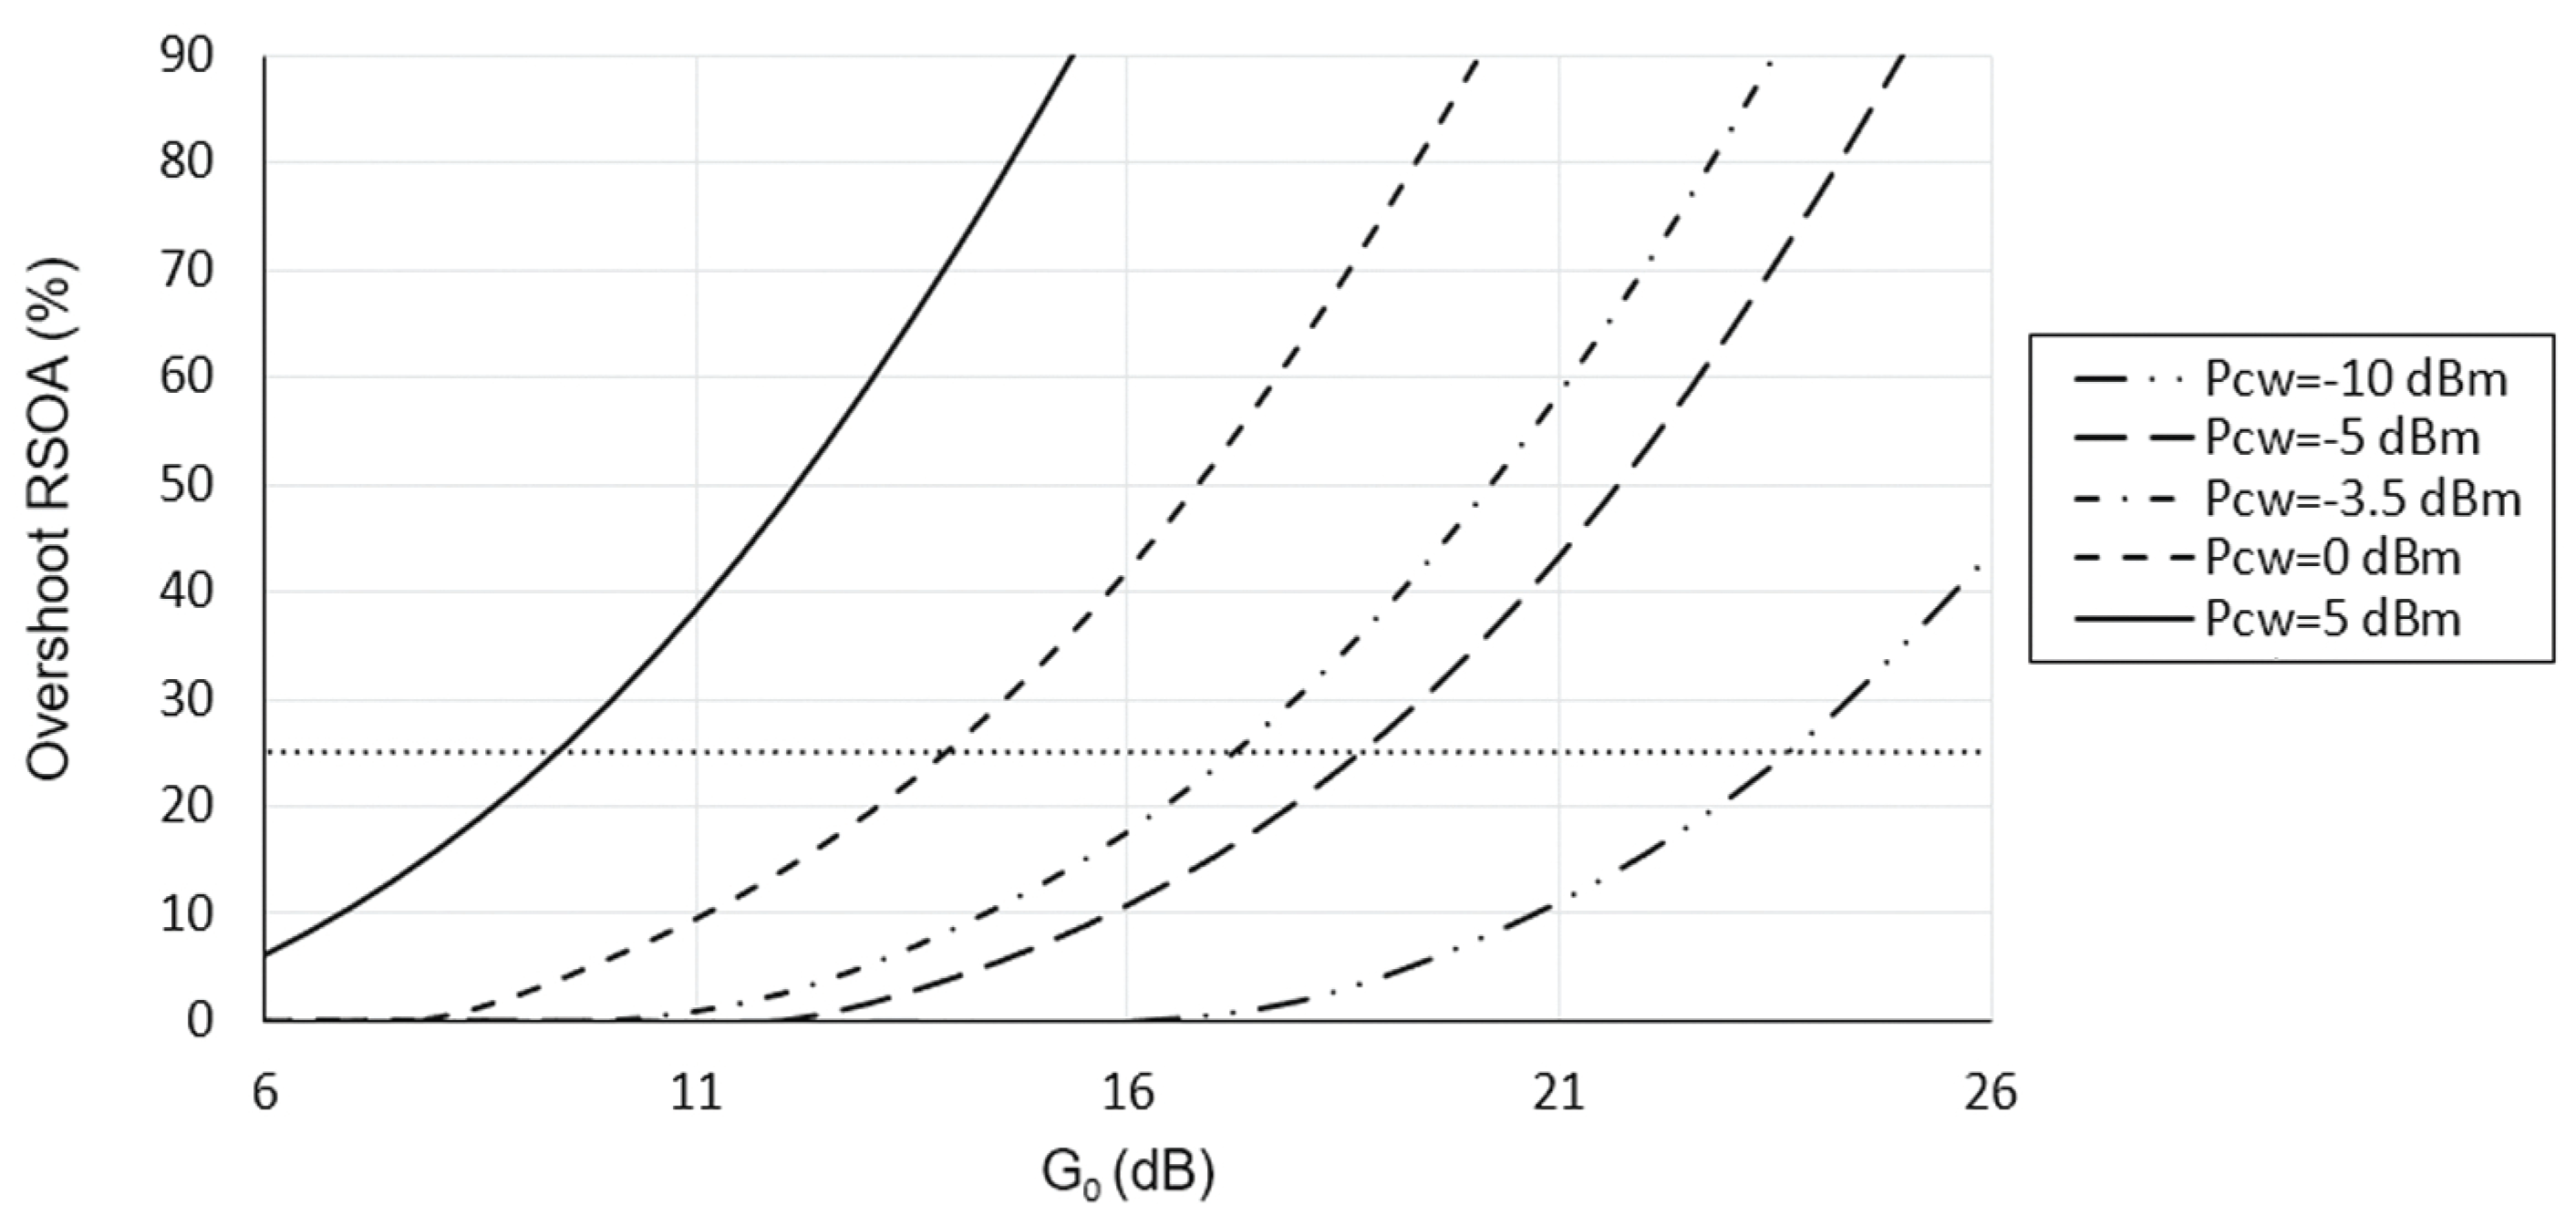
Figure 9 shows the O V S variation against the RSOA small signal gain for different CW input power. It can be seen that when one of these parameters is increased while the other is kept fixed, and vice versa, the O V S is drastically raised and exceeds by far its permissible limit of 25% [10]. In both cases this happens because such change of either parameter provokes a stronger RSOA saturation. In fact, the RSOA input saturation power, P i n , s a t , and the RSOA unsaturated (small signal) gain, G o are related through [19 P i n , s a t = [ 2 ln 2 / ( G o 2 ) ] P s a t . This implies that increasing G o results in reducing P i n , s a t , or that the RSOA can be brought into saturation for smaller CW input powers, and hence suffers from more intense pattern effects, which is translated into a worst and eventually unacceptable O V S . Inversely, the smaller the CW power and hence the weaker the RSOA saturation, the wider the range of small signal variation that allows for the O V S at the RSOA output to be acceptable. Since the nominal small signal gain determines the net gain available for compensation of transmission or frequency discrimination losses, while the input power determines the saturation region over which the RSOA can support pattern-free direct signal amplification [25], there is an inevitable trade-off between these two parameters. This requirement is translated into a small signal gain margin up to 23.6 dB, 18.8 dB, 17.3 dB, 13.9 dB and 9.4 dB for CW power of −10 dBm, −5 dBm, −3.5 dBm, 0 dBm and 5 dBm, respectively. The optimum pair of G o and P C W that can satisfy all these requirements is ( G o , P C W ) = (23.6 dB, −10 dBm), which results in an adequate net gain of 9.61 dB.
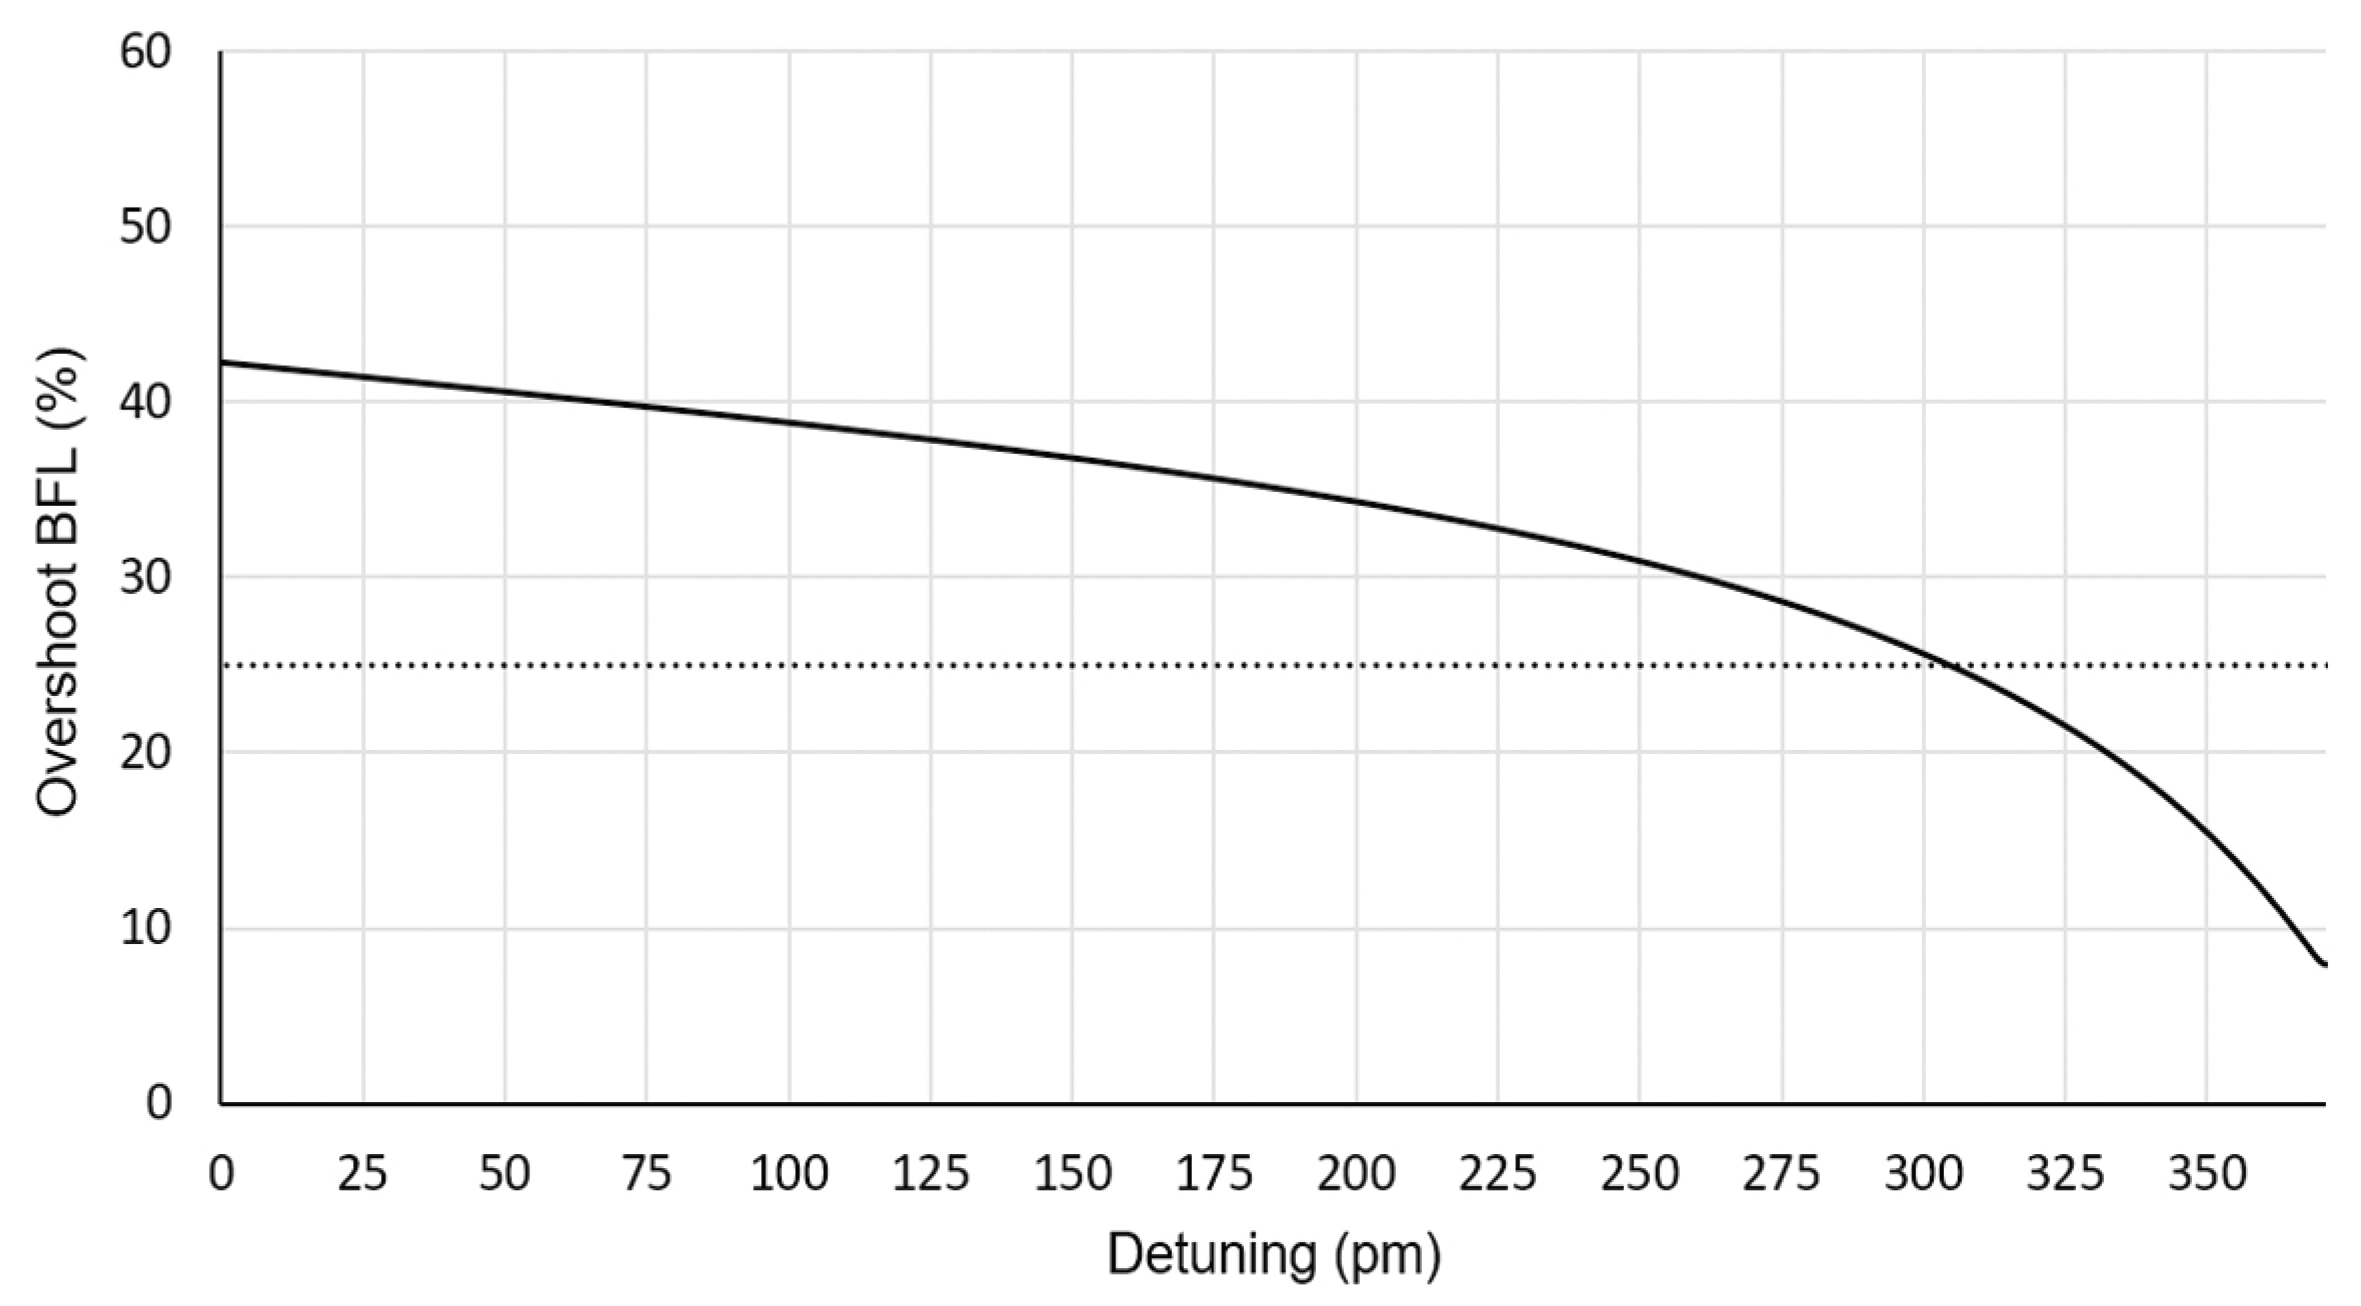
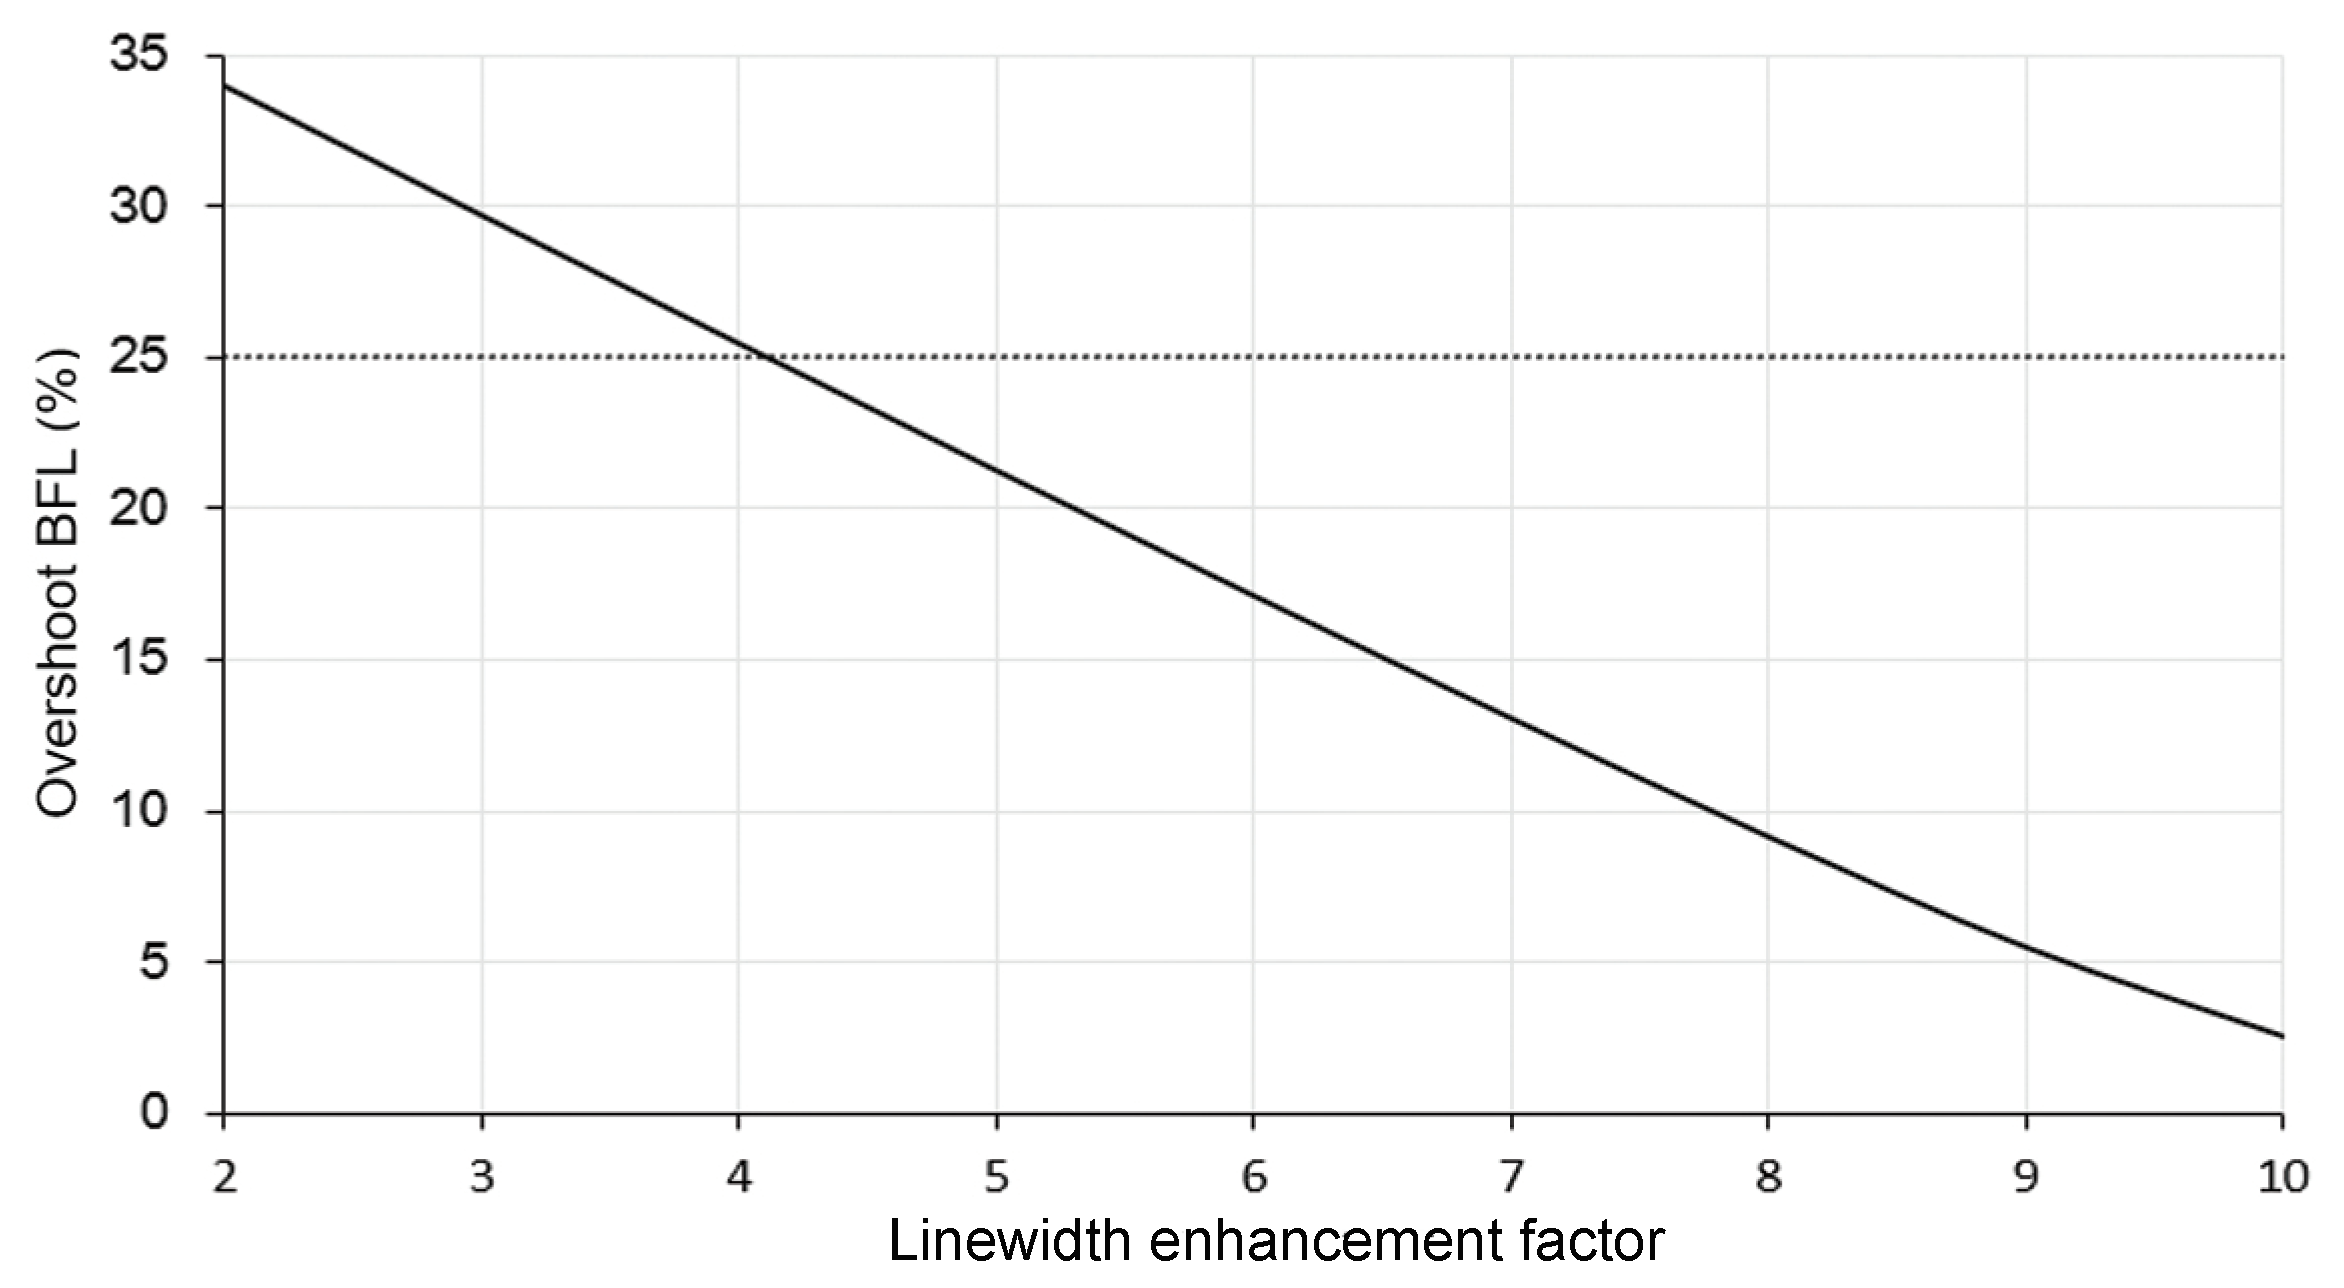
Figure 10 shows the O V S variation against the BFL detuning. In the absence of detuning, i.e., Δ λ = 0 pm, the O V S is worst, as expected. However, as the detuning is progressively increased and the red-shifted components of the amplified signal are pushed to fall closer to the notch located at F S R / 2 , the O V S is improved until it becomes acceptable, i.e., smaller than 25%, for Δ λ > 300 pm. The O V S is clamped for a detuning around 370 pm. This value is less than 10% away from the experimental one [7], when the latter is specified with reference to the nearest notch position. The deviation is attributed to the nonideal conditions under which the BFL was operated during the experiment [7], but shows once again the model’s potential in making meaningful and precise predictions. Note that the optimum detuning depends on the chirp level of the signal exiting the RSOA. In fact, the slope of the detuned BFL transforms the distortions associated to the irregular variations of the transient chirp into amplitude changes that counteract those at the RSOA exit. This chirp falls at the amplified pulse leading edge, and the peak amplitude of this negative chirp can be as high as some tens of GHz [9]), which can be tailored by the BFL for combating the pattern effect and increasing the optical modulation bandwidth of the RSOA. The BFL action is more efficient the higher the chirp, which in turn scales with the RSOA linewidth enhancement factor. This physical dependence is reflected on Figure 11, which depicts the O V S variation against different values of this RSOA parameter. From this figure it can be seen that as the alpha factor is increased and hence the RSOA produces more chirp, the O V S is improved, or equivalently the performance of the BFL-assisted RSOA is ameliorated. This result provides helpful information for the design of the whole scheme, since it suggests that the BFL can enhance more conveniently the optical modulation capability of RSOAs having a larger linewidth enhancement factor.
Finally, Figure 12 shows the effect on the O V S of the data rate when the latter is increased starting from 5 Gb/s. Clearly, the O V S at the RSOA output is inordinately high and farther from being acceptable. This happens because the corresponding modulation bandwidth, which for NRZ pulses equals half the repetition rate [26], is always larger than the 3 dB cut-off frequency of the RSOA response. Nevertheless, the use of the BFL renders the O V S borderline acceptable up to 8 Gb/s. This corresponds to an increase of the RSOA optical modulation capability by at least three times that being possible by its nominal optical modulation bandwidth. Note that the curves presented in Figure 12 exhibit a small slope, which may give the misleading impression that the O V S is rather insensitive to the data rate increase. However, this happens because, by definition (Equation (11)), the O V S is not an absolute but a relative quantity calculated against the high level of the peak power, P h i g h , of the amplified pulse. Thus, as the data rate is increased, or equivalently the pulse period, T p e r , is decreased, P h i g h should increase in order for the output pulse energy, E o u t , to be preserved, since the latter satisfies E o u t = P a v e , o u t T p e r = 2 P h i g h T p e r . This means that even if the power of the spike, P s p i k e , is increased with the acceleration of the data rate due to the more pronounced accompanying pattern effects, so does P h i g h , and hence the change of the O V S is such that its corresponding slope is small. This is even more noticeable for the case of the BFL, whose action suppresses both P s p i k e and P h i g h . Nevertheless, the form of the curves is such that it allows us to draw useful conclusions about the performance deterioration of the RSOA alone and its improvement with the contribution of the BFL.

5. Conclusions

In conclusion, we have presented a systematic and concise treatment on the mitigation of the pattern-dependent overshoot in an RSOA configured for direct signal amplification of intensity modulated on–off pulses. By validating that the simulation results mimic the experimental ones well, we have further investigated the RSOA and BFL working conditions that ensure acceptable overshoot at an extended rate of the external optical excitation, despite the RSOA inherently small optical modulation bandwidth. The derived outcomes suggest that the BFL is a viable technological option that can efficiently assist the operation and enhance the performance of RSOAs.

Author Contributions

Conceptualization, N.A. and K.E.Z.; Data curation, N.A. and Z.V.R.; Investigation, K.E.Z. and Z.V.R.; Methodology, K.E.Z.; Project administration, K.E.Z.; Software, N.A.; Supervision, K.E.Z.; Validation, N.A. and Z.V.R.; Writing—original draft, N.A. and K.E.Z.; Writing—review and editing, K.E.Z. and Z.V.R. All authors have read and agreed to the published version of the manuscript.

Funding

This research received no external funding.

Data Availability Statement

Not applicable.

Conflicts of Interest

The authors declare no conflict of interest.

References

  1. Gebrewold, S.A. Reflective Semiconductor Optical Amplifiers (RSOAs) as Colorless Sources in Access Networks. Ph.D. Thesis, ETH Zurich, Zurich, Switzerland, 2016. [Google Scholar]
  2. Prat, J. (Ed.) Next-Generation FTTH Passive Optical Networks; Springer Science + Business Media: Dordrecht, The Netherlands, 2008. [Google Scholar]
  3. Connelly, M.J. Reflective semiconductor optical amplifier pulse propagation model. IEEE Photonics Technol. Lett. 2011, 24, 95–97. [Google Scholar] [CrossRef] [Green Version]
  4. Dúill, S.Ó.; Marazzi, L.; Parolari, P.; Brenot, R.; Koos, C.; Freude, W.; Leuthold, J. Efficient modulation cancellation using reflective SOAs. Opt. Express 2012, 20, B587–B594. [Google Scholar] [CrossRef] [PubMed] [Green Version]
  5. Inoue, K. Optical filtering technique to suppress waveform distortion induced in a gain-saturated semiconductor optical amplifier. Electron. Lett. 1997, 33, 885–886. [Google Scholar] [CrossRef]
  6. Gutiérrez-Castrejón, R.; Fernández-Segura, O.; Torres-Ferrera, P.; Ceballos-Herrera, D.E. Performance analysis of a directly modulated semiconductor optical amplifiers using non-return-to-zero, duobinary and quaternary pulse amplitude modulation signalling. IET Optoelectron. 2021, 15, 8–19. [Google Scholar] [CrossRef]
  7. Zoiros, K.E.; Kastritsis, D.; Rampone, T.; Sharaiha, A. Reflective semiconductor optical amplifier pattern effect compensation with birefringent fiber loop. Opt. Quantum Electron. 2020, 52, 366. [Google Scholar] [CrossRef]
  8. Rizou, Z.; Zoiros, K.; Connelly, M. Semiconductor optical amplifier pattern effect suppression using optical notch filtering. J. Eng. Sci. Technol. Rev. 2016, 9, 198–201. [Google Scholar] [CrossRef]
  9. Antonelli, C.; Mecozzi, A. Reduced model for the nonlinear response of reflective semiconductor optical amplifiers. IEEEPhotonics Technol. Lett. 2013, 25, 2243–2246. [Google Scholar] [CrossRef]
  10. Nielsen, M.L.; Tsuruoka, K.; Kato, T.; Morimoto, T.; Sudo, S.; Okamoto, T.; Mizutani, K.; Sakuma, H.; Sato, K.; Kudo, K. SOA-booster integrated Mach–Zehnder modulator: Investigation of SOA position. J. Light. Technol. 2010, 28, 837–846. [Google Scholar] [CrossRef]
  11. Antonelli, C.; Mecozzi, A.; Hu, Z.; Santagiustina, M. Analytic study of the modulation response of reflective semiconductor optical amplifiers. J. Light. Technol. 2015, 33, 4367–4376. [Google Scholar] [CrossRef]
  12. Patent, E.; van der Tol, J.; Calabretta, N.; Liu, Y. Compensation of the pattern effect in SOAs. In International Workshop on Optical Signal Processing (COST 276 and SCOOP); Citeseer: Copenhagen, Denmark, 2001; Volume 2, pp. 99–101. [Google Scholar]
  13. Wong, C.; Tsang, H. Reduction of bit-pattern dependent errors from a semiconductor optical amplifier using an optical delay interferometer. Opt. Commun. 2004, 232, 245–249. [Google Scholar] [CrossRef]
  14. Inoue, K. Waveform distortion in a gain-saturated semiconductor optical amplifier for NRZ and Manchester formats. IEE Proc.-Optoelectron. 1997, 144, 433–437. [Google Scholar] [CrossRef]
  15. Vujičić, Z.; Dionísio, R.P.; Shahpari, A.; Pavlović, N.B.; Teixeira, A. Efficient dynamic modeling of the reflective semiconductor optical amplifier. IEEE J. Sel. Top. Quantum Electron. 2013, 19, 1–10. [Google Scholar] [CrossRef]
  16. Dong, J.; Zhang, X.; Wang, F.; Hong, W.; Huang, D. Experimental study of SOA-based NRZ-to-PRZ conversion and distortion elimination of amplified NRZ signal using spectral filtering. Opt. Commun. 2008, 281, 5618–5624. [Google Scholar] [CrossRef]
  17. Rizou, Z.V.; Zoiros, K.E.; Hatziefremidis, A.; Connelly, M.J. Performance tolerance analysis of birefringent fiber loop for semiconductor optical amplifier pattern effect suppression. Appl. Phys. B 2015, 119, 247–257. [Google Scholar] [CrossRef]
  18. Rizou, Z.V.; Zoiros, K.E.; Rampone, T.; Sharaiha, A. Reflective semiconductor optical amplifier direct modulation capability enhancement using birefringent fiber loop. Appl. Sci. 2020, 10, 5328. [Google Scholar] [CrossRef]
  19. Hamze, M. Study of Different SOA Structures Impact on the Transmission of IMDD OOFDM Signals. Ph.D. Thesis, Université de Bretagne Occidentale (UBO), Brest, France, 2015. [Google Scholar]
  20. Wei, X.; Zhang, L. Analysis of the phase noise in saturated SOAs for DPSK applications. IEEE J. Quantum Electron. 2005, 41, 554–561. [Google Scholar]
  21. Sato, K.; Toba, H. Reduction of mode partition noise by using semiconductor optical amplifiers. IEEE J. Sel. Top. Quantum Electron. 2001, 7, 328–333. [Google Scholar] [CrossRef]
  22. Zimmerman, D.R.; Spiekman, L.H. Amplifiers for the masses: EDFA, EDWA, and SOA amplets for metro and access applications. J. Light. Technol. 2004, 22, 63. [Google Scholar] [CrossRef]
  23. De Valicourt, G.; Make, D.; Landreau, J.; Lamponi, M.; Duan, G.; Chanclou, P.; Brenot, R. High gain (30 dB) and high saturation power (11 dBm) RSOA devices as colorless ONU sources in long-reach hybrid WDM/TDM-PON architecture. IEEE Photonics Technol. Lett. 2010, 22, 191–193. [Google Scholar] [CrossRef]
  24. Gutiérrez-Castrejón, R.; Occhi, L.; Schares, L.; Guekos, G. Recovery dynamics of cross-modulated beam phase in semiconductor amplifiers and applications to all-optical signal processing. Opt. Commun. 2001, 195, 167–177. [Google Scholar] [CrossRef]
  25. Rizou, Z.V.; Zoiros, K.E.; Hatziefremidis, A.; Connelly, M.J. Design analysis and performance optimization of a Lyot filter for semiconductor optical amplifier pattern effect suppression. IEEE J. Sel. Top. Quantum Electron. 2013, 19, 1–9. [Google Scholar] [CrossRef]
  26. Schwartz, M. Information Transmission, Modulation and Noise. A Unified Approach to Communication Systems; McGraw-Hill: New York, NY, USA, 1970. [Google Scholar]
Figure 1. Block diagram of RSOA optically modulated by NRZ data and followed by BFL to overcome pattern-dependent distortion. F S R , Δ λ : free spectral range and detuning, respectively, of the BFL response, T B F L .
Photonics 09 00248 g001
Figure 2. RSOA frequency response: experimental (solid line) and theoretical curve (dashed line). The dotted line denotes the 3 dB bandwidth.
Photonics 09 00248 g002
Figure 3. Overshoot definition and effect on amplified pulse shape.
Photonics 09 00248 g003
Figure 4. BFL response: (a) experimental, (b) simulated.
Photonics 09 00248 g004
Figure 5. Representative pulse stream profile at the RSOA input (a), RSOA output (b) and BFL output (c). Left column: experimental results. Right column: simulation results.
Photonics 09 00248 g005
Figure 6. Consecutive “1”s profile at the RSOA input (a), RSOA output (b) and BFL output (c). Left column: experimental results. Right column: simulation results.
Photonics 09 00248 g006
Figure 7. Measured eye diagrams (left column) and simulated pseudo-eye diagrams (right column) at the RSOA input (a), RSOA output (b) and BFL output (c).
Photonics 09 00248 g007
Figure 8. Consecutive “1”s profile at (a) output of unsaturated RSOA, (b) output of BFL following saturated RSOA. Left column: experimental results. Right column: simulation results.
Photonics 09 00248 g008
Figure 9. Overshoot at RSOA output vs. RSOA small signal gain for different CW input power. The dotted horizontal line denotes the O V S acceptable limit set at 25%.
Photonics 09 00248 g009
Figure 10. Overshoot at BFL output for different BFL detuning values. The dotted horizontal line denotes the O V S acceptable limit set at 25%.
Photonics 09 00248 g010
Figure 11. Overshoot at BFL output vs. RSOA linewidth enhancement factor. The dotted horizontal line denotes the O V S acceptable limit set at 25%.
Photonics 09 00248 g011
Figure 12. Overshoot at RSOA and BFL output for different data rates. The dotted horizontal line denotes the O V S acceptable limit set at 25%.
Photonics 09 00248 g012
Table 1. Simulation parameters default values.
SymbolDefinitionValueUnitReference
P C W Data pulse average (CW) power−3.5dBm[7]
T p e r Data pulse repetition period200ps[7]
t r Data pulse rise time17% of repetition periodps[7]
Γ RSOA confinement factor0.21-[19]
aRSOA differential gain 8.2 × 10 20 m 2 [19]
N o RSOA carrier density at transparency 6.5 × 10 23 m 3 [19]
α L E F RSOA linewidth enhancement factor5- [19]
n g RSOA semiconductor material group refractive index3.6-[19]
L R S O A RSOA active region length713um[19]
I d c RSOA dc bias current70mA[7]
I o RSOA transparency current45mA[18]
T c a r RSOA carrier lifetime248.9psSpecified by fitting to experiment [7]
P s a t RSOA semiconductor material saturation power17dBmSpecified by fitting to experiment [7]
BBFL birefringence 3.3 × 10 4 - [7]
L B F L BFL PMF total length8.5m [7]
Δ λ BFL detuning325pm [7]
Publisher’s Note: MDPI stays neutral with regard to jurisdictional claims in published maps and institutional affiliations.