Abstract
Blood cell analysis is essential for the diagnosis and identification of hematological malignancies. The use of digital microscopy systems has been extended in clinical laboratories. Super-resolution microscopy (SRM) has attracted wide attention in the medical field due to its nanoscale spatial resolution and high sensitivity. It is considered to be a potential method of blood cell analysis that may have more advantages than traditional approaches such as conventional optical microscopy and hematology analyzers in certain examination projects. In this review, we firstly summarize several common blood cell analysis technologies in the clinic, and analyze the advantages and disadvantages of these technologies. Then, we focus on the basic principles and characteristics of three representative SRM techniques, as well as the latest advances in these techniques for blood cell analysis. Finally, we discuss the developmental trend and possible research directions of SRM, and provide some discussions on further development of technologies for blood cell analysis.
1. Introduction
Hematological diseases are a series of diseases that originate or affect the blood and hematopoietic organs [1]. In recent years, the number of deaths from hematological malignancies has increased gradually [2]; therefore, accurate diagnosis and identification are increasingly important for the treatment of hematological diseases. In hospitals and clinical laboratories around the world, blood cell analysis has always been recognized as an important tool for the diagnosis and identification of hematological diseases [3]. The most common examinations are complete blood count and leukocyte classification in clinical hematology laboratory, which include various information on the number, morphology, structure, and component of blood cells [4,5].
The available techniques for assessing blood cell functions are limited, considering the various types of blood cell and their diverse functions. Currently, the main approaches to blood cell analysis include optical microscopy, electron microscopy, flow cytometry, and hematology analyzers. However, these traditional approaches still have many limitations. For example, optical microscopy requires a long examination time, while hematology analyzers suffer from a low recognition ability and a high dependence on the experience of the user. To improve the sensitivity and specificity of diagnoses and the efficiency of blood cell analysis, researchers have been exploring new approaches to blood cell analysis [6].
It is interesting to identify quantitative features through digital image analysis for morphological characteristics of blood cells. Super-resolution microscopy (SRM) is one of the most significant breakthroughs in the field of optical microscopy in the last three decades. SRM breaks the resolution limit of optical microscopy and achieves a spatial resolution in the tens of nanometers, and thus provides an unprecedented opportunity to study life phenomena at the subcellular scale [7,8,9]. In 2014, the Nobel Prize in Chemistry was awarded to three pioneering scientists, Willian E. Moerner, Eric Betzig, and Stefan Hell, who made outstanding contributions to the theory and realization of SRM. SRM has the desirable characteristics of ultra-high resolution, high sensitivity, and high biocompatibility, and is now being applied in various biomedicine fields.
Not surprisingly, SRM provides new opportunities in hematology. It is common to use ultrastructural features in the diagnosis of some hematologic malignancies. For example, electron microscopy is often used to investigate platelet granule deficiency disorders [10]. However, the electron beam used in electron microscopy is harmful to cell samples, and it is not possible to apply electron microscopy when studying living cells. Live-cell SRM can provide various forms of dynamic information at the nanoscale, such as structural changes, distribution abnormalities, interactions, and physiological processes, which can provide crucial information on the pathogenesis, prevention, monitoring, and treatment of hematological malignancies [11]. For example, how malaria parasites infect red blood cells and further spread the disease is important in treating and blocking parasite development [12]; while the regulation mechanism of related cytoskeleton during platelet shape changes is the key to the development or prevention of thrombotic diseases [13]. SRM can offer precise information on the ultrastructure and mechanisms of action within blood cells at the macromolecular level without damaging sample structures [14,15]. Therefore, SRM has the potential to be used in the monitoring and treatment of hematologic malignancies in both translational research and clinical diagnostics.
In this paper, we review several traditional approaches to blood cell analysis, including optical microscopy, electron microscopy, flow cytometry, and hematology analyzers. After analyzing the advantages and disadvantages of each approach, we demonstrate the necessity of exploring new approaches to blood cell analysis. Next, we introduce the basic principles and characteristics of several representative SRM technologies, and present the latest progress of these SRM techniques in blood cell analysis. Finally, we discuss future research trends and possible research directions in SRM-based blood cell analysis.
2. Traditional Approaches
2.1. Optical Microscopy
Manual microscopic examination refers to the observation, analysis, and judgment of clinical samples (e.g., blood smears and bone marrow smears) by a user under an optical microscope [5]. Note that the typical blood volume is ~20–30 µL when preparing a blood smear. For a long time, manual microscopic examination has been widely used for diagnosing some common diseases, such as malaria, acute leukemia, and MM [16,17,18]. Recently, manual microscopic examination was applied in the study of coronavirus disease 2019, in which the effect of the virus on blood cells was checked using peripheral blood smears, and early signs of inflammation could be identified from abnormal phenomena in the number and morphology of platelets and leukocytes [19].
However, manual microscopic examination is highly dependent upon the experience of the user, resulting in highly subjective conclusions with poor repeatability. With the development of digital imaging and computer vision, various methods have been gradually developed for blood-smear analysis using image-processing technology, in which human eye inspection is replaced with automated image analysis. For example, Alzubaidi and coworkers used a deep-learning model to classify patients with sickle cell anemia, and achieved an accuracy of 99.98% [20]. Using image segmentation and a data-mining algorithm, Acharya and coworkers detected acute lymphoblastic leukemia with an accuracy of 98.6% [21]. Umer and coworkers used a stacked convolutional neural network model to classify malaria in thin blood-smear images with an accuracy of 99.96% [22].
2.2. Electron Microscopy
Since the 1940s, the electron microscope (EM) has been used to observe the internal structures of blood cells. With the development of sample preparation methods (e.g., tissue fixation and staining), EM has gradually become a powerful tool in the study of platelets by providing new data on their morphology, physiology, and pathology. In a review paper, White described the excellent performance of EM in the diagnosis of many platelet dysfunctions [10]. For example, in Hermansky–Pudlak syndrome, which is caused by a reduction in dense (or δ-) granules in platelets, the content of such dense granules has a high electron density. Therefore, the use of an EM to diagnose Hermansky–Pudlak syndrome can be more rapid and reliable. In another hematological disease, gray platelet syndrome, in which patients have a lack of α-granules, the reduction in and absence of α-granules can be clearly visualized under an EM, but it is difficult to distinguish these situations with an optical microscope. In addition, an EM also performs well in observing the 3D tissue information of megakaryocytes and the process of thrombosis [23,24].
However, an EM requires the preservation of biological samples in vacuum. Therefore, an EM is not applicable to in vivo imaging. In addition, an EM can only provide the structure of a sample at a certain time, without being able to observe the dynamic process of that sample, and thus offers very limited opportunities for studying life activities.
2.3. Flow Cytometry
A flow cytometer is a tool that uses scattered light from different angles to analyze, screen, and characterize single cells suspended in a liquid medium. Most flow cytometers consist of four parts: a liquid flow system, an optical system, an electronic system, and an analysis system [25]. Flow cytometers are widely used in the diagnosis of hematological diseases due to their high throughput, fast speed, and flexible operation [26]. For example, acute myeloid leukemia, lymphoma, platelet dysfunction, and MM can be well characterized by flow cytometry [27,28,29,30].
Traditional flow cytometers use fluorophores as markers to label the antibodies to be tested. The multicolor detection capability of flow cytometers is limited by the emission-spectra overlaps of the fluorophores. To solve this problem, researchers have been developing several upgraded versions of flow cytometers. For example, a spectral flow cytometer uses spectral unmixing to solve the emission-overlap problem, as well as to reduce the complexity of the optical path. Spectral flow cytometers are now used to analyze mixed populations of immune cells [31]. In another upgrade, a mass flow cytometer combines flow cytometry with mass spectrometry, and is able to perform multiparameter detection of single cells using the high resolution of mass-spectrometry detection. The mass flow cytometer has a wide application in hematopoiesis, cancer, and drug screening [32,33]. An imaging flow cytometer relies on multispectral imaging to collect a large number of static images of cells, and is able to analyze the morphologies of rare cell subpopulations in a mixed cell population, such as minimal residual disease and circulating tumor cells [34,35].
The throughput of a flow cytometer is generally high, and a large number of high-dimensional datasets will be produced in daily usage. To solve the problems of low efficiency and subjectivity of manual analysis, researchers developed computational flow cytometry, which combines high-dimensional flow-cytometry data visualization with automatic cell-population identification to analyze a large number of cell data, creating a new and objective way for the visualization, interpretation, and modeling of flow-cytometry data [36].
Nowadays, the microfluidic flow cytometer with a microfluidic chip as the core is a new development direction with the advantages of high integration, low volume, portability, full closure, and zero cross-contamination. The microfluidic flow cytometer is especially suitable for disease monitoring and real-time rapid diagnosis, and thus plays an important role in medical care [37,38].
Despite the promising developments mentioned above, flow cytometry still has much room to improve, especially in detection sensitivity. In fact, the detection sensitivity of flow cytometry was estimated to be ~1000 antigen/cell, which may not be sufficient for some applications [39]. During the diagnosis and treatment of hematological malignancies, flow cytometry can only detect CD19 (a very good target antigen for cancer immunotherapy) in 0.05% of myeloma cells, and cannot correctly classify myeloma cells [40,41]. To improve the diagnosis accuracy and discrimination rate, the detection sensitivity of flow cytometry needs to be further improved.
2.4. Hematology Analyzer
A hematology analyzer is mainly used to enable various blood cell counts, leukocyte classification, hemoglobin content quantification, and detection of some parasites. The detection principles of various hematology analyzers include electrical impedance, radiofrequency conductivity, laser-light scattering, and spectrophotometry [42]. A hematology analyzer is simple to operate; the user sets the normal thresholds for various parameters, and the instrument displays an alert message when the test results exceed the normal thresholds. Currently, the BC-6800 Plus (Mindray, Shenzhen, China) hematology analyzer can detect 200 samples/hour, which is approximately 50 times faster than manual microscopic examination. A hematology analyzer is thus effective in reducing the workload of the inspector. At the same time, a hematology analyzer is able to detect multiple parameters. For example, the ABX PENTRA DX 120 (HORIBA, Paris, France) automatic hematology analyzer can detects up to 49 parameters. However, many of the new parameters cannot be applied to the clinic, and are limited to only laboratory or research use. However, with the advantages of high throughput, multiple parameters, a fast speed, and simple operation, hematology analyzers are widely used in hospitals at all levels, and greatly improve the efficiency of clinical testing.
It is worthwhile to note that hematology analyzers are generally used as a preliminary screening method for blood cell analysis, because this method cannot provide accurate detection of the changes in blood cell morphology that may contain important information for diagnosis. Therefore, hematology analyzers are suitable only for large-scale blood-sample analysis. For the identified abnormal samples, it is necessary to use manual microscopic examination to accurately identify the cell type and confirm pathological changes. The HematoFlow platform (Beckman Coulter, Brea, CA, USA) was developed by combining a hematology analyzer and a flow cytometer [43]. When an alarm message appears on the hematology analyzer, the abnormal sample will be sent to the flow cytometer, and subjected to manual microscopic examination if necessary, for further testing. Therefore, the HematoFlow platform significantly improves the detection efficiency by reducing the number of samples required for manual microscopic examination.
The advantages and disadvantages of the above-mentioned techniques for blood cell analysis are summarized in Table 1.

Table 1.
Comparison of different blood cell analysis techniques.
3. New Approaches: Super-Resolution Microscopy
In the past three decades, SRM has gained popularity in biomedical research due to its ultra-high resolution, high sensitivity, and high biocompatibility. SRM technologies have greatly enhanced the ability to study subcellular-scale structures, which is important for hematological-disease detection and diagnosis [44,45]. Here, we present three representative SRM technologies for blood cell analysis: single-molecule localization microscopy (SMLM) [46,47], stimulated emission depletion microscopy (STED) [48], and structured illumination microscopy (SIM) [49,50]. Table 2 compares the performance of several SRM methods using some important parameters.

Table 2.
Comparison of several SRM methods.
3.1. Single-Molecule Localization Microscopy
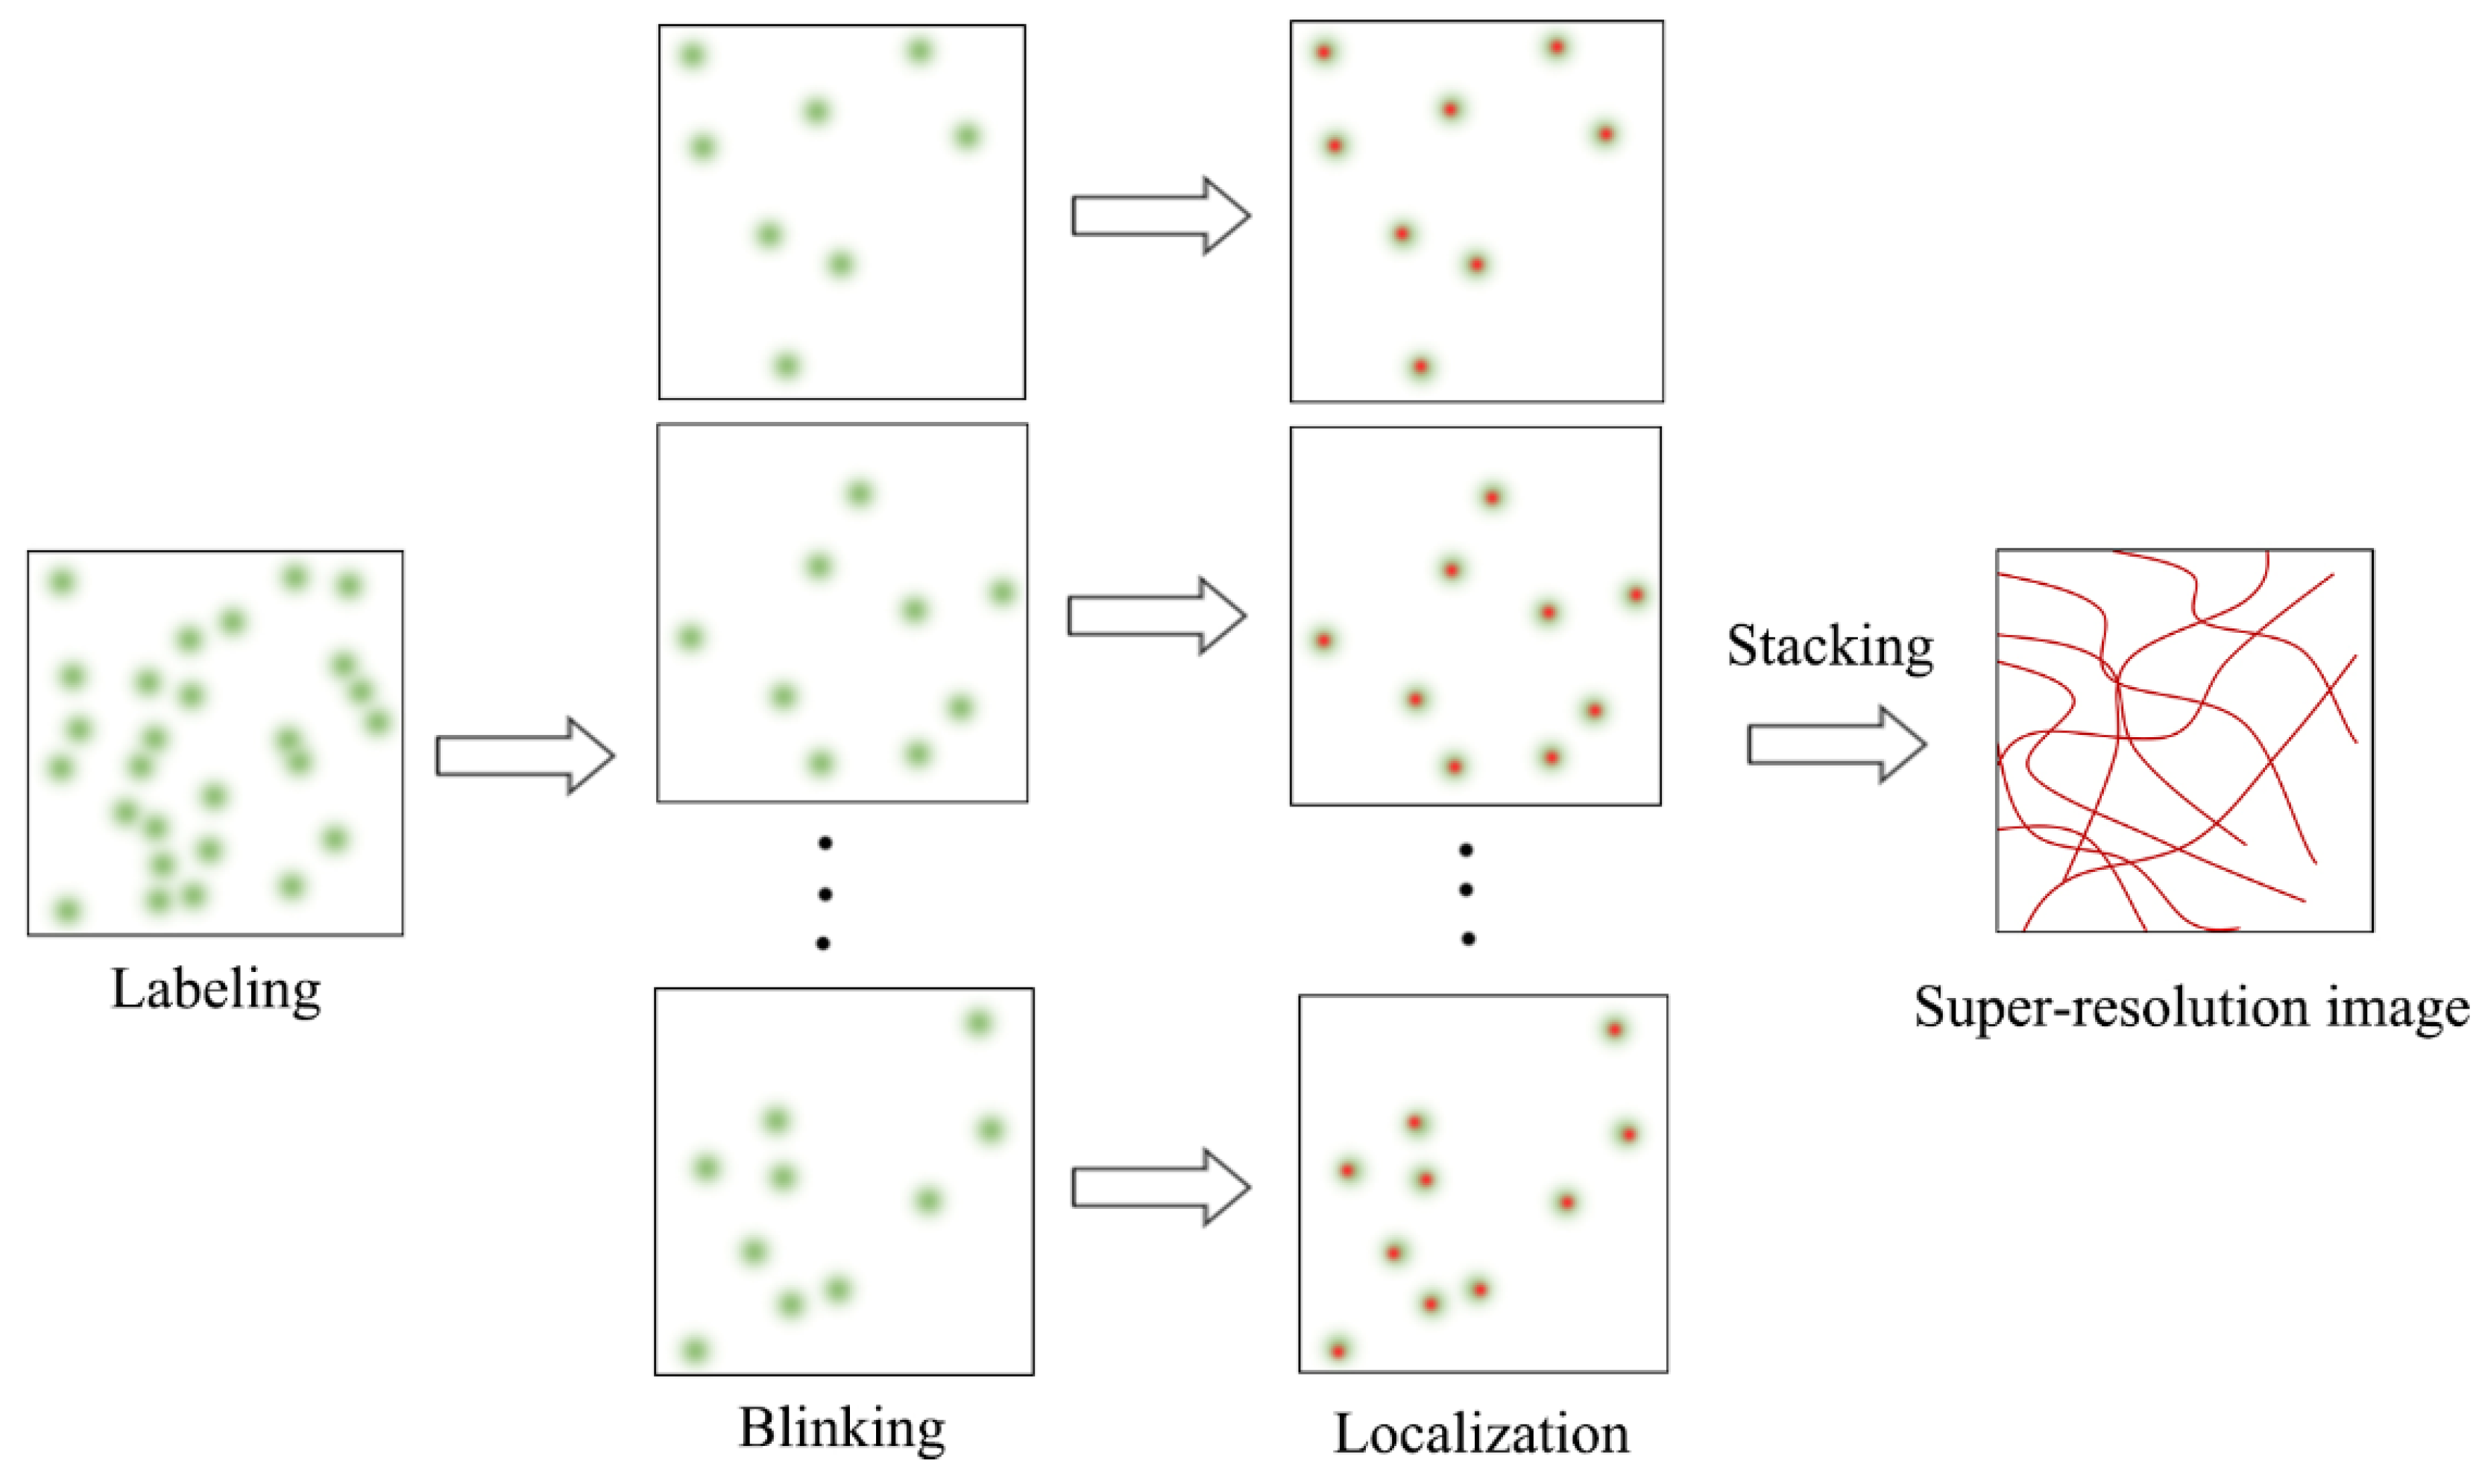
SMLM is an advanced fluorescence microscopy technique that combines single-molecule fluorescence imaging with single-molecule localization to break the diffraction limit. SMLM is also a mainstream SRM technology, and includes photoactivated localization microscopy (PALM), stochastic optical reconstruction microscopy (STORM), direct STROM (dSTORM), point accumulation for imaging in nanoscale topography (PAINT), and many other variants. SMLM adopts the time-for-space strategy to randomly activate fluorophores labeled with biological structures, so that the fluorophores observed at the same time are sparsely distributed in space. Single-molecule fluorescence images of the sparse fluorophores are captured and processed with a suitable single-molecule localization algorithm to find the nanoscale spatial locations of the fluorophores (Figure 1), which are further used to reconstruct a final super-resolution image with a typical mean lateral resolution of 20~30 nm.
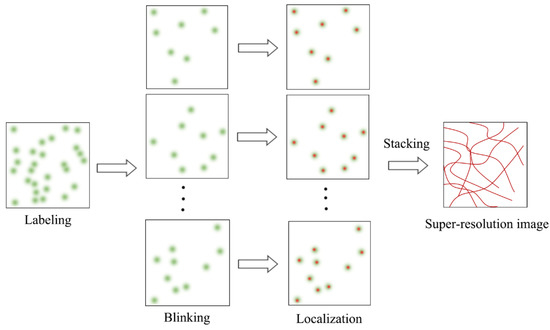
Figure 1.
Schematic diagram of SMLM principle.
In 2006, Betzig and coworkers invented the so-called PALM technique, in which the resolution is determined mainly by the number of fluorescent molecules (N) and the localization precision [46]. Specifically, the localization accuracy can be theoretically estimated using the following formula [56]:
where s represents the standard deviation of the point spread function (PSF) of the optical imaging system, a represents the pixel size on the sample plane, N represents the number of photons emitted from a fluorescent molecule, and b represents the background noise. If N is large enough, the resolution can be infinitely improved. Note that this formula has been updated to work with different types of low-light cameras.
PALM can provide nanoscale imaging of subcellular structures or cellular components (e.g., proteins) with a resolution 10 times that of conventional optical imaging. Rust and coworkers invented a similar SRM technique called STORM, which explores the photoswitching properties of chemical dyes, rather than the fluorescent proteins that are used in PALM [47]. The resolution of STORM is determined by the same factors as those in PALM. Van de Linde and coworkers proposed dSTORM [57], which relies on conventional chemical dyes instead of special dyes. In this case, the experimental setup was simplified. Another important SMLM technique, called PAINT, relies on the intermittent phenomenon of bimolecular collisions to localize fluorescent molecules [58]. As reported by Brockman and coworkers, PAINT can be used to map molecular mechanical events with up to a 25 nm resolution [59].
Researchers also have been attempting to enable 3D SMLM. Currently, the most popular approach to 3D SMLM is by introducing astigmatism in the PSF, which can achieve an axial resolution of ~50 nm and an imaging depth of ~1 µm [60]. Other approaches to axial resolution enhancement in SMLM include 4Pi microscopy and multiplane detection [8]. The highest axial resolution obtained by applying 4Pi in SMLM that has been achieved was 10–20 nm inside thick cells (~10 µm) [61]. However, combining 4Pi microscopy with SMLM is extremely complicated, and suffers from reduced stability.
Furthermore, to explore the interactions of intracellular components, multicolor super-resolution imaging has been developed. The mainstream methods of multicolor SMLM include spectral splitting, sequential excitation, chromatic dispersion, and PSF engineering [62]. In addition, 6–7-color SRLM has been achieved, but the crosstalk rate was high (10–20%) [63,64]. Recently, Wang and coworkers invented a joint encoding scheme for the emitter location and color using a customized RGBW camera, and demonstrated two-color SMLM with ∼20 nm resolution and <2% crosstalk, while the complexity of the optical system was significantly reduced [65].
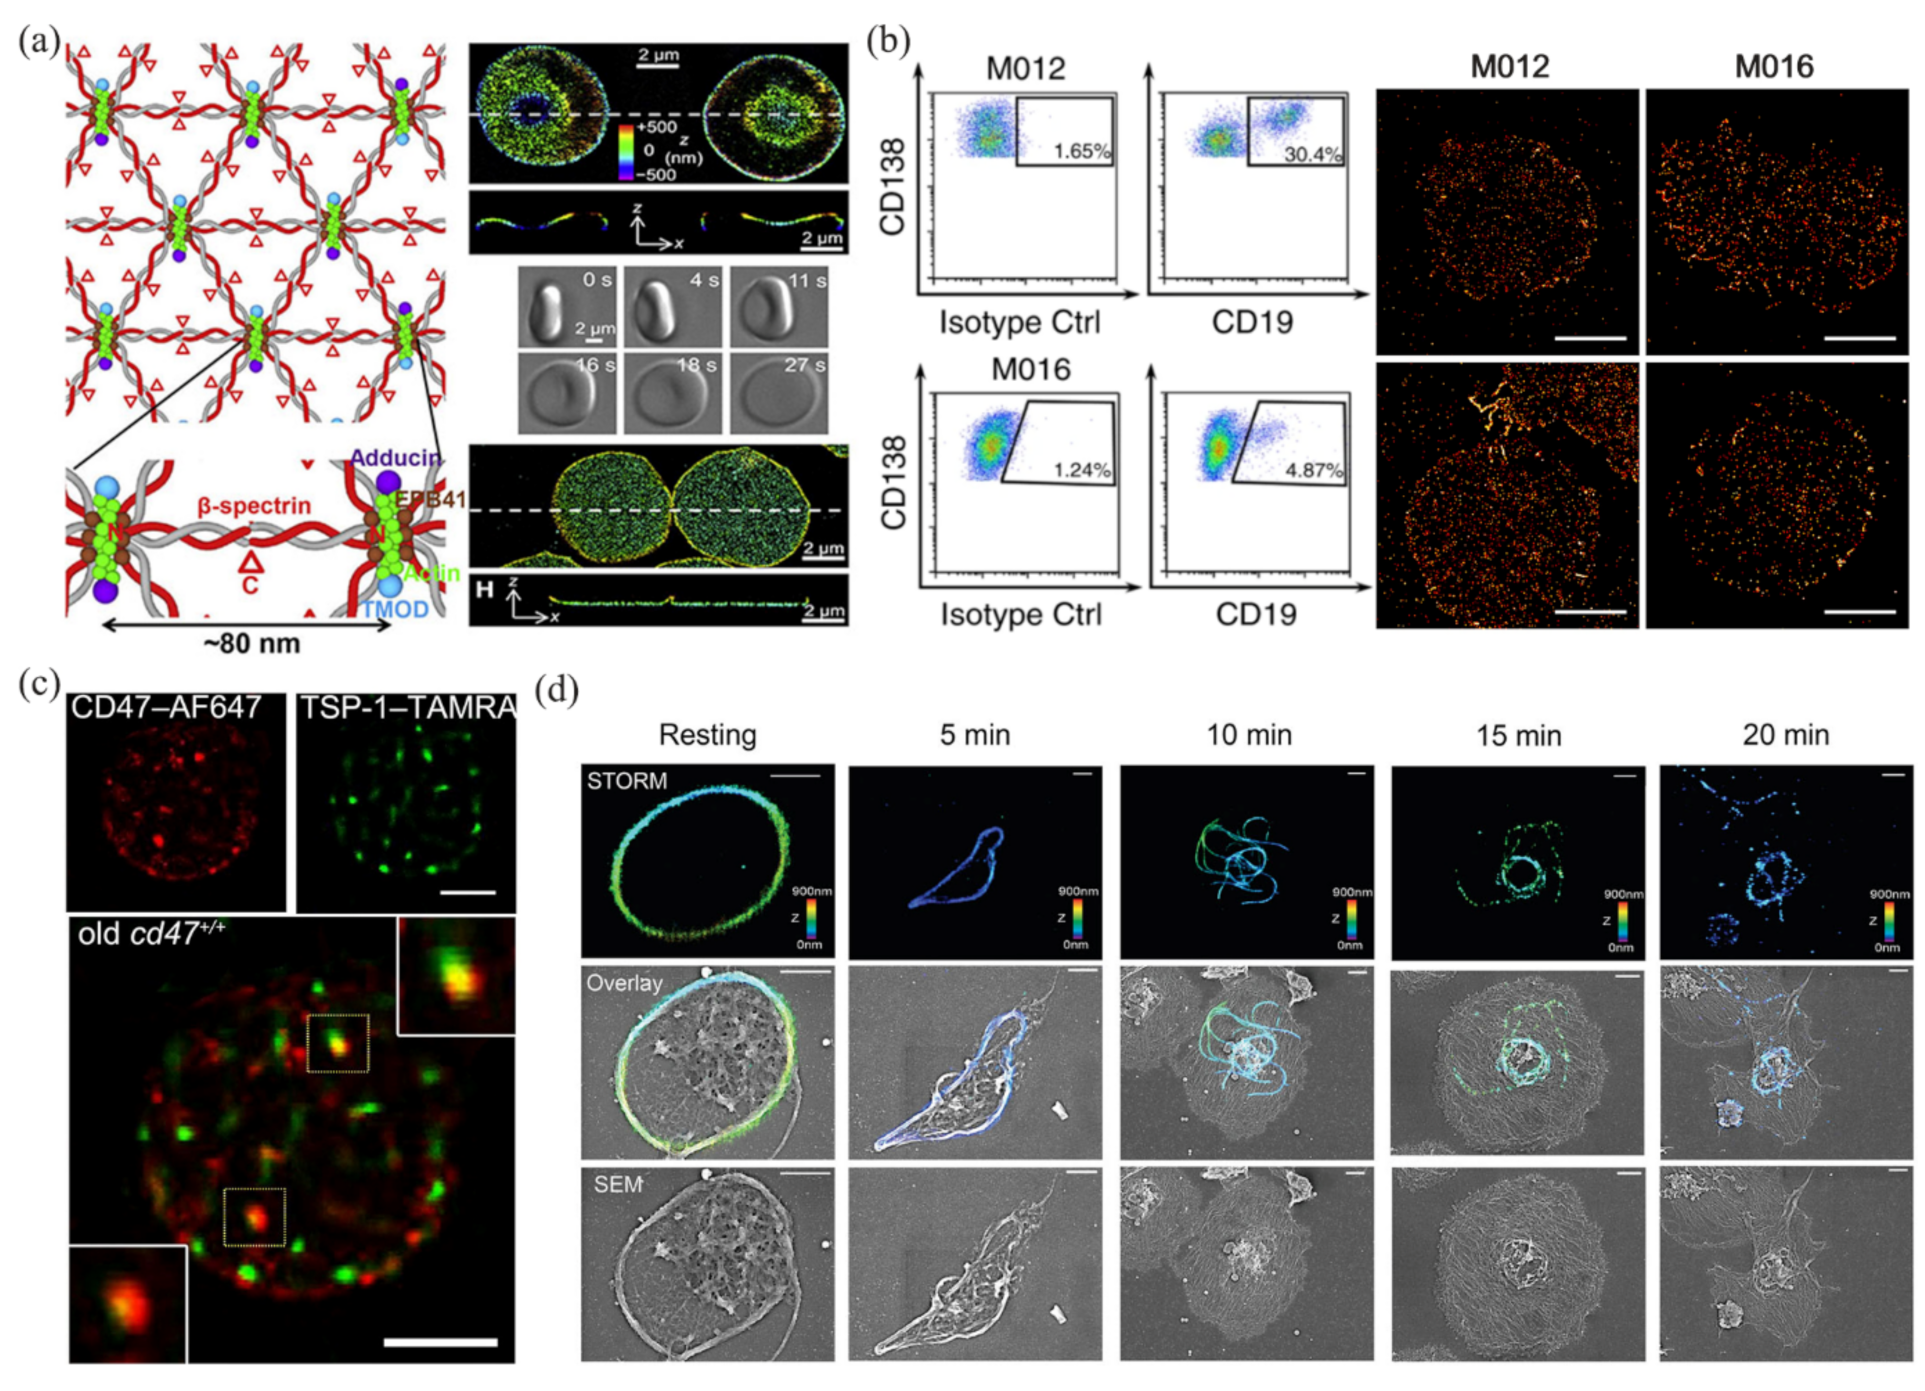
In the past several years, many researchers have tried to apply SMLM to blood cell analysis. Pan and coworkers analyzed the ultrastructure structure of an erythrocyte membrane skeleton using STORM [66], and revealed a junction-to-junction distance of ~80 nm (Figure 2a). These works provided a new approach to studying the rheological properties of erythrocytes, and helped clarify the pathological processes of diseases such as hemolytic anemia, ischemic disease, and malaria. Nerreter and coworkers used dSTORM to detect CD19/CD20 (two good target antigens in immunotherapy for multiple myeloma), and performed a statistical analysis of the density changes of CD19/CD20 during immunotherapy [40]. They found that in the detection of antigens (CD19/CD20), dSTORM was several hundred times more sensitive than flow cytometry (Figure 2b). In addition, dSTORM can more accurately identify false-negative patients with minimal residual disease than flow cytometry. Wang and coworkers used dSTORM to obtain the nanoscale distribution and changes in CD47 on an erythrocyte surface during thrombospondin-1 (TSP-1)/CD47 interactions [67], and revealed the mechanism of TSP-1/CD47 binding on removal of aged erythrocytes (Figure 2c). This work provided direct evidence of the role of TSP-1 in the phagocytosis of aged erythrocytes, which may help in the treatment and prevention of anemia and iron toxicity. Recently, Chung and coworkers used STORM to observe the platelet-activation process at the nanoscale (Figure 2d), and revealed the spatiotemporal changes in platelets under phorbol 12-myristate 13-acetate activation [68]. They proved that STORM was more suitable than transmission electron microscopy in 3D intact imaging of activated and aggregated platelets. Some applications of SMLM in blood cell analysis, along with the data-analysis methods and the main results, are summarized in Table 3.
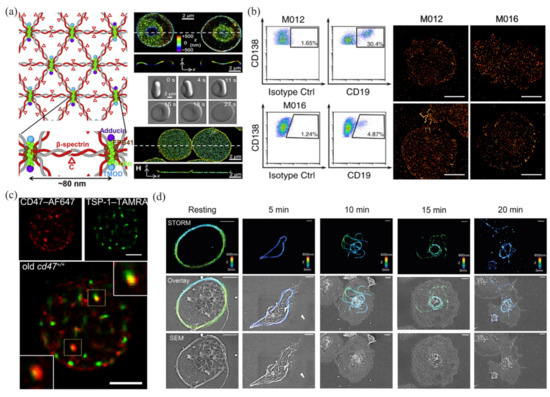
Figure 2.
Applications of SMLM in blood cell analysis. (a) The ultrastructure of erythrocyte membrane skeleton revealed by STORM. Reprinted from [66]. (b) Detection and analysis of CD19 in multiple myeloma cells by dSTORM and flow cytometry. Reprinted from [40]. (c) Colocalization of TSP-1 and CD47 in aging erythrocytes by two-color dSTORM. Reprinted from [67]. (d) STORM and SEM images of microtubules in platelets. Reprinted from [68].

Table 3.
Some applications of SMLM in blood cell analysis.
However, there are still many difficulties in the practical application of SMLM technology. On the one hand, the use of reducing agents (such as β-mercaptoethanol) in the imaging buffer leads to a hypoxic environment in which live cells cannot be imaged for a long period of time. Therefore, it is crucial to develop new fluorescent probes with desirable photophysics for fast imaging [69]. On the other hand, SMLM relies on single-molecule localization algorithm to obtain the center locations of fluorescent probes, and thousands or even tens of thousands of raw image frames are required for reconstructing a single super-resolution image. Therefore, SMLM usually suffers from a low imaging speed. Replacing the traditional single-molecule localization algorithm with high-density localization algorithms is a good strategy to improve the imaging speed of SMLM, because the latter can identify more center locations in a raw image, and thus reduces the total number of raw images. However, the data-processing speed of high-density localization algorithms is usually slow, and thus will result in severe data accumulation, especially when a scientific complementary metal–oxide–semiconductor camera is used as the detector in SMLM. To solve this problem, Ma and coworkers proposed a fast noniterative high-density localization algorithm called WindSTORM, but this algorithm is not applicable to 3D raw images [70].
Li and coworkers combined the divide-and-conquer strategy with a set of maximum likelihood estimation localization algorithms and presented a high-density localization algorithm called QC-STORM [71], which achieved real-time processing of high-density images from a scientific complementary metal–oxide–semiconductor camera with an exposure time of 10 ms and a field of view of 1024 × 1024 pixels. QC-STORM is two orders of magnitude faster than the popular high-density localization algorithm called ThunderSTORM [72]. QC-STORM is applicable to both 2D and 3D raw images, and would be useful in SMLM. However, it is still desirable to develop new localization algorithms or techniques for higher emitter densities, localization accuracies, and wider fields of view.
Balzarotti and coworkers invented the MINFLUX technology, which achieved ~1 nm localization precision [73]. Similar to STORM/PALM, MINFLUX requires random and sparse blinking of single molecules. However, to achieve such a high localization precision, MINFLUX relies on a ring beam with a central intensity of 0, rather than the normal Gaussian beam used in STORM, to excite fluorescence molecules. Cnossen and coworkers developed the SIMFLUX technology to improve the localization accuracy by nearly two times that of STORM [74]. SIMFLUX uses an orthogonally oriented sinusoidal illumination pattern (which is similar to that used in SIM) to overcome the limited field of view and throughput in MINFLUX.
3.2. Stimulated Emission Depletion Microscopy
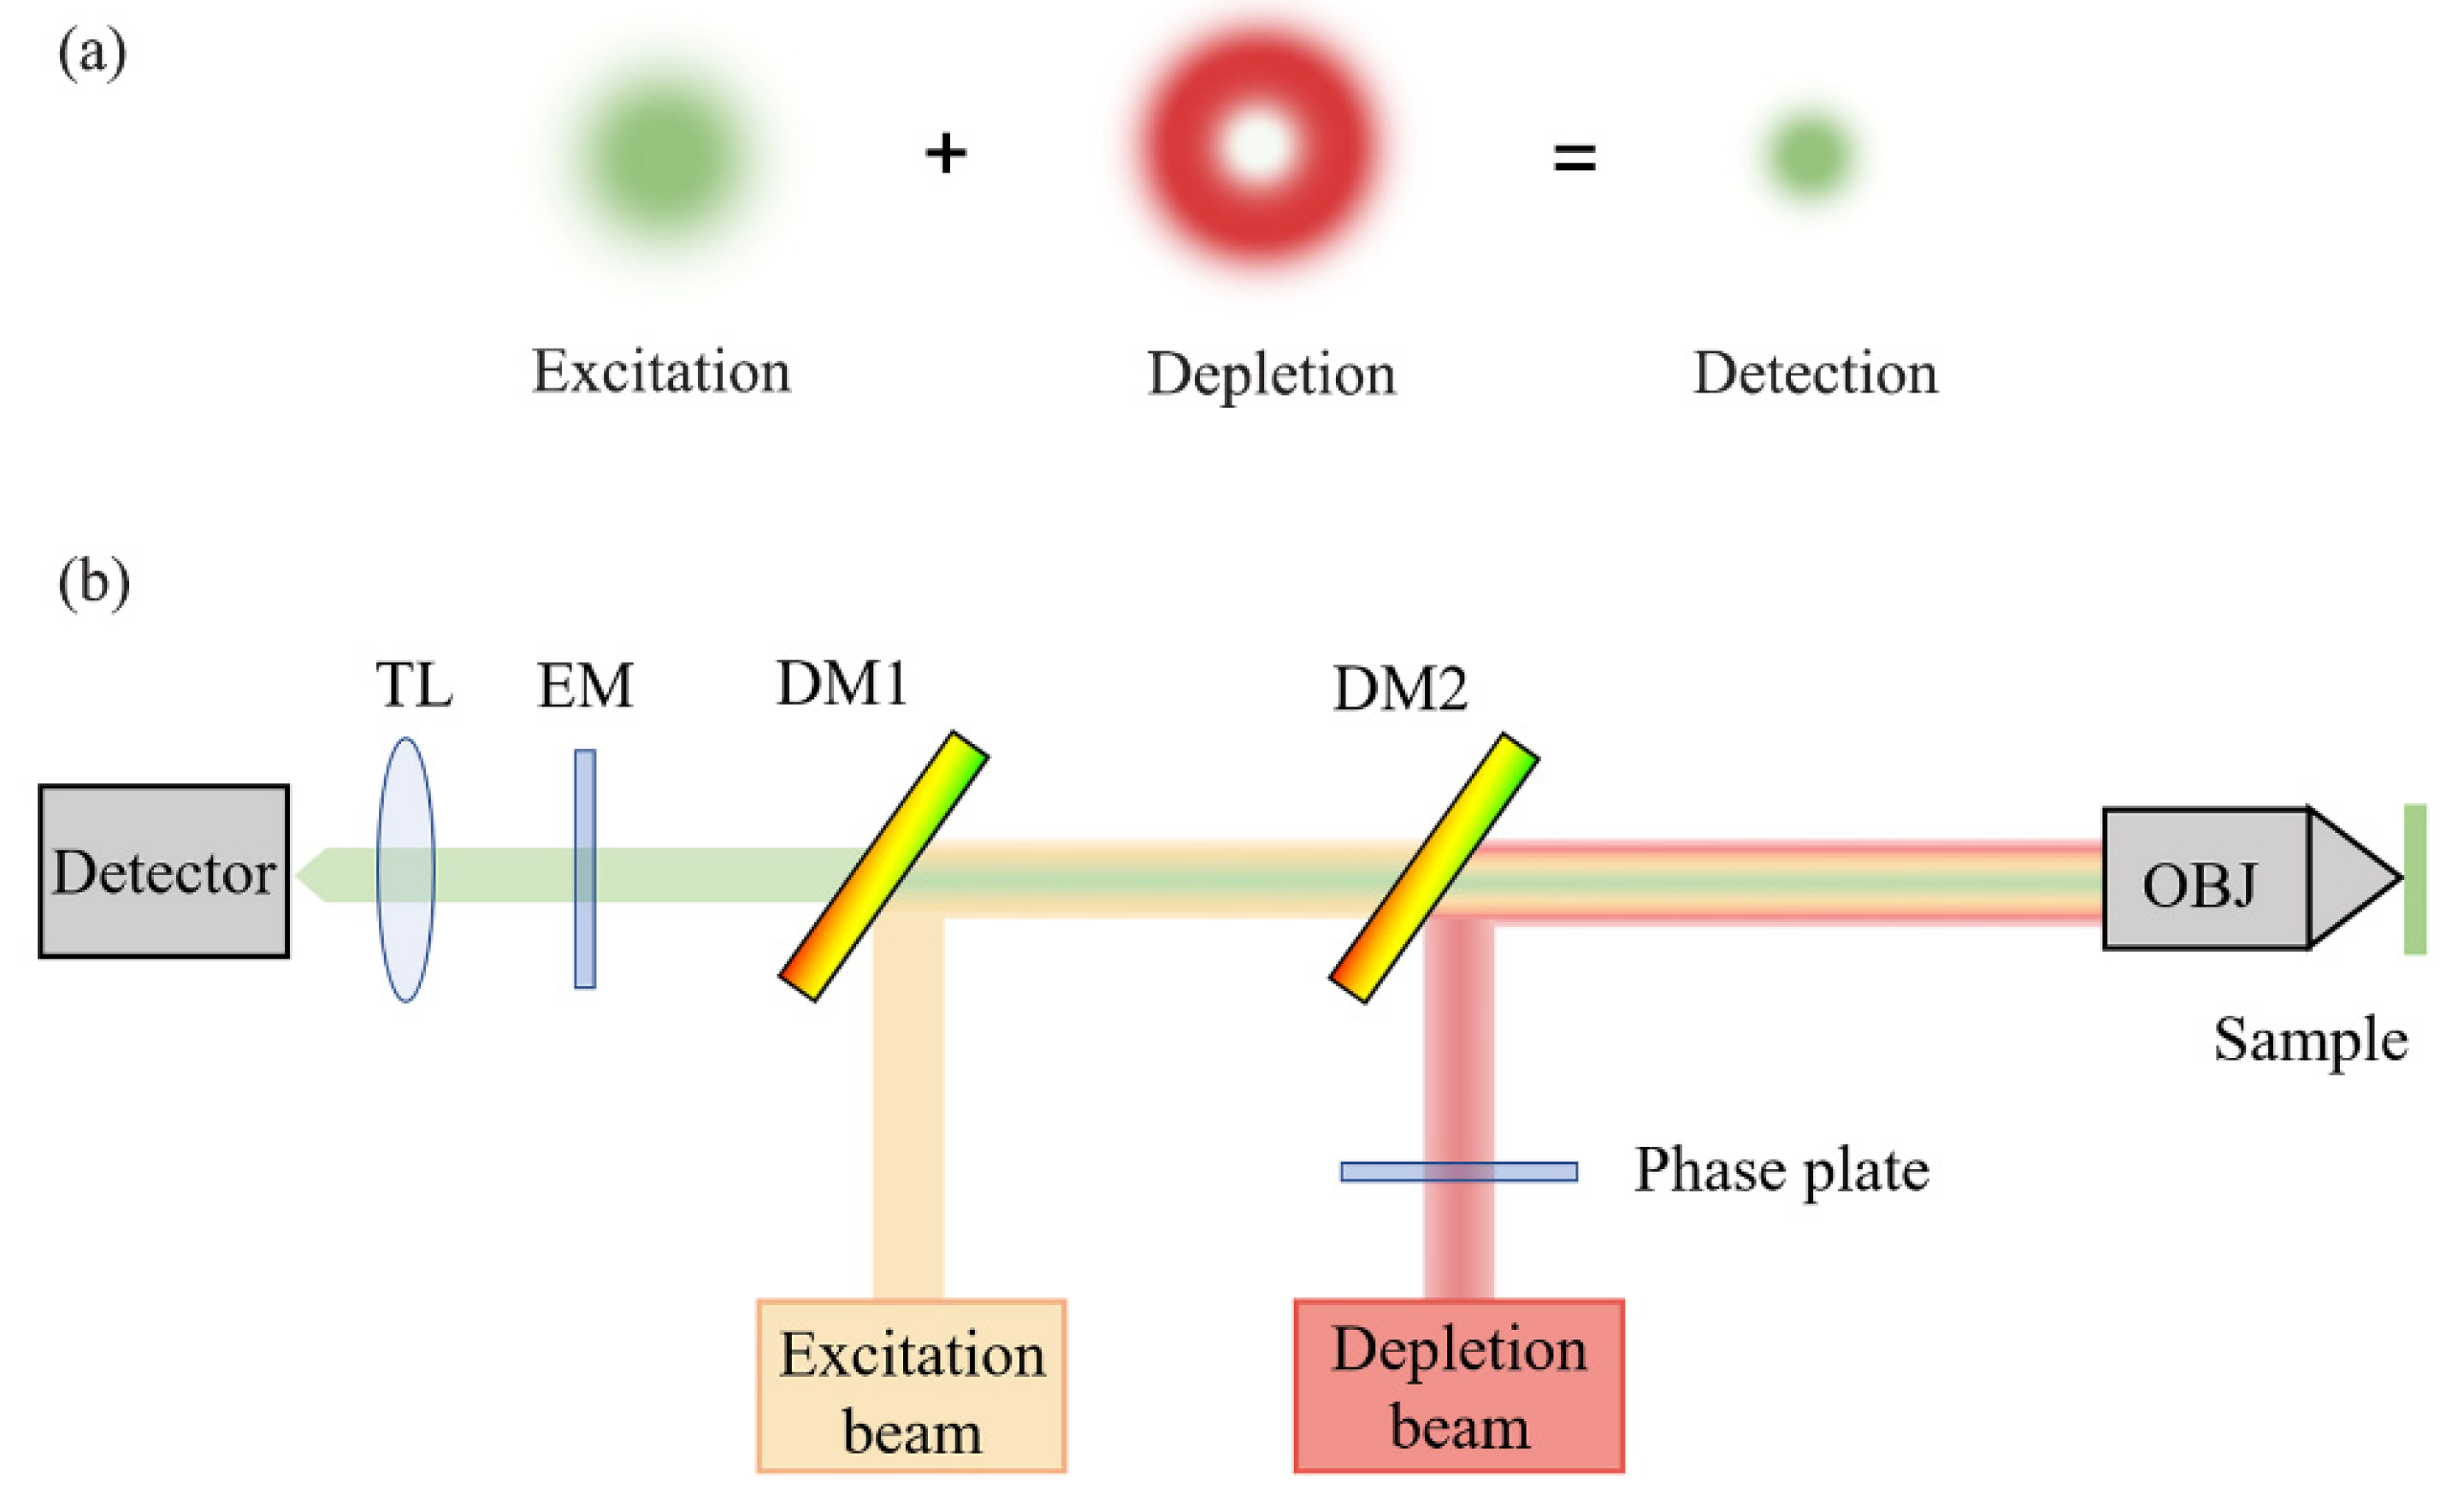
Hell proposed the theory of STED microscopy for SRM [48]. STED microscopy is built upon traditional confocal microscopy, except that a depletion light path is added to the excitation path to realize a doughnut light distribution in the focal plane, which effectively reduces the size of excitation light, and thus enables super-resolution imaging [75]. A schematic diagram of the STED principle is shown in Figure 3. STED microscopy was experimentally demonstrated in 2000, and has developed over the last two decades [9]. Recently, Li and coworkers used carbon dots as an STED probe to achieve an ultra-high resolution of 19.7 nm in live cell imaging [76].
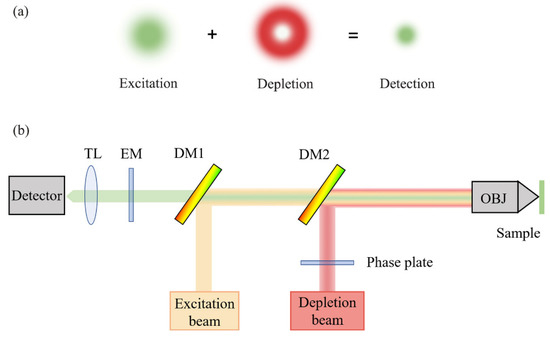
Figure 3.
Schematic diagram of STED principle: (a) mechanism of the excitation beam and depletion beam; (b) optical setup of STED. TL, tube lens; EM, emission filter; DM, dichroic mirror; OBJ, objective lens.
The axial resolution of STED has also been enhanced. For example, 3D-STED achieved a resolution of 43 nm in the lateral direction and 125 nm in the axial direction through two superimposed incoherent STED beams [77]. In addition, isoSTED provided an isotropic 3D resolution of 40 nm using a dual-objective-lens architecture [75]. In addition, with the further development of new probes and imaging schemes, STED has achieved four-color imaging of platelets with ≤40 nm resolution and low crosstalk [78].
A unique characteristic of STED microscopy is that the resolution is controlled by adjusting the depletion-light intensity. However, the high intensity of STED light can cause photodamage to biological samples. To reduce the photodamage without sacrificing the resolution, researchers have been developing various techniques to reduce the STED light intensity; for example, G-STED based on time gated detection [79], RESCue STED, and DyMIN STED based on adaptive illumination [80,81]. Compared with other SRM techniques, STED microscopy can generate a super-resolution image immediately after the image acquisition. No additional data processing is required, and the time resolution can reach the millisecond scale. In addition, the 3D-sectioning capability of STED microscopy allows for a deeper imaging depth, which is particularly useful for imaging thick tissues and live animals [82].
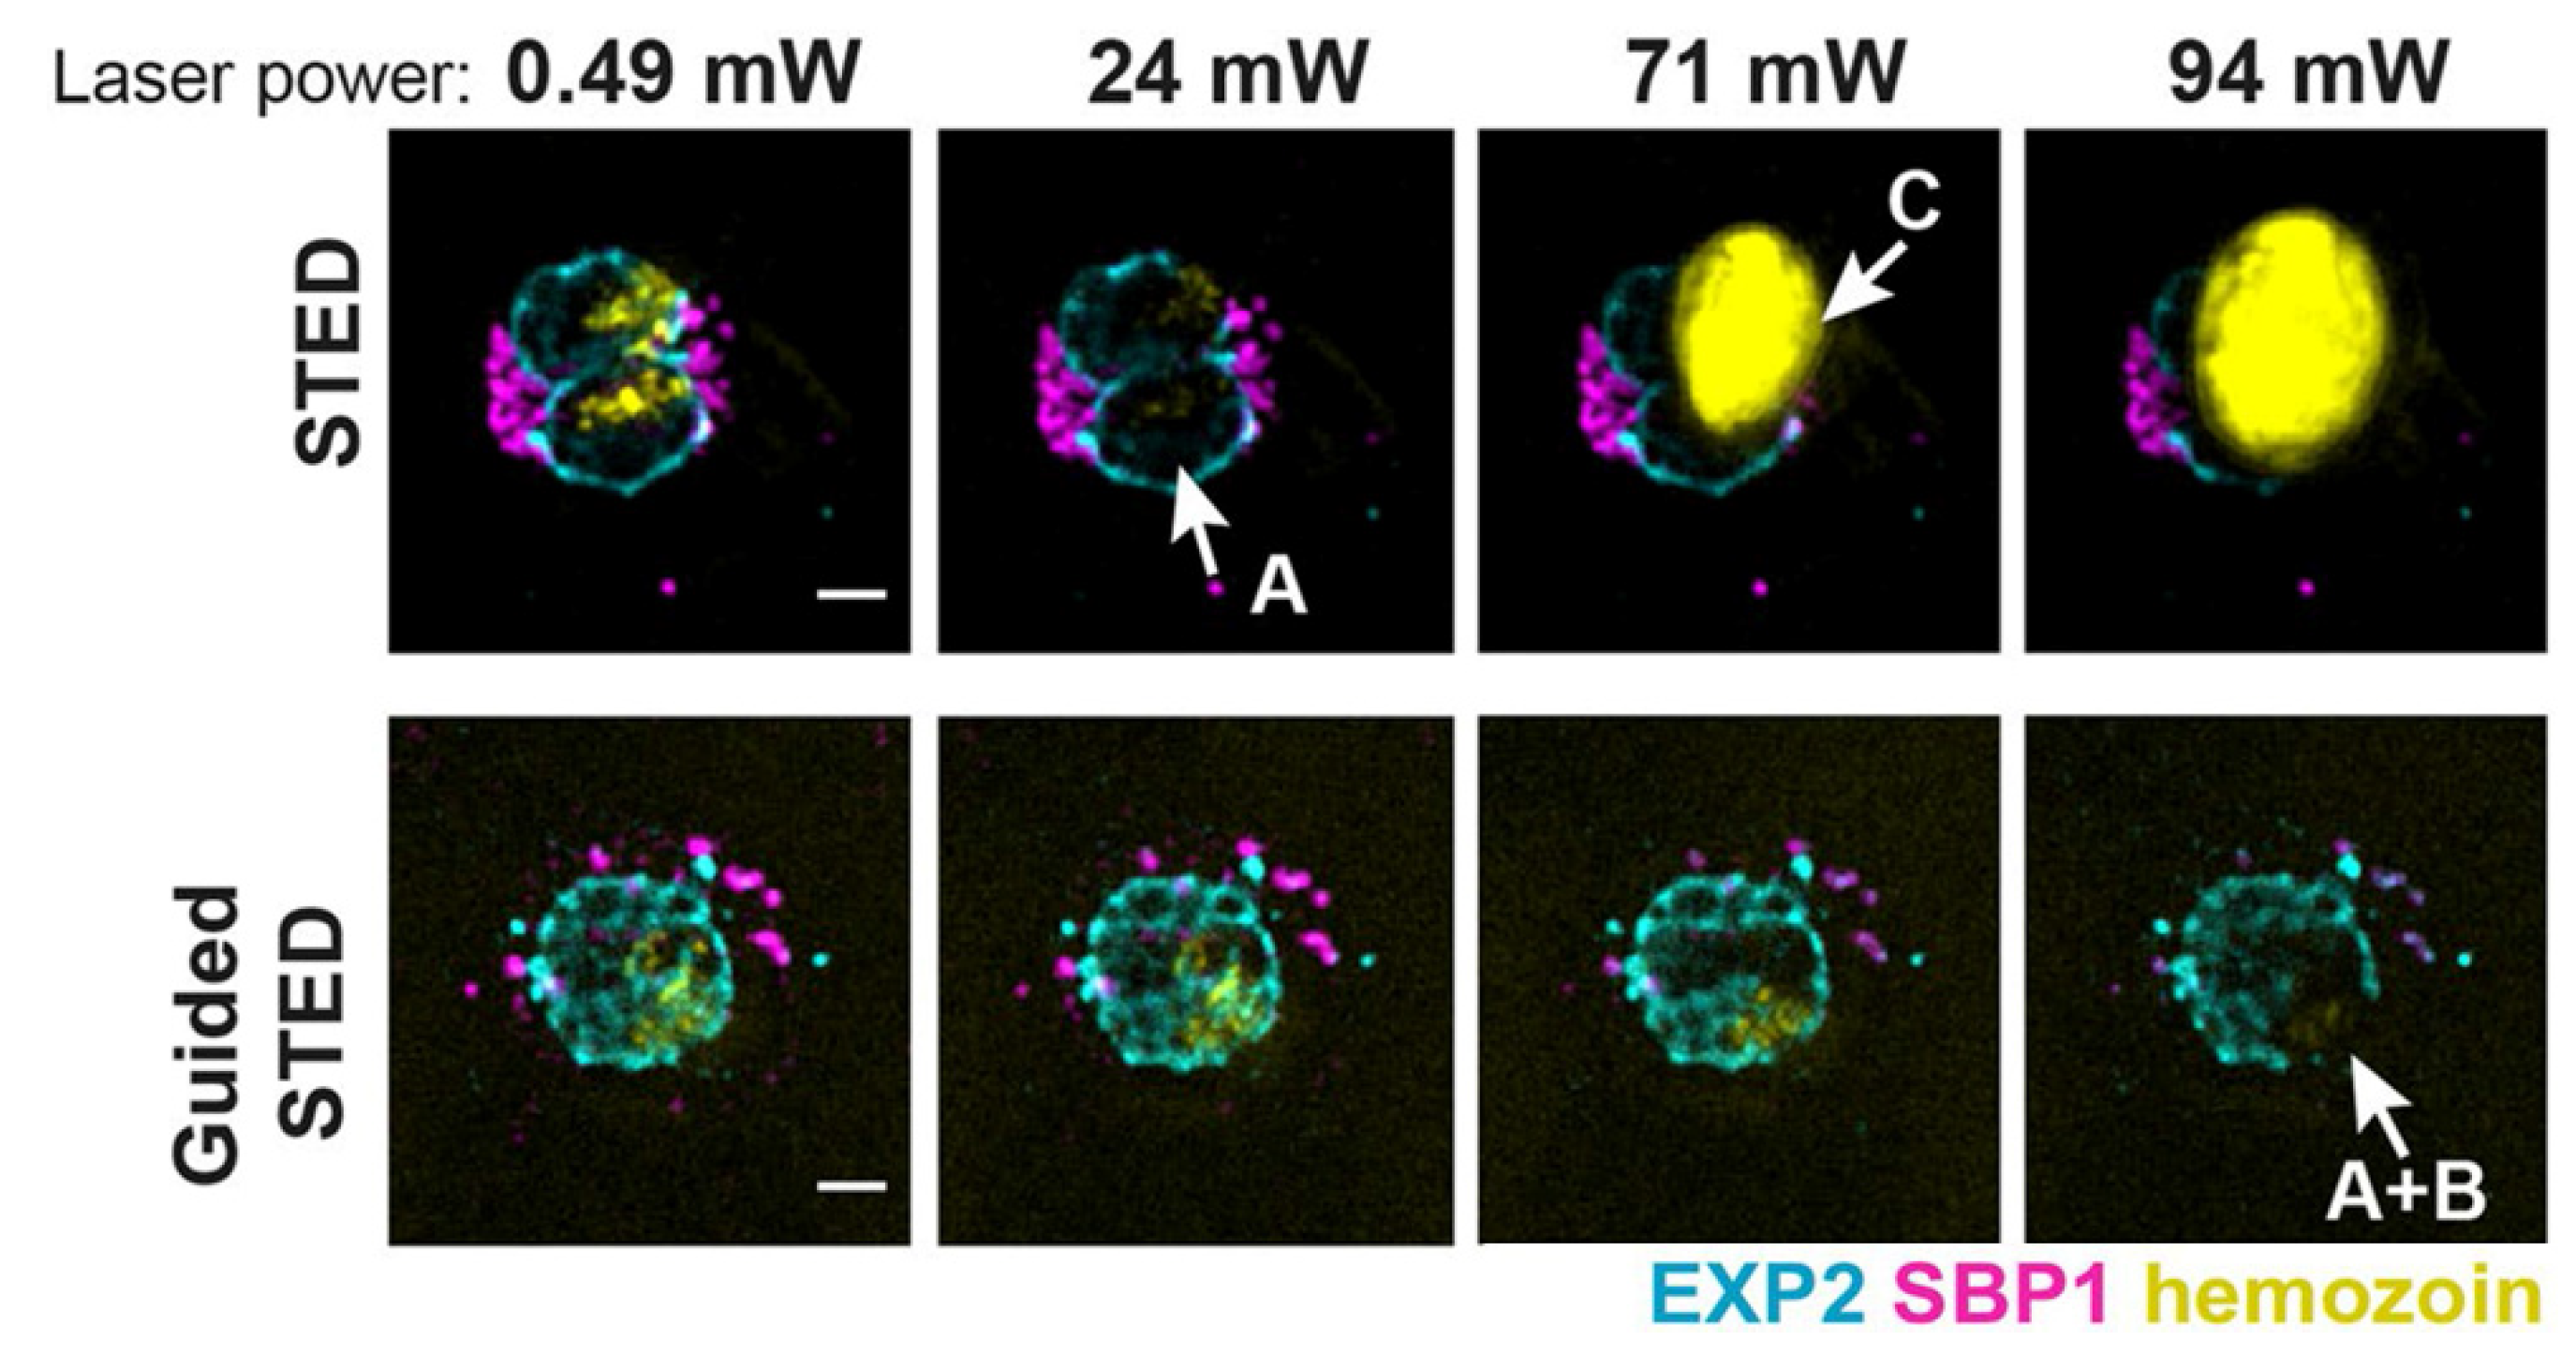
The development of STED microscopy has provided new chances for studying plasmodium falciparum in blood, which is the most deadly of the human malaria parasites [83,84]. Schloetel and coworkers invented guided STED [85], a new STED microscopy based on adaptive illumination, to image the whole life cycle of plasmodium with an unprecedented 35 nm resolution without destroying any surrounding cellular structures (Figure 4). Compared to RESCue STED and DyMIN STED, guided STED uses the reflection signal from hemozoin particles, which are highly reflective and insoluble crystals produced when parasites digest hemoglobin, to identify the most photosensitive regions of the sample. When hemozoin particles are presented in the cell, guided STED can effectively help researchers explore the state of the parasites.
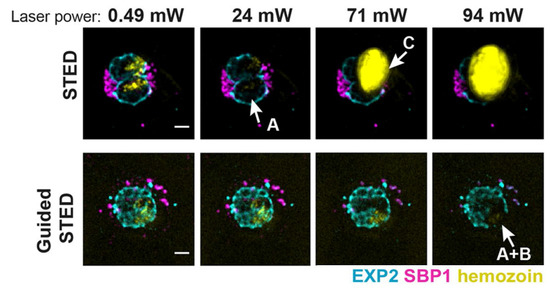
Figure 4.
Sample damage at different laser power in STED and guided STED. Reprinted from [85].
3.3. Structured Illumination Microscopy
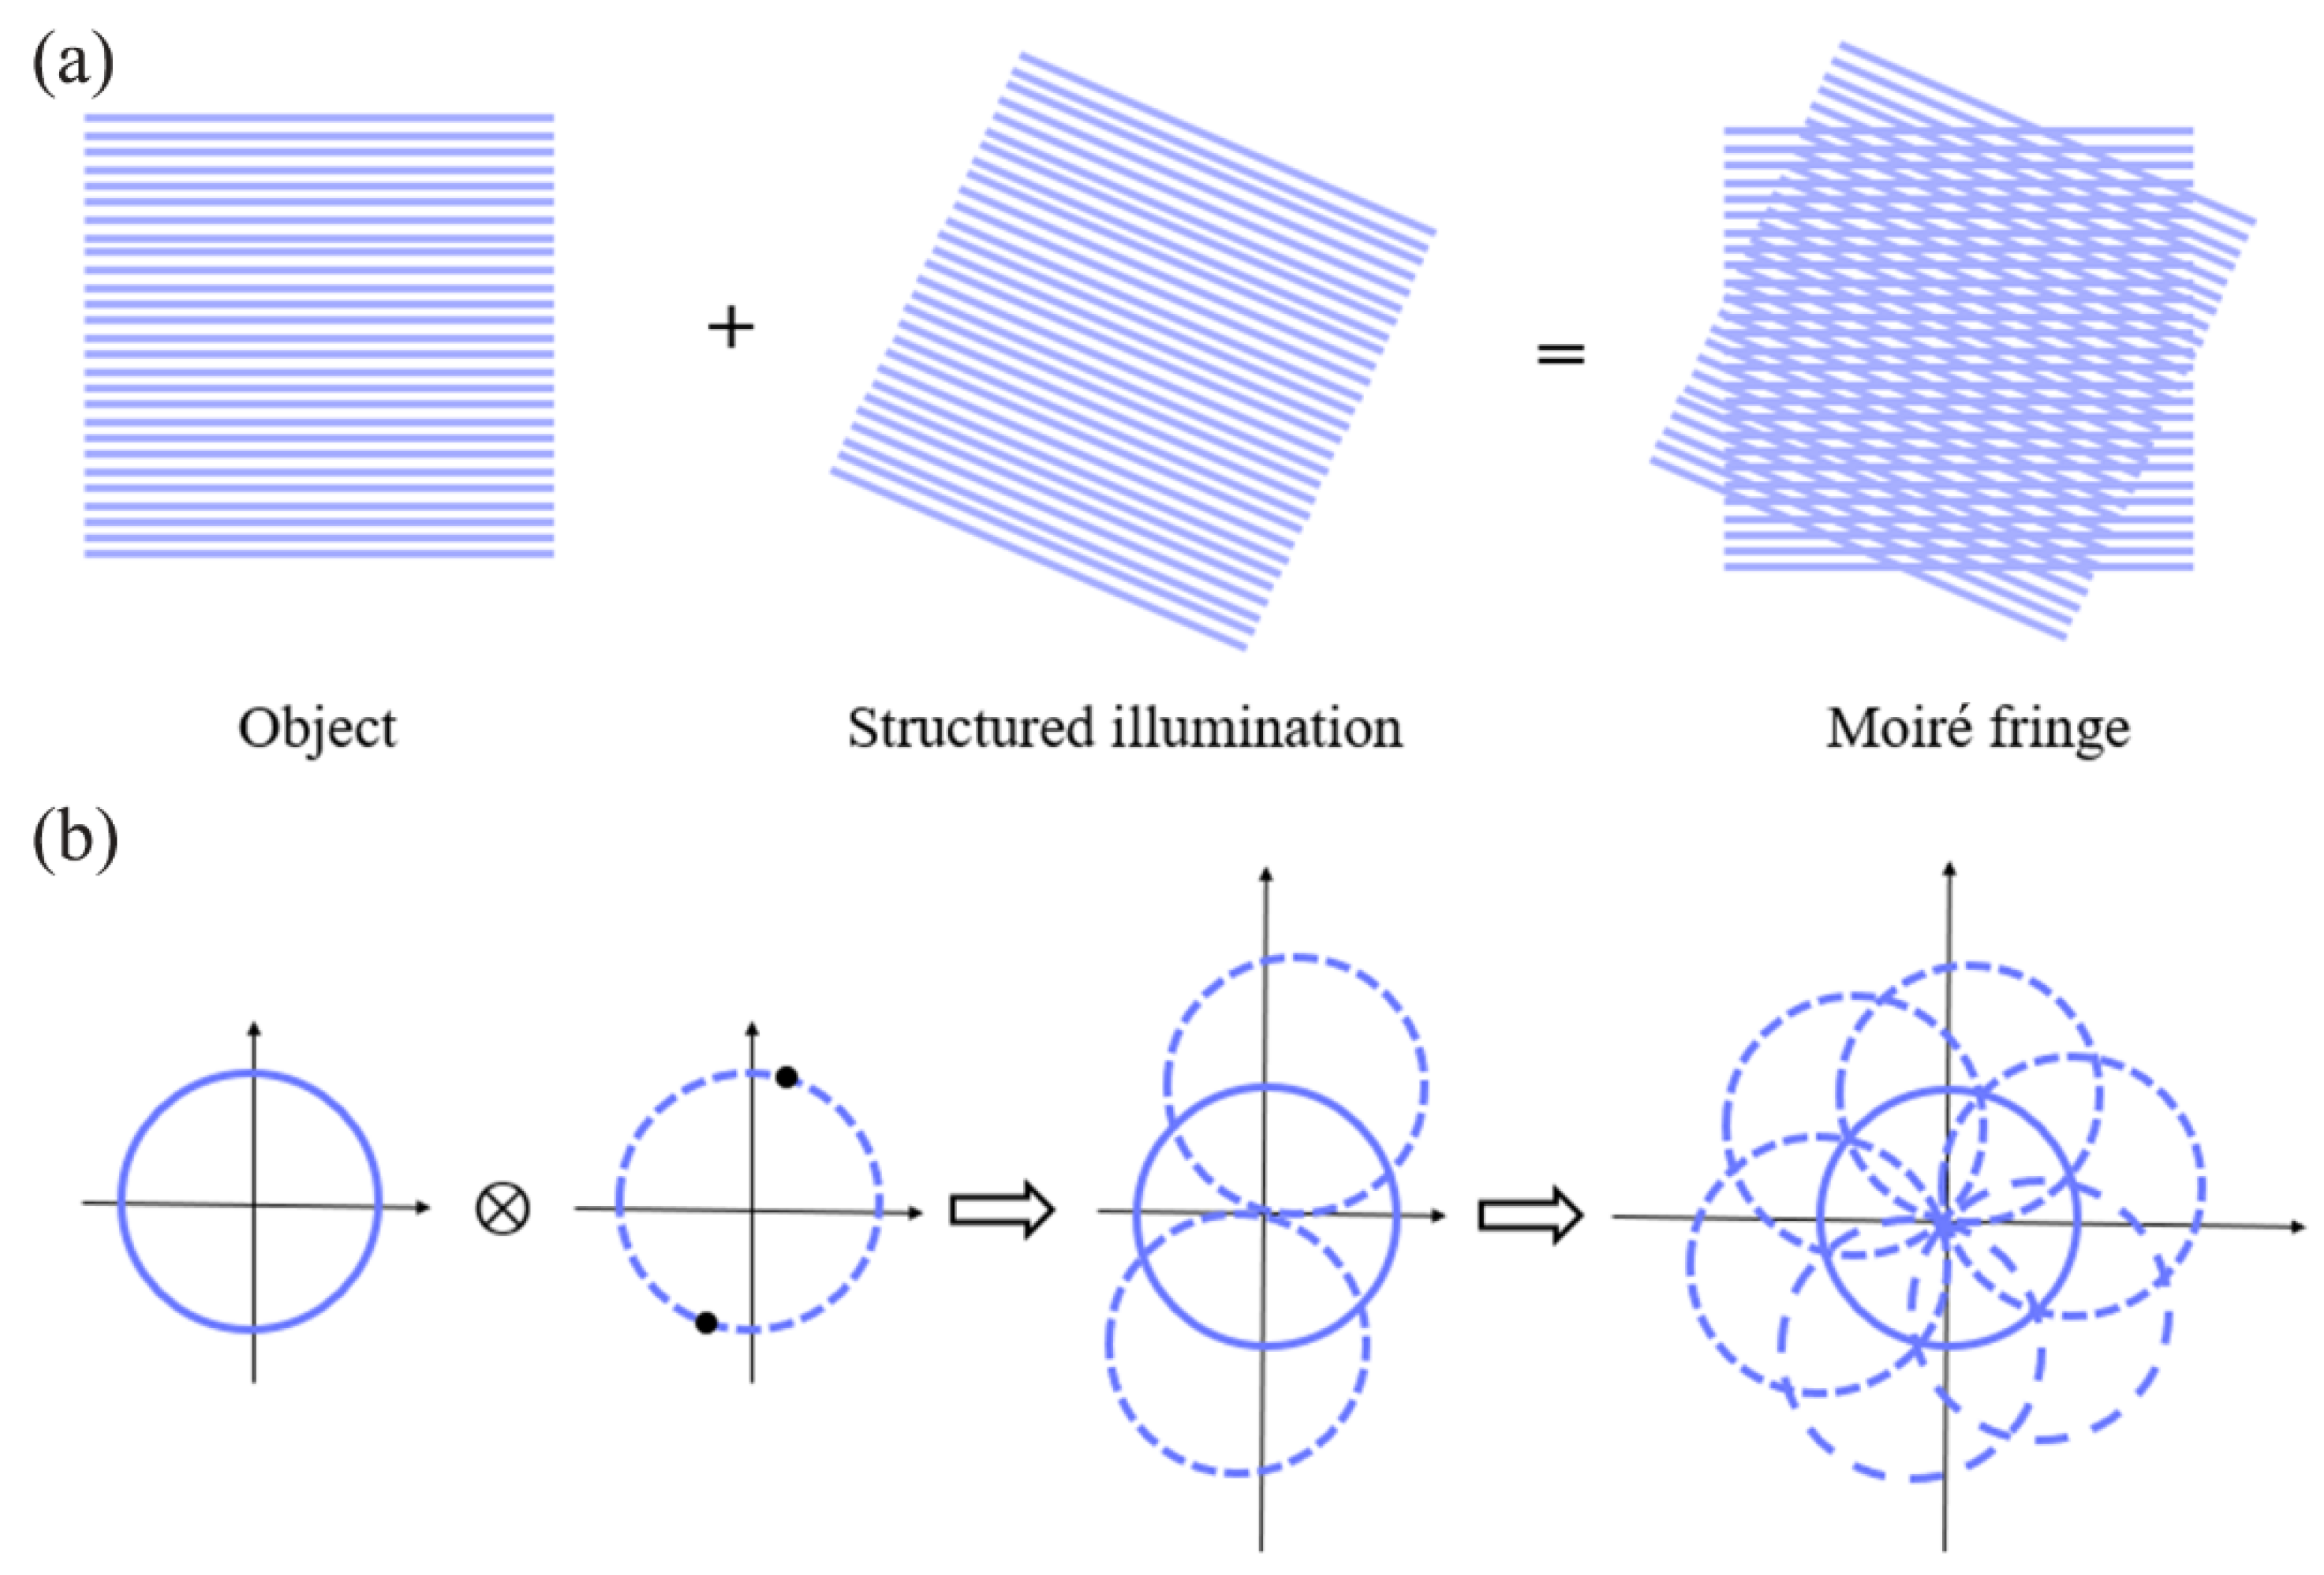
Gustafsson proposed and developed SIM [49], which relies on moiré fringes to transform the high-frequency information (normally invisible in an image) in the sample to a low-pass band (visible in an image) (Figure 5). Unlike SMLM, which requires tens of thousands of original frames to reconstruct a super-resolution image, SIM requires only several original images to reconstruct a super-resolution image, and thus greatly improves the time for resolution [86]. In addition, SIM requires a significantly lower light intensity than SMLM and STED microscopy, and thus enables long-term imaging of live samples.
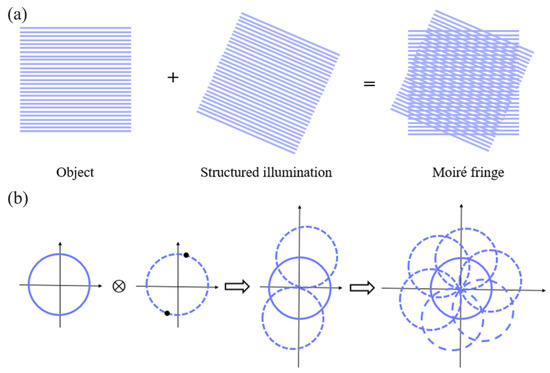
Figure 5.
Schematic diagram of SIM principle: (a) generation of moiré fringes; (b) implementation of two-dimensional spatial frequency expansion.
Typically, the lateral resolution of SIM is about 100 nm and the axial resolution is about 300 nm [87]. However, 3D-SIM with two-objective detection allowed for better axial resolution, and achieved an isotropic resolution of ~100 nm [88]. It is worth mentioning that SIM is compatible with many common fluorophores, which have been used for a long time in wide-field fluorescence microscopy and confocal microscopy [89]. For multicolor SIM, Fiolka and coworkers realized two-color imaging of living cells with 120 nm spatial resolution and 8.5 s temporal resolution [90].
SIM realizes a balance of resolution and biocompatibility: the resolution of conventional optical microscopy is usually too low to study subcellular structures or organelles, while electron microscopy is not suitable for studying dynamics in living cells. Due to these advantages, SIM has been recognized as the first choice for long-term in vivo imaging of cell samples.
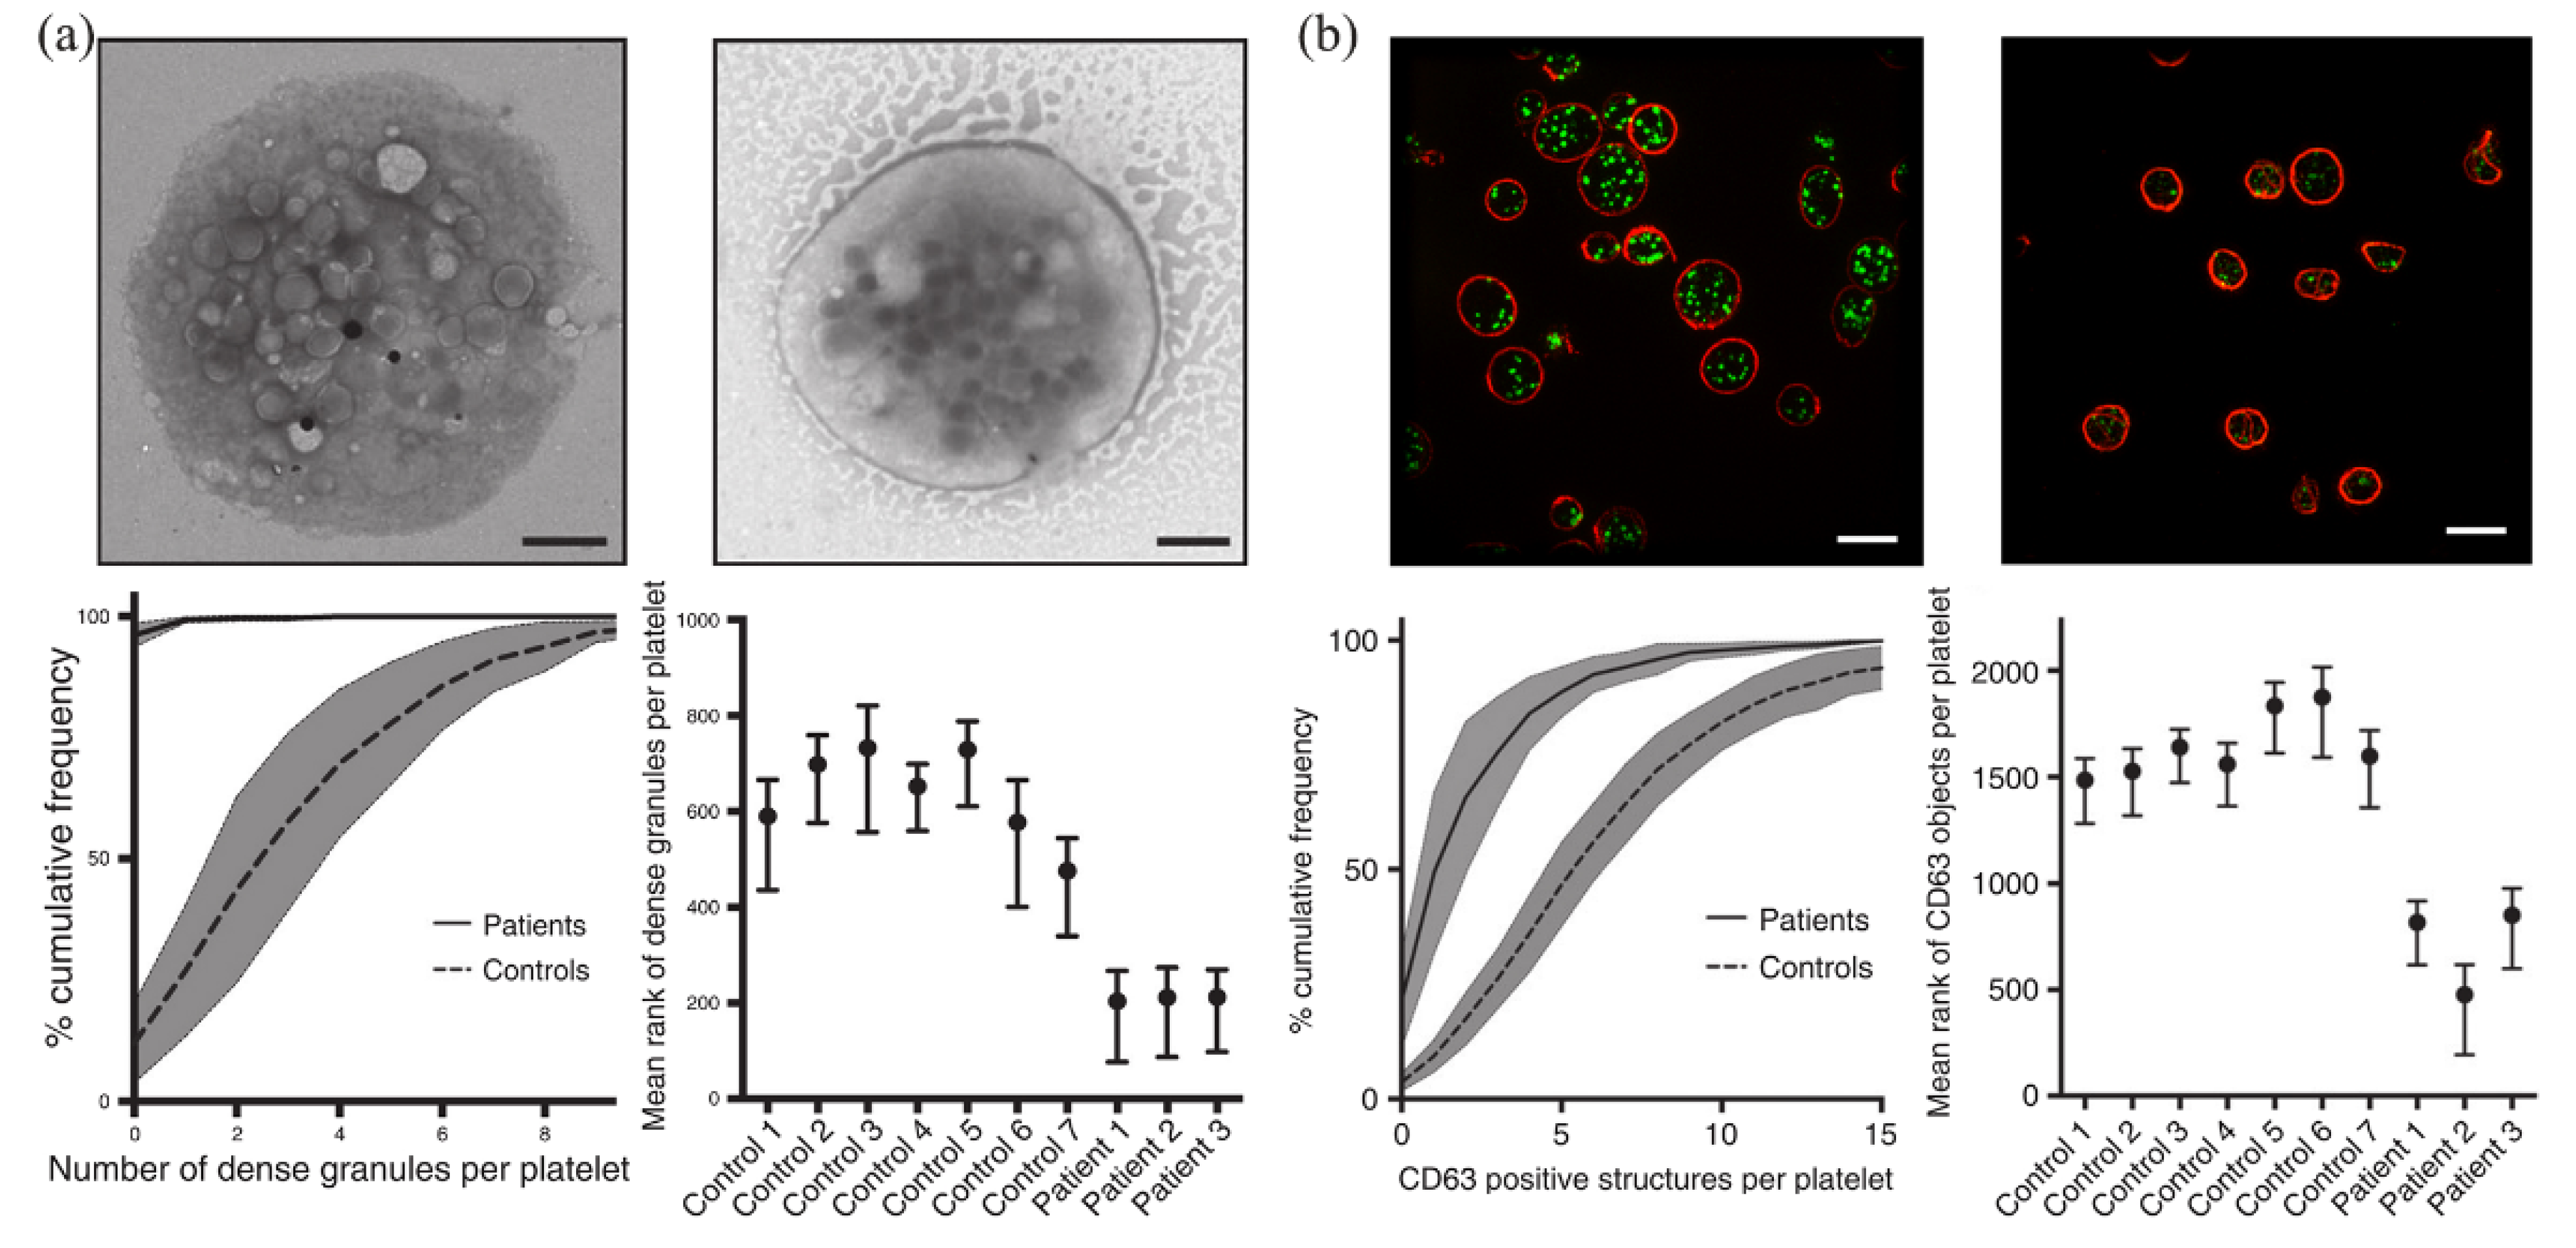
SIM has been widely used to diagnose platelet granule deficiency disorders. Platelets contain various types of granules, such as α-granules, λ-granules, and dense granules. Dense-granule defects lead to an impaired clotting response. Knight and coworkers used SIM to image dense granules, and found that SIM could detect platelet granule deficiency at a speed tens of times faster than that of electron microscopy analysis [91,92]. The analysis of dense granules on 1008 platelets using TEM took 6 hours, while the detection of CD63 (a marker for dense granule) on 2812 platelets using SIM took less than 5% of the time (that is, ~18 min) (Figure 6). In addition, the blood volume required in SIM was reduced to less than 1 mL. Using acupuncture samples, SIM analysis could even be further reduced to less than the 1 mL volume level that is typically used in flow cytometer. For another example, Swinkels and coworkers developed a platform for quantitative analysis of platelets using SIM [93]. They used SIM to image blood samples from patients with von Willebrand’s disease (VWD), isolated individual α-granules and dense granules in platelets, and reconstructed and analyzed the samples with Zen software [94] and the ImageJ plugin. They revealed that the key mechanism of VWD was the inability of VWD patients carrying the C1190R mutation to assemble the von Willebrand factor into α-granules.
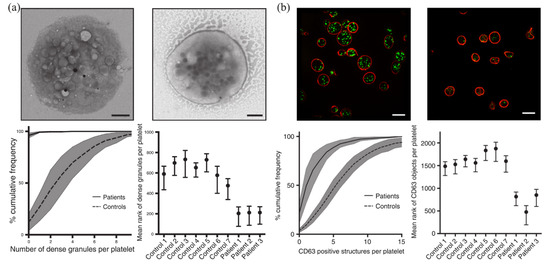
Figure 6.
Detection and analysis of dense granules in platelets using EM (a) and SIM (b). Reprinted from [91].
In summary, we can confidently conclude that, for diagnosing platelet granule deficiency syndromes, SIM provides a superb performance that exceeds traditional tools such as electron microscopy and flow cytometry. However, researchers are still not satisfied with the spatial resolution of SIM, and have been pursuing further improvements in its spatial resolution without sacrificing its capability in live cell imaging. Instead of relying on free-space optics, photonic-chip SIM (cSIM) utilizes a photonic chip to generate the desired light pattern to illuminate the sample, which is beneficial to producing uniform and stable illumination patterns [95]. At the same time, high-refractive-index silicon nitride waveguides improve the spatial resolution by 2.3 times when compared to traditional SIM. As such, cSIM is better for super-resolution imaging over a large field of view. On the other hand, grazing incidence SIM (GI-SIM) overcomes the imaging depth limitation of TIRF-SIM [96]. GI-SIM confines light closer to the critical angle, and produces a thin illumination layer that matches the depth of focus of a high numerical aperture objective, thus achieving the goal of illuminating the entire volume of the basal cell cortex. Compared to conventional SIM, GI-SIM achieves a sample depth that is ~10 times thicker, and obtains fluorescence signals that are 10 times stronger. GI-SIM enables fast (266 frames/s) and high-resolution (97 nm) super-resolution imaging of living cells, and provides a new way to resolve cellular organelles and their interactions in cells.
3.4. Fusion of Deep Learning and SRM
Technological advances in artificial intelligence and machine learning have opened up new opportunities for SRM. A technique called DL-SIM combines SIM with deep learning, and reconstructs a super-resolution image with only three original images under very low light (at least 100× photon reduction), thus greatly reducing the acquisition time and photobleaching [97]. A deep-learning-based upgrade of PALM, called ANNA-PLAM, can achieve super-resolution imaging of >1000 cells in ~3 h, thus alleviating the incompatibility between high resolution and high throughput [98].
Super-resolution images contain rich biochemical information. Deep learning provides good opportunities to accurately interpret such information through mining and learning the images [99]. In recent years, deep learning has been combined with SRM to investigate biomedical questions [100]. However, currently, there is still a lack of research on the application of deep-learning-based SRM in blood cell analysis. We believe that the situation could be improved soon after collecting extensive, accurate, and high-quality image datasets of blood cells and related diseases, which are necessary for the algorithm adjustment and training in deep learning.
Table 4 presents representative technological achievements in the field of SRM, with notes summarizing the advantages and disadvantages of each technique.

Table 4.
Comparing the advantages and disadvantages of representative SRM methods.
4. Other New Approaches
In recent years, other approaches to blood cell analysis have also been developed, including, but not limited to, Raman microscopy, phase microscopy, atomic force microscopy (AFM), super-resolution optical fluctuation imaging (SOFI), real-time quantitative polymerase chain reaction (qPCR), and HemoScreen analysis.
Raman microscopy is a noninvasive, label-free technique that uses the inelastic scattering of light to provide unique biochemical information. Raman microscopy combined with multivariate statistical analysis can detect blood hemozoin in patients with malaria [101], identify small hemoglobin changes in patients with sickle cell anemia [102], and classify leukocyte subtypes in blood [103]. However, because a Raman cross section is typically six orders of magnitude smaller than the absorption cross section, Raman scattering signal is weak and the acquisition time is long (0.5–10 s per spectrum), making it unsuitable for high-throughput clinical analysis [104].
Phase microscopy uses the amplitude and phase changes that are produced by light passing through transparent samples to achieve fast, nondestructive, and high-dimensional imaging of unlabeled samples. Currently, phase microscopy combined with machine learning can accurately classify leukocyte subpopulations [105], and screen erythrocyte-related diseases [106]. However, phase microscopy is susceptible to environmental perturbations that degrade the image quality.
AFM uses a microcantilever with a probe to scan the surface of a sample. Using the deflection or vibration of the microcantilever, the morphology or mechanical properties of the surface can be characterized. AFM provides a horizontal resolution of ~0.1 nm and a vertical resolution of ~0.01 nm, but lacks specificity [107]. Currently, AFM is often used to study the morphological changes in pathological red blood cells and the structural changes in red blood cell membranes [108,109,110]. It is worth mentioning that a combined imaging using AFM and SMLM can offer enriched spatial information on a sample. This combination is currently used to study the distribution pattern and relationship between different proteins [111,112].
SOFI relies on the high-order statistical analysis of real-time fluorescence signals, which are used to distinguish different single molecules [113]. SOFI uses a shorter acquisition time and a lower laser intensity to achieve super-resolution imaging; it has realized simultaneous three-color super-resolved imaging of living cells, and is suitable for studying the dynamic process of living cells [114]. For example, some researchers explored the function of microvilli in T-lymphocyte activation by SOFI [115]. However, the resolution of SOFI was limited by the complex high-order moment calculations, with a lateral resolution of ~100 nm and an axial resolution of 500 nm [116].
qPCR analysis has significant equivalence with flow cytometry, allowing analysis of human leukocyte subpopulations and immune cell counts [117]. qPCR expands the ability to screen immunodeficiency, and has no special requirements for blood-preservation conditions.
HemoScreen analysis is based on machine vision and artificial intelligence, and can be used for a complete blood cell count [118]. HemoScreen analysis provides a good correlation with that of a hematology analyzer. Due to its small size, convenient carrying, and ease of use, HemoScreen analysis is most suitable for building mobile laboratory or community health stations, or use in remote areas.
5. Conclusions and Prospects
This review first described traditional approaches to blood cell analysis. Manual microscopic examination, the most popular approach, has a high accuracy, but cannot be used to observe intracellular ultrastructure and organelle interactions. Electron microscopy provides a higher resolution, but has difficulty in measuring dynamic information in live cell samples. Flow cytometry provides high throughput in cell analysis and screening, but the detection sensitivity is not high enough to detect a low number of single antigens (that is, less than 1000 antigen/cell). Hematology analyzers have improved detection speed, but the detection accuracy is not high.
Compared with traditional blood cell analysis approaches, SRM has advantages in imaging speed, spatial resolution, and biocompatibility. However, the performance and imaging modality of current SRM techniques are still not fully optimized. There is still a lot of room for technology development; for example, in real-time imaging, 3D imaging, thick-sample imaging, and multicolor imaging. A major bottleneck in SRM is 3D imaging of thick samples, which offers great potential to enable super-resolution pathology of tissues and large cells (e.g., megakaryocytes). Nowadays, although SRM technology is not yet popularly used in clinical laboratories, with continuous development and improvement in SRM technologies, we believe that SRM will become a powerful tool in blood cell analysis, and surely gain popularity in diagnosing hematological diseases.
Author Contributions
Writing—original draft preparation, Z.T. and Y.W.; investigation, Y.Y.; funding acquisition, project administration, writing—review and editing, Z.-L.H. and F.Z. All authors have read and agreed to the published version of the manuscript.
Funding
This research was funded by the Start-up Fund from Hainan University (KYQD(ZR)-20077) and the Innovation Fund of WNLO (2018WNLOKF023).
Institutional Review Board Statement
Not applicable.
Informed Consent Statement
Not applicable.
Data Availability Statement
Data underlying the results presented in this paper are not publicly available at this time, but may be obtained from the authors upon reasonable request.
Conflicts of Interest
The authors have no conflict of interest to declare.
Ethical Statements
This research did not involve human subjects.
References
- Shang, Y.; Guan, H.; Zhou, F. Biological characteristics of umbilical cord mesenchymal stem cells and its therapeutic potential for hematological disorders. Front. Cell Dev. Biol. 2021, 9, 570179. [Google Scholar] [CrossRef] [PubMed]
- Chen, P.; Du, Z.L.; Wang, J.F.; Liu, Y.; Zhang, J.; Liu, D.H. A bibliometric analysis of the research on hematological tumor microenvironment. Ann. Transl. Med. 2021, 9, 1337. [Google Scholar] [CrossRef] [PubMed]
- Pfeffer, N.; Laws, S. It’s only a blood test: What people know and think about venepuncture and blood. Soc. Sci. Med. 2006, 62, 3011–3023. [Google Scholar] [CrossRef] [PubMed]
- Mach, A.J.; Adeyiga, O.B.; Di Carlo, D. Microfluidic sample preparation for diagnostic cytopathology. Lab Chip. 2013, 13, 1011–1026. [Google Scholar] [CrossRef] [Green Version]
- Gulati, G.; Song, J.M.; Florea, A.D.; Gong, J. Purpose and criteria for blood smear scan, blood smear examination, and blood smear review. Ann. Lab. Med. 2013, 33, 1–7. [Google Scholar] [CrossRef] [Green Version]
- Li, X.; Chen, W.Q.; Li, Z.D.; Li, L.; Gu, H.C.; Fu, J.P. Emerging microengineered tools for functional analysis and phenotyping of blood cells. Trends Biotechnol. 2014, 32, 586–594. [Google Scholar] [CrossRef] [Green Version]
- Richter, V.; Lanzerstorfer, P.; Weghuber, J.; Schneckenburger, H. Probing small distances in live cell imaging. Photonics 2021, 8, 176. [Google Scholar] [CrossRef]
- Lelek, M.; Gyparaki, M.T.; Beliu, G.; Schueder, F.; Griffié, J.; Manley, S.; Jungmann, R.; Sauer, M.; Lakadamyali, M.; Zimmer, C. Single-molecule localization microscopy. Nat. Rev. Methods Primers 2021, 1, 39. [Google Scholar] [CrossRef]
- Schermelleh, L.; Ferrand, A.; Huser, T.; Eggeling, C.; Sauer, M.; Biehlmaier, O.; Drummen, G.P.C. Super-resolution microscopy demystified. Nat. Cell Biol. 2019, 21, 72–84. [Google Scholar] [CrossRef]
- White, J.G. Use of the electron microscope for diagnosis of platelet disorders. Semin. Thromb. Hemost. 1998, 24, 163–168. [Google Scholar] [CrossRef]
- Sauer, M.; Heilemann, M. Single-molecule localization microscopy in eukaryotes. Chem. Rev. 2017, 117, 7478–7509. [Google Scholar] [CrossRef] [PubMed]
- Baum, J.; Richard, D.; Riglar, D.T. Malaria parasite invasion: Achieving superb resolution. Cell Host Microbe 2017, 21, 294–296. [Google Scholar] [CrossRef] [PubMed] [Green Version]
- Shin, E.K.; Park, H.; Noh, J.Y.; Lim, K.M.; Chung, J.H. Platelet shape changes and cytoskeleton dynamics as novel therapeutic targets for anti-thrombotic drugs. Biomol. Ther. 2017, 25, 223–230. [Google Scholar] [CrossRef] [PubMed] [Green Version]
- Möckl, L.; Moerner, W.E. Super-resolution microscopy with single molecules in biology and beyond-essentials, current trends, and future challenges. J. Am. Chem. Soc. 2020, 142, 17828–17844. [Google Scholar] [CrossRef]
- Jacquemet, G.; Carisey, A.F.; Hamidi, H.; Henriques, R.; Leterrier, C. The cell biologist’s guide to super-resolution microscopy. J. Cell Sci. 2020, 133, jcs240713. [Google Scholar] [CrossRef]
- Zaninetti, C.; Greinacher, A. Diagnosis of inherited platelet disorders on a blood smear. J. Clin. Med. 2020, 9, 539. [Google Scholar] [CrossRef] [Green Version]
- Gitta, B.; Kilian, N. Diagnosis of malaria parasites plasmodium spp. in endemic areas: Current strategies for an ancient disease. Bioessays 2020, 42, 1900138. [Google Scholar] [CrossRef] [Green Version]
- Hallek, M. Chronic lymphocytic leukemia: 2017 update on diagnosis, risk stratification, and treatment. Am. J. Hematol. 2017, 92, 946–965. [Google Scholar] [CrossRef]
- Mitra, A.; Dwyre, D.M.; Schivo, M.; Thompson III, G.R.; Cohen, S.H.; Ku, N.; Graff, J.P. Leukoerythroblastic reaction in a patient with COVID-19 infection. Am. J. Hematol. 2020, 95, 999–1000. [Google Scholar] [CrossRef] [Green Version]
- Alzubaidi, L.; Fadhel, M.A.; Al-Shamma, O.; Zhang, J.; Duan, Y. Deep learning models for classification of red blood cells in microscopy images to aid in sickle cell anemia diagnosis. Electronics 2020, 9, 427. [Google Scholar] [CrossRef] [Green Version]
- Acharya, V.; Kumar, P. Detection of acute lymphoblastic leukemia using image segmentation and data mining algorithms. Med. Biol. Eng. Comput. 2019, 57, 1783–1811. [Google Scholar] [CrossRef] [PubMed]
- Umer, M.; Sadiq, S.; Ahmad, M.; Ullah, S.; Choi, G.S.; Mehmood, A. A novel stacked CNN for malarial parasite detection in thin blood smear images. IEEE Access 2020, 8, 93782–93792. [Google Scholar] [CrossRef]
- Tomaiuolo, M.; Litvinov, R.I.; Weisel, J.W.; Stalker, T.J. Use of electron microscopy to study platelets and thrombi. Platelets 2020, 31, 580–588. [Google Scholar] [CrossRef] [PubMed]
- Scandola, C.; Erhardt, M.; Rinckel, J.Y.; Proamer, F.; Gachet, C.; Eckly, A. Use of electron microscopy to study megakaryocytes. Platelets 2020, 31, 589–598. [Google Scholar] [CrossRef]
- Adan, A.; Alizada, G.; Kiraz, Y.; Baran, Y.; Nalbant, A. Flow cytometry: Basic principles and applications. Crit. Rev. Biotechnol. 2017, 37, 163–176. [Google Scholar] [CrossRef]
- Jiang, N.G.; Jin, Y.M.; Niu, Q.; Zeng, T.T.; Su, J.; Zhu, H.L. Flow cytometric immunophenotyping is of great value to diagnosis of natural killer cell neoplasms involving bone marrow and peripheral blood. Ann. Hematol. 2013, 92, 89–96. [Google Scholar] [CrossRef]
- Sorigue, M.; Cañamero, E.; Miljkovic, M.D. Systematic review of staging bone marrow involvement in B cell lymphoma by flow cytometry. Blood Rev. 2021, 47, 100778. [Google Scholar] [CrossRef]
- Paiva, B.; Puig, N.; Cedena, M.T.; Rosinol, L.; Cordón, L.; Vidriales, M.B.; Burgos, L.; Flores-Montero, J.; Sanoja-Flores, L.; Lopez-Anglada, L.; et al. Measurable residual disease by next-generation flow cytometry in multiple myeloma. J. Clin. Oncol. 2020, 38, 784–792. [Google Scholar] [CrossRef]
- Van Asten, I.; Schutgens, R.E.G.; Baaij, M.; Zandstra, J.; Roest, M.; Pasterkamp, G.; Huisman, A.; Korporaal, S.J.A.; Urbanus, R.T. Validation of flow cytometric analysis of platelet function in patients with a suspected platelet function defect. J. Thromb. Haemost. 2018, 16, 689–698. [Google Scholar] [CrossRef] [Green Version]
- Hwang, K.; Park, C.J.; Jang, S.; Chi, H.S.; Kim, D.Y.; Lee, J.H.; Lee, J.H.; Lee, K.H.; Im, H.J.; Seo, J.J. Flow cytometric quantification and immunophenotyping of leukemic stem cells in acute myeloid leukemia. Ann. Hematol. 2012, 91, 1541–1546. [Google Scholar] [CrossRef]
- Robinson, J.P. Spectral flow cytometry-quo vadimus? Cytom. Part A 2019, 95, 823–824. [Google Scholar] [CrossRef] [PubMed] [Green Version]
- Spitzer, M.H.; Nolan, G.P. Mass cytometry: Single cells, many features. Cell 2016, 165, 780–791. [Google Scholar] [CrossRef] [PubMed] [Green Version]
- Bendall, S.C.; Nolan, G.P.; Roederer, M.; Chattopadhyay, P.K. A deep profiler’s guide to cytometry. Trends Immunol. 2012, 33, 323–332. [Google Scholar] [CrossRef] [PubMed] [Green Version]
- Doan, M.; Vorobjev, I.; Rees, P.; Filby, A.; Wolkenhauer, O.; Goldfeld, A.E.; Lieberman, J.; Barteneva, N.; Carpenter, A.E.; Hennig, H. Diagnostic potential of imaging flow cytometry. Trends Biotechnol. 2018, 36, 649–652. [Google Scholar] [CrossRef] [PubMed] [Green Version]
- Han, Y.; Gu, Y.; Zhang, A.C.; Lo, Y.H. Review: Imaging technologies for flow cytometry. Lab Chip. 2016, 16, 4639–4647. [Google Scholar] [CrossRef] [PubMed]
- Saeys, Y.; Van Gassen, S.; Lambrecht, B.N. Computational flow cytometry: Helping to make sense of high-dimensional immunology data. Nat. Rev. Immunol. 2016, 16, 449–462. [Google Scholar] [CrossRef]
- Honrado, C.; Ciuffreda, L.; Spencer, D.; Ranford-Cartwright, L.; Morgan, H. Dielectric characterization of plasmodium falciparum-infected red blood cells using microfluidic impedance cytometry. J. R. Soc. Interface 2018, 15, 20180416. [Google Scholar] [CrossRef] [Green Version]
- Gong, Y.; Fan, N.; Yang, X.; Peng, B.; Jiang, H. New advances in microfluidic flow cytometry. Electrophoresis 2019, 40, 1212–1229. [Google Scholar] [CrossRef]
- Zola, H. High-sensitivity immunofluorescence/flow cytometry: Detection of cytokine receptors and other low-abundance membrane molecules. Curr. Protoc. Cytom. 2004, 30, 6.3.1–6.3.13. [Google Scholar] [CrossRef]
- Nerreter, T.; Letschert, S.; Götz, R.; Doose, S.; Danhof, S.; Einsele, H.; Sauer, M.; Hudecek, M. Super-resolution microscopy reveals ultra-low CD19 expression on myeloma cells that triggers elimination by CD19 CAR-T. Nat. Commun. 2019, 10, 3137. [Google Scholar] [CrossRef]
- Garfall, A.L.; Fraietta, J.A.; Maus, M.V. Immunotherapy with chimeric antigen receptors for multiple myeloma. Discov. Med. 2014, 17, 37–46. [Google Scholar] [PubMed]
- Vembadi, A.; Menachery, A.; Qasaimeh, M.A. Cell cytometry: Review and perspective on biotechnological advances. Front. Bioeng. Biotechnol. 2019, 7, 147. [Google Scholar] [CrossRef] [PubMed]
- Vergnolle, I.; Allou, K.; Lacombe, F.; Mahon, F.X.; Vial, J.P. Verification of a quantitative method: Complete blood count by flow cytometry, the HematoFlowTM system (Beckman Coulter). Ann. Biol. Clin. 2016, 74, 617–631. [Google Scholar] [CrossRef] [PubMed]
- Khan, A.O.; Pike, J.A. Super-resolution imaging and quantification of megakaryocytes and platelets. Platelets 2020, 31, 559–569. [Google Scholar] [CrossRef] [PubMed]
- Thomas, S.G.; Poulter, N.S. Seeing is believing: Use of advanced imaging to study platelets and megakaryocytes. Platelets 2020, 31, 549–550. [Google Scholar] [CrossRef]
- Betzig, E.; Patterson, G.H.; Sougrat, R.; Lindwasser, O.W.; Olenych, S.; Bonifacino, J.S.; Davidson, M.W.; Lippincott-Schwartz, J.; Hess, H.F. Imaging intracellular fluorescent proteins at nanometer resolution. Science 2006, 313, 1642–1645. [Google Scholar] [CrossRef] [Green Version]
- Rust, M.J.; Bates, M.; Zhuang, X.W. Sub-diffraction-limit imaging by stochastic optical reconstruction microscopy (STORM). Nat. Methods 2006, 3, 793–796. [Google Scholar] [CrossRef] [Green Version]
- Hell, S.W.; Wichmann, J. Breaking the diffraction resolution limit by stimulated emission: Stimulated-emission-depletion fluorescence microscopy. Opt. Lett. 1994, 19, 780–782. [Google Scholar] [CrossRef]
- Gustafsson, M.G.L. Surpassing the lateral resolution limit by a factor of two using structured illumination microscopy. J. Microsc. 2000, 198, 82–87. [Google Scholar] [CrossRef] [Green Version]
- Heintzmann, R.; Huser, T. Super-resolution structured illumination microscopy. Chem. Rev. 2017, 117, 13890–13908. [Google Scholar] [CrossRef]
- Vaughan, J.C.; Zhuang, X.W. New fluorescent probes for super-resolution imaging. Nat. Biotechnol. 2011, 29, 880–881. [Google Scholar] [CrossRef] [PubMed] [Green Version]
- Eggeling, C.; Willig, K.I.; Sahl, S.J.; Hell, S.W. Lens-based fluorescence nanoscopy. Q. Rev. Biophys. 2015, 48, 178–243. [Google Scholar] [CrossRef] [PubMed]
- Wu, Y.C.; Shroff, H. Faster, sharper, and deeper: Structured illumination microscopy for biological imaging. Nat. Methods 2018, 15, 1011–1019. [Google Scholar] [CrossRef] [PubMed]
- Attia, A.B.E.; Balasundaram, G.; Moothanchery, M.; Dinish, U.S.; Bi, R.; Ntziachristos, V.; Olivo, M. A review of clinical photoacoustic imaging: Current and future trends. Photoacoustics 2019, 16, 100144. [Google Scholar] [CrossRef]
- Galli, R.; Uckermann, O.; Andresen, E.F.; Geiger, K.D.; Koch, E.; Schackert, G.; Steiner, G.; Kirsch, M. Intrinsic indicator of photodamage during label-free multiphoton microscopy of cells and tissues. PLoS ONE 2014, 9, e110295. [Google Scholar] [CrossRef] [Green Version]
- Thompson, R.E.; Larson, D.R.; Webb, W.W. Precise nanometer localization analysis for individual fluorescent probes. Biophys. J. 2002, 82, 2775–2783. [Google Scholar] [CrossRef] [Green Version]
- Van de Linde, S.; Loeschberger, A.; Klein, T.; Heidbreder, M.; Wolter, S.; Heilemann, M.; Sauer, M. Direct stochastic optical reconstruction microscopy with standard fluorescent probes. Nat. Protoc. 2011, 6, 991–1009. [Google Scholar] [CrossRef]
- Sharonov, A.; Hochstrasser, R.M. Wide-field subdiffraction imaging by accumulated binding of diffusing probes. Proc. Natl. Acad. Sci. USA 2006, 103, 18911–18916. [Google Scholar] [CrossRef] [Green Version]
- Brockman, J.M.; Su, H.; Blanchard, A.T.; Duan, Y.; Meyer, T.; Quach, M.E.; Glazier, R.; Bazrafshan, A.; Bender, R.L.; Kellner, A.V.; et al. Live-cell super-resolved PAINT imaging of piconewton cellular traction forces. Nat. methods 2020, 17, 1018–1024. [Google Scholar] [CrossRef]
- Huang, B.; Wang, W.; Bates, M.; Zhuang, X.W. Three-dimensional super-resolution imaging by stochastic optical reconstruction microscopy. Science 2008, 319, 810–813. [Google Scholar] [CrossRef] [Green Version]
- Huang, F.; Sirinakis, G.; Allgeyer, E.S.; Schroeder, L.K.; Dium, W.C.; Kromann, E.B.; Phan, T.; Rivera-Molina, F.E.; Myers, J.R.; Irnov, I.; et al. Ultra-high resolution 3D imaging of whole cells. Cell 2016, 166, 1028–1040. [Google Scholar] [CrossRef] [PubMed] [Green Version]
- Yan, R.; Moon, S.; Kenny, S.J.; Xu, K. Spectrally resolved and functional super-resolution microscopy via ultrahigh-throughput single-molecule spectroscopy. Accounts Chem. Res. 2018, 51, 697–705. [Google Scholar] [CrossRef] [PubMed]
- Bates, M.; Dempsey, G.T.; Chen, K.H.; Zhuang, X.W. Multicolor super-resolution fluorescence imaging via multi-parameter fluorophore detection. Chemphyschem 2012, 13, 99–107. [Google Scholar] [CrossRef] [PubMed]
- Lubeck, E.; Cai, L. Single-cell systems biology by super-resolution imaging and combinatorial labeling. Nat. methods 2012, 9, 743–748. [Google Scholar] [CrossRef]
- Wang, Y.; Kuang, W.; Shang, M.; Huang, Z.L. Two-color super-resolution localization microscopy via joint encoding of emitter location and color. Opt. Express 2021, 29, 34797–34809. [Google Scholar] [CrossRef]
- Pan, L.; Yan, R.; Li, W.; Xu, K. Super-resolution microscopy reveals the native ultrastructure of the erythrocyte cytoskeleton. Cell Rep. 2018, 22, 1151–1158. [Google Scholar] [CrossRef] [Green Version]
- Wang, F.; Liu, Y.H.; Zhang, T.; Gao, J.; Xu, Y.; Xie, G.Y.; Zhao, W.J.; Wang, H.; Yang, Y.G. Aging-associated changes in CD47 arrangement and interaction with thrombospondin-1 on red blood cells visualized by super-resolution imaging. Aging Cell 2020, 19, e13224. [Google Scholar] [CrossRef]
- Chung, J.; Jeong, D.; Kim, G.H.; Go, S.; Song, J.; Moon, E.; Huh, Y.H.; Kim, D. Super-resolution imaging of platelet-activation process and its quantitative analysis. Sci. Rep. 2021, 11, 10511. [Google Scholar] [CrossRef]
- Samanta, S.; Gong, W.; Li, W.; Sharma, A.; Shim, I.; Zhang, W.; Das, P.; Pan, W.; Liu, L.; Yang, Z.; et al. Organic fluorescent probes for stochastic optical reconstruction microscopy (STORM): Recent highlights. Coord. Chem. Rev. 2019, 380, 17–34. [Google Scholar] [CrossRef]
- Ma, H.Q.; Xu, J.Q.; Liu, Y. WindSTORM: Robust online image processing for high-throughput nanoscopy. Sci. Adv. 2019, 5, eaaw0683. [Google Scholar] [CrossRef] [Green Version]
- Li, L.; Xin, B.; Kuang, W.; Zhou, Z.; Huang, Z.L. Divide and conquer: Real-time maximum likelihood fitting of multiple emitters for super-resolution localization microscopy. Opt. Express 2019, 27, 21029–21049. [Google Scholar] [CrossRef] [PubMed]
- Ovesný, M.; Křížek, P.; Borkovec, J.; Švindrych, Z.K.; Hagen, G.M. ThunderSTORM: A comprehensive ImageJ plug-in for PALM and STORM data analysis and super-resolution imaging. Bioinformatics 2014, 30, 2389–2390. [Google Scholar] [CrossRef] [PubMed]
- Balzarotti, F.; Eilers, Y.; Gwosch, K.C.; Gynna, A.H.; Westphal, V.W.; Stefanl, F.D.; Elf, J.; Hell, S.W. Nanometer resolution imaging and tracking of fluorescent molecules with minimal photon fluxes. Science 2017, 35, 606–612. [Google Scholar] [CrossRef] [PubMed] [Green Version]
- Cnossen, J.; Hinsdale, T.; Thorsen, R.Ø.; Siemons, M.; Schueder, F.; Jungmann, R.; Smith, C.S.; Rieger, B.; Stallinga, S. Localization microscopy at doubled precision with patterned illumination. Nat. Methods 2020, 17, 59–63. [Google Scholar] [CrossRef] [PubMed]
- Vicidomini, G.; Bianchini, P.; Diaspro, A. STED super-resolved microscopy. Nat. Methods 2018, 15, 173–182. [Google Scholar] [CrossRef]
- Li, H.; Ye, S.; Guo, J.; Wang, H.; Yan, W.; Song, J.; Qu, J. Biocompatible carbon dots with low-saturation-intensity and high-photobleaching-resistance for STED nanoscopy imaging of the nucleolus and tunneling nanotubes in living cells. Nano. Res. 2019, 12, 3075–3084. [Google Scholar] [CrossRef]
- Harke, B.; Ullal, C.K.; Keller, J.; Hell, S.W. Three-dimensional nanoscopy of colloidal crystals. Nano Lett. 2008, 8, 1309–1313. [Google Scholar] [CrossRef] [Green Version]
- Rönnlund, D.; Xu, L.; Perols, A.; Gad, A.K.B.; Karlstörm, A.E.; Auer, G.; Widengren, J. Multicolor fluorescence nanoscopy by photobleaching: Concept, verification, and its application to resolve selective storage of proteins in platelets. ACS Nano 2014, 8, 4358–4365. [Google Scholar] [CrossRef] [Green Version]
- Willig, K.I.; Rizzoli, S.O.; Westphal, V.; Jahn, R.; Hell, S.W. STED microscopy reveals that synaptotagmin remains clustered after synaptic vesicle exocytosis. Nature 2006, 440, 935–939. [Google Scholar] [CrossRef]
- Staudt, T.; Engler, A.; Rittweger, E.; Harke, B.; Engelhardt, J.; Hell, S.W. Far-field optical nanoscopy with reduced number of state transition cycles. Opt. Express 2011, 19, 5644–5657. [Google Scholar] [CrossRef]
- Heine, J.; Reuss, M.; Harke, B.; D’Este, E.; Sahl, S.J.; Hell, S.W. Adaptive-illumination STED nanoscopy. Proc. Natl. Acad. Sci. USA 2017, 114, 9797–9802. [Google Scholar] [CrossRef] [PubMed] [Green Version]
- Yu, W.; Ji, Z.; Dong, D.; Yang, X.; Xiao, Y.; Gong, Q.; Xi, P.; Shi, K. Super-resolution deep imaging with hollow bessel beam STED microscopy. Laser Photon. Rev. 2016, 10, 147–152. [Google Scholar] [CrossRef] [Green Version]
- De Niz, M.; Burda, P.C.; Kaiser, C.; Del Portillo, H.A.; Spielmann, T.; Frischknecht, F.; Heussler, V.T. Progress in imaging methods: Insights gained into plasmodium biology. Nat. Rev. Microbiol. 2017, 15, 37–54. [Google Scholar] [CrossRef] [PubMed]
- Mehnert, A.K.; Simon, C.S.; Guizetti, J. Immunofluorescence staining protocol for STED nanoscopy of plasmodium-infected red blood cells. Mol. Biochem. Parasitol. 2019, 229, 47–52. [Google Scholar] [CrossRef] [PubMed]
- Schloetel, J.G.; Heine, J.; Cowman, A.F.; Pasternak, M. Guided STED nanoscopy enables super-resolution imaging of blood stage malaria parasites. Sci. Rep. 2019, 9, 4674. [Google Scholar] [CrossRef]
- Markwirth, A.; Lachetta, M.; Monkemoller, V.; Heintzmann, R.; Hubner, W.; Huser, T.; Muller, M. Video-rate multi-color structured illumination microscopy with simultaneous real-time reconstruction. Nat. Commun. 2019, 10, 4315. [Google Scholar] [CrossRef]
- Gustafsson, M.G.L.; Shao, L.; Carlton, P.M.; Wang, C.J.R.; Golubovskaya, I.N.; Cande, W.Z.; Agard, D.A.; Sedat, J.W. Three-dimensional resolution doubling in wide-field fluorescence microscopy by structured illumination. Biophys. J. 2008, 94, 4957–4970. [Google Scholar] [CrossRef] [Green Version]
- Shao, L.; Isaac, B.; Uzawa, S.; Agard, D.A.; Sedat, J.W.; Gustafsson, M.G.L. I5S: Wide-field light microscopy with 100-nm-scale resolution in three dimensions. Biophys. J. 2008, 94, 4971–4983. [Google Scholar] [CrossRef] [Green Version]
- Hu, S.B.; Yao, R.W.; Chen, L.L. Shedding light on paraspeckle structure by super-resolution microscopy. J. Cell Biol. 2016, 214, 789–791. [Google Scholar] [CrossRef]
- Fiolka, R.; Shao, L.; Rego, E.H. Gustafsson, M.G.L. Time-lapse two-color 3D imaging of live cells with doubled resolution using structured illumination. Proc. Natl. Acad. Sci. USA 2012, 109, 5311–5315. [Google Scholar] [CrossRef] [Green Version]
- Westmoreland, D.; Shaw, M.; Grimes, W.; Metcalf, D.J.; Burden, J.J.; Gomez, K.; Knight, A.E.; Cutler, D.F. Super-resolution microscopy as a potential approach to diagnosis of platelet granule disorders. J. Thromb. Haemost. 2016, 14, 839–849. [Google Scholar] [CrossRef] [PubMed]
- Knight, A.E.; Gomez, K.; Cutler, D.F. Super-resolution microscopy in the diagnosis of platelet granule disorders. Expert Rev. Hematol. 2017, 10, 375–381. [Google Scholar] [CrossRef] [PubMed]
- Swinkels, M.; Slotman, J.A.; Leebeek, F.W.G.; Voorberg, J.; Bierings, R.; Jansen, G. Super-resolution immunofluorescence imaging of platelet granules. Blood 2019, 134, 3613. [Google Scholar] [CrossRef]
- ZEN—ZEISS Efficient Navigation. Available online: https://www.zeiss.com/microscopy/int/products/microscope-software/zen.html (accessed on 1 January 2022).
- Helle, Ø.I.; Dullo, F.T.; Lahrberg, M.; Tinguely, J.C.; Helleso, O.G.; Ahluwalia, B.S. Structured illumination microscopy using a photonic chip. Nat. Photonics 2020, 14, 431–438. [Google Scholar] [CrossRef]
- Guo, Y.; Li, D.; Zhang, S.; Yang, Y.; Liu, J.J.; Wang, X.; Liu, C.; Milkie, D.E.; Moore, R.P.; Tulu, U.S.; et al. Visualizing intracellular organelle and cytoskeletal interactions at nanoscale resolution on millisecond timescales. Cell 2018, 175, 1430–1442. [Google Scholar] [CrossRef] [Green Version]
- Jin, L.H.; Liu, B.; Zhao, F.Q.; Hahn, S.; Dong, B.W.; Song, R.Y.; Elston, T.C.; Xu, Y.K.; Hahn, K.M. Deep learning enables structured illumination microscopy with low light levels and enhanced speed. Nat. Commun. 2020, 11, 1934. [Google Scholar] [CrossRef] [Green Version]
- Ouyang, W.; Aristov, A.; Lelek, M.; Hao, X.; Zimmer, C. Deep learning massively accelerates super-resolution localization microscopy. Nat. Biotechnol. 2018, 36, 460–468. [Google Scholar] [CrossRef]
- Barbastathis, G.; Ozcan, A.; Situ, G. On the use of deep learning for computational imaging. Optica 2019, 6, 921–943. [Google Scholar] [CrossRef]
- Dankovich, T.M.; Rizzoli, S.O. Challenges facing quantitative large-scale optical super-resolution, and some simple solutions. Iscience 2021, 24, 102134. [Google Scholar] [CrossRef]
- Chen, K.; Yuen, C.; Aniweh, Y.; Preiser, P.; Liu, Q. Towards ultrasensitive malaria diagnosis using surface enhanced Raman spectroscopy. Sci. Rep. 2016, 6, 20177. [Google Scholar] [CrossRef]
- Bueno, A.C.; Silveira, L.; Yanai, A.L.S.; Fernandes, A.B. Raman spectroscopy for a rapid diagnosis of sickle cell disease in human blood samples: A preliminary study. Lasers Med. Sci. 2015, 30, 247–253. [Google Scholar] [CrossRef]
- Ramoji, A.; Neugebauer, U.; Bocklitz, T.; Foerster, M.; Kiehntopf, M.; Bauer, M.; Popp, J. Toward a spectroscopic hemogram: Raman spectroscopic differentiation of the two most abundant leukocytes from peripheral blood. Anal. Chem. 2012, 84, 5335–5342. [Google Scholar] [CrossRef]
- Durrant, B.; Trappett, M.; Shipp, D.; Notingher, I. Recent developments in spontaneous Raman imaging of living biological cells. Curr. Opin. Chem. Biol. 2019, 51, 138–145. [Google Scholar] [CrossRef] [PubMed]
- Shu, X.; Sansare, S.; Jin, D.; Zeng, X.X.; Tong, K.Y.; Pandey, R.; Zhou, R.J. Artificial-intelligence-enabled reagent-free imaging hematology analyzer. Adv. Intell. Syst. 2021, 3, 2000277. [Google Scholar] [CrossRef]
- Kim, G.; Jo, Y.; Cho, H.; Min, H.S.; Park, Y. Learning-based screening of hematologic disorders using quantitative phase imaging of individual red blood cells. Biosens. Bioelectron. 2019, 123, 69–76. [Google Scholar] [CrossRef]
- Deng, X.Y.; Xiong, F.; Li, X.Y.; Xiang, B.; Li, Z.; Wu, X.; Guo, C.; Li, X.L.; Li, Y.; Li, G.Y.; et al. Application of atomic force microscopy in cancer research. J. Nanobiotechnol. 2018, 16, 102. [Google Scholar] [CrossRef] [Green Version]
- Ciasca, G.; Papi, M.; Di Claudio, S.; Chiarpotto, M.; Palmieri, V.; Maulucci, G.; Nocca, G.; Rossi, C.; De Spirito, M. Mapping viscoelastic properties of healthy and pathological red blood cells at the nanoscale level. Nanoscale 2015, 7, 17030–17037. [Google Scholar] [CrossRef]
- Ruggeri, F.S.; Marcott, C.; Dinarelli, S.; Longo, G.; Girasole, M.; Dietler, G.; Knowles, T.P.J. Identification of oxidative stress in red blood cells with nanoscale chemical resolution by infrared nanospectroscopy. Int. J. Mol. Sci. 2018, 19, 2582. [Google Scholar] [CrossRef] [Green Version]
- Buys, A.V.; Van Rooy, M.J.; Soma, P.; Van Papendorp, D.; Lipinski, B.; Pretorius, E. Changes in red blood cell membrane structure in type 2 diabetes: A scanning electron and atomic force microscopy study. Cardiovasc. Diabetol. 2013, 12, 25. [Google Scholar] [CrossRef] [Green Version]
- Zhao, G.; Li, H.; Gao, J.; Cai, M.; Xu, H.; Shi, Y.; Wang, H.; Wang, H. Insight into the different channel proteins of human red blood cell membranes revealed by combined dSTORM and AFM techniques. Anal. Chem. 2021, 93, 14113–14120. [Google Scholar] [CrossRef]
- Zhou, L.; Gao, J.; Wang, H.; Shi, Y.; Xu, H.; Yan, Q.; Jing, Y.; Jiang, J.; Cai, M.; Wang, H. Correlative dual-color dSTORM/AFM reveals protein clusters at the cytoplasmic side of human bronchial epithelium membranes. Nanoscale 2020, 12, 9950–9957. [Google Scholar] [CrossRef] [PubMed]
- Dertinger, T.; Colyer, R.; Iyer, G.; Enderlein, J. Fast, background-free, 3D super-resolution optical fluctuation imaging (SOFI). Proc. Natl. Acad. Sci. USA 2009, 106, 22287–22292. [Google Scholar] [CrossRef] [PubMed] [Green Version]
- Grußmayer, K.S.; Geissbuehler, S.; Descloux, A.; Lukes, T.; Leutenegger, M.; Radenovic, A.; Lasser, T. Spectral cross-cumulants for multicolor super-resolved SOFI imaging. Nat. Commun. 2020, 11, 3023. [Google Scholar] [CrossRef] [PubMed]
- Glatzová, D.; Cebecauer, M. Dual role of CD4 in peripheral T lymphocytes. Front Immunol. 2019, 10, 618. [Google Scholar] [CrossRef]
- Descloux, A.; Grußmayer, K.S.; Bostan, E.; Lukes, T.; Bouwens, A.; Sharipov, A.; Geissbuehler, S.; Mahul-Mellier, A.L.; Lashuel, H.A.; Leutenegger, M.; et al. Combined multi-plane phase retrieval and super-resolution optical fluctuation imaging for 4D cell microscopy. Nat. Photonics 2018, 12, 165–172. [Google Scholar] [CrossRef] [Green Version]
- Bransky, A.; Larsson, A.; Aardal, E.; Ben-Yosef, Y.; Christenson, R.H. A novel approach to hematology testing at the point of care. J. Appl. Lab. Med. 2021, 6, 532–542. [Google Scholar] [CrossRef]
- Baron, U.; Werner, J.; Schildknecht, K.; Schulze, J.J.; Mulu, A.; Liebert, U.G.; Sack, U.R.; Speckmann, C.; Gossen, M.; Wong, R.J.; et al. Epigenetic immune cell counting in human blood samples for immunodiagnostics. Sci. Transl. Med. 2018, 10, eaan3508. [Google Scholar] [CrossRef] [Green Version]
Publisher’s Note: MDPI stays neutral with regard to jurisdictional claims in published maps and institutional affiliations. |
© 2022 by the authors. Licensee MDPI, Basel, Switzerland. This article is an open access article distributed under the terms and conditions of the Creative Commons Attribution (CC BY) license (https://creativecommons.org/licenses/by/4.0/).

