Cladding-Pumped Er/Yb-Co-Doped Fiber Amplifier for Multi-Channel Operation

 ,
, 
 , , ,
, , ,  and
and
Abstract
:1. Introduction
2. Characterization of the Erbium/Ytterbium-Co-Doped Fiber Parameters
2.1. Doped Fiber Elemental Analysis
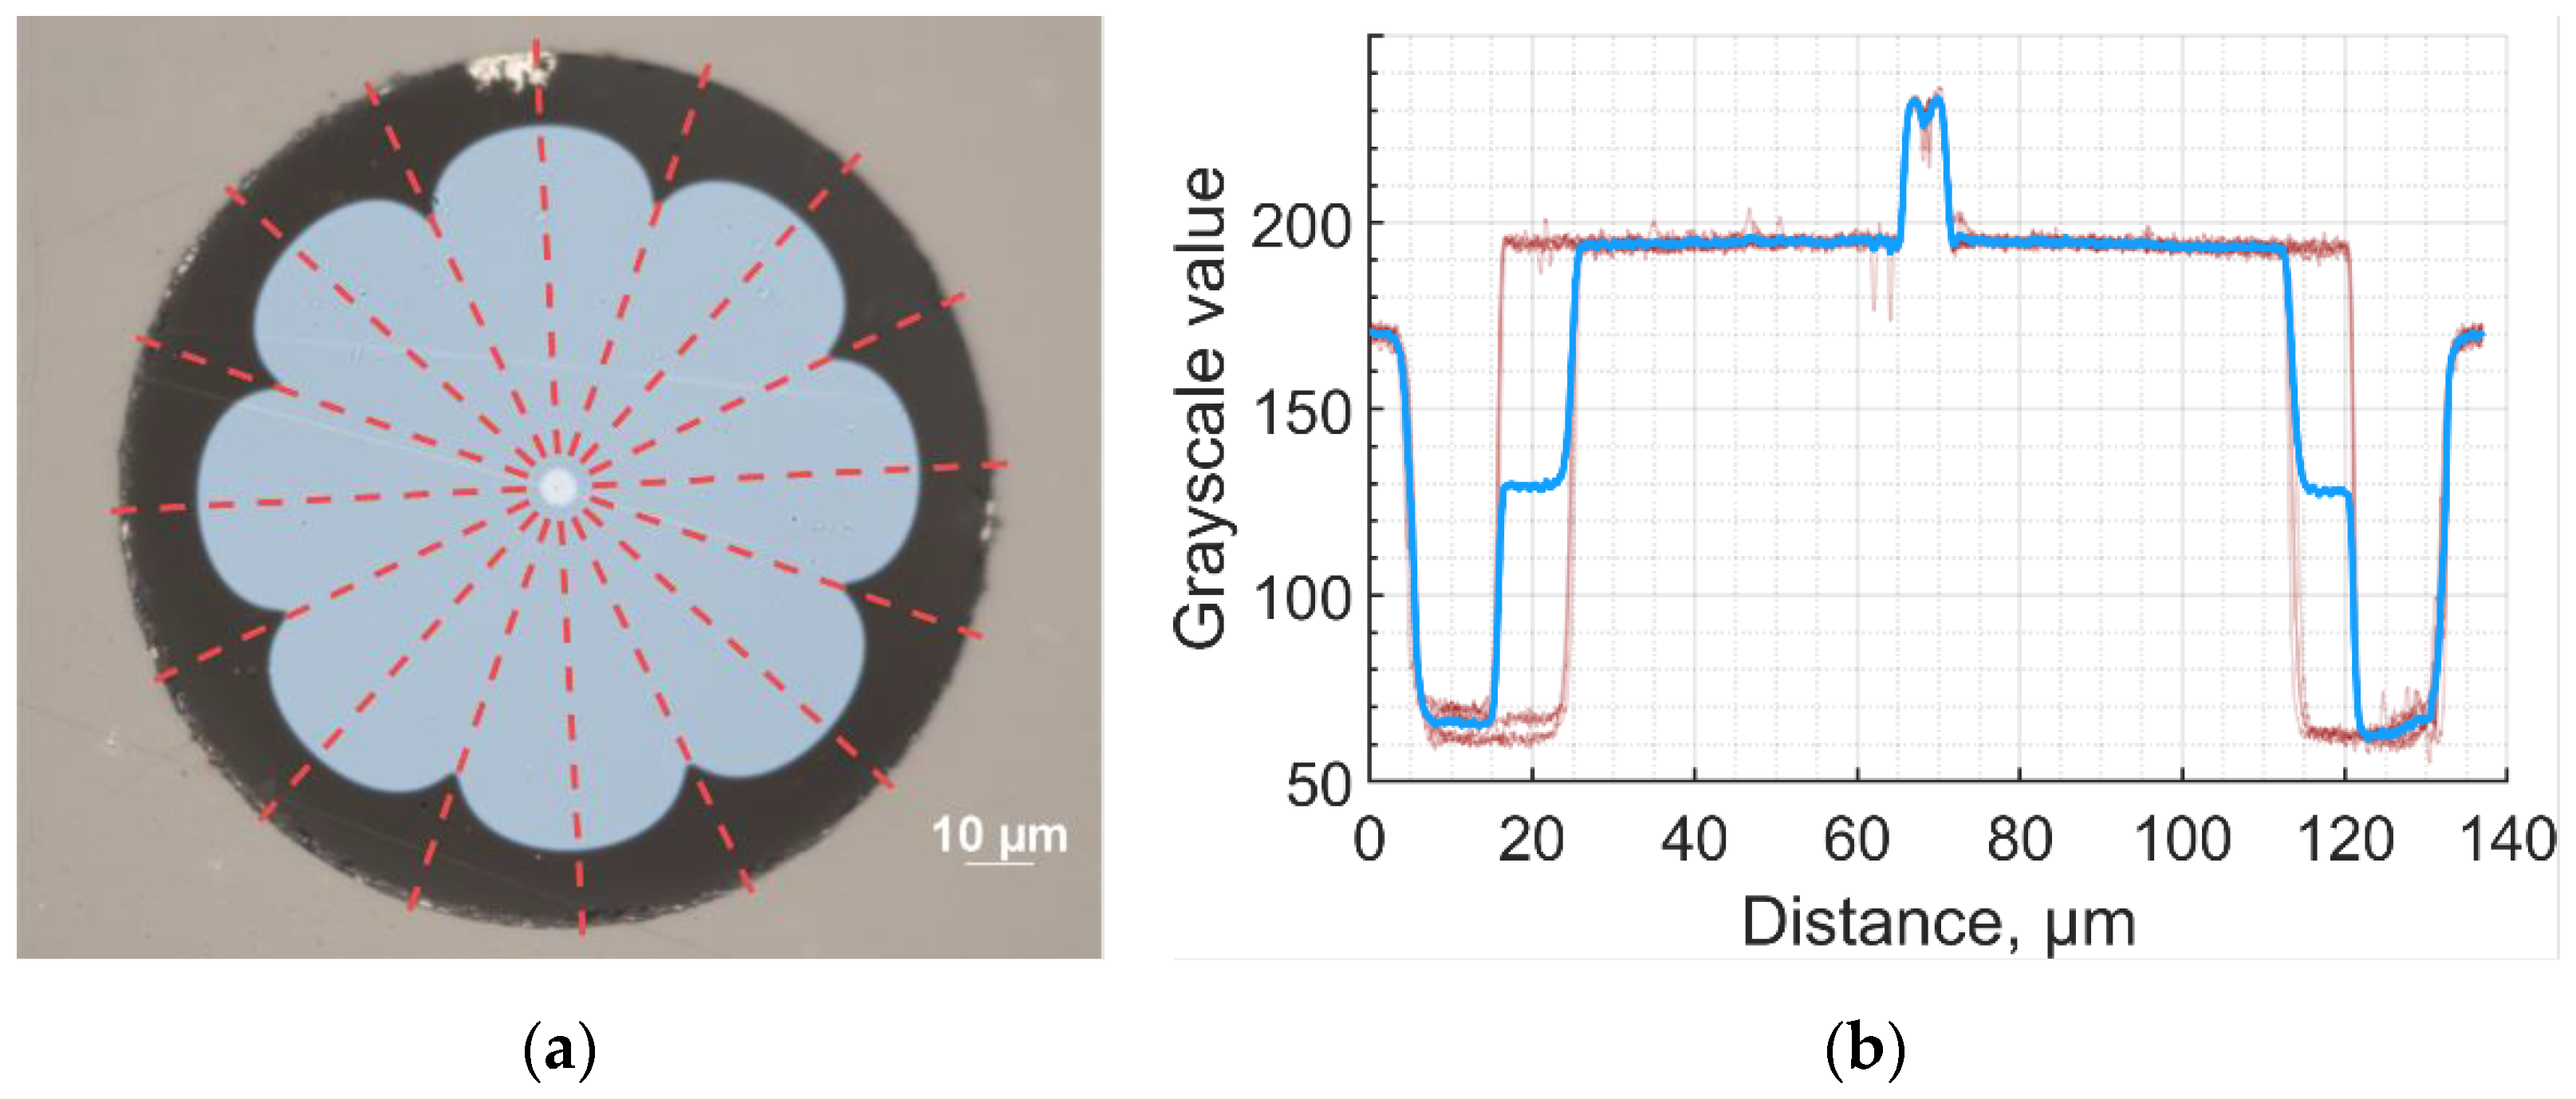
2.2. Overlap Factor Calculation
- fiber profile;
- position;
- sigmoid function fitting coefficients;
- edge of the boundary.
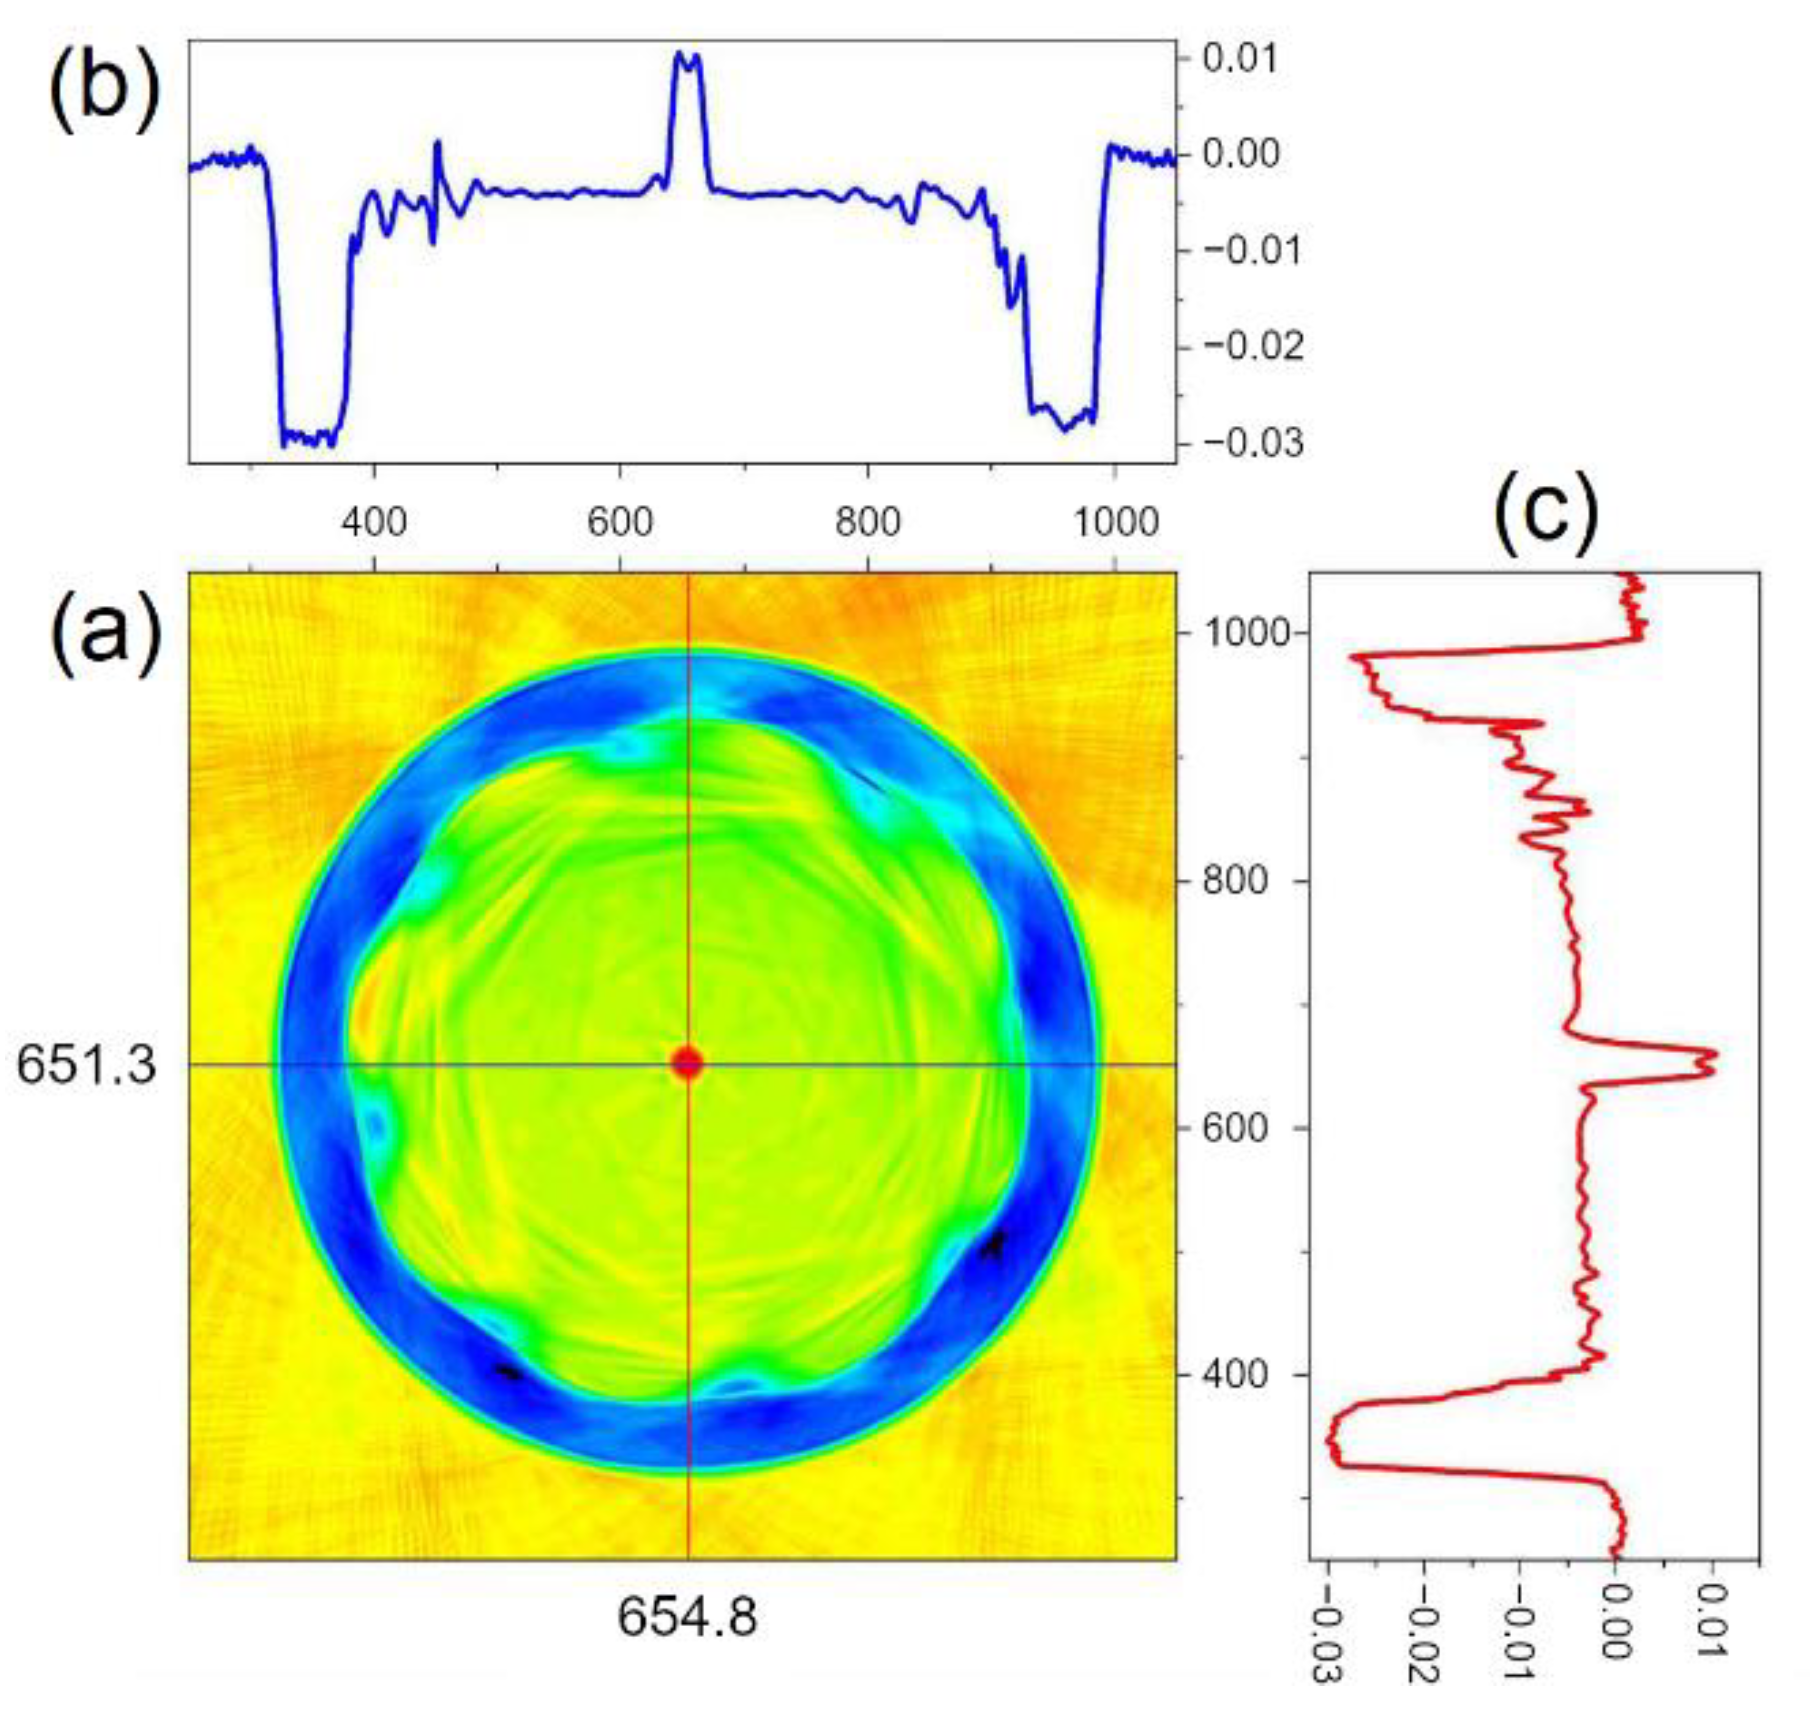
2.3. Refractive Index
- Outer cladding n3 = 1.505 ± 0.004;
- Inner cladding n2 = 1.529 ± 0.004;
- Core n1 = 1.543 ± 0.004.
2.4. Absorption and Emission Cross-Section
3. Amplifier Model and Setup
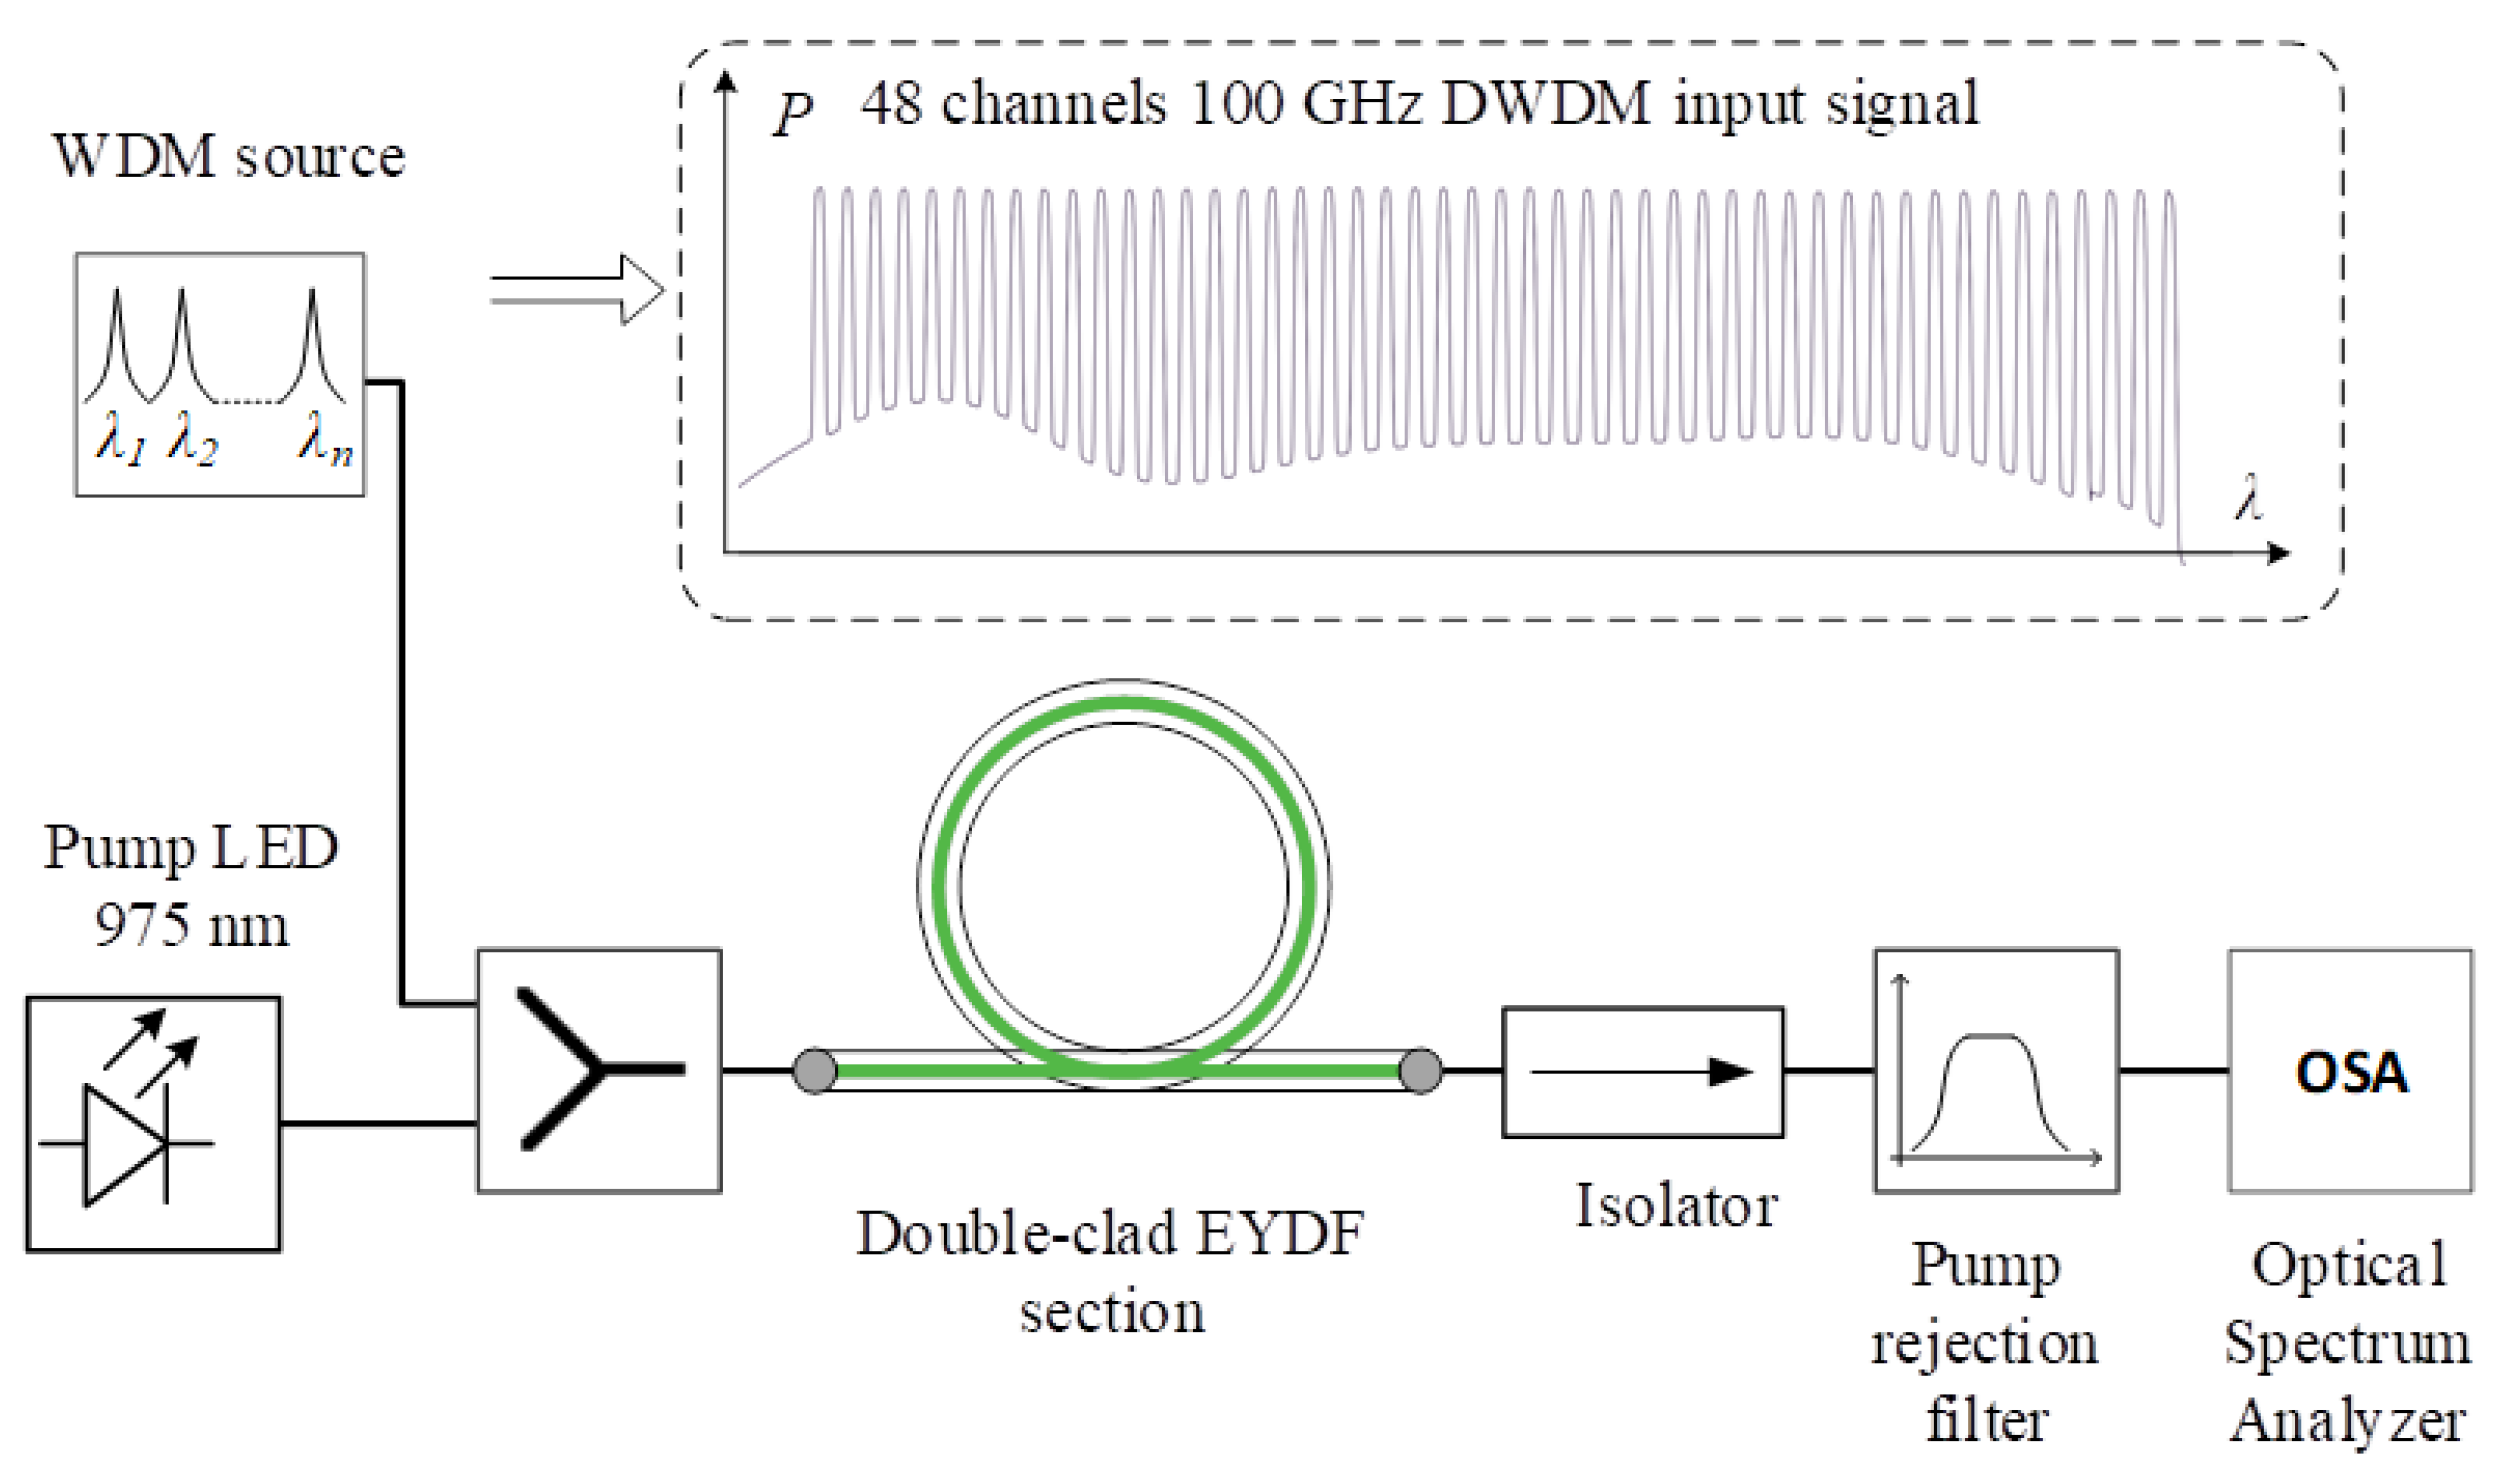
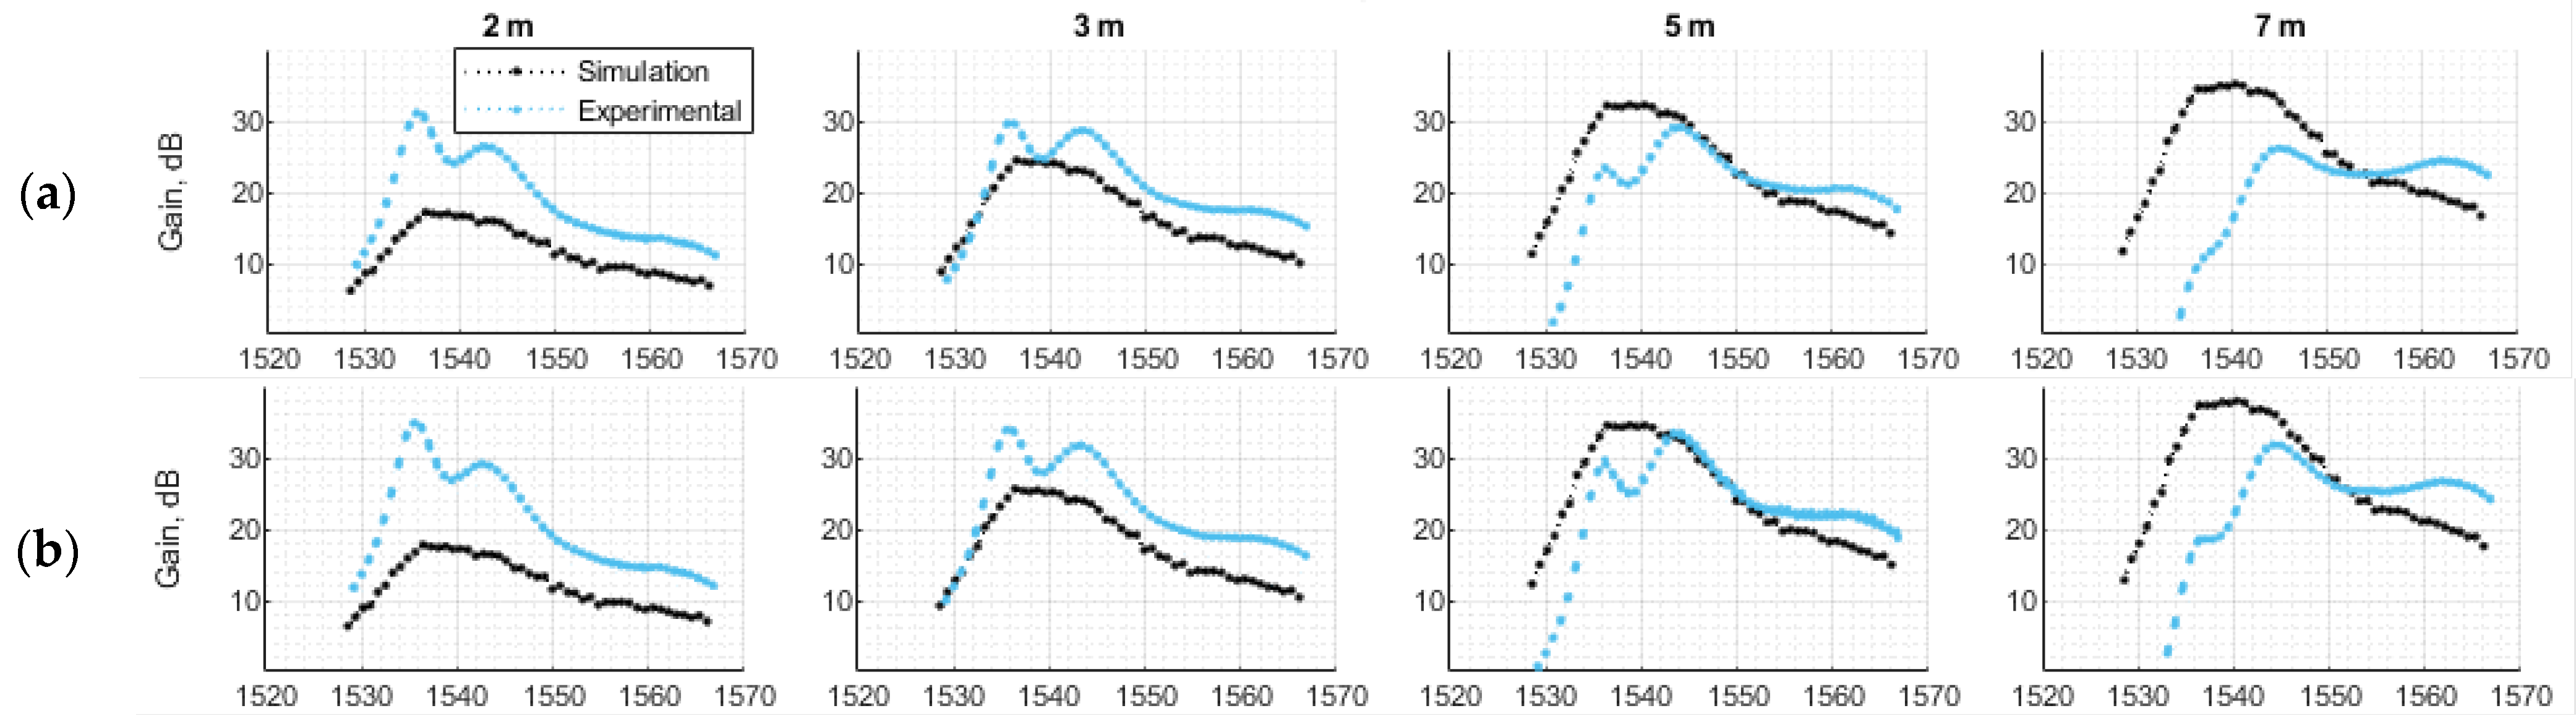
3.1. Simulation Setup
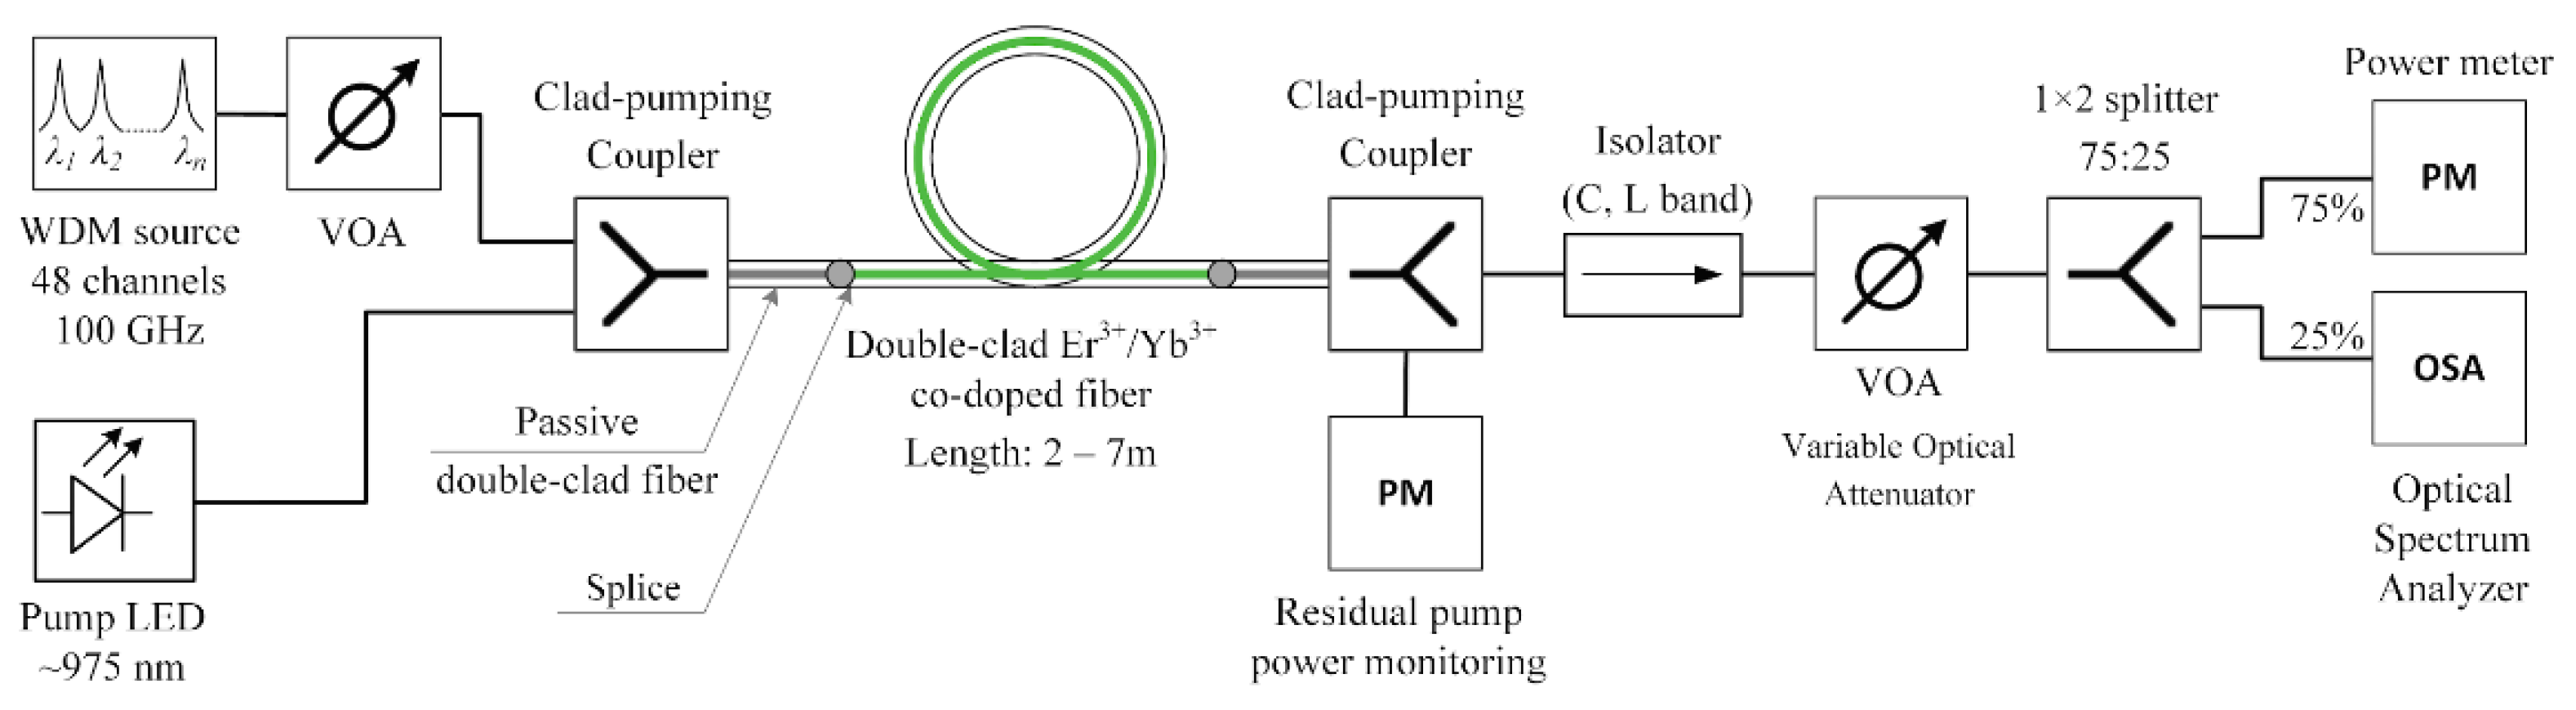
3.2. Experimental Setup
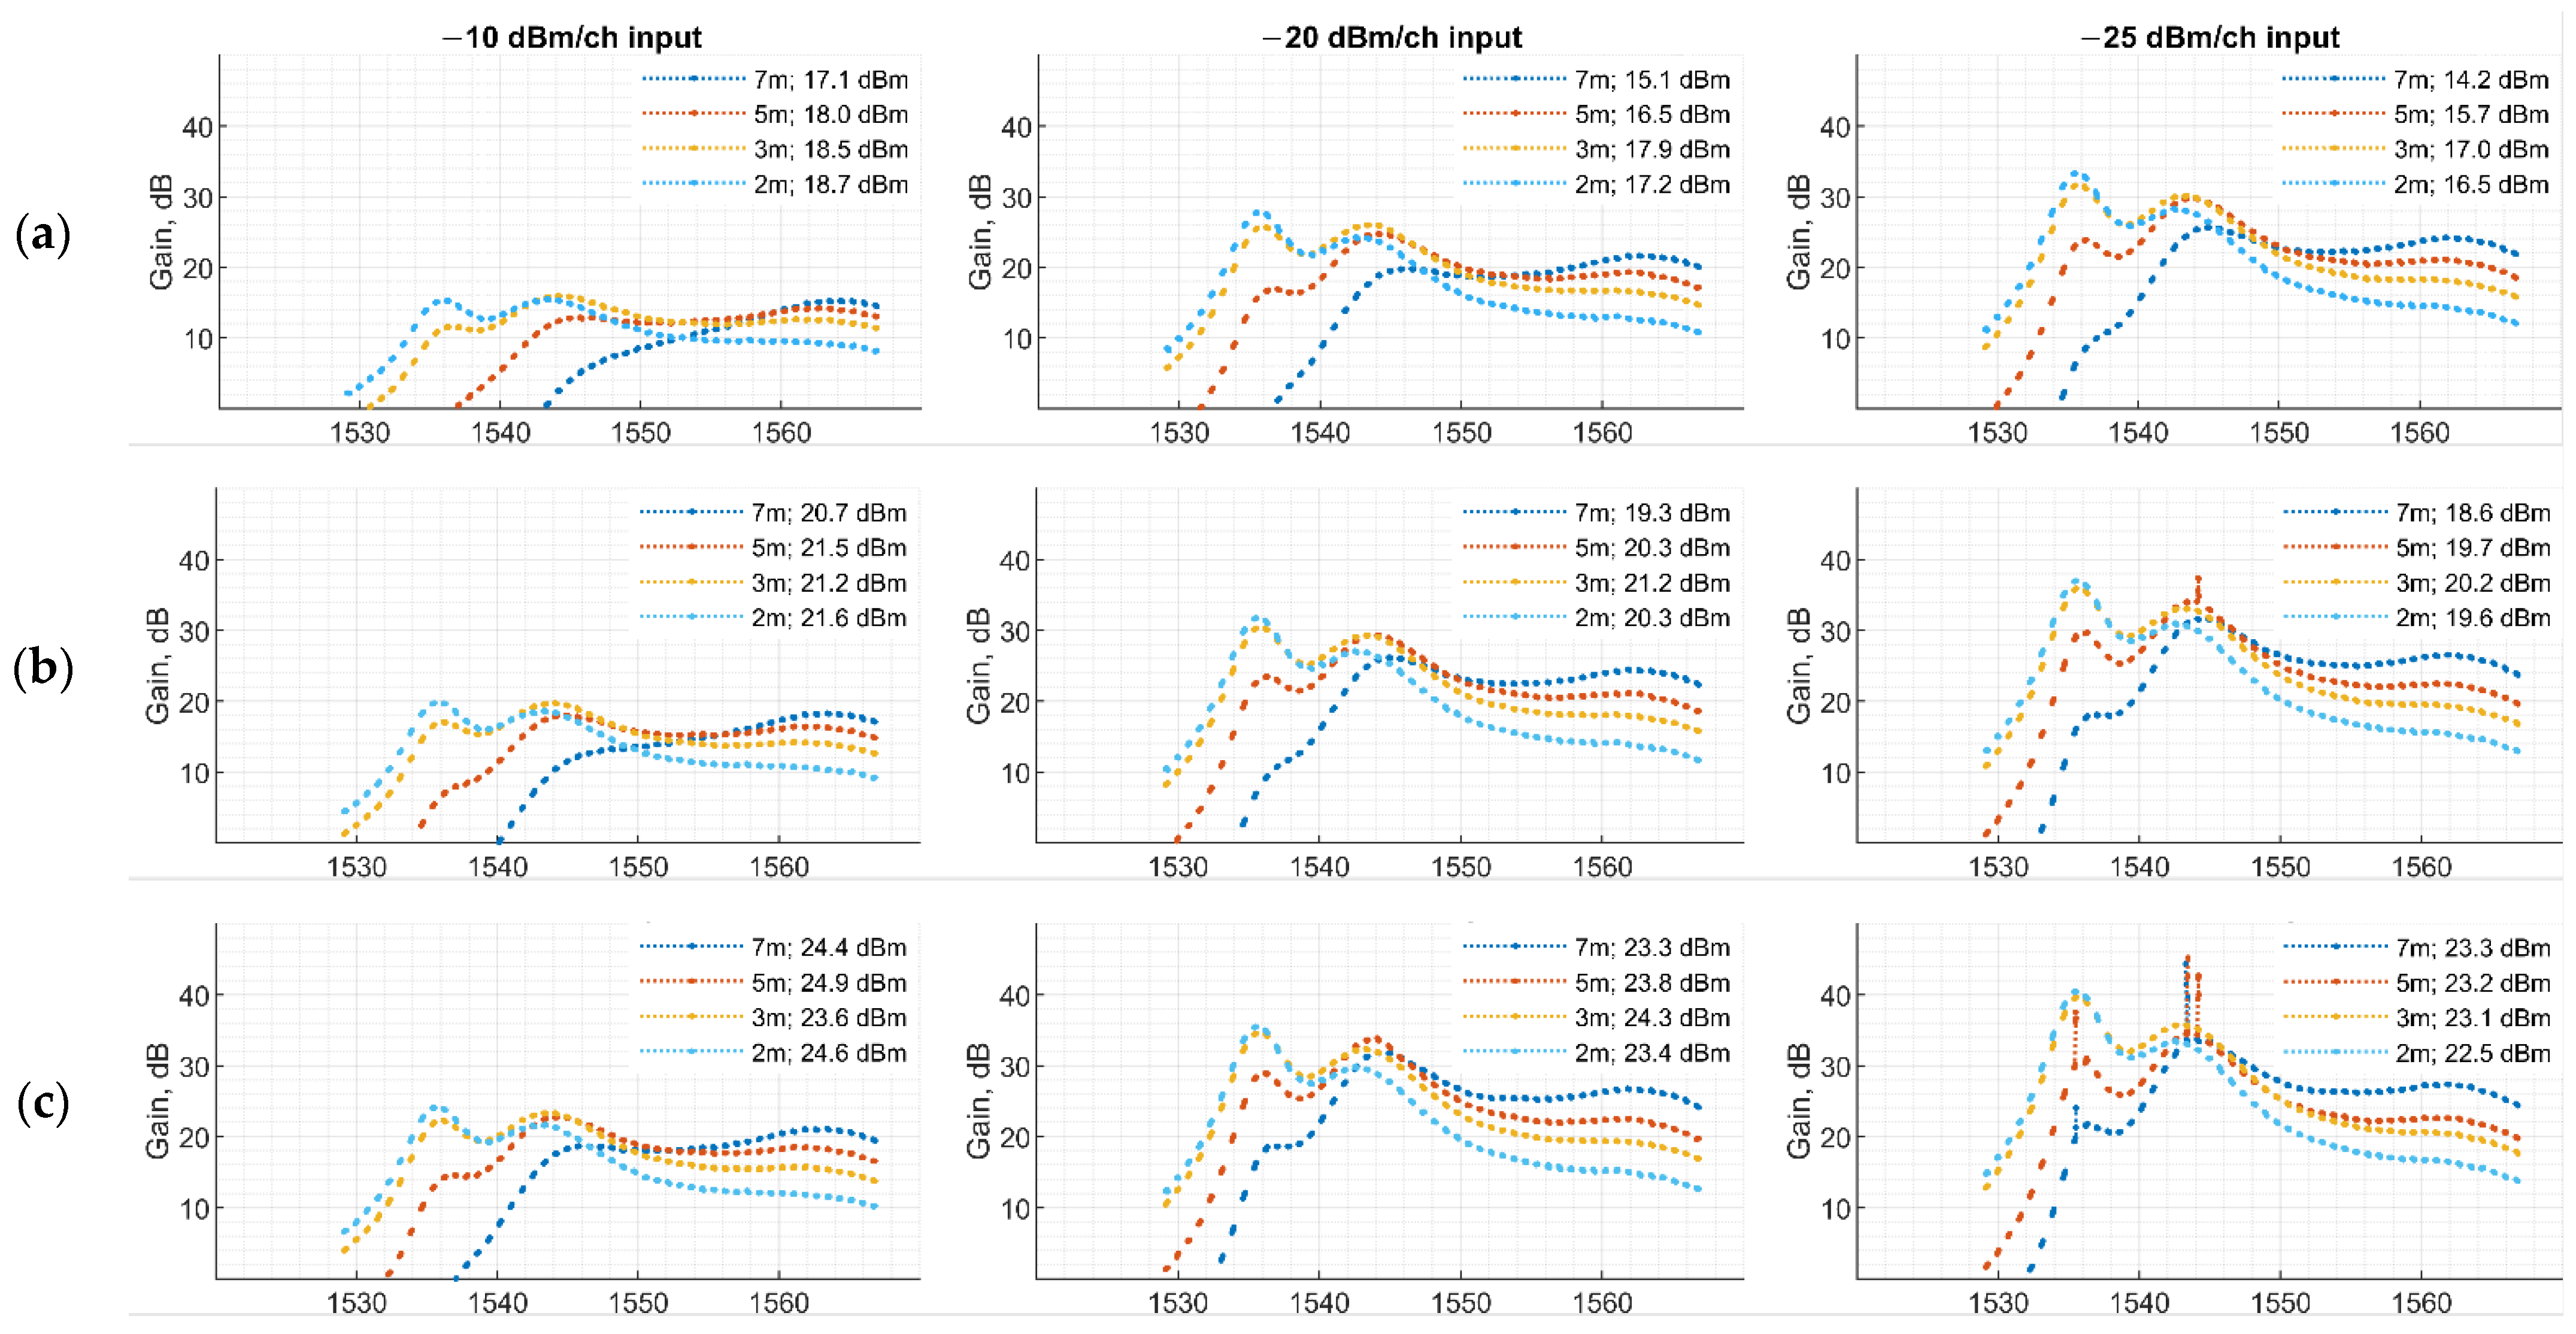
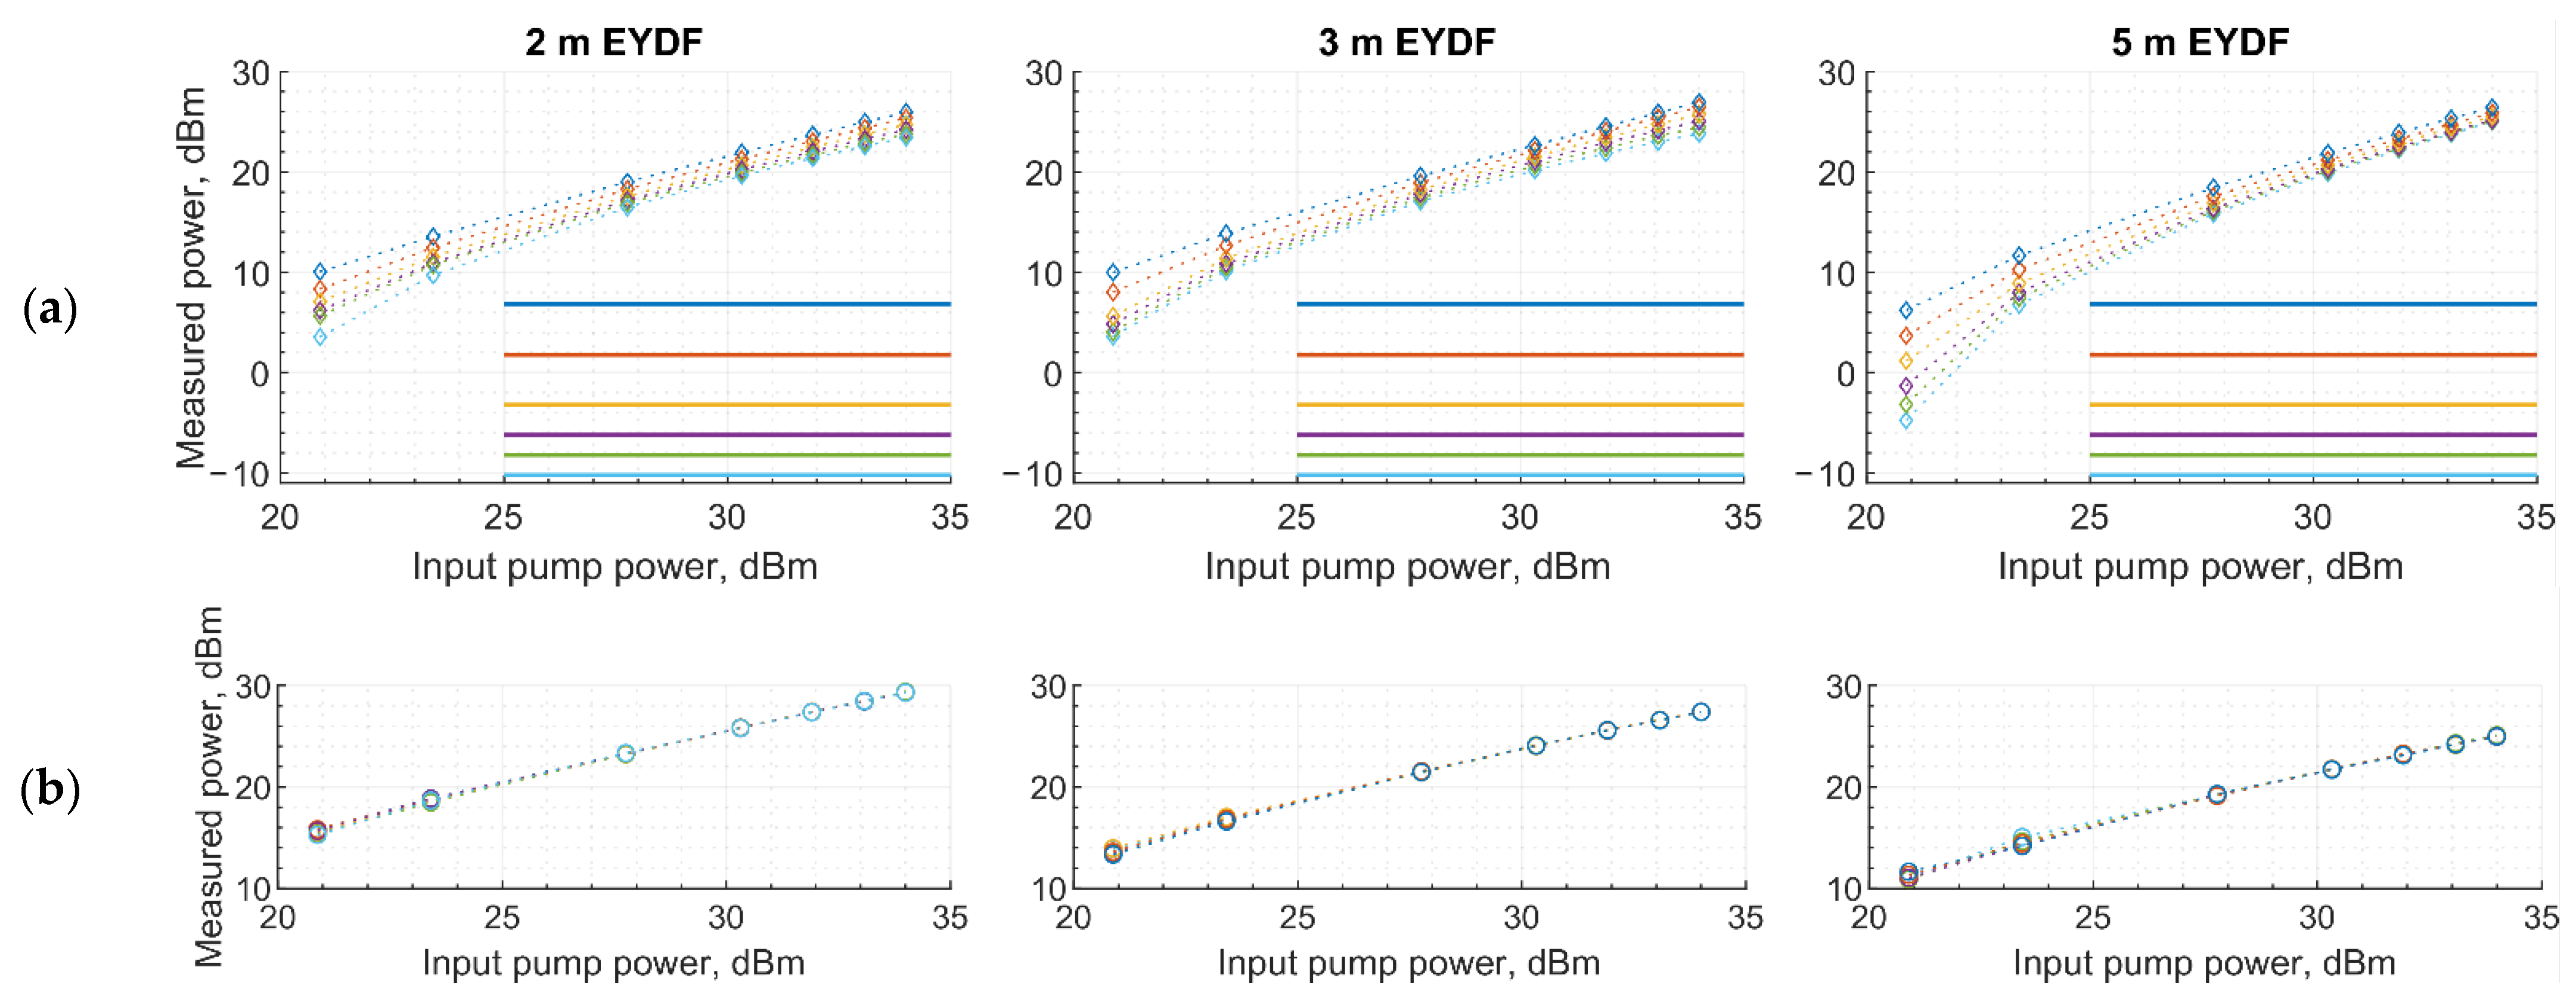
4. Results and Discussion
5. Conclusions
Author Contributions
Funding
Institutional Review Board Statement
Informed Consent Statement
Data Availability Statement
Acknowledgments
Conflicts of Interest
References
- Peterka, P.; Koška, P.; Jasim, A.A.; Kanagaraj, N.; Aubrecht, J.; Kamrádek, M.; Podrazký, O.; Todorov, F.; Kašík, I.; Honzátko, P. Enhanced Pump Absorption Efficiency in Coiled and Twisted Double-Clad Fibers for Fiber Lasers. In Proceedings of the 2019 21st International Conference on Transparent Optical Networks (ICTON), Angers, France, 9–13 July 2019; pp. 1–4. [Google Scholar] [CrossRef]
- Andrianov, A.V.; Skobelev, S.A.; Balakin, A.A.; Anashkina, E.A.; Litvak, A.G. Tapered Multicore Fiber for High-Power Laser Amplifiers. IEEE Photonics J. 2022, 14, 1505606. [Google Scholar] [CrossRef]
- Anashkina, E.A.; Andrianov, A.V. Design and Dispersion Control of Microstructured Multicore Tellurite Glass Fibers with In-Phase and Out-of-Phase Supermodes. Photonics 2021, 8, 113. [Google Scholar] [CrossRef]
- Marisova, M.P.; Andrianov, A.V.; Leuchs, G.; Anashkina, E.A. Dispersion Tailoring and Four-Wave Mixing in Silica Microspheres with Germanosilicate Coating. Photonics 2021, 8, 473. [Google Scholar] [CrossRef]
- Supe, A.; Olonkins, S.; Udalcovs, A.; Senkans, U.; Mūrnieks, R.; Gegere, L.; Prigunovs, D.; Grube, J.; Elsts, E.; Spolitis, S.; et al. Cladding-Pumped Erbium/Ytterbium Co-Doped Fiber Amplifier for C-Band Operation in Optical Networks. Appl. Sci. 2021, 11, 1702. [Google Scholar] [CrossRef]
- Matte-Breton, C.; Ryf, R.; Fontaine, N.K.; Essiambre, R.-J.; Chen, H.; Kelly, C.; Messaddeq, Y.; LaRochelle, S. Modeling and Characterization of Cladding-Pumped Erbium-Ytterbium Co-Doped Fibers for Amplification in Communication Systems. J. Lightwave Technol. 2020, 38, 1936–1944. [Google Scholar] [CrossRef]
- Al-Azzawi, A.A.; Almukhtar, A.A.; Reddy, P.H.; Dutta, D.; Das, S.; Dhar, A.; Paul, M.C.; Zakaria, U.N.; Ahmad, H.; Harun, S.W. Compact and Flat-Gain Fiber Optical Amplifier with Hafnia-Bismuth-Erbium Co-Doped Fiber. Optik 2018, 170, 56–60. [Google Scholar] [CrossRef]
- Miluski, P.; Kochanowicz, M.; Żmojda, J.; Dorosz, D.; Łodziński, M.; Baranowska, A.; Dorosz, J. Eye Safe Emission in Tm3+/Ho3+ and Yb3+/Tm3+ Co-Doped Optical Fibers Fabricated Using MCVD-CDS System. Opt. Mater. 2020, 101, 109711. [Google Scholar] [CrossRef]
- PathfinderTM X-ray Microanalysis Software. Available online: https://www.thermofisher.com/order/catalog/product/IQLAADGABKFAQOMBJE (accessed on 20 January 2022).
- Várallyay, Z.; Szabó, Á.; Rosales, A.; Gonzales, E.; Tobioka, H.; Headley, C. Accurate Modeling of Cladding Pumped, Star-Shaped, Yb-Doped Fiber Amplifiers. Opt. Fiber Technol. 2015, 21, 180–186. [Google Scholar] [CrossRef]
- Jeong, Y.; Sahu, J.K.; Payne, D.N.; Nilsson, J. Ytterbium-Doped Large-Core Fiber Laser with 1.36 KW Continuous-Wave Output Power. Opt. Express OE 2004, 12, 6088–6092. [Google Scholar] [CrossRef] [PubMed]
- Supe, A.; Spolitis, S.; Elsts, E.; Murnieks, R.; Doke, G.; Senkans, U.; Matsenko, S.; Grube, J.; Bobrovs, V. Recent Developments in Cladding-Pumped Doped Fiber Amplifiers for Telecommunications Systems. In Proceedings of the 2020 22nd International Conference on Transparent Optical Networks (ICTON), Bari, Italy, 19–23 July 2020; pp. 1–6. [Google Scholar] [CrossRef]
- Eclipse LV150N and LV150NA|Upright Microscopes|Nikon Metrology. Available online: https://www.nikonmetrology.com/en-gb/industrial-microscopes/upright-microscopes-eclipse-lv150n-and-lv150na (accessed on 16 December 2021).
- Nikon|Industrial Metrology|Objectives for Industrial Microscopes. Available online: https://www.nikon.com/products/industrial-metrology/lineup/microscope/industrial-microscopes/accessory/objective/ (accessed on 16 December 2021).
- DS-Fi3|Digital Sight Cameras|Nikon Metrology. Available online: https://www.nikonmetrology.com/en-gb/industrial-microscopes/digital-sight-cameras-ds-fi3 (accessed on 16 December 2021).
- Lee, S.W.; Lee, S.Y.; Pahk, H.J. Precise Edge Detection Method Using Sigmoid Function in Blurry and Noisy Image for TFT-LCD 2D Critical Dimension Measurement. Curr. Opt. Photon. COPP 2018, 2, 69–78. [Google Scholar]
- Ma, H.-P.; Yang, J.-H.; Yang, J.-G.; Zhu, L.-Y.; Huang, W.; Yuan, G.-J.; Feng, J.-J.; Jen, T.-C.; Lu, H.-L. Systematic Study of the SiOx Film with Different Stoichiometry by Plasma-Enhanced Atomic Layer Deposition and Its Application in SiOx/SiO2 Super-Lattice. Nanomaterials 2019, 9, 55. [Google Scholar] [CrossRef] [PubMed] [Green Version]
- Multi-Angle Absolute Specular Reflectance, Cary UMA|Agilent. Available online: https://www.agilent.com/en/product/molecular-spectroscopy/uv-vis-uv-vis-nir-spectroscopy/uv-vis-uv-vis-nir-accessories/cary-universal-measurement-accessory-uma (accessed on 16 December 2021).
- RonD FiberMate2TM Fiber Optic Coupler. Available online: https://www.harricksci.com/ftir/accessories/group/FiberMate2%E2%84%A2-Fiber-Optic-Coupler (accessed on 16 December 2021).
- Huang, F.; Liu, X.; Ma, Y.; Kang, S.; Hu, L.; Chen, D. Origin of near to Middle Infrared Luminescence and Energy Transfer Process of Er3+/Yb3+co-Doped Fluorotellurite Glasses under Different Excitations. Sci. Rep. 2015, 5, 8233. [Google Scholar] [CrossRef] [Green Version]
- McCumber, D.E. Einstein Relations Connecting Broadband Emission and Absorption Spectra. Phys. Rev. 1964, 136, A954–A957. [Google Scholar] [CrossRef]
- VPIphotonics Design SuiteTM—Overview. Available online: https://www.vpiphotonics.com/Tools/DesignSuite/ (accessed on 16 December 2021).
- VPIphotonics GmbH. VPIcomponentMaker Fiber Optics User’s Manual; VPIphotonics GmbH: Berlin, Germany, 2020; pp. 176–204. [Google Scholar]
- VPIphotonics GmbH. VPIcomponentMaker Fiber Optics Module Reference; VPIphotonics GmbH: Berlin, Germany, 2020. [Google Scholar]
- Meng, Q.; Li, J.; Wu, H.; Han, B.; Wang, Z. Cladding-Pumped Erbium-Ytterbium Co-Doped Random Fiber Laser. In Proceedings of the 2017 16th International Conference on Optical Communications and Networks (ICOCN), Wuzhen, China, 7–10 August 2017; pp. 1–2. [Google Scholar] [CrossRef]
- Meng, Q.; Wu, H.; Han, B.; Li, J.; Wang, Z. LD-Pumped Random Fiber Laser Based on Erbium-Ytterbium Co-Doped Fiber. Photonic Sens. 2020, 10, 181–185. [Google Scholar] [CrossRef] [Green Version]
- Bai, X.; Wang, M.; Yang, Y.; Liu, Z.; Jia, W. Experimental and Theoretical Analysis on Pump Spectral Propriety of Single Frequency Erbium-Ytterbium Co-Doped Fiber Amplifier. J. Phys. Commun. 2021, 5, 015005. [Google Scholar] [CrossRef]


| System parameters | |
|---|---|
| Number of channels | 48 |
| Channels carrier frequency range | 191.35–196.05 THz |
| Channel spacing | 100 GHz |
| Single-channel power (simulation) | −20 dBm |
| Single-channel power (experimental) | −25 to −10 dBm |
| EYDFA pump parameters | |
| Pump wavelength | 973–977 nm at 30 °C |
| Pump power | 0.6–2.5 W |
| Pumping direction | Co-propagating |
| Doped fiber parameters | |
| Length | 2–7 m |
| Er3+ concentration | 1 × 1025 m−3 |
| Yb3+ concentration | 2 × 1026 m−3 |
| Er3+/Yb3+ cross-relaxation coefficient | 1 × 10⁻²² m3/s |
| Overlap factor (at 1530 nm) | 0.0027 |
| Overlap factor (at 980 nm) | 0.9203 |
| EYDF length, m | 3 | 5 | 7 |
| Gain max., dB | 25.6 | 34.6 | 38 |
| Peak gain wavelength, nm | 1536.4 | 1538.8 | 1540.4 |
| Δ Gain, dB | - | 9.1 | 3.4 |
Publisher’s Note: MDPI stays neutral with regard to jurisdictional claims in published maps and institutional affiliations. |
© 2022 by the authors. Licensee MDPI, Basel, Switzerland. This article is an open access article distributed under the terms and conditions of the Creative Commons Attribution (CC BY) license (https://creativecommons.org/licenses/by/4.0/).
Share and Cite
Zakis, K.; Olonkins, S.; Udalcovs, A.; Lukosevics, I.; Prigunovs, D.; Grube, J.; Bikse, L.; Supe, A.; Ozolins, O.; Spolitis, S.; et al. Cladding-Pumped Er/Yb-Co-Doped Fiber Amplifier for Multi-Channel Operation. Photonics 2022, 9, 457. https://doi.org/10.3390/photonics9070457
Zakis K, Olonkins S, Udalcovs A, Lukosevics I, Prigunovs D, Grube J, Bikse L, Supe A, Ozolins O, Spolitis S, et al. Cladding-Pumped Er/Yb-Co-Doped Fiber Amplifier for Multi-Channel Operation. Photonics. 2022; 9(7):457. https://doi.org/10.3390/photonics9070457
Chicago/Turabian StyleZakis, Kaspars, Sergejs Olonkins, Aleksejs Udalcovs, Ingars Lukosevics, Dmitrijs Prigunovs, Jurgis Grube, Liga Bikse, Andis Supe, Oskars Ozolins, Sandis Spolitis, and et al. 2022. "Cladding-Pumped Er/Yb-Co-Doped Fiber Amplifier for Multi-Channel Operation" Photonics 9, no. 7: 457. https://doi.org/10.3390/photonics9070457