Article

Transient Thermal Response of Blood Vessels during Laser Irradiation Monitored by Laser Speckle Contrast Imaging

State Key Laboratory of Multiphase Flow in Power Engineering, Xi’an Jiaotong University, Xi’an 710049, China
*
Author to whom correspondence should be addressed.
Photonics 2022, 9(8), 520; https://doi.org/10.3390/photonics9080520
Submission received: 29 June 2022 / Revised: 21 July 2022 / Accepted: 22 July 2022 / Published: 26 July 2022
(This article belongs to the Special Issue Biomedical and Biological Optical Device)

Abstract

:
Real-time monitoring of blood flow and thrombosis formation induced by laser irradiation is critical to reveal the thermal-damage mechanism and successfully implement vascular-dermatology laser surgery. Laser speckle contrast imaging (LSCI) is a non-invasive technique to visualize perfusion in various tissues. However, the ability of the LSCI to monitor the transient thermal response of blood vessels, especially thrombus formation during laser irradiation, requires further research. In this paper, an LSCI system was constructed and a 632 nm He-Ne laser was employed to illuminate a Sprague Dawley rat dorsal skin chamber model irradiated by a 1064 nm Nd: YAG therapy laser. The anisotropic diffusion filtering (ADF) technique is implemented after temporal LSCI (tLSCI) processing to improve the SNR and temporal resolution. The speckle flow index is used to characterize the blood-flow velocity to reduce the computational cost. The combination of the tLSCI and ADF increases the temporal resolution by five times and the SNR by 17.2 times and 16.14 times, without and with laser therapy, respectively. The laser-induced thrombus formation and vascular damage during laser surgery can be visualized without any exogenous labels, which provides a powerful tool for thrombus monitoring during laser surgery.

1. Introduction

Laser therapy has become the gold standard for vascular dermatoses such as port-wine stain (PWS) birthmarks [1], which is a kind of subcutaneous malformation of the blood vessels. Due to the absorption-affinity of laser energy by the hemoglobin in red blood cells (RBCs) [2], the target blood vessels can be heated and destroyed without causing damage to the surrounding tissues, thereby bleaching the lesions. However, the practical treatment mainly depends on the physician’s experience, and the total clearance rate is still less than 20% [3]. Our in vivo experiment on the dorsal skin chamber model revealed that thrombus formation is the prerequisite for effective multi-pulsed laser treatment [4]. The reason is that the light absorption of the thrombus is about three times higher than that of the hemoglobin, which greatly improves the thermal response of diseased blood vessels [5]. Subsequently, the real-time monitoring of blood flow and thrombus formation is essential for the precise treatment of vascular dermatosis.
Recently, LSCI technology has demonstrated a promising future for precision-laser skin surgery. It is a nondestructive blood-flow monitoring technology, based on dynamic scattering. In skin tissue, the red blood cells are moving scatterers. The faster the blood flow is, the fuzzier the speckle image and the lower the image contrast, which is defined as the ratio of the standard deviation to the mean of the speckle intensity [6]. Therefore, the LSCI can non-invasively monitor blood flow and thrombus formation during laser surgery, with the potential for allowing physicians to observe the transient thermal response of blood vessels and adjust the laser parameters in real time to achieve the best treatment effect.
In 2010, Jia et al. [7] utilized a combined therapy of a frequency-doubled Nd: YAG laser treatment and topical rapamycin angiogenesis to achieve complete bleaching of PWS. For up to 14 days after the operation, the LSCI was used to monitor blood flow at a dorsal window chamber model to confirm whether the blood vessels regenerated. In 2011, Heger et al. [8] labeled thrombus with carboxyl fluorescein and employed an intravital fluorescence microscope to study the mechanism of thrombus formation. Although the fluorescence imaging signal is strong, it necessitates the injection of a contrast agent, yielding biocompatibility issues. Ma et al. [9] improved the efficacy of laser therapy by applying an optical clearing agent. A color high-speed camera was used to monitor the thermal response of blood vessels, identifying thrombosis by its darker color, but blood-flow velocity was not available. Moreover, it was impossible to tell whether a blood vessel was completely blocked by a thrombus. Nebritova [10] utilized the laser speckle contrast analysis method to monitor the capillary blood flow in a chicken embryo model and found that thrombosis occlusion caused by laser heating has an impact on the microcirculation in the vascular system. Recently, Hu et al. [11] provided a method to make a photothrombotic ischemic stroke model in mice. Likewise, observations of thrombus dynamics are lacking.
The LSCI can be employed to monitor blood microcirculation. However, real-time observation of transient thermal response of blood vessels, especially the thrombosis-formation process during laser surgery by the LSCI, is rarely reported. Laser-induced thrombosis that blocks the vessel is the clinical endpoint of the treatment of vascular skin disease. It is worth researching the transient thermal response, especially the thrombus formation process. Nevertheless, the traditional LSCI has a low SNR and temporal resolution. In 2018, Song et al. [12] introduced the anisotropic diffusion filter (ADF) to improve the temporal resolution and speed sensitivity of the LSCI. With this technology, the cardiac cycle of a rat was imaged by an industrial camera at speed of up to 390 bpm (beat per minute). Tripathi et al. [13] evaluated coagulation status by measuring the viscoelastic propertied of blood during coagulation using laser speckle rheology. However, the in vitro experiment was conducted without laser irradiation, which cannot reproduce the scenario of thrombosis formation during laser therapy.
Therefore, the motivation of this work is to investigate the transient thermal response of blood vessels irradiated by a 1064 nm Nd: YAG therapy laser. An LSCI system was established with the ADF technique to improve the SNR and temporal resolution. The transient thermal responses of blood vessels, especially the thrombus formation, was visualized on the Sprague Dawley rat dorsal skin chamber model, and blood flow during the laser surgery was studied.

2. Materials and Methods

2.1. Animal Preparation

The animal experiment was carried out in accordance with the Institutional Animal Care and Use Committees of Xi’an Jiaotong University. Ten female Sprague Dawley rats weighing 80–120 g were used to prepare the dorsal skin model. The rats were anesthetized with isopentane and have skin hair shaved. A circular area approximately 2 cm in diameter is removed with scissors on one side of the dorsal skin. The remained area is then fixed with a titanium window, exposing the other side of the skin for observation. Figure 1 shows the image of dorsal skin chamber window.

2.2. LSCI System

The LSCI system for real-time monitoring the instantaneous thermal response of blood vessels in the dorsal skin model is shown in Figure 2. As shown in the figure, a 632 nm He-Ne imaging laser (THORLABS, HNL150LB, Orlando, USA) is employed to illuminate the experimental animal after collimating and expanding the beam with a maximum output power of 15 mW. The animal is put on the object stage of a stereo microscope (Leica, M205A, Heerbrugg, Switzerland) to take advantage of its large field of view and long working distance. The microscope can achieve 3.35×~5× magnification of speckle images through a variable magnification optical system. The magnification of the tube lens is 0.67×. Therefore, the system magnification range is 2.2×~3.6×. In order to capture a larger area of skin blood vessels, the system magnification was set to be 2.2×. In addition, the raw speckle images are collected by a sCMOS camera (Teledyne Photonmetrics, Prime BSI, Tucson, USA) for contrast analysis. The camera features high resolution of 2048 × 2048 pixels (each pixel area is as small as 6.5 µm × 6.5 µm) and high frame rate of 60 fps to record transient response, with exposure time of 10 ms. A 1064-nm Nd: YAG therapy laser (Won Technology Co. Ltd., Won-Cosjet TR, Daejeon, Korea) is applied to irradiate the blood vessels in the dorsal skin chamber model. The exposure time is 0.3 ms. A 10-nm bandpass filter centered at wavelength of 633 nm (Union Optics, ITF9320-10-633-M25.4, Wuhan, China) is positioned between the sCMOS camera and microscope to eliminate the interference of the therapy laser.
In practice, the energy density of the therapy laser is high to destroy the blood vessel, easily yielding overexposure of the sCMOS camera for speckle imaging, as shown in Figure 3a. This overexposure could lead to inability to observe blood vessels in the speckle images (Figure 3b). Thus, a 10-nm bandpass filter centered at wavelength of 633 nm is adopted to eliminate the interference of the therapy laser. By using the interferometric bandpass filter with center wavelength of 633 nm, the blood vessels can be clearly distinguished and the blood-flow-rate information can be obtained during laser irradiation (Figure 3c), which lays the hardware foundation to monitor the dynamic thermal response of vessels.

2.3. Theory of the LSCI and the Anisotropic Diffusion Filter

The LSCI is a blood-flow monitoring technology based on the dynamic light-scattering theory [14]. When skin tissue is irradiated by coherent light (laser), the backscattered light from interactions with moving red blood cells generates speckle phenomenon, which can be detected by a camera. In a given exposure time, the faster the red blood cells move, the faster the scattering signals change, and the more blurred the speckle pattern becomes. This blur degree of raw speckle images is measured by the image contrast K, which is defined as the ratio of the standard deviation σ to the mean of the speckle intensity I [15]:
K = σ I ,
The contrast value can be obtained either in the spatial or temporal domains, by using spatial laser speckle contrast imaging (sLSCI) or temporal laser speckle contrast imaging (tLSCI), respectively [16]. Figure 4 shows the schemas of the sLSCI and tLSCI.
After raw laser speckle images are processed by spatial or temporal contrast analysis algorithms, they are usually temporally or spatially averaged to remove noise and improve the SNR [17]. Temporal-averaged spatial contrast images reduce temporal resolution and are not suitable for monitoring the transient thermal response. Spatially averaged temporal contrast images are good candidates, but the spatial resolution is low for the recognition of small blood vessels. Filtering technology can reduce image noise, among which anisotropic diffusion filtering (ADF) technology can preserve image details while smoothing the image and reducing noise. Furthermore, it has the advantage of fast processing because there are no time-consuming operations, which shows potential for instantaneous monitoring with high temporal resolution [12].
In the ADF algorithm, the entire image is analogous to a “heat” field. Each pixel is regarded as a heat source, and the heat flow depends on the difference between the current pixel and the surrounding pixels. The “heat” inside the blood vessel and tissue diffuses quickly, and the image is directly smoothed. At the boundary between the blood vessel and the tissue, the “heat” is blocked. In this way, the edges are preserved, and the noise is reduced. The ADF filtering is iteratively calculated as follows, by inputting the temporal laser speckle contrast value K in the pixel position of (i, j), which can be calculated by,
K n + 1 ( i , j ) = K n ( i , j ) + λ ( d N K N + d S K S + d E K E + d W K W ) ,
where n is the number of filtering iterations, and λ represents the rate of heat diffusion. The number of iterations after optimization is 30, when both processing time and SNR are considered. Since there are four neighboring pixels, the value of λ can be set as 1/4. d is the diffusion coefficient, and K is the contrast gradient between the current center pixel and the surrounding pixels. The subscripts N, S, E, and W represent the four directions, respectively. The diffusion coefficient is calculated as follows,
d ( K ) = 1 1 + ( K K thr ) 2 = { 1 , i f     K = 0 0 , i f     K ,
where Kthr is the edge magnitude parameter, the gradient threshold that determines the sensitivity of the blood vessel boundary. The larger the value is, the smoother the image, and the boundary details of blood vessel could be lost. The value of Kthr can be determined by averaging the contrast value [12]. For traditional LSCI, a quite large number of raw speckle images are needed to avoid noise. Thus, the ADF can be used to improve the SNR and temporal resolution of traditional LSCI, while preserving the vessel edge with fewer raw speckle images. Figure 5 shows the schema of the conventional tLSCI with the ADF.
The signal-to-noise ratio used to measure image quality is defined as follows,
SNR = K σ K ,
where K is the spatial mean value of speckle contrast K with square window size of 10 × 10 pixels, and σ K is the standard deviation of contrast K. The larger the value of SNR is, the better the image quality.

3. Results

In this section, we compared the performance of the traditional LSCI (sLSCI and tLSCI) and the tLSCI with the ADF, for the same sample irradiated by the multi-pulsed 1064-nm Nd: YAG therapy laser, with an energy density of 57 J/cm2, pulse width of 0.3 ms, pulse number of 11, repetition rate of 4 Hz, and spot diameter of 3 mm. Afterwards, the blood flow during the laser irradiation is investigated.

3.1. Transient Thermal Response of Blood Vessels by the sLSCI Algorithm

Firstly, we check the imaging quality by the sLSCI algorithm during therapy laser irradiation. The spatial contrast is computed through the spatial sliding window (size: 5 × 5 pixels). To meet the requirements of temporal resolution for instantaneous monitoring, it maintains a high temporal resolution at the expense of spatial resolution. The blood vessel (red arrow) in Figure 6a is clearly visible before laser irradiation. Figure 6b,c show two high-contrast images captured during laser irradiation. Due to the low spatial resolution of the sLSCI, the process of thrombus formation cannot be observed. Comparing Figure 6d with Figure 6a, we can find that the vessel (red arrow) vanished in the contrast image after laser irradiation. Therefore, the sLSCI is suitable for monitoring of large vessels but cannot monitor thrombosis.

3.2. Transient Thermal Response of Blood Vessels by the tLSCI Algorithm

Secondly, we check the imaging quality by the tLSCI algorithm during therapy laser irradiation. Multi-frame raw speckle images are processed to compute one temporal contrast image. It maintains a high spatial resolution, at the expense of temporal resolution, to meet the high spatial resolution requirements for imaging smaller vessels. The blood vessel (red arrow) in Figure 7a is clearly visible before laser irradiation. Figure 7b,c are two contrast images captured during laser irradiation. Due to the high spatial resolution of tLSCI, the process of thrombus formation can be observed. As shown in Figure 7c, the thrombus (red arrow) presents a bright state. In contrast to the sLSCI, the tLSCI is more effective at monitoring thrombus dynamics. However, more frames of raw speckle are required to improve the SNR, which reduces the temporal resolution. In this case, the raw speckle frames are 3, 6, and 9, while the SNR are only 1.38, 2.06, and 2.5, respectively. As shown in Figure 7c,g,k, the thrombus gradually becomes indistinguishable, indicating that the temporal resolution is not enough for monitoring transient thermal response. After laser irradiation, the blood vessel (red arrow) disappeared in the contrast image. Thus, the tLSCI is still not conducive to the observation of transient phenomena.

3.3. SNR and Temporal-Resolution Improvement by Introducing the ADF Algorithm

The aforementioned results indicate that the tLSCI has high spatial resolution and is more suitable for the observation of transient thermal effects. However, the process is time-consuming because certain frames are needed to improve the SNR. Therefore, we combined the tLSCI and the ADF together to reduce the number of original speckle frames and improve the temporal resolution, while maintaining a high SNR. To quantify the improvement of the SNR and temporal resolution without laser irradiation, the temporal contrast images are compared without/with introducing the ADF: the tLSCI (3 frames), the tLSCI (15 frames), and the tLSCI (3 frames) with the ADF. As shown in Figure 8a,d,g, the temporal contrast images are grainy without the ADF, indicating that the temporal-contrast algorithm has a low SNR. When using three frames of the raw speckle image, the mean SNR of the tLSCI is only 1.40 (Figure 8a,d,g). When the number of original speckle images is increased to 15, the mean SNR of the tLSCI is still only 3.28 (Figure 8b,e,h). By introducing the ADF, the mean SNR is increased to 24.08 (Figure 8c,f,i). The small blood vessels circled in black cannot be resolved by the tLSCI (Figure 8a) but can be clearly resolved by introducing the ADF (Figure 8c). In addition, the noise shown in Figure 8h (black circle) was denoised by the ADF, as shown in Figure 8i. The results demonstrated that the SNR is increased 17.2 times, and the temporal resolution is increased five times (needed frames of raw speckle images are reduced from 15 to 3), respectively. We adopted the widely used contrast-to-noise ratio (CNR) to quantitatively specify the improvement in contrast between the vessels and the surrounding tissue after the application of the ADF algorithm, which was proposed by Song et al., used in near-infrared tomography [18], and applied to laser speckle contrast imaging [19,20]. When three frames are used, the CNR value is improved by 1.4 times on average after using the ADF (from 2.16 to 3.06).

3.4. Label-Free High-Resolution Thrombosis Monitoring by the tLSCI-ADF Algorithm

We demonstrated that the introduction of the ADF improves the SNR and temporal resolution of the tLSCI without therapy laser irradiation. Only three frames of raw speckle image are used to achieve high SNR by applied the ADF after the tLSCI processing. In this section, the effect of the ADF during therapy laser irradiation is further verified. Figure 9a shows the contrast image of the vessel before laser irradiation. As shown in Figure 9b,c, the entire process of thrombus formation, as well as the flowing of the thrombus with the blood, can be clearly monitored by the tLSCI-ADF. In particular, the signal intensity of thrombus shown in this label-free technique in Figure 9c is as strong as that of the fluorescent imaging by Heger et al. [8]. A variety of vascular thermal responses following laser irradiation, such as the disappearance of branch vessels (Figure 9a,d) and the thread-like constriction of main blood vessels (Figure 9d), are also observed. Compared with the tLCSI, this method has a higher SNR and, therefore, reduces the number of raw speckle frames required for contrast analysis to improve the temporal resolution. In this case, just three frames of raw speckle images are used, and the SNR is increased to 22.28, which is 16.14 times the tLSCI during therapy laser irradiation. Thus, the tLSCI-ADF algorithm is a powerful method for the transient thermal response of blood vessels.

3.5. Speckle Flow Index

In addition to observing vessel morphology and thrombus formation, accurate measurement of blood-flow velocity is also critical. Speckle decorrelation time τc is typically used to relate speckle contrast K and flow speed v for Lorentzian velocity distribution:
K = τ c 2 T [ 1 exp ( 2 T τ c ) ] ,
where T is the exposure time of the camera, which was set to 10 ms.
Solving Equation (5) is time-consuming. According to Ramirez-San-Juan et al. [21], Equation (5) can be simplified to the following algebraic expressions, when T/τc > 2,
τ c = 2 T K 2 ,
Therefore, the speckle flow index (SFI) [22,23] can be used to characterize the blood-flow velocity:
SFI = 1 τ c = 1 2 T K 2 ,
In Figure 10, we compared the SFI images processed by the tLSCI without/with introducing the ADF. As shown in Figure 10a,b, the SFI images before and after laser irradiation processed by the tLSCI along are full of noise, and the small blood vessels are indistinguishable, which cannot reflect the decrease in blood-flow rate after laser irradiation. After introducing the ADF, the SNR of the blood vessels before and after the laser irradiation is greatly improved, as shown in Figure 10c,d. The blood vessels are clearly distinguishable, and the details of tiny blood vessels can be recognized. The thrombus is formed after the laser irradiation, the right branch blood vessel is blocked, and the blood-flow rate is decreased.
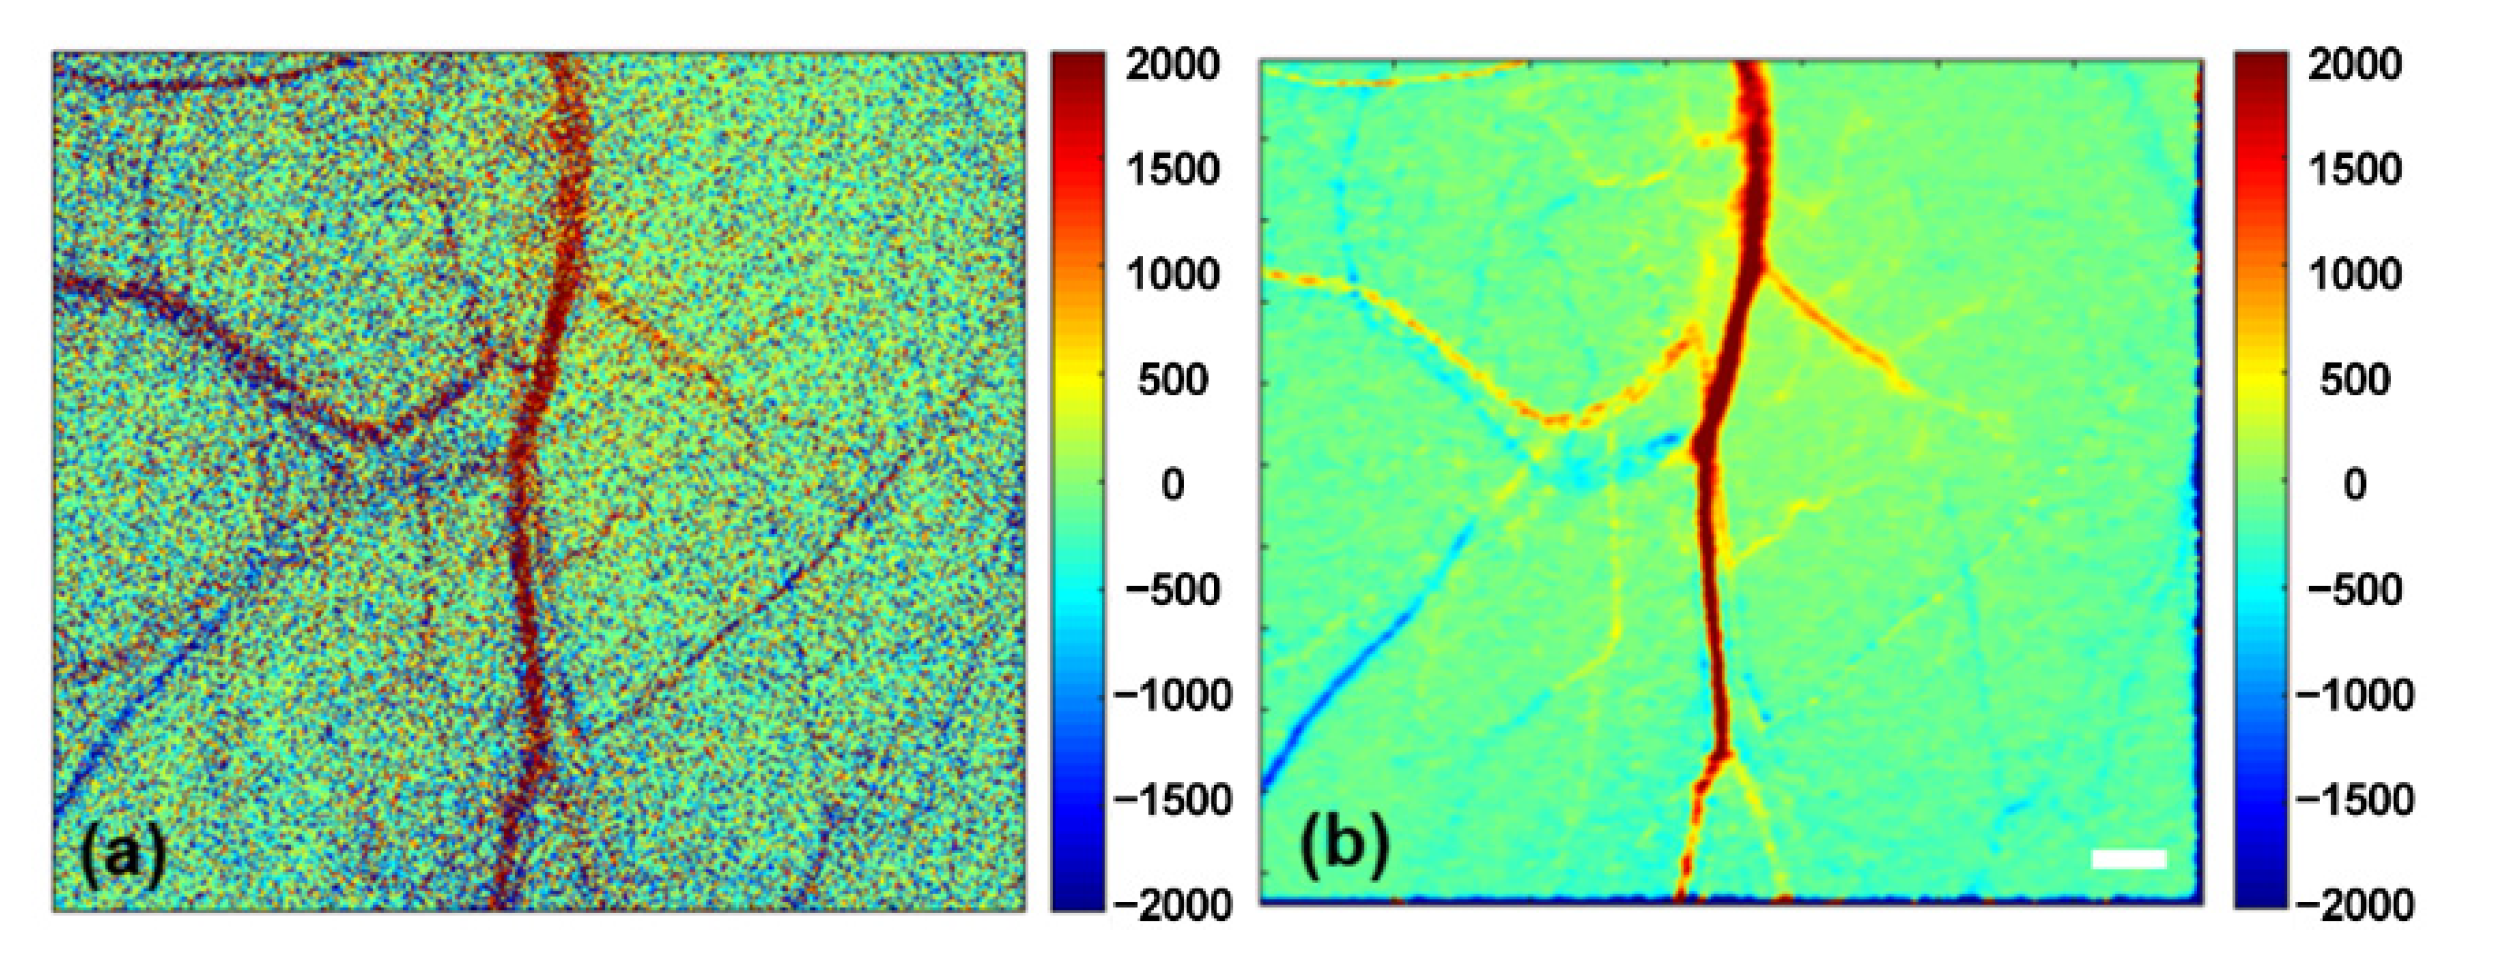
In order to more intuitively show the blood-flow changes and blood-vessel morphology, the difference between the images before and after laser irradiation in Figure 10 is computed, and the results are shown in Figure 11. The temporal SFI image has a low SNR, so the blood-flow change is difficult to display. Upon introducing the ADF, the SFI image with higher SNR accurately shows the decrease in blood-flow rate after laser irradiation.

3.6. Blood-Flow Monitoring during Laser Irradiation Using the SFI

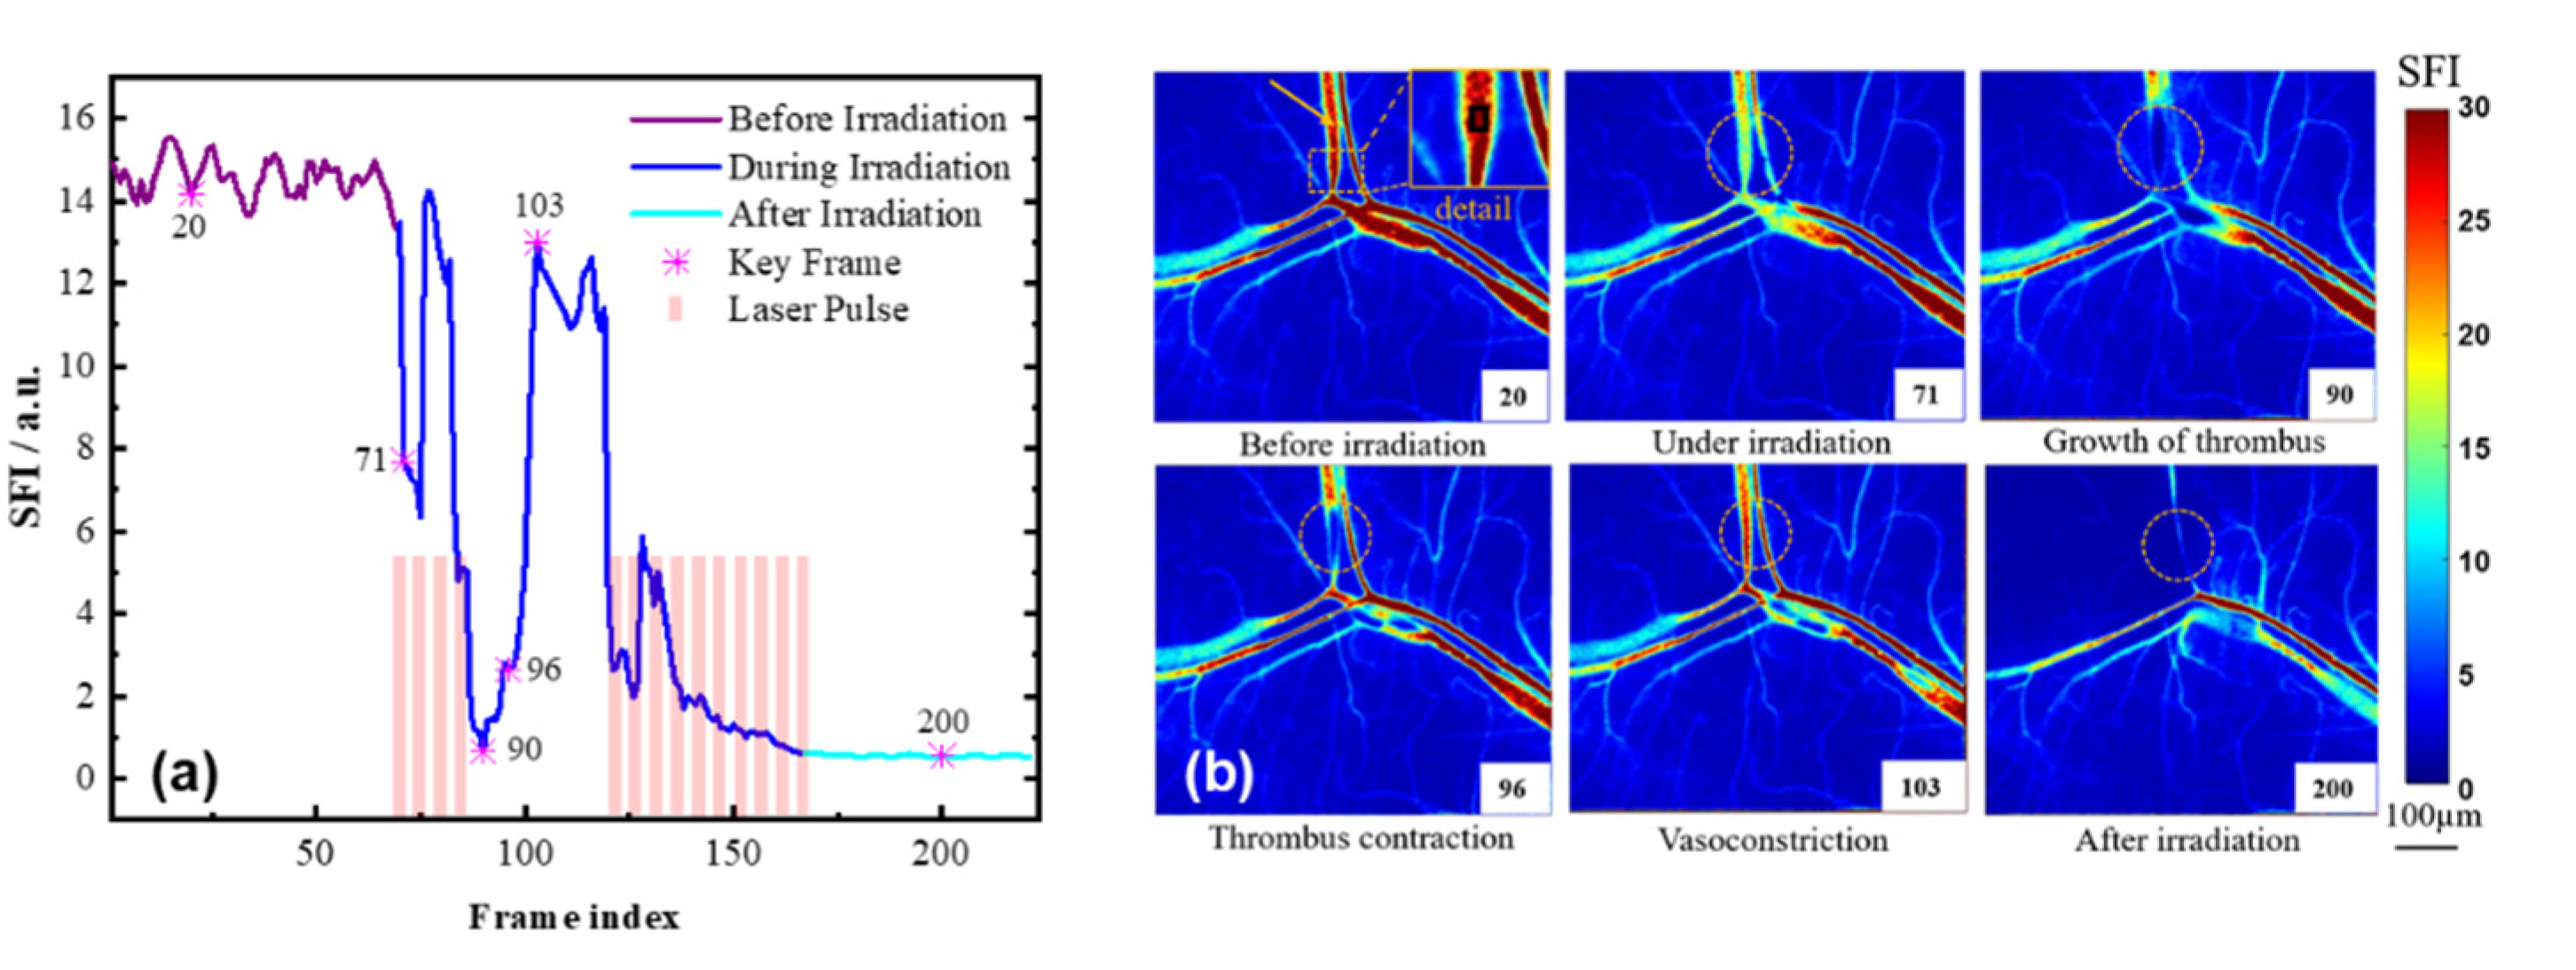
The variation of the SFI over time in each frame can be used to monitor the hemodynamic changes during the transient thermal response of the blood vessel. The incident laser energy density is 57 J/cm2, and the repetition rate is 4 Hz. The pulse width is 0.3 ms, and the spot diameter is 3 mm. Figure 12 shows the SFI variation with laser pulse (red line) and the SFI images in important instants. The blood vessels are intact before laser irradiation in Figure 12a. Firstly, four pulses were fired to generate the thrombus. After 2.5 s, 10 more pulses were fired to occlude the vessel. The target vessel is pointed by the orange arrow in the Figure 12b (frame index: 20), and the black rectangle area is monitored by the SFI. The regions of interest are circled in red. As shown in Figure 12a, the blood-flow rate is relatively high before the laser pulse (red line), with a mean SFI of 14.54. After each pulse, the SFI decreases because the laser-induced thrombus does not completely block the vessel, and it then increases because the thrombus is flushed away by blood pressure. After the fourth pulse, the SFI reduces to a minimum value of 0.66, owing to the obstruction of the blood vessel by blood clots, as shown in Figure 12b (frame index: 90). Afterwards, the thrombus begins to contract and flow away due to the greater blood pressure (Figure 12b, frame index: 96), and the SFI increases to 2.63. When the thrombus is completely drained, the SFI value recovers to 12.99, and the blood vessel is partially constricted (Figure 12b, frame index: 103). After the 14th pulse, the blood vessels are completely blocked, and the blood flow is stabilized to a minimum value of 0.56 (Figure 12b, frame index: 200). The results demonstrated the feasibility of using SFI to obtain blood-flow images during laser surgery and its capability to monitor whether the desired thermal response is achieved.

4. Discussion

The LSCI has proven to be a simple and versatile tool to visualize the structure of capillary and to monitor blood flow including cortical [24,25], neurovascular [26,27], retinal blood flow [28,29,30], dermal blood flow [31,32,33,34], etc. This study evaluated the potential of combining the LSCI and ADF filter as a tool for monitoring transient thermal responses of blood vessel during laser irradiation. The present study demonstrates the limitations of the traditional LSCI algorithm to monitor the hemodynamics and laser-induced thrombus. In comparison, our LSCI system based on instrumental and algorithmic improvements exhibits a better SNR as well as better spatial and temporal resolutions. Additionally, the blood-flow-velocity changes during laser surgery can be indicated by the SFI. These features enable this technology a potential non-invasive tool for the study of microcirculation.
We determined the range of temporal and spatial resolution for characterization of thrombus formation. The spatial resolution of the LSCI system depends on the ratio of the sCMOS pixel size to the total system magnification. The sCMOS pixel size in our system is 6.5 µm, and the total system magnification is 2.2×. Therefore, the spatial resolution of our system is 3 µm. According to the principle of the tLSCI, the spatial resolution of the temporal contrast image is 3 µm. However, the spatial resolution of the map obtained by the sLSCI was reduced by the use of 5 × 5 square of pixels from 3 µm to 15 µm, which is one-fifth of that of the tLSCI. Owing to the low spatial resolution of the sLSCI, the thrombus formation during laser irradiation cannot be observed. Accordingly, we suggest that the spatial resolution for thrombus observation should be higher than 3 µm. Our sCMOS has a sampling rate of 60 Hz. The temporal resolution of the tLSCI method was approximately from 0.05 s to 0.1 s to 0.15 s (3/60, 6/60, 9/60), which was determined by the sampling frequency of the sCMOS camera and the number of frames used to obtain one temporal-contrast image. The results in Section 3.2 show that the temporal-contrast map obtained from three frames of the raw speckle images has the best effect on thrombus monitoring. Therefore, the optimal temporal resolution for the characterization of thrombus formation should be higher than 0.05 s.
Interestingly, the signal of laser-induced thrombus visualized by our device is as strong as fluorescently labeled thrombosis. It is worth analyzing the inner essence of this phenomenon. The LSCI is based on the interactions of laser light with moving particles, known as the dynamic light scattering theory, and the speckle pattern encodes the velocity information. The faster the movement of scattered particles, such as red blood cells, is, the quicker the dynamic light-scattering-signal changes and the lower the contrast. The photothermal laser–tissue interactions cause the aggregation of red blood cells and thrombus formation, which decreases its movement. Therefore, the change speed of the scattered signal of the thrombus is decreased, and the contrast value is increased, which may be the main reason for their signal enhancement. Moreover, the SNR and resolution improvement by the combination of the ADF greatly improves the performance of the LSCI. In addition, the change in the optical properties of laser-induced thrombus may also be one of the reasons, which needs further study.
This study demonstrated that the LSCI is highly effective in determining microvascular blood flow in the dorsal skin chamber model. In this model, the skin of the SD rat is removed and the blood vessels are exposed. For the future detection of human skin tissue, the blood vessels will be concealed inside the skin, which limits the depth of speckle imaging. The optical clearing technology can enhance the imaging depth, which is expected to be coupled with laser speckle technology to achieve clearer imaging.

5. Conclusions

In this work, an LSCI system was constructed to monitor the transient thrombosis formation during transient laser surgery. The introducing of the ADF to the temporal contrast image (tLSCI) can increase the temporal resolution by five times and the SNR by 17.2 times and 16.14 times, without and with laser therapy, respectively. Through the optimized design of the light path and the application of the ADF, the thrombus during laser surgery can be observed by the naked eye without any exogenous labels. The blood flow can be characterized by the speckle flow index, to reduce the computational cost, which can be used to determine whether the desired thermal response is achieved during laser therapy.
With an incident laser energy of 57 J/cm2, pulse width of 0.3 ms, and repetition rate of 4 Hz, the ideal therapeutic effect is achieved after 14 pulses, when the thrombus formed and blocked the blood vessel. This proved the combination of the tLSCI and the ADF as a powerful tool for hemodynamic monitoring during laser irradiation.

Supplementary Materials

The following supporting information can be downloaded at: https://www.mdpi.com/article/10.3390/photonics9080520/s1, Video S1: Blood-flow monitoring during laser irradiation using the SFI.

Author Contributions

Conceptualization, X.S. (Xu Sang) and B.C.; methodology, X.S. (Xu Sang); software, X.S. (Xu Sang); validation, X.S. (Xu Sang), D.P. and X.S. (Xuehao Sang); investigation, X.S. (Xu Sang); resources, X.S. (Xu Sang), D.L. and B.C.; data curation, X.S. (Xu Sang); writing—original draft preparation, X.S. (Xu Sang); writing—review and editing, B.C. All authors have read and agreed to the published version of the manuscript.

Funding

This research was funded by the National Natural Science Foundation of China, grant number 51727811, and the Fundamental Research Funds for the Central Universities.

Institutional Review Board Statement

Not applicable.

Informed Consent Statement

Not applicable.

Data Availability Statement

Not applicable.

Conflicts of Interest

The authors declare no conflict of interest.

References

  1. Alster, T.S.; Wilson, F. Treatment of port-wine stains WITH the flashlamp-pumped pulsed dye-laser-extended clinical-experience in children and adults. Ann. Plast. Surg. 1994, 32, 478–484. [Google Scholar] [CrossRef] [PubMed]
  2. Anderson, R.R.; Parrish, J.A. Microvasculature can be selectively damaged using dye lasers: A basic theory and experimental evidence in human skin. Lasers Surg. Med. 1981, 1, 263–276. [Google Scholar] [CrossRef] [PubMed]
  3. Kelly, K.M.; Choi, B.; McFarlane, S.; Motosue, A.; Jung, B.J.; Khan, M.H.; Ramirez-San-Juan, J.C.; Nelson, J.S. Description and analysis of treatments for port-wine stain birthmarks. Arch. Facial Plast. Surg. 2005, 7, 287–294. [Google Scholar] [CrossRef] [PubMed] [Green Version]
  4. Li, D.; Li, R.; Jia, H.; Chen, B.; Wu, W.; Ying, Z. Experimental and Numerical Investigation on the Transient Vascular Thermal Response to Multi-Pulse Nd:YAG Laser. Lasers Surg. Med. 2017, 49, 852–865. [Google Scholar] [CrossRef]
  5. Jia, H.; Chen, B.; Li, D. Dynamic optical absorption characteristics of blood after slow and fast heating. Lasers Med. Sci. 2017, 32, 513–525. [Google Scholar] [CrossRef]
  6. Fercher, A.F.; Briers, J.D. flow visualization by means of single-exposure speckle photography. Opt. Commun. 1981, 37, 326–330. [Google Scholar] [CrossRef]
  7. Jia, W.; Sun, V.; Tran, N.; Choi, B.; Liu, S.-W.; Mihm, M.C., Jr.; Phung, T.L.; Nelson, J.S. Long-Term Blood Vessel Removal With Combined Laser and Topical Rapamycin Antiangiogenic Therapy: Implications for Effective Port Wine Stain Treatment. Lasers Surg. Med. 2010, 42, 105–112. [Google Scholar] [CrossRef] [Green Version]
  8. Heger, M.; Salles, I.I.; Bezemer, R.; Cloos, M.A.; Mordon, S.R.; Begu, S.; Deckmyn, H.; Beek, J.F. Laser-induced primary and secondary hemostasis dynamics and mechanisms in relation to selective photothermolysis of port wine stains. J. Dermatol. Sci. 2011, 63, 139–147. [Google Scholar] [CrossRef]
  9. Ma, J.; Chen, B.; Zhang, Y.; Li, D.; Xing, Z.L. Multiple laser pulses in conjunction with an optical clearing agent to improve the curative effect of cutaneous vascular lesions. Lasers Med. Sci. 2017, 32, 1321–1335. [Google Scholar] [CrossRef]
  10. Nebritova, O.A. A study of hemodynamics and the structure of capillary blood flow using the method of laser speckle contrast analysis LASCA. J. Phys. Conf. Ser. 2019, 1348, 012065. [Google Scholar] [CrossRef]
  11. Hu, Z.; Li, D.; Zhong, X.; Li, Y.; Xuan, A.; Yu, T.; Zhu, J.; Zhu, D. In vivo tissue optical clearing assisted through-skull targeted photothrombotic ischemic stroke model in mice. J. Biomed. Opt. 2022, 27, 065001. [Google Scholar] [CrossRef] [PubMed]
  12. Song, L.; Wang, X.; Zhang, R.; Zhang, K.; Zhou, Z.; Elson, D.S. Improving temporal resolution and speed sensitivity of laser speckle contrast analysis imaging based on noise reduction with an anisotropic diffusion filter. J. Opt. 2018, 20, 075301. [Google Scholar] [CrossRef] [Green Version]
  13. Tripathi, M.M.; Hajjarian, Z.; Van Cott, E.M.; Nadkarni, S.K. Assessing blood coagulation status with laser speckle rheology. Biomed. Opt. Express 2014, 5, 817–831. [Google Scholar] [CrossRef]
  14. Briers, J.D.; Webster, S. Laser speckle contrast analysis (LASCA): A nonscanning, full-field technique for monitoring capillary blood flow. J. Biomed. Opt. 1996, 1, 174–179. [Google Scholar] [CrossRef]
  15. Li, P.C.; Ni, S.L.; Zhang, L.; Zeng, S.Q.; Luo, Q.M. Imaging cerebral blood flow through the intact rat skull with temporal laser speckle imaging. Opt. Lett. 2006, 31, 1824–1826. [Google Scholar] [CrossRef]
  16. Qiu, J.; Li, P.; Luo, W.; Wang, J.; Zhang, H.; Luo, Q. Spatiotemporal laser speckle contrast analysis for blood flow imaging with maximized speckle contrast. J. Biomed. Opt. 2010, 15, 016003. [Google Scholar] [CrossRef]
  17. Cheng, W.; Zhu, X.; Chen, X.; Li, M.; Lu, J.; Li, P. Manhattan Distance-Based Adaptive 3D Transform-Domain Collaborative Filtering for Laser Speckle Imaging of Blood Flow. IEEE Trans. Med. Imaging 2019, 38, 1726–1735. [Google Scholar] [CrossRef]
  18. Song, X.M.; Pogue, B.W.; Jiang, S.D.; Doyley, M.M.; Dehghani, H.; Tosteson, T.D.; Paulsen, K.D. Automated region detection based on the contrast-to-noise ratio in near-infrared tomography. Appl. Opt. 2004, 43, 1053–1062. [Google Scholar] [CrossRef] [Green Version]
  19. Sang, X.; Li, D.; Chen, B. Improving imaging depth by dynamic laser speckle imaging and topical optical clearing for in vivo blood flow monitoring. Lasers Med. Sci. 2021, 36, 387–399. [Google Scholar] [CrossRef]
  20. Murari, K.; Li, N.; Rege, A.; Jia, X.; All, A.; Thakor, N. Contrast-enhanced imaging of cerebral vasculature with laser speckle. Appl. Opt. 2007, 46, 5340–5346. [Google Scholar] [CrossRef]
  21. Ramirez-San-Juan, J.C.; Ramos-Garcia, R.; Guizar-Iturbide, I.; Martinez-Niconoff, G.; Choi, B. Impact of velocity distribution assumption on simplified laser speckle imaging equation. Opt. Express 2008, 16, 3197–3203. [Google Scholar] [CrossRef] [PubMed] [Green Version]
  22. Kim, H.; Lee, Y.; Lee, S.; Kim, J.G. Changes in Breast-tumor Blood Flow in Response to Hypercapnia during Chemotherapy with Laser Speckle Flowmetry. Curr. Opt. Photonics 2019, 3, 555–565. [Google Scholar]
  23. Owen, Y.; David, C.; Bernard, C. Real-time blood flow visualization using the graphics processing unit. J. Biomed. Opt. 2011, 16. [Google Scholar]
  24. Kazmi, S.M.S.; Richards, L.M.; Schrandt, C.J.; Davis, M.A.; Dunn, A.K. Expanding applications, accuracy, and interpretation of laser speckle contrast imaging of cerebral blood flow. J. Cereb. Blood Flow Metab. 2015, 35, 1076–1084. [Google Scholar] [CrossRef] [PubMed] [Green Version]
  25. Hecht, N.; Woitzik, J.; Koenig, S.; Horn, P.; Vajkoczy, P. Laser speckle imaging allows real-time intraoperative blood flow assessment during neurosurgical procedures. J. Cereb. Blood Flow Metab. 2013, 33, 1000–1007. [Google Scholar] [CrossRef]
  26. Yoon, J.-H.; Jeong, Y. In vivo imaging for neurovascular disease research. Arch. Pharmacal Res. 2019, 42, 263–273. [Google Scholar] [CrossRef]
  27. Tarantini, S.; Fulop, G.A.; Kiss, T.; Farkas, E.; Zolei-Szenasi, D.; Galvan, V.; Toth, P.; Csiszar, A.; Ungvari, Z.; Yabluchanskiy, A. Demonstration of impaired neurovascular coupling responses in TG2576 mouse model of Alzheimer’s disease using functional laser speckle contrast imaging. Geroscience 2017, 39, 465–473. [Google Scholar] [CrossRef] [Green Version]
  28. Briers, J.D.; Fercher, A.F. Retinal blood-flow visualization by means of laser speckle photography. Investig. Ophthalmol. Vis. Sci. 1982, 22, 255–259. [Google Scholar]
  29. Patel, D.D.; Lipinski, D.M. Validating a low-cost laser speckle contrast imaging system as a quantitative tool for assessing retinal vascular function. Sci. Rep. 2020, 10, 7177. [Google Scholar] [CrossRef]
  30. Asano, T.; Kunikata, H.; Yasuda, M.; Nishiguchi, K.M.; Abe, T.; Nakazawa, T. Ocular microcirculation changes, measured with laser speckle flowgraphy and optical coherence tomography angiography, in branch retinal vein occlusion with macular edema treated by ranibizumab. Int. Ophthalmol. 2021, 41, 151–162. [Google Scholar] [CrossRef]
  31. Forrester, K.R.; Tulip, J.; Leonard, C.; Stewart, C.; Bray, R.C. A laser speckle imaging technique for measuring tissue perfusion. IEEE Trans. Biomed. Eng. 2004, 51, 2074–2084. [Google Scholar] [CrossRef] [PubMed]
  32. Huang, Y.-C.; Tran, N.; Nelson, J.S.; Choi, B. Noninvasive blood flow imaging for real-time feedback during laser therapy of port wine stain birthmarks. In Proceedings of the 3rd Frontiers in Biomedical Devices Conference and Exposition, Irvine, CA, USA, 18–20 June 2008; pp. 111–112. [Google Scholar]
  33. Allan, D.; Chockalingam, N.; Naemi, R. Validation of a non-invasive imaging photoplethysmography device to assess plantar skin perfusion, a comparison with laser speckle contrast analysis. J. Med. Eng. Technol. 2021, 45, 170–176. [Google Scholar] [CrossRef] [PubMed]
  34. Gnyawali, S.C.; Blum, K.; Pal, D.; Ghatak, S.; Khanna, S.; Roy, S.; Sen, C.K. Retooling Laser Speckle Contrast Analysis Algorithm to Enhance Non-Invasive High Resolution Laser Speckle Functional Imaging of Cutaneous Microcirculation. Sci. Rep. 2017, 7, 41048. [Google Scholar] [CrossRef] [PubMed] [Green Version]
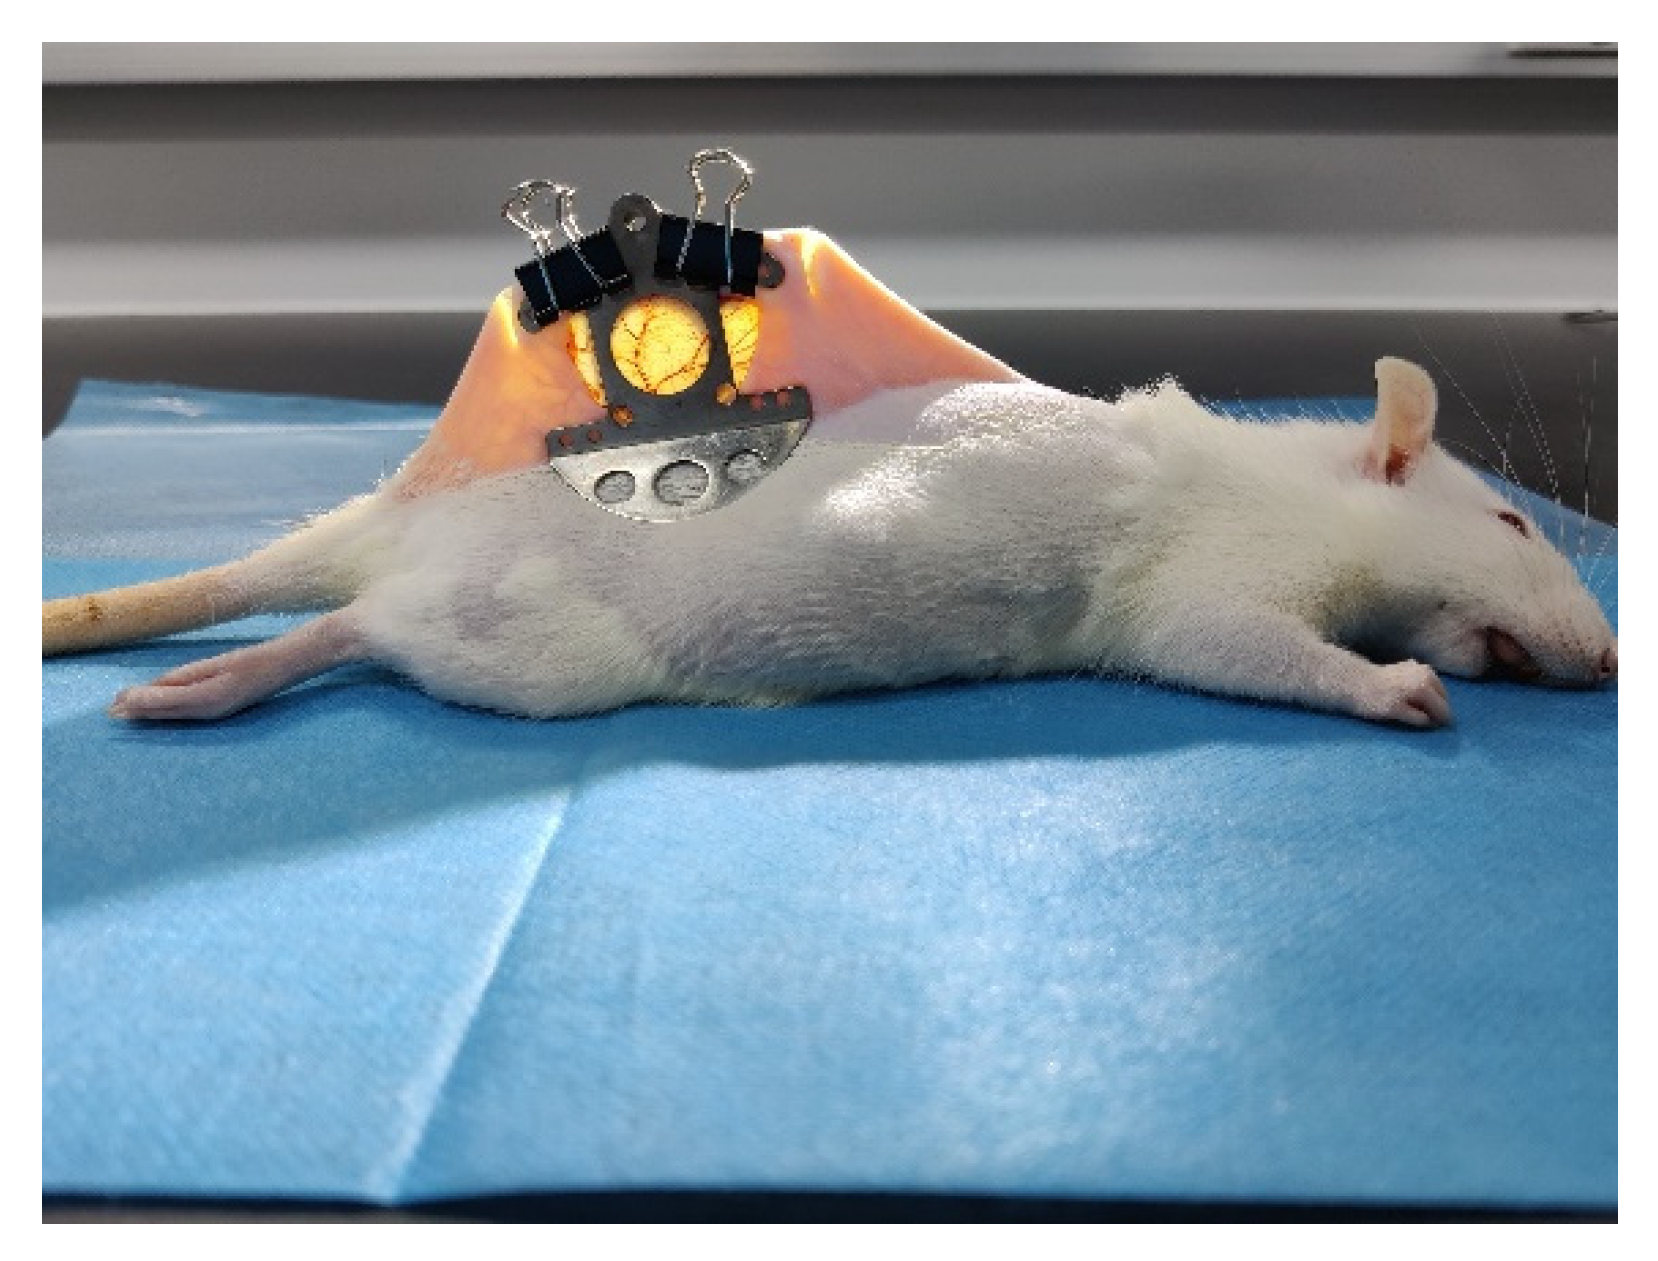
Figure 1. Dorsal skin chamber window.
Photonics 09 00520 g001
Figure 2. Laser speckle contrast imaging based blood-flow monitoring system during transient laser irradiation.
Photonics 09 00520 g002
Figure 3. The elimination of overexposure by the band-pass filter (scale bar = 100 µm, K is the spatial contrast). (a) Raw speckle image, (b) contrast image without filtering, (c) contrast image with filtering.
Photonics 09 00520 g003
Figure 4. Schemas of the sLSCI and tLSCI (blue arrow: the number of pixels of the original speckle image required for contrast analysis, red arrow: ergodic direction for contrast analysis). (a) sLSCI, (b) tLSCI.
Photonics 09 00520 g004
Figure 5. The tLSCI with the ADF schema.
Photonics 09 00520 g005
Figure 6. Real-time monitoring of blood flow and thrombosis-formation monitoring by using the sLSCI algorithm (scale bar = 100 µm). The red arrow indicates the target vessel. (a) Before irradiation, (b) during irradiation, (c) thrombosis formation, (d) after irradiation.
Photonics 09 00520 g006
Figure 7. Real-time monitoring of blood flow and thrombosis formation by using the tLSCI algorithm. (a,e,i) Before irradiation with 3, 6, 9 frames, respectively, (b,f,j) During irradiation with 3, 6, 9 frames, respectively, (c,g,k) Thrombosis formation with 3, 6, 9 frames, respectively, (d,h,l) After irradiation with 3, 6, 9 frames, respectively.
Photonics 09 00520 g007
Figure 8. Comparison of temporal contrast image and the ADF.
Photonics 09 00520 g008
Figure 9. Real-time monitoring of blood flow and thrombus formation by using the ADF algorithm (scale bar = 100 µm). (a) Before irradiation, (b) during irradiation, (c) thrombosis formation, (d) after irradiation.
Photonics 09 00520 g009
Figure 10. SFI images processed by the tLSCI without/with introducing the ADF (scale bar = 100 µm). (a) Before irradiation (tLSCI), (b) after irradiation (tLSCI), (c) before irradiation (with the ADF), (d) after irradiation (with the ADF).
Photonics 09 00520 g010
Figure 11. SFI difference image processed by the tLSCI without/with introducing ADF (scale bar = 100 µm). (a) tLSCI, (b) tLSCI with introducing ADF.
Photonics 09 00520 g011
Figure 12. Blood-flow monitoring during laser irradiation using SFI. (a) The relationship between SFI and frame index, (b) SFI images at important instants (Video S1).
Photonics 09 00520 g012
Publisher’s Note: MDPI stays neutral with regard to jurisdictional claims in published maps and institutional affiliations.