Article

Deep Deconvolution of Object Information Modulated by a Refractive Lens Using Lucy-Richardson-Rosen Algorithm

1
Institute of Physics, University of Tartu, W. Ostwaldi 1, 50411 Tartu, Estonia
2
PG & Research Department of Physics, The American College, Madurai 625002, India
3
PG & Research Department of Physics, Thiagarajar College, Madurai 625009, India
4
Optical Sciences Centre and ARC Training Centre in Surface Engineering for Advanced Materials (SEAM), School of Science, Swinburne University of Technology, Hawthorn, VIC 3122, Australia
5
Laboratory of Nonlinear Optics, University of Latvia, LV-1004 Riga, Latvia
6
Hee Photonic Labs, LV-1002 Riga, Latvia
7
Tashkent Institute of Irrigation and Agricultural Mechanization Engineers, National Research University, Tashkent 100000, Uzbekistan
8
Tokyo Tech World Research Hub Initiative (WRHI), School of Materials and Chemical Technology, Tokyo Institute of Technology, 2-12-1, Ookayama, Meguro-ku, Tokyo 152-8550, Japan
*
Author to whom correspondence should be addressed.
Photonics 2022, 9(9), 625; https://doi.org/10.3390/photonics9090625
Submission received: 29 July 2022 / Revised: 25 August 2022 / Accepted: 29 August 2022 / Published: 31 August 2022
(This article belongs to the Special Issue Advances and Application of Imaging on Digital Holography)

Abstract

:
A refractive lens is one of the simplest, most cost-effective and easily available imaging elements. Given a spatially incoherent illumination, a refractive lens can faithfully map every object point to an image point in the sensor plane, when the object and image distances satisfy the imaging conditions. However, static imaging is limited to the depth of focus, beyond which the point-to-point mapping can only be obtained by changing either the location of the lens, object or the imaging sensor. In this study, the depth of focus of a refractive lens in static mode has been expanded using a recently developed computational reconstruction method, Lucy-Richardson-Rosen algorithm (LRRA). The imaging process consists of three steps. In the first step, point spread functions (PSFs) were recorded along different depths and stored in the computer as PSF library. In the next step, the object intensity distribution was recorded. The LRRA was then applied to deconvolve the object information from the recorded intensity distributions during the final step. The results of LRRA were compared with two well-known reconstruction methods, namely the Lucy-Richardson algorithm and non-linear reconstruction.

1. Introduction

Imaging objects using spatially incoherent light sources has many advantages such as higher imaging resolution and lower imaging noises such as edge ringing or speckle noises in comparison to coherent sources [1]. Furthermore, the use of spatially incoherent light sources is economical and eye-safe. Due to the aforementioned advantages, the development of incoherent imaging technologies is essential for imaging applications; in many cases, which include astronomical imaging and fluorescence microscopy, such technologies are irreplaceable [1,2,3]. While realizing a 2D incoherent imaging system is easy with a single refractive lens, extending the imaging dimensionality to 3D is a challenging task without introducing dynamic changes to the system. Three-dimensional imaging using spatially incoherent sources is developed along two directions. The first direction is based on the principles of holography involving two beam interferences, phase-shifting, generation of a complex hologram and image reconstruction by numerical back propagation [3,4,5,6]. This direction required extremely complicated optical architectures with numerous optical components due to the constraints of low coherence lengths. Some notable architectures developed in this direction are the rotational shearing interferometer [7], conoscopic holography [8], Fresnel incoherent correlation holography (FINCH) [9,10], Fourier incoherent single channel holography [11] and coded aperture correlation holography [12]. FINCH, which is considered as one of the simplest incoherent digital holography architectures, requires an active device such as a spatial light modulator and multiple optical and opto-mechanical components.
The second research direction of 3D imaging using incoherent light was based on deconvolution, utilizing the linearity conditions of incoherent imaging. This approach, unlike the holography method, does not require two beam interferences, vibration isolation and many optical components. The first report of deconvolution-based imaging was published by Ables and Dicke [13,14]. In these studies, a random pinhole array was used as the only optical element between the object and the sensor. The scattered intensity distribution for an object was recorded, which was deconvolved into the object information using the pre-recorded point spread function (PSF). In comparison to the holography-based 3D imaging approaches, the deconvolution-based approach is faster, simpler, more economical and compact.
The above research directions are not free of challenges and involved many decades of development until the ideas met the technology and vice versa [1,4,15,16]. The incoherent holography methods waited for the development of active optical devices such as SLM and the idea of FINCH. The deconvolution-based methods waited for the development of high-performance computational algorithms and the idea to image in 3D. The deconvolution-based 2D imaging was reported in 1968, while the first 3D spatial imaging was reported in 2017 [17]. Most of the deconvolution-based 3D [18,19,20], 4D [21] and 5D [22,23] imaging techniques were reported in the last five years. In all the above studies, a diffuser-type optical modulator was used between the object and the sensor. Consequently, the signal to noise ratio (SNR) was low in all the above studies. The choice of the optical modulator originated from the requirements of the computational reconstruction algorithm. As most, if not all, computational algorithms are correlation-based, the autocorrelation function is required to be as sharp as possible to sample the object function [24,25]. The scattered intensity distributions in the far-field generate a sharp autocorrelation function as the average speckle size is equal to the diffraction limited spot size allowing diffraction limited imaging.
As diffusers are lossy and affect the SNR, it is necessary to find optical fields that can concentrate light in a small area on the sensor. A recent review from our research group identified a computational processing pair—non-linear reconstruction (NLR) and raising the image to the power of p enabled the use of many deterministic fields for deconvolution-based 2D imaging applications [26]. However, the imaging results varied with the type of optical field and all of them were generated by highly diffractive masks. The above study leads to an important question. Is it possible to use a refractive lens for deconvolution-based 3D imaging? Lucy-Richardson (LRA) is one of the widely used deconvolution algorithms for deblurring images formed by lenses due to depth or motion blur [27,28]. However, the deconvolution range is limited and so the algorithm cannot be applied to cases with large aberrations. Recently, a deconvolution algorithm, Lucy-Richardson-Rosen algorithm (LRRA) was developed by integrating LRA with NLR and applied to infrared microspectroscopy studies by our group [29]. The performance of the algorithm was significantly better than LRA and NLR. In this study, we have applied LRRA to imaging using a refractive lens to computationally extend the depth of focus of imaging.
In the original study on the formulation of LRRA by our group, a condition termed as SALCAD—Sharp Autocorrelation and Low Cross-correlation Along Depth—was suggested as the requirement for 3D imaging. This condition, in simpler words, means that the intensity distributions need to be localized to generate a sharp autocorrelation function and should vary with depth such that the cross-correlation is low. This is an essential condition for 3D imaging as when one plane of the object is computationally refocused, the information from other planes should appear weak. In our past study, this condition on a plane was fulfilled as the infrared imaging system consisted of Cassegrain objective lenses which generated localized intensity distributions in the form of four lobes in the presence of axial aberrations. Besides, the intensity distribution varied with depth fulfilling the second part of the condition of SALCAD. However, fulfilling SALCAD also means that the optical modulator is required to distribute light to a larger area, which decreases the signal to noise ratio. In this study, LRRA has been applied to blurred intensity distributions for the first time. Secondly, in the previous study and in correlation-based incoherent holography systems, a low spatial coherence and a high temporal coherence (Δλ ~ 1 nm) is desirable. In this study, we investigate LRRA in a case with a broader spectral width Δλ > 20 nm. Finally, the expected impact is significant as the focal depth of the refractive lens is low and the proposed method can extend it computationally better than LRA and NLR. This opens the possibility for 3D imaging. Finally, the proposed system consists of only one optical element—a refractive lens—which makes the system compact, lightweight, and low-cost (~20 Euros), which are significant advantages in comparison to existing self-interference incoherent holography systems. In comparison to existing single-element systems [22,23], the proposed method is expected to have a better signal to noise ratio as the energy is concentrated in a small area of the sensor.
The manuscript consists of six sections. The methodology is discussed in the next section. In the Section 3, the simulation studies are presented. The experimental studies are presented in the Section 4. The discussion of 3D imaging with incoherent light is presented in the Section 5. In the Section 6, conclusion and future perspectives of the study are discussed.

2. Materials and Methods

The optical configuration of the imaging system is shown in Figure 1. A quasi-monochromatic light source—no spatial coherence and high temporal coherence—is considered for illumination. A point object at r o ¯ = ( x o , y o ) with an amplitude of I o is located at a distance of zs from a refractive lens with a complex amplitude of exp [ j π R 2 / ( λ f ) ] , where f is the focal length of the lens given as 1 f = 1 u + 1 z h , u is the ideal object distance, zh is the distance between the refractive lens and the sensor and ideal image distance, λ is the wavelength and R is the radial coordinate given as R = x 2 + y 2 . The complex amplitude of light reaching the refractive lens is given as ψ 1 = C 1 I o Q ( 1 z s ) L ( r o ¯ z s ) , where Q ( 1 / z s ) = exp [ j π R 2 / ( λ z s ) ] and L ( o ¯ / z s ) = exp [ j 2 π ( o x x + o y y ) / ( λ z s ) ] are the quadratic and linear phases, zs is the actual object distance and the axial aberration is quantified as zs-u and C1 is a complex constant. The complex amplitude after the optical modulator is given as ψ 2 = C 1 I o Q ( 1 z 1 ) L ( r o ¯ z s ) , where z 1 = z s f f z s . The intensity distribution obtained in the sensor plane located at a distance of zh is the PSF given as
I P S F = | C 2 I o L ( r o ¯ z s ) Q ( 1 z 1 ) Q ( 1 z h ) | 2
where ‘⊗’ is a 2D convolutional operator. When zs = u, the imaging condition is satisfied, z1 becomes zh and a point image is obtained on the sensor. The lateral resolution in the object plane is given as 1.22λzs/D, where D is the diameter of the lens. The axial resolution of the system is given as 8 λ ( z s / D ) 2 and the magnification of the system is given as M = zh/zs. By the linearity condition of incoherent imaging, the intensity distribution obtained for an object with a function O is given as
I O = | I P S F O |
In the direct imaging mode, IO is obtained by sampling of O by IPSF and therefore when the imaging condition is satisfied, the object information gets sampled by the lateral resolution of the system. When the imaging condition is not satisfied, the IPSF is blurred and so is the object information. In indirect imaging mode, the task is to extract O from IO and IPSF. A direct method to extract O is to cross-correlate IO and IPSF as I R = I O I P S F which is given as I R = I P S F O I P S F . Rearranging the terms, we obtain I R = O I P S F I P S F . So, the reconstructed information is the object information sampled by the autocorrelation function of IPSF. The width of the autocorrelation function cannot be smaller than the diffraction limited spot size under normal conditions. When the imaging condition is satisfied or when a diffuser is used, the autocorrelation function is sharp. When the imaging condition is not satisfied, then the autocorrelation function is blurred, making the correlation-based reconstruction not effective. The advanced version of correlation given as a non-linear reconstruction is effective in reducing the background noise arising due to the positive nature of the IPSF during correlation but is affected by the nature of the intensity distribution [24,26]. The non-linear reconstruction is given as
I R = 1 { | I ˜ P S F | α exp [ j · arg ( I ˜ P S F ) ] | I ˜ O | β exp [ j · arg ( I ˜ O ) ] }
where α and β were varied until a minimum background noise is obtained, 1 is inverse Fourier transform operator and I ˜ a is the Fourier transform of Ia. While this is one of the robust correlation-based reconstruction methods, LRA uses a different approach involving the calculation of the maximum likelihood solution but once again from IPSF and IO. The (n+1)th reconstructed image in LRA is given as I R n + 1 = I R n { I O I R n I P S F I P S F } , where I P S F refers to the flipped version of I P S F and the loop is iterated until the maximum likelihood reconstruction is obtained. In the above equation, the denominator has a convolution between two positive functions which results in non-zero values. The initial guess of the LRA is often the recorded image itself and the final solution is a maximum-likelihood solution. As seen in the above equation, there is a forward convolution I R n I P S F and the ratio between this and I O is correlated with I P S F which is replaced by the NLR. This yields a better estimation with reduced background noise and rapid convergence. In this study, the performances of LRA, NLR and LRRA are compared. The schematic of the Lucy-Richardson-Rosen algorithm is shown in Figure 2.

3. Simulation Studies

A simulation study was carried out in MATLAB using Fresnel diffraction formulation. A mesh grid was created with a pixel size Δ = 10 μm, λ = 650 nm and 500 × 500 pixels matrix. The values of zh and f were selected as 0.8 m and 0.4 m, respectively, and zs was varied from 0.4 m to 1.2 m in steps of 0.1 m. The recorded PSFs for zs = 0.4 to 1.2 m in steps of 0.1 m is shown in Figure 3. A test object ‘CIPHR’ was used, and the object intensity distributions were calculated by a convolution between the test object and the PSF. The images of the test object for different cases of axial aberrations are shown in Figure 3. The reconstruction results using LRA, NLR and LRRA are shown in Figure 3. It can be seen that the performance of LRRA is significantly better than LRA and better than NLR. The LRA and NLR had consistent reconstruction conditions such as 20 iterations and α = 0 and β = 0.6. In the case of LRRA, the conditions were changed for every case. The values of (α, β, n) for zs = 0.4 to 1.2 are (0, 0.5, 5), (0, 0.5, 5), (0, 0.5, 5), (0, 0.5, 5), (0, 0.5, 1), (0, 0.5, 8), (0, 0.5, 8), (0, 0.5, 8) and (0, 0.6, 5), respectively. In the case of NLR, the reconstruction improves when the PSF pattern is larger as expected due to improvement in sharpness of autocorrelation function with larger patterns. A 3D simulation was carried out by accumulating the 2D intensity distributions into cube data. The images of the PSF, object variation from 0.6 to 1 m and the cross-sectional images of reconstructions of NLR, LRA and LRRA are shown in Figure 4a–e, respectively. Comparing, Figure 4c–e, it is seen that NLR and LRRA performed better than LRA, while LRRA exhibited the best performance.
Prior to the experiment, a simulation study was carried out on a test object similar to the object that was used for optical experiments later. An object similar to a double slit was designed. The simulation conditions were made to match the experimental conditions. The location of the pinhole from the refractive lens was kept at 7 cm, 7.1 cm and 7.2 cm and the PSFs were simulated. The object intensity distribution was estimated by a convolution between the simulated PSF and the test object. The object image was reconstructed using LRA, NLR and LRRA. The simulation results of PSF, direct imaging (DI) and optimal reconstructions of LRA, NLR and LRRA are shown in Figure 5. The simulation results indicate that LRRA performs better than LRA and NLR.

4. Experiments

The experimental setup used in this study is shown in Figure 6. This setup consists of a spatially incoherent light source—a high-power LED (Thorlabs, 170 mW, λ = 650 nm and Δλ = 20 nm). An iris and a refractive lens (L1) of the focal length of 50 mm were used to focus the light from the LED to critically illuminate the object. A pinhole with a diameter of 50 μm was used for recording the PSF library. A refractive lens (L2) with a focal length of f = 35 mm is placed at 2f position between the test object and the image sensor (Quantum QHM495LM 6 Light Webcam) with 480 × 640 pixels and pixel size of ~1.5 μm. The lateral and axial resolutions of the system are 2.2 μm and 40 μm, respectively. A neutral-density filter (ND 1.5) was placed between the image sensor and the L2 to reduce the light intensity.
As a first step in the experiment, the PSF library was recorded by shifting the location of the pinhole along the +z and −z directions in steps of 0.25 mm. Then, the pinhole was replaced by the test object, and the corresponding images were recorded in identical planes to that of the PSF. The PSF library and the object intensity distributions were then fed into the reconstruction algorithm and the images were deconvolved. The experimental set up is highly economical and can be constructed with as low as <20 €. Three test objects were considered for imaging experiments. The first test object is a double slit-like object with a size 1.5 × 0.28 mm (L × B). The images of the PSFs recorded at zs = 7 cm, 7.1 cm and 7. 2 cm, the corresponding direct imaging (DI) results of object and reconstruction results using LRA (n = 20), NLR (α = 0.2, β = 0.7) and LRRA (α = 0.6, β = 0.9) with n = 2, 12 and 12 for the above three cases are shown in Figure 7. The differences between the simulation and experimental results are due to the cumulative effect of the following conditions. The point object used in the simulation was a single pixel object with a size of 10 µm, while the one used in the experiment was 100 µm. The image sensor used in the experiment was a low-cost web camera in which it is not possible to control exposure conditions as it is done in scientific cameras. Most web cameras have their own autocorrection algorithms to enhance images. There were stray lights entering the camera. The above three might have contributed to the increase in background noises. The objects used in simulation only transmit or block light but in experiments, in addition to the above the objects also scatter light. Finally, experimental errors in the form of differences in the locations of the pinhole and objects. We believe that the cumulative effect of all the above caused the discrepancy between simulation and experimental results.
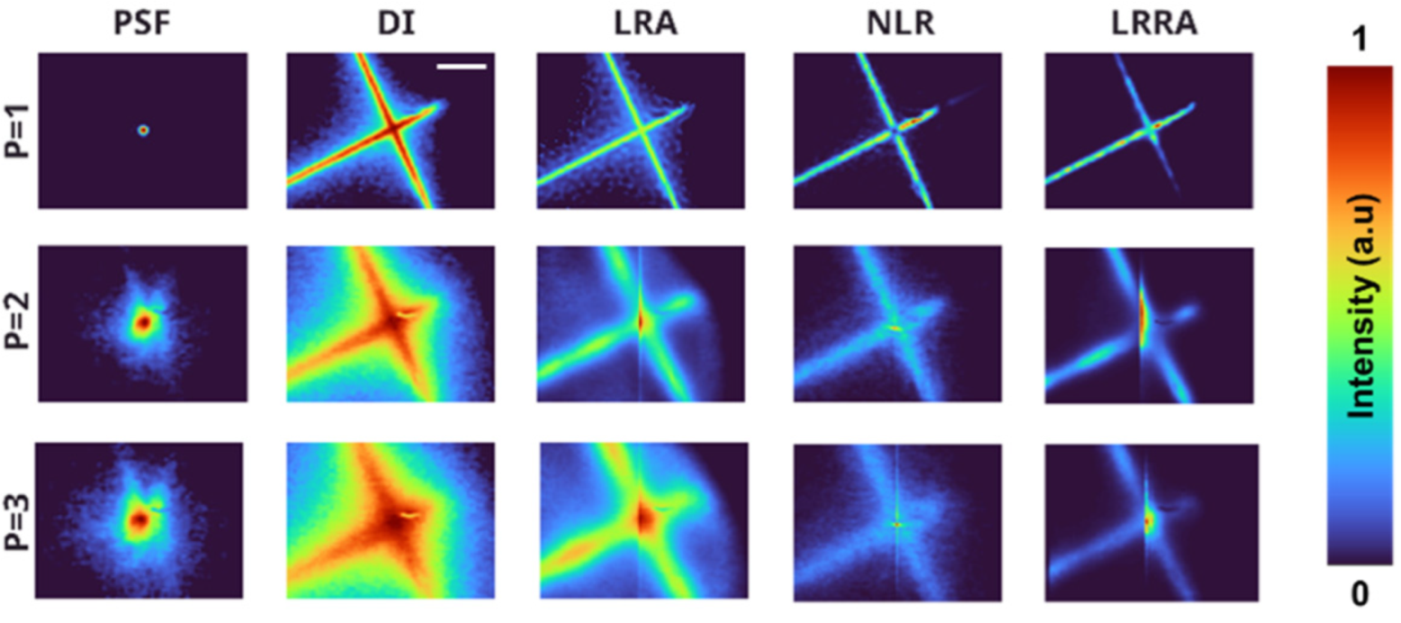
The second test object is a cross-like object with a size 3.06 × 3.4 mm (L × B). The images of the PSFs recorded at zs = 7 cm, 7.2 cm and 7. 4 cm, the corresponding direct imaging (DI) results of object and reconstruction results using LRA (n = 20), NLR (α = 0.2, β = 0.7) and LRRA (α = 0.8, β = 0.9, n = 10), (α = 0.8, β = 1, n = 10) and (α = 0.8, β = 0.9, n = 15) for the above three cases are shown in Figure 8. The third test object consists of two circular objects each with a radius of 360 μm. The images of the PSFs recorded at zs = 7 cm, 7.2 cm and 7. 4 cm; the corresponding direct imaging (DI) results of object and reconstruction results using LRA (n = 20), NLR (α = 0.2, β = 0.7) and LRRA (α = 0.6, β = 0.9, n = 12), (α = 0.8, β = 1, n = 15) and (α = 0.8, β = 1, n = 15) for the above three cases are shown in Figure 9.
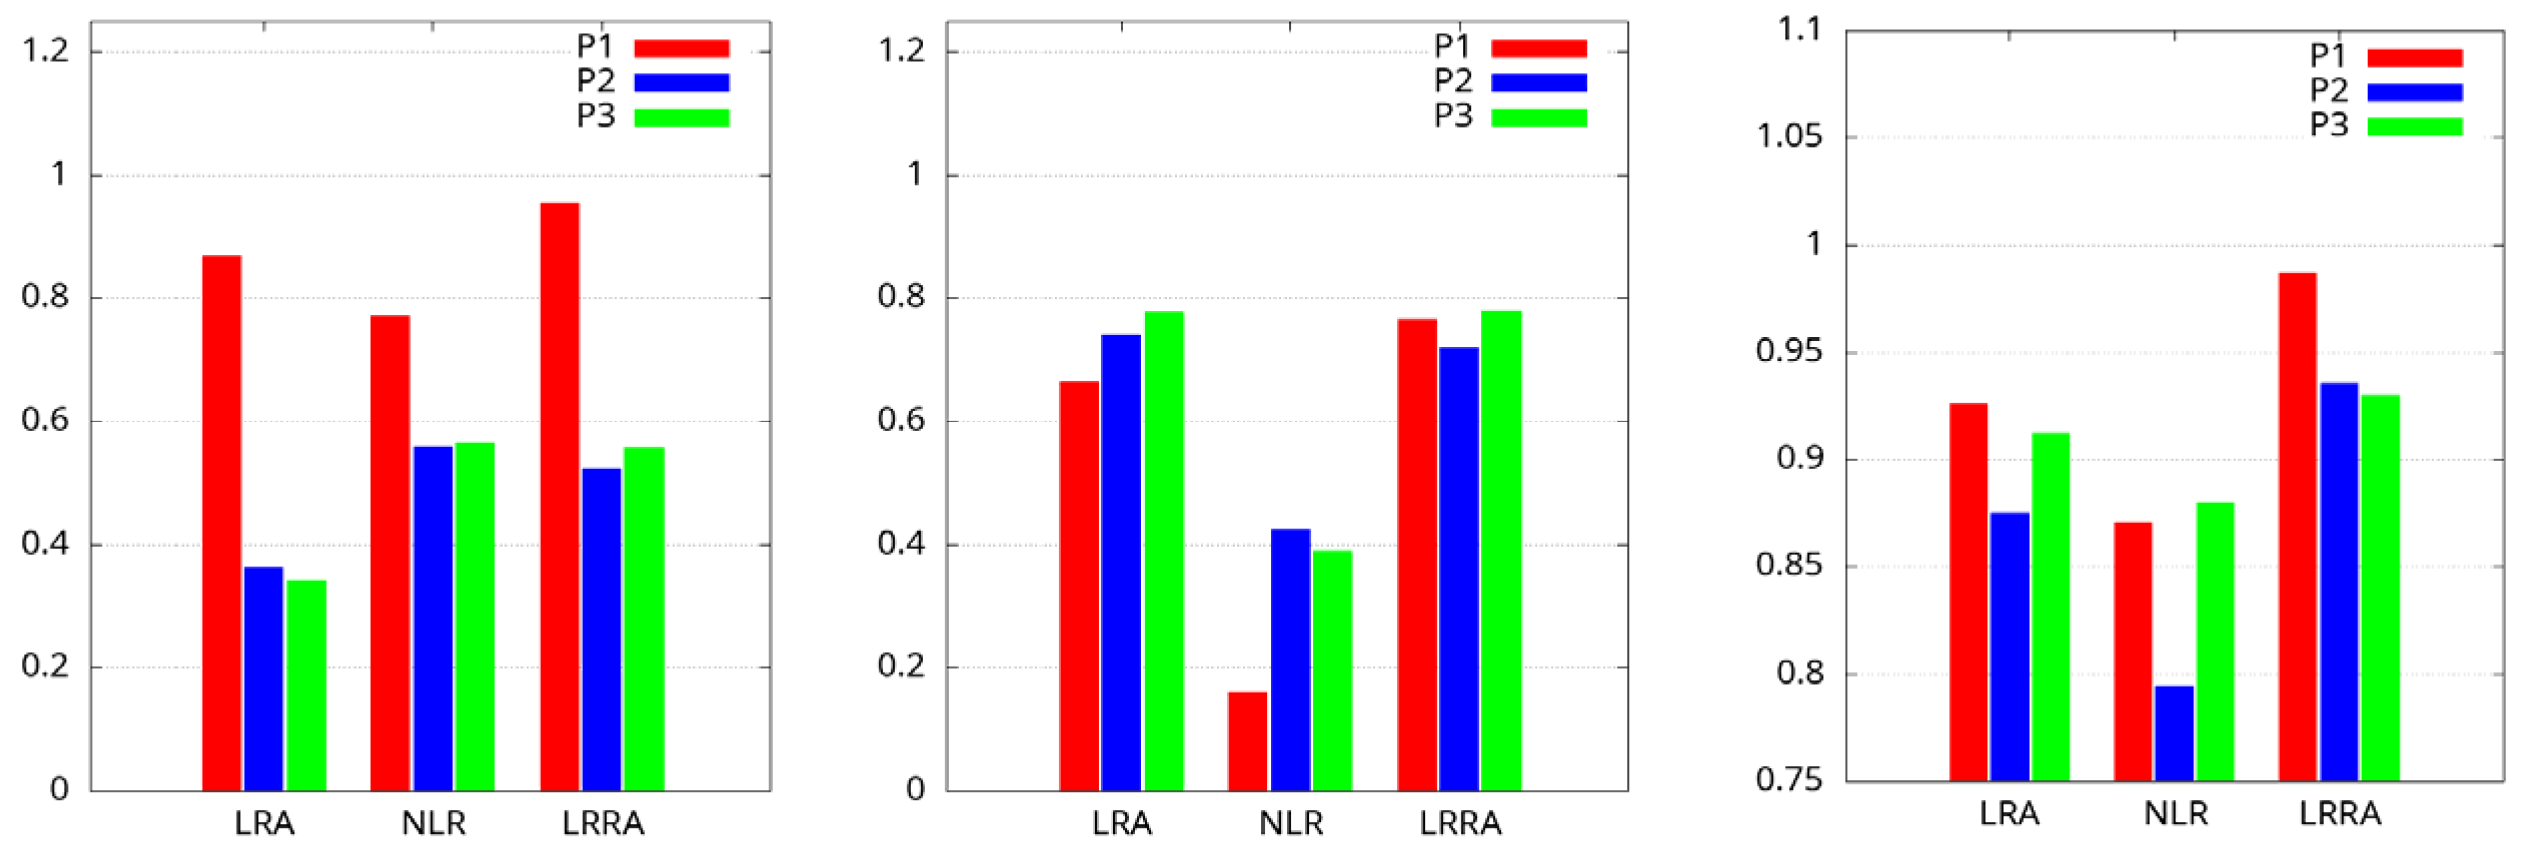
The structural similarity index (SSIM) of the reconstructed images was calculated with respect to the reference image recorded without aberration for direct imaging, LRA, NLR, and LRRA [30]. The SSIM is given as SSIM ( I 1 , I 2 ) = ( 2 μ I 1 μ I 2 + D 1 ) ( 2 σ I 1 I 2 + D 2 ) ( μ I 1 2 + μ I 2 2 + D 1 ) ( σ I 1 2 + σ I 2 2 + D 2 ) , where I1 and I2 are the two compared images; μ I 1 and μ I 2 are the local mean values of I1 and I2, respectively; σ I 1 and σ I 2 are the variances of I1 and I2 with means μ I 1 and μ I 2 ; σ I 1 I 2 is the covariance; D1 and D2 are constants used to maintain the values of components in denominator as non-zeros. The maps of the SSIM for the above cases are shown in Figure 10. It should be noted that the presence of stray light in the recorded images could significantly affect the SSIM index. This could be attributed to the slight variations observed in Figure 10. The SSIM values are plotted as shown in Figure 11. It can be seen that LRRA performed better than both LRA and NLR techniques.

5. Discussion

Are 3D imaging and deconvolution the same or different? In incoherent imaging, the above two terminologies can be used interchangeably. In incoherent imaging, unlike coherent imaging systems where the phase information is recorded, only 3D intensity information is recorded [1]. Let us ask this important question. What is 3D imaging? In a direct imaging system using a lens, only one plane of the object is imaged at a time. In order to image the other planes of the object, the location of one of the components: object, lens or sensor has to be physically modified to satisfy the imaging condition for that plane. This physical process needs to be repeated for every plane of the object until all the information is recorded. This is 3D imaging, but the process consumes more time and requires physical efforts. In indirect imaging, one or a few recordings are done and this process records only one plane of the object in focus, while the other planes of the objects are recorded with different degrees of blur. The blur increases with the increase in difference between the current distance and the required distance to achieve imaging condition. With the prerecorded PSFs, it is possible to digitally refocus to different planes of the object. So, 3D imaging in indirect imaging is only digital refocusing. In the previous sections, digital refocusing has been carried out for an object consisting of only one plane using LRRA, LRA and NLR and it was found that LRRA performs better than both LRA and NLR. This approach can be applied to objects consisting of two or more planes. As a proof of concept, an object consisting of two planes has been constructed using test objects 2 and 3 separated by a distance of 4 mm. The image of the recorded intensity distribution is shown in Figure 12a. As it is seen, test object 3 is in focus, but test object 2 is not. Now applying LRRA as it was done for objects with single plane, test object 2 is digitally refocused during which test object 3 becomes defocused, as shown in Figure 12b. In summary, 3D imaging with incoherent light is only a digital refocusing process of the physically recorded intensity distribution. In other words, 3D imaging with direct imaging methods involve only physical refocusing, whereas 3D imaging with indirect imaging methods involves substantial digital refocusing and one or a few physical recordings.

6. Conclusions

A refractive lens is one of the simplest optical elements that can be used for 2D imaging with spatially incoherent light. However, the depth of focus of imaging is limited to ~λ/NA2, beyond which the object information becomes blurred. There are many computational techniques that can be used to deblur the object information but are often limited to a smaller range of axial aberrations [31,32,33]. In this study, a recently developed computational technique called the LRRA has been implemented for deep deconvolution of images formed by a refractive lens and compared against NLR and LRA. The performance of LRRA seems significantly better than LRA and better than NLR in both simulation as well as experimental studies. Since the simulation and experimental studies confirm the possibility of a higher range of deconvolution, we believe that this study will benefit 3D imaging using spatially incoherent light. In this study, proof-of-concept 3D imaging has been demonstrated. Recalling the novelty conditions described in the introduction, in our original article [29], the intensity distributions were localized and so the autocorrelation function was sharp, and consequently NLR performed better than LRA. In this study, the PSF is blurred and so the autocorrelation function has a width which is twice that of the width of the PSF and so a correlation-based reconstruction system is expected to perform poorly with a low resolution. This is exactly seen in this case when NLR did not reconstruct the object information satisfactorily. The optimal case of LRRA seems to shift between NLR and LRA depending upon the type of intensity distributions and offers a better performance than both methods. In summary, LRRA enables converting a refractive lens-based direct imaging system into a 3D imaging system where direct and indirect imaging methods can co-exist. When the imaging condition is satisfied, it acts as a direct imaging system. When the imaging condition is not satisfied, LRRA is applied to reconstruct the information at that plane using the pre-recorded PSF. To the best of our knowledge, such an incoherent holography system does not exist. We believe that this study will improve the current state-of-the-art incoherent 3D imaging technology.

Author Contributions

Conceptualization, V.A.; methodology, experiments, P.A.P., A.S.J.F.R. and V.A.; software, V.A. and P.A.P.; validation, P.A.P., A.S.J.F.R., T.K. and V.A.; formal analysis, T.K., (Tauno Kahro) S.H.N., D.S., P.A.P., F.G.A., S.G., S.-M.V., A.B., A.N.K.R. and T.K. (Tomas Katkus); investigation, V.A., S.J., A.T., K.K., S.P. and R.A.G.; resources, V.A., A.T., K.K., S.J., S.P. and R.A.G.; data curation, P.A.P., A.S.J.F.R. and V.A.; writing—original draft preparation, P.A.P., A.S.J.F.R. and V.A.; writing—review and editing, All the authors; visualization, A.S.J.F.R., P.A.P. and V.A.; supervision, V.A., S.J., R.A.G., A.T., S.P. and K.K.; project administration, V.A., S.J., A.T., K.K., S.P. and R.A.G.; funding acquisition, V.A., S.J., A.T., S.P., K.K. and R.A.G. All authors have read and agreed to the published version of the manuscript.

Funding

This research was funded by European Union’s Horizon 2020 research and innovation programme grant agreement No. 857627 (CIPHR), ARC Linkage LP190100505 project, European Regional Development Fund project “Emerging orders in quantum and nanomaterials” (TK134), State Education Development Agency (SEDA), Republic of Latvia (Project Number: 1.1.1.2/VIAA/3/19/436) and European Regional Development Fund (1.1.1.5/19/A/003).

Institutional Review Board Statement

Not applicable.

Informed Consent Statement

Not applicable.

Data Availability Statement

The experimental data corresponding to this study are given within the manuscript. Theoretical simulation data are openly available in zenodo.org. DOI: 10.5281/zenodo.6928454.

Acknowledgments

P.A.P.; S.-M.V.; A.S.J.F.R.; V.A. thank Tiia Lillemaa for the administrative support.

Conflicts of Interest

The authors declare no conflict of interest.

References

  1. Rosen, J.; Vijayakumar, A.; Kumar, M.; Rai, M.R.; Kelner, R.; Kashter, Y.; Bulbul, A.; Mukherjee, S. Recent advances in self-interference incoherent digital holography. Adv. Opt. Photon. 2019, 11, 1–66. [Google Scholar] [CrossRef]
  2. Lichtman, J.W.; Conchello, J.A. Fluorescence microscopy. Nat. Methods 2005, 2, 910–919. [Google Scholar] [CrossRef]
  3. Kim, M.K. Adaptive optics by incoherent digital holography. Opt. Lett. 2012, 37, 2694–2696. [Google Scholar] [CrossRef]
  4. Liu, J.-P.; Tahara, T.; Hayasaki, Y.; Poon, T.-C. Incoherent Digital Holography: A Review. Appl. Sci. 2018, 8, 143. [Google Scholar] [CrossRef]
  5. Poon, T.-C. Optical Scanning Holography—A Review of Recent Progress. J. Opt. Soc. Korea 2009, 13, 406–415. [Google Scholar] [CrossRef]
  6. Rosen, J.; Alford, S.; Anand, V.; Art, J.; Bouchal, P.; Bouchal, Z.; Erdenebat, M.-U.; Huang, L.; Ishii, A.; Juodkazis, S.; et al. Roadmap on Recent Progress in FINCH Technology. J. Imaging 2021, 7, 197. [Google Scholar] [CrossRef]
  7. Murty, M.V.R.K.; Hagerott, E.C. Rotational shearing interferometry. Appl. Opt. 1966, 5, 615. [Google Scholar] [CrossRef]
  8. Sirat, G.; Psaltis, D. Conoscopic holography. Opt. Lett. 1985, 10, 4–6. [Google Scholar] [CrossRef]
  9. Rosen, J.; Brooker, G. Digital spatially incoherent Fresnel holography. Opt. Lett. 2007, 32, 912–914. [Google Scholar] [CrossRef]
  10. Kim, M.K. Incoherent digital holographic adaptive optics. Appl. Opt. 2013, 52, A117–A130. [Google Scholar] [CrossRef] [Green Version]
  11. Kelner, R.; Rosen, J.; Brooker, G. Enhanced resolution in Fourier incoherent single channel holography (FISCH) with reduced optical path difference. Opt. Express 2013, 21, 20131–20144. [Google Scholar] [CrossRef]
  12. Vijayakumar, A.; Kashter, Y.; Kelner, R.; Rosen, J. Coded aperture correlation holography–a new type of incoherent digital holograms. Opt. Express 2016, 24, 12430–12441. [Google Scholar] [CrossRef] [PubMed]
  13. Ables, J.G. Fourier Transform Photography: A New Method for X-Ray Astronomy. Publ. Astron. Soc. Aust. 1968, 1, 172–173. [Google Scholar] [CrossRef]
  14. Dicke, R.H. Scatter-Hole Cameras for X-Rays and Gamma Rays. Astrophys. J. Lett. 1968, 153, L101. [Google Scholar] [CrossRef]
  15. Cieślak, M.J.; Gamage, K.A.; Glover, R. Coded-aperture imaging systems: Past, present and future development–A review. Radiat. Meas. 2016, 92, 59–71. [Google Scholar] [CrossRef]
  16. Anand, V.; Rosen, J.; Juodkazis, S. Review of engineering techniques in chaotic coded aperture imagers. Light. Adv. Manuf. 2022, 3, 1–9. [Google Scholar] [CrossRef]
  17. Vijayakumar, A.; Rosen, J. Interferenceless coded aperture correlation holography–a new technique for recording incoherent digital holograms without two-wave interference. Opt. Express 2017, 25, 13883–13896. [Google Scholar] [CrossRef]
  18. Singh, A.K.; Pedrini, G.; Takeda, M.; Osten, W. Scatter-plate microscope for lensless microscopy with diffraction limited resolution. Sci. Rep. 2017, 7, 10687. [Google Scholar] [CrossRef]
  19. Antipa, N.; Kuo, G.; Heckel, R.; Mildenhall, B.; Bostan, E.; Ng, R.; Waller, L. DiffuserCam: Lensless single-exposure 3D imaging. Optica 2018, 5, 1–9. [Google Scholar] [CrossRef]
  20. Sahoo, S.K.; Tang, D.; Dang, C. Single-shot multispectral imaging with a monochromatic camera. Optica 2017, 4, 1209–1213. [Google Scholar] [CrossRef]
  21. Vijayakumar, A.; Rosen, J. Spectrum and space resolved 4D imaging by coded aperture correlation holography (COACH) with diffractive objective lens. Opt. Lett. 2017, 42, 947. [Google Scholar] [CrossRef] [PubMed]
  22. Anand, V.; Ng, S.H.; Maksimovic, J.; Linklater, D.; Katkus, T.; Ivanova, E.P.; Juodkazis, S. Single shot multispectral multidimensional imaging using chaotic waves. Sci. Rep. 2020, 10, 1–13. [Google Scholar] [CrossRef] [PubMed]
  23. Anand, V.; Ng, S.H.; Katkus, T.; Juodkazis, S. Spatio-Spectral-Temporal Imaging of Fast Transient Phenomena Using a Random Array of Pinholes. Adv. Photon. Res. 2021, 2, 2000032. [Google Scholar] [CrossRef]
  24. Rai, M.R.; Anand, V.; Rosen, J. Non-linear adaptive three-dimensional imaging with interferenceless coded aperture correlation holography (I-COACH). Opt. Express 2018, 26, 18143–18154. [Google Scholar] [CrossRef]
  25. Horner, J.L.; Gianino, P.D. Phase-only matched filtering. Appl. Opt. 1984, 23, 812–816. [Google Scholar] [CrossRef]
  26. Smith, D.; Gopinath, S.; Arockiaraj, F.G.; Reddy, A.N.K.; Balasubramani, V.; Kumar, R.; Dubey, N.; Ng, S.H.; Katkus, T.; Selva, S.J.; et al. Nonlinear Reconstruction of Images from Patterns Generated by Deterministic or Random Optical Masks—Concepts and Review of Research. J. Imaging 2022, 8, 174. [Google Scholar] [CrossRef]
  27. Richardson, W.H. Bayesian-Based Iterative Method of Image Restoration. J. Opt. Soc. Am. 1972, 62, 55–59. [Google Scholar] [CrossRef]
  28. Lucy, L.B. An iterative technique for the rectification of observed distributions. Astron. J. 1974, 79, 745. [Google Scholar] [CrossRef]
  29. Anand, V.; Han, M.; Maksimovic, J.; Ng, S.H.; Katkus, T.; Klein, A.; Bambery, K.; Tobin, M.J.; Vongsvivut, J.; Juodkazis, S.; et al. Single-shot mid-infrared incoherent holography using Lucy-Richardson-Rosen algorithm. Opto-Electron. Sci. 2022, 1, 210006. [Google Scholar] [CrossRef]
  30. Wang, Z.; Bovik, A.; Sheikh, H.; Simoncelli, E. Image Quality Assessment: From Error Visibility to Structural Similarity. IEEE Trans. Image Process. 2004, 13, 600–612. [Google Scholar] [CrossRef] [Green Version]
  31. Beck, A.; Teboulle, M. Fast Gradient-Based Algorithms for Constrained Total Variation Image Denoising and Deblurring Problems. IEEE Trans. Image Process. 2009, 18, 2419–2434. [Google Scholar] [CrossRef] [PubMed]
  32. Biemond, J.; Lagendijk, R.; Mersereau, R. Iterative methods for image deblurring. Proc. IEEE 1990, 78, 856–883. [Google Scholar] [CrossRef] [Green Version]
  33. Wang, R.; Tao, D. Recent progress in image deblurring. arXiv 2014, arXiv:1409.6838. [Google Scholar]
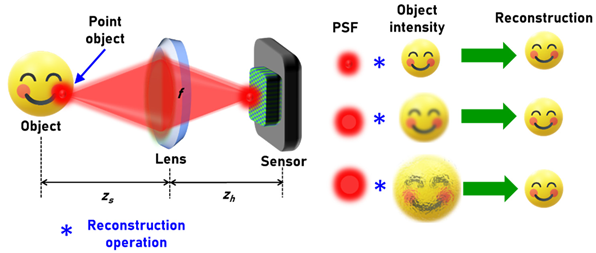
Figure 1. Concept figure of imaging using a refractive lens and computational reconstruction.
Photonics 09 00625 g001
Figure 2. Schematic of LRRA. ML—maximum likelihood; OTF—optical transfer function; n—number of iterations; ⊗—2D convolutional operator; —refers to complex conjugate following a Fourier transform.
Photonics 09 00625 g002
Figure 3. Simulation results of PSF, object intensity and reconstruction results using NLR, LRA and LRRA.
Photonics 09 00625 g003
Figure 4. (a) Image of 3D PSF (zs = 0.6 to 1 m), X-Y cross sectional images obtained from cube data of (b) imaging using a lens, reconstruction using (c) NLR, (d) LRA and (e) LRRA.
Photonics 09 00625 g004
Figure 5. Images of the simulated PSF, DI of the test object, reconstruction results using LRA, NLR and LRRA.
Photonics 09 00625 g005
Figure 6. Photograph of the experimental setup: (1) LED source, (2) Iris, (3) LED power source, (4) Lens L1 (f = 50 mm), (5) Test object, (6) Lens L2 (f = 35 mm), (7) ND filter (ND 1.5), (8) Image sensor and (9) XY stage movement controller.
Photonics 09 00625 g006
Figure 7. Images of the PSF, DI of the test object—1, reconstruction results using LRA, NLR and LRRA. The scale bar has a length of 1 mm.
Photonics 09 00625 g007
Figure 8. Images of the PSF, DI of the test object—2, reconstruction results using LRA, NLR and LRRA. The scale bar has a length of 1 mm.
Photonics 09 00625 g008
Figure 9. Images of the PSF, DI of the test object—3, reconstruction results using LRA, NLR and LRRA. The scale bar has a length of 1 mm.
Photonics 09 00625 g009
Figure 10. SSIM maps for the test objects with respect to the direct imaging and the reconstruction results using LRA, NLR and LRRA. The colormap follows usual grayscale with black being least similarity and white being highest similarity.
Photonics 09 00625 g010
Figure 11. SSIM values of the test objects with respect to the direct imaging and the reconstruction results.
Photonics 09 00625 g011
Figure 12. (a) Image of the recorded intensity distribution for a 4 mm thick object consisting of two thin objects—test object 2 and 3. (b) Reconstructed image using LRRA at the plane of the test object 2.
Photonics 09 00625 g012
Publisher’s Note: MDPI stays neutral with regard to jurisdictional claims in published maps and institutional affiliations.