Communication

Parametric Generation of Variable Spot Arrays Based on Multi-Level Phase Modulation

1
School of Electronic and Science and Engineering, Southeast University, 2 Sipailou, Xuanwu District, Nanjing 210018, China
2
Cambridge University Nanjing Centre of Technology and Innovation, 23 Rongyue Road, Jiangbei New Area, Nanjing 210000, China
3
Centre for Photonic Devices and Sensors, University of Cambridge, 9 JJ Thomson Avenue, Cambridge CB3 0FA, UK
*
Author to whom correspondence should be addressed.
Photonics 2022, 9(9), 633; https://doi.org/10.3390/photonics9090633
Submission received: 12 August 2022 / Revised: 29 August 2022 / Accepted: 30 August 2022 / Published: 2 September 2022
(This article belongs to the Special Issue Computer Holography)

Abstract

:
Holographic generation of beam spot array with high uniformity have been extensively investigated while existing methods cannot combine high quality and tunability. This paper demonstrated a method to generate beam spot array by using phase-only liquid crystal on silicon (LCOS) device. The proposed method is highly flexible and tolerant to the defects within the LCOS device. The uniformity deviation of the speckle array can be limited to within ±5% in the numerical simulation and the experimental results agreed well with the simulation results.

1. Introduction

Generation of beam spot array with high uniformity has been extensively investigated due to its wide range of applications including optical data storage [1,2,3,4], laser processing [5,6], optical switching [7,8], and high-resolution optical imaging [9]. The optical spot array can be generated through optical refraction or diffraction. In the refraction regime, the microlens array [10,11,12] has been widely used. Microlens array can be fabricated by thermal reflow [13,14], microplastic embossing [15,16], and ultrafast laser writing [17], etc. Liquid crystal [18] can also be used to realize microlens arrays with variable focal lengths. However, the pitch of the microlens within an array is often fixed. Therefore, the spot array generated by the microlens array also would have a fixed pitch. In addition, optical spot array generation based on the microlens arrays requires precise alignment of the optical systems, which may include multiple microlens arrays. Therefore, it is a non-trivial task to generate a uniform spot array in this way.
In the diffraction regime, the Dammann grating [19,20] is an effective way to generate optical spot arrays. Dammann gratings are a special form of phase-only binary diffractive optical element (DOE). Fixed Dammann gratings can be fabricated by lithography [21] or direct laser writing [22]. The design of the Dammann gratings with different spot count and arrangement is a non-linear optimization process and often carried out in an iterative process [23]. This can be slow and may not be able to achieve the optimal design. In addition, the performance of the Dammann gratings is highly dependent on accurate representation of the desired binary phase patterns. When the liquid crystal on silicon (LCOS) spatial light modulators (SLMs) [24] are used as the DOE to form reconfigurable Dammann gratings, the displayed phase patterns would inevitably deviate from the ideal design due to the fringing field effect [25], phase flickers [26,27], etc. This can be detrimental to the quality of the generated spot array in some cases. The Dammann gratings are inherently binary while the LCOS devices are capable of multi-level phase modulation. Therefore, it is inefficient to implement Dammann gratings by using the LCOS devices. To fully utilize the LCOS devices, multi-level phase holograms can be generated by advanced algorithms [28] for the generation of the spot array. In the process of the hologram generation, individual pixels are treated as the independent variables for the optimization. As a result, this multi-dimensional optimization process can be extremely complicated, slow, and ineffective.
In this paper, we propose a method to compose the beam splitting holograms by a series of sinusoid functions with different periods. In this way, the holograms for the spot array generation can be described by a few parameters, i.e., the amplitudes and the periods of the sinusoid functions. While the periods of the sinusoid functions determine the pitch within the generated spot array, the amplitudes affect the power distribution between the spots. In addition, the defects within the LCOS device can also be compensated by fine-tuning the amplitude of each sinusoid component. More importantly, this parametric way of describing the complex beam splitting holograms significantly reduced the number of variables for optimization, leading to a faster and more effective optimization process. In a proof-of-concept experiment, we successfully demonstrated that the proposed method was able to generate highly uniform spot array within a few iterations.

2. Methods

In this work, the holograms for the spot array generation are based on a series of sinusoid functions. The phase profiles of the holograms, i.e., Ψ ( x ) , can be described by the following equation,
Ψ ( x ) = i = 1 m a i sin ( 2 π x i T + ( i 1 ) π 2 )
where a i represents the amplitude of each sinusoid functions; T is the base period of the sinusoid functions and is related to the pitch of the spot array.
The operation principle of this type of holograms is illustrated in the Figure 1. The two sinusoid phase profiles shown in Figure 1a have the same period and different amplitudes, i.e., values of a i . It can be seen from their corresponding spot profiles shown in Figure 1b that the difference in the amplitudes leads to a variation in the power distribution within the generated spot array. However, the pitch between the spots is identical. Figure 1c shows two sinusoid phase profiles with the same amplitude but different periods, i.e., T values. The period within the solid blue phase pattern is twice of that within the dark dashed one. The corresponding spot profiles illustrated in Figure 1d show the same power distribution between the generated spots. However, the pitch of the spots in the dark dashed line is twice of that in the solid blue line.
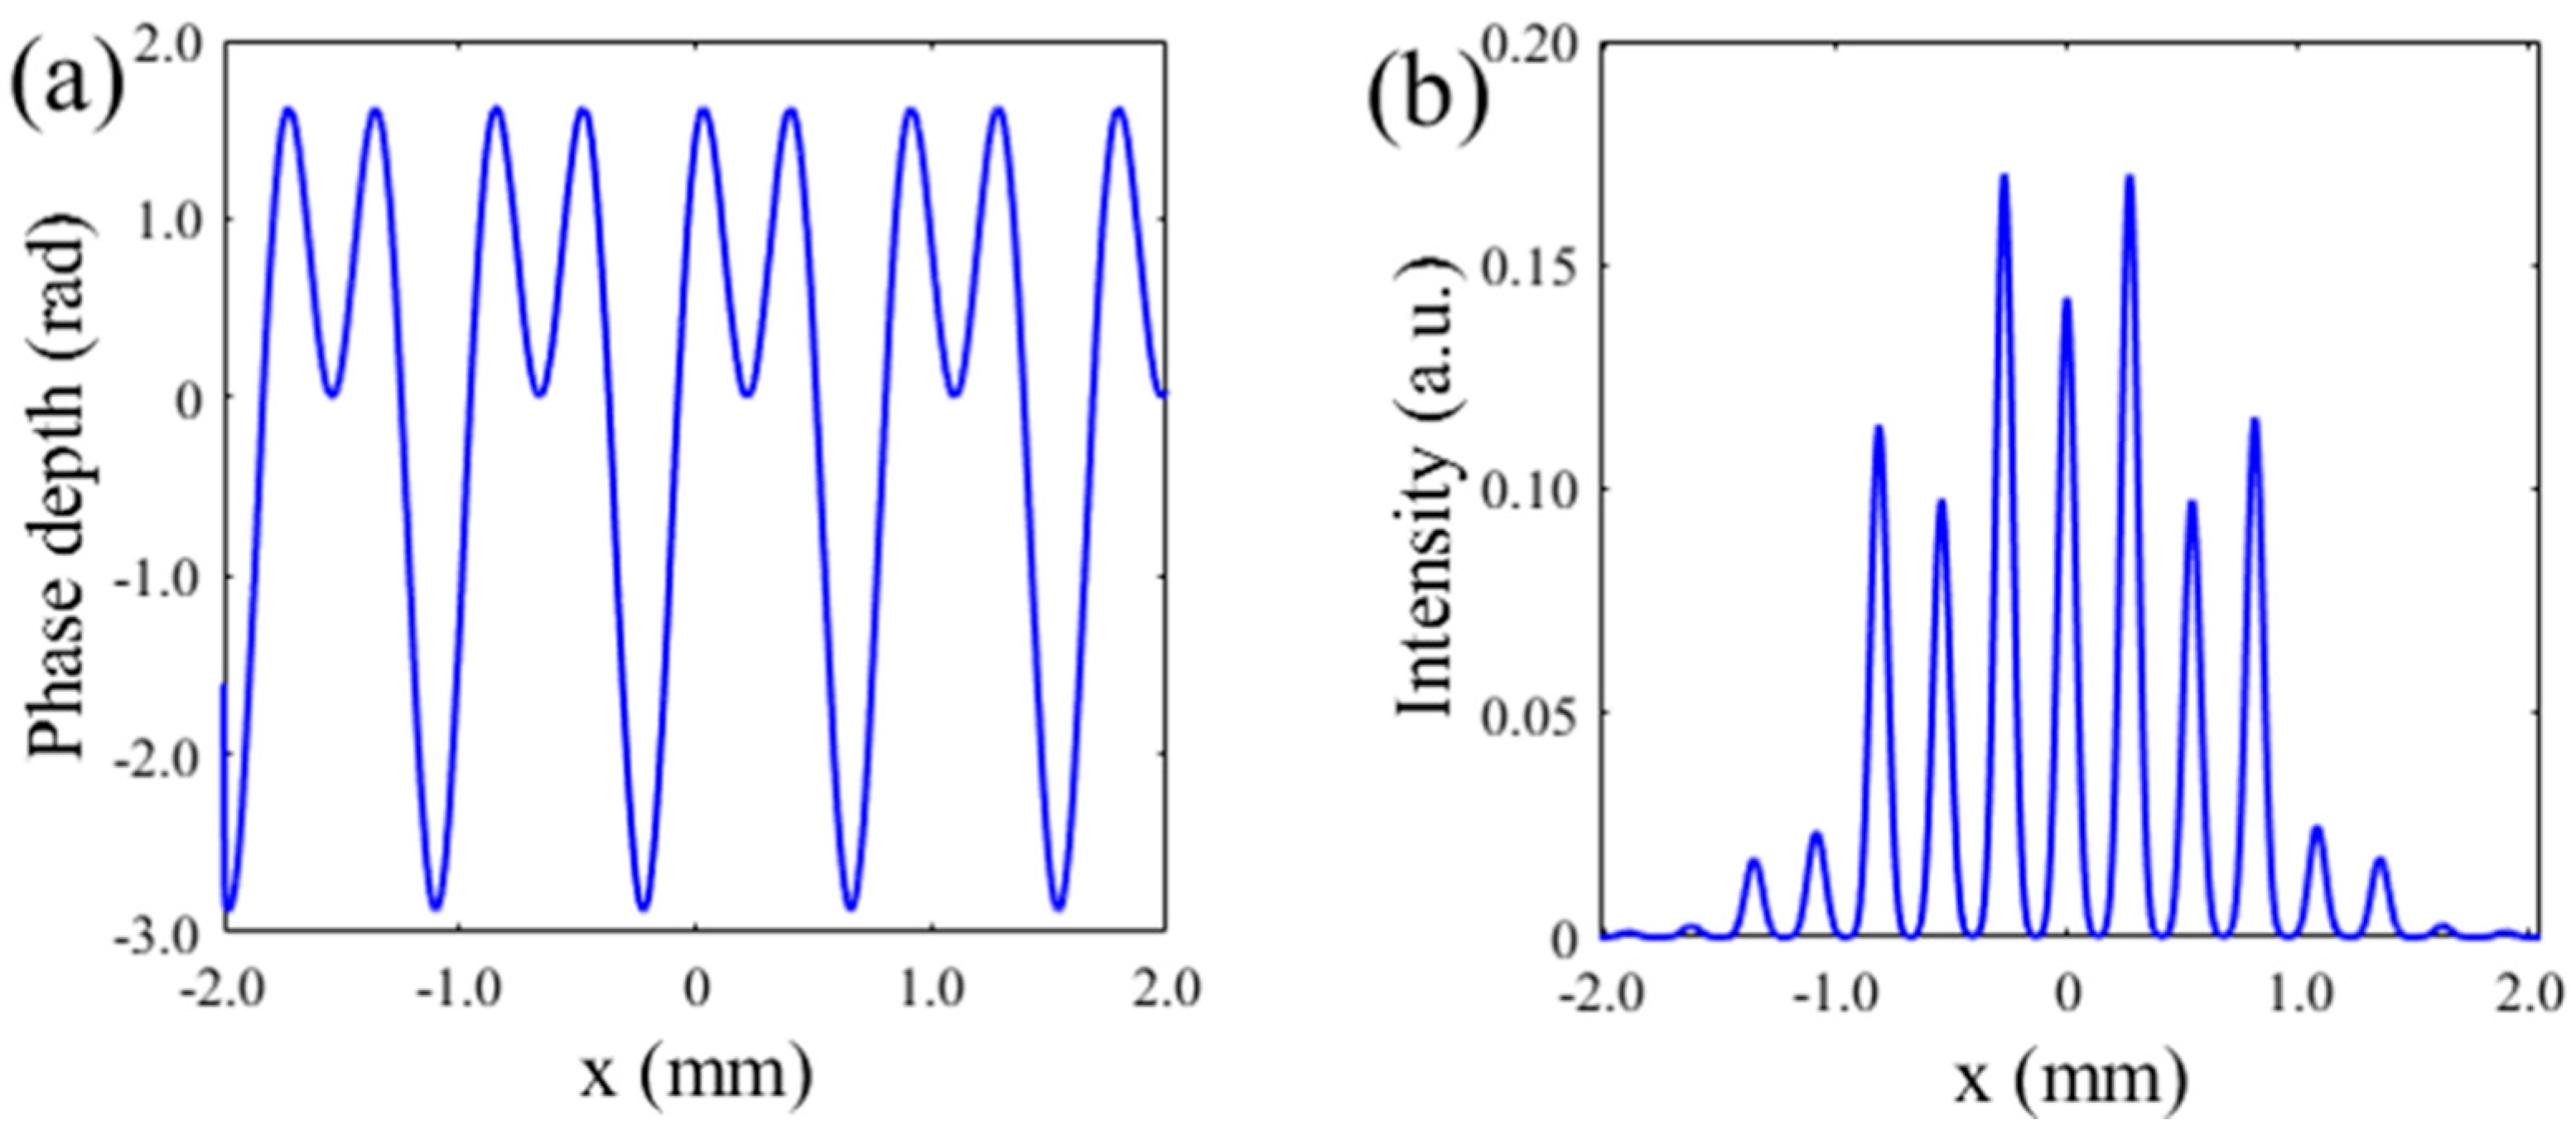
By combining multiple sinusoid functions in the way described in Equation (1), the number of spots can be increased. The example given in Figure 2a is the combination of the two-phase profiles shown in Figure 1c. Its corresponding array profile shown in Figure 2b contains seven spots with substantial power level. For a given target spot array, the number of sinusoid functions can be determined in this way while the amplitude of each sinusoid component can be adjusted to achieve a uniform power distribution between the generated spots. It can also be seen from Figure 2a that the phase profiles based on the combination of sinusoid functions avoid the abrupt phase change between adjacent pixels that are common in either the Dammann gratings or the beam-splitting phase profiles generated by the conventional algorithm. This helps enable the LCOS device to display the designed phase profile as accurately as possible. The inaccurate representation of the designed phase profile by the LCOS device often leads to a non-uniformity within the spot array. The non-uniformity caused by the remaining discrepancy between the designed and the actual phase profile displayed by the LCOS device can be further minimized by fine-tuning the amplitudes of the sinusoid series.
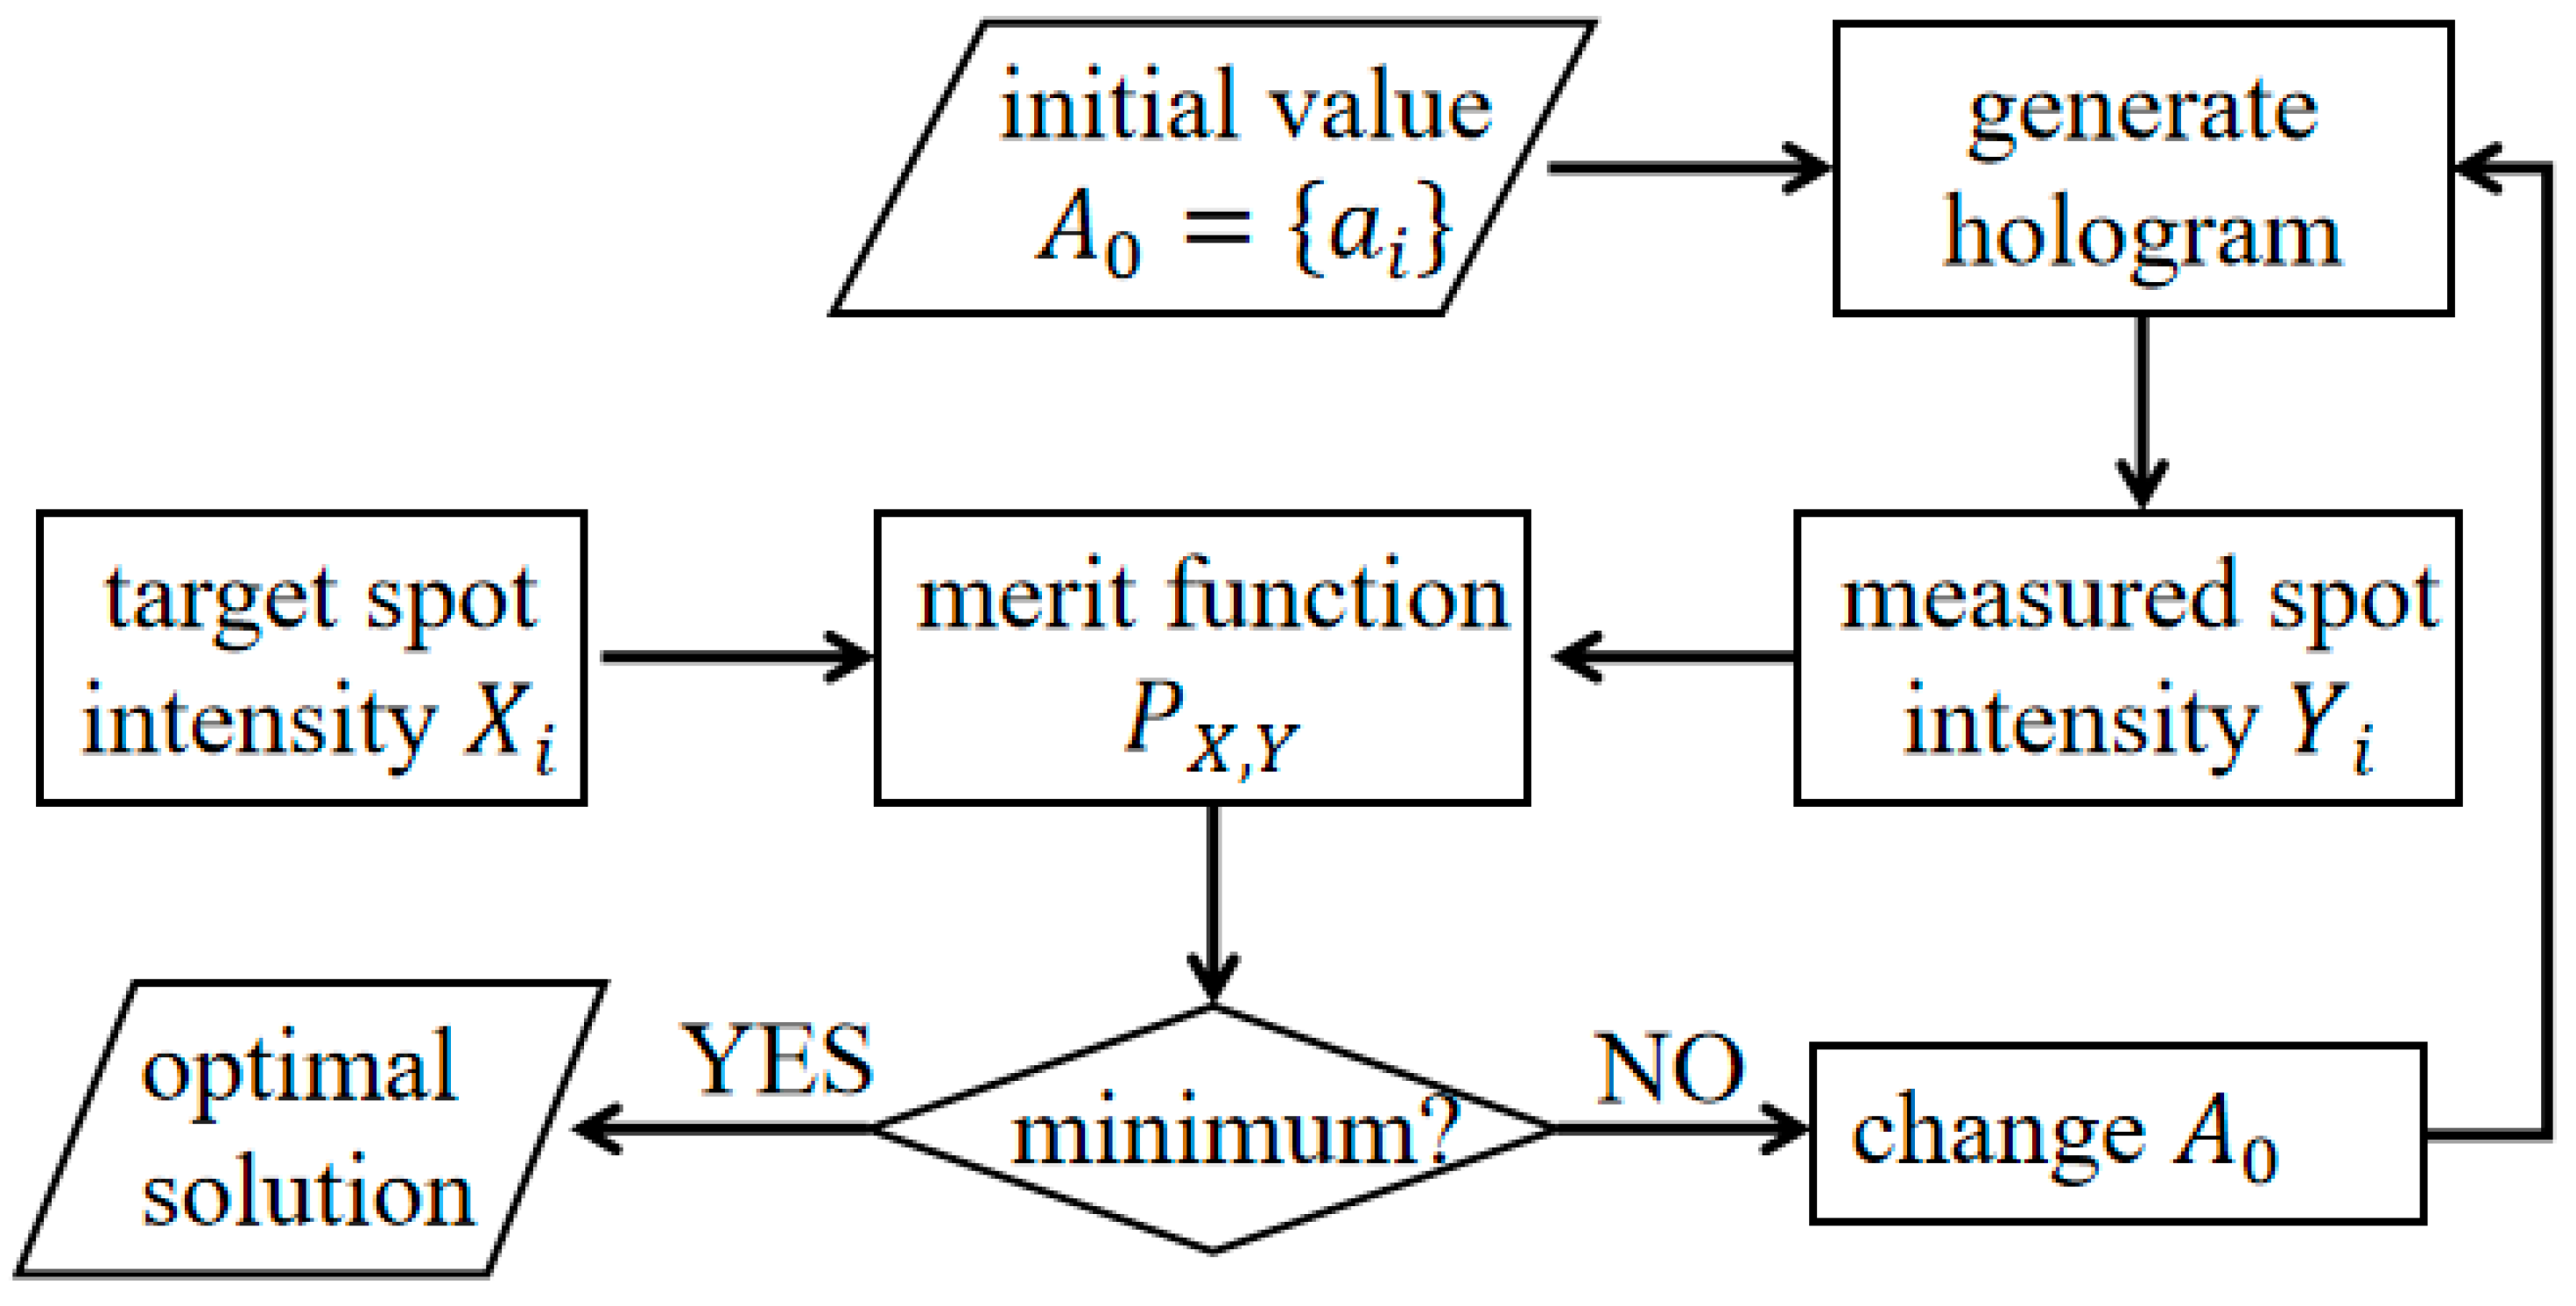
In this scheme, the number of variables for the optimization was proportional to the number of spots within the target array instead of the number of pixels within the holograms. As a result, the number of variables that require optimization was significantly reduced. This enabled the use of the standard small-scale optimization algorithm for the automated generation of the a i value of each sinusoid function. The flow chart of the optimization process used in this work was shown in Figure 3. This iterative process was carried out based on the standard gradient descent algorithm.
The merit function used in this optimization process was based on the Pearson correlation coefficient P X , Y ,
P X , Y = i = 1 n ( X i X ¯ ) ( Y i Y ¯ ) i = 1 n ( X i X ¯ ) 2 i = 1 n ( Y i Y ¯ ) 2
where X i and Y i represent the target and measured spot intensity at the target position within the array, respectively; X ¯ and Y ¯ are the averaged values of all the X i and Y i , respectively. It should be noted that zero padding was applied to the positions outside of the target array region. This proves to be an effective way to maximize the diffraction efficiency of the generated holograms.

3. Simulation

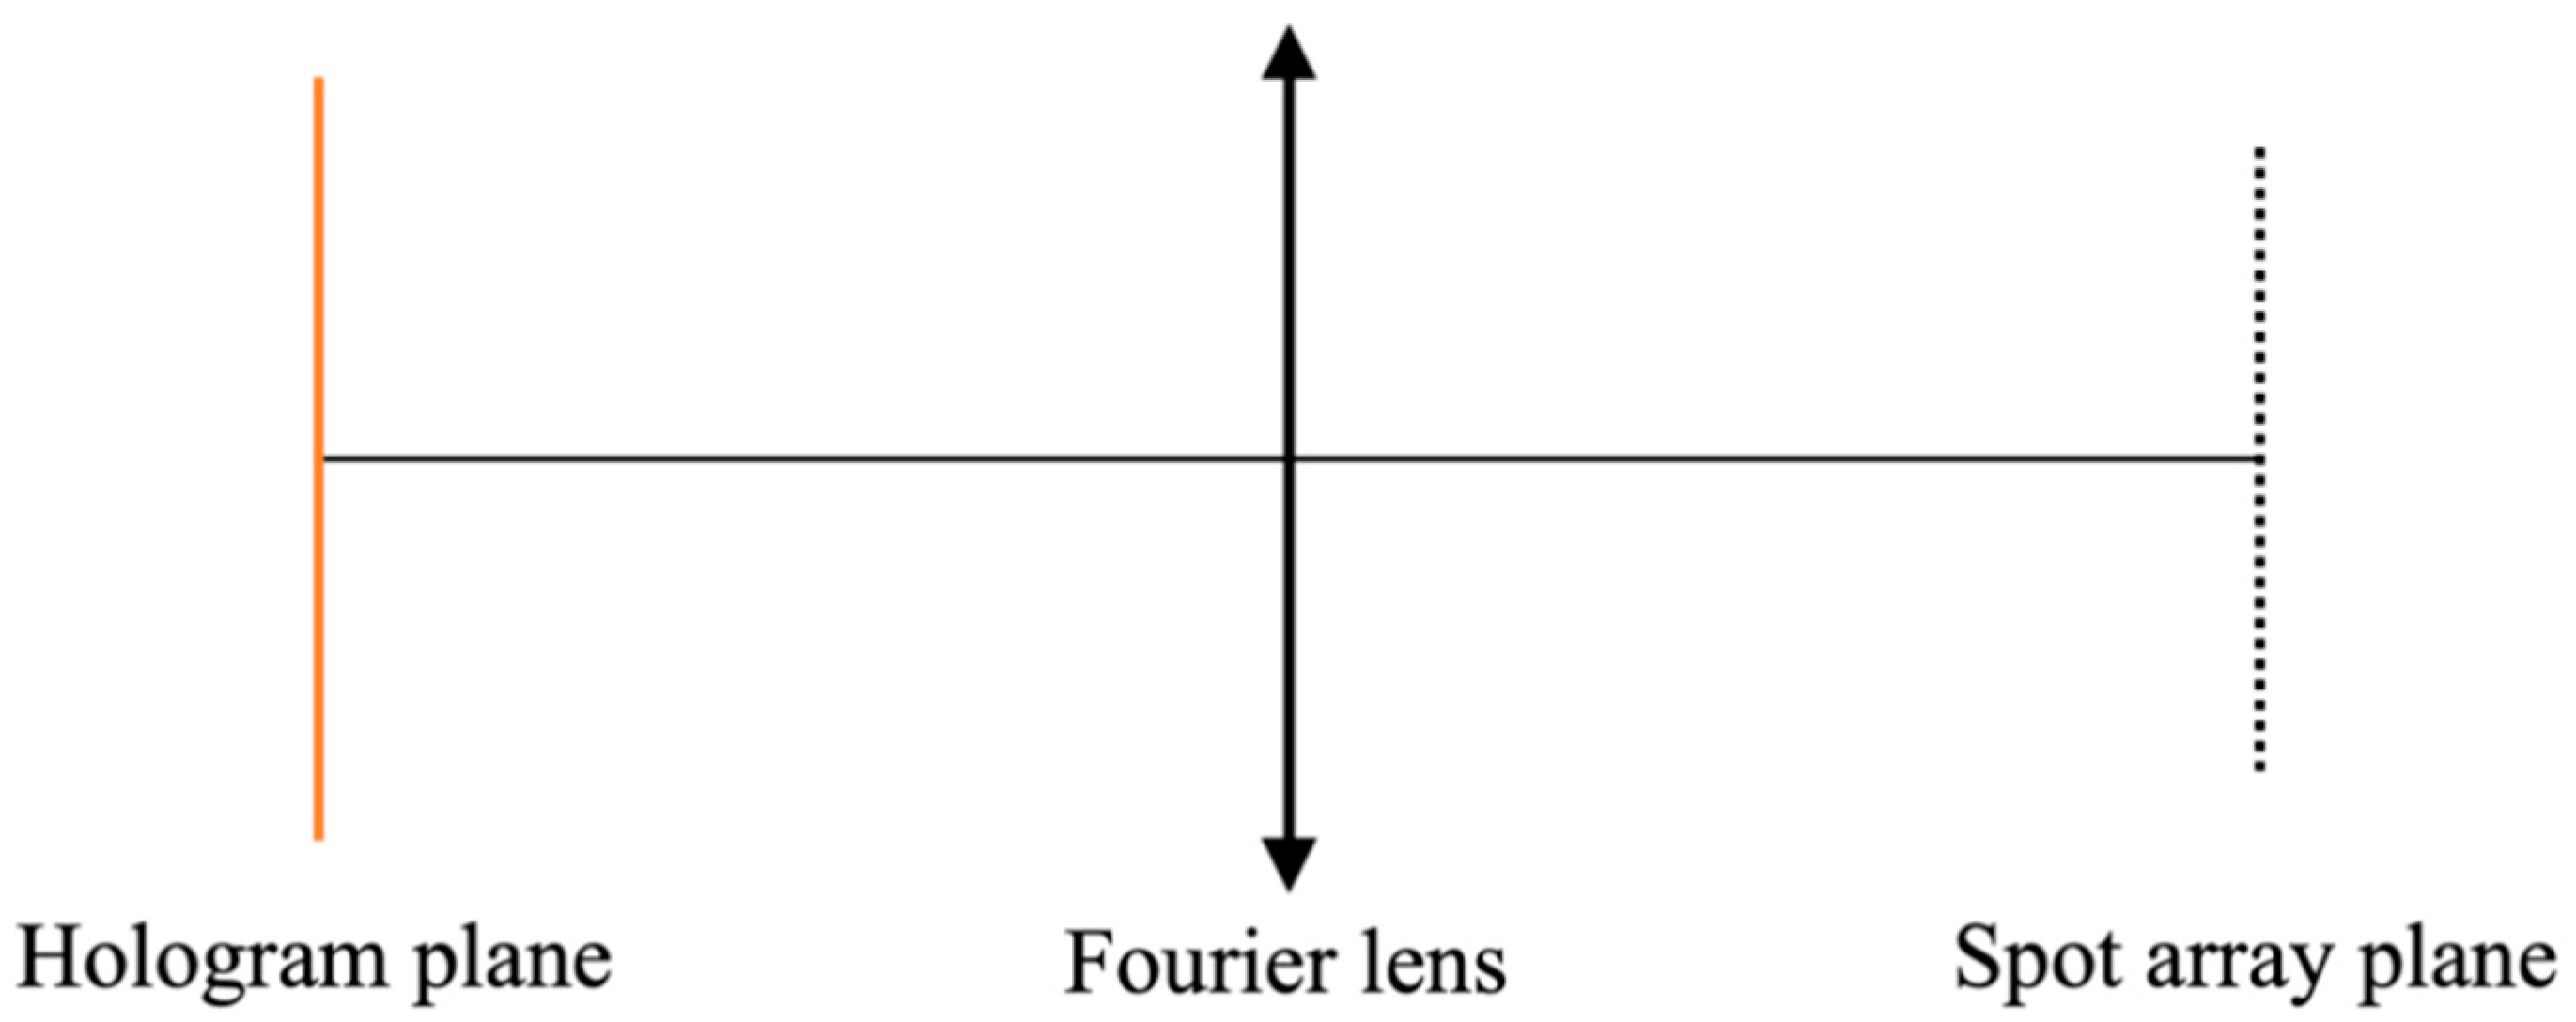
In order to evaluate the feasibility of the proposed method, a simulation was carried out to generate 1 × 9 and 1 × 15 spot arrays, respectively. Figure 4 showed the general optical architecture used in the simulation. The Gaussian beam waist on the hologram plane was set as 1.08 mm. The wavelength of the beam was set as 1550 nm. The hologram was placed at the front focal plane of a Fourier lens with a focal length of 154 mm. In this way, spot arrays can be generated at the back focal plane of the Fourier lens. The base period of the sinusoid functions was always set as 0.88 mm. In this setup, the generated spots can be closely packed but without interfering with each other. The specification of the LCOS device for the display of the hologram was set based on the actual device used in the experiment. It has a pixel size of 8 µm. A Gaussian filter with a 1/e width of 8 µm was applied to the displayed holograms to emulate the fringing field effect of the LCOS device.
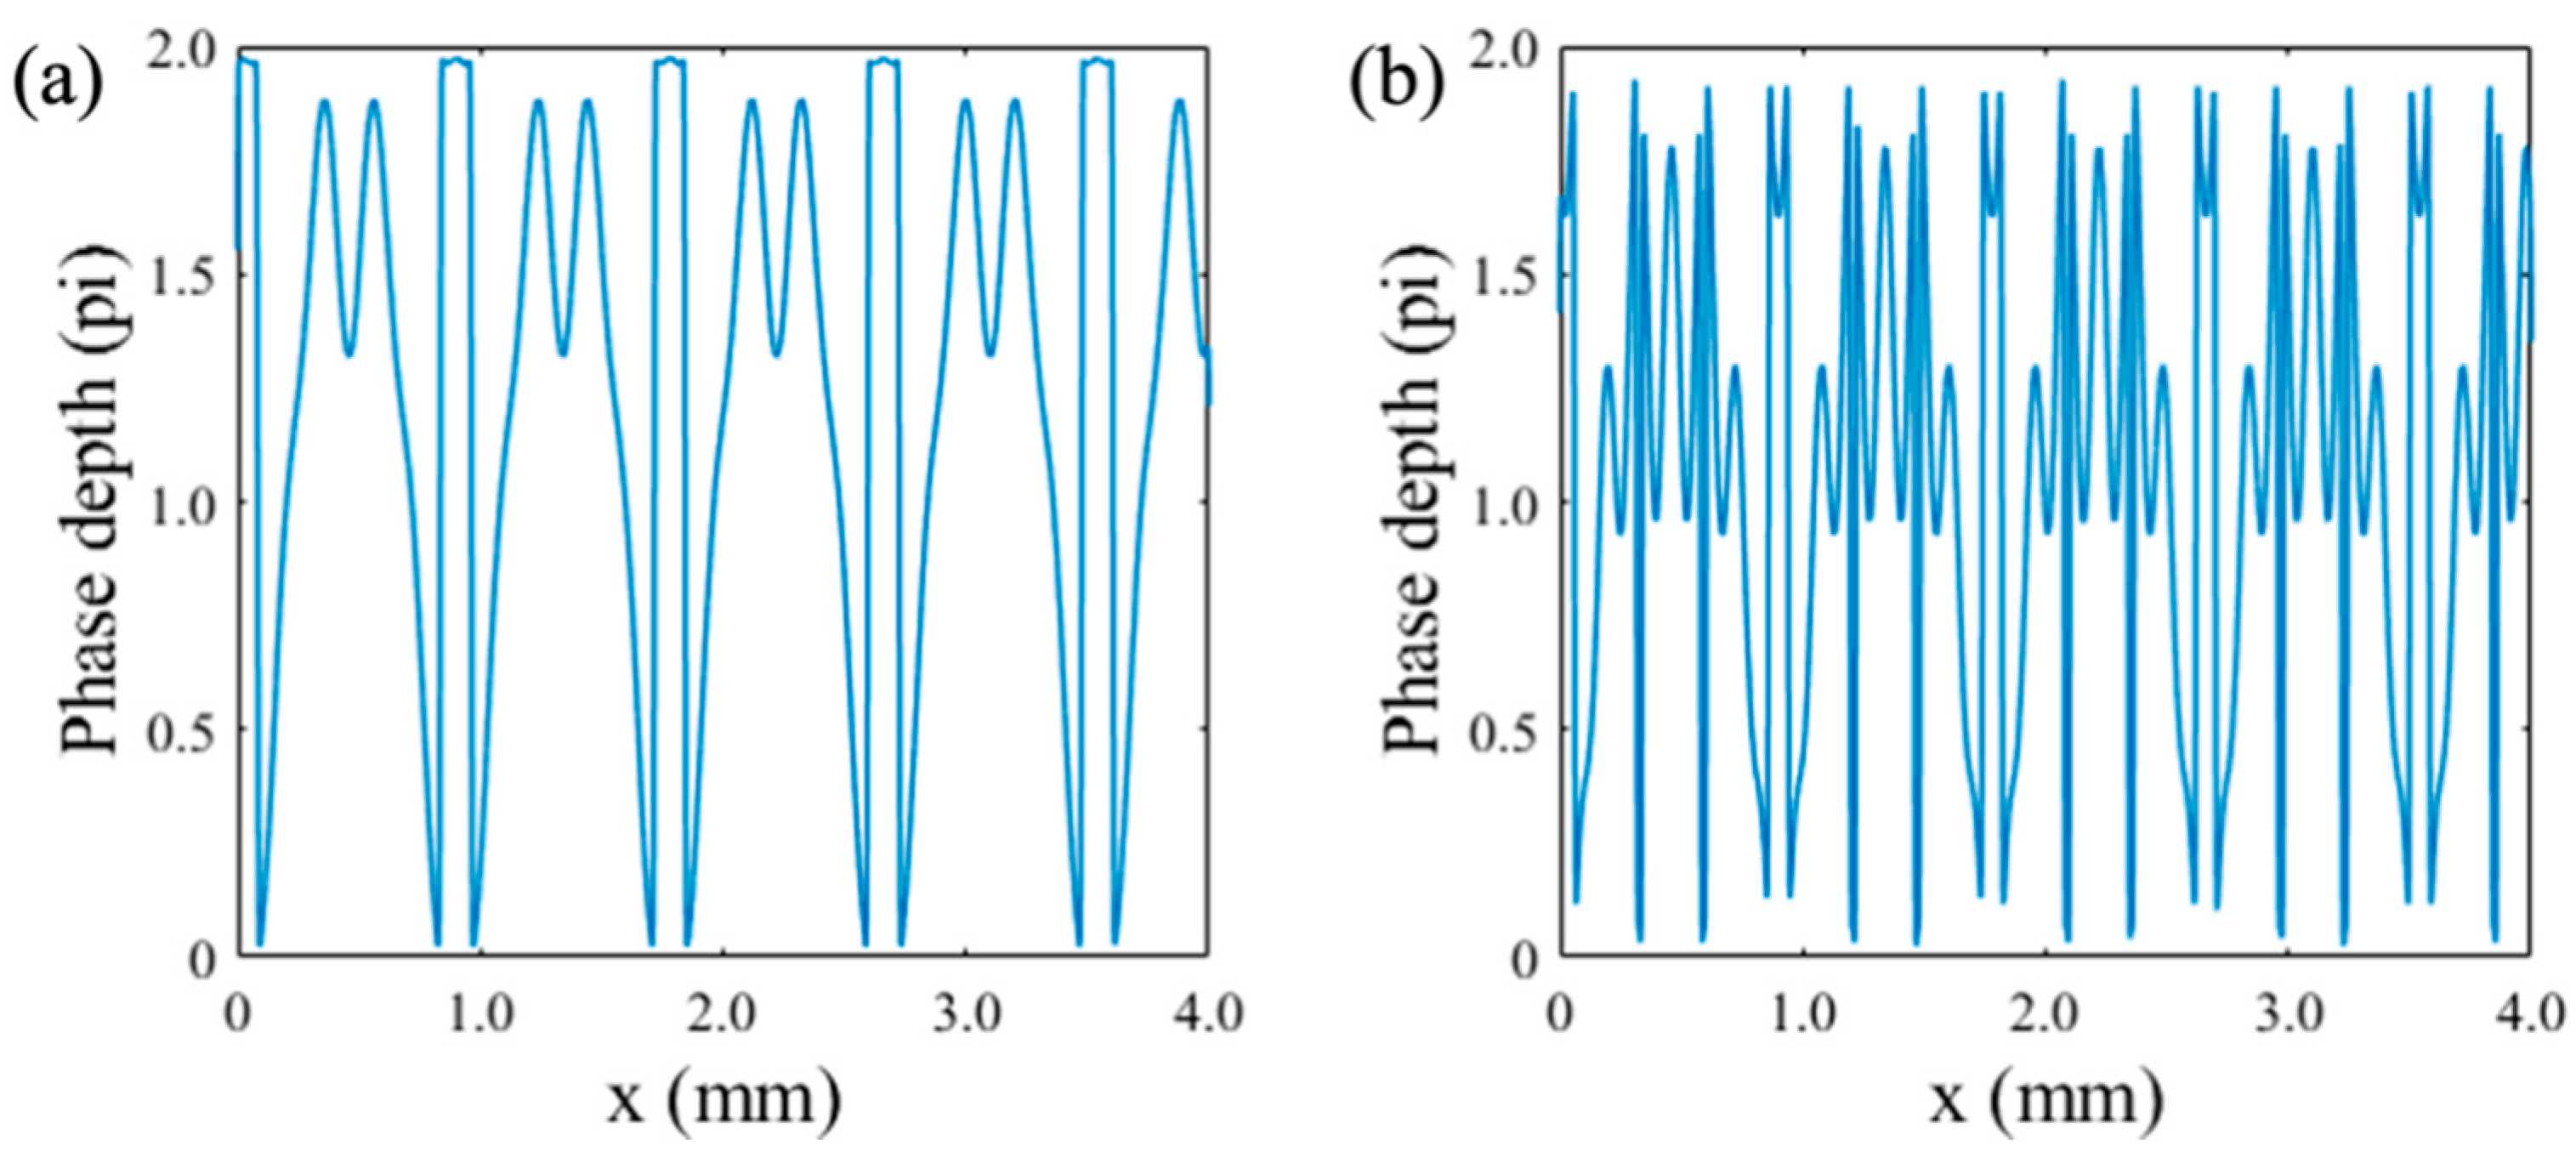
Figure 5a showed the simulated intensity profile of the un-optimized hologram for a 1 × 9 spot array. Five sinusoid series were used to describe this hologram. The values of a i for the sinusoid functions were randomly generated. Figure 5b showed the intensity profile after the hologram optimization. The non-uniformity of the generated spot array is less than ±5%. The corresponding phase profiles of the optimized hologram is shown in Figure 6a. The progress of the optimization was illustrated in Figure 7a. It can be seen that the optimization algorithm was able to converge after only ~15 iterations.
Subsequently, we increased the size of the target spot array to 1 × 15 in order to evaluate the scalability of the proposed method. In this case, eight sinusoid series were used to describe the hologram. The intensity profiles of the generated spot array were plotted in Figure 5c,d for before and after the optimization, respectively. The non-uniformity was maintained at less than ±5%. The optimized hologram was shown in Figure 6b. The progression of the optimization process was shown in Figure 7b. Again, the optimization algorithm was able to converge within 15 iterations.

4. Experiments

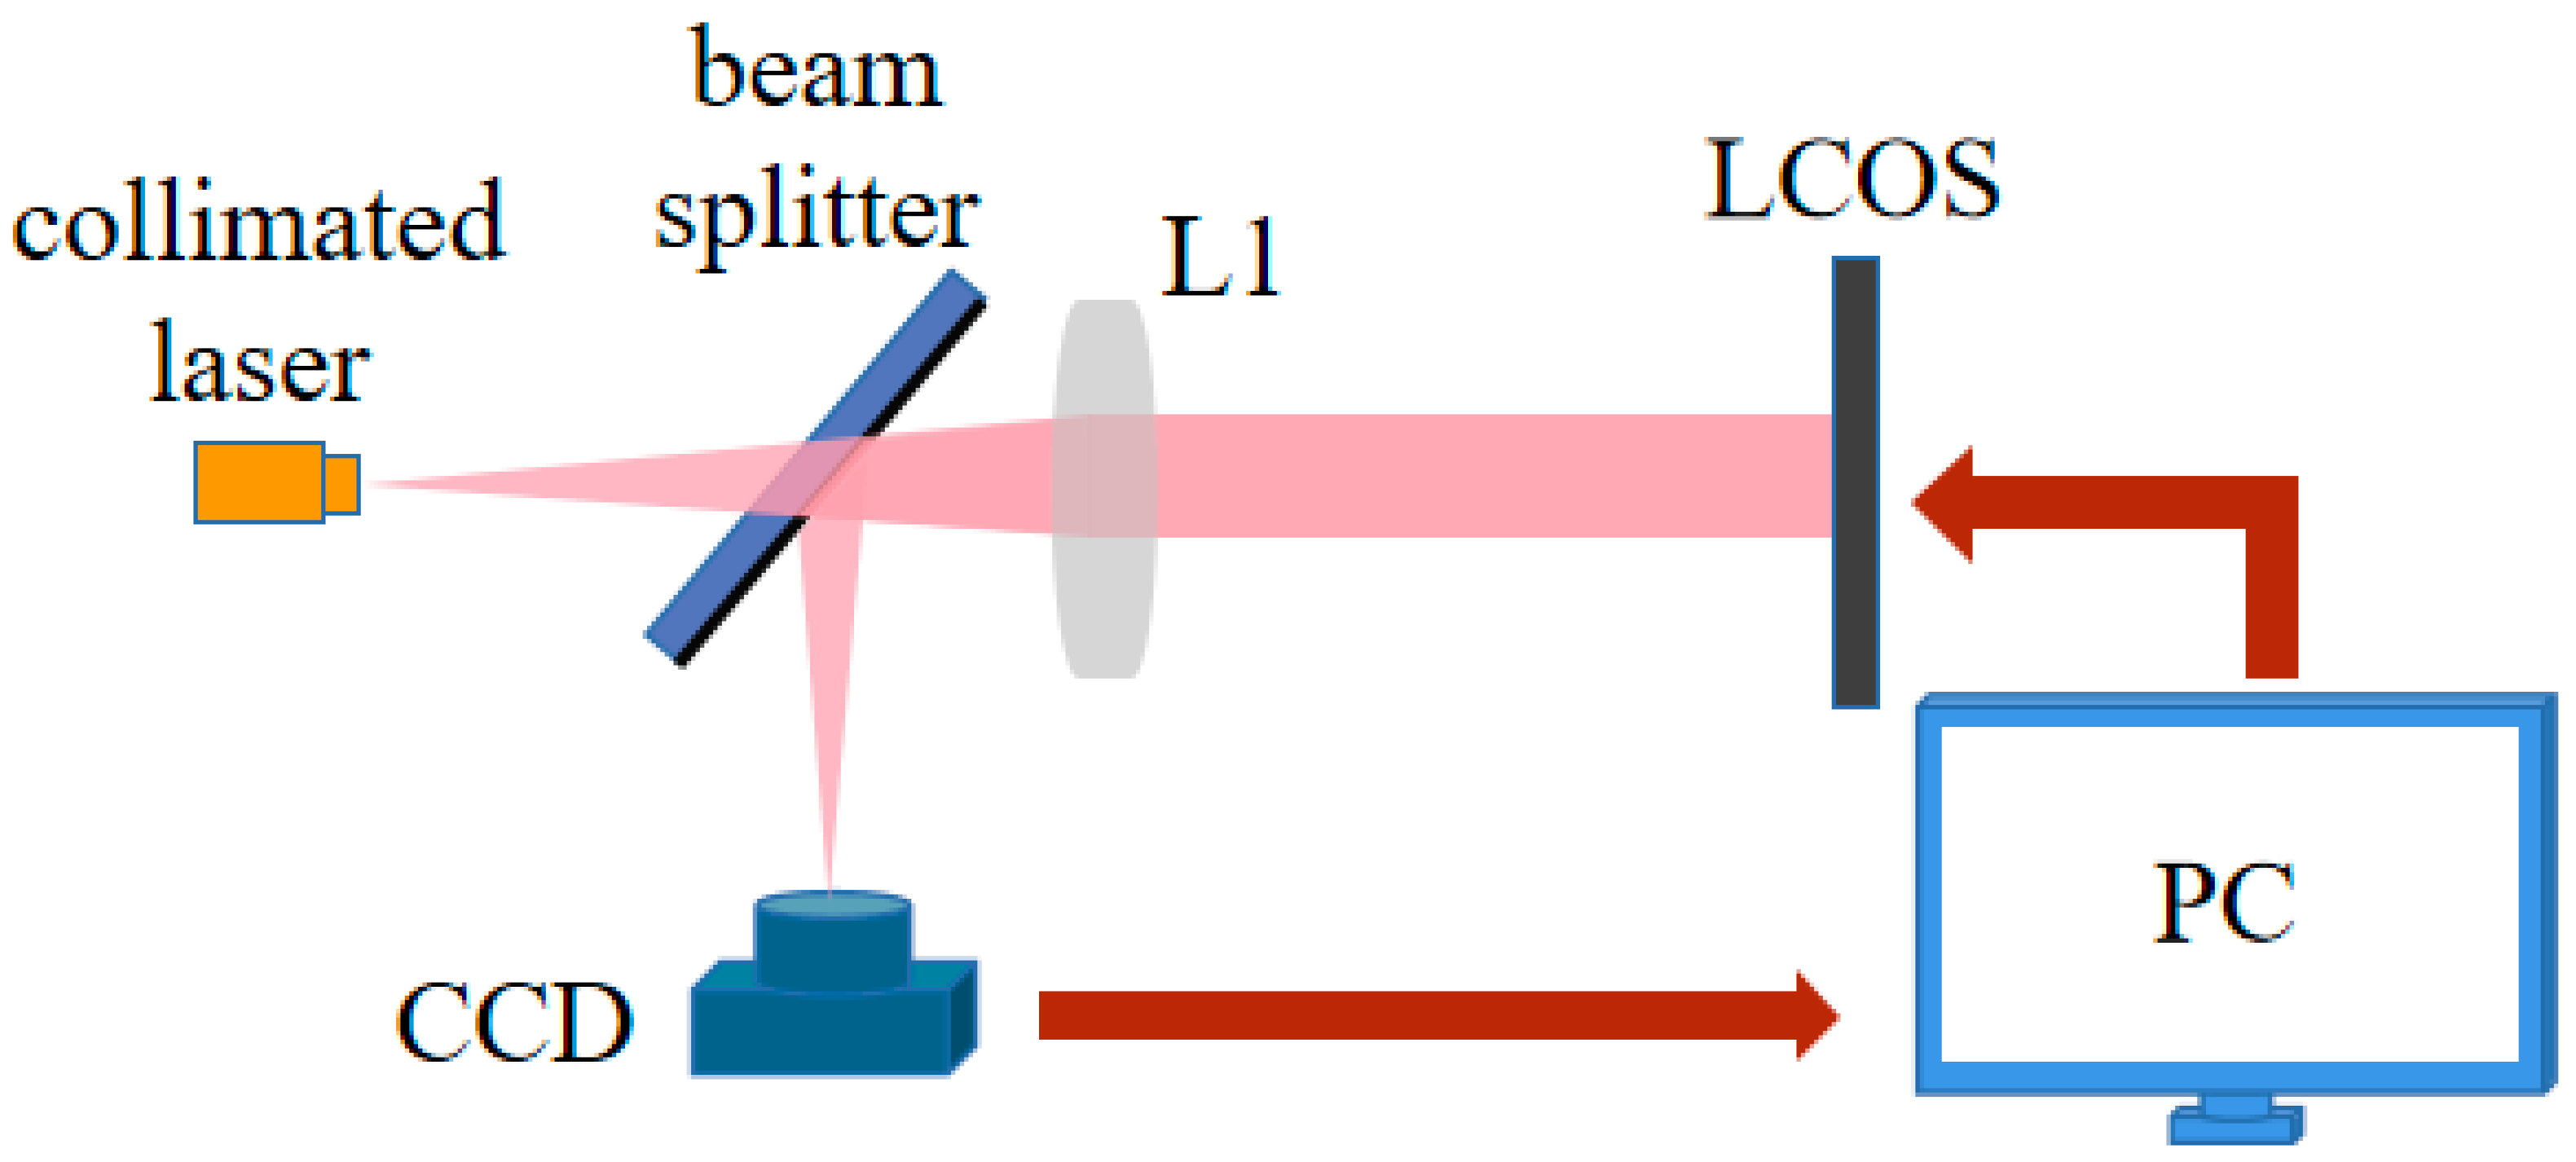
The optical system shown in Figure 8 was constructed to further validate the proposed method for the spot array generation. A collimated laser beam with a Gaussian waist of 60 um was placed at the front focal plane of the Fourier lens (L1) with a focal length of 127 mm. The central wavelength of the laser was set at 1550 nm in this work. The LCOS device was placed at the back focal plane of L1. The LCOS device had a resolution of 1920 × 1200 and a pixel size of 8 um [29]. This LCOS device was also designed for 1550 nm operation. The reconstructed light field was directed to the infrared camera by a pellicle beam splitter. During the optimization process, the PC controlled both the LCOS device and the camera. The spot profile captured by the camera was used as the feedback to iteratively update the phase patterns displayed on the LCOS device. In this way, the optimization algorithm also took the defects within the LCOS device into account, particularly the fringing field effect.
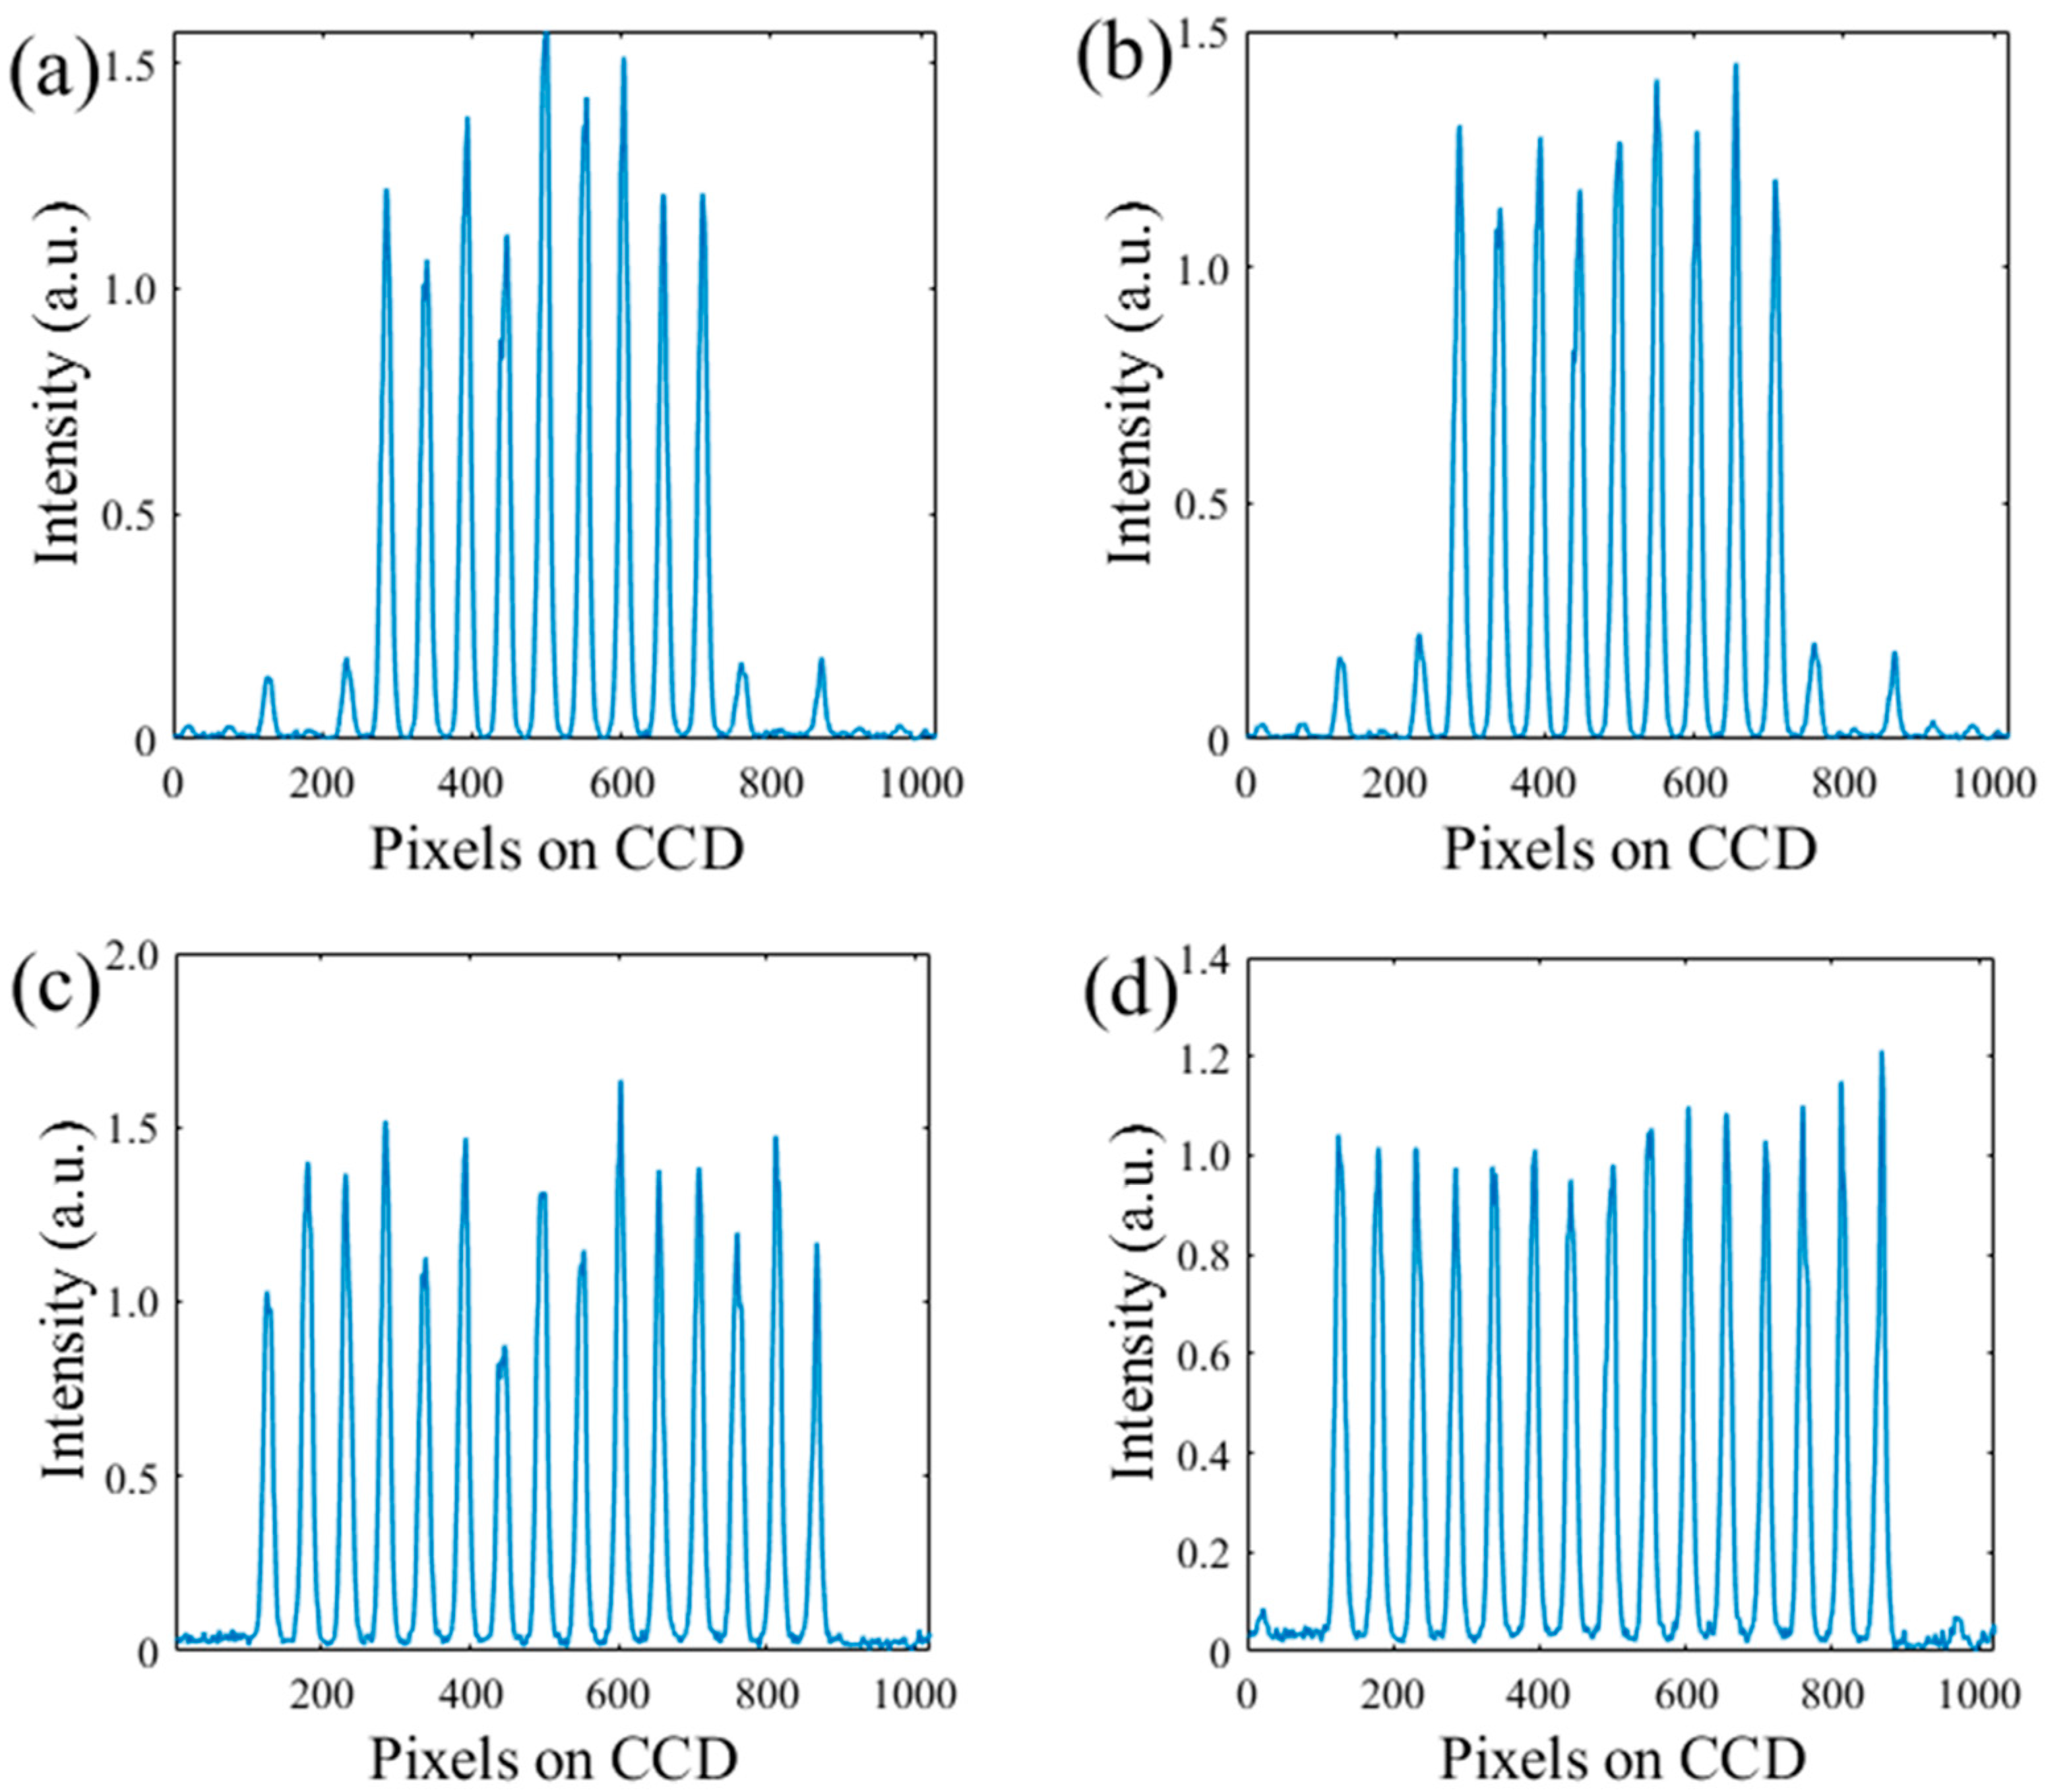
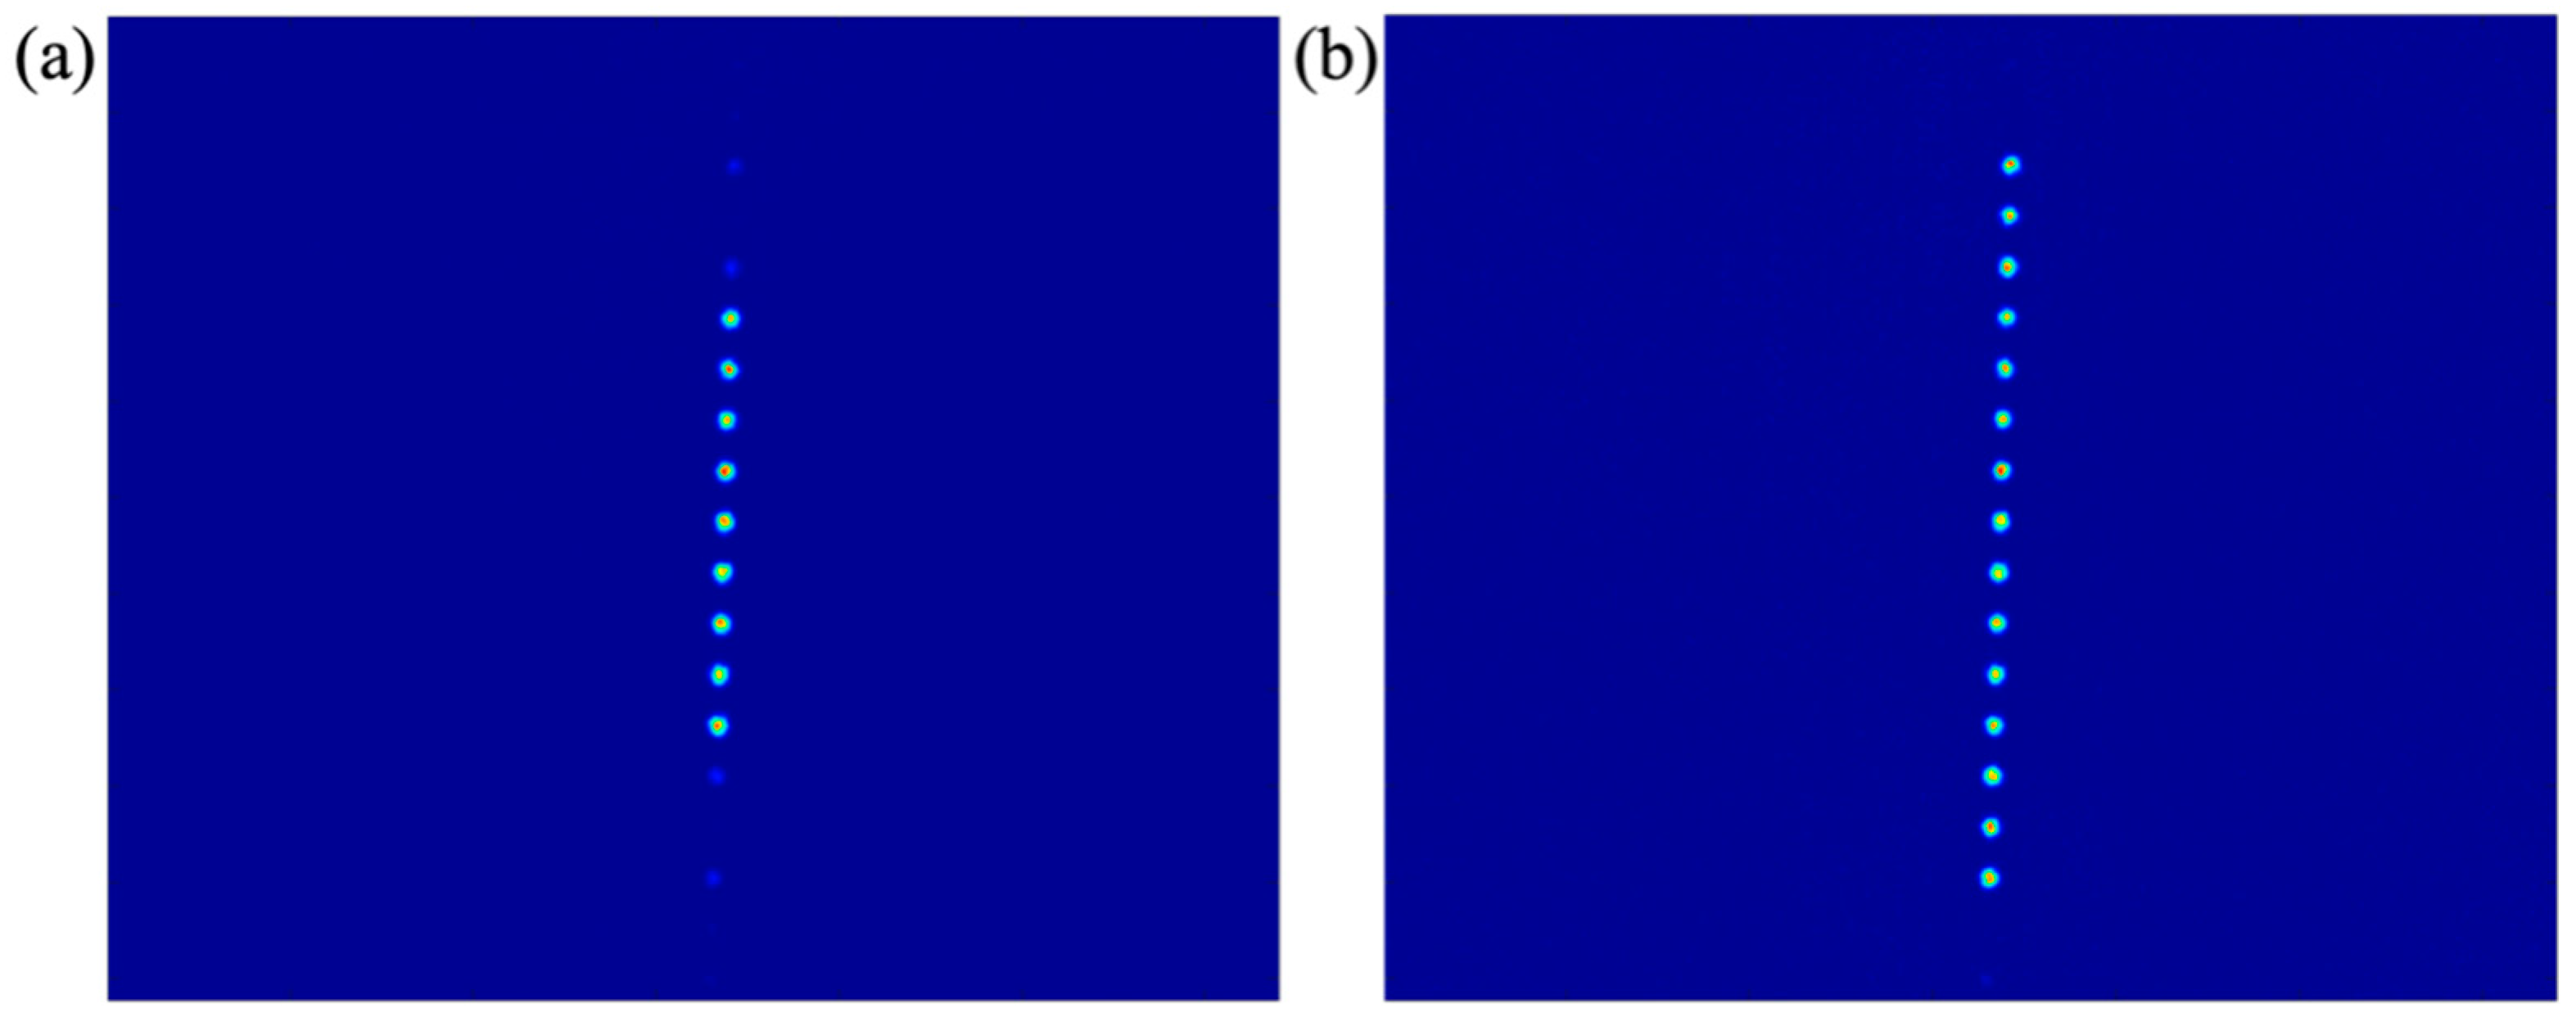
In the experiment, the initial holograms were generated through the simulation process, which was described in the above. Therefore, the spot array generated by the initial hologram can be closer to the target profile, potentially leading to a faster optimization process. Nevertheless, there still would be some discrepancy between the simulation and experiment since the simulation cannot cover every aspect of the actual optical system, including the misalignment of the optical system, manufacturing errors within the lens, depolarization effect and the phase flicker within the LCOS device, etc. It should be noted that the impact of the depolarization effect of the LCOS device was particularly strong, especially when a large spot array was required. In this case, the intensity of the central spot within the array would be higher than expected. As a result, the target intensity of the central spot was intentionally suppressed for the initial hologram generation through the simulation. During the experimental optimization process, the target intensity level of each spot within the array can be modified adaptively based on the progress of the optimization. Figure 9a,c showed the cross section of 1 × 9 and 1 × 15 spot arrays generated by the initial holograms, respectively. The corresponding results after the optimization were shown in Figure 9b,d. The 2D profiles were shown in Figure 10. For both 1 × 9 and 1 × 15 spot arrays, the non-uniformity was less than ±8%.
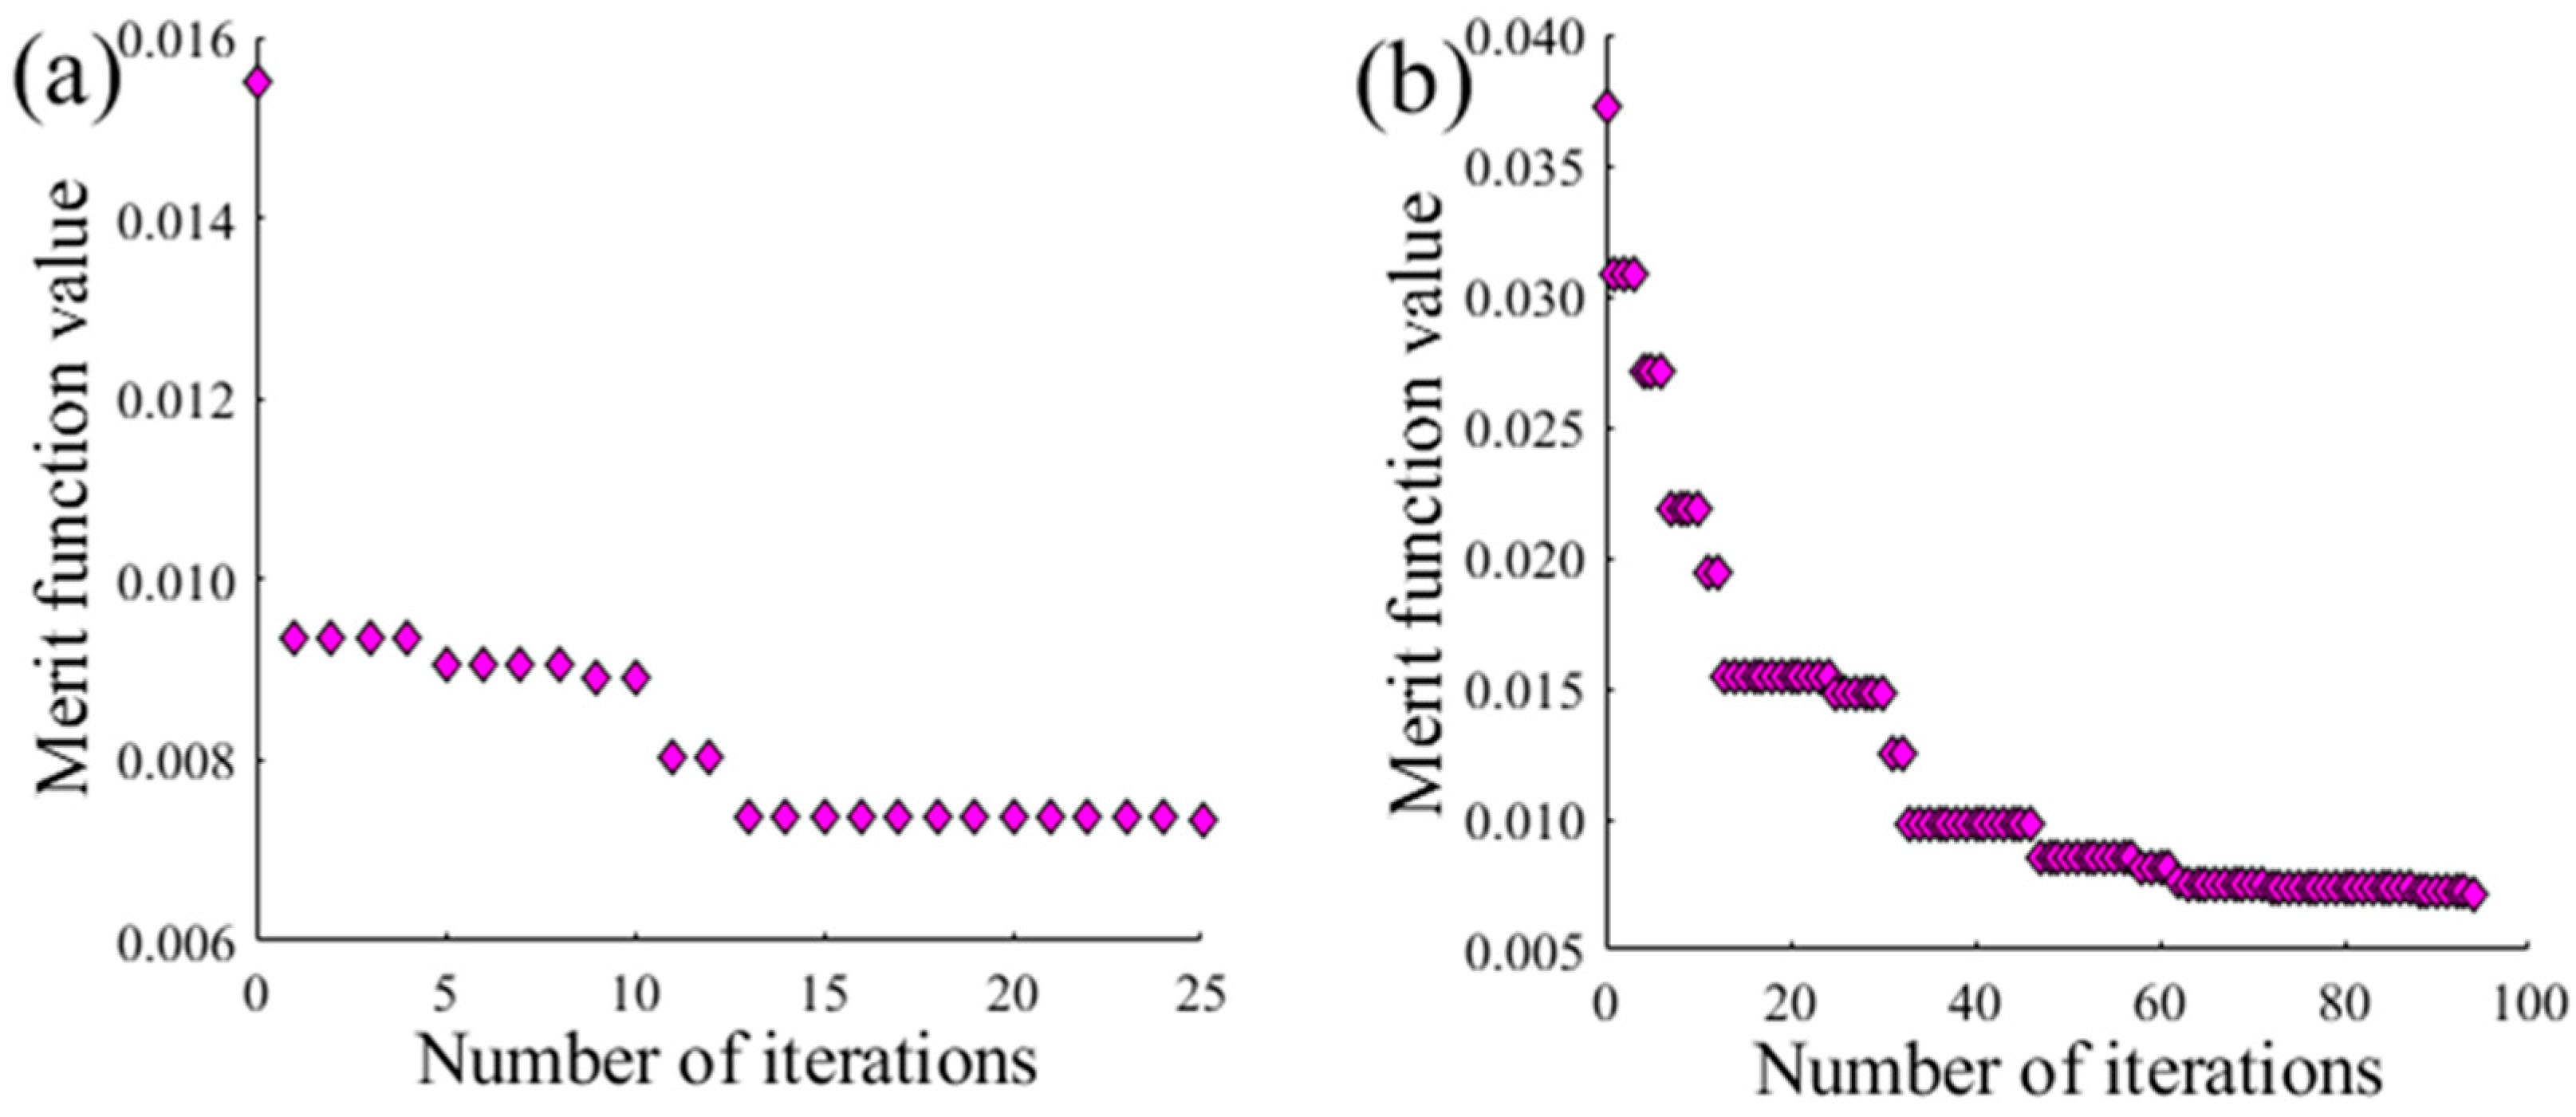
The progression of the optimization process was plotted in Figure 11. It was consistent with the simulation results that the algorithm was able to converge within 15 iterations. The fast convergence further demonstrated that this parametric description of the beam splitting holograms was efficient and effective.

5. Conclusions

In this work, we proposed a novel method to describe the complex beam splitting holograms by a series of sinusoid functions. This significantly reduced the search dimensions for the beam splitting holograms from hundreds of thousands to fewer than 10. As a result, a rapid and effective generation of the beam splitting holograms can be realized for different spot counts and pitches. The proposed method was validated through both the simulation and experiments by using the standard gradient descent algorithm. It was successfully demonstrated that the proposed method was able to generate a uniform spot array within 15 iterations. More advanced optimization algorithm can be used to further improve the uniformity and the optimization speed.

Author Contributions

Conceptualization, H.Y.; methodology, H.Y.; software, Y.L.; validation, Y.L., X.Z. and H.Y.; data curation, Y.L., X.Z. and H.Y.; writing—original draft preparation, Y.L.; writing—review and editing, H.Y.; visualization, Y.L.; project administration, H.Y. and D.C.; funding acquisition, H.Y. and D.C. All authors have read and agreed to the published version of the manuscript.

Funding

Natural Science Foundation of China (62105059); Natural Science Foundation of Jiangsu Province (BK20200351).

Data Availability Statement

Data underlying the results presented in this paper are not publicly available at this time but may be obtained from the authors upon reasonable request.

Conflicts of Interest

The authors declare no conflict of interest.

References

  1. Jesacher, A.; Booth, M.J. Parallel direct laser writing in three dimensions with spatially dependent aberration correction. Opt. Express 2010, 18, 21090–21099. [Google Scholar] [CrossRef] [PubMed]
  2. Di, C.H.; Zhou, C.H. Dynamic optical coupled system employing even-numbered Dammann gratings. Appl. Opt. 2006, 45, 1993–2000. [Google Scholar] [CrossRef]
  3. Gu, M.; Li, X.P.; Cao, Y.Y. Optical storage arrays: A perspective for future big data storage. Light-Sci. Appl. 2014, 3, 11. [Google Scholar] [CrossRef]
  4. Sacconi, L.; Froner, E.; Antolini, R.; Taghizadeh, M.R.; Choudhury, A.; Pavone, F.S. Multiphoton multifocal microscopy exploiting a diffractive optical element. Opt. Lett. 2003, 28, 1918–1920. [Google Scholar] [CrossRef] [PubMed]
  5. Sakakura, M.; Ishiguro, Y.; Fukuda, N.; Shimotsuma, Y.; Miura, K. Modulation of laser induced-cracks inside a LiF single crystal by fs laser irradiation at multiple points. Opt. Express 2013, 21, 26921–26928. [Google Scholar] [CrossRef] [PubMed]
  6. Ghebjagh, S.G.; Fischer, D.; Sinzinger, S. Multifocal multi-value phase zone plate for 3D focusing. Appl. Opt. 2019, 58, 8943–8949. [Google Scholar] [CrossRef]
  7. Robertson, B.; Yang, H.; Redmond, M.M.; Collings, N.; Liu, J.; Jeziorska-Chapman, A.M.; Moore, J.R.; Zhang, Z.; Crossland, W.A.; Wonfor, A.; et al. The Use of Wavefront Encoding to Reduce Crosstalk in a Multicasting Fiber Telecom Switch. In Proceedings of the Optical Fiber Communication Conference, Los Angeles, CA, USA, 4 March 2012; p. OM2J.6. [Google Scholar]
  8. Yang, H.N.; Robertson, B.; Chu, D.P. IEEE. Crosstalk Reduction in Holographic Wavelength Selective Switches Based on Phase-only LCOS Devices. In Proceedings of the Optical Fiber Communications Conference and Exhibition (OFC), San Francisco, CA, USA, 9–13 March 2014. [Google Scholar]
  9. Roider, C.; Piestun, R.; Jesacher, A. 3D image scanning microscopy with engineered excitation and detection (vol 4, pg 1373, 2017). Optica 2017, 4, 1559. [Google Scholar] [CrossRef]
  10. Kato, J.; Takeyasu, N.; Adachi, Y.; Sun, H.B.; Kawata, S. Multiple-spot parallel processing for laser micronanofabrication. Appl. Phys. Lett. 2005, 86, 3. [Google Scholar] [CrossRef]
  11. Anderson, T.; Segref, A.; Frisken, G.; Lorenser, D.; Ferra, H.; Frisken, S. Highly Parallelized Optical Coherence Tomography for Ocular metrology and imaging. In Proceedings of the Biophotonics Australasia Conference, Melbourne, Australia, 9–12 December 2019. [Google Scholar]
  12. Streibl, N.; Nolscher, U.; Jahns, J.; Walker, S. Array generation with lenslet arrays. Appl. Opt. 1991, 30, 2739–2742. [Google Scholar] [CrossRef]
  13. Daly, D.; Stevens, R.F.; Hutley, M.C.; Davies, N. The manufacture of microlenses by melting photoresist. Meas. Sci. Technol. 1990, 1, 759–766. [Google Scholar] [CrossRef]
  14. Haselbeck, S.; Schreiber, H.; Schwider, J.; Streibl, N. Microlenses fabricated by melting a photoresist on a base layer. Opt. Eng. 1993, 32, 1322–1324. [Google Scholar] [CrossRef]
  15. Pan, C.T.; Wu, T.T.; Chen, M.F.; Chang, Y.C.; Lee, C.J.; Huang, J.C. Hot embossing of micro-lens array on bulk metallic glass. Sens. Actuator A-Phys. 2008, 141, 422–431. [Google Scholar] [CrossRef]
  16. Chang, C.Y.; Yang, S.Y.; Huang, L.S.; Hsieh, K.H. Fabrication of polymer microlens arrays using capillary forming with a soft mold of micro-holes array and UV-curable polymer. Opt. Express 2006, 14, 6253–6258. [Google Scholar] [CrossRef]
  17. Hua, J.G.; Ren, H.; Jia, A.; Tian, Z.N.; Wang, L.; Juodkazis, S.; Chen, Q.D.; Sun, H.B. Convex silica microlens arrays via femtosecond laser writing. Opt. Lett. 2020, 45, 636–639. [Google Scholar] [CrossRef]
  18. Algorri, J.F.; Bennis, N.; Urruchi, V.; Morawiak, P.; Sanchez-Pena, J.M.; Jaroszewicz, L.R. Tunable liquid crystal multifocal microlens array. Sci. Rep. 2017, 7, 6. [Google Scholar] [CrossRef]
  19. Kuang, Z.; Perrie, W.; Liu, D.; Edwardson, S.P.; Jiang, Y.; Fearon, E.; Watkins, K.G.; Dearden, G. Ultrafast laser parallel microprocessing using high uniformity binary Dammann grating generated beam array. Appl. Surf. Sci. 2013, 273, 101–106. [Google Scholar] [CrossRef]
  20. Davis, J.A.; Moreno, I.; Martinez, J.L.; Hernandez, T.J.; Cottrell, D.M. Creating three-dimensional lattice patterns using programmable Dammann gratings. Appl. Opt. 2011, 50, 3653–3657. [Google Scholar] [CrossRef]
  21. Zheng, Q.; Zhou, J.Y.; Chen, Q.M.; Lei, L.; Wen, K.H.; Hu, Y.M. Rapid Prototyping of a Dammann Grating in DMD-Based Maskless Lithography. IEEE Photonics J. 2019, 11, 11. [Google Scholar] [CrossRef]
  22. Li, Y.; Watanabe, W.; Sun, Q.; Tamaki, T.; Nishii, J.; Itoh, K. Fabrication of Dammann gratings in silica glass. Chin. Opt. Lett. 2005, 3, S57–S59. [Google Scholar]
  23. Krackhardt, U.; Streibl, N. Design of dammann-gratings for array generation. Opt. Commun. 1989, 74, 31–36. [Google Scholar] [CrossRef]
  24. Zhang, Z.C.; You, Z.; Chu, D.P. Fundamentals of phase-only liquid crystal on silicon (LCOS) devices. Light-Sci. Appl. 2014, 3, 10. [Google Scholar] [CrossRef] [Green Version]
  25. Chiang, K.H.F.; Wu, S.T.; Chen, S.H. Fringing field effect of the liquid-crystal-on-silicon devices. Jpn. J. Appl. Phys. Part 1—Regul. Pap. Short Notes Rev. Pap. 2002, 41, 4577–4585. [Google Scholar] [CrossRef]
  26. Yang, H.; Chu, D.P. Phase flicker optimisation in digital liquid crystal on silicon devices. Opt. Express 2019, 27, 24556–24567. [Google Scholar] [CrossRef] [PubMed]
  27. Yang, H.N.; Chu, D.P. Phase flicker in liquid crystal on silicon devices. J. Phys. Photonics 2020, 2, 19. [Google Scholar] [CrossRef]
  28. Wang, C.M.; Wang, Q.D.; Mu, Q.Q.; Peng, Z.H. High-precision beam array scanning system based on Liquid Crystal Optical Phased Array and its zero-order leakage elimination. Opt. Commun. 2022, 506, 8. [Google Scholar] [CrossRef]
  29. Yang, H.N.; Li, K.; Chu, D.P. Liquid crystal on silicon technology and reconfigurable all-optical networks. Chin. J. Liq. Cryst. Disp. 2021, 36, 772–788. [Google Scholar] [CrossRef]
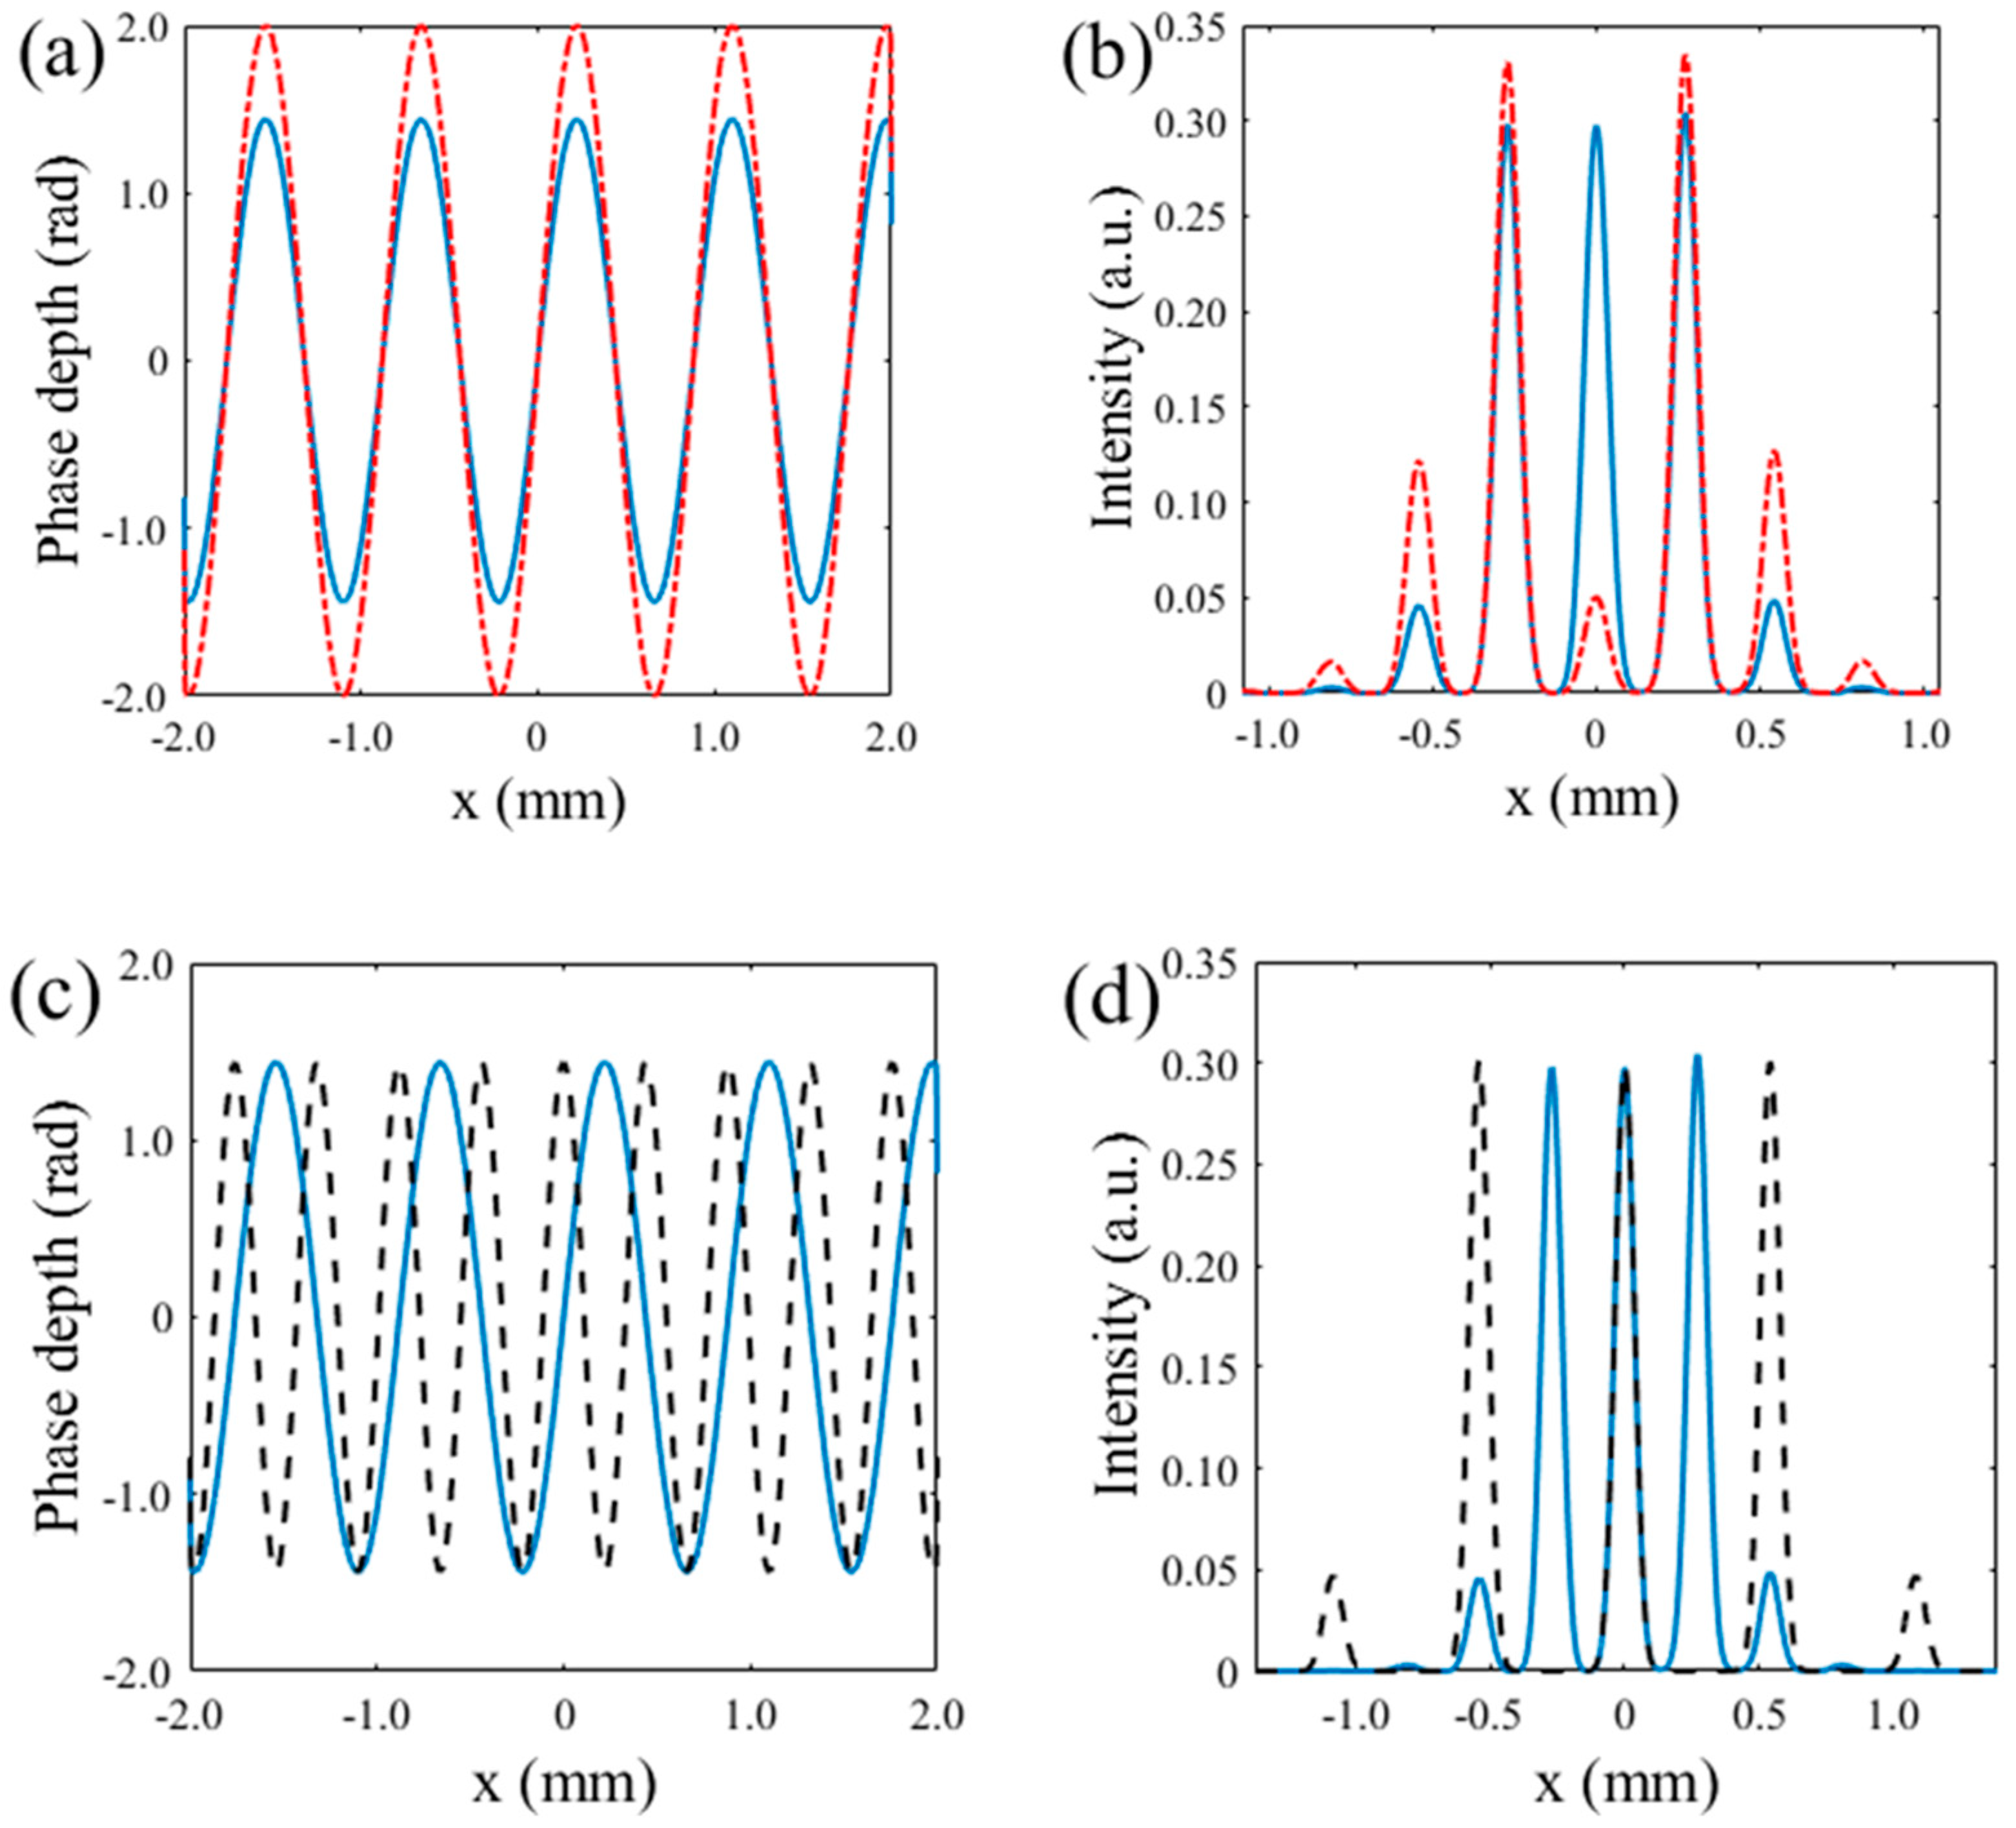
Figure 1. Holograms and the corresponding profiles of the generated spot array based on one sinusoid function with different amplitudes (a,b) or different periods (c,d).
Photonics 09 00633 g001
Figure 2. The hologram (a) and the corresponding profile of the generated spot array (b) based on the superposition of two sinusoid functions with different periods.
Photonics 09 00633 g002
Figure 3. Flow chart of the optimization process.
Photonics 09 00633 g003
Figure 4. Optical setup for the simulation.
Photonics 09 00633 g004
Figure 5. The initial and optimized 1×9 (a,b) and 1×15 (c,d) beam spot array.
Photonics 09 00633 g005
Figure 6. Optimized holograms for (a) 1 × 9 and (b) 1 × 15 spot array generation.
Photonics 09 00633 g006
Figure 7. Progression of the optimization for (a) 1 × 9 and (b) 1 × 15 spot array in the simulation.
Photonics 09 00633 g007
Figure 8. Experimental setup for the online spot array generation.
Photonics 09 00633 g008
Figure 9. The original and result generated beam spot array for 1 × 9 (a,b) and 1 × 15 (c,d) in the experiment.
Photonics 09 00633 g009
Figure 10. 2D profiles of the experimentally generated 1 × 9 (a) and 1 × 15 (b) beam spot array.
Photonics 09 00633 g010
Figure 11. Progression of the experimental optimization for 1 × 9 (a) and 1 × 15 (b) beam spot arrays.
Photonics 09 00633 g011
Publisher’s Note: MDPI stays neutral with regard to jurisdictional claims in published maps and institutional affiliations.