Abstract
Numerous papers have demonstrated that by using a varying coefficients model (VCM), researchers can unveil patterns of interactions between variables that could otherwise remain hidden if using the more popular regression model with an interaction term. Hence, one would expect high acceptance of the VCM as a tool for studying statistical interactions in datasets. Yet, the current paper shows that the VCM is still struggling to migrate from journals in which methods are presented to journals in which methods are utilized. First, a search in Google Scholar with the phrase “varying coefficients” returned ~79,200 results in comparison to returning ~2,710,000 results with the phrase “interaction term”. Second, a bibliometric analysis of publications with the VCM showed that in many research domains, there were more publications with the VCM in journals on methods than publications with the VCM in journals for empirical investigations. Economics and environmental studies stood out with many more publications with the VCM in empirical journals than in journals on statistical methods. The gap between the high acclaims of the VCM in the statistical literature and its low utilization rate in practice should be of concern to the research community. The possible reasons for this gap and its potential remedies are discussed.
1. Introduction
Numerous papers have demonstrated that by using a varying coefficients model (VCM), researchers can unveil patterns of interactions between variables that could otherwise remain hidden if using a regression model with an interaction term (e.g., Dambon et al., 2021; Fan & Zhang, 1999, 2008; Park et al., 2015; Sperlich & Theler, 2015). In the current paper, while the prowess of the VCM in studying statistical interactions is demonstrated, the focus is not on its prowess but rather on the extent to which it is utilized. The current paper will show that despite its prowess, the VCM is still struggling to migrate from statistical, mathematical, and methodological journals, in which methods are usually presented, to journals in which methods are implemented.
The next section of the paper (Section 2) is a short background on the concept of statistical interaction, on the formulation differences between the standard regression model and the VCM, and on how the VCM can unveil patterns in the dataset that are less observable with the standard regression model. The latter point is demonstrated using a case example.
Note that since this paper is not intended to introduce novel computational methods for VCMs, the formulas in Section 2 are not essential for engaging with its main points. Readers can skip Section 2 and still address the main points of this paper: that the VCM is underutilized, that its acceptance as a tool for studying statistical interactions varies across research domains, and that there are possible reasons and potential remedies for its current underutilization. These points can be addressed through the rest of the sections of this paper. However, it is Section 2 that sets the motivation for exploring the (under)utilization of the VCM by demonstrating how the VCM can unlock insights from empirical data that may otherwise remain hidden.
2. Background
- Statistical interaction
In formal terms, an interaction between the variables in a response function is that “the difference in the value of as a result of changing the value of depends on the value of ” (Friedman & Popescu, 2008). This definition can be expressed in different mathematical forms. The more widely used form is a regression model with an interaction term.
- A regression model with an interaction term and the “curse of dimensionality”
- A regression model with an interaction term
Equation (1) presents a regression model with an interaction term as follows:
where F(X) is the response function, is the intercept, f1 is a function that links to F(X), f2 is a function that links to F(X), and f3 is a function that links the interaction between and to F(X). Key to this regression model is that f3, which includes the two variables, and , is a way to express an interaction between them. Namely, f3 is an interaction term (e.g., Lou et al., 2013; Sorokina et al., 2008).
- The “curseof dimensionality”
All three functions on the right side of Equation (1) above, namely, f1(), f2(), and f3(), can take any mathematical form; for instance, a simple linear form, like in Equation (2) as follows:
where is the intercept, is the coefficient of is the coefficient of and is the coefficient of the interaction between and .
Researchers usually embark on their investigations without knowing the mathematical forms of the functions. Graphical visualizations of the empirical data that they collect can potentially aid in unveiling those mathematical forms, yet this would more likely hold true for the functions that do not describe an interaction.
Taking Equation (1) as an example, researchers can generate scatter plots for the first two functions (f1(), f2()) and often identify their forms visually. For instance, scatter plots may reveal that f1 and f2 are not linear functions, like in the example in Equation (2) above, but rather look more like a parabola, and that, in fact, f1() = and f2() = .
In contrast, scatter plots would usually not allow us to unveil the form of f3 by visual inspection because unlike f1 and f2, which include only one variable ( and , respectively), f3 includes two variables (both and ). Therefore, the scatter plot would be three-dimensional, and the function that it follows would not be readily visible by visual inspection (Hastie & Tibshirani, 1986; Nason et al., 2004). To counter this “curse of dimensionality”, one can use a varying coefficients model (VCM) (Fan & Zhang, 1999).
- Formulating an interaction between variables using a VCM
In a VCM, one does not have to find the correct function for the interaction term (linear, quadratic, etc.) because the VCM does not include an interaction term (unlike in Equation (1) and in Equation (2) above). Instead, in a VCM, an interaction between in a response function can be formulated by letting the coefficient of the intercept (i.e., ) and the coefficient of (i.e., ) depend on the value of (e.g., Park et al., 2015). For example, if one identifies (e.g., by visual inspection) that f1 is a linear function of the form F(X) = + , then a VCM that describes an interaction between would look like in Equation (3) as follows:
where Equation (3) can be viewed as the product of a two-step process. First, presenting F(X) without , essentially using only and the coefficients and so that F(X) = + but then accounting for the interaction between and by allowing the values of the coefficients, and to vary as a function of as in Equation (3) above.
Hence, the essence of the VCM is that instead of using an interaction term with a constant coefficient, like in a standard regression model (e.g., () in Equation (2)), the interaction in a VCM is formulated by letting the coefficients vary. Using varying coefficients is a powerful tool for studying statistical interactions, especially if coupled with a visual representation, like in the next case example.
- Case example—hazard perception, braking intensity, and braking events
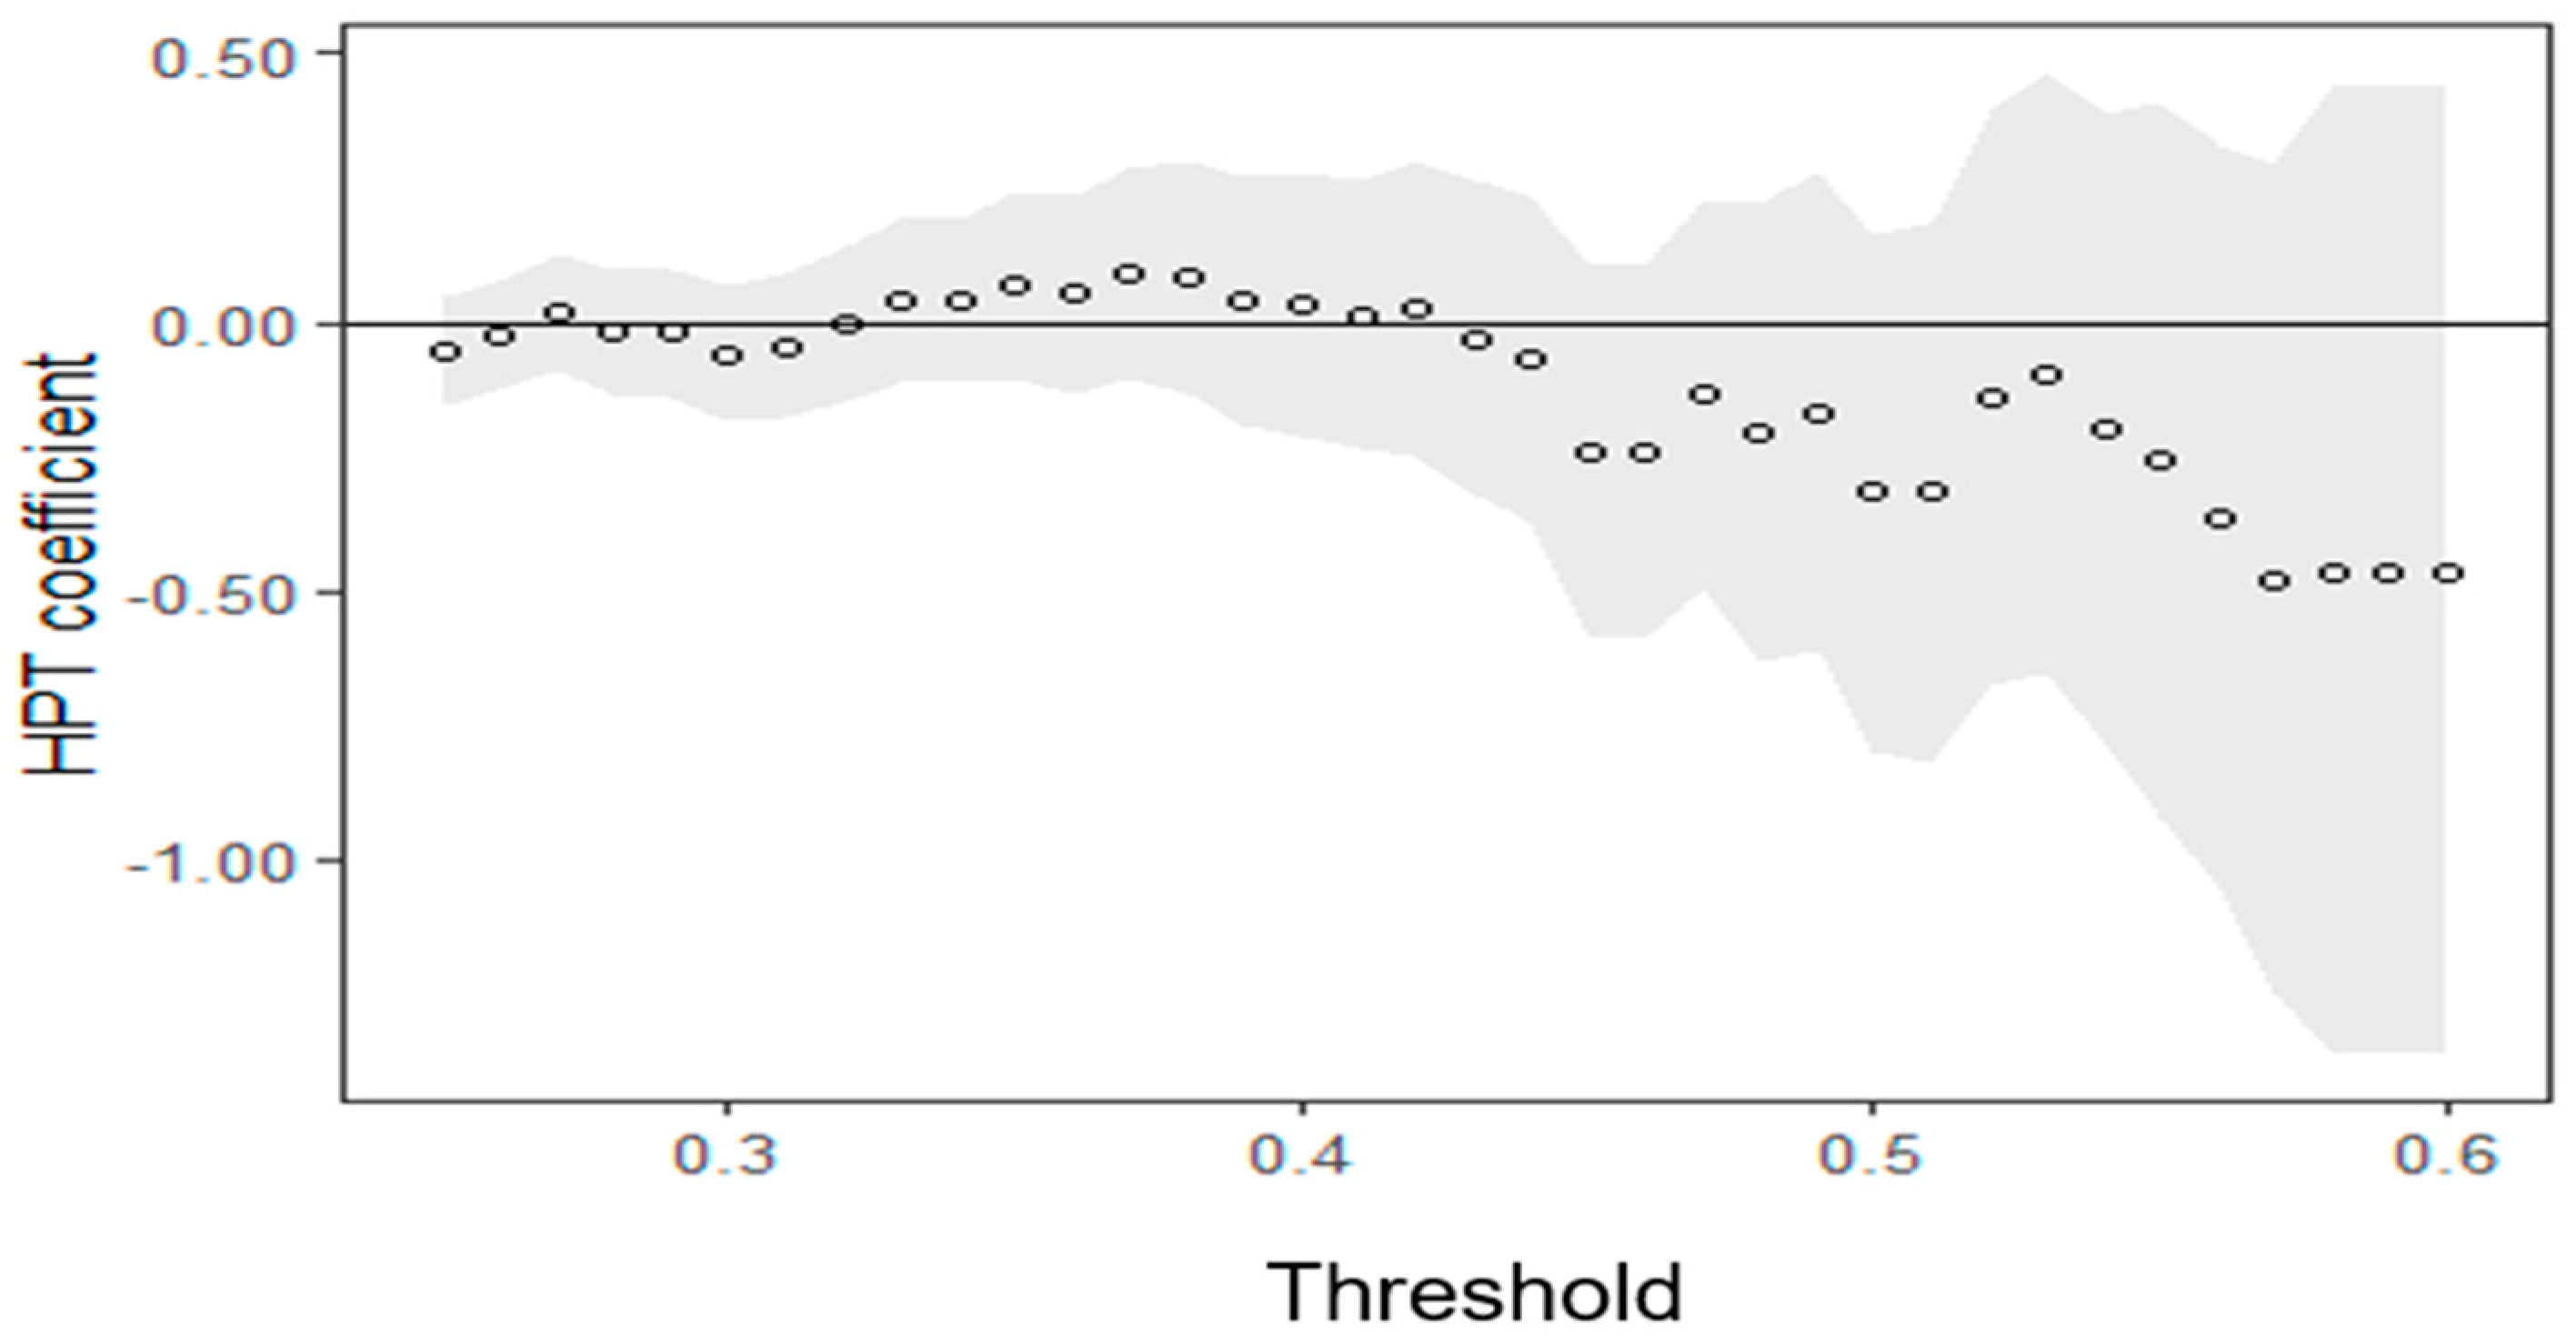
In Botzer et al. (2019), the authors hypothesized that the frequency of drivers’ braking events is linked to their hazard perception ability (being able to detect road hazards) and that this link would be stronger for stronger braking events. This is because stronger braking events are more likely to result from later detection of hazards. The authors formulated their hypothesis in terms of a VCM and presented the results visually, as demonstrated in Figure 1.
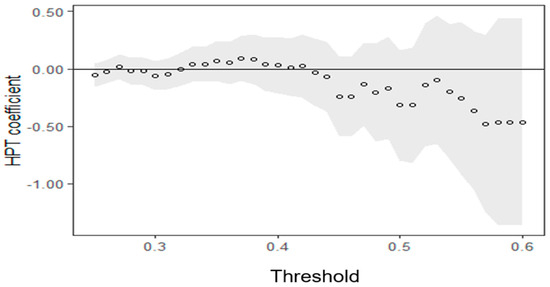
Figure 1.
Estimates of the coefficient of hazard perception ability (HPT coefficient, on the y-axis) as a function of the threshold for braking intensity (threshold, on the x-axis). The black horizontal line represents a zero coefficient. The gray area represents the confidence intervals.
The pattern in Figure 1 supported the authors’ hypothesis. Importantly, it is a pattern of divergent validity (e.g., Holton et al., 2007) that one would expect to obtain if a test for hazard perception ability is indeed valid. The figure shows that the hazard perception ability score (HPT) of the drivers had no link to braking events if the intensity of the braking was weaker than around 0.42 g. This can be identified by observing that the open dots in the graph do not descend from the zero-coefficient line until a threshold of around 0.42 g. In contrast, the braking events that were stronger than around 0.42 g were linked to the drivers’ hazard perception ability score. This can be identified by observing that the dots in Figure 1 descend from the zero line at around 0.42 g, meaning that from this intensity and on, drivers with higher hazard perception ability had fewer braking events.
The VCM that Figure 1 follows is in the following form:
where F(X) is the response function, is the coefficient of the intercept (that is not depicted in Figure 1 for reasons of simplicity), and is the coefficient of the hazard perception ability score (HPT). T is the threshold for braking intensity that interacts with HPT and, therefore, modulates the value of the coefficient , as shown by the pattern of dots in Figure 1. Thus, Figure 1 unlocks the pattern of interaction between HPT and T. Namely, the effect of the HPT score on the proportion of braking events depends on T, but it does not change continuously as a function of T. Rather, the effect is constant (and zero) if T is lower than 0.42 g and changes if T is greater than 0.42 g. Such a pattern could not be observed if the model had an interaction term with a constant coefficient, like in Equation (1) or Equation (2).
Some of the readers may argue that while a standard regression model with constant coefficients will naturally not yield a changing coefficients graph, like in Figure 1, it can still yield good estimates for F(X) (i.e., good estimates for the proportion of braking events of different intensities). For instance, one may formulate a regression model with a series of constant coefficients for the braking events until 0.42 g and a second series of constant coefficients for the braking events above 0.42 g. However, readers might acknowledge that such a formulation would probably not be readily apparent. Rather, considering the “curse of dimensionality” (Fan & Zhang, 1999), one would probably be advised to first inspect the pattern from a VCM (like in Figure 1) before attempting to formulate the correct regression model with constant coefficients.
3. The Aims of the Current Paper
The background of the current paper, including the case example above, joins numerous discussions and examples on the prowess of the VCM in studying statistical interactions (e.g., Dambon et al., 2021; Fan & Zhang, 2008; Park et al., 2015). However, different than in the previous manuscripts, the current paper is not designed to demonstrate the prowess of the VCM. Rather, the current paper has three aims as follows:
- To provide a rough sense of the acceptance (or lack thereof) of the VCM as a tool for studying statistical interactions;
- To compare different research domains in terms of their relative acceptance of the VCM;
- To provide insights into the obstacles to utilizing the VCM and how its utilization might be increased.
4. Aim 1—Method
- Analysis rationale
The first aim of the paper is to provide a rough sense of the acceptance (or lack thereof) of the VCM as a tool for studying statistical interactions. This aim will be achieved by providing a crude estimation of the total number of publications with the VCM and comparing it with a very crude estimation of the total number of publications with an interaction term.
- Tools and procedure
- Google Scholar search on publications with the phrase “varying coefficients”
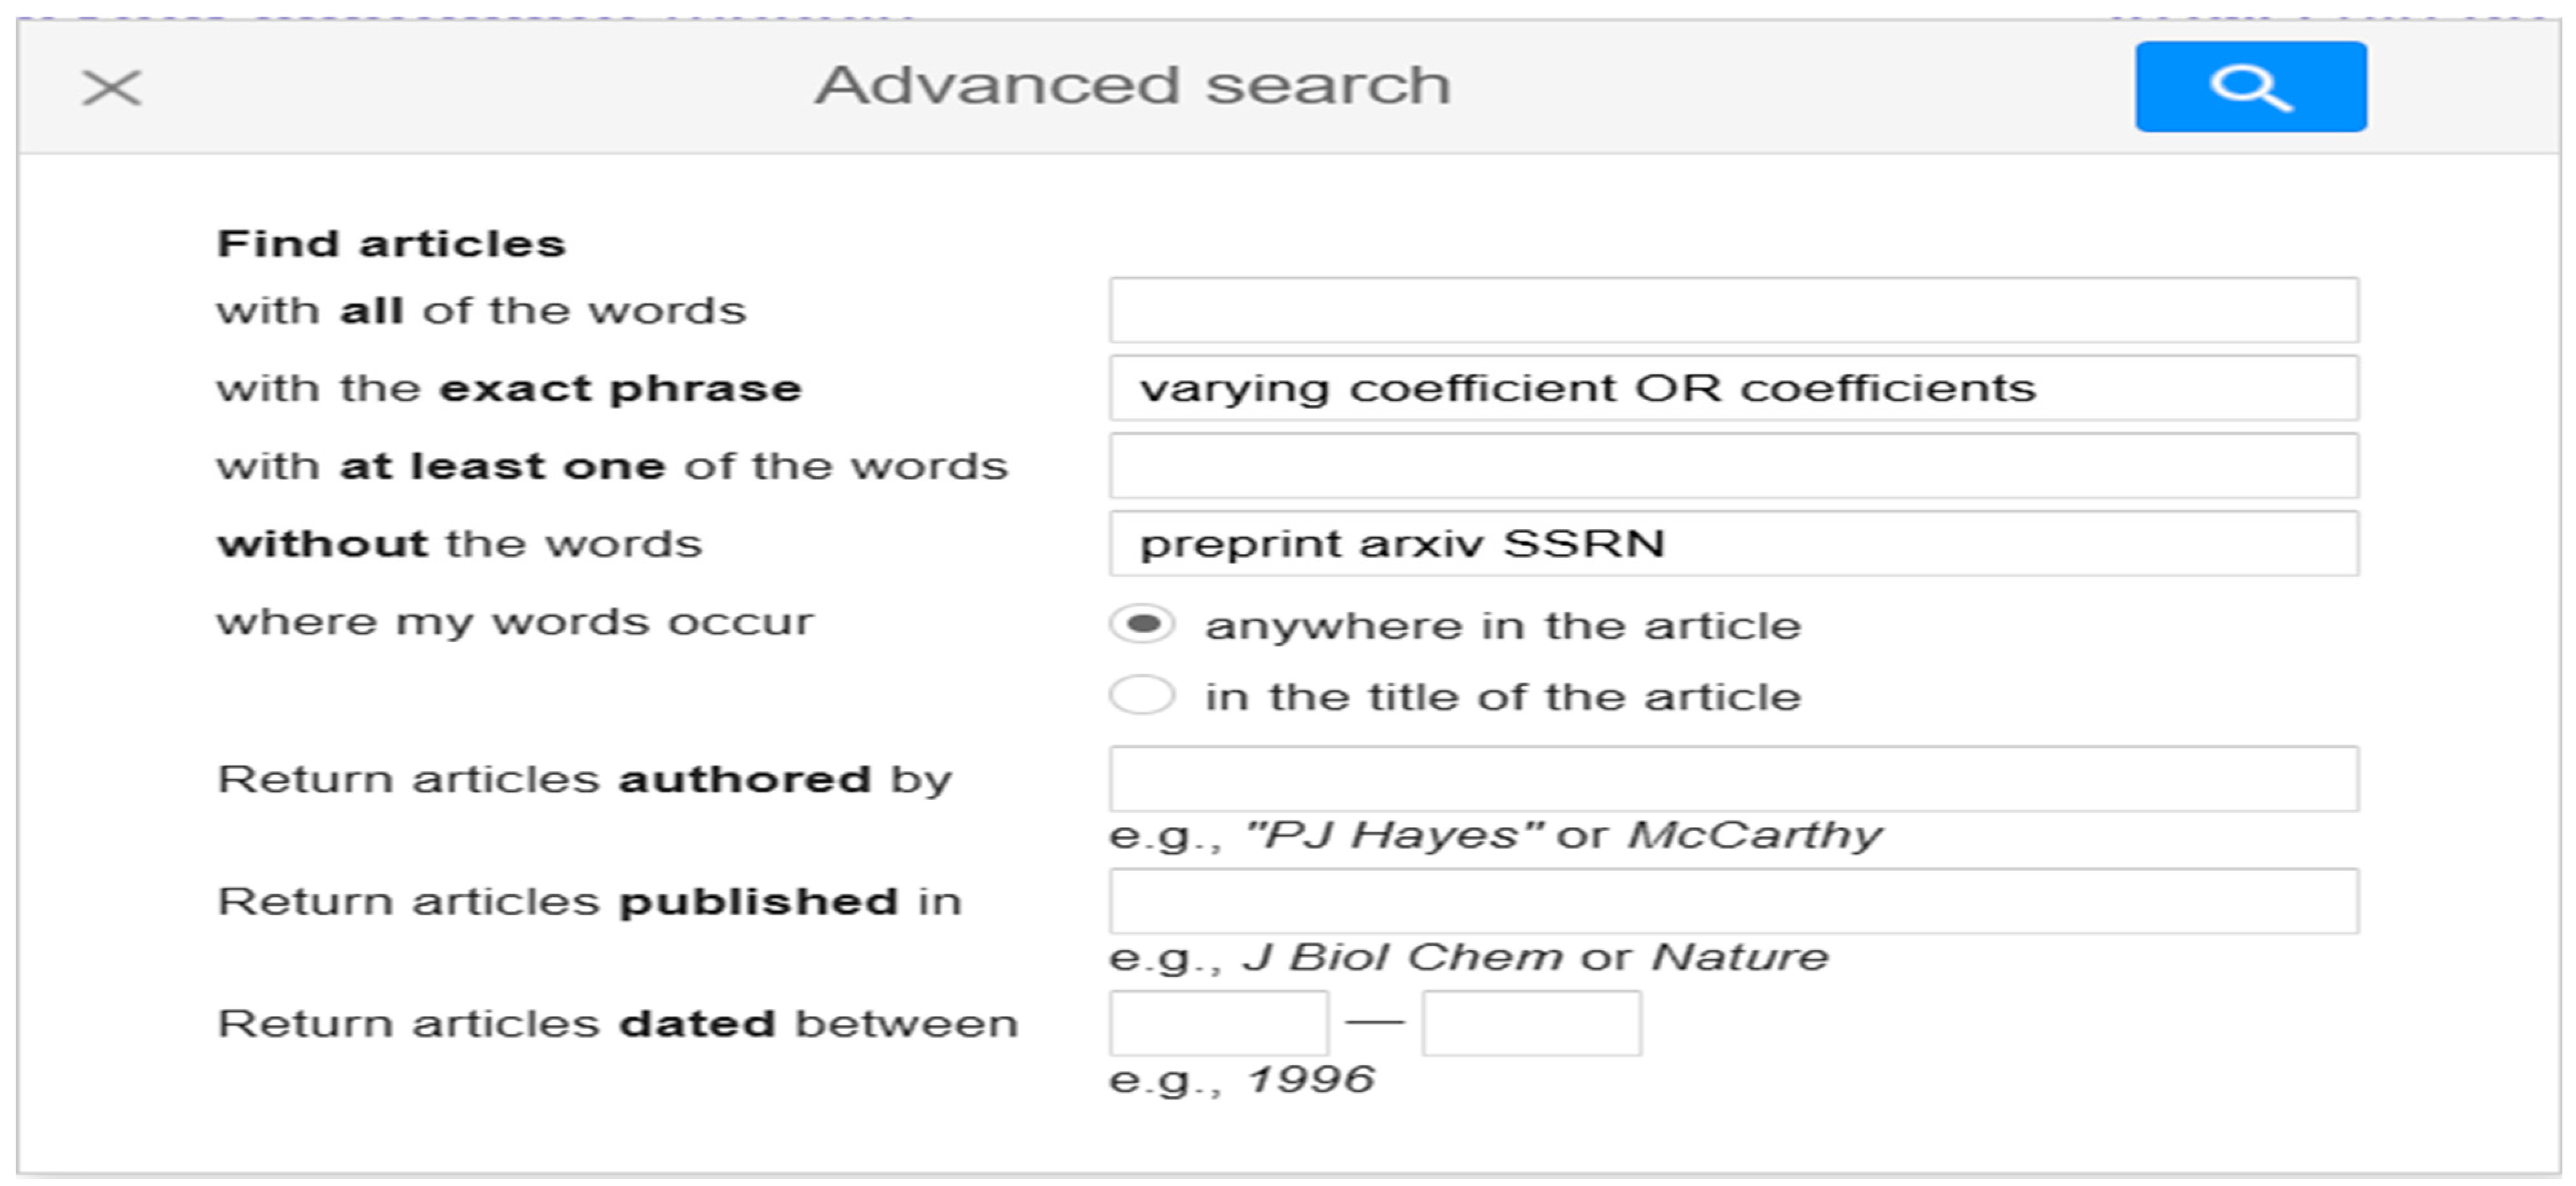
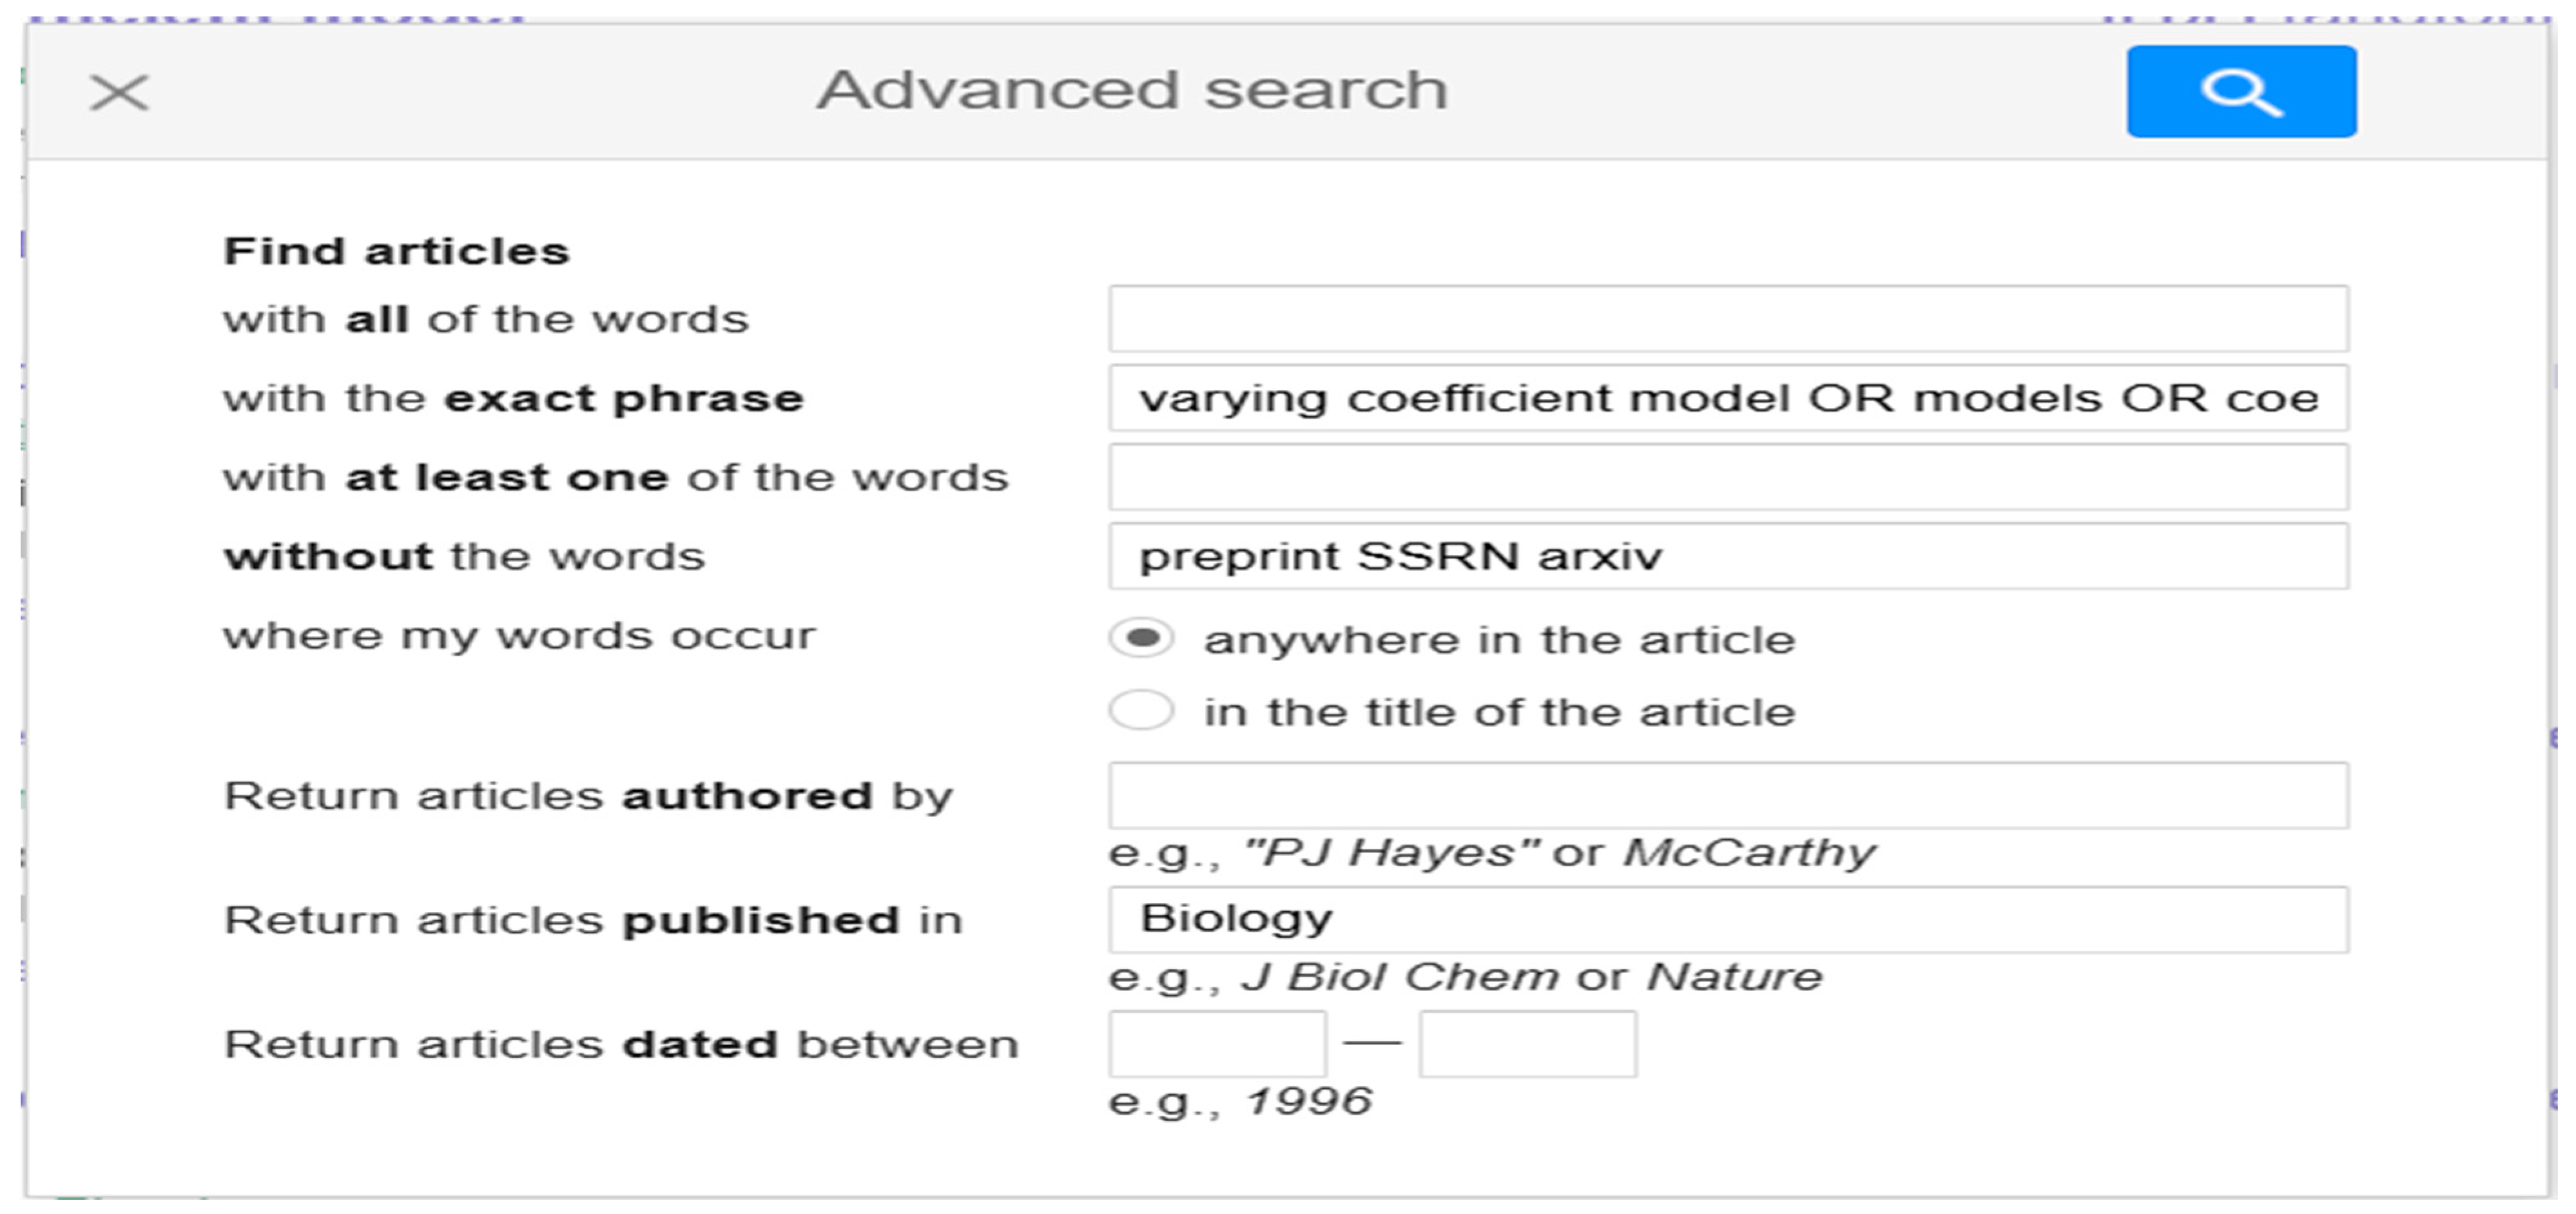
Google Scholar was used to obtain a crude estimation of the total number of publications with the VCM. The search was conducted by first typing “varying coefficient OR coefficients” into the field “with the exact phrase” within the advanced search dialog box (see Figure 2 below). The second step was tick marking the filter option “anywhere in the article”, and finally, the third step was typing in the words preprint, SSRN, and arxiv in the field “without the words” to exclude papers that were not published yet.
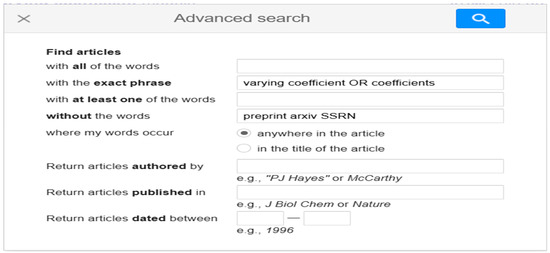
Figure 2.
Advanced search box for publications with the phrase “varying coefficient OR coefficients”.
- Google Scholar search on publications with the phrase “interaction term”
This search was performed like in Figure 2, and only the phrase “varying coefficient OR coefficients” was substituted by the phrase “interaction term OR terms” in the field “with the exact phrase”.
5. Aim 1—Results
The search yielded 79,200 results for the phrase “varying coefficient OR coefficients” in comparison to 2,710,000 results (~34.2-fold more) for the phrase “Interaction term OR terms”. Hence, a crude estimation showed that it is far more likely to find a publication in which statistical interactions were modeled using a regression with an interaction term than to find a publication in which statistical interactions were modeled using a VCM.
6. Aim 1—Discussion
The search results showed that the VCM has relatively little ground as a tool for studying statistical interactions. Instead, it appears that researchers are far more likely to use a regression model with an interaction term. This conclusion holds even stronger if considering that the search procedure (see Section 4 above) was more likely to deflate the estimations of the number of publications with a regression term in their analyses than the number of publications with a VCM.
Researchers are not always using statistical language in their papers and, therefore, may not use the phrase “interaction term”, which was used in the search procedure. Instead, researchers may more simply report that they used a “regression model”, either if the model included an interaction term or not. This is probably why the Google Scholar search returned only 2,710,000 publications, while it is very unlikely that this is indeed the number of publications over the years in which a regression term was part of statistical analyses. In contrast, the phrase “varying coefficients” is in the name of the tool “varying coefficients model” and, therefore, it is very likely to be used in a publication in which the statistical tool was a VCM. Thus, the estimation of 79,200 publications with a VCM is less likely to be grossly deflated.
The conclusion that the VCM has relatively little ground as a tool for studying statistical interactions should be of great concern to the research community considering its acknowledged prowess in describing patterns of interactions between variables (e.g., Dambon et al., 2021; Fan & Zhang, 2008; Park et al., 2015; Sperlich & Theler, 2015). Patterns that may remain hidden if using a regression model with an interaction term because of the difficulty of finding the mathematical form of the interaction term (Fan & Zhang, 1999; Hastie & Tibshirani, 1986; Nason et al., 2004). Therefore, the second aim of this paper is to compare research domains on their relative acceptance of the VCM, laying the groundwork for insights into factors that might facilitate or hinder the usage of the VCM as a tool for studying statistical interactions.
7. Aim 2—Method
- Analysis rationale
The second aim of this paper is to compare different research domains on their relative acceptance of the VCM as a tool for studying statistical interactions. The straightforward way to such a comparison would be to estimate the number of publications with the VCM in different domains. Then, divide the estimations by the overall number of publications over the years in each of the domains to obtain proportions, and finally, compare the proportions. The higher the proportion of publications with a VCM in a research domain out of all publications in this domain over the years, the higher this research domain is in using the VCM.
However, such a straightforward comparison does not appear possible because it is difficult to obtain good estimations of the total number of publications in different research domains. For example, writing “Biology” in Google Scholar does not guarantee a good estimation of the number of publications in biology over the years. This is because publications in biology would not necessarily have the word biology within them and would also not necessarily be published in an outlet with the word biology in its title.
Therefore, an alternative index has been devised to estimate the relative acceptance of the VCM in different domains. The index was the estimated ratio of publications in methodological to non-methodological outlets. The rationale for this index is that methodological outlets (e.g., Biostatistics in biology) are designed to inform researchers of methods that they can implement, and these methods are implemented (or not) in the non-methodological outlets (e.g., Genes in biology). Thus, if the VCM has gained more acceptance as a statistical method in a certain domain, then for each publication with the VCM in an outlet for presenting methods in that domain, there will be more publications with the VCM in outlets in which methods are implemented. This rationale will be addressed again in Section 9 using an example from Section 8.
- Search, review, and counting procedure
The aim of the search was to estimate the ratio of methodological to non-methodological publications with the VCM in different domains. Going over 79,200 publications with the VCM over the years (see Section 5 above) and classifying them into domains was not feasible and, therefore, two ways were used to reduce the number of publications to be classified.
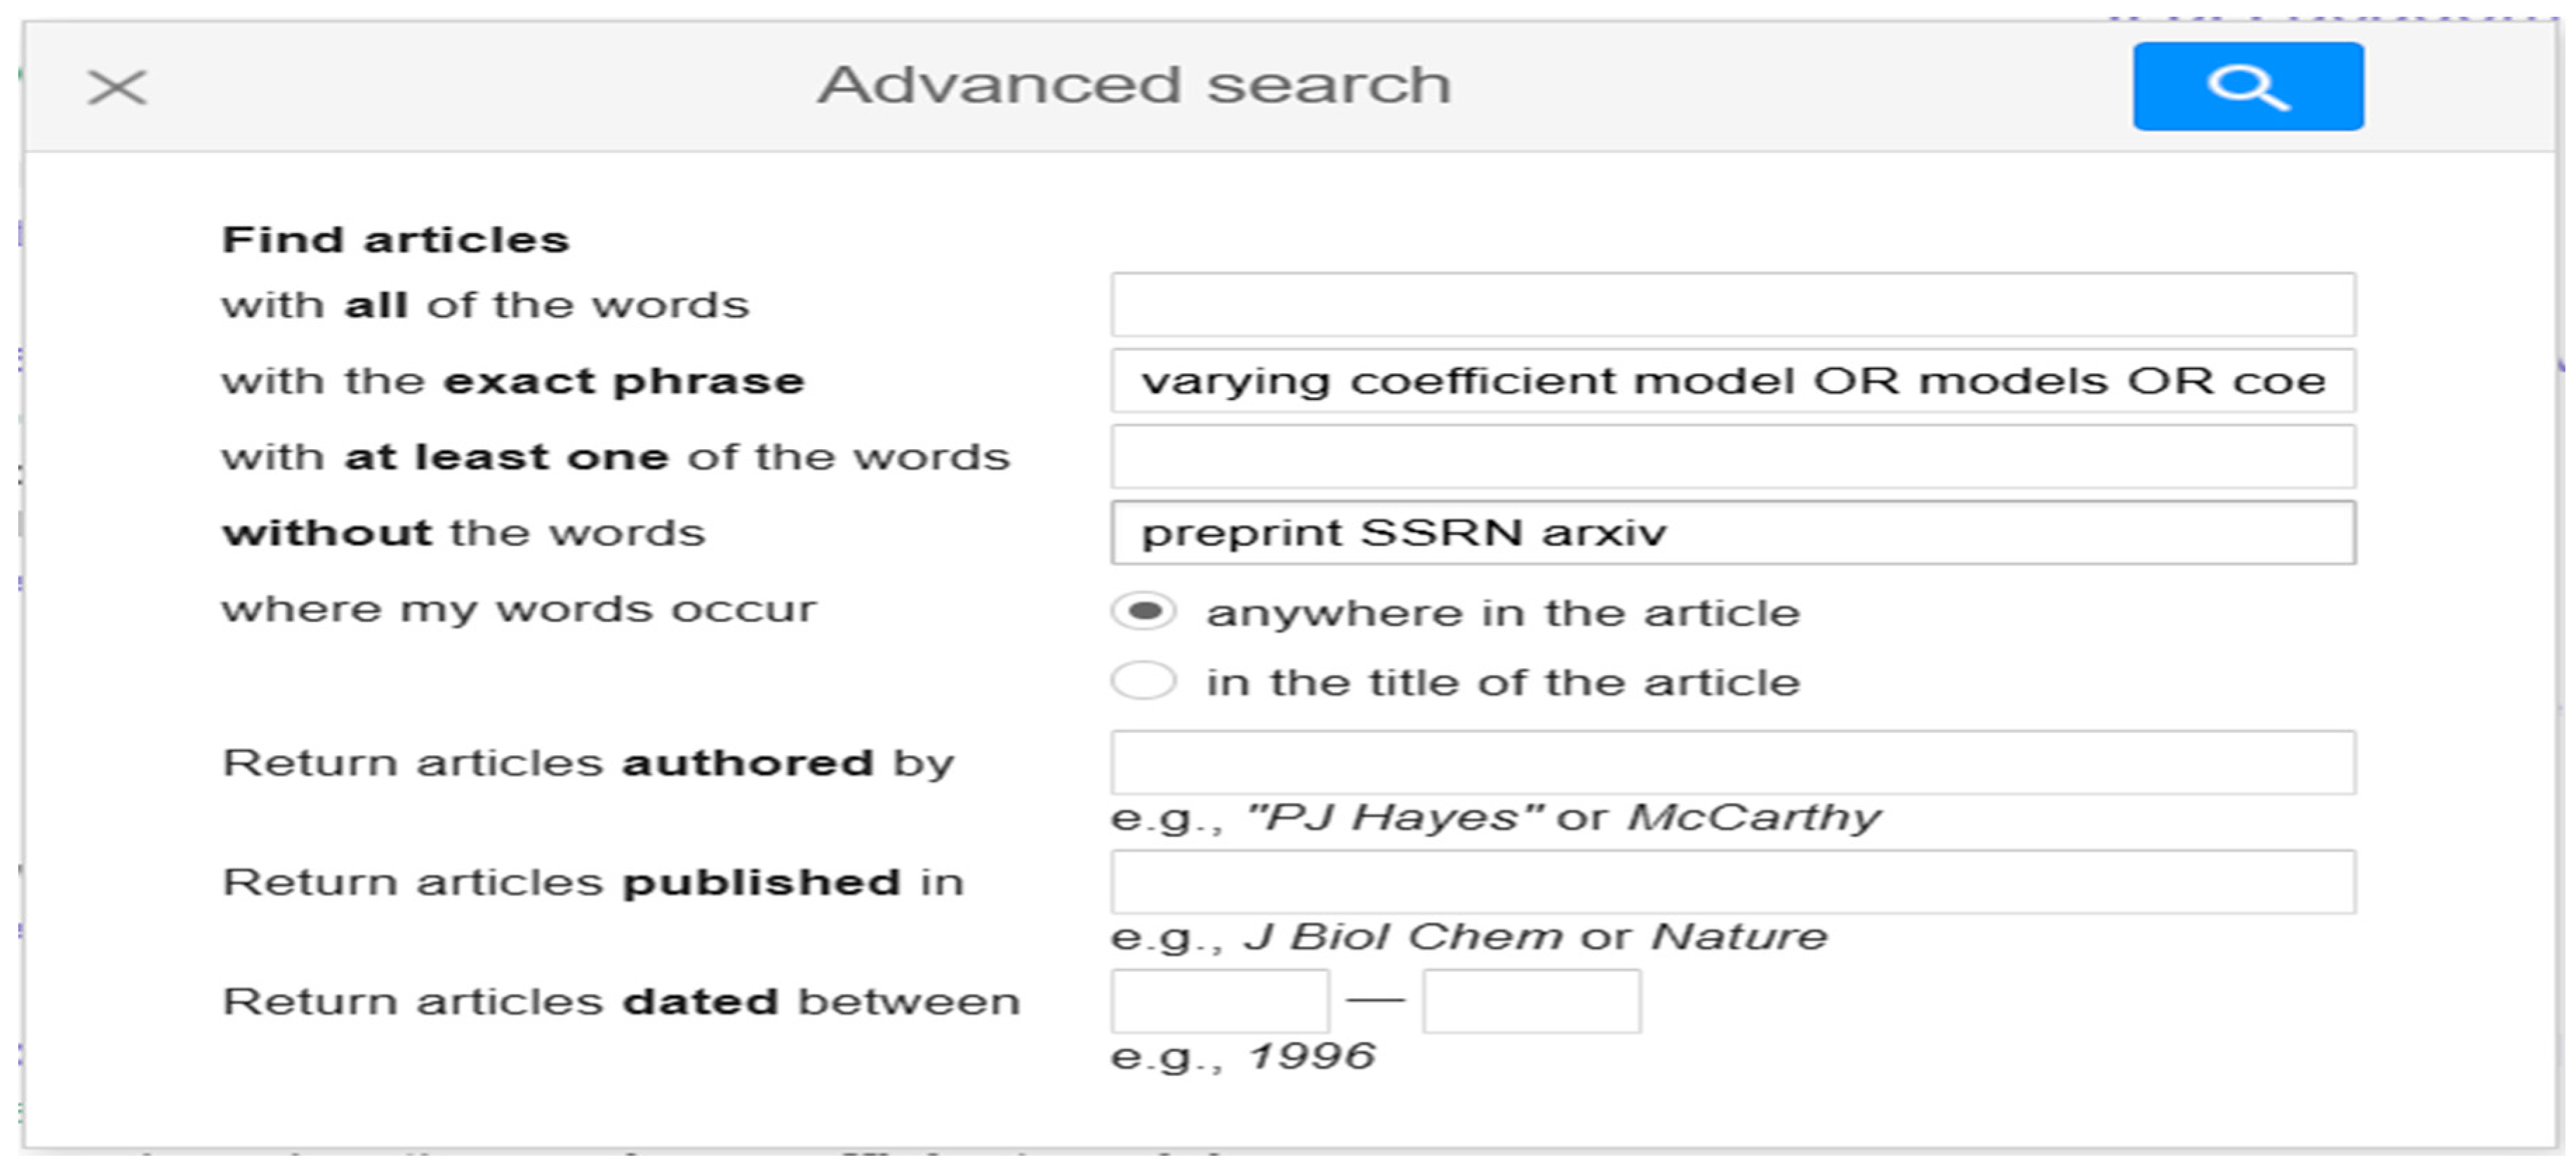
- The phrase “varying coefficient OR coefficients” (see Figure 2 above) was substituted by the phrase “varying coefficient model OR models OR coefficients” (see Figure 3 below), resulting in narrowing down the results from 79,200 to 9420 publications.
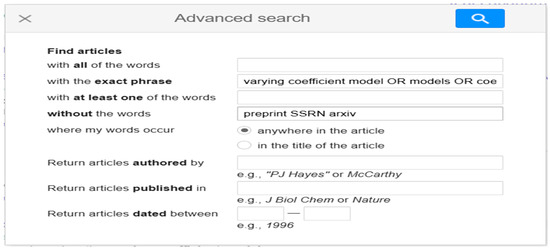 Figure 3. Advanced search box for publications with the phrase “varying coefficient model OR models OR coefficients”.
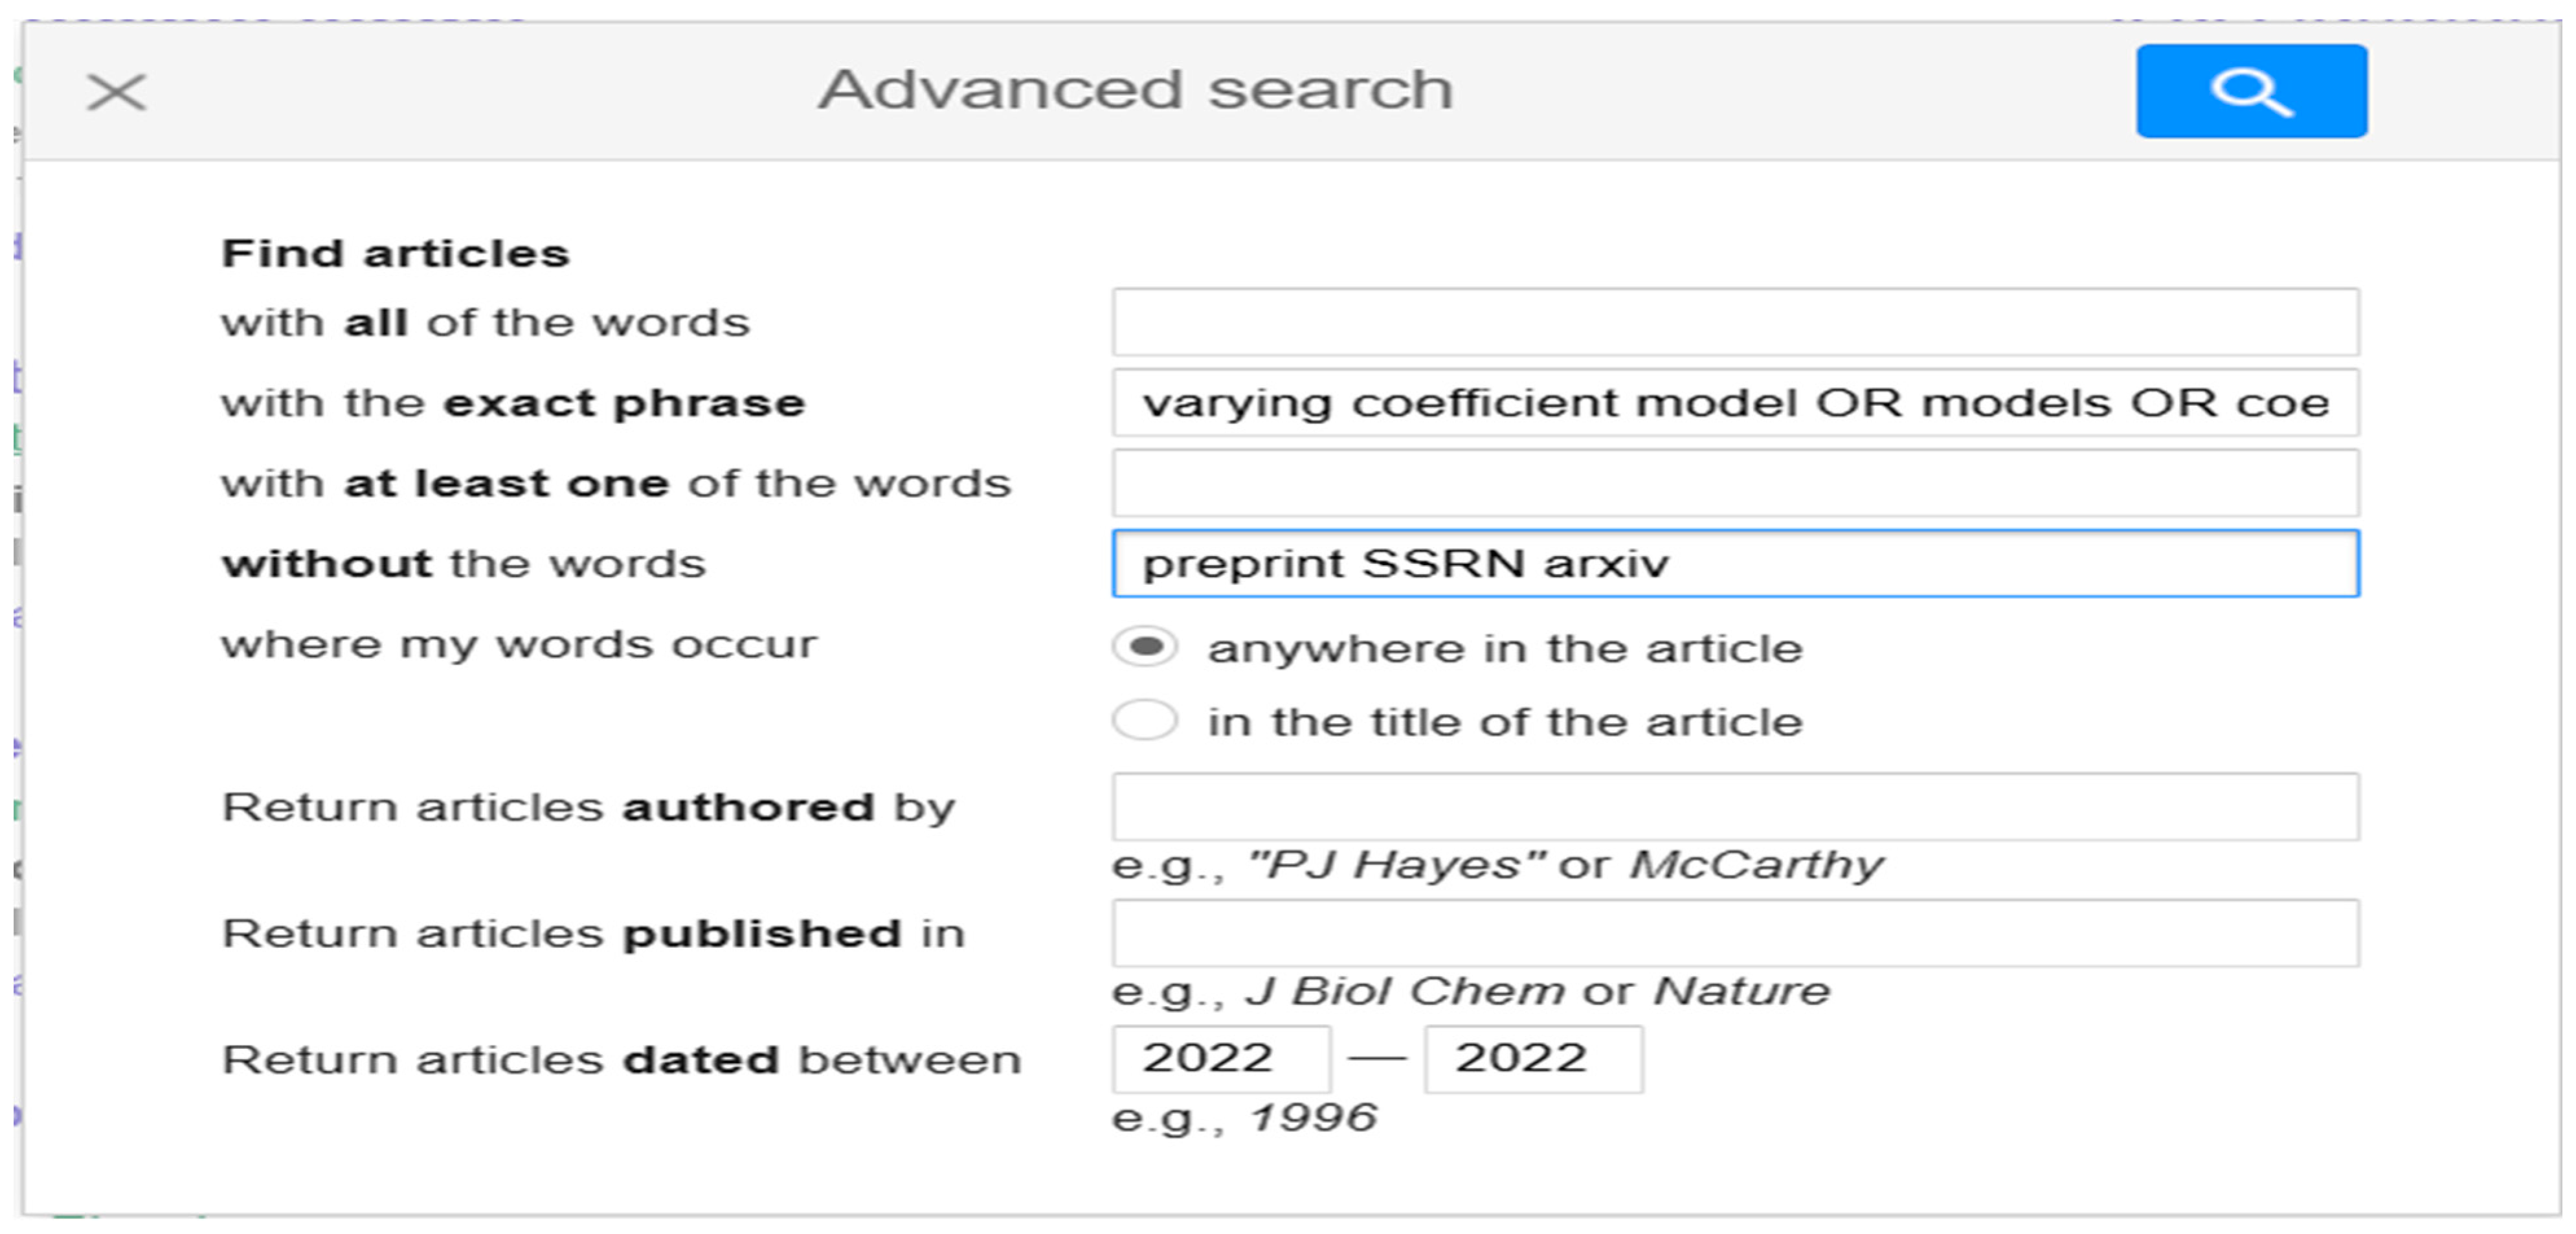
 - Generating a sub-sample of publications within the 9420 that were found above (see point 1) and identifying their respective research domains. The sub-sample was generated by limiting the search to publications in 2022. The year 2022 was chosen arbitrarily because the purpose was to generate a sub-sample of research domains, and there was no reason to expect that 2022 would have a bias towards certain research domains in comparison to any other year (e.g., 2024). The search box with the limitation to publications in 2022 is presented in Figure 4.
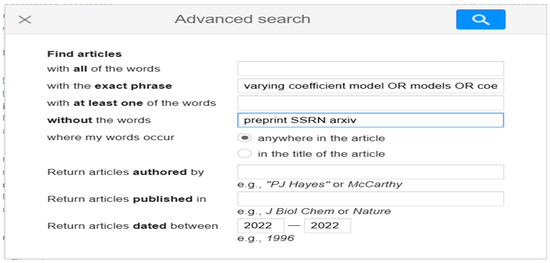 Figure 4. Advanced search box for publications with the phrase “varying coefficient model OR models OR coefficients” in 2022.
The search with the phrase “varying coefficient model OR models OR coefficients” in 2022 led to a sample of 656 publications from different outlets. Then, a one-by-one inspection of the 656 publications was performed to identify their respective research domains while applying the procedure in the points below. The findings in Section 8 are the outputs of this procedure, and looking at them in parallel to reading the points below may facilitate the reading.
- If the outlet title contained a research domain that had already been found (e.g., “Statistics”), the search proceeded to the next result.
- Otherwise, if the title contained a domain that had not been found yet (e.g., “Biology”), then the advanced search had been resumed but across all years (not limited to 2022), with the domain’s name in the search field “return articles published in” (see Figure 5 below).
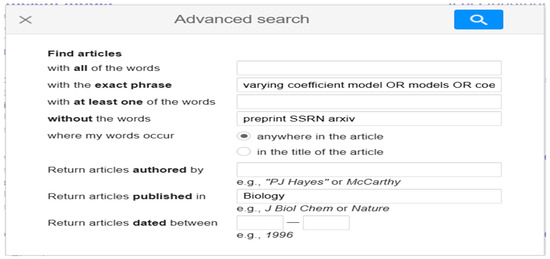 Figure 5. Advanced search box for publications with the phrase “varying coefficient model OR models OR coefficients” in biology. As explained above, a search across all years with a domain’s name (e.g., Biology) was initiated if a publication from the sample of 656 in 2022 had this domain’s name in its title.
- ○
- Then, for each retrieved paper from this domain (unless the domain was statistics or mathematics), an inspection was made to test if the outlet title contained the words “Statistics(cal)” or “Mathematics(cal)”. For example, “Biostatistics”.
- ➢
- If yes, the frequency count for the relevant category of domain-specific methods had been increased by 1 (+1 publications in “Methods in biology”), and the count for the other domain had been decreased by 1 (e.g., −1 publications in “Statistics”).
- ➢
- If not, the frequency count of papers in the relevant domain had been increased by 1 (e.g., +1 papers in “Biology”), unless the title still signified that the journal is methodological (e.g., “Biometrika”). In this case, the frequency count for the relevant category of domain-specific methods had been increased by 1 (+1 publications in “Methods in biology”).
- Otherwise, if the title did not contain a word from a domain, for example, Genes is a journal in biology but does not contain the domain’s name, an advanced search was run with the title of the journal across all years. Thereby, the papers with “varying coefficient model OR models OR coefficients” in this journal were counted and added to the count of the relevant domain (e.g., +count publications in “Biology”). This way, publications with the VCM in journals that did not have the domain’s name in their title but were in a certain domain could be found and associated with the domain.
Note that in almost all cases, the classification of papers in methodological outlets to their respective domain was very straightforward. For example, papers in Biometrika were classified into “methods in biology”. Yet, in a few instances, the classification was based on the journal’s stated “aims and scope”, like with the journal “Spatial Statistics”, which has been associated with three domains as a methodological journal.
Finally, because the search started from an initial sample of 656 publications and then expanded based on their research domains and outlets, a smaller cross-validation search was conducted in the Web of Science (WOS) with the phrase “Varying Coefficient* Model*”. The purpose of the smaller search was to assess whether the distribution of VCM publications across research domains according to WOS resembled the distribution according to the search in Google Scholar. To elaborate, while Google Scholar offers a larger dataset than other databases (e.g., WOS; Scopus) (Lopez-Cozar et al., 2017; Zupic & Cater, 2015), it was feasible to benefit from this advantage only by starting from a predefined sample. WOS has fewer records but provides automatic classification of all the records into research domains.
Furthermore, in this respect, because the main analysis was an exploratory mapping of VCM publications across methodological and non-methodological outlets in various domains, Google Scholar could be used instead of Scopus or Web of Science. The latter are essential if the analysis requires bibliometric methods, like co-author or co-citation analysis, as they allow researchers to import data to bibliometric software programs (see Zupic & Cater, 2015 review on bibliometric methods and analysis). If such methods are not the focus, Google Scholar is a valuable database for exploring publication trends (e.g., Ahmad et al., 2019; Strandberg et al., 2018; ElHawary et al., 2020; Fernandes & Fernandes, 2024; Gadd et al., 2019).
8. Aim 2—Results
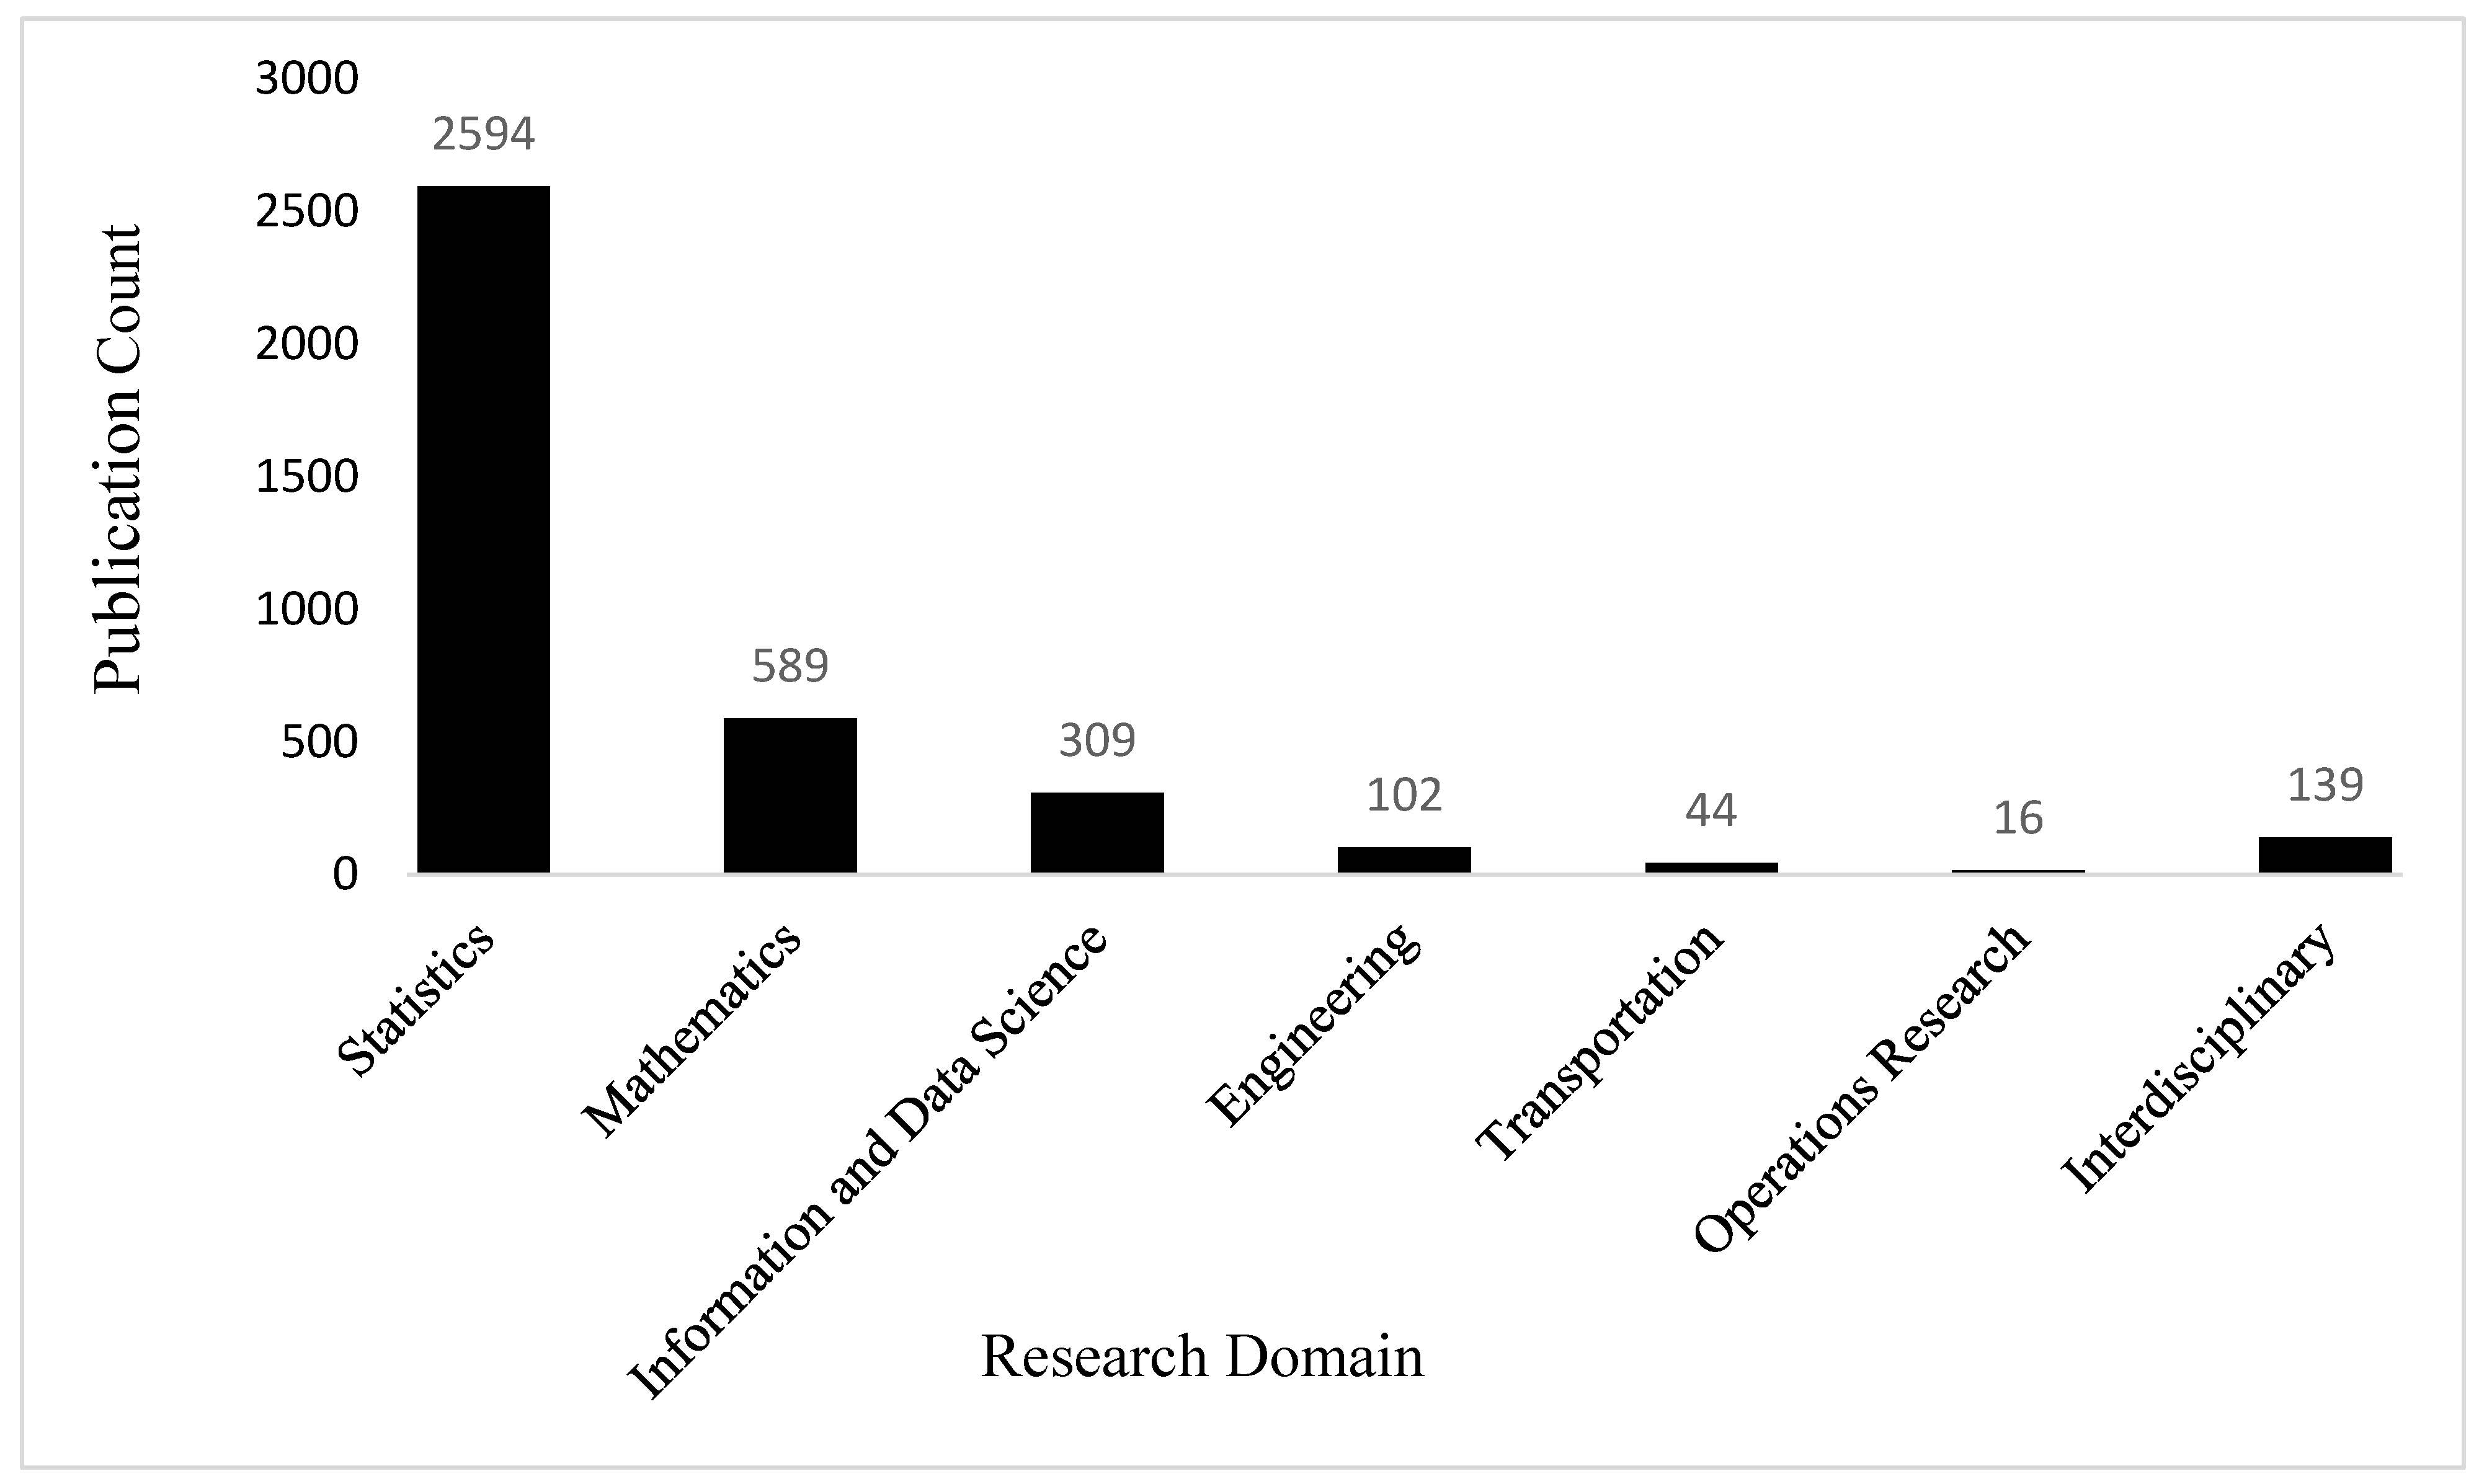
The results are summarized in Figure 6 and Figure 7 and in the notes below the figures. Overall, the search strategy of taking a sample of 656 publications with the VCM in 2022 and using the outlets of these 656 publications to search for additional publications with the VCM across all years in different domains and journals has led to retrieving 6212 publications. This number can be computed by summing the numbers above the bars in Figure 6 and Figure 7 below and then subtracting the publications that were counted in multiple research domains (see the Notes below Figure 7). Hence, of the original 9420 results that were retrieved with the phrase “Varying coefficient model OR models OR coefficients” across all years (see Figure 3), ~65.9% (6212/9420), could be retrieved using the sample of 656 publications with the VCM in 2022 (see Figure 4) and then following the search procedure below Figure 4.
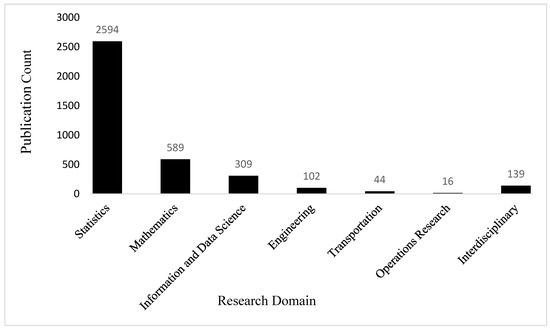
Figure 6.
Number of publications with the VCM in research domains for which the search did not lead to a methodological/non-methodological classification. In the list below “Domain” = retrieved by domain’s name, “Title” = retrieved by journal title. (x) = number of retrieved papers. The publication count in Figure 6 does not include all publications in Statistics and Mathematics from the list below, as domain-specific ones were counted in Figure 7 (e.g., Statistics in Medicine which appears in the notes below Figure 7). “Information”, “Remote sensing”, “Machine learning”, and “Artificial intelligence” were merged into “Information and data science” in Figure 6.
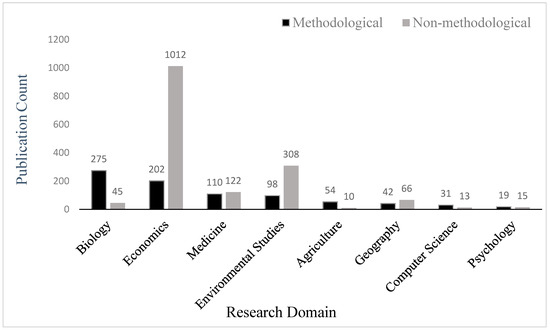
Figure 7.
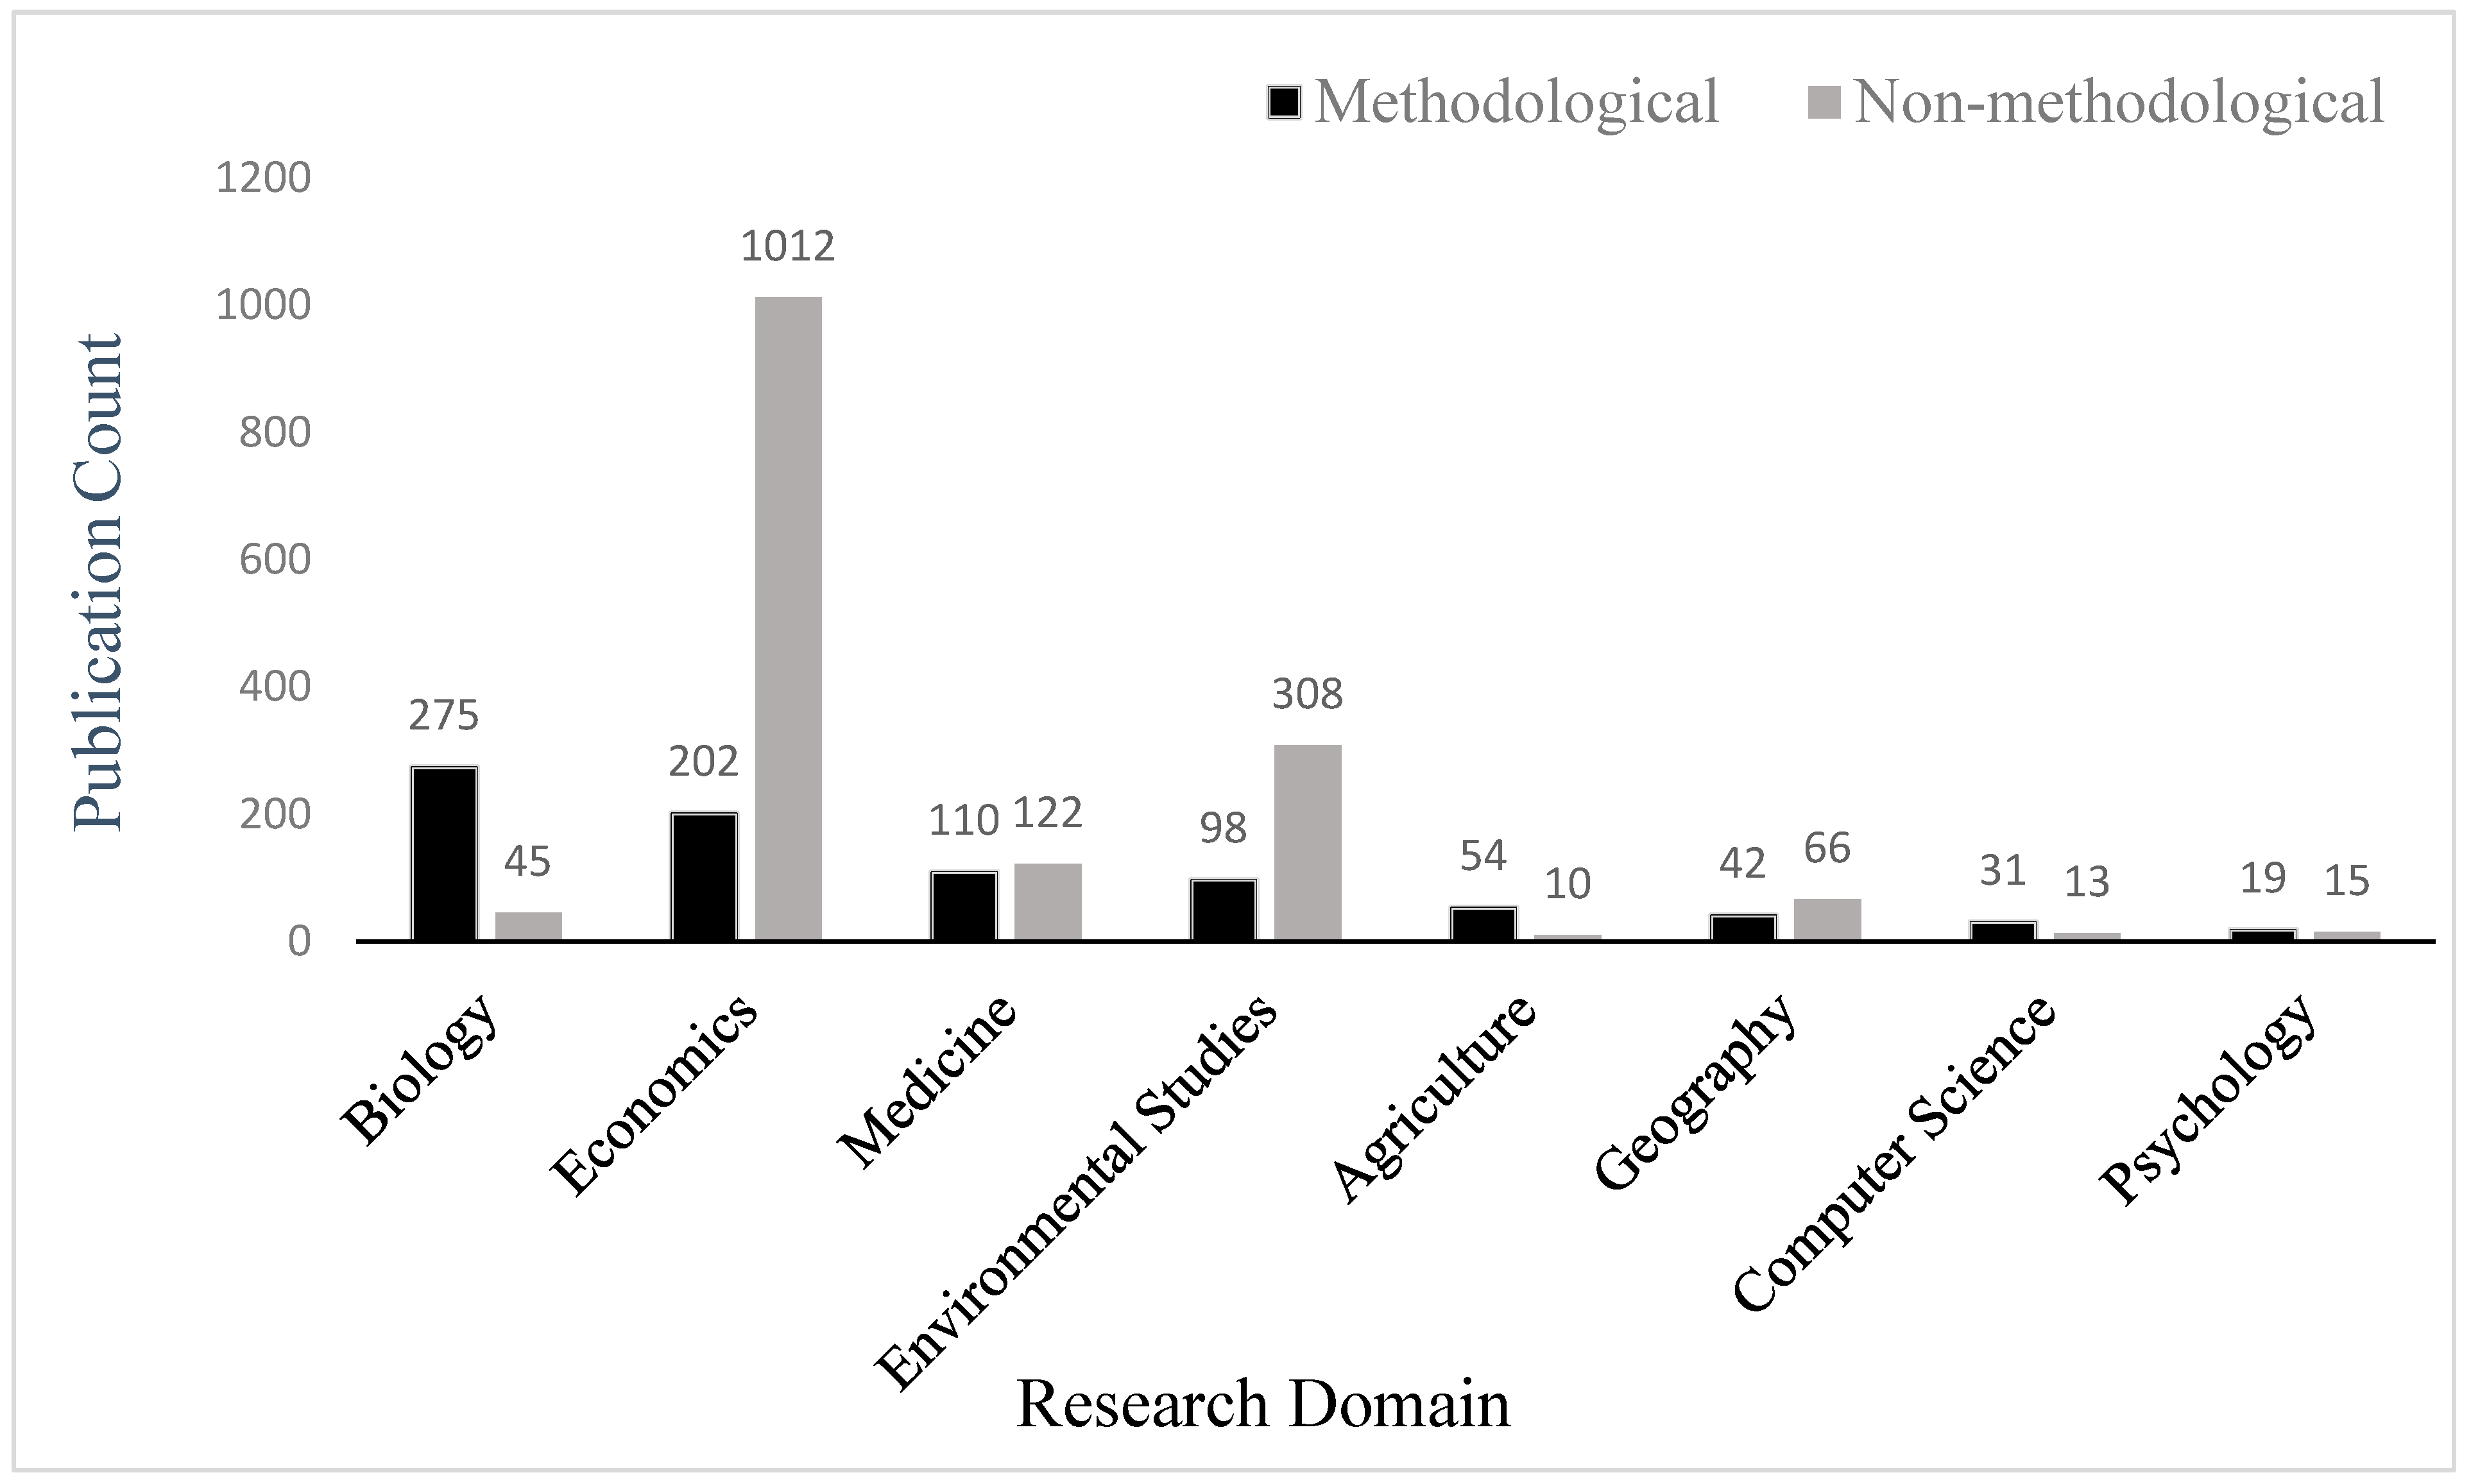
Number of publications with a VCM by “Methodological” (black bars) and non-methodological (gray bars). In the list below “Domain” = retrieved by domain’s name, “Title” = retrieved by journal title. (x) = number of retrieved papers. Spatial Statistics is associated with three domains in the figure (methods in environmental studies, methods in agriculture, methods in geography) based on an inspection of the stated aims and scope of the journal. Journal of Agricultural, Biological and Environmental Statistics is associated with three domains in the figure (methods in biology, methods in environmental studies, and methods in agriculture). To reduce the list below, outlets with fewer than five publications were not listed unless their associated domain had very few publications, like in the case of agriculture.
Figure 6 summarizes the number of publications from research domains for which the search procedure only pointed to non-domain-methodological outlets (see Figure 7 for comparison). Essentially, many of the research domains in Figure 6 are methodological in nature like statistics, mathematics, and information and data science. Therefore, one should not expect them to have respective methodological outlets like in the case of, for example, psychology and psychological methods (see the rightmost bars in Figure 7).
The notes below Figure 6 list the number of publications that were retrieved using a domain’s name (e.g., “Statistics(cal)”) and the number of publications that were retrieved with an outlet’s name (e.g., Multivariate Analysis). This reflects the search procedure that was described in Section 7 above. Namely, if a publication in 2022 was in an outlet with a domain’s name in its title (e.g., Statistics was part of the title), the search was reinitiated with the domain’s name (e.g., Statistics) across all years (see the example in Figure 5). Otherwise, if the publication in 2022 was in an outlet that did not have a domain’s name in its title (e.g., the title Multivariate Analysis does not include the domain’s name, which is statistics), the search was reinitiated across all years with the title of the outlet (e.g., Multivariate Analysis).
Finally, it is important to learn in Figure 6 that 3183 of the publications, which are ~33.8% of the original 9420 publications, are in statistics or mathematics. Thus, a large proportion of the publications with the VCM were in outlets for presenting computational methods. This is different than using the VCM for studying statistical interactions in an empirical research dataset. This finding resonates with the conclusion in Section 6 above that the VCM has not gained large acceptance as a tool for studying statistical interactions.
- “Statistics(cal)” (2552), Multivariate Analysis (104), Bernoulli (21), Metrika (50), Test (46), Technometrics (27), Stat (18), Analytics (18), Time Series Analysis (24), Statistica Neerlandica (9), and Sankhya (9).
- “Mathematics(cal)” (526), Acta Mathematicae (27), Journal of Systems Science and Complexity (30), and Symmetry (10).
- “Information” (141), “Remote sensing” (43), “Machine learning” (55), “Artificial intelligence” (20), Informatics (22), Journal of Data Science (22), and Journal of the Korean Data and Information Science (6).
- “Engineering” (102).
- “Transportation” (37) and Accident Analysis and Prevention (7).
- European Journal of Operational Research (10) and Annals of Operations Research (6).
- (Interdisciplinary) “Forecasting” (59), PlosOne (45), Scientific Reports (26), International Regional Science Review (7), and International Journal of Disaster Risk Reduction (2).
Figure 7 below summarizes the number of publications that were retrieved in different research domains classified into methodological and non-methodological publications. This classification was designed to compare research domains on their relative acceptance of the VCM. The results in the figure imply that economics, environmental studies, and geography, in this order, were the highest in accepting the VCM as a tool for studying statistical interactions.
For every publication with the VCM in a methodological journal in economics (202 publications in Figure 7), there were ~5 publications with the VCM in non-methodological journals (1012 publications in Figure 7). For every publication with the VCM in a methodological journal in environmental studies (98 publications in Figure 7), there were ~3.14 publications with the VCM in non-methodological journals (308 publications in Figure 7). Finally, for every publication with the VCM in a methodological journal in geography (42 publications in Figure 7), there were ~1.57 publications with the VCM in non-methodological journals (66 publications in Figure 7).
Economics, environmental studies, geography, and medicine were the research domains in Figure 7 in which more publications were found in outlets in which methods were implemented than in outlets in which methods were presented. A sharp point of contrast was biology, in which for every publication with the VCM in a methodological journal (275 publications in Figure 7), there were only ~0.16 publications with the VCM in non-methodological journals (45 publications in Figure 7).
- Biometrical Journal (27), Biometrics (95), Biometrika (55), Biostatistics (45), Bioinformatics (32), Journal of Agricultural, and Biological and Environmental Statistics (21).
- “Biology” (37), Genes (8).
- “Econometrics” (202).
- “Economic(s)” (735), “Finance (Financial)” (264), Journal of Business Research (7), and Resources Policy (6).
- BMC Medical Research Methodology (12) and Statistics in Medicine (98).
- “Medicine” (36), Revista (16), and “Epidemiology” (70).
- Environmetrics (26), Journal of the International Environmetrics (8), Environmental and Ecological Statistics (10), Journal of Agricultural, Biological and Environmental Statistics (21), and Spatial Statistics (33).
- “Environment(al)” (240), “Ecology” (42), and Sustainability (26).
- Journal of Agricultural, Biological and Environmental Statistics (21) and Spatial Statistics (33).
- Agriculture (2), Precision Agriculture (5), and Computers and Electronics in Agriculture (1).
- Geographical analysis (9) and Spatial Statistics (33).
- International Journal of Geographical Information Science (18), International Journal of Geo-Information (17), Journal of Geographical Systems (12), Annals of the American Association of Geographers (9), Computers Environment and Urban Systems (7), and Spatial Demography (3).
- Statistics and Computing (31).
- “Computer Science” (13).
- Psychological Methods (11), Psychometrika (4), and Mathematical and Statistical Psychology (4).
- “Psychology” (15).
- Cross-validation with Web of Science (WOS)
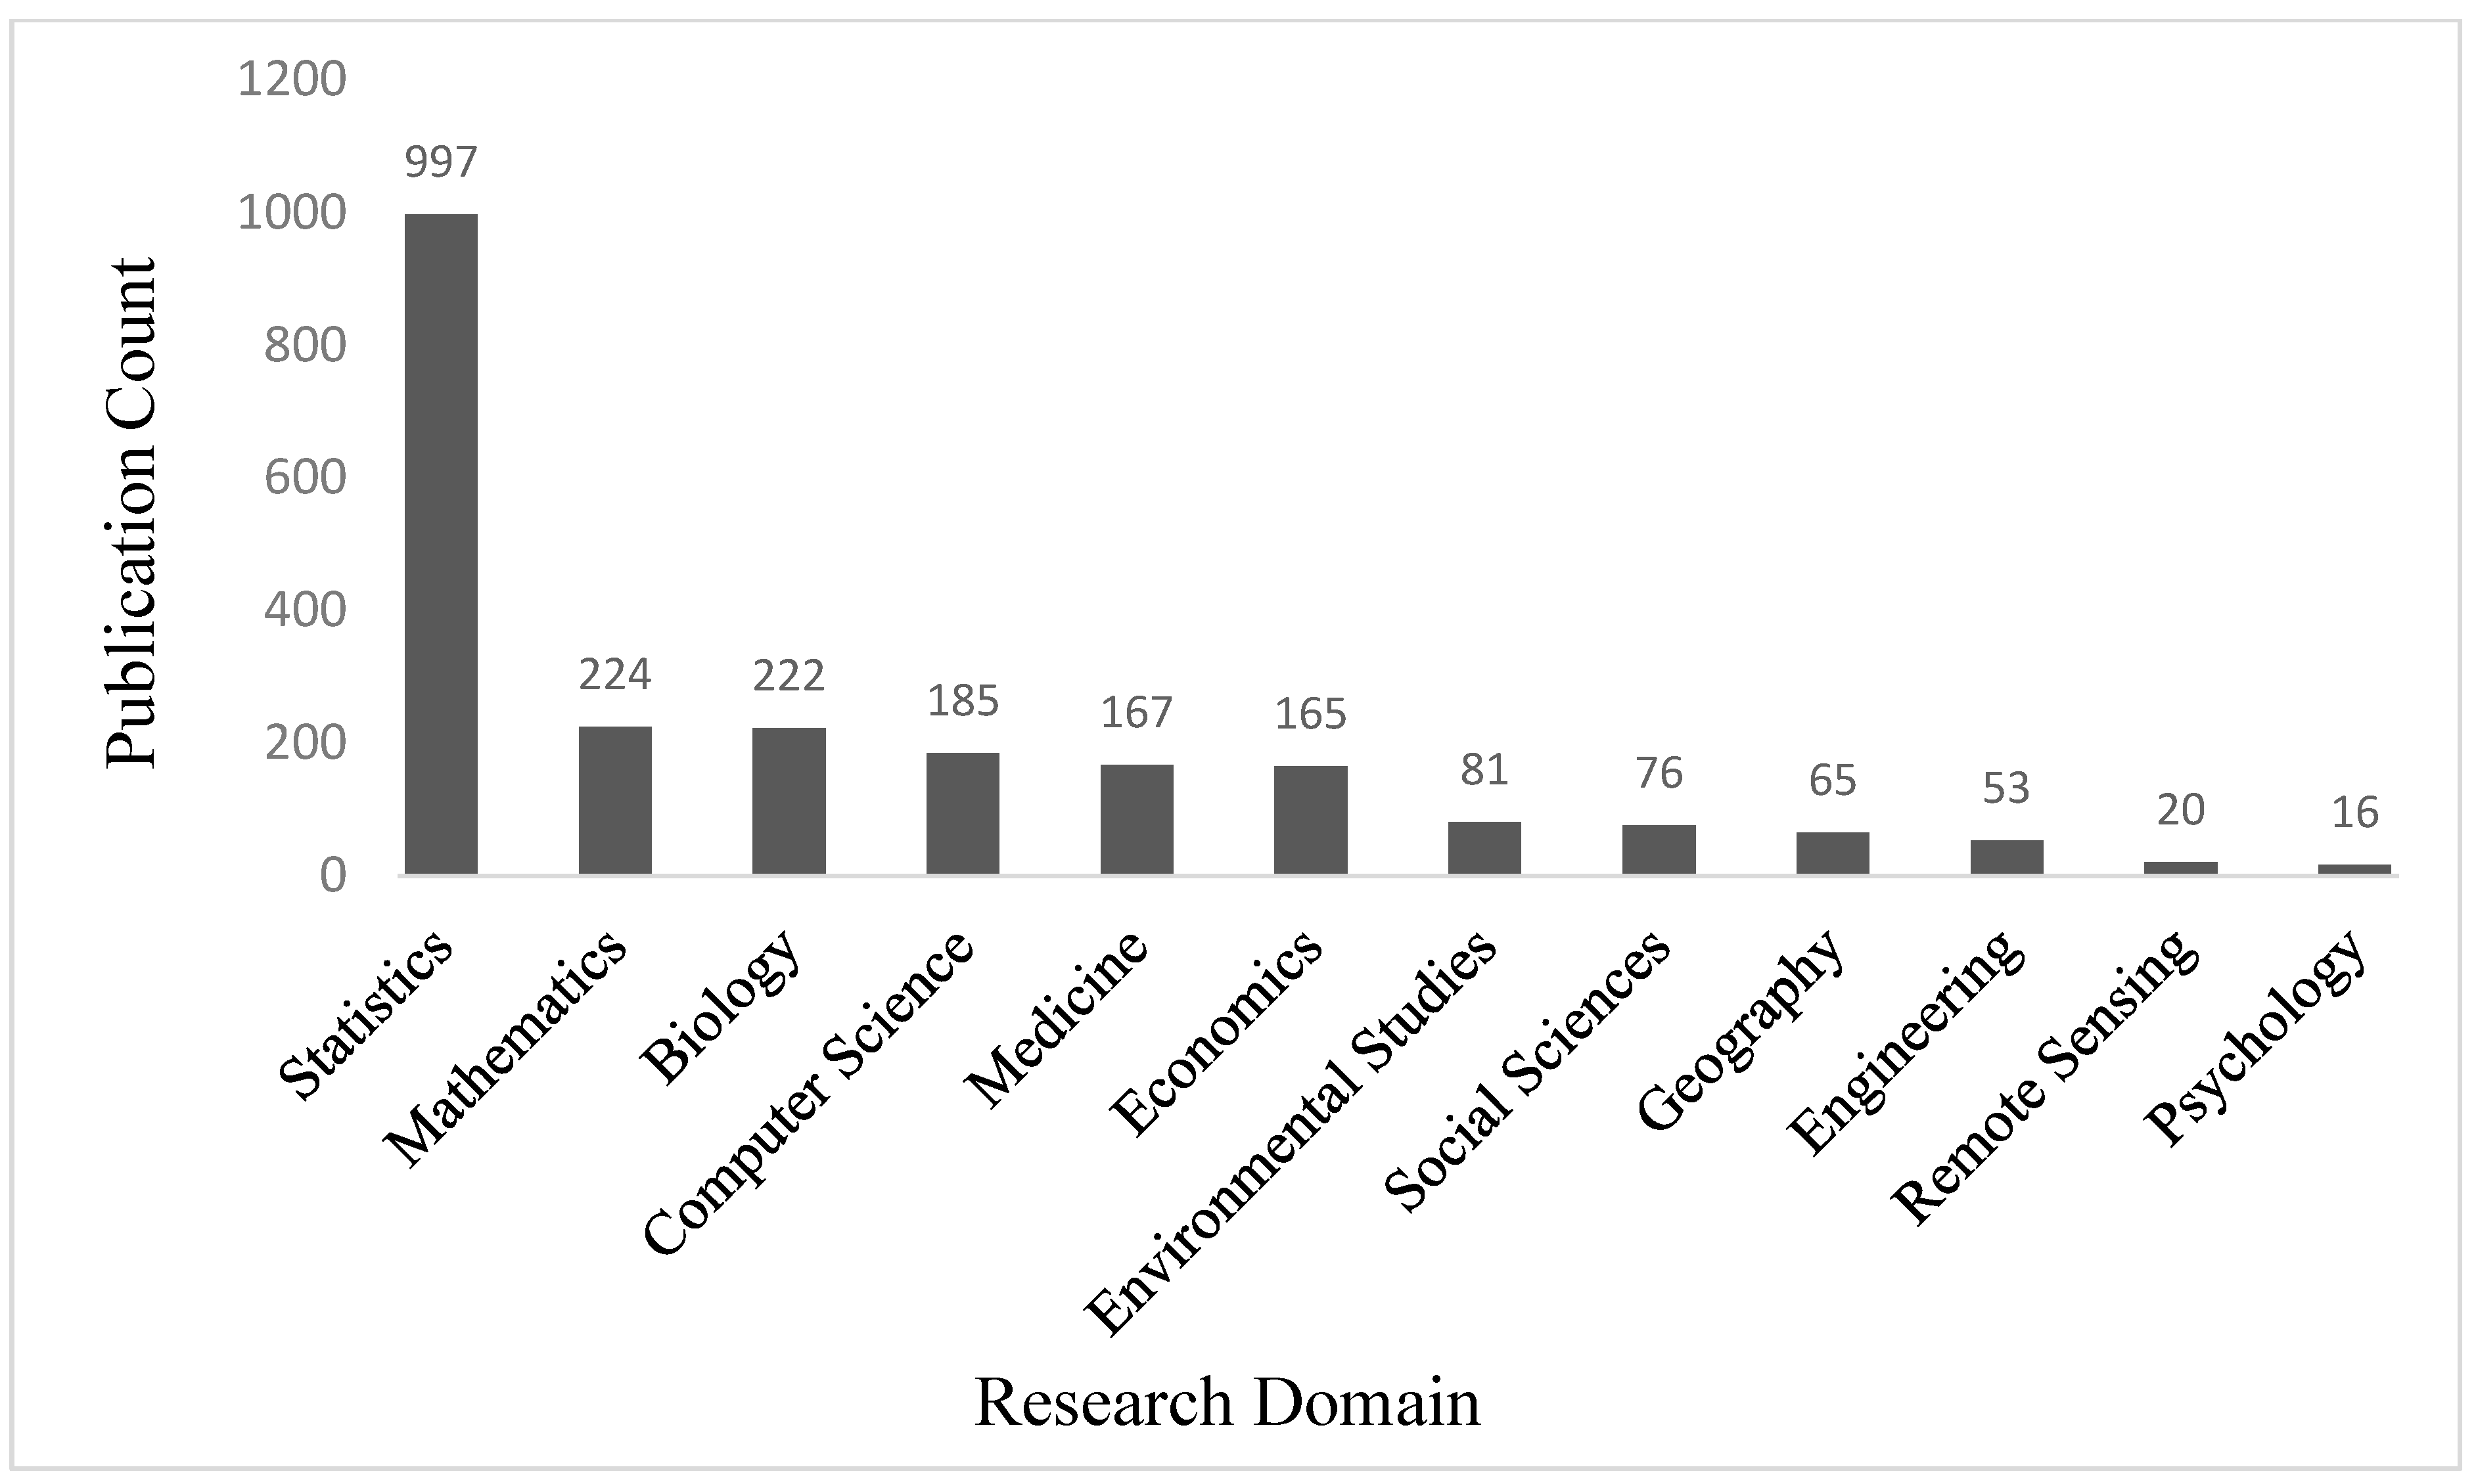
A search in WOS with the phrase “Varying Coefficient* Model*” yielded 1511 results, which were automatically classified into research domains. The goal of this smaller search was to estimate the validity of the main search and counting procedure in Google Scholar by comparing the distribution of VCM publications across domains. Note that the retrievals from WOS were not further classified into methodological and non-methodological publications because this was a smaller search conducted solely for validity estimation.
The distribution of VCM publications across research domains is presented in Figure 8. Note that research domains with fewer than 16 VCM publications were excluded, as they did not significantly impact the overall trend of publication distribution. For example, six publications in the transportation category in WOS were excluded from Figure 8 even though the exact same category appears in Figure 6. Also, note that several category names were adjusted for consistency with the figures above and that several categories were merged. For example, environmental sciences and environmental studies were merged into “Environmental Studies”, and public, environmental, and occupational health (with 69 VCM publications) was merged into “Medicine”.
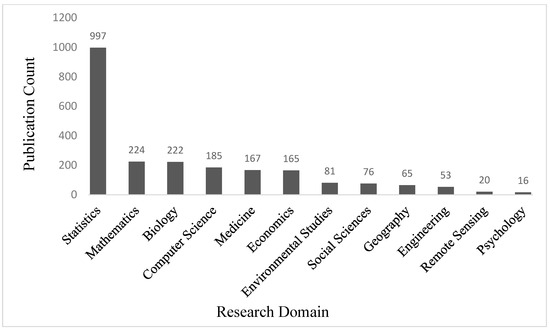
Figure 8.
Distribution of VCM publications across domains based on WOS. The sum of the numbers above the bars exceeds 1511 (the total number of retrieved publications) because a single publication can be associated with several categories.
A comparison between Figure 8 (based on WOS) and Figure 6 and Figure 7 (based on Google Scholar) shows that despite some differences, the overall trend remains similar. For example, while Figure 8 includes “Social Sciences”, which does not appear in Figure 6 or Figure 7 and lists only “Remote Sensing”, which was merged into the broader category “Information and Data Science” in Figure 6, the three figures largely include and exclude almost the same categories. For example, “Physics” had too few VCM publications to enter either of the figures, while statistics, mathematics, biology, computer science, medicine, economics, environmental studies, geography, engineering, and psychology were present (albeit not always in the same proportions). Hence, it appears that the analysis based on WOS is in alignment with the analysis based on Google Scholar.
9. Aim 2—Discussion
The search for publications with the VCM in methodological and non-methodological outlets in different domains has led to three major conclusions. First, and in accordance with the conclusion from the analysis for Aim 1, overall, the VCM has low acceptance as a method for studying statistical interactions. This conclusion is derived from Figure 6 which shows that ~33.8% of the original 9420 publications with the VCM are in outlets in statistics and mathematics, which are designed to present computational methods and not necessarily to implement them on collected data. A second conclusion is that research domains differ in their acceptance of the VCM as a tool for studying statistical interactions, and a third conclusion is that economics, environmental studies, and geography appear to stand out in their acceptance of the VCM.
One may ask whether the ratio of publications in methodological to non-methodological outlets in a research domain is a good index for the level of acceptance of a statistical method. The results for biology in Figure 7 may demonstrate why this index is, at least, a better index than an alternative index that may seem preferable. Suppose that one decides to sum the number of publications in biology in Figure 7, which is 320 (275 + 45). Next, suppose that it was possible to know the total number of publications in biology over the years and use it as a denominator while the nominator would be 320. This proportion (320/total number of publications in biology over the years) may seem like a natural candidate index for the acceptance of the VCM in biology.
However, it would fail to express that of the 320 publications in biology, 275 were in methodological outlets and, therefore, were probably not reports in which researchers implemented the VCM to extract insights from their data. In contrast, the ratio of methodological to non-methodological publications is an index that is based on the difference between presenting the VCM in a methodological outlet and implementing the VCM in an empirical investigation.
One may also suggest that the mapping of VCM publications across methodological and non-methodological outlets in various domains could have been more accurate if it had been conducted in WOS and/or in Scopus in addition to Google Scholar. This is a valid suggestion, particularly if considering that Figure 6 and Figure 7, while very similar to Figure 8, were not identical to it. However, since an exact mapping of VCM distributions across outlets and domains was not essential at this stage, it was possible to conduct an exploratory analysis. Future mappings of VCM publications, for the purpose of guiding the possible steps to increase its utilization (see Section 10 below), will be conducted using multiple databases.
10. General Discussion
Numerous papers have demonstrated that by using a varying coefficients model (VCM) researchers can unveil patterns of interactions between variables that could otherwise remain hidden if using a regression model with an interaction term (e.g., Dambon et al., 2021; Fan & Zhang, 1999, 2008; Park et al., 2015; Sperlich & Theler, 2015). Nevertheless, the current paper showed that the VCM is far less implemented by researchers for studying interactions between variables in datasets than a regression model with an interaction term. Furthermore, there are many research domains in which the VCM is more often presented in methodological journals than implemented in empirical investigations. These trends represent a significant concern that necessitates further scrutiny of their possible underlying reasons and potential remedies.
- What could be the reasons for the underutilization of the VCM in research?
It is difficult to be certain about the reasons why the VCM is underutilized in empirical investigations. However, possible answers to this question can potentially be found within previous discussions on ignoring statistical methods and best practices in data analysis and reporting in general—a problem that is not new to the academic community and has been illuminated and discussed by several academics (e.g., Erceg-Hurn & Mirosevich, 2008; Griffith, 2014; Krueger & Lewis-Beck, 2007; Sharpe, 2013; Wilcox, 1998).
Sharpe (2013), in his paper on resisting statistical innovations in psychological research, has summarized the reasons proposed by academics and offered additional reasons for ignoring statistical innovations. The reasons that were put forth were being unaware of statistical innovations, journal editors that do not insist on implementing statistical innovations in empirical reports, pressures to publish (or otherwise perish), faculty teachers that are not trained in statistics, fear of changing standard practices, lacking user-friendly software for more sophisticated statistical analyses, and poor communication of statistical innovations.
These reasons appear ubiquitous across domains (e.g., pressures to publish, fear of changing standard practices) and are relevant to the underutilization of the VCM, as they are relevant to failures to implement statistical innovations in general. Consequently, most of them need not be reintroduced here. However, in view of facilitating the implementation of the VCM, two points should be addressed in its specific context as follows:
- The availability (or lack thereof) of user-friendly software for running the VCM;
- Communicating the VCM to researchers and research students.
- Availability of user-friendly software for implementing the VCM
Muenchen (2012) reported that R 2.15.2, Stata 12.1, SAS 9.3, and SPSS 21 (in this order) were the four most discussed data analysis software programs on the web at the end of 2012. Of these four software programs, R has the most robust packages for running the VCM in terms of the flexibility of the model assumptions (e.g., single or multiple coefficient modifiers that can be correlated or uncorrelated) and the range of smoothing algorithms for the coefficients’ functions (e.g., B- or P-splines of different orders) (see Sperlich & Theler, 2015, for packages and implementations). Stata and SAS provide a less flexible option that supports a VCM with a single coefficient modifier (see Rios-Avila, 2020, for package and implementation in Stata and Li et al., 2015, for package and implementation in SAS). Finally, SPSS allows for computing time-varying coefficients in survival analyses (Klein et al., 2014).
It is only on SPSS that users can run the VCM by pointing and clicking on a graphical user interface (GUI), and as mentioned above, it is only a limited version of the model (within survival analysis) that is supported. All other software programs require command line interactions for running the VCM, which generally demand a higher level of technological expertise than GUI-based interactions (Ajayi et al., 2010; Feizi & Wong, 2012).
It is, therefore, possible that part of the hindrance to wider utilization of the VCM in empirical studies is the lack of user-friendly software for running it. If this is indeed the case, then part of the solution might be expanding the GUI options of SPSS, SAS, and Stata to include the implementation of VCM models. At the same time, note that while user-friendly software applications could facilitate the adoption of the VCM, its current wider utilization in several research domains (see Figure 7) suggests that usability limitations are not the only barrier to its wider utilization.
- Communicating the VCM to researchers and research students
Sharpe (2013) observed that in psychological research, some methods, like power analysis, did not gain wide acceptance at that time, while other methods, like structural equation modeling and meta-analysis, overcame initial resistance to become widely used. This observation resonates with the broader usage of the VCM in economics, environmental studies, geography, and medicine (see Figure 7), suggesting that if researchers realize the necessity of statistical methods in their field, they are likely to adopt them despite obstacles.
Economics, environmental studies, and geography are domains in which the studied phenomena depend strongly on space and time (Bernstein & Kemp, 2020; Huang et al., 2023; Xu et al., 2023). Similarly, in medicine, the other research domain with relatively higher adoption of the VCM according to Figure 7, 70 of the 122 papers were found in Epidemiology (see the notes below the figure)—a field in which phenomena are often studied across space and time (e.g., Kulldorff, 1999; Moore & Carpenter, 1999). Finally, of the 167 publications in medicine in WOS (see Figure 8), 69 were in public, environmental, and occupational health—another field in which phenomena depend on location (space) (e.g., Elliott & Wartenberg, 2004; Miranda & Edwards, 2011).
Hence, researchers in these domains are more likely to recognize the value of a tool like the VCM, which provides more accurate descriptions of how the effects of variables vary as a function of other continuous variables (e.g., space and time).
This proposed link between recognizing the necessity of a statistical tool and using it underscores the need to improve how the VCM is communicated to researchers in various domains. To illustrate, the ratio of methodological to empirical papers with the VCM in biology, agriculture, psychology, and computing (see Figure 7) indicates that while methodologists recognize the value of the VCM to their research domains, substantive researchers do not. Another, and perhaps an even stronger illustration is that of the 76 publications in the social sciences in WOS (see Figure 8), 73 were from the more specific category “Social Sciences Mathematical Methods”. These patterns point to a communication gap between methodologists and substantive researchers regarding the value of the VCM in these domains.
Sharpe (2013) suggested several ways to bridge the communication gap between methodologists and substantive researchers in psychology. Two of these will be discussed here in the context of the VCM, although readers are also encouraged to explore the concept of a Maven that the author developed.
First, considering the mathematical complexity of the methodological papers on the VCM, methodologists should publish introductory papers in designated “teacher’s corners” of methodological journals or publish such papers in journals for empirical investigations. The papers should focus on case examples according to the journals’ scope (e.g., transportation) and on showing the steps for performing the analyses on a statistical software program. Such papers can also contribute to domains in which even methodological papers on the VCM remain scarce. For example, in physics, the VCM can hold value in certain cases (e.g., Brabec et al., 2021; Lv et al., 2012) despite the predominant reliance on differential equations in this field (Arnold, 1992; Logan, 2013).
Second, and again, in consideration of the mathematical complexity of the VCM, better ways should be developed for teaching this model in classrooms. Notably, such changes may require a shift in perception of the VCM, as will be elaborated below.
- Teaching the VCM as a fundamental expression of statistical interaction
A quick web search for syllabi of multiple regression courses would yield an abundance of results of graduate and undergraduate courses from a variety of academic institutions and departments. In these courses, statistical interactions are typically modeled using a regression model with an interaction term (e.g., Williams, 2017; UCSF, n.d.; Boston College, 2015), as shown in Equations (1) and (2) in Section 2.
The VCM, on the other hand, while being an expression of statistical interaction, is also a form of a Generalized Additive Model (GAM) (e.g., Hastie & Tibshirani, 1993; Park et al., 2015). Such modeling involves more complex computational procedures, like using splines and knots for generating smooth curves (Hastie & Tibshirani, 1993; Park et al., 2015; Sperlich & Theler, 2015), and consequently, syllabi on GAMs are found in more specific academic departments, like earth and environment and statistics (e.g., Dietze, 2022; Mackey, 2022).
However, considering the availability of statistical software programs, it is argued here that the mathematical complexity of the VCM should not be an obstacle to introducing it to courses on multiple regression. Initially, in departments in which students are using R, Stata, or SAS, and possibly, in the future, in departments in which students are using SPSS (see the discussion on software programs above), teachers in these courses can instruct students on the main theoretical considerations when running a VCM, like choosing the number of knot points for the curves (Hastie & Tibshirani, 1993; Park et al., 2015), and how to extract valuable insights from the analysis output. This is not very different from learning the main considerations in running a regression analysis and interpreting its output, without necessarily being able to compute it by hand, which is arguably often the case.
Furthermore, in some cases, one can represent varying coefficients graphically, like in Figure 1 in Section 2, without using sophisticated tools. This can be performed by running a standard regression model with a single predicting variable multiple times, each time on a different segment of the dataset, defined by different values (or range of values) of a second predicting variable. This procedure would yield multiple regression outputs with different coefficient values that can then be plotted, like in Figure 1. This procedure can be used both for demonstrating the concept of VCM and as a tool for testing if using a VCM might reveal patterns in the data that may not be revealed otherwise.
Some might still object to introducing the VCM to multiple regression courses, suggesting that it is less intuitive than the more standard expression of statistical interaction. This is because the standard expression contains an explicit interaction term while the VCM does not. However, a comparison between Equations (2) and (3) in Section 2 reveals that the VCM (Equation (3)) is the more parsimonious expression, exactly because it does not include an extra coefficient for an interaction term (see the extra in Equation (2)).
In addition, while both the VCM and the regression model with an interaction term express the formal definition of an interaction, it appears that the VCM can be translated more readily into a shorter and more intuitive version of this definition. The formal definition is that an interaction between the variables in a response function is that “the difference in the value of as a result of changing the value of depends on the value of ” (Friedman & Popescu, 2008).
A shorter version of this definition might be that an interaction between the variables in a response function is that the “relationship between the value of and the value of depends on the value of ”. This shorter definition is readily expressed in the VCM by varying the coefficient of (i.e., ) as a function of (see Equation (3)). Hence, it appears that the VCM is not only a powerful tool for analyzing statistical interactions but also an intuitive way of expressing what they are—an expression that should be taught when introducing interactions to students, rather than being reserved for specialized courses.
11. Conclusions
There is a gap between the high acclaim of the VCM in the statistical literature and its low utilization rate in practice. This gap should be of concern to the research community. Steps for facilitating the utilization of the VCM include developing user-friendly software programs for running it, encouraging methodologists to write accessible introductory papers, and teaching the VCM as a fundamental expression of statistical interaction.
Funding
The APC was funded by Ariel University.
Data Availability Statement
Data are contained within the article.
Conflicts of Interest
The authors declare no conflict of interest.
References
- Ahmad, P., Alam, M. K., Jakubovics, N. S., Schwendicke, F., & Asif, J. A. (2019). 100 years of the Journal of Dental Research: A bibliometric analysis. Journal of Dental Research, 98(13), 1425–1436. [Google Scholar] [CrossRef] [PubMed]
- Ajayi, A., Olajubu, E. A., Ninan, D. F., Akinboro, S. A., & Soriyan, H. A. (2010). Development and testing of a graphical FORTRAN learning tool for novice programmers. Interdisciplinary Journal of Information, Knowledge, and Management, 5, 277. [Google Scholar] [CrossRef][Green Version]
- Arnold, V. I. (1992). Ordinary differential equations. Springer Science & Business Media. [Google Scholar]
- Bernstein, J., & Kemp, K. (2020). The role of spatial science in environmental case studies: A special collection from the University of Southern California. Case Studies in the Environment, 4(1), 1–8. [Google Scholar] [CrossRef]
- Boston College. (2015). Multiple regression: Interaction terms [lecture slides]. Boston College. Available online: http://fmwww.bc.edu/EC-C/S2015/2228/ECON2228_2014_6.slides.pdf (accessed on 10 March 2025).
- Botzer, A., Musicant, O., & Mama, Y. (2019). Relationship between hazard-perception-test scores and proportion of hard-braking events during on-road driving—An investigation using a range of thresholds for hard-braking. Accident Analysis & Prevention, 132, 105267. [Google Scholar]
- Brabec, M., Craciun, A., & Dumitrescu, A. (2021). Hybrid numerical models for wind speed forecasting. Journal of Atmospheric and Solar-Terrestrial Physics, 220, 105669. [Google Scholar]
- Dambon, J. A., Sigrist, F., & Furrer, R. (2021). Maximum likelihood estimation of spatially varying coefficient models for large data with an application to real estate price prediction. Spatial Statistics, 41, 100470. [Google Scholar]
- Dietze, M. (2022). Generalized Additive Models (GAMs). Boston University. Available online: https://people.bu.edu/dietze/Bayes2022/gams.html#1 (accessed on 10 March 2025).
- ElHawary, H., Salimi, A., Diab, N., & Smith, L. (2020). Bibliometric analysis of early COVID-19 research: The top 50 cited papers. Infectious Diseases: Research and Treatment, 13, 1178633720962935. [Google Scholar]
- Elliott, P., & Wartenberg, D. (2004). Spatial epidemiology: Current approaches and future challenges. Environmental Health Perspectives, 112(9), 998–1006. [Google Scholar]
- Erceg-Hurn, D. M., & Mirosevich, V. M. (2008). Modern robust statistical methods: An easy way to maximize the accuracy and power of your research. American Psychologist, 63, 591–601. [Google Scholar] [CrossRef]
- Fan, J., & Zhang, W. (1999). Statistical estimation in varying coefficient models. The Annals of Statistics, 27(5), 1491–1518. [Google Scholar]
- Fan, J., & Zhang, W. (2008). Statistical methods with varying coefficient models. Statistics and Its Interface, 1(1), 179–195. [Google Scholar] [CrossRef] [PubMed]
- Feizi, A., & Wong, C. Y. (2012, June 12–14). Usability of user interface styles for learning a graphical software application. 2012 International Conference on Computer & Information Science (ICCIS) (Vol. 2, pp. 1089–1094), Kuala Lumpur, Malaysia. [Google Scholar]
- Fernandes, G. V. O., & Fernandes, J. C. H. (2024). GFsa (GF “Scientific Age”) index application for assessment of 1020 highly cited researchers in dentistry: A pilot study comparing GFsa index and H-index. Publications, 12(2), 18. [Google Scholar] [CrossRef]
- Friedman, J. H., & Popescu, B. E. (2008). Predictive learning via rule ensembles. The Annals of Applies Statistics, 2(3), 916–954. [Google Scholar] [CrossRef]
- Gadd, E., Morrison, C., & Secker, J. (2019). The impact of open access on teaching—How far have we come? Publications, 7(3), 56. [Google Scholar] [CrossRef]
- Griffith, D. A. (2014). Reflections on the current state of spatial statistics education in the United States: 2014. Geo-Spatial Information Science, 17(4), 229–235. [Google Scholar] [CrossRef]
- Hastie, T., & Tibshirani, R. (1986). Generalized additive models. Statistical Science, 1(3), 297–310. [Google Scholar]
- Hastie, T., & Tibshirani, R. (1993). Varying-coefficient models. Journal of the Royal Statistical Society Series B: Statistical Methodology, 55(4), 757–779. [Google Scholar] [CrossRef]
- Holton, E. F., III, Bates, R. A., Bookter, A. I., & Yamkovenko, V. B. (2007). Convergent and divergent validity of the learning transfer system inventory. Human Resource Development Quarterly, 18(3), 385–419. [Google Scholar] [CrossRef]
- Huang, J., Li, Q., Du, M., & Chen, X. (2023). Spatial and temporal variation of economic resilience and its drivers: Evidence from Chinese cities. Frontiers in Environmental Science, 11, 1109857. [Google Scholar] [CrossRef]
- Klein, J. P., Van Houwelingen, H. C., Ibrahim, J. G., & Scheike, T. H. (Eds.). (2014). Handbook of survival analysis. CRC Press. [Google Scholar]
- Krueger, J. S., & Lewis-Beck, M. S. (2007). Goodness-of-fit: R-squared, SEE and ‘best practice’. The Political Methodologist, 15(1), 2–4. [Google Scholar]
- Kulldorff, M. (1999). Geographic information systems (GIS) and community health: Some statistical issues. Journal of Public Health Management and Practice, 5(2), 100–106. [Google Scholar] [CrossRef] [PubMed]
- Li, R., Dziak, J. J., Tan, X., Huang, L., Wagner, A. T., & Yang, J. (2015). TVEM (time-varying effect modeling) SAS macro users’ guide. The Methodology Center, Penn State. [Google Scholar]
- Logan, J. D. (2013). Applied mathematics. John Wiley & Sons. [Google Scholar]
- Lopez-Cozar, E. D., Orduna-Malea, E., Martin-Martín, A., & Ayllon, J. M. (2017). Google Scholar: The big data bibliographic tool. In Research analytics (pp. 59–80). Auerbach Publications. [Google Scholar]
- Lou, Y., Caruana, R., Gehrke, J., & Hooker, G. (2013, August 11–14). Accurate intelligible models with pairwise interactions. 19th ACM SIGKDD International Conference on Knowledge Discovery and Data Mining (pp. 623–631), Chicago, IL, USA. [Google Scholar]
- Lv, S., Wei, J., & Zhang, G. (2012). Estimation on generalized semi-varying coefficient models. Physics Procedia, 33, 949–953. [Google Scholar]
- Mackey, L. (2022). Lecture 18: Generalized additive models. Stanford University. Available online: https://web.stanford.edu/~lmackey/stats202/content/lec18-condensed.pdf (accessed on 10 March 2025).
- Miranda, M. L., & Edwards, S. E. (2011). Use of spatial analysis to support environmental health research and practice. North Carolina Medical Journal, 72(2), 132. [Google Scholar] [CrossRef] [PubMed]
- Moore, D. A., & Carpenter, T. E. (1999). Spatial analytical methods and geographic information systems: Use in health research and epidemiology. Epidemiologic Reviews, 21(2), 143–161. [Google Scholar] [CrossRef]
- Muenchen, R. A. (2012). The popularity of data analysis software. Available online: http://r4stats.com/popularity (accessed on 4 March 2025).
- Nason, M., Emerson, S., & LeBlanc, M. (2004). CARTscans: A tool for visualizing complex models. Journal of Computational and Graphical Statistics, 13(4), 807–825. [Google Scholar] [CrossRef]
- Park, B. U., Mammen, E., Lee, Y. K., & Lee, E. R. (2015). Varying coefficient regression models: A review and new developments. International Statistical Review, 83(1), 36–64. [Google Scholar] [CrossRef]
- Rios-Avila, F. (2020). Smooth varying-coefficient models in Stata. The Stata Journal, 20(3), 647–679. [Google Scholar] [CrossRef]
- Sharpe, D. (2013). Why the resistance to statistical innovations? Bridging the communication gap. Psychological Methods, 18(4), 572–582. [Google Scholar] [CrossRef]
- Sorokina, D., Caruana, R., Riedewald, M., & Fink, D. (2008, July 5–9). Detecting statistical interactions with additive groves of trees. 25th International Conference on Machine Learning (pp. 1000–1007), Helsinki, Finland. [Google Scholar]
- Sperlich, S., & Theler, R. (2015). Modeling heterogeneity: A praise for varying-coefficient models in causal analysis. Computational Statistics, 30, 693–718. [Google Scholar] [CrossRef]
- Strandberg, C., Nath, A., Hemmatdar, H., & Jahwash, M. (2018). Tourism research in the new millennium: A bibliometric review of literature in tourism and hospitality research. Tourism and Hospitality Research, 18(3), 269–285. [Google Scholar] [CrossRef]
- UCSF. (n.d.). Multiple regression: Interactions [lecture slides]. University of California. Available online: https://courses.ucsf.edu/pluginfile.php/811266/mod_resource/content/1/lecture5.pdf (accessed on 10 March 2025).
- Wilcox, R. R. (1998). How many discoveries have been lost by ignoring modern statistical methods? American Psychologist, 53, 300–314. [Google Scholar] [CrossRef]
- Williams, R. (2017). Interaction terms in regression [lecture notes]. University of Notre Dame. Available online: https://www3.nd.edu/~rwilliam/stats2/l53.pdf (accessed on 10 March 2025).
- Xu, M., Chen, C., Lin, S., & Shen, D. (2023). Research on the spatial-temporal variation of resources and environmental carrying capacity and the impact of supply-side reform on them: Evidence from provincial-level data in China. Land, 12, 1584. [Google Scholar] [CrossRef]
- Zupic, I., & Cater, T. (2015). Bibliometric methods in management and organization. Organizational Research Methods, 18(3), 429–472. [Google Scholar]
Disclaimer/Publisher’s Note: The statements, opinions and data contained in all publications are solely those of the individual author(s) and contributor(s) and not of MDPI and/or the editor(s). MDPI and/or the editor(s) disclaim responsibility for any injury to people or property resulting from any ideas, methods, instructions or products referred to in the content. |
© 2025 by the author. Licensee MDPI, Basel, Switzerland. This article is an open access article distributed under the terms and conditions of the Creative Commons Attribution (CC BY) license (https://creativecommons.org/licenses/by/4.0/).

