Abstract
We are living in an era where the demand for Open Access to knowledge is growing and the need for transparency in scientific publishing is becoming imperative. The question that arises at this stage is whether openness in knowledge constitutes the Achilles heel of the once profitable legacy publishing industry or whether it is the Trojan horse of the latter for increasing its revenues. At the same time, the question of whether Open Access publishers can ensure their sustainability through this model remains unanswered. This study implements a multi-year analysis (2019–2023) comparing the performance of Open Access and legacy publishers. Using a set of financial ratios—grouped by profitability, liquidity, efficiency, and solvency, as well as data on firm size (revenues, assets, and employee counts), we assess their financial performance. The results indicate that legacy publishers have enormous scale, stable profitability, and high leverage, but low liquidity and return on equity. On the other hand, OA publishers, although smaller, have higher returns, better liquidity, and almost zero borrowing, but with greater annual volatility. The study discusses that OA publishers, despite their small size, can be as profitable as or even more profitable than traditional publishers, thanks to flexible structures and fast cash flows, but remain vulnerable due to limited resources and the risk of acquisition. Furthermore, legacy publishers maintain their dominance by leveraging their scale, strong brands, and investment capacity while adopting or acquiring OA models, creating a competitive environment where scale and strategic differentiation are decisive.
1. Introduction
There is ongoing debate over whether academic publishers are independent or whether they control scientific progress by affecting what and who is published or not (Padmalochanan, 2019). Publishers are not neutral intermediaries. Hanson et al. (2024) argue that they are structural lobbyists with considerable power and often operate with profit motives that are not necessarily aligned with the interests of science. In the digital world, publishers are shifting identities, becoming platforms that mediate the complete circle of interactions between scholars, institutions, libraries, and companies on one side and information assets on the other. This, then, gives them the strategic advantage of regulating a two-sided market (Filistrucchi et al., 2014), where different stakeholders use their services with increasing intensity. This increase in intensity is not only reflected in the pure volume of publications but also in the volume of services that are built by third parties, such as ranking systems. According to Ma (2023), the platformization in scholarly communication has two main features: “one is the datafication and the commodification of user contents (scholarly publications) and personal data, and the other is the loss of negotiating powers in creating standards, values and norms of knowledge production”. The high rates of profit emerge from the fact that the publishers who mediate become—through contractual agreements at the time of publishing—the owners of the goods that one of the markets produces. Given the fact that scholarly communication production and consumption are performed by the same actors, who are not compensated for this, these multi-sided markets are tangibly profitable for the intermediaries alone. Authors and their institutions receive only symbolic rewards that are artificially sustained by competition.
Publishers are exploiting technological advancements faster and more efficiently than libraries, thus displacing libraries from their institutional role as gateways to knowledge (Odlyzko, 2015). Conley and Wooders answered their own question to the publishers in the late 2000s (Conley & Wooders, 2009) when electronic publishing flourished: “What have you done for us lately? We think the answer has to be ‘Not much.’” The existing oligopolistic market structure was causing ethical deviations, which needed some kind of intervention or shift in the way the system operated (Zarif, 2023). By calibrating access to information, the publishers have controlled the indirect network effects (spread of knowledge) between readers and authors, thus mitigating the improvements that science can bring to all aspects of social life, not just itself. The rise in the Open Access (OA) movement was the result of an attempt to break this oligopoly of academic publishing and stop the commodification of knowledge as a public good (Puehringer et al., 2021). The introduction of new players—new publishers—into the main stage of academic publishing seems to have brought about some change, but not the desired one (Rodrigues et al., 2020). OA publishing has been plagued by research integrity phenomena, such as predatory publishing and journal snatching (Singh Chawla, 2025). Additionally, as Booth et al. (2023) mention, “the open access model presents an equity paradox; while it liberates scientific knowledge for the consumer, it presents barriers to those who produce research”. According to Eger and Scheufen (2021), equity among researchers can be ensured through waivers of article processing charges (APCs), the promotion of Green OA, and institutional safeguards for secondary publication rights.
One would reasonably expect that the expenditure of money for the dissemination of knowledge would be reduced, and publishers would be affected financially by this shift. However, the publishing industry, though, has adapted to the new reality by transferring the costs from subscribers who wish to have access to the authors who wish to publish, shifting the flow of money from the consumer of knowledge to its producer. Nevertheless, there is a question that we should investigate in this new era. Has this “disruption” of the old publishing model affected the financial performance of its traditional players? Are there new servants of knowledge’s decommodification dogma, or are there just camouflaged publishers who ride the wave of openness? In this study, we examine and compare the financial performance of the two groups of publishers, namely legacy and OA publishers.
Ratios have been used to help evaluate companies’ financial condition since the beginning of the finance discipline (Lawder, 1989). Literature on financial statement analysis has discussed the use of ratio analysis as a fundamental tool for evaluating the financial health of a company, and many financial ratios have been developed and are used by practitioners and academicians. Moreover, accounting and finance textbooks typically emphasize the use of ratio analysis. However, and in spite of all the evidence that financial ratio analysis is, and has been, a widely used technique, there have been very few attempts to apply it in the academic publishing industry. Indeed, a survey of the literature revealed a handful of studies addressing the issue within the academic publishing industry context (Larivière et al., 2015; Shu & Larivière, 2024; Zarif, 2023). Knowing the financial characteristics across these four segments (profitability, liquidity, efficiency, and solvency ratios) would be helpful for those who like to understand the commonalities and differences between them. Financial ratio analysis is a useful analytical tool for this purpose. It can reveal the relative financial strengths and weaknesses of these segments and identify the potential investment opportunities for investors interested in this industry. This study provides an empirical comparison of the financial performance of OA publishers versus legacy publishers, i.e., traditional entities that originate from and partly maintain a subscription-based business model, over the five-year period of 2019–2023, focusing on financial ratios. By examining these four ratio categories, as well as firm size metrics (revenues, assets, and employees), we aim to illuminate how these two groups of publishing entities differ, not only in performance but also in scale and strategic positioning.
The motivation behind this comparison is twofold. First, as OA publishing continues to mature, there is growing interest in its economic sustainability and how its financial outcomes compare to the highly profitable traditional model (Larivière et al., 2015). Second, the strategic context is evolving. Large legacy publishers have been acquiring OA ventures and developing their own OA portfolios, raising questions about whether smaller OA-focused firms can remain independent or competitive in a consolidating industry. Understanding differences in financial health and scale can shed light on competitive advantages or vulnerabilities. We use a unique dataset of financial statements and ratios for a sample of major publishers to conduct this analysis. As Bobtcheff et al. (2023) indicate, economic theory can support the design of more equitable and efficient systems of scientific publishing, incorporating transparency, accountability, and incentives for quality. By applying econometric methods to such a field, we intend to shine a light on an ecosystem that is not transparent.
The paper is organized as follows. The Literature Review section examines prior studies on the economics of academic publishing and the rise in OA, highlighting known differences in business models and market structure. The Methodology section outlines the dataset, ratio measures, and grouping of firms into the OA and legacy categories. In the Results section, we present year-by-year comparisons of key financial ratios and multi-year average statistics for each group, alongside metrics of firm size. The Discussion section interprets these findings, examining the strategic implications of performance and scale disparities—particularly how the much smaller size of OA publishers may affect their competitive position and the likelihood of acquisitions by larger firms. Finally, the Conclusion section summarizes the insights and considers future outlooks for OA publishers in an industry still dominated by large incumbents.
2. Literature Review
2.1. Academic Publishing Oligopoly and Financial Performance
OA publishing emerged in the 2000s as an alternative model aimed at free dissemination of research. Pioneers such as BioMed Central—an OA publisher founded in 2000—and the Public Library of Science (PLOS), a non-profit launched in 2003, demonstrated the viability of making articles freely available online, funded by APCs or institutional subsidies (Copiello, 2020). Over time, several OA-focused publishers have successfully entered the market, despite the high barriers to entry that exist in oligopolistic environments. Barriers to entry, the factors that prevent new agents of competition from entering a market, are associated with the privileges of the existing economies of scale (McAfee et al., 2004) and prone to appear in multi-sided markets (Evans, 2002). MDPI (Multidisciplinary Digital Publishing Institute) and Frontiers are two prominent for-profit OA publishers that grew rapidly in the 2010s, leveraging efficient online platforms and fast publication processes. By 2019, MDPI had become the world’s largest publisher of purely OA journals by article output and notably has remained debt-free during its expansion, suggesting a conservative financial approach despite rapid growth. Similarly, Frontiers Media, founded in 2007 in Switzerland, expanded its portfolio of OA journals and attracted external investment. Like other OA competitors, Frontiers grew quickly (reportedly ~50% annual growth around 2020) and approached the scale of some mid-sized legacy publishers in output. Both companies, however, have faced questions about their editorial practices and the surge in article volumes. Another example, Hindawi (founded in 1997, fully OA since 2007), became one of the largest OA publishers by the 2010s and achieved steady profitability that led to its acquisition by Wiley in 2021 for USD 298 million. Early analyses questioned the sustainability of the OA model, noting that while it eliminates subscription revenue, it must cover costs through APCs, grants, or other means (Solomon & Björk, 2012). The phenomenon of “double dipping” expanded the legacy publishers’ existing profit margin (Pinfield et al., 2017). Publishers that carry their operation from a paper-based world have retained multi-sided market business models that allow them to secure multiple sources of profit, such as revenues from library subscriptions for accessing journals and individual or institutional APCs for publishing in journals. To further mitigate the effects of heterogeneous demands, legacy publishers carry market models that bundle information assets, while they keep an agile portfolio of services to control external factors.
The advent of digital technologies and increased connectivity has given rise to new markets that are dynamic, minimally costly, and profitable. In the context of the digital economy, it is not unusual that “the average net revenue per user increases with the total number of users because of the existence of demand-driven network effects” (Jullien & Sand-Zantman, 2021). The principle of “publish or perish” has served as a powerful driver of demand in academic publishing. Therefore, the expansion of the OA market and the magnitude of its network effect motivate publishers to engage with it. To illustrate this, we collected data from Scilit, a publishing industry data aggregator maintained by MDPI, to produce the entities of our sample in the last ten years. Figure 1 indicates that there is a steady growth of OA publications and journals, especially post-COVID. Despite the growth in the number of publications, the number of OA journals remains steady and proportional to the number of journals in the overall portfolio (27%). The share of OA journals, published by both legacy and OA publishers, increased from 3% to 5%, driven mainly by the development of a stronger catalog of titles by OA publishers. The number of OA publications has increased from 24% to 46% in the context of an observed increase of 59.5% of publications from 2015 to 2024. These trends indicate that legacy publishers still anchor on the subscription model, following tactics of modest—and in some cases reversible—transformation.
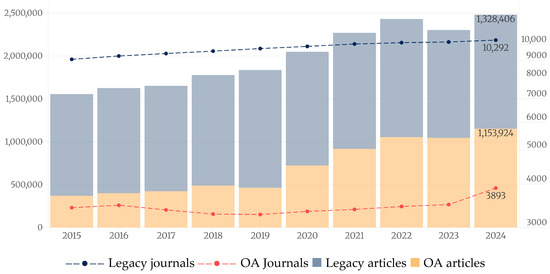
Figure 1.
Annual production of sample publishers in terms of journals and articles in the years 2015–2024. Data from Scilit.
Numerous studies have documented the concentration of the academic publishing market and the extraordinary profitability of the leading legacy publishers. Larivière et al. (2015) found that through mergers and acquisitions, five of the top publishers grew their share of research articles from 20% in 1973 to approximately 50% by 2006. These major firms—including Elsevier (RELX), Wiley, Springer (now SpringerNature), Taylor & Francis (Informa), and Sage—leverage economies of scale, extensive journal portfolios, and Big Deal subscription bundles to maintain market power. Profit margins for these companies have been reported in the range of 30–40%, rivaling or exceeding those of big tech companies. The high profitability and cash flow of legacy publishers have also enabled them to invest in emerging technologies and to acquire smaller companies, reinforcing their dominant positions. At the same time, comparative studies of network effects in free goods markets show that “increased demand in a complementary premium goods market more than covers the cost of investment in the free-goods market.” (Parker & Van Alstyne, 2010). Reading in OA is free, but publishing is not, and complementarity comes in the form of author benefits.
Such an oligopoly also seems to exist in OA publishing. Four major commercial publishers (Springer, PLOS, MDPI, and Hindawi) owned 63% of the journals with the now-defunct DOAJ Seal and published almost 65% of the articles. For example, PLOS ONE alone publishes more articles than all the small publishers combined (Rodrigues et al., 2020). This phenomenon indicates that the oligopoly in OA is driven by the high concentration of control and revenue in the large commercial publishers, who use business strategies of dominance, reproducing the inequalities of the legacy publishing market rather than reducing them. According to Kim and Atteraya (2023), large publishers (100+ journals) produced 31.4% of OA articles in 2021, compared to 19.8% in 2011 (Grossmann & Brembs, 2021). This oligopolistic market structure affects the APCs of major publishers, such as SpringerNature (Asai, 2023; Budzinski et al., 2020), as they have more power to set elevated prices without competitive pressures. The demand for openness in scientific results from the authors themselves, aiming at higher rates of visibility, social recognition, and access to research funds, also works positively in terms of increasing APC prices (Yoh et al., 2025). The actual technical cost of publishing an article (writing, pagination, hosting, DOI, metadata, etc.) ranges from about USD 200–600, while many large publishers charge USD 2000–USD 4000+ per article, i.e., up to 10 times the cost (Asai, 2023; Borrego, 2023; Morrison et al., 2022; Solomon & Björk, 2012). The OA model seems to lead to greater concentration of power, as the symbolic rewards (prestige), technological prowess, and customer support offered by the large publishers make them attractive to authors. This dynamic reduces the effective selectivity among journal options, which could be seen as a restriction of academic freedom or, in two-sided market economics, as “multihoming”, the ability of a consumer to select any of the publication venues. This also gives them the strategic advantage over their competitors, since “competition is more intense when platforms cannot deter multihoming” (Rochet & Tirole, 2003). Overall, the OA publishing market remains imbalanced, with large commercial publishers strengthening their position, limiting the ability of smaller publishers to compete.
2.2. Differences in Business Models and Financial Structure
Legacy publishers primarily rely on subscription revenues (often multi-year library contracts) and enjoy a steady cash flow, whereas OA publishers depend heavily on APCs and other fees, which can be more variable and directly tied to article volume (Frank et al., 2023; Shu & Larivière, 2024). This fundamental difference impacts their financial performance. For instance, legacy publishers historically have high operating margins and return on equity, partly because they incur relatively low marginal costs per article and can leverage existing content with paywalls. However, OA publishers—particularly those that are non-profit, such as PLOS and eLife—may not seek profit maximization; PLOS, for example, reinvests any surplus in its mission and has at times operated at a loss or modest surplus. Indeed, a Scholarly Kitchen analysis by Petrou (2020) noted that despite dramatic growth in output, MDPI’s strategy kept its profit margin “thin” by design, prioritizing expansion over short-term profit. This indicates that some OA publishers measure success in terms of growth and market share (or mission fulfillment), rather than profitability alone. Moreover, OA publishers often operate with a leaner asset base—they may not own extensive office real estate or large staff relative to revenue, and they invest heavily in digital platforms. This might result in high asset turnover ratios and low fixed assets on the balance sheet. Conversely, large legacy publishers, through years of acquisitions, have accumulated significant assets (including acquired goodwill, publishing platforms, and extensive staff and offices worldwide). They may also carry more debt; for example, RELX and Wiley have used debt financing for acquisitions, affecting leverage ratios.
2.3. Market Competition and Consolidation
The competitive landscape is influenced by the scale differences. Large publishers benefit from enormous scale in terms of revenue and thousands of employees. The data in this study underline the fact that RELX Group PLC (parent of Elsevier) had the highest revenue, with more than USD 10+ billion in 2023, with Wolters Kluwer NV being second with more than USD 5.7 billion in revenue in 2023. Publishers also bundle both subscription and OA offerings (like hybrid journals or OA options) to maintain revenue streams. According to Pinfield et al. (2017) APCs are not a substitute for subscriptions; instead, they add to the total cost. Elsevier and Wiley derive most of their revenue from hybrid OA, while the others (SpringerNature, Taylor & Francis, Sage) focus mainly on Gold OA (Butler et al., 2023). This phenomenon creates a very lucrative market that publishers tend to exploit.
The strategic implications of scale are evident in recent industry moves: large publishers can acquire emerging OA players; see the acquisitions of Hindawi, Biomed Central, and F1000 by Wiley, Springer Nature, and Taylor & Francis, respectively, to quickly expand their OA portfolios. Such acquisitions are often motivated by the larger firm’s resources to accelerate growth and cross-selling services. SPARC’s market analysis (Crow, 2009) observed a “steady stream of consolidations” in academic publishing, highlighting that major transactions, such as Wiley-Hindawi and Springer-Atlantis Press, occurred in rapid succession. According to reports, Hindawi’s revenue in 2020 was about USD 40 million, indicating that Wiley paid a valuation of roughly 7.5 times revenue to integrate this OA publisher. That acquisition underscores how large conventional firms perceive OA publishers as strategically valuable, not only for their journal portfolios, but also for their efficient platforms and lower-cost infrastructure. This trend raises concerns that the burgeoning OA sector could become dominated by the same legacy giants, a phenomenon dubbed the “oligopoly’s shift to OA” (Piwowar et al., 2018). On the other hand, smaller independent OA publishers face challenges in competing with the marketing, infrastructure, and Big Deal negotiating power of larger companies. Their smaller scale could limit their ability to secure large contracts or invest in innovative technologies (e.g., AI-driven manuscript screening) at the same pace. Non-profit OA publishers additionally may rely on grant funding or philanthropy (e.g., eLife is backed by research funders), which can constrain their growth if such funding is limited.
3. Research Setting
3.1. Research Hypotheses
The transition from subscription-based to OA publishing has fundamentally altered the economic structure and financial incentives within the scholarly communication ecosystem. Prior research has suggested that legacy academic publishers operate with substantial profit margins, high leverage, and extensive fixed assets, benefiting from scale economies and subscription lock-ins (Björk, 2012; Larivière et al., 2015). In contrast, OA publishers -particularly those that are mission-driven or digitally native- are thought to operate with leaner infrastructures, lower leverage, and greater variability in financial performance due to their reliance on article processing charges (Petrou, 2020; Solomon & Björk, 2012). Given these structural differences, this study formulates a series of hypotheses aimed at empirically testing whether observable financial performance metrics diverge systematically between OA and legacy publishers.
- OA publishers do not exhibit financial profitability comparable to legacy publishers: Despite their smaller size, we hypothesize that OA publishers will not achieve levels of Return on Equity (ROE) and Return on Assets (ROA) similar to or exceeding those of legacy publishers. This reflects the expectation that lean digital operations and scalable APC-funded models can yield strong profitability ratios, albeit potentially with higher year-to-year volatility.
- OA publishers do not have the same levels of high liquidity in comparison with legacy publishers: We expect that OA publishers will have significantly lower current ratios, indicating weaker short-term liquidity, as they have fewer income sources and are smaller in size.
- OA publishers are not more operationally efficient than legacy publishers: We hypothesize that OA publishers will exhibit significantly higher net assets turnover ratios, reflecting a more efficient conversion of equity into revenue. We think that OA, with a smaller size and its non-traditional approach, will be able to perform better than legacy publishers.
3.2. Sample Selection
We assembled a sample of publishing companies consisting of two groups: OA-only publishers (OA publishers) and traditional subscription-originated publishers (legacy publishers). The OA group includes four significant publishers that operate predominantly or entirely on an OA model: Frontiers Media Ltd., PLOS, MDPI AG1, and eLife Sciences Publications Ltd. We only used financial data until 2020 from Hindawi Limited for the OA sample because it was acquired by Wiley in early 2021 and is no longer independent. The legacy group consists of seven major publishers: RELX Group PLC (parent of Elsevier), Wolters Kluwer NV, Informa PLC (parent of Taylor & Francis), SpringerNature AG & Co. KGaA, John Wiley & Sons, Inc. (Wiley), SAGE Publications, Inc., and Walter de Gruyter GmbH. These firms represent a mix of the largest multinational science/technical/medical publishers and a mid-size legacy academic publisher, see DeGruyter, providing a contrast in scale with the OA firms.
We acquired the data from the Orbis database by Moody’s, focusing on the most recent years, 2019–2023. Company selection was also influenced by the availability of data. All companies in the sample have calendar fiscal years; we examined the five-year period from 2019 through 2023. In cases where 2023 data were not available for a given company (e.g., some privately held firms had not yet released 2023 figures at the time of analysis), we treated those values as missing. No imputation was performed; comparisons for 2023 reflect only the companies with available data in that year.
We used key financial statement metrics, including operating revenue (turnover), profit before tax, total assets, current assets, current liabilities, long-term debt, and shareholders’ equity (often labeled shareholders’ funds or net assets). From these, a variety of financial ratios had been pre-calculated in the dataset, and we also computed a few additional metrics as needed. All monetary values were standardized in thousands of euros (EUR ’000) for comparability, converting from local currencies when necessary (the dataset provided figures in EUR for all firms). All time values are expressed in days.
3.3. Financial Ratio Measures
We analyzed a comprehensive set of financial ratios, grouped into four categories: profitability, liquidity, efficiency, and solvency. Table definitions are as follows:
- Profitability ratios: assess the firm’s ability to generate returns on investment (Dimitropoulos, 2020; Kohls & Mager, 2023). We used Return on Equity (ROE) and Return on Assets (ROA), both calculated using profit (or loss) before tax. ROE was defined as profit before tax divided by total equity (shareholders’ funds), and ROA as profit before tax divided by total assets. These ratios are expressed as percentages in the data. Higher values indicate greater returns on the capital or assets employed. We note that for non-profit organizations, these “returns” may not be a performance objective, but they are included in our study in order to enable the comparison of financial outcomes across all types of publishers.
- Liquidity ratio: We employed the current ratio (Magerakis et al., 2022; Serrasqueiro, 2017), defined as current assets divided by current liabilities. This measures short-term liquidity: a value above 1.0 indicates that current assets exceed current obligations, implying a comfortable liquidity position. This ratio is unitless (often expressed as a multiple). A higher current ratio can indicate more liquidity (but excessively high values might also indicate inefficient use of working capital).
- Efficiency ratios: We examined three metrics related to how efficiently the firms utilize assets and manage working capital (Goto et al., 2020; Ranasinghe, 2021). First, net assets turnover was given, calculated as operating revenue divided by net assets (total equity). This ratio (in times per year) shows how many euros of revenue are generated per euro of equity; it reflects asset utilization efficiency. We included the collection period, the average number of days the company takes to collect payments from customers (accounts receivable). This is an efficiency metric in working capital management; shorter collection periods are generally favorable as they indicate quicker conversion of receivables to cash. We also included the credit period, the average number of days the company takes to pay its suppliers (accounts payable outstanding). A longer credit period can indicate efficient use of supplier credit (or possibly strained liquidity if excessively long), while a shorter period means the company pays suppliers quickly.
- Solvency ratios: These assess long-term financial stability and leverage (Abbas & Nainggolan, 2023; Gkillas et al., 2018; Orman & Köksal, 2017). We used the gearing ratio, defined here as (Total Debt/Equity) × 100%, which indicates the degree of financial leverage (a value of 100% means debt equals equity). We also considered a related ratio provided in the data: solvency ratio (asset-based), defined as (Equity/Total Assets) × 100%. The asset-based solvency ratio essentially measures the equity portion of total assets (higher values indicate lower leverage).
In addition to financial ratios, we collected basic indicators of firm size and scale: annual operating revenue (turnover), Total Assets, and Number of Employees. These provide context on the absolute scale of operations of OA versus legacy publishers. These size metrics are crucial for interpreting the ratio results and understanding the strategic position of each firm. For example, differences in revenue scale might explain differences in efficiency ratios or strategy. We present these metrics to highlight how significantly the groups differ in magnitude.
We grouped the companies into two cohorts and computed descriptive statistics, specifically the mean and median, of each ratio for each and for all years by group. Given the small sample sizes and some missing data points in certain years, the mean can be sensitive to outliers, so the median is reported as a complementary robust measure of central tendency. It should be noted that some extreme values in the data (for example, a very high current ratio for one OA publisher in a particular year, or an anomalously high profit figure due to a one-time gain) can skew the group’s mean values. Where relevant, we point out such cases and rely on medians for a clearer indication of typical performance. We used Mann–Whitney test for mean ratio differences.
3.4. Limitations
This study is limited to a specific set of companies, which, while representative of major players, is not exhaustive. They represent publishing entities that serve the Gold and Hybrid ways of OA, and therefore, the plenitude of other OA journals, such as those provided by membership schemes or Diamond OA, are not considered. Some large legacy publishers, such as Taylor & Francis, which is included as part of Informa PLC, and some notable smaller OA publishers, such as Hindawi and F1000 Research, which were excluded due to acquisitions, are not separately analyzed. The data for privately held entities (e.g., eLife, Frontiers) are based on available filings and may have some gaps (for instance, eLife’s 2020 figures were partly missing). Also, for MDPI, we did not have the full financial data, and we had to make some assumptions (see footnotes 1 and 2). We assume the data are consistent and comparable; however, accounting practices, especially for things like recognition of revenue or treatment of debt, could vary and impact certain ratios. Despite these considerations, the analysis provides a robust descriptive comparison using actual financial outcomes.
4. Results
4.1. Overview of Firm Size
Before delving into financial ratios, we compare in Figure 2 the scale of OA publishers versus legacy publishers in terms of revenue, assets, and employees. The differences in the scale of financial indicators are dramatic. Perhaps the most striking disparities between the groups are in absolute size. Legacy academic publishers are orders of magnitude larger than their OA-native counterparts in revenue, assets, and manpower. Over 2019–2023, the average annual revenue of a legacy publisher in our sample was about EUR 3.44 billion (median ~EUR 2.0 billion), whereas for an OA publisher it was only about EUR 149 million (median ~EUR 50 million). In 2023, RELX, Elsevier’s parent company, alone earned over EUR 10.5 billion, while the largest fully OA publisher, Frontiers, had revenue on the order of EUR 58 million. Total assets show an even greater gulf: legacy publishers held ~EUR 6.9 billion in assets on average (with extensive journal portfolios, acquired imprints, and data platforms contributing to asset value), compared to roughly EUR 10 million in assets for the typical OA publisher. Employee counts likewise highlight scale differences: the leading legacy firms employ tens of thousands (median ~7800 staff), whereas OA publishers often have only a few hundred employees (e.g., Frontiers ~1000; MDPI ~66002; many OA publishers well under 200). These size asymmetries are profound, aligning with industry estimates that fully OA publishers still comprise only a small fraction of the market’s value (about 5–20% by revenue in recent years). The strategic positioning of each group is heavily influenced by these size differences. Large legacy publishers benefit from economies of scale, diversified portfolios, and financial clout. Their vast revenues and assets allow major investments in technology (e.g., analytics platforms, editorial systems) and content acquisition (through mergers and journal acquisitions). They can cross-subsidize new ventures or temporary loss-making initiatives with profits from core subscription businesses. Their workforce scale provides extensive in-house expertise (from marketing to legal) that smaller firms must outsource or do without. These advantages have enabled this group of publishers to adapt to the OA era by launching or acquiring OA outlets while still thriving in subscriptions. Such moves illustrate that they are able to use their capital strength to absorb successful OA players, integrating them into a hybrid strategy. The result is that established publishers now capture a growing share of the OA market (often via hybrid journals and APC-based imprints), blunting the competitive threat from independent OA publishers.
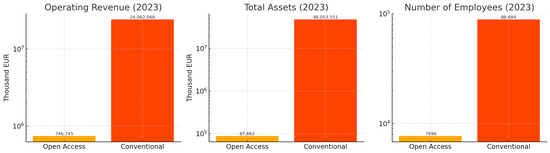
Figure 2.
Comparison of scale metrics (Operating Revenue, Total Assets, and Number of Employees) for OA vs. legacy publishers in 2023 (logarithmic scale)3.
The legacy publishers dwarf the OA group in all aspects; for instance, in 2023, the mean revenue for legacy publishers was about EUR 3.17 billion versus EUR 149 million for OA publishers, and legacy firms had ~12,669 employees versus ~2565 in the OA group. These scale differences have strategic implications discussed later, including the ability of large firms to leverage resources and potentially acquire smaller players.
OA publishers, in contrast, compete by being agile, innovative, and mission-focused. Their small size can be an advantage in specialized niches: they can experiment with new publishing models (platform-based peer review, preprint integration, etc.) more quickly and cater to author communities desiring rapid, free-access publication. With lean operations, OA publishers have lower overhead and can achieve higher revenue per employee. For example, the high net asset turnover and quick cash cycle of OA firms reflect a lean business model geared to volume and speed. Strategically, however, their modest financial resources limit them. They may struggle to invest in large-scale infrastructure or global sales networks, and economic shocks (like a sudden drop in submissions or APC funding, as seen post-COVID) can strain their finances more severely. Moreover, smaller OA publishers often find it hard to compete for high-profile content against the prestige and reach of big publishers, which is why many have pursued partnerships or sales to the big players. The data show that even with ~50% of research articles now published as OA, the OA-only publishers account for just ~20% of market revenues; the rest has been captured by the large incumbents pivoting to OA.
Despite their small size, the OA publishers did grow over the period. For instance, the aggregate revenue of the OA group roughly doubled from 2019 to 2022 in our data. This growth slightly closed the gap in percentage terms, but the legacy group also grew post-2020. Thus, legacy publishers remain two to three orders of magnitude larger in financial terms. These scale differences should be kept in mind when interpreting ratio comparisons; for instance, a small publisher can have extreme ratio values (high ROE or current ratio) that are unlikely for a very large firm.
In conclusion, OA and legacy publishers display distinct financial profiles that mirror their strategic roles in the industry. OA publishers are lean, efficient, and less leveraged, enabling rapid growth and innovation but with vulnerability due to their small scale. Legacy publishers are massively larger, leveraging debt and scale economies to dominate profitability and sustain competitive advantages, including absorbing OA models into their businesses. These differences in size and financial strength mean that legacy publishers generally set the competitive landscape, for instance, by bundling subscriptions with OA deals and wielding greater pricing power, while OA-focused firms must find strategic niches or align with bigger partners. The financial results support this narrative: despite OA publishers’ healthy profitability and efficiency, their sheer size disadvantage remains a critical factor in strategic positioning, keeping the scholarly publishing oligopoly largely intact even as OA grows.
In the following sections, we present detailed financial ratio comparisons, grouped by category. For each category, we provide data on the mean and median values for the OA versus the legacy group for each year from 2019 to 2023, as well as the five-year average. We also describe notable trends visible in the data.
4.2. Profitability
Table 1 reports the mean profitability ratios—ROE and ROA, before tax—as percentages for OA and legacy publishers from 2019 to 2023. PLOS and eLife are non-profit organizations; therefore, we excluded them from the profitability ratio calculations. Ours is limited to profitability ratios for OA publishers with three firms only. Several observations emerge.

Table 1.
Financial performance indicators for legacy and OA publishers in the years 2019–2023 (M: median, μ: mean).
Return on Equity (ROE): Figure 3 shows that legacy publishers maintained robust ROE performance across the 2019–2023 period, with a noticeable dip in 2020 followed by a consistent recovery. Their mean ROE was 31.66% in 2019, declined to 21.17% in 2020, and recovered to 28.89% in 2021 and 43.23% in 2022, settling at 32.91% in 2023. This trajectory reflects both the temporary disruption from the COVID-19 pandemic and the resilience of large incumbents. The 2020 dip corresponds with documented financial pressure across the industry; for instance, Informa posted a significant loss that year, resulting in negative equity returns. However, by 2022, firms such as RELX and Wolters Kluwer reported ROEs exceeding 50%, driving the group’s average upward.
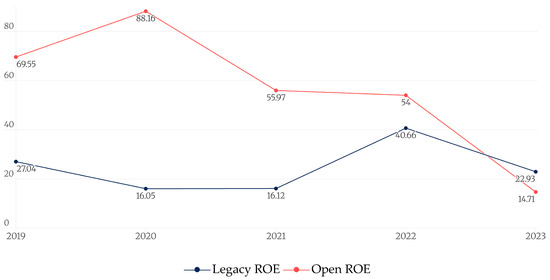
Figure 3.
Annual median values for the return on equity ratio for the two cohorts of publishers. Data from Orbis by Moody’s.
OA publishers displayed a more erratic ROE pattern. OA publishers exhibit very high ROE levels throughout 2020–2022 and a sharp contraction in 2023: 69.55% (2019), 88.16% (2020), 55.97% (2021), 54.00% (2022), and 14.71% (2023); the five-year average is 56.48%. This reflects the dual nature of OA publishing: while lean structures can yield exceptional returns, they are also susceptible to instability due to limited equity bases or funding variability. Due to the removal of PLOS and eLife, we have observations of three firms (unbalanced panel); thus, the mean and median values are the same.
Over the five-year period, the average mean ROE was 56.48% for OA publishers and 31.57% for legacy publishers. This indicates that OA publishers, particularly for-profit entities, were highly efficient in converting equity to returns despite greater year-to-year volatility.
In comparing ROE between the Legacy and Open Access groups, the Mann–Whitney U test yielded U = 183.00, p = 0.093 (exact p = 0.097), indicating no statistically significant difference at the 5% level. Although the result approaches the 10% threshold, it provides only marginal evidence of a difference in ROE distributions between the two groups.
Return on Assets (ROA): A similar trend is observed with ROA (Figure 4). The mean ROA for legacy publishers was 6.57% in 2019, 3.39% in 2020, and increased to 8.43% (2021), 12.76% (2022), and 8.36% (2023), reflecting modest but stable returns on large and diversified asset bases. These values are consistent with asset-intensive business models, where investments in infrastructure, acquisitions, and intangible assets (e.g., goodwill, IP) suppress percentage returns despite high absolute profits.
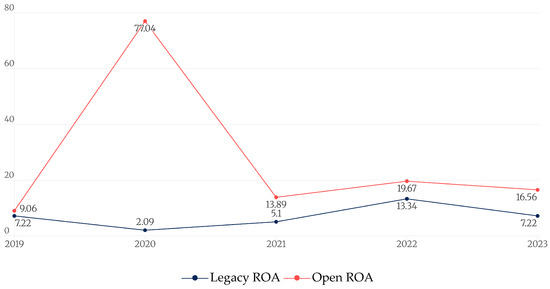
Figure 4.
Annual median values for the return on assets ratio for the two cohorts of publishers. Data from Orbis by Moody’s.
In contrast, OA publishers consistently reported higher mean ROAs, peaking in 2020 and averaging 28.41% across the period. The 2020 spike was driven by extremely high firm-level ROA (e.g., MDPI’s ROA 77% that year), reflecting how relatively small asset bases can amplify profit ratios. However, the mean ROA was normalized to 14.71% (2021), 24.70% (2022), and 16.56% (2023). The Mann–Whitney U test showed a statistically significant difference in ROA between the legacy and OA groups, U = 310.00, p = 0.002 (exact p = 0.002). This indicates the ROA distributions differ strongly between groups (z = 3.026), significantly at the 1% level.
Median ROA values were more consistent. The corresponding medians are 9.06%, 77.04%, 13.89%, 19.67%, and 19.31%. The five-year averages are 28.41% (mean) and 27.79% (median). Relative to legacy publishers, OA outperforms on average (≈28% versus ≈8% mean ROA), but with pronounced volatility, most notably the 2020 spike, while 2023 shows some convergence in levels.
Overall, the profitability analysis reveals that OA publishers, despite their smaller size, were able to achieve higher returns than legacy publishers on average, though with greater volatility. OA publishers have a significantly larger ROA but not a statistically significant ROE, which indicates, as we will see in further analysis, higher leverage. Some OA players are highly profitable relative to their equity (indicative of efficient operations and possibly undercapitalization). Legacy publishers delivered reliably strong profits even through external shocks, aided by diversified portfolios and perhaps cost-cutting in bad years.
4.3. Liquidity and Efficiency
In this section, we examine measures of liquidity (current ratio) and operational efficiency (net asset turnover and receivables/payables periods). Mean and median values for these ratios for each group by year are presented in Table 1. We will discuss each in turn.
Current Ratio (Current Assets/Current Liabilities): According to Figure 5, legacy publishers consistently reported current ratios below 1.0 over the five-year period, indicating a structurally negative working capital position. Specifically, their mean current ratio ranged from 0.74 in 2019 to 0.96 in 2022 before declining to 0.79 in 2023. The median values remained slightly lower, between 0.67 and 0.98, reflecting a stable trend of current liabilities exceeding current assets. This is typical in the industry due to substantial deferred subscription revenue, which is recorded as a current liability but does not require short-term cash outflows. In contrast, OA publishers maintained significantly higher current ratios, suggesting stronger liquidity positions. The group’s mean current ratio increased from 1.06 in 2019 to 2.71 in 2021, the latter driven by an outlier (MDPI) that held an unusually large cash balance relative to its current liabilities. By 2022, the mean had normalized to 1.52 and 1.90 for 2023.
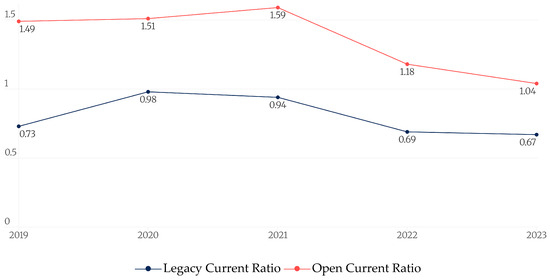
Figure 5.
Annual median values for the current ratio for the two cohorts of publishers. Data from Orbis by Moody’s.
The median OA current ratios were more representative of the group’s typical liquidity behavior, rising from 1.05 (2019) to 1.59 (2021) and settling at 1.51 in 2022. Across 2019–2022, the median current ratio for OA publishers averaged around 1.36, compared to 0.8 for legacy firms. These results indicate that OA publishers generally maintain a liquidity buffer, whereas legacy publishers operate with thin or negative working capital due to their different business models and revenue recognition practices. In short, OA publishers maintain higher liquidity reserves relative to short-term liabilities than legacy publishers do. This could be due to different business models, as the legacy publishers are involved in other activities also. The Mann–Whitney U test revealed a highly significant difference in current ratio between the legacy and OA groups, U = 614.00, p < 0.001. This result (z = 4.619) indicates that the distributions for the two groups differ markedly, with the difference being significantly beyond the 1% level.
Net Assets Turnover (Revenue/Equity): Perhaps the most striking difference in efficiency is in net asset turnover. As shown in Figure 6, the legacy group’s asset turnover was around 1.13–1.20 (mean) each year, meaning they generated roughly EUR 1.13–1.20 of revenue per EUR 1 of assets annually. The median was similar, around 0.79–0.97. These relatively low turnovers reflect the large equity bases of legacy publishers (built up over years of retained earnings and acquisitions). In contrast, OA publishers showed very high net asset turnover, a hallmark of asset-light operations. Their mean turnover began at 7.14 in 2019, dipped slightly to 4.70 in 2020, and climbed to 6.47 in 2021 and 6.72 in 2022, and for 2023, 7.34, the overall five-year average stood at 6.48x, compared to 1.18× for legacy publishers. This means that OA publishers are generating approximately six times more revenue per unit of equity than their legacy counterparts.
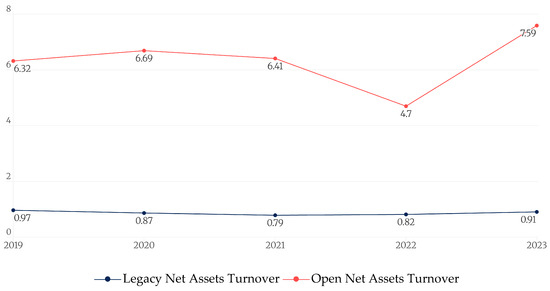
Figure 6.
Annual median values for the Net Asset Turnover ratio for the two cohorts of publishers. Data from Orbis by Moody’s.
The median turnover values for OA firms followed a similar trajectory, confirming this as a consistent group trait rather than being driven solely by outliers. The implications are significant: OA publishers are far more efficient in deploying equity to generate revenue, although this may also signal a thinner capital cushion and potential exposure during revenue downturns. For example, Frontiers in 2022 had revenue of EUR 46.8M against equity (shareholders’ funds) of perhaps only a few million, yielding a turnover of >7×; MDPI similarly operates with a small equity base relative to its revenue, giving high turnover. Over 2019–2022 the gap is consistent: OA turnover was roughly 5–8 times, whereas legacy was ~1.15–1.20 times. The five-year average turnover was 6.34× for OA compared to just 1.18x for legacy. This difference highlights a fundamental structural contrast: OA publishers are far more “asset-light” and capital-efficient in generating revenue. They rely on intangible assets (platforms, networks) and operate lean, whereas legacy publishers carry substantial retained capital and assets (from decades of operations), which makes their revenue in proportion to equity smaller. For the OA group, such high turnover can also be a double-edged sword; it means they are operating with relatively low equity (which can make them financially agile but potentially less cushioned against losses). This ratio reveals another limitation of our study: legacy publishers are not only involved in academic writing but also involved in other activities. The Mann–Whitney U test showed a highly significant difference in net assets turnover between the legacy and OA groups, U = 560.00, p < 0.00. This result (z = 5.121) indicates a substantial difference in the distributions of the two groups, significantly well beyond the 1% level.
Collection Period: Legacy publishers wait a long time to collect cash (Figure 7). Their mean collection period was about 60–73 days during 2019–2021, improving to 60 days in 2023. The median for legacy was around 70–71 days through 2021, improving to ~60 days in 2022. This suggests that on average, it takes about 2–2.5 months for legacy publishers to collect payments (likely from libraries, consortia, advertisers, etc.). OA publishers, however, collected payments much faster. In 2019, the group’s mean was 104.28 days due to an unusually high MDPI ratio, decreasing to 9.17 (2020), 28.51 (2021), 38.98 (2022), and 37.00 (2023). These values are substantially shorter than those for legacy firms. The 2021 median collection period for OA publishers was 33.00 days, half that of the legacy group. Over the 2019–2023 window, OA publishers had a mean collection period of 43.59 days, compared to 66.34 days for legacy publishers. By 2022, with all four OA companies reporting, the mean collection period was 38.98 days, and the median was 37.45 days. The jump in 2022 was mainly because PLOS had an unusually high 72-day collection period (perhaps slower payments from institutions contributing to publishing fees), while others like Frontiers and MDPI were around 30–34 days apart from 2019. Despite this uptick, OA publishers still collected much faster on average than legacy ones (39 days versus 62 days in 2022). The overall 2019–2023 average collection period was ~44 days for OA versus 66 days for legacy. This is intuitive given the business models: APCs are often paid by authors (or their funders) promptly as a condition of publication (many APCs are paid upfront or at article acceptance time), whereas publishers deal with institution-scale subscription/agreement-based negotiations and invoices for a thicker portfolio of services, often on annual cycles, leading to slower receipts. The consistently shorter collection period is a cash flow advantage for OA publishers; they get paid much sooner after providing service, improving their operating cash cycle. The Mann–Whitney U test for the collection period indicated a highly significant difference between the compared groups, U = 87.00, p < 0.001. The negative z-value (z = −3.497) shows that the legacy publishers had consistently higher ranks than the OA, with the difference being significant at the 1% level.
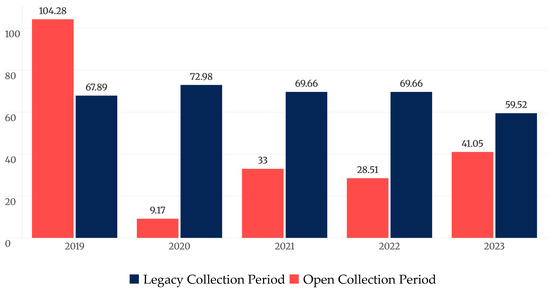
Figure 7.
Annual median rates for the collection period ratio for the two cohorts of publishers. Data from Orbis by Moody’s.
Credit Period: Figure 8 shows that credit periods were more closely aligned between the two groups but still exhibited a slight advantage for OA publishers in terms of efficiency. Legacy publishers reported a mean credit period ranging from 14.44 to 15.29 days. Their median values typically hovered between 13 and 17 days. OA publishers, in contrast, paid vendors more quickly: the mean credit period was 8.16 days (2019), 8.97 (2020), 4.35 (2021), 11.38 (2022), and a large increase in 2023, 24.93. This yields a five-year average of 11.56 days, versus 15.12 days for legacy firms. The medians reinforced this finding, with OA values clustering between seven and 16 days. These shorter durations could stem from OA firms’ smaller vendor networks, use of automated payment systems, or limited ability to negotiate long payment terms. Despite paying somewhat sooner, OA publishers benefit from a net positive working capital dynamic: they collect revenue quickly while paying slightly later, leading to a favorable cash conversion cycle. For the credit period, the Mann–Whitney U test showed a statistically significant difference between the legacy and OA groups, U = 168.00, p = 0.012. The negative z-value (z = −2.526) indicates that the legacy group had consistently higher ranks than the OA one, with the difference significant at the 5% level.
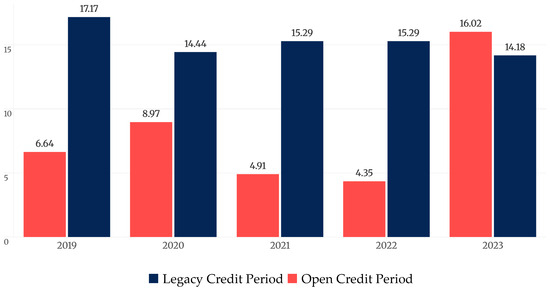
Figure 8.
Annual median rates for the credit period ratio for the two cohorts of publishers. Data from Orbis by Moody’s.
Considering liquidity and efficiency together, OA publishers operate with a faster cash cycle (collect sooner, pay slightly sooner) and require less capital to generate revenue, but they hold proportionally more liquid assets relative to liabilities. Legacy publishers, by contrast, exhibit a slower cash cycle (potentially due to legacy business practices and customer types) and far lower asset turnover, and they comfortably use negative working capital (unearned revenue) to finance operations. These differences highlight an advantage for OA publishers in terms of agility and potentially lower working capital needs. However, the extremely high asset turnover of OA firms also reflects their thin equity cushions, something that could pose a risk if revenues falter.
From these tables, it is evident that OA publishers operate with a different working capital dynamic: higher current ratios (more liquidity), much faster turnover of equity (indicating lower capital requirements), faster receivables collection, and slightly faster payment of payables. These are characteristics of smaller, nimble companies and align with expectations for firms that largely conduct business online (APCs are often paid via web portals, etc.). Legacy publishers, with their entrenched practices, exhibit slower cash flows and deliberately carry large, deferred revenues (reducing the current ratio). Yet, it should be noted that the low current ratio has not been problematic for them due to reliable subscription renewal rates.
The efficiency metrics underscore a key insight: OA publishers generate revenue very efficiently relative to their size, as measured by equity/assets. This could be viewed as being undercapitalized, which might constrain growth unless profits are reinvested or new capital is raised, or simply very lean operations. In contrast, legacy publishers’ heavy capital and asset base might be seen as underutilized, if one were to judge purely by asset turnover; however, their strategy often involves using that capital for strategic acquisitions, product diversification, and maintaining buffers for stability.
4.4. Solvency and Leverage
Finally, we compare solvency and leverage indicators between the two groups. Mean and median values for the bearing (debt to equity) percentage and the two solvency ratios (equity to assets and equity to liabilities) for each year.
Leverage (Gearing): Figure 9 clearly demonstrates that legacy publishers are substantially more leveraged than their OA counterparts. The mean gearing ratio for their cohort began at 123.46% in 2019, increased dramatically to 205.29% in 2020, and gradually declined to 108.62% in 2021, 101.96% in 2022, and increased again to 176.48% in 2023. The spikes are due to the fact that SpringerNature had large increases and missing data. In 2023, SpringerNature’s gearing ratio is 538.33%. The five-year average stands at 143.16%, indicating that, on average, legacy publishers carried debt loads roughly 1.2 to 1.7 times their equity. This level of financial leverage is consistent with broader industry strategies: legacy firms often use debt to finance acquisitions, dividend distributions, or share repurchases. For instance, Informa, SpringerNature, and Wiley have all carried substantial debt in recent years, often backed by predictable, long-term subscription revenues. The spike in 2020 may reflect sharp declines in equity due to COVID-related earnings reductions, while debt levels remained constant or even increased, amplifying the gearing ratio.
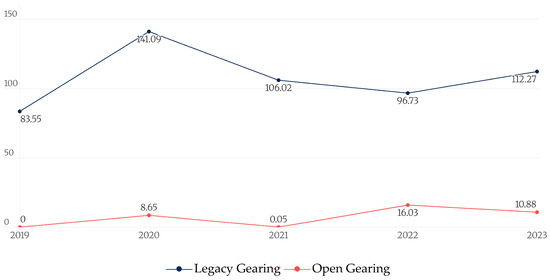
Figure 9.
Annual median values for the gearing ratio for the two cohorts of publishers. Data from Orbis by Moody’s.
In contrast, OA publishers exhibit minimal reliance on debt financing. While the mean gearing ratio for OA publishers in 2019 is 35.41%, this is entirely attributable to Frontiers, which reported this ratio individually. The median value for OA in 2019 was 0%, as most OA publishers had no recorded debt. In 2020, the OA mean fell to 13.30%, reflecting modest debt levels across two firms (PLOS and Frontiers). By 2021, the mean rose again to 31.35%, but this again reflects the inclusion of Frontiers as the only firm with substantial debt; the median was 0%. In 2022, with four data points, the mean dropped to 27.78%, and the median was 16.03%, further reinforcing the conclusion that most OA publishers remain virtually debt-free, while Frontiers is the outlier. The overall five-year mean gearing for OA publishers was 26.07%, and the median was significantly lower.
This stark contrast underscores the structural difference in financing strategies: legacy publishers actively use debt to fund growth and enhance returns, whereas OA publishers generally rely on equity, retained earnings, or grant-based funding. The absence of debt among OA publishers also suggests a lower financial risk profile—but potentially less flexibility for rapid capital-intensive expansion. Importantly, this financial posture may also influence acquisition dynamics: debt-free firms with high revenue efficiency and low liabilities are attractive targets for leveraged acquisitions by large incumbents. Removing Frontiers (the only OA firm with notable long-term debt in multiple years) would drop the OA gearing to near zero in many years. So, most OA publishers are essentially unleveraged (zero debt), whereas legacy publishers extensively use debt financing. This aligns with the earlier observation that MDPI is debt-free and eLife/PLOS (non-profits) likely avoid debt. Legacy firms have ready access to credit markets and often have ongoing loans or issued bonds to fund acquisitions or shareholder returns. For example, Wiley took on debt to acquire Hindawi; SpringerNature carries debt from its private equity ownership structure, etc. The strategic implication is that OA publishers have lower financial risk from debt but also less “firepower” from borrowing. The low leverage could make them attractive targets. For the gearing ratio, the Mann–Whitney U test showed a highly significant difference between the OA and legacy groups, U = 70.00, p < 0.001. The negative z-value (z = −4.782) indicates that the Open Access subgroup had consistently lower ranks than the legacy group, with the difference significantly beyond the 1% level.
Solvency Ratio: Solvency ratios in Figure 10 provide a complementary view to gearing by measuring the share of a firm’s assets or liabilities financed by equity. The asset-based solvency ratio (equity/assets) for legacy publishers averaged 28.37% in 2019, 28.80% in 2020, rising slightly to 34.18% in 2021, and stabilizing at 29.89% in 2022 and 30.71% in 2023. This pattern indicates that roughly one-quarter to one-third of their asset base is financed through equity, while the rest is covered by liabilities. The five-year average was 30.52%, suggesting a healthy, but leveraged capital structure, consistent with long-term debt funding alongside retained earnings.
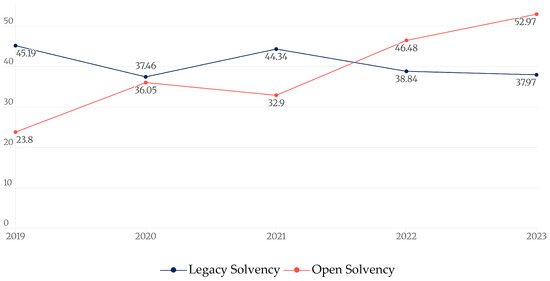
Figure 10.
Annual median values for the Solvency ratio for the two cohorts of publishers. Data from Orbis by Moody’s.
By contrast, OA publishers had substantially higher equity-to-assets ratios. Their mean asset-based solvency began at 35.71% in 2019 and peaked at 50.38% in 2023. These values imply that OA publishers fund a greater portion of their operations through equity, with less exposure to long-term debt or financial obligations. In essence, OA publishers are much less leveraged, often operating primarily on equity (or retained earnings and grants), whereas legacy publishers have a leveraged capital structure with substantial debt. Legacy firms’ ability to carry high debt is supported by their stable cash flows and profitability; many have investment-grade credit ratings and can borrow at reasonable costs. OA publishers, being smaller and some being non-profit, likely either cannot easily raise debt or choose not to. This conservative financial posture of OA firms means lower financial risk but also potentially slower expansion unless funded by equity or revenue growth. On the other hand, the big publishers’ higher debt loads have not impeded their strategic moves; they use debt capacity to acquire companies (for further increasing scale advantages). For the 2023 solvency ratio, the Mann–Whitney U test indicated no statistically significant difference between the OA and the legacy groups (U = 426.00, p = 0.184).
The Solvency ratio comparison reinforces that OA publishers are generally equity-financed and solvent, whereas legacy publishers strategically utilize debt, resulting in lower equity ratios. Neither group shows signs of solvency distress (even a 25% equity-to-asset ratio for large publishers is acceptable given their stable earnings). However, the legacy group’s higher debt means higher interest obligations; indeed, some legacy publishers, such as Wiley, have seen profits impacted by interest expenses and must maintain earnings to service debt. OA publishers, free of such burdens, can reinvest any earnings directly into operations or growth.
From a strategic perspective, the low leverage of OA publishers could make them nimbler but also possibly limit their growth rate without outside investment. It also makes them enticing targets for acquisition by leveraged firms that see an opportunity to add revenue without adding proportional debt (since the acquirer can leverage the acquisition at their own cheaper cost of capital). This dynamic is part of why market observers note the risk of “corporate capture” of OA; smaller OA ventures might eventually be absorbed by the well-capitalized giants.
In conclusion, the financial ratio analysis reveals clear distinctions: OA publishers have similar or even slightly better profitability ratios on average, significantly stronger liquidity and faster turnover, and operate with minimal debt, whereas legacy publishers have enormous scale, steady moderate efficiency, and substantial leverage. In the next section, we discuss what these differences mean for the competitive landscape and strategy of OA publishers in a market still led by much larger players.
5. Discussion
The empirical results highlight a number of important points about the financial performance and positioning of OA publishers relative to legacy publishers. In this section, we interpret these findings and discuss their implications for competition and the potential trajectory of the scholarly publishing industry.
Profitability and efficiency: One striking outcome is that, when averaged over 2019–2023, OA publishers achieved comparable or higher profitability to legacy publishers. Despite their much smaller size, the OA group’s return on equity and return on assets were on par with and higher than those of the big established firms. This suggests that the OA business model—at least as implemented by the sample OA companies—can be financially viable and even lucrative. The analysis clearly shows that OA publishers run asset-light, high-turnover operations. This is a key strategic difference. The OA group’s net asset turnover, being an order of magnitude higher than that of legacy publishers, reflects that they generate revenue with far less equity capital. In practical terms, an OA publisher does not require the massive infrastructure (in terms of buildings, facilities, etc.) that legacy publishers once needed, nor do they carry large goodwill from acquisitions on their books, since many grew organically, but they leverage digital platforms and scalable processes. The benefit of this model is a high return on invested capital and agility—they can scale up by accepting more submissions or launching new journals with relatively small incremental investment. This is exemplified by how quickly MDPI and Frontiers grew their output and revenue around 2020–2022 without needing huge capital injections. The flip side is that having a small capital base means any profits represent a high percentage return (which looks great in ratios), but the absolute resources at their disposal are limited. For instance, MDPI’s revenue of, say, EUR 690 million in 2022 is tiny compared to Elsevier’s EUR 9.677+ billion; even if MDPI reinvests all profits, that is at most a few million euros, Elsevier can reinvest hundreds of millions or make acquisitions with ease. Thus, high efficiency is a double-edged sword: it indicates lean operations but also hints at undercapitalization relative to growth potential. If an OA publisher wants to, for example, develop a new sophisticated peer-review platform or expand into new markets, it might lack internal funds and need external investment or partnerships.
Liquidity and leverage: The OA publishers’ tendency to collect cash faster and maintain higher current ratios suggests a conservative approach to liquidity. This is likely based on a different business model approach. Nevertheless, the legacy publishers have adequate liquidity. The stark difference in leverage highlights a philosophy of independence among OA publishers versus a willingness to leverage among legacy publishers. The OA firms, many started by academics or as mission-driven enterprises, have largely avoided taking on debt. This keeps them independent but also indicates limited access to credit markets. Legacy publishers often have the backing of large parent corporations or investors that encourage using debt to optimize capital structure and shareholder returns (debt can amplify returns on equity in good times).
Competitive dynamics—David vs. Goliath: The differences in scale and financial structure feed directly into strategic positioning. Large legacy publishers operate at a scale where they can cross-subsidize and strategically price their offerings to maintain dominance. For instance, they can bundle OA publishing options with subscriptions, use Big Deal negotiations to lock in institutional budgets, and invest in new services (analytics, workflow tools, AI) that complement their publishing business. OA publishers, being smaller, traditionally focused on journals alone, and with a lean structure that allows them to undercut prices and/or offer quicker publication times, have become attractive to authors, lowering the barrier to entering the market. A key concern is whether these OA publishers can continue to grow and take market share from the big players or whether they will be bought out or marginalized. The evidence so far is mixed: on one hand, OA content has grown to account for ~50% of new publications by 2022, and independent OA publishers like MDPI and Frontiers contributed significantly to that surge. This shows that the market is shifting toward OA, providing a tailwind to OA-focused firms. On the other hand, the big five (Zarif, 2023) are adapting: they have all adopted OA strategies, and many of their journals are now hybrid or fully OA, as well as launching new OA journals regularly. They are also actively acquiring successful OA publishers both as growth and prevention (barriers to entry) strategies. Every acquisition is both a validation of the OA publisher’s value and a sign of consolidation that potentially limits the space for new competitors.
From a market competition perspective, the presence of financially successful OA publishers is a positive force for change; it pressures legacy publishers to offer more OA options and possibly to moderate pricing. However, there are strategic challenges: the legacy publishers still have the most prestigious journals (many society journals and high-impact titles), and they have deeper relationships with libraries and consortia. These are instruments that stabilize their incumbent advantageous position in the market, which the OA publishers, as well as the publicly governed infrastructures, struggle to acquire. OA publishers often rely on volume, which has raised questions about quality control. In 2022–2023, integrity issues (paper mills and questionable peer review) emerged in the industry, affecting both the reputation and the income of some OA publishers. This means that OA publishers now must invest more in quality control and perhaps slow the pace of expansion to ensure integrity. Such investments may increase costs and could reduce profitability in the short term but are necessary for long-term sustainability and to compete on quality, not just quantity.
Strategic implications of size disparities: The massive size disparities mean that OA publishers must choose strategic niches or differentiation to thrive. Competing head-on with the conglomerates is difficult when the latter can bundle deals and have extensive sales networks. Many OA publishers have, in fact, differentiated themselves: eLife has a unique editorial model (review then publish with reviews), PLOS pioneered megajournals, MDPI mastered speed and volume, and Frontiers emphasizes research community platforms and has specialty journals with engaged editors. These differentiators have helped them build a reputation and an author base. Financially, being smaller also means the leadership of these OA firms can make decisions more quickly (no large shareholders demanding quarterly dividends, etc.), which might allow more innovation (albeit at the risk of mistakes too). The lean operations and lack of debt give them a runway to experiment or pivot without creditors imposing constraints.
At the same time, large legacy publishers have strategic advantages from scale: they can invest in data analytics that complement publishing, and they can bundle services along with publishing contracts, things a smaller publisher cannot easily match. They also have brand prestige on their side for many journals. The challenge is to remain agile despite their size, and adopting some of the lean practices of OA publishers (streamlining workflows, embracing greater transparency to satisfy the demands of authors and funders) might be important. Financially, they might need to moderate profit expectations during the transition to OA, as the market becomes more competitive in price; the days of annual price hikes and 40% margins being taken for granted may wane as OA options proliferate. Instead, growth for them will come from volume and new services around content (analytics, institutional dashboards, AI licensing, etc.), as well as from tapping into emerging research markets, such as AI scholarly tools. In a sense, the distinction might soon be less about business model and more about scale and ownership structure.
Overcoming these advantages will likely require OA publishers to either (a) grow substantially larger themselves (organically or via alliances) or (b) operate in collaborative frameworks that amplify their reach (for instance, OA publishers working with library consortia in new ways, or multiple OA publishers forming a network). One strategic route we are seeing is the formation of consortial funding and institutional agreements for OA. While so far mostly the big publishers have engaged with those with big consortia because they control the must-have subscription journals, OA publishers like PLOS and Frontiers have also signed deals with institutions to cover APCs. If that trend broadens, OA publishers might obtain more secure institutional funding (akin to subscriptions), which could help them scale and smooth revenue. It might partially reduce the gap in how they manage working capital (with some deferred revenue coming in for prepaid publishing), making them a bit more like legacy publishers in that respect. However, it could also reduce one of their current advantages (fast payment by individuals) if they have to wait for lump sum payments from institutions. It is a strategic balance. They should capitalize on their efficiency by continuing to innovate and keep overheads low but perhaps consider strategic partnerships or selective investments (even if it means taking on some debt or outside capital) to grow their infrastructure and reach, especially in areas that bolster trust, such as peer-review management systems, fraud detection, etc. Maintaining a strong balance sheet with low debt is wise, but if the competitive environment intensifies, judicious leveraging of their now-proven business model could help them scale up quickly.
For the policymakers, who are often criticized by the publishers’ associations for promoting the OA agenda, our study’s results are reassuring: they indicate that a more open and competitive market is feasible without sacrificing financial viability. The fact that OA publishers can be financially sound means that initiatives to further mandate or encourage OA need not harm the publishing industry; rather, they may be calibrating and redistributing revenue and profits towards more accessible models. It will be beneficial to continue monitoring the financial health of publishing actors as the industry evolves to ensure that financial moderation can be implemented to benefit the public interest and that no single group gains an overwhelming advantage that could lead to exploitative, almost anti-trust, practices. The diversity of business models and providers often leads to better outcomes for consumers, in this case, libraries, authors, and readers. In summary, the strategic implications of our findings are as follows:
- OA publishers have shown financial viability and even strength in certain metrics (especially efficiency), proving that the OA model can be run as a sustainable business. This strengthens their position when advocating for OA; it is not a charity case but a competitive model.
- The much smaller scale of OA publishers is a vulnerability in a market with huge incumbents. To overcome that, OA publishers likely need to leverage their agility and focus to continue out-innovating the slower giants in aspects like speed, user experience, and cost-effectiveness. If they can keep authors and editors satisfied at a lower cost, they can continue to pull submissions, which are the lifeblood of journals, away from legacy outlets.
- If the current trends continue without excessive consolidation, we could end up with a more pluralistic market where a handful of big publishers coexist with several strong independent OA publishers, each maybe specializing in or excelling in different fields or approaches. This could be healthy for the system. Ensuring that outcome might require conscious effort by research funders and institutions to support independent outlets, such as through institutional APC funds that are not all locked into deals with the big publishers.
- The big legacy publishers will likely continue to deploy acquisitions as a key strategy to maintain dominance in the OA era. This means that any up-and-coming OA publisher might at some point face an offer that is hard to refuse. The scholarly community might want to consider how to preserve the diversity of the ecosystem in light of this; one possibility is the growth of non-profit collaborative platforms (like SCIELLO) and government-supported publishing platforms (like Open Research Europe) that cannot be bought, but those tend to operate in specific regions or niches.
- The findings suggest that OA publishers have been very conservative financially (low debt, keeping cash, etc.). Going forward, they might need to consider whether taking on some debt or investment could actually help them scale faster to compete. Given their demonstrated profitability, they could likely attract investors or loans on good terms. If performed carefully, this could boost their growth (for instance, funding new top-tier journals or new services) without undermining their stability. It is a strategic choice: remain ultra-conservative and grow organically (slower but safer) or leverage their success to accelerate growth (riskier but could gain market share faster).
- The data on employees (OA publishers having far fewer) hints at another strategic angle: talent and expertise. Large publishers have armies of staff—in editorial management, sales, technology, etc.—whereas OA publishers often run lean teams with many automated systems. As OA publishers grow, they may need to expand their human capital, such as hiring more in-house editors, business development managers to broker deals, etc. This will increase costs but also capabilities. On the other hand, big publishers have been trimming staff in production and other areas due to automation; their challenge is to not become so bloated that nimble competitors outcompete them on service. We already see some societies taking their journals away from big publishers to self-publish or go to smaller OA presses, citing cost and service issues. This competitive dynamic might intensify if independent publishers can offer more personalized attention.
- In essence, OA publishers have proven they can compete on product and price; the question is whether they can also compete on scale and longevity. The financial comparison in this study shows they manage their finances prudently and yield strong performance, but the might of the multi-billion-dollar competitors is a looming factor. The landscape of scholarly publishing in the next decade will be shaped by how these smaller OA firms navigate growth and whether they remain challengers or join forces with the giants. What is clear is that the rise in OA has fundamentally changed the business; even the largest publishers are now transforming how they operate (with new revenue models and cost structures), which can be attributed in part to the success and pressure from the OA movement and its leading publishers.
6. Conclusions
This study conducted an empirical comparison of OA versus legacy publishers in terms of financial performance over the period 2019–2023, using financial ratio analysis. The results reveal that, despite enormous differences in scale, the two groups exhibit some surprisingly comparable financial outcomes alongside key contrasts in capital structure and efficiency. OA publishers seized the momentum of the OA movement’s growth, expanding output rapidly, especially in fast review megajournals that attracted the deluge of COVID research and largely translated that growth into solid financial performance, rather than operating at a loss for market share. This strengthens their strategic position. Legacy publishers weathered the pandemic-induced turbulence reasonably well, thanks in part to diversified income and deep pockets, but also faced pressure to adapt business models faster (as library budgets were strained and the value of OA was highlighted). As funder policies, such as PlanS and the U.S. OSTP mandate, kick in, requiring OA research, the addressable market for OA publishing services is expected to further expand, and this volume increase is what both cohorts are pushing for.
OA publishers in our sample achieved profitability on par with or even exceeding that of the much larger legacy publishers over the five years, although the OA group’s year-to-year volatility was higher. Legacy publishers have higher ROE as they are more leveraged, while the OA publishers have higher ROA, indicating the capability of expanding while having healthy ROE. They also maintained stronger liquidity positions, and they converted cash faster, collecting receivables in a fraction of the time legacy publishers did. In terms of solvency, OA publishers operated with minimal debt, whereas legacy publishers were heavily leveraged. Finally, the sheer scale gap was underscored by revenue and asset figures: legacy publishers are two orders of magnitude larger; multi-billion euro enterprises with tens of thousands of employees, compared to OA publishers with tens of millions in revenue and a few hundred staff.
The question that arises is why noble intentions have been turned into a flawed reality (Frank et al., 2023). The commercialization of knowledge still exists, and profitability is a given. The vision of openness is being undermined from within, as the legacy publishers themselves could have been more sensible in APC pricing and not monetizing prestige. According to one of the conclusions of a recent report by the International Council of Science, “Without coordinated international action of this nature by the research community it seems inevitable that scholarly research processes will, over the next few years, become dominated by a small number of large commercial digital platforms” (Gatti, 2020). Thus, policymakers need to review and encourage alternatives to the Gold OA model, such as Diamond, which does not charge fees to authors and readers, and Green OA, which would serve many other purposes. Many voices have been pushing towards the Diamond way (Normand, 2018; Mounier & Rooryck, 2025), but still there is a lot of work to be done. Collective action by universities, libraries, funders, and states is required to address the distortions in the current system (Borrego, 2023), including APC price transparency, non-disclosure agreements for Gold OA, recalibration of research assessment, rights retention policies, and others. Publishers seem to respond well to the pressures for zero-embargo mandates that would favor Green OA, based on the prestige capital of their journal catalog. However, multi-front pressures from states and the introduction of secondary publishing rights, as well as from big-tech companies and the format-less, micro-sized information future by AI, are challenging their models. Libraries need to create workflows and data aggregation systems to control the flow of money invested in the support of openness in scientific knowledge (Barbers et al., 2018). Openness is not an end in itself but a means to answer the question of whether public money is reasonably invested (Kendall, 2024). Its rational management can enhance other academic dimensions (infrastructure, financial support for students, and additional academic staff).
In a market long criticized for oligopolistic practices and exorbitant costs, the rise in OA publishers represents a disruptive force, injecting both innovation and competition. This paper’s comparative analysis shows that the disruptors can hold their own financially. While the playing field is not even—David is still much smaller than Goliath—the agility and mission-driven ethos of OA publishers have enabled them to thrive in the niches they carved out. Whether David can slay Goliath, or perhaps more realistically, prompt Goliath to evolve into a gentler giant, remains to be seen. The period up to 2023 might be remembered as the time when OA went from a fringe movement to a mainstream part of scholarly publishing’s business landscape. The subsequent years will determine if that results in a true rebalancing of power in the industry or a reabsorption of OA into the old framework. Financial performance, as dry as ratios may seem, is fundamentally tied to that outcome: it influences who can invest, who can expand, and ultimately who will shape the future of academic knowledge dissemination.
Author Contributions
Conceptualization, G.P., L.P. and G.T.; methodology, G.P.; validation, G.P., L.P. and G.T.; formal analysis, G.P. and L.P.; investigation, G.P and L.P.; resources, L.P.; writing—original draft preparation, G.P., L.P. and G.T.; writing—review and editing, G.P., L.P. and G.T.; visualization, G.P. and G.T. All authors have read and agreed to the published version of the manuscript.
Funding
This research received no external funding.
Data Availability Statement
Data for this study can be downloaded from the database Orbis, formerly known as Bureau van Dijk (BvD), by Moody’s.
Conflicts of Interest
Giannis Tsakonas is a member of the Governing Board of the Directory of Open Access Journals.
Notes
| 1 | MDPI AG is a private company that is not obliged to publish financial information. Orbis has no financial data for MDPI AG and only lists four persons as staff. For MDPI, we used consolidated financial data from MDPI offices (MDPI D.O.O. BEOGRAD, MDPI OPEN ACCESS PUBLISHING ROMANIA S.R.L., MDPI (THAILAND) CO., LTD., MDPI POLAND SP. Z O.O., MDPI HAIDIAN OFFICE, MDPI UK LIMITED). There were six more offices, but with no available financial data. We asked MDPI to provide us with financial data; unfortunately, they referred us to their annual report, which has no financial data and only the number of staff. To estimate revenue, we also used APC data from Butler et al. (2023). Since our analysis is primarily based on ratios, the absence of financial data from other MDPI offices does not materially affect our results, provided that these offices do not exhibit significant differences in terms of financial performance. |
| 2 | MDPI annual report 2024. |
| 3 | For MDPI, we used the annual report for the number of employees and estimated revenue from Butler et al. (2023). |
References
- Abbas, Y., & Nainggolan, Y. A. (2023). Profit, cash flow, and leverage: The case of ASEAN stock market performance during the COVID-19 pandemic. Journal of Accounting in Emerging Economies, 13(5), 898–921. [Google Scholar] [CrossRef]
- Asai, S. (2023). Determinants of article processing charges for hybrid and gold open access journals. Information Discovery and Delivery, 51(2), 121–129. [Google Scholar] [CrossRef]
- Barbers, I., Kalinna, N., & Mittermaier, B. (2018). Data-driven transition: Joint reporting of subscription expenditure and publication costs. Publications, 6(2), 19. [Google Scholar] [CrossRef]
- Björk, B.-C. (2012). The hybrid model for open access publication of scholarly articles: A failed experiment? Journal of the American Society for Information Science and Technology, 63(8), 1496–1504. [Google Scholar] [CrossRef]
- Bobtcheff, C., Caillaud, B., & Lévy, R. (2023). Academic publishing and open access: What does economics teach us? Annals of Economics and Statistics, 150, 1–24. [Google Scholar] [CrossRef]
- Booth, C. M., Ross, J. S., & Detsky, A. S. (2023). The changing medical publishing industry: Economics, expansion, and equity. Journal of General Internal Medicine, 38(14), 3242–3246. [Google Scholar] [CrossRef] [PubMed]
- Borrego, Á. (2023). Article processing charges for open access journal publishing: A review. Learned Publishing, 36(3), 359–378. [Google Scholar] [CrossRef]
- Budzinski, O., Grebel, T., Wolling, J., & Zhang, X. (2020). Drivers of article processing charges in open access. Scientometrics, 124(3), 2185–2206. [Google Scholar] [CrossRef]
- Butler, L.-A., Matthias, L., Simard, M.-A., Mongeon, P., & Haustein, S. (2023). The oligopoly’s shift to open access. How the big five academic publishers profit from article processing charges. Quantitative Science Studies, 4(4), 778–799. [Google Scholar] [CrossRef]
- Conley, J. P., & Wooders, M. (2009). But what have you done for me lately? Commercial publishing, scholarly communication, and open-access. Economic Analysis and Policy, 39(1), 71–88. [Google Scholar] [CrossRef]
- Copiello, S. (2020). Business as usual with article processing charges in the transition towards OA publishing: A case study based on Elsevier. Publications, 8(1), 3. [Google Scholar] [CrossRef]
- Crow, R. (2009). Income models for open access: An overview of current practice. SPARC. [Google Scholar]
- Dimitropoulos, P. E. (2020). R &D investments and profitability during the crisis: Evidence from Greece. R&D Management, 50(5), 587–598. [Google Scholar] [CrossRef]
- Eger, T., & Scheufen, M. (2021). Economic perspectives on the future of academic publishing: Introduction to the special issue. Managerial and Decision Economics, 42(8), 1922–1932. [Google Scholar] [CrossRef]
- Evans, D. S. (2002). The antitrust economics of two-sided markets (SSRN Scholarly Paper No. 332022). Social Science Research Network. [Google Scholar] [CrossRef]
- Filistrucchi, L., Geradin, D., van Damme, E., & Affeldt, P. (2014). Market definition in two-sided markets: Theory and practice. Journal of Competition Law & Economics, 10(2), 293–339. [Google Scholar] [CrossRef]
- Frank, J., Foster, R., & Pagliari, C. (2023). Open access publishing—Noble intention, flawed reality. Social Science & Medicine, 317, 115592. [Google Scholar] [CrossRef]
- Gatti, R. (2020). Business models and market structure within the scholarly communications sector (International Science Council Occasional Paper). International Science Council. Available online: https://council.science/publications/business-models/ (accessed on 16 August 2025).
- Gkillas, K., Peppas, G., Tsagkanos, A., & Salatas, I. K. (2018). Capital structures of US market firms and its determinants during different macroeconomic states and various leverage levels (SSRN Scholarly Paper No. 3138009). Social Science Research Network. [Google Scholar] [CrossRef]
- Goto, S., Wang, Z., & Yan, S. (2020). Net share issuance and asset growth effects: The role of managerial incentives. Financial Analysts Journal, 76(1), 63–81. [Google Scholar] [CrossRef]
- Grossmann, A., & Brembs, B. (2021). Current market rates for scholarly publishing services. F1000Research, 10, 20. [Google Scholar] [CrossRef] [PubMed]
- Hanson, M. A., Barreiro, P. G., Crosetto, P., & Brockington, D. (2024). The strain on scientific publishing. Quantitative Science Studies, 5(4), 823–843. [Google Scholar] [CrossRef]
- Jullien, B., & Sand-Zantman, W. (2021). The economics of platforms: A theory guide for competition policy. Antitrust in the Digital Economy, 54, 100880. [Google Scholar] [CrossRef]
- Kendall, G. (2024). Are open access fees a good use of taxpayers’ money? Quantitative Science Studies, 5(1), 264–270. [Google Scholar] [CrossRef]
- Kim, E., & Atteraya, M. S. (2023). A decade of changes in OA and non-OA journal publication and production. Journal of Librarianship and Information Science, 56, 09610006231179718. [Google Scholar] [CrossRef]
- Kohls, T., & Mager, F. (2023). Profitability and low-risk anomalies reexamined. Global Finance Journal, 56, 100776. [Google Scholar] [CrossRef]
- Larivière, V., Haustein, S., & Mongeon, P. (2015). The oligopoly of academic publishers in the digital era. PLoS ONE, 10(6), e0127502. [Google Scholar] [CrossRef]
- Lawder, K. E. (1989). Ratios 101: Back to the basics of financial analysis: The national magazine of business fundamentals. Business Credit, 91(6), 28. [Google Scholar]
- Ma, L. (2023). The platformisation of scholarly information and how to fight it. LIBER Quarterly: The Journal of the Association of European Research Libraries, 33(1), 1–20. [Google Scholar] [CrossRef]
- Magerakis, E., Gkillas, K., Floros, C., & Peppas, G. (2022). Corporate R&D intensity and high cash holdings: Post-crisis analysis. Operational Research, 22(4), 3767–3808. [Google Scholar] [CrossRef]
- McAfee, R. P., Mialon, H. M., & Williams, M. A. (2004). What is a barrier to entry? The American Economic Review, 94(2), 461–465. [Google Scholar] [CrossRef]
- Morrison, H., Borges, L., Zhao, X., Kakou, T. L., & Shanbhoug, A. N. (2022). Change and growth in open access journal publishing and charging trends 2011–2021. Journal of the Association for Information Science and Technology, 73(12), 1793–1805. [Google Scholar] [CrossRef]
- Mounier, P., & Rooryck, J. (2025). Federating Diamond OA in Europe and beyond: The European Diamond Capacity Hub (EDCH). Insights: The UKSG Journal, 38, 9. [Google Scholar] [CrossRef]
- Normand, S. (2018). Is diamond open access the future of open access? The iJournal: Student Journal of the Faculty of Information, 3(2). Available online: https://theijournal.ca/index.php/ijournal/article/view/29482 (accessed on 31 May 2025).
- Odlyzko, A. M. (2015). Open access, library and publisher competition, and the evolution of general commerce. Evaluation Review, 39(1), 130–163. [Google Scholar] [CrossRef] [PubMed]
- Orman, C., & Köksal, B. (2017). Debt maturity across firm types: Evidence from a major developing economy. Emerging Markets Review, 30, 169–199. [Google Scholar] [CrossRef]
- Padmalochanan, P. (2019). Academics and the field of academic publishing: Challenges and approaches. Publishing Research Quarterly, 35(1), 87–107. [Google Scholar] [CrossRef]
- Parker, G., & Van Alstyne, M. W. (2010). Two-sided network effects: A theory of information product design. Management Science, 51(10), 1494–1504. [Google Scholar] [CrossRef]
- Petrou, C. (2020). Guest post—MDPI’s remarkable growth—The scholarly kitchen. The Scholarly Kitchen. Available online: https://scholarlykitchen.sspnet.org/2020/08/10/guest-post-mdpis-remarkable-growth/ (accessed on 31 May 2025).
- Pinfield, S., Salter, J., & Bath, P. A. (2017). A “Gold-centric” implementation of open access: Hybrid journals, the “Total cost of publication,” and policy development in the UK and beyond. Journal of the Association for Information Science and Technology, 68(9), 2248–2263. [Google Scholar] [CrossRef]
- Piwowar, H., Priem, J., Larivière, V., Alperin, J. P., Matthias, L., Norlander, B., Farley, A., West, J., & Haustein, S. (2018). The state of OA: A large-scale analysis of the prevalence and impact of Open Access articles. PeerJ, 6(2), e4375. [Google Scholar] [CrossRef]
- Puehringer, S., Rath, J., & Griesebner, T. (2021). The political economy of academic publishing: On the commodification of a public good. PLoS ONE, 16(6), e0253226. [Google Scholar] [CrossRef]
- Ranasinghe, D. (2021). Managerial entrenchment, financial constraints, and investment choice in unlisted firms. International Journal of Finance & Economics, 26(1), 258–270. [Google Scholar] [CrossRef]
- Rochet, J.-C., & Tirole, J. (2003). Platform Competition in two-sided markets. Journal of the European Economic Association, 1(4), 990–1029. [Google Scholar] [CrossRef]
- Rodrigues, R. S., Abadal, E., & Hermes de Araújo, B. K. (2020). Open access publishers: The new players. PLoS ONE, 15(6), e0233432. [Google Scholar] [CrossRef]
- Serrasqueiro, Z. (2017). Investment determinants: High-investment versus low-investment Portuguese SMEs. Investment Analysts Journal, 46(1), 1–16. [Google Scholar] [CrossRef]
- Shu, F., & Larivière, V. (2024). The oligopoly of open access publishing. Scientometrics, 129(1), 519–536. [Google Scholar] [CrossRef]
- Singh Chawla, D. (2025). Invasion of the ‘journal snatchers’: The firms that buy science publications and turn them rogue. Nature, 641(8061), 15–16. [Google Scholar] [CrossRef] [PubMed]
- Solomon, D. J., & Björk, B.-C. (2012). A study of open access journals using article processing charges. Journal of the American Society for Information Science and Technology, 63(8), 1485–1495. [Google Scholar] [CrossRef]
- Yoh, N., Holle, M. J. M., Willis, J., Rudd, L. F., Fraser, I. M., & Veríssimo, D. (2025). Understanding author choices in the current conservation publishing landscape. Conservation Biology, 39(2), e14369. [Google Scholar] [CrossRef]
- Zarif, A. (2023). The economics of scientific publishing. The Yale Journal of Biology and Medicine, 96(2), 267–273. [Google Scholar] [CrossRef]


Disclaimer/Publisher’s Note: The statements, opinions and data contained in all publications are solely those of the individual author(s) and contributor(s) and not of MDPI and/or the editor(s). MDPI and/or the editor(s) disclaim responsibility for any injury to people or property resulting from any ideas, methods, instructions or products referred to in the content. |
© 2025 by the authors. Licensee MDPI, Basel, Switzerland. This article is an open access article distributed under the terms and conditions of the Creative Commons Attribution (CC BY) license (https://creativecommons.org/licenses/by/4.0/).