Abstract
Background: Replenishment process is one of the success factors for a more efficient management of operations and a regained profitability. The application of the principles of lean manufacturing in the field of industrial logistics, where substantial improvements in the replenishment process are necessary, is relevant with the objective of optimising the replenishment flow of raw materials from assembly lines in order to propose and implement robust solutions capable of mitigating or even eliminating all types of waste and maximising the productivity of value-added activities. Methods: To achieve this goal, the paper follows the spirit of the DMAIC (Define, Measure, Analyse, Improve and Control) and 5-Why methods that allow the mapping of internal processes of factory logistics in the particular case of a Wire Harness Automotive Plant. Results: Based on the data collected, as well as on specific analysis methods, simulations are launched to challenge and validate the improvements made to the replenishment process. Conclusions: Several generalisable lessons are learnt regarding replenishment flow management, covering topics such as inventory traceability, in addition to logistics costs and process flow optimisation.
1. Introduction
From a high-level perspective, the economy strives for the wealth of people, plants, groups, and the nation. The source of wealth is characterized by the transformation process and its competitive advantage to generate margins and added value (Chapman et al., 2017). For instance, Gulf countries are considered as the main sources of oil energy, but they are not among the dominant wealth forces in the world. On the other hand, as continued by Chapman et al. [], “Japan has very few natural resources and buys most of the raw materials it needs. However, it has developed one of the wealthiest economies in the world by transforming the purchased raw materials and adding value to them through manufacturing”.
To create wealth and added value, robust manufacturing processes are the central element in the productive transformation of materials. When they are applied properly, the processes become well controlled and improvements are observed in order to ensure a competitive position. The materials’ flows within manufacturing processes are notably the drivers and streams of any valuable transformation and, therefore, is one of the most important operations that could create efficient products in terms of quality, cost, and delivery.
The strategic position of Morocco allows Supply Chain Management and logistics to emerge widely, aiming to effectively link suppliers and customers. Flows of materials through the creation of huge ports, free zones, and other fiscal advantages make Morocco an interesting land of investment.
In this large context, the car industry is specifically a growing sector in Morocco, which gets a particular attention from the political and economic spheres. The establishment of car maker’s plants, automotive suppliers, and 3rd party logistics do contribute to the sustainable growth [,,] of the automotive ecosystem. In order to improve their quality, cost, and delivery, automotive suppliers support their business based on the functional principles of lean manufacturing and continuous improvement, while prioritizing innovation by being either radical or incremental [,]. Eliminating waste and increasing efficiency through optimising the internal logistics flows is one of the main lean manufacturing processes deserving of more attention. In order to improve the QCD (Quality, Cost, and Delivery) equilibrium [], which consists of improving the quality aspect of products and their underlying services, optimising costs and meeting delivery deadlines to customers, companies generally need to improve the process of replenishing components from the raw materials warehouse to the workshop in real time through various concepts. The following elements need to be considered:
- Optimising the distribution flows to different workstations.
- Elaborating an accurate replenishment cartography.
- Reducing inventory level of the Work in Process/Progress (WIP).
- Eliminating waste [].
- Smoothing the line feeding process flow:
- -
- To avoid erratic line stops.
- -
- To eliminate the stock take gaps.
- -
- To ensure traceability of material within the WIP processes.
- Standardising the feeding system flows.
The essence of the paper is meant to take into account the above goals, define bottlenecks, and draw solutions. The case of the Wire Harness Automotive Company (WHAC) will serve to draw the necessary lessons that can be generalised and deployed at the level of any other structure, according to a predefined methodological path. The state of the art relating to manufacturing and internal logistics is presented in Section 2, then the methodology (Section 3) adopted to respond to the problem raised taking into account the case of the plant. Following this, respectively, in Section 4, Section 5 and Section 6, is a description of the data collected, an introduction to the FlexSim program, the implementation of optimisation and simulation models of factory flows, and then an analysis and discussion of the results highlighting the lessons (Section 7) endorsed throughout the combined DMAIC-5 Why process. Traceability of products, productivity of line feeders, and the organisation of teams are some of the elements of analysis that came from the simulation results. Section 8 concludes our study and opens the way to some areas for improvement in the management of plant replenishment flows.
2. Literature Review
Manufacturing refers to an industrial production process by which raw materials are transformed into finished goods, taking into account in particular the physical flows between the factory warehouse and its workstations. Warehouse management, internal logistics planning and control, and production are gaining importance and are highly interfaced and interdependent, which could help increase the performance of factory operations. Plants must also manage several aspects of inventory management, which involves replenishing, storing, tracking, and prioritising stocks []. These integrated problems and their coordination with each other have caught the attention of many researchers [], including those using simulation optimisation methods (sim-opt), whether the decision variables considered are discrete or continuous. Lacksonen [], Yokohama [], Chen [,], Kleijnen [], Shukla et al. [], Taleizadeh et al. [,], and Wong et al. [] compare different sim-opt methods, while [,] both compare and combine sim-opt methods to agree that the combination of methods generally better reflects reality. On the other side, internal logistics is essential in creating value and maximising profits by rationalising the physical flows between the main blocks of the factory (warehouse, storage locations near the production workstations, and assembly line). Based on the warehouse and production layouts, defining the number and location of the storage locations as well as aisle hallmarks [] and arranging machines, tools, and equipment on the shop floor to improve manufacturing performance in terms of operations and throughput times [] are fundamental and condition the plant’s productivity. The “warehouse/storage location operations” sub-dimension captures different alternatives encountered by the operator during order preparation. For example, it determines the number of workers picking the orders in the warehouse [] and whether or not a capacity constraint has been defined for the operator in terms of weight or number of items [,]. If multiple order pickers work at the same location, a bottleneck can occur, which can lead to wait times [] that add no value.
Considering the production control strategies, different approaches exist and are classified as push, pull or push/pull systems [,,]. Zheng et al. [] discuss three modes of control for the pull production strategy including the Kanban framework for whom one of the objectives is to minimize WIP while producing only those products which are needed and avoiding shortages. If an item is out of stock, demand can be backordered or is lost. Shortages most commonly arise in the production context [,,], deteriorating the customer service level with possible impacts on machines interruption, maintenance, rework, and quality.
Taking into consideration the above factors and their inherent variables, the article tries to optimise, in the specific case of WHAC, the circulation of the physical flows of materials [] from a central warehouse to the production lines according to a systems logic aimed at rationalising movements to maximise profits, in particular by reducing WIP and reorganising the plant [] following various simulations. To the knowledge of the authors, this is one of the few publications dealing, in a homogeneous whole, with the integration of the different facets of the holistic management of component replenishment flows at the scale of a complete plant comprising at least one central warehouse and several assembly lines.
3. Wire Harness Production
3.1. Presentation of the Company
The Wire Harness Automotive Company (WHAC), which has, worldwide, more than 280,000 employees, was initially a family business established in 1929. Since 1941, it has grown into a company and is currently one of the leaders in the automotive industry. Present in 45 countries, the company globally consists of 170 subsidiaries, 476 units divided into production plants, customer service centres (CSC), and technical and technological centres.
With its high-quality standards and cost reduction rates, the Corporation serves companies including Mercedes, JLR, PSA, Nissan Motors, Fiat, Toyota, Ford, GM, VW, BMW, and Renault.
In 2001, Morocco was the first African country in which the Wire Harness Automotive Company launched a first factory and consistently increased its footprint in different cities to reach nowadays 5 plants. The intention behind the creation of these plants was mainly to substantially penetrate the European automotive market, in particular in order to equip Renault vehicles. The core business activity of WHAC remains manufacturing of the automotive cable harness for the Renault customer.
3.2. Manufacturing Process of Wire Harness
3.2.1. Wire Harness
The main functions of a car harness manufacturer are to power safety and comfort equipment. A wiring harness is considered a link that communicates information to the computer, integrating more and more electronic data into the car. Indeed, electrical harnesses in the automotive industry mainly focus on defining their architecture, which can be very complex and must take into account a variety of constraints. This product is composed of a set of electric wires, terminals, connectors, and plastic protectors. It is divided into several parts and product families related to each other in order to cover the power supply and distribution of electricity and data to all car components (engine, body, rear, roof, doors…).
3.2.2. Manufacturing Process
The manufacturing process follows the reception of raw materials, cutting, pre-assembly, assembly, packaging, and delivery phases.
Figure 1 illustrates the end-to-end flows in a value stream mapping [,]. The process starts by the customer order (coming from the Customer Service Center-CSC in the Figure 1) received at on the basis of a 6-month forecast horizon. In this framework, an electronic transmission of data (EDI) is updated daily. Through the forecast of the orders, issues the procurement plan of components to suppliers. After 4 weeks, the components are received and stored in the warehouse. For a good performance, the plant needs to ensure an inventory level of 13 days on the average in order to absorb the possible fluctuations coming from customers, while a substantial effort needs to be made for reducing the stock based on a properly sized push–pull approach [,,]. As indicated in Figure 1, the manufacturing process currently takes an average of 1.7 h (6134 s) for the whole process, from assembly to shipping. At the level of the sawtooth line, the assembly step requires 3876 s, namely a cycle time (CT) of 3.23 mn/worker times 20 workers, the changeover (CO) being equal to 0. The other consuming time phase is the clip checking requiring 1242 s. The first pass yield is equal to 79%, which remains improvable.
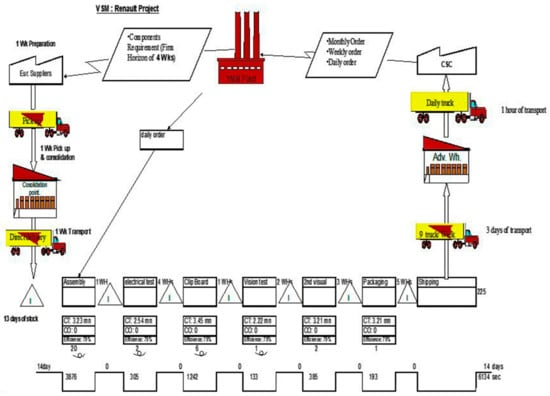
Figure 1.
Plant’s end-to-end flows (source: WHAC).
Other than the external flows shown in the Figure 1 (information flows from customers to the WHAC plant, then from the plant to the suppliers, and physical flows from the suppliers to the WHAC plant and from the WHAC plant to the CSC via the advanced warehouse), the details of the internal ones (internal physical flows) are described hereinafter.
Reception of Raw Materials
The raw materials coming from suppliers are initially consolidated according to an hourglass scheme to save transportation costs. Later, once the truck arrived at the plant, it is unloaded and separated by material groups for making goods receipts in the system. A sample check is done by quality inspection before the raw materials are stored in the central warehouse.
Production
The production process is divided into three steps, namely the cutting, the pre-assembly, and the assembly.
- ○
- Cutting
Cutting is the first step in the production process of a wire. It consists of cutting the electrical wires, depending on the length desired, by automatic cutting machines. These machines also perform the stripping of wire, setting terminals as well as inserting seals.
- ○
- Pre-Assembly
Once cutting is completed, the 2nd step consists of joining different wires to each other, performed in several operations processes and depending on each semi-finished good:
- -
- Manual Setting: it is not possible sometimes to set the terminals to the edge of the wires automatically by the machine; therefore, this operation is occasionally done using manual presses.
- -
- Twist: Twisting two wires ensure their protection from magnetic fields.
- ○
- Assembly
The assembly is the final step, a process which groups all the components and semi-finished goods in order to get the final product, the wire harness.
Wires generally pass by four steps during the assembly: The insertion, the ultrasound welding, the wrapping, and the inspection. Each one of these steps includes various operations depending on the nature of the wire.
- -
- The Insertion: This step consists of inserting, manually and respectively, the terminals in their connectors. In order to help operators, sub-assembly schema is displayed on each workstation.
- -
- The Welding: This operation serves to weld the edges of stripped wires in order to realise a pairing using an ultrasound machine that applies precise strength and vibrations during a pre-defined time.
- -
- The Wrapping: This operation consists of covering the wires with ribbons and protectors.
These three steps are realised on tables called JIGs [].
- -
- Inspection and Testing: These operations consist of testing the wire harness in an essay machine that helps to detect electrical shortcuts and to check the presence of connectors thanks to integrated sensors. Then, the final wire harness goes through a compulsory visual test to check certain dimensions. Two other workstations for testing are:
- ○
- Clip checker: This device makes it possible to check whether each clip is used in its correct position. Clips are used to gather and fix the wire harness in the car chassis.
- ○
- Packaging: Each finished product has a label with a barcode. The product is placed in a plastic bag, packed in boxes, and delivered to the shipping area.
Expedition
The expedition is about the “finished goods” area where all boxes from different products and families are gathered together. In this step, products are sorted by destination.
3.3. Problem
After a diagnostic of raw materials distribution to the production lines and workstations, an improvement plan is required for the following:
- Buffer stock of raw materials and subassemblies are kept in different locations within the production lines and workstations. This organisation involves a non-optimised inventory level due to the existence of the same components in different locations.
- The 2nd set of improvement is that the production lines are stopped due to the method used for the replenishment of the raw materials despite the high level of inventory. When the production operator does not scan the consumed material, the system does not send any signal to the warehouse operator to prepare the goods. This non-synchronization between the WIP buffer stock and the central warehouse leads to repetitive stoppages of the production lines, resulting in hidden costs due to non-productive time.
On this basis, the objective sought consists of:
- -
- Reducing the inventory in the WIP.
- -
- Putting in place a lean replenishment flow.
4. Methodology and Methods
4.1. Adopted Approach
Most effective projects are based on the methodologies adopted to make a close follow-up with defined goals. Restructuring methods were investigated following discussions with top and middle management, as well as with operators. Taking into account the sine qua non constraint of non-stopping production, continuous improvement tools have proven to be the most appropriate instead of the total process reengineering [,] approach.
This was followed by the use of the Kaizen concept and the DMAIC approach of the Six Sigma methods family [].
4.2. Kaizen Concept
The word ‘Kaizen’ means continuous improvement. It is a lean manufacturing approach that may contribute to improve flow management in a quick way. As a Japan transnational, the Kaizen culture within the company already exists, making it easy for the project to be successful. Kaizen activities concern all employees of and the culture against waste. These are achievements that help to robustly promote interactions between the value and supply chains of the plant, favouring cost reduction.
For a good monitoring of structuring projects, the DMAIC method is used to dig into more details in order to define the root-causes, analyse the variables, propose solutions, put in place a particular one, and control it by checking its efficacy. Through a deep analysis, a modelling of the physical replenishment flows is performed as well as simulations of the chosen solution.
4.3. DMAIC Method
Every manufacturing plant has problems, or rather opportunities for improvement. These issues are solved through certain methodologies depending on the complexity of the situation and the appropriation of the potential tools to be used. Methods can be instructed by plant strategy management; others are offered by employees or contractually imposed by customer specifications.
Among these methods, seven are most often used, namely the Deming cycle, the Eight Discipline (8D) methodology, the Kaizen, the Appreciative Inquiry, the Kepner-Tregoe Decision analysis, the lean Six Sigma (including the DMAIC approach), and the 5-Why methodology.
To accurately structure the problem identified and put in place a robust solution, the DMAIC approach is chosen as a method for improving existing processes and focusing on internal customers. Thanks to its five structured and interdependent phases [], we can more easily solve one of the most difficult challenges; that is, the selection of the appropriate problems to solve, belonging to one or more categories as follows:
- -
- Conformance issues defined by the unsatisfactory performance of a well-specified system.
- -
- Efficiency issues, resulting from unsatisfactory performance from the standpoint of stakeholders.
- -
- Unstructured performance problems, resulting from unsatisfactory performance by a poorly specified system.
- -
- Product design problems, involving the design of new products that better respect the expectations of customers that matter most to them.
- -
- Process design issues, involving the design of new processes or substantially revising existing ones.
Therefore, following the DMAIC approach, the Six Sigma concept has come to mean a generic quality level of no more than 3.4 defects per million opportunities, or almost zero defects.
Combining the 5-Why methodology and the DMAIC method, the analysis generated allows us to:
- -
- Assist problem solving teams by providing a framework to ensure that data-driven decisions are conducted, ensuring the robustness of the solution.
- -
- Use the DMAIC 5-Panel as a flexible format that can be shared by all manufacturing plants.
- -
- Propose a consistent and concise communication means to management.
5. Data
5.1. Data Collection
This section gives the context under which the project critical path is analysed. Schematising the current flows of the existing buffer stock in different locations will help to move forward in order to identify sustainable solutions. The 5-Why methodology contributes to a clear definition of the current issue (Table 1).

Table 1.
The problem broken following the 5-Why.
The 5-Why methodology emphasizes a set of root causes to the dysfunctional process, grouped in the following general points, namely the replenishment flow and the different storage locations. For a better understanding of the replenishment flow, Figure 2 illustrates the existing process steps between the buffer stock in the production shop floor and the warehouse.
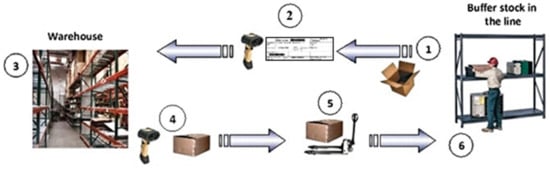
Figure 2.
Flows between the warehouse and storage locations.
The complete cycle loop of materials’ movements between the warehouse and the buffer stock starts with a trigger on the empty box and ends by fulfilling it.
- Bin in the buffer stock become empty.
- Scan the “empty Kanban” to create material reservation in the system for the warehouse.
- According to the FIFO (First In, First Out) concept, the system proposes a box to be picked.
- Scan the box for confirmation—this refers to the Kanban signal and made the box full.
- Bring the carton box physically to the empty bin on the buffer stock.
- Fulfil the empty place on the buffer stock.
From the other side, direct flow from the warehouse to the production lines is not recommended. It is a prerequisite determined by suppliers, customers, and plant standards to keep complete closed boxes inside the warehouse for good quality of components. This helps to avoid:
- -
- Damaged components, as they can fall out of boxes.
- -
- There is a risk that dust may be at the origin of electric shortcuts in case components are affected.
- -
- The Enterprise Resource Planning (ERP) system cannot handle incomplete boxes.
For all these reasons, flows between the warehouse and the storage locations must be maintained and the same components must be delivered from the warehouse to both storage locations.
The yellow captions on the Figure 3, called the Kaizen burst [] in the usual jargon of the VSM (Value Stream Mapping) method, are identified as opportunities of improvement for the XFB product in this case. This is summarised in the following three points:
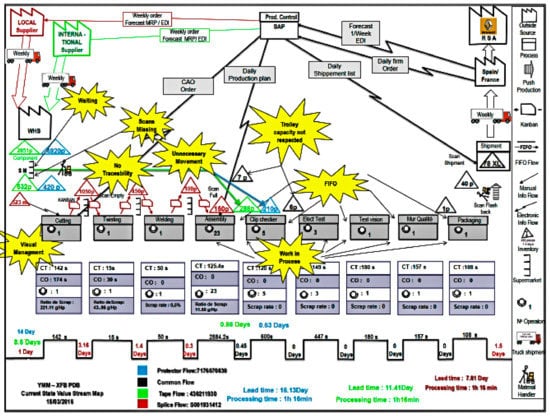
Figure 3.
Value stream mapping of the current status (source: WHAC).
- Lead-time: there are components that can go through the manufacturing process in nine working days, whereas others have a very short lead-time. This leads to constraints on the stock levels specific to each of the components. These unbalanced processes create a lot of inefficient movements of operators or lead to their reconciliation with buffer stocks.
- The high level of inventory is also one of the dysfunctionalities that must be fixed. Two dimensions need to be investigated.
- ○
- The number of storage locations in production: since we have two storage points, we indirectly create too much inventory in the WIP.
- ○
- Calculations of the net demand to suppliers do not consider the WIP inventory. Most important to notice is that the ERP system cannot handle open boxes and so this inventory is somehow ignored. Since the inventory in WIP is not part of the calculations, it leads the system to order more materials from suppliers. This increases, once again, the stock level in the whole plant.
- The Kaizen approach helps eliminate useless movements and waiting times, and helps achieve continuous improvement in visual management and on the discipline of the scan during physical movements as well as the traceability between the processes.
Based on an analysis of the flow management within the factory, delays in the line feeding system are one of the major failures, contributing to 50% of assembly line stops (Figure 4).
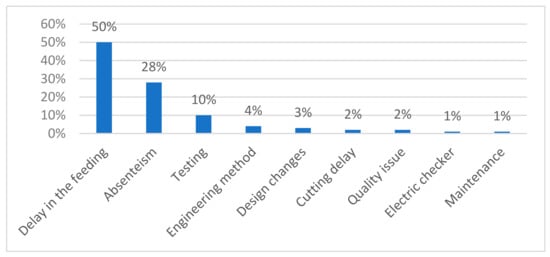
Figure 4.
Causes behind the assembly line stops.
The 5-Why methodology is launched to understand the root causes that lead to the delay in the line feeding process. During a one-week observation, the conclusion about the main root-causes is:
- -
- A lack of components: the trigger of the order to the warehouse is interrupted by missing scans of the consumed products in WIP storage locations.
- -
- Operators take different routes to complete replenishment, causing delays.
- -
- The type of the trolley used does not help to optimise the quantity of products in a trip.
- -
- The Kanban boxes used do not respect the proper timing for the operator to make the round trip. As the operator returns to fulfil the boxes, the line is already stopped.
- -
- There is poor communication between production operators and line feeders.
A time study (Table 2) was carried out during the follow-up of line feeding at all the stages and processes traversed by an operator.
Table 2.
Time study for line feeding.
Table 2 introduces all tasks made by an operator in order to fulfil the assembly lines. Nonetheless, a waiting time always occurs when the line feeder does not find the reference in the shelf where he needs to pick up the boxes. He has to wait for another operator to come to the warehouse to bring that required item, or even set of items. There are also abnormal flows where the operator is moving the buffer stock not with a trolley, but with an urgent box to be filled. This action induces a delay and, most of the time, the shortage of another component. This situation stresses the operator to move again and again.
We deduce two main categories related to the performance of line replenishment:
- -
- Value-added operations: these are operations that are directly involved in the creation of an added value in the product.
- -
- Non-value-added operations: this is an intermediate step, sometimes necessary for the implementation of the next operation, but not essential for the mission of the line feeder.
In conclusion, 57% of the operator workload is no more than Mudas []; they need to be eliminated in order provide the possibility of occupying the operator with added value tasks.
5.2. Data Analysis
The analysis focuses on two structuring categories, namely the inventory level and the waiting Muda.
5.2.1. Inventory Level
To analyse the different variables in the shop floor, a WIP detailed study is required to estimate the losses related to the defined inventory level by calculating the difference between the daily requirement of components and the existing days of inventory. For example, Table 3, representing a set of items from 874 components, shows the number of times an item is used for in the 10 product families.
Table 3.
Component usage within product families.
Penetration is defined as the number of times a component is used for finished goods or a family product. Once the penetration of each component in a family is determined, Equation (1) is used to calculate the daily needs.
with:
- -
- yj = Daily Needs on Component j
- -
- C = Daily Capacity for Component j regarding Each Family Product
- -
- i = Family Product (out of the 10 family products indicated at the top of the Table 3)
- -
- Pj = Penetration of Component j
Based on Equation (1), the difference in terms of days between the daily consumption and the available stock is significant for 549 components, whose coverage is between 2 and 35 days with an average equal to 12.67 days, whereas the required stock target is 1 day maximum. A sample of results is represented in Table 4 in the knowledge that calculations have been done over the entire 874 components.
Table 4.
Comparison of daily consumption to available stock.
As a summary, this poor feeding system generates high financial costs. An action plan allowing, among other things, to better evaluate the Takt time [] and to avoid overstocking and activities without real added value [], must be put in place in order to ensure a precise balance between the needs of the assembly lines in raw materials and what to have in the buffer inventory.
5.2.2. Waiting Muda of Line Feeders
The waiting Muda is the entire time of non-value-added operations [,]. Following field observations, one can deduce that an operator loses on average 46.7% of its operating time (equivalent to 3 h 58 min) just in waiting, both in the production line and in the buffer stock. It is the sum of an operator’s idle (25.7%) and waiting (21%) durations (Figure 5).
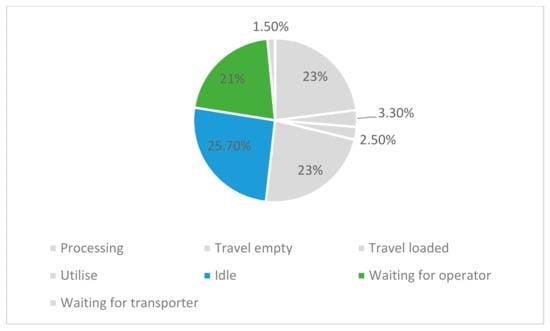
Figure 5.
Line feeding operator performance.
At this stage, a strong opportunity is there to optimise the workforce for this process. It is necessary to modify the process and determine the impact. A follow-up study of the operators to understand the existing issues and then to improve the distribution is carried out. The results are presented in Table 5.
Table 5.
Distribution of line feeders.
It highlights that there is no balance in the cycle time of the operators both in terms of the distances travelled and the number of components transported. For example, operator number 1 moves 33 m with 102 components, returns and also takes 96 m for 135 components. If we compare operator 1 to operator 4 (Table 5), the latter is very busy. The same comparisons for other carriers show huge gaps regarding the distance and the capacity. The distance between the buffer storage area and the production line, as well as the number of components supplied, indeed show an unbalanced workload within the line feeding operations.
Based on the root causes depicted, the following sections focus over structuring macro-actions to be deployed for being able to propose robust solutions, namely the consolidation of all raw materials in one area, the creation of an optimised route, and the use of a standard workload for the assembly line replenishment, while using a simulation method.
6. FlexSim Simulator
Simulating a process is a form of designing it as it is in the real world, tackling the strong constraints of the physical and information flows. In a comparative study prepared by Abu-Taieh and El Sheikh [], they show that simulations are being applied in different sectors and particularly in manufacturing systems, supply chain management, and business processes.
There are many simulation tools in the operations domain; each of them is specialized for some aspects and/or have modules more adapted than others in model building, interactive debugging, design view, animation, distribution fitting, design experiment, interpretation of data, output analysis, and transfer/receipt of information when it comes to communication with other programs.
Among these tools, three are the most used, namely Arena, AnyLogic, and FlexSim, that are well specialised in manufacturing and supply chain management. The typical applications of each of the three software are shown in the Table 6.
Table 6.
Simulation software comparison.
The FlexSim simulator is chosen taking into account the following criteria:
- -
- FlexSim is a simulator with a certain flexibility, offering the possibility to simulate and model any process, in addition to its strong characteristics of optimisation.
- -
- It is used mostly for material handling and warehousing more than the other competitive software, which was the dominant criterion for having chosen FlexSim.
Moreover, in addition to be able to consider simultaneously different alternatives/solutions, the program allows the launch of several analyses of processes and helps choose the most relevant one. FlexSim is able to handle different situations such as:
- -
- Visualising the bottlenecks.
- -
- Identifying the inventory caused by over-production and over-processing.
- -
- Analyses of new concepts highlighting some parameters linked to the productivity.
- -
- Evaluation of operational decisions regarding lean processes and materials transfer.
7. Results and Analysis
7.1. Consolidated Supermarket
7.1.1. Space Optimisation
The plant contains two storage locations with the following dimensions: 349 m2 and 347 m2. It can be clarified that the so-called “components supermarket” is inside the production workshop and occupies a productive space likely to accommodate new projects. Additionally, components are initially duplicated in the two locations, involving a double storage and increasing the WIP stock level. This organisation also leads to having two flows of raw materials to production; hence, a multiplication of efforts and a lack of optimisation because operators have to transport the same components to different places.
To avoid stock in multiple locations inside the shop floor, it is proposed to create a consolidated area where the open boxes, subject of transformation, can also be stored.
The question that rises immediately is how we can free space inside the warehouse and what the implications are in terms of physical flows.
7.1.2. Simulations Regarding the Consolidated Supermarket
Simulations of the consolidated supermarket flows using the FlexSim program may give substantial improvements and could help to size the most optimal process. Different simulations with sensitivity analyses are run.
The supermarket layout contains 4 racks: A, B, C, and D. Each rack is composed of:
- -
- 13 bays with 1.40 cm width;
- -
- 4 levels with a height of 0.65 cm each;
- -
- a capacity of 104 boxes for each rack that represents 1.5 days’ consumption;
- -
- Rack D is used for high runner items where production replenishment is done from the supplier’s complete original packaging. Racks A, B, and C are used for open boxes distributed to the lines by a returnable plastic box in a trolley.
Each line feeder is responsible for 2 trolleys, returning the trolley empty and picking the full one. The cycle time of a trolley to be fulfilled is 30 min. Two operators each work 7.67 h, excluding a break of 20 min. They fill empty locations in the consolidated supermarket with boxes coming from the warehouse. The scan of empty boxes is the trigger signal towards the warehouse in order to process the demand. Operators also fill the trolleys with the required components for production. Each operator has one scanner that is used to make replenishments from the warehouse.
With the above features, FlexSim simulates the process flow for one working day (equivalent to 460 min), resulting in operator productivity rated at 98.1% (Figure 6). The remaining 1.9% represents the idle capacity, which is linked to the waiting time observed at the start of the shift, at the warehouse level. Looking at the results, operators use 51.5% of empty travel time, which is an operation without added value that should be optimised. It can also be observed that the operators transport the articles from the picking area of the warehouse to the shelves of the supermarket, box by box, which is far from being efficient.
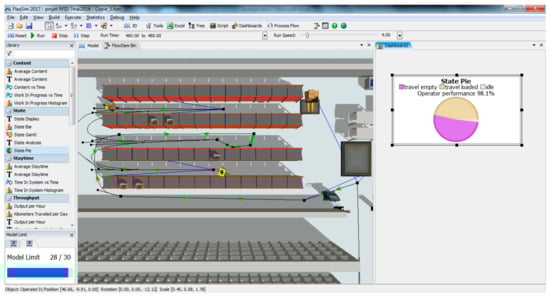
Figure 6.
Operators’ performance using boxes.
The need to move with a full loaded pallet from the warehouse picking area to the consolidated supermarket could be an optimised solution. To check the performance of this proposal, simulations are run, using two operators as follows:
- -
- 1st operator moves the loads box by box.
- -
- 2nd operator moves loads using a pallet with a capacity of 15 boxes (standard capacity of a pallet).
Figure 7 gives the result of the simulations using pallets.
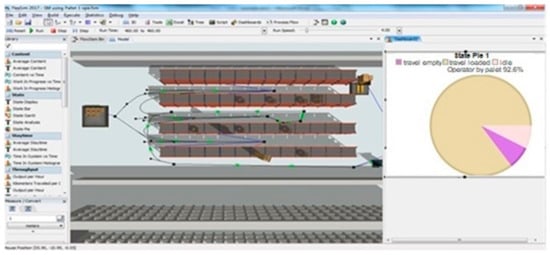
Figure 7.
Operators’ performance using pallets.
The operator performance is higher than in the case operating box by box. The travel loaded represents 87.5%, meaning that one operator is able to move 122 boxes alone during the shift, instead of 139 boxes with two operators. Therefore, for a regular shift of 139 boxes, only 1.14 operators are needed. The empty travel counts for 5.1%, which is significantly reduced compared to the box by box travel scenario. Idle time represents 7.4%; an increase due to the fact that operators are waiting for a full pallet.
To reduce this last ratio, an alternative solution is proposed consisting in creating three pallet locations. The supermarket operator has the possibility to use two additional slots for well-sorted pallets; one position is kept for the high runner parts stored in one rack; the two others are dedicated to the remaining three racks.
Consequently, the following figures are achieved, using FlexSim simulations.
- -
- Travel loaded: 89.2%;
- -
- Travel empty: 5.4%;
- -
- Idle time: 5.5%.
This 3rd scenario remains the best one, allowing operators to manage other tasks during the time saved.
7.2. Line Feeding Process
7.2.1. Description, Measurements, and Paths Configuration
The line feeding process represents the flow of material moving from the consolidated supermarket to the production lines for the purpose of their replenishment based on a pull system.
The methods of inventory ordering techniques as listed by Ross [] are diverse. They all answer the following questions:
- -
- What is the demand?
- -
- What are the currently available articles?
- -
- What is on order?
- -
- What will need to be ordered?
- -
- When do orders need to be released?
- -
- How much should be ordered?
The manufacturing environment and its constraints define the proper replenishment method. The most used methods are as follows:
- -
- Visual Review System: this method focuses on a visual check of the physical inventory to reach the minimum required quantity that triggers the demand. In other words, when there is one pallet remaining, a demand is triggered to supply another one. In this case, one pallet is the minimum stock level and two pallets are the maximum stock levels. The advantage of this method is its simplicity and does not require any software or high training level of the employees.
- -
- Two-Bin System: this is a fixed ordering flow where the inventory is controlled through two bins. One bin is located in the workstation area, while the other one is in the picking area. Practically, the bin in the workstation area is used as full, while the bin in the picking area is empty. The empty bin is the trigger of the replenishment demand.
- -
- Periodic Review: it is a fixed review timing system and tends to make replenishment on a regular and deterministic cycle. The main advantage of this method is that it can be used without a computer-based solution.
- -
- Order Point: it is the minimum quantity for which the order is placed to make the replenishment. This method requires a close follow-up of consumed quantities, generally through an ERP.
Considering the four replenishment systems defined above, the two-bin method remains the best replenishment one in our case because the demand in terms of production lines is stable and the system is intrinsically simple to apply, easing the inventory control.
However, it is not only a matter of transporting the raw materials from place A to a place B, but it is about a complete study, taking into consideration variables such as the timing, the quantity, the route, and the physical flows.
- -
- The timing: the time to pick up the full and empty bins.
- -
- The quantity: the quantity to be transported to the production lines.
- -
- The route: it is about the optimal route to consider.
- -
- The physical flows: how are materials stacked and what is the chosen frequency?
In order to improve the replenishment process based on the consolidated supermarket concept, the following actions need to be executed:
- -
- Identify all the necessary components in the workstation.
- -
- Identify the quantities needed by a component.
- -
- Identify the type of container
- ○
- Plastic bin;
- ○
- Original packaging.
- -
- Design the workstation in accordance with the rules of ergonomics.
- -
- Implement the two-bin concept.
The above points are taken into consideration during the line feeding process, FlexSim simulations being based on:
- -
- Standardising the line feeding process
- -
- Defining the number of operators required
- ○
- Define the preliminary routes of line feeders;
- ○
- Standardise the in/out trajectories for each assembly line.
- -
- Adopt and execute the visual management technique for the raw materials flows
- ○
- Checklists
- ○
- Specific colour by location of the raw materials.
To define the standard process flow of line feeders, the optimal number of operators needed to perform the tasks supplying the components to the production lines is determined in the first step. We start by calculating an operator’s cycle from the consolidated supermarket to the production lines and back. By adopting this method, we have taken a margin of error factor of 5% as our assessment of the worst-case scenario capable of ensuring reliable calculations. This margin of error is notably intended to take into account the operator execution speed.
Each line feeder is at the same time delivering the fast-moving items (within original boxes) and the components in the Kanban plastic boxes. It is also important to mention that this Kanban cycle methodology is the outcome of Equation (2):
with:
CycleT.line F = CycleT.comp + CycleT.HR
- CycleT.line F: total cycle time of the line feeders
- CycleT.comp: cycle time to supply components using the Kanban bins
- CycleT.HR: cycle time to supply High Runner (HR) parts
The cycle time used to supply components in the Kanban box is composed of two main operations, namely:
- -
- Collect the empty Kanban bins in the production lines.
- -
- Replenish the full Kanban bins using:
- ○
- The scan of the empty Kanban bins;
- ○
- The scan of the full Kanban bins with components.
Therefore, as shown in Equation (3):
with:
CycleT.comp = Time.collection + Time.line feeding
- Time.collection: time to collect the Kanban bins from the production line
- Time.line feeding: time the operator makes distribution of the components to the workstations.
Measuring the total cycle time for all the production lines, which is equal to 501 min 6 s, and setting the replenishment time to 230 min per shift, excluding break, the number of operators is 2.18, namely 3 operators are required.
According to the calculated cycle time, the work of the operators is grouped, for greater efficiency, by product families through the definition of zones, taking into account the following criteria:
- -
- The number of components supplied to each product family;
- -
- The synergies between the same product families in different projects;
- -
- The distance to the consolidated supermarket;
- -
- The timing balance between all the operators.
7.2.2. Simulations
Replenishment Inside the Consolidated Supermarket
The flow starts when the line feeder brings the trolley with empty boxes to the consolidated supermarket. The operator puts it in an empty dedicated footprint and picks the trolley with full boxes for distribution to the lines. Another operator working in the supermarket picks the empty trolley and starts to fill the boxes; the picking is made manually with the operator moving through the racks. This process flow is simulated using FlexSim to optimise it.
Simulations of the Supermarket Operator Performance
Following the FlexSim simulations, Figure 8 shows the results of the 1st scenario consisting of an empty displacement output of 8.8% accumulated during the working time shifts equal to 460 min per day, i.e., a total loss of 40.48 min. This is due to the operator’s movement to pick the empty trolley and it represents 2.89 min per trip. Therefore, the simulations highlight that the operator can only make the replenishment of 14 trolleys instead of a maximum of 15.35, which represent a 91.2% performance increase, as shown in Figure 8.
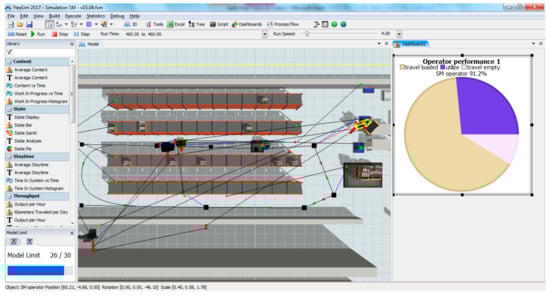
Figure 8.
Performance of the supermarket operator (scenario 1).
In more detail, the overall performance of an operator in a cycle is subdivided into:
- -
- 64.7% as travel loaded, which is the operation when the operator picks the empty trolley and moves between the racks in order to fill the boxes.
- -
- 26.6% as the “utilize” mode, which is when the operator is picking the components and puts the required quantity in the boxes.
- -
- 8.7% for travels empty, which refers to the time when the operator moves to pick the empty trolley.
In a second scenario, the concept of colour coding (coming from the visual management technique) is introduced to facilitate management control. Based on this, different colours have been used for efficient management of racks and plastic boxes in the supermarket. Indeed, thanks to the colours that make it possible to match boxes and racks, it becomes more relevant to accompany the operator in order to better focus on the right picking area for the item sought. The empty boxes on the trolley are also sorted by colour in order to prevent the operator from making unnecessary round trips.
In a time study after implementing the colour coding concept, the average time of use and travel under load improved by 2.5 min for every 30 min cycle. Consequently, this field observation must be corroborated by simulations (Figure 9).
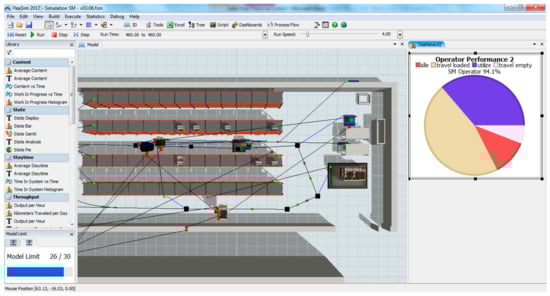
Figure 9.
Performance of the supermarket operator (scenario 2—color coding concept).
The 2nd scenario shows an overall performance of 94.1% during a cycle instead of 91.2% in the 1st scenario. This improved performance is subdivided as follows:
- -
- Travel loaded is reduced significantly from 64.7% to 49.1%. This proves that the colour coding helps the operator to move efficiently without substantial returns; the operator strictly follows the work sequence from one area to another.
- -
- While reducing the travel loading time, the “utilize” step as the central activity of the process increases from 26.6% to 38.6%.
- -
- Idle capacity is evaluated to 12.3%, which represents the free capacity generated from the colour coding concept introduction. This means that we free up the time of the operator by 56.58 min (460 min/day × 12.3%) implying that we may give other tasks to the operators of the warehouse in order to be fully occupied.
Simulations of the Line Feeding Process Flows
Two kinds of travel are performed during a cycle time by a line feeder:
- -
- A 1st trip with components in returnable boxes placed in the trolley.
- -
- A 2nd trip with components in the original supplier packaging (volume or high-runner items).
To simulate the line feeding process flow, it remains important first to visualise it in accordance with the consolidated supermarket (Figure 10).
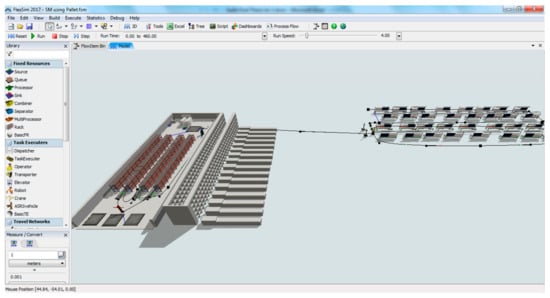
Figure 10.
Supermarket and line feeding overview.
When the operator working inside the supermarket fills the trolley, the line feeder picks up the full one to feed the production lines. The capacity of the trolley and the performance of the operator remain the key elements in this flow, the capacity of the trolley being:
- -
- 4 h consumption.
- -
- 200 Kanban bins.
The delivery plan to the production lines is made two times per shift in order to ensure the four hours consumption as a minimum inventory in the production line due to the required time to prepare the raw materials inside the supermarket.
This is calculated to guarantee the Kanban cycle of:
- -
- 4 h consumption of empty boxes moving to the supermarket.
- -
- 4 h consumption of full boxes used in the production lines.
Based on the above-described flows, FlexSim simulations are run for the optimisation of the movements. The production lines under simulations are located outside the consolidated supermarket, in a distance of 270 m, which is the average distance travelled by an operator. By running simulations, an overall performance of the line feeder is estimated to be 90.2% (Figure 11).
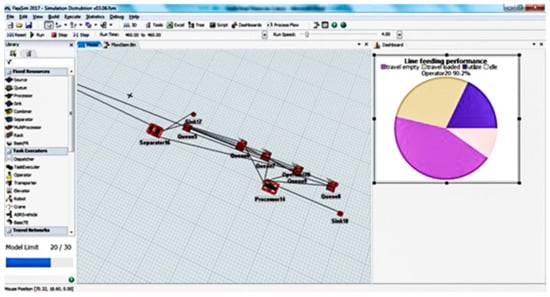
Figure 11.
Line feeding performance-based scenario.
The simulated performance is decomposed into:
- -
- 44% for traveling empty from production lines to the consolidated supermarket;
- -
- 28.4% for traveling loaded, which refers to the delivery of raw materials on the trolley from the supermarket to the production lines;
- -
- 17.8% in the “utilize” mode, which represents the operations of putting in place full boxes on the lines and picking the empty ones;
- -
- 9.8% as the idle time that is the theoretically free capacity; the operator is waiting for the trolley to be fulfilled.
A certain room for improvement exists and the process needs to be challenged.
Sensitivity Analysis of the Line Feeding Process
A certain number of items are distributed to production lines in their original boxes as opposed to more commonly used ones that are arranged in returnable boxes. In the absence of returnable boxes to trigger replenishment, operators resort to a hand-written list, showing the items required and the quantities needed. As a result, the operator of the consolidated supermarket is easily misled, with some likelihood of preparing wrong items and incorrect quantities, which creates delays and waiting times for the line feeder to gain the raw materials.
Consequently, a predefined pick list containing all the components to be supplied has been developed in order to facilitate and secure communication between the two groups of operators, namely the line feeders and the pickers at the consolidated supermarket level. In a time study carried out, operators increased their chances of avoiding any type of misunderstanding and/or misinterpretation and saved up to 11 min to prepare the goods.
FlexSim simulations are run based on this improvement. Figure 12 presents the results obtained.
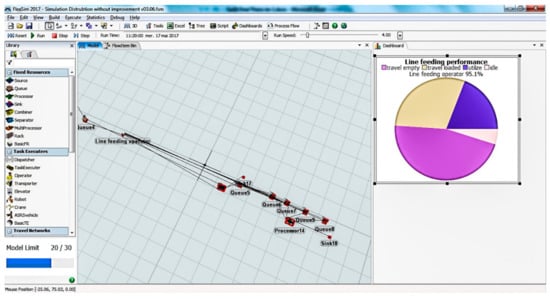
Figure 12.
Line feeding performance—improved scenario.
The simulations show an overall performance of 95.1% for the improved scenario instead of 90.2% for the previous one.
The line feeding process performance shows for this improved scenario:
- -
- An idle capacity of 4.9% per shift instead of 9.8%, i.e., a net gain of 22.54 min;
- -
- 46.2% travelling empty compared to 44% previously achieved;
- -
- 29.8% travelling loaded instead of 28.4%;
- -
- 19.1% in the “utilize” mode instead of 17.8% previously.
By enhancing the process flow of supply lines, optimising routes, consolidating production storage locations in one place, and synchronizing ERP flows with physical flows, the process becomes lean and the raw non-value-added time is globally reduced while the proportion of travelling empty is slightly higher for the last improved scenario.
Consequently, within the framework of continuous improvement, activities can be recovered, allowing the plant to reduce its costs and increase its productivity. Since the reduced time does not eliminate an operator’s entire workload, more tasks are added to operators, including:
- -
- The supermarket operator will work inside the warehouse, store the goods inside the supermarket, and prepare the trolleys.
- -
- The line delivery operator will scan the empty boxes inside the supermarket and participate in the 6S-based activities (Sort, Set in order, Shine, Standardise, Sustain, and Safe).
8. Lessons and Future Improvements
8.1. Lessons and Contributions
The essence of any project concludes with the construction of constructive lessons that summarise the main benefits and best practices obtained. The results generated also open the way to generalise the lessons to other processes and contexts.
In the case of this specific WHAC plant, the points hereinafter are highlighted:
- -
- Space optimisation: the optimisation of space in the production workshop allows implementation of at least one new project in order to increase the turnover.
- -
- Available inventory days: this part draws attention to the commodity inventory level for the main warehouse and WIP.
- -
- Production line shutdowns: this is linked to the discrepancies observed between the characteristic flows of the old process and the trend observed with the new simulated configuration, with a special introduction to the consolidated supermarket concept.
- -
- Logistics costs: the costs of logistics are reduced and are mainly impacted by staff cost optimisations. With logistics downsizing, costs have dropped from 6.51% in monthly sales values to an average of 4.84%.
The points listed above are common elements found in any industry generating physical flows. In this sense, a holistic analysis approach allowing the optimisation of internal logistics processes, thanks in particular to the use of simulation tools, in order to better frame the replenishment flows and reduce the WIP that impacts the level of inventory and, therefore, the company’s cash flow was defined. Requiring a basic knowledge of lean principles, it makes it possible to structure any process aimed at a quantifiable improvement of internal replenishment flows by emphasising the following questions:
- -
- Is there an overproduction waste or excessive WIP in certain areas or extra processing times? How to remedy these dysfunctions thanks to modelling, simulations and the factual interpretation of the results?
- -
- Where can we reduce stocks or position and use supermarkets correctly?
- -
- Where can internal physical flows be improved?
- -
- What other improvements are needed? Should we create a new layout for specific areas?
Finally, analytics to deploy in non- settings may include how to deal with overproduction, unnecessary travel and transportation, excessive waiting, defects, and overprocessing. The VSM tool (Figure 3) used for modelling, and simulations on FlexSim or on any other simulators, make it possible to reduce or even eliminate non-value-added activities in a structured way by using the main principles and stages of our scalable framework.
Moreover, future improvements can be introduced, such as the implementation of RFID (Radio-Frequency Identification) or the automatic replenishment of the production lines by a mechanised system instead of a manual trolley.
8.2. Future Improvements
8.2.1. RFID Solution
The said Wire Harness Automotive Company aims to improve the global supply chain in order to optimise costs and decrease all forms of waste. The RFID implementation [] can:
- -
- Manage more detailed traceability throughout the supply chain;
- -
- Follow in real-time the available inventory and the different movements;
- -
- Allow a strong and rapid reaction in the resolution and anticipation of problems;
- -
- Avoid all scan errors that lead to inventory discrepancies.
To be applied in the case of the WHAC, the process flow consists of a scanning operation that can be effectively replaced by RFID [] according to the following process steps.
- -
- Step 1: Extract the request from the supermarket, print the corresponding selection list and start preparing it physically. This picking list is sorted by storage location in the warehouse, which follows the sequence of picking the required items.
- -
- Step 2: Receive the necessary equipment and distribute it inside the supermarket. The operator ensures that the material is positioned in the right place.
- -
- Step 3: The requirements of the production lines presented in the pick lists received, as well as the empty boxes on the trolleys, are triggers for the supermarket operators to launch the preparation.
- -
- Step 4: The fourth step is important because the operators scan the empty boxes, becoming a signal for:
- ○
- Moving material in the warehouse system to WIP for consumption;
- ○
- Ensuring the order and the replacement of the box at the warehouse.
- -
- Step 5: This is the physical delivery to the production lines.
The last two steps (4 and 5) of the process are the perfect candidates for the application of RFID. The RFID tags of returnable Kanban bins are glued and each component is dedicated to its own box. By replacing the old tag with the new RFID tag, we can immediately identify:
- -
- Component reference.
- -
- The quantity contained.
- -
- The position in the consolidated supermarket.
- -
- The workstation for which it is intended in the production line.
With all the information mentioned above, the RFID tag in the Kanban bin informs the two main movements shown below:
- -
- Kanban to Full: The RFID tag is detected as a full box delivered to the production line. The ERP system recognises it through the Kanban status of the box and transfers this quantity to the WIP.
- -
- Kanban to Empty: The RFID tag is detected in an empty state as soon as it is returned from production.
- -
- The advantages behind this solution are as follows:
- -
- Inventory accuracy.
- -
- Visibility of the supply chain/reduction of the shortage risk.
- -
- Reduction of the error rate.
- -
- Productivity gains for operators (line feeders).
- -
- More detailed traceability.
An RFID tag is also stuck on the trolley to facilitate the monitoring of the movements made by the operators and improve the traceability of the components supplied. The label stuck on the trolley is read by an RFID gate with readers that also detect the information stored on the labels of the trolley and Kanban bins. These data are then transferred to the server in order to establish the necessary link between the labels and the database. Finally, quantities are updated in the ERP system to eliminate the scan errors and the associated extra costs.
8.2.2. Automatised Replenishment to Production Lines
Trolleys have certain dimensions and capacities. The number of Kanban bins that can be transported by a trolley is somewhat limited. The density in terms of bins is an important element in the feeding process. The general idea behind this observation is that a mechanised system can carry several trolleys to feed the lines. Conveyors or trains pick up the empty bins and place the full boxes in a dedicated footprint position on each production line. An operator on the production line carries out the dispatching inside the line and to each workstation.
There are two logistics train configurations to transport raw materials within the factory:
- -
- Automatic train: a train that can be programmed and delivers automatically without a driver. This type of logistic train requires a greater focus on:
- ○
- Detailed programming devices for stop and go.
- ○
- Respect of timing.
- ○
- High investment.
- ○
- A large dedicated corridor.
- -
- Mechanical train: identical to the automatic train, except that it requires a driver to move it. It involves:
- ○
- One driver.
- ○
- Less machine programming.
- ○
- Flexibility in the time slot.
- ○
- Less investment compared to the automatic train.
- ○
- A large dedicated corridor.
Simulations implementing the logistics train are necessary to assess the technical and economic impact of this mechanised replenishment solution as accurately as possible. A cost-benefit analysis must then be carried out for both the solution with the driver and without the driver for decision support in this area.
9. Conclusions and Limitations
The paper discusses the application of the lean manufacturing principles in the area of the internal/industrial logistics where substantial improvements in the replenishment process have been observed in the case of the factory. Various simulations and sensitivity analyses at critical points have been carried out. The objective is to optimise the replenishment flows of the raw materials to the assembly lines in order to propose and implement profitable solutions capable of mitigating or even eliminating all types of waste and increasing the productivity.
To achieve this goal, the article follows the essence of DMAIC and 5-Why methods, which allow the mapping of the internal process of factory logistics. Based on the data collected, as well as specific analysis methods, FlexSim simulations are launched to challenge and validate the improvements made to the replenishment process. Following additional sensitivity analyses, simulations help to provide a complete picture of bottlenecks, obstacles, and potential improvements. Therefore, robust solutions have been proposed while highlighting the main root causes of existing dysfunctions.
First, the focus was on creating and implementing the consolidated supermarket that allows full control of available stocked quantities and reducing the inventory as components were initially duplicated in two different locations, which could generate wasted effort. In a second step, the concept of the Kanban bins was introduced, taking into account all the flows and their visual management that makes it possible to reduce the inventory value of the WIP and to better organise the operations of the factory. All these improvements have been simulated in the FlexSim program for an optimal solution.
Finally, emphasis is placed on improving the management of replenishment flows, which has made it possible to reduce production stoppages and operations without added value.
In addition, many lessons were learnt regarding the management of replenishment flows, covering topics such as inventory traceability, logistics costs, and process flow optimisation. Following the concept of continuous improvement, solutions were presented and additional structuring actions have been defined through two major action-research projects to be launched, namely the introduction of the RFID technology and a mechanised system for transporting raw materials to workstations.
Simulations and sensitivity analyses are necessary for a final decision before the implementation of these two proposals. Moreover, contexts are different from one plant to another. A robust and rigorous adaptation according to the case treated is then required, while the general bases concerning the steps to be observed and the simulations to be carried out risk remaining unchanged.
In conclusion, the use of the methodological path presented in the paper as well as the principle of simulations and sensitivity analyses undertaken are carried out internationally in 19 of the 22 factories of the corporate (at all WHAC plants). Several of them have launched experiments on a small and medium scale, which are proving positive. Finally, in order to better anchor the framework developed in this article and largely adapted to the factories of the corporate, it is essential to experiment with it in other environments and industrial sectors to conclude with certainty as to its scalability due to those parameters that are likely to change, such as the configuration of the plant, the positioning of the replenishment area(s) and their distance from the workstations, the role and operating characteristics of the storage warehouse, the administrative organisation into one or more teams, the number of workers and the degree of their adaptability.
Funding
This research received no external funding.
Institutional Review Board Statement
Not applicable.
Informed Consent Statement
Not applicable.
Data Availability Statement
Not applicable.
Acknowledgments
The author would like to warmly thank Hamidi Sadik for the fruitful discussions, valuable comments made in relation to this study, and his proofreading.
Conflicts of Interest
The author declares no conflict of interest.
References
- Chapman, S.N.; Arnold, J.R.T.; Gatewood, A.K.; Clive, L.M. Introduction to Materials Management; Pearson: Harlow, UK, 2017. [Google Scholar]
- Paul, R.K.; Kalyan, S.; Luk, N.V. Sustainable operations management. Prod. Oper. Manag. 2005, 14, 482–492. [Google Scholar]
- Giret, A.; Trentesaux, D.; Prabhu, V. Sustainability in manufacturing operations scheduling: A state of the art review. J. Manuf. Syst. 2015, 37, 126–140. [Google Scholar] [CrossRef]
- Yang, Q.; Meng, X.; Zhao, H.; Cao, C.; Liu, Y.; Huisingh, D. Sustainable operations-oriented painting process optimisation in automobile maintenance service. J. Clean. Prod. 2021, 324, 129191. [Google Scholar] [CrossRef]
- Christensen, C.M.; Anthony, S.D.; Roth, E.A. Seeing What’s Next: Using the Theories of Innovation to Predict Industry Change; Harvard Business School Press: Boston, MA, USA, 2004. [Google Scholar]
- Danneels, E. Disruptive technology reconsidered: A critique and research agenda. J. Prod. Innov. Manag. 2004, 21, 246–258. [Google Scholar] [CrossRef]
- Esmaeilian, B.; Behdad, S.; Wang, B. The evolution and future of manufacturing: A review. J. Manuf. Syst. 2016, 39, 79–100. [Google Scholar] [CrossRef]
- El-Tamimi, A.M.; Abidi, M.H.; Mian, S.H.; Aalam, J. Analysis of performance measures of flexible manufacturing system. J. King Saud Univ. Eng. Sci. 2012, 24, 115–129. [Google Scholar] [CrossRef]
- Stevenson, W.J. Operations Management, 12th ed.; McGraw-Hill Education: New York, NY, USA, 2015. [Google Scholar]
- Jalali, H.; Nieuwenhuyse, I.V. Simulation optimization in inventory replenishment: A classification. IIE Trans. 2015, 47, 1217–1235. [Google Scholar] [CrossRef]
- Lacksonen, T. Empirical comparison of search algorithms for discrete event simulation. Comput. Ind. Eng. 2001, 40, 133–148. [Google Scholar] [CrossRef]
- Yokoyama, M. Integrated optimization of inventory-distribution systems by random local search and a genetic algorithm. Comput. Ind. Eng. 2002, 42, 175–188. [Google Scholar] [CrossRef]
- Chen, S.-P. An alternating variable method with varying replications for simulation response optimization. Comput. Math. Appl. 2004, 48, 769–778. [Google Scholar] [CrossRef][Green Version]
- Chen, S.-P. Simulation response optimization via an alternating variable method. Eng. Optim. 2003, 35, 675–684. [Google Scholar] [CrossRef]
- Kleijnen, J.P.C.; van Beers, W.; van Nieuwenhuyse, I. Constrained optimization in expensive simulation: Novel approach. Eur. J. Oper. Res. 2010, 202, 164–174. [Google Scholar] [CrossRef]
- Shukla, S.K.; Tiwari, M.K.; Wan, H.-D.; Shankar, R. Optimization of the supply chain network: Simulation, Taguchi, and psychoclonal algorithm embedded approach. Comput. Ind. Eng. 2010, 58, 29–39. [Google Scholar] [CrossRef]
- Taleizadeh, A.A.; Niaki, S.T.A.; Meibodi, R.G. Replenish-up-to multi-chance-constraint inventory control system under fuzzy random lost-sale and backordered quantities. Knowl.-Based Syst. 2013, 53, 147–156. [Google Scholar] [CrossRef]
- Taleizadeh, A.A.; Niaki, S.T.A.; Nikousokhan, R. Constraint multiproduct joint-replenishment inventory control problem using uncertain programming. Appl. Soft Comput. 2011, 11, 5143–5154. [Google Scholar] [CrossRef]
- Wong, J.-T.; Su, C.-T.; Wang, C.-H. Stochastic dynamic lot-sizing problem using bi-level programming base on artificial intelligence techniques. Appl. Math. Model. 2012, 36, 2003–2016. [Google Scholar] [CrossRef]
- Scholz, A.; Wäscher, G. Order batching and picker routing in manual order picking systems: The benefits of integrated routing. Cent. Eur. J. Oper. Res. 2017, 25, 491–520. [Google Scholar] [CrossRef]
- Kia, R.; Khaksar-Haghani, F.; Javadian, N.; Tavakkoli-Moghaddam, R. Solving a multi-floor layout design model of a dynamic cellular manufacturing system by an efficient genetic algorithm. J. Manuf. Syst. 2014, 33, 218–232. [Google Scholar] [CrossRef]
- Matusiak, M.; de Koster, R.; Saarinen, J. Utilizing individual picker skills to improve order batching in a warehouse. Eur. J. Oper. Res. 2017, 263, 888–899. [Google Scholar] [CrossRef]
- Glock, C.H.; Grosse, E.H. Storage policies and order picking strategies in U-shaped order-picking systems with a movable base. Int. J. Prod. Res. 2012, 50, 4344–4357. [Google Scholar] [CrossRef]
- Matusiak, M.; de Koster, R.; Kroon, L.; Saarinen, J. A fast simulated annealing method for batching precedence-constrained customer orders in a warehouse. Eur. J. Oper. Res. 2014, 236, 968–977. [Google Scholar] [CrossRef]
- Franzke, T.; Grosse, E.H.; Glock, C.H.; Elbert, R. An investigation of the effects of storage assignment and picker routing on the occurrence of picker blocking in manual picker-to-parts warehouses. Int. J. Logist. Manag. 2017, 28, 841–863. [Google Scholar] [CrossRef]
- Spearman, M.L.; Zazanis, M.A. Push and pull production systems: Issues and comparisons. Oper. Res. 1992, 40, 521–532. [Google Scholar] [CrossRef]
- Huang, C.-C.; Kusiak, A. Manufacturing control with a push-pull approach. Int. J. Prod. Res. 1998, 36, 251–276. [Google Scholar] [CrossRef]
- Geraghty, J.; Heavey, C. A comparison of hybrid push/pull and CONWIP/pull production inventory control policies. Int. J. Prod. Econ. 2004, 91, 75–90. [Google Scholar] [CrossRef]
- Zheng, W.; Ma, Y.; Zheng, Y.; Shi, X.; Li, B.; Jiang, Y. The research of pull production strategy and method. In Proceedings of the 2010 International Conference on Management and Service Science, Wuhan, China, 24–26 August 2010; pp. 1–4. [Google Scholar]
- Muniappan, P.; Uthayakumar, R.; Ganesh, S. A production inventory model for vendor-buyer coordination with quantity discount, backordering and rework for fixed life time products. J. Ind. Prod. Eng. 2016, 33, 355–362. [Google Scholar] [CrossRef]
- Chaudhary, U.; Singh, S.R.; Chaudhary, U. Supply chain model for deteriorating items with imperfect production process under budget constraint. In Information Systems Design and Intelligent Applications, Advances in Intelligent Systems and Computing; Mandal, J.K., Satapathy, S.C., Sanyal, M.K., Sarkar, P.P., Mukhopadhyay, A., Eds.; Springer: New Delhi, India, 2015; Volume 340, pp. 273–284. [Google Scholar]
- Ghasemi, N. Developing EPQ models for non-instantaneous deteriorating items. J. Ind. Eng. Int. 2015, 11, 427–437. [Google Scholar] [CrossRef][Green Version]
- Burganova, N.; Grznar, P.; Gregor, M.; Mozol, S. Optimalisation of internal logistics transport time through warehouse management: Case study. Transp. Res. Procedia 2021, 55, 553–560. [Google Scholar] [CrossRef]
- Masae, M.; Glock, C.H.; Grosse, E.H. Order picker routing in warehouses: A systematic literature review. Int. J. Prod. Econ. 2020, 224, 107564. [Google Scholar] [CrossRef]
- Kapoor, A.; Agarwal, K.M.; Sheokand, A. Lean Implementation Value in Automobile Sector. In Recent Advances in Industrial Production; Springer: Singapore, 2022; pp. 303–314. [Google Scholar]
- Tsigkas, A. Principles of Lean Production. In The Modern Lean Enterprise; Springer: Berlin/Heidelberg, Germany, 2022; pp. 43–51. [Google Scholar]
- Haug, P. Toolbox of Supply Chain Management. In Project Management in Logistics and Supply Chain Management; Springer Gabler: Wiesbaden, Germany, 2022; pp. 91–124. [Google Scholar]
- Helmold, M.; Küçük Yılmaz, A.; Dathe, T.; Flouris, T.G. Global Supply Chains. In Supply Chain Risk Management; Springer: Cham, Switzerland, 2022; pp. 79–89. [Google Scholar]
- Makinde, O.; Selepe, R.; Munyai, T.; Ramdass, K.; Nesamvuni, A. Improving the Supply Chain Performance of an Electronic Product-Manufacturing Organisation Using DMAIC Approach. Cogent Eng. 2022, 9, 2025196. [Google Scholar] [CrossRef]
- Bakker, O.J.; Papastahis, T.N.; Ratchev, S.M.; Popov, A.A. Recent research on flexible fixtures for manufacturing processes. Recent Pat. Mech. Eng. 2013, 6, 107–121. [Google Scholar] [CrossRef][Green Version]
- Hussein, B.; Hammoud, M.; Bazzi, H.; Haj-Ali, A. PRISM—Process reengineering integrated spiral model: An agile approach to business process reengineering (BPR). Int. J. Bus. Manag. 2014, 9, 134–142. [Google Scholar] [CrossRef]
- Hammer, M.; Champy, J.A. Reengineering the Corporation: A Manifesto for Business Revolution; Harper Business Books: New York, NY, USA, 1993. [Google Scholar]
- Kholil, M.; Suparno, A.; Hasan, S.B.H.; Aprilia, R. Lean approach for waste reduction in production line by integrating DMAIC, VSM, and VALSAT method (Study case: Assembling bracket manufacturing automotive industry). J. Intell. Decis. Support Syst. 2022, 5, 37–43. [Google Scholar] [CrossRef]
- Williams, M.A. Six Sigma; Rath & Strong/Aon Management Consulting: Lexington, MA, USA, 2006. [Google Scholar]
- Sangwa, N.R.; Sangwan, K.S. Leanness assessment of a complex assembly line using integrated value stream mapping: A case study. TQM J. 2022. ahead-of-print. [Google Scholar] [CrossRef]
- Helmold, M. Performance Management in Operations Management. In Strategic Performance Management; Springer: Cham, Switzerland, 2022; pp. 57–70. [Google Scholar]
- Vavrík, V.; Fusko, M.; Bučková, M.; Gašo, M.; Furmannová, B.; Štaffenová, K. Designing of Machine Backups in Reconfigurable Manufacturing Systems. Appl. Sci. 2022, 12, 2338. [Google Scholar] [CrossRef]
- Gochel, A.; Gebeyehu, S.G.; Abebe, M. Production lead time improvement through lean manufacturing. Int. J. Ind. Syst. Eng. 2022, 40, 147–156. [Google Scholar] [CrossRef]
- Smith, S. Muda, muri and mura. Lean Six Sigma Rev. 2014, 13, 36. [Google Scholar]
- Chen, T.C.T.; Wang, Y.C. Basics in Lean Management. In Artificial Intelligence and Lean Manufacturing; Springer: Cham, Switzerland, 2022; pp. 1–12. [Google Scholar]
- Abu-taieh, E.; El Sheikh, A. Commercial simulation packages: A comparative study. Int. J. Simul. Syst. Sci. Technol. 2007, 8, 66–76. [Google Scholar]
- Ross, D.F. Distribution Planning and Control: Managing in the Era of Supply Chain Management; Kluwer Academic Publisher: Norwell, MA, USA, 2004. [Google Scholar]
- Ho, G.T.S.; Choy, K.L.; Poon, T.C. Providing decision support functionality in warehouse management using the RFID-based fuzzy association rule mining approach. In Proceedings of the 2010 8th International Conference on Supply Chain Management and Information, Hong Kong, China, 6–9 October 2010; pp. 1–7. [Google Scholar]
- Chen, J.C.; Cheng, C.-H.; Huang, P.B.; Wang, K.J.; Huang, C.-J.; Ting, T.-C. Warehouse management with lean and RFID application: A case study. Int. J. Adv. Manuf. Technol. 2013, 69, 531–542. [Google Scholar] [CrossRef]
Publisher’s Note: MDPI stays neutral with regard to jurisdictional claims in published maps and institutional affiliations. |
© 2022 by the author. Licensee MDPI, Basel, Switzerland. This article is an open access article distributed under the terms and conditions of the Creative Commons Attribution (CC BY) license (https://creativecommons.org/licenses/by/4.0/).