
Optimization of Hub-Based Milkrun Supply


Institute of Logistics, University of Miskolc, 3515 Miskolc, Hungary
Logistics 2024, 8(3), 86; https://doi.org/10.3390/logistics8030086
Submission received: 10 July 2024
/
Revised: 16 August 2024
/
Accepted: 29 August 2024
/
Published: 3 September 2024
Abstract
:Background: Milkrun-based material supply plays an important role in the automotive industry, as it is a material supply concept where high efficiency can be achieved. When implementing milkrun-based material supply, the milkrun supply of the production plant often has to be integrated with an existing warehouse material handling system, which frequently leads to a less efficient solution. Methods: In this paper, the author investigates the impact of a hub-based milkrun supply, where the collection processes in the component’s warehouse and the distribution processes in the assembly plant are connected to a hub, which is responsible for the sequencing of component demands. After a systematic literature review, the paper introduces a novel mathematical model, which makes it possible to describe the conventional milkrun-based solutions, the hub-based milkrun solutions, and to compare them in terms of the length of transportation routes, transportation time, total service time, and virtual emission points of view. Results: The scenario analysis demonstrates that the hub-based solution can lead to an efficiency improvement of about 13% in total service time, 23% savings in transportation time, and 45% savings in transportation time in the component’s warehouse. Conclusions: The article’s findings suggest that implementing a hub-based milkrun system in automotive material supply can significantly enhance efficiency. The described approach could lead to more streamlined operations in production plants by optimizing the integration of milkrun systems.
1. Introduction
The milkrun in-plant supply is a logistics method, where the materials and components required by assembly and production cells are delivered in small, frequent quantities (lots) to production and assembly lines, optimizing inventory levels, including work-in-process inventory (WIP), and reducing warehousing costs. This approach aims to ensure a steady and just-in-time, or just-in-sequence flow of components, minimizing production downtime and increasing the efficiency of production, assembly, and logistics. By using milkrun supply solutions, companies can streamline the in-plant supply, reducing the need for large inventory and the risk of overproduction. The method often involves coordinated routes and schedules, ensuring that supplies are replenished based on actual consumption rates, which can be described as static and dynamic milkrun supply. Overall, milkrun in-plant material supply contributes to lean manufacturing practices, promoting agility, efficiency, productivity, flexibility, and responsiveness in the production and assembly process.
Milkrun solutions can be used both in the case of global supply chain solutions including urban freight transportation [1], community traffic systems [2], industrial delivery [3], or transit networks between urban areas and suburbs [4]. Milkrun solutions can be improved using Industry 4.0 technologies. Karouani and Elgarej propose, in a research focusing on the improvement of milk collection [5], a smart decision method using IoT, big data, and swarm artificial intelligence to optimize milk delivery logistics, reduce transportation costs, and improve collection density. In a research, Dewitz et al. discuss the importance of time table optimization in milkrun supply solutions [6]. Through a research collaboration between the BMW Group and the Technical University Munich, a method of generating timetables for milkruns has been developed and is now utilized for planning and controlling operations in multiple production plants.
Kilic et al. focus on research on the classification and modeling for in-plant milkrun distribution systems [7]. The study found that implementing milkrun solutions in production plants standardizes material handling operations and eliminates waste, aligning with lean manufacturing principles. The research shows that the core problem in milkrun design and operation is to minimize vehicle numbers and travel distances.
The uncertainties can significantly influence the efficiency of milkrun supply solutions. As Bocewicz et al. show, in a research on milkrun routing and scheduling problems [8], fuzzy models can be used to design and control milkrun supply solutions and these models can be complex models including time and- capacity-related constraints, as Çakir et al. discuss [9]. Industry 4.0 technologies have a significant impact on the efficiency and flexibility of milkrun solutions, especially in the case of disrupted supply chains and supply solutions, where Internet of Things (IoT) solutions can support decision making in routing problems [10] or improve sustainability and energy efficiency [11].
The importance of logistics service providers and 4th party logistics providers is highlighted by De Souza et al. [12]. They explore the Fourth Party Milkrun (4PMR) model as a flexible contract mechanism for horizontal collaboration to reduce last-mile logistics costs. Case studies and scenarios demonstrate significant cost reductions using the 4PMR model. Different research approaches show that the design and operation of milkrun-based in-plant supply and milkrun-based supply chain operations can be based on a wide range of objectives, objective functions and constraints, including transportation distance optimization [13], capacity utilization and loading model optimization [14], vehicle routing [15], surface occupation and utilization of available area for production and logistics operations [16], improvement in cost efficiency [17] and return on investment calculation for automatized milkrun solutions, scheduling of milkrun routes including time table design for transportation and materials handling (loading and unloading) operations [18], and fleet size optimization [19].
Other important research topics related to the design and operation of milkrun supply solutions include the following aspects: traffic system prototyping [20], Kanban systems with milkrun [21], milkrun consolidation [22], comparison of point-to-point and milkrun delivery models [23], mixed distribution systems [24], milkrun control [25], strategic decisions in milkrun operation and the application of collaborative strategies [26], milkrun-based in-plant supply on multi-line assembly [27], impact of disturbances on the operation and efficiency of milkrun supply solutions [28], intelligent scheduling [29], or transport concept selection for freight or passenger transport [30]. The main design aspects, application fields and used technologies are summarized in Table 1.
The findings of the literature review are as follows:
- More than 50% of the articles regarding milkrun-based supply were published in the last five years. This result indicates the scientific potential of the design and optimization of milkrun-based materials supply solutions.
- The articles that addressed the optimization of milkrun supply of assembly and production plants are focusing on conventional solutions and only a few of them describe the indirect milkrun-based supply, where an intermittent hub is responsible for the sequencing of collected components required by the assembly or production cells.
- A wide range of research articles discuss the logistics-related aspects of milkrun-based in-plant supply operations, but energy efficiency and environmental impacts are research gaps. These research topics still need more attention and research; therefore, the proposed mathematical model integrates sustainability aspects (minimization of energy consumption and GHG emission).
- The design and optimization of milkrun supply solutions is generally based on heuristics, metaheuristics, or simulation, commercial solvers are rarely used.
- The approach can be compared with recent methodologies. While Karouani and Elgarej [5] concentrate on the milkrun collection system, the approach described here addresses the integrated design and operation of both collection and distribution systems, considering milkruns for both processes. Arvidsson [1] explores the load factor paradox with economic and environmental implications, Novaes et al. [2] focus on the environmental impacts of milkrun design, DeSouza et al. [12] examine the logistics costs of milkrun operations, Mohd et al. [13] emphasize minimizing transportation distances, and Eroglu et al [14]. discuss the capacity-related aspects of milkrun design. This approach integrates these various aspects into a comprehensive design model, enabling consideration of multiple facets of milkrun design and operation.
The main contributions of this article include the following: (1) the conceptual model of hub-based in-plant material supply; (2) the novel mathematical approach, which makes it possible to describe the conventional milkrun-based solutions, the hub-based milkrun solutions, and to compare them in terms of the length of transportation routes, transportation time, total service time, and virtual emission points of view; (3) comparative analysis of conventional and hub-based milkrun supply solutions; and (4) computational results of different scenarios used to validate the developed methodology. Table 2 shows the descriptions of notations and symbols used in the article.
The conventional milkrun supply system integrates the collection process in the component’s warehouse with the distribution process in the assembly or production plant, organizing these steps sequentially. This approach allows for a straightforward workflow but may not optimize the separation of tasks. In contrast, the hub-based milkrun supply separates the collection and distribution processes, where a hub connects both subsystems. This system begins with gathering component demand data from the MES or ERP system, ensuring that materials needed for the assembly plant are accurately identified. A shopping list for each assembly cell is then created, detailing the required components. The hub-based approach checks the availability of milkrun and JIT trolleys before consolidating the shopping list, ensuring efficient use of transport resources. By scheduling sequencing operations to align with assembly demands, the hub-based system optimizes material flow and supports continuous production. This separation and integration via the hub can potentially lead to more efficient operations compared to the conventional method.
2. Materials and Methods
One of the most common solutions for in-plant material supply systems is the milkrun-based material supply. In the production and assembly systems the milkrun supply can be organized in many ways. Within the frame of this chapter, two typical conception will be described and compared. The first one is the conventional milkrun supply, where the collection process in the component’s warehouse and the distribution process in the assembly or production plant is integrated and these processes are sequentially organized. The second one is the hub-based milkrun supply, where the collection process in the component’s warehouse and the distribution process in the assembly plant is separated. Within the frame of this chapter, a novel conceptual model of the hub-based milkrun supply is proposed. The author discusses a mathematical model, which makes it possible to describe the conventional and the hub-based milkrun supply and compare the optimal solutions.
2.1. Conceptional Model of Conventional and Hub-Based Milkrun Supply
The component demand is based on the assembly master plan (AMP) generated by the manufacturing execution system (MES). Based on the component demand, different milkrun supply solutions can be defined. In the case of conventional milkrun supply (Figure 1), a shopping list (SL) is generated. Based on this shopping list, the collection milkrun collects required components from the component’s warehouse and the same milkrun distributes the collected components to the assembly cells. In this case, the most significant influencing factor of the routing of milkruns is the supply of assembly cells; therefore, the milkrun routes are clustered, sequenced, and scheduled based on the assembly master plan. It means that in this conventional milkrun supply, the collection routes depend on the distribution routes in the assembly plant.
In the case of hub-based milkrun supply (Figure 2), the collection routes in the component’s warehouse and the distribution routes in the assembly plant are connected by a hub, which is responsible for the sequencing of collected components according to the demands of assembly cells. In this case, the optimization of collection and distribution processes are independent, therefore it is possible that potential reductions in transportation distances, transportation time, energy consumption, and emission can be achieved. In Figure 2, the red lines represent the collection route of components in the component’s warehouse, while the green lines are for the distribution milkrun routes in the assembly plant. In the hub, the collected components are sequenced depending on the demands of the assembly station to optimize the distribution milkrun routes.
2.2. Mathematical Model of Conventional and Hub-Based Milkrun Supply
The hub-based process can be described as follows. The process begins by collecting component demand data from the Manufacturing Execution System (MES) or Enterprise Resource Planning (ERP) system, which detail the required materials for the assembly plant. Based on this demand, a shopping list is created for each assembly cell, specifying the components needed. Next, the availability of milkrun trolleys and just-in-time (JIT) trolleys is checked to ensure the necessary transport resources are on hand. Using the available trolleys, a shopping list is generated, consolidating the required components from both the component warehouse and the assembly plant. This list ensures that materials are allocated efficiently across the available trolleys. Finally, sequencing operations are scheduled, aligning the material delivery schedule with the demands of each assembly cell to optimize the assembly process and maintain continuous production flow. The process is shown in Figure 3.
The input parameters of the conventional milkrun supply are the following:
- : coordinates of the available assembly cells, ;
- : coordinates of the available warehouse racks, ;
- : quantity of supply demand of assembly cell i in [LU];
- : capacity of milkrun trolleys in [LU];
- : average speed of milkrun trolleys in the assembly plant;
- : average speed of milkrun trolleys in the component’s warehouse;
- : specific materials handling time in the assembly plant (unloading time) in [s];
- : specific materials handling time in the component’s warehouse (unloading time) in [s];
- : total number of available milkrun trolleys in [pcs];
- : specific energy consumption of milkrun trolleys in [kWh/km];
- : specific GHG emission of milkrun trolleys in [CO2 g/km].
We can define a wide range of objective functions for the optimization of milkrun supply as follows. The first potential objective function is the minimization of transportation routes. The transportation routes include the length of routes of milkrun trolleys both in the component’s warehouse and in the assembly plant. The objective function summarizes the length of relations depending on the value of related elements of the assignment matrix:
where
- is the length of milkrun routes in the component’s warehouse and in the assembly plant;
- is the index of milkrun routes in the assembly plant, , where is the total number of milkrun routes;
- is the index of stations of milkrun routes in the assembly plant, , where is the maximum number of stations within a milkrun route;
- is the index of milkrun routes in the component’s warehouse, , where is the total number of milkrun routes;
- is the index of stations of milkrun routes in the component’s warehouse, , where is the maximum number of stations within a milkrun route;
- is the first decision variable of the optimization problem defining the assignment of assembly cells to milkrun routes, where is the ID of the assembly cell assigned as station of milkrun route ;
- is the second decision variable of the optimization problem defining the assignment of racks in the component’s warehouse to milkrun routes, where is the ID of the rack in the component’s warehouse assigned as station of milkrun route .
The second potential objective function is the minimization of transportation time:
where is the transportation time of milkrun routes in the component’s warehouse and in the assembly plant. This objective function is based on the minimization of the transportation routes, but the length is divided by the average speed of milkrun trolleys.
The third potential objective function is the minimization of total time including both transportation and material handling operations:
where is the total time of milkrun routes in the component’s warehouse and in the assembly plant. In the case of this objective function, both the transportation times in the component’s storage and the assembly plant and the required time for materials handling operations are taken into consideration.
The fourth potential objective function is the minimization of energy consumption of milkrun trolleys:
where is the total energy consumption of milkrun trolleys in the component’s warehouse and in the assembly plant. The objective function multiplies the length of transportation routes and the specific energy consumption. If the energy consumption depends on the load of milkrun trolleys, the fourth objective function can be written as follows:
where is the current load of the milkrun at assembly cell or rack in the component’s warehouse.
The fifth potential objective function is the minimization of virtual emission of milkrun trolleys. The milkrun trolleys are using electricity, but this electricity must be produced in a way. The virtual emission represents the emission of electricity production of used electricity, which depends on the electricity production source (gas, solar, coal, wind, nuclear, etc.):
where is the total GHG emission of milkrun trolleys in the component’s warehouse and in the assembly plant.
In this article, milkrun trolleys perform in-plant supply operations, where emissions are taken into consideration as virtual emissions. These virtual emissions are calculated by considering the emission rates associated with the electricity generation sources. To estimate the environmental impact of electricity used by milkrun trolleys, it is important to determine the specific emissions in grams per liter of fuel consumed. We then calculate the corresponding contribution of each energy source to greenhouse gas (GHG) emissions. It is possible to derive the specific virtual emissions associated with the electricity consumed by milkrun trolleys. This approach allows for a more detailed understanding of the environmental impact of using electricity from various energy sources in industrial automation.
If the emission depends on the load of milkrun trolleys, the fourth objective function can be written as follows:
The optimization problem can include a wide range of constraints as follows. The first constraint defines that it is not allowed to exceed the total number of milkrun trolleys. In the case of the conventional milkrun supply, the milkruns perform both the collection in the component’s warehouse and the distribution in the assembly plant; therefore, in the case of the conventional milkrun supply, this constraint can be written as follows:
while in the case of hub-based milkrun supply the collection and distribution processes are not sequenced, which means that the number of milkrun trolleys in the collection process and the number of milkrun trolleys in the distribution process can be different; therefore, in the case of hub-based milkrun supply, this constraint can be written as follows:
The second constraint defines that it is not allowed to exceed the capacity of milkrun trolleys. In the case of the conventional milkrun supply, the capacity-related constraint can be written in a simplified form, because the sequencing of the collection process in the component’s warehouse and the distribution process in the assembly plant means that if the constraint regarding the milkrun process in the warehouse is true, the constraint regarding the milkrun process in the assembly plant is also true:
In the case of the hub-based milkrun supply, the collection and distribution processes are not sequenced, they are separated by the hub; therefore, the capacity-related constraint must be defined both for the assembly plant and for the component’s warehouse:
It means that it is not allowed to exceed the available capacity of milkrun trolleys and JIT trolleys in the component’s warehouse and in the assembly plant. The third constraint defines that all operations must be performed within a predefined time window. This predefined time window is generally based on the master assembly plan (MAP) and defines the schedule of required assembly operations for each assembly cell. In the case of conventional milkrun supply, this constraint can be written as follows:
while in the case of hub-based milkrun supply this constraint is as follows:
The fourth constraint is responsible for the supply strategy. In the case of conventional milkrun supply, the required components for all assembly cells assigned to a milkrun route must be collected by the same milkrun route in the component’s warehouse:
where is the set of components required by the assembly cells assigned to milkrun route , is the set of components collected by milkrun route .
In the case of hub-based milkrun supply, the milkrun routes in the component’s warehouse must collect all components required by the assembly cells in the analyzed time frame. In this case, the constraint is as follows:
The structure of the mathematical model is summarized in Figure 4.
3. Results
Within the frame of this chapter the conventional milkrun solution and the hub-based milkrun solution are compared. In the case of the conventional case, where the milkrun process of assembly and warehouse are integrated, the following parameters are given:
- Material supply demands of each assembly cells in [LU] (Table 3);
- Capacity of milkrun trolleys in [LU]: ;
- Average speed of milkrun in the assembly plant in [m/s]: ;
- Average material handling time at the assembly cells in [s]: ;
- Position of required components in the warehouse (see Table 4);
- Average speed of milkrun in the component’s warehouse in [m/s]: ;
- Average material handling time (unloading time) in the component’s warehouse in [s]: .
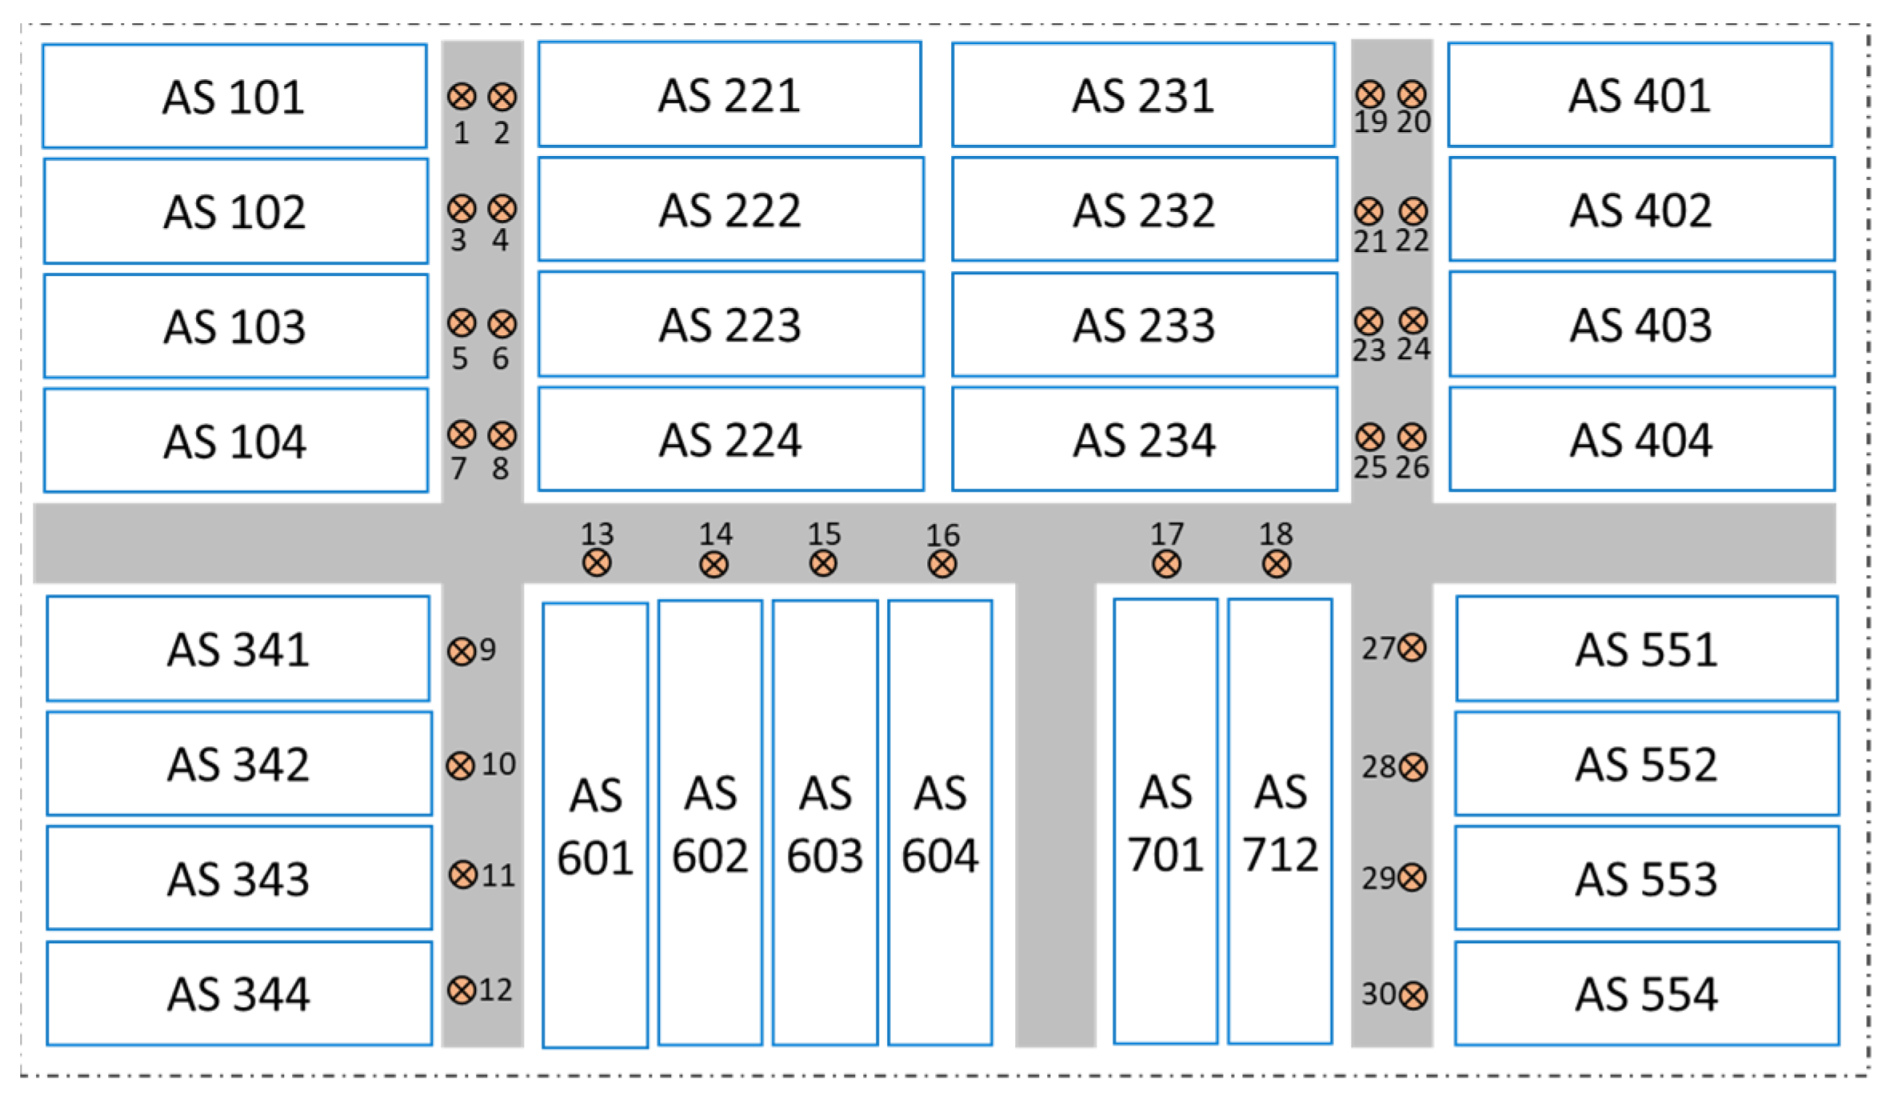
Figure 5.
The layout of the assembly plant and the position of picking points.

Table 3.
The locations of picking points in the assembly plant.
| Assembly Cell’s ID | Picking Point ID | Location (x, y) in [m] | Component Demand in [Type, LU] | Assembly Cell’s ID | Picking Point ID | Location (x, y) in [m] | Component Demand in [Type, LU] |
|---|---|---|---|---|---|---|---|
| AS 101 | 1 | (0, 0) | 0,0 | AS 344 | 12 | (0, 65) | X05, 44 |
| AS 102 | 3 | (0, 10) | X12, 23 | AS 401 | 20 | (65, 0) | X06, 27 |
| AS 103 | 5 | (0, 15) | X14, 38 | AS 402 | 22 | (65, 10) | X07, 33 |
| AS 104 | 7 | (0, 25) | Y07, 27 | AS 403 | 24 | (65, 15) | A12, 33 |
| AS 221 | 2 | (5, 0) | X08, 11 | AS 404 | 26 | (65, 25) | A44, 30 |
| AS 222 | 4 | (5, 10) | A02, 12 | AS 551 | 27 | (65, 40) | A51, 30 |
| AS 223 | 6 | (5, 15) | G72, 32 | AS 552 | 28 | (65, 50) | D30, 21 |
| AS 224 | 8 | (5, 25) | C33, 28 | AS 553 | 29 | (65, 55) | D40, 35 |
| AS 231 | 19 | (60, 0) | X11, 16 | AS 554 | 30 | (65, 65) | F03, 20 |
| AS 232 | 21 | (60, 10) | Y05, 11 | AS 601 | 13 | (10, 35) | F02, 11 |
| AS 233 | 23 | (60, 15) | C09, 32 | AS 602 | 14 | (20, 35) | X91, 18 |
| AS 234 | 25 | (60, 25) | B34, 10 | AS 603 | 15 | (25, 35) | Z01, 41 |
| AS 341 | 9 | (0, 40) | B35, 26 | AS 604 | 16 | (35, 35) | Z02, 35 |
| AS 342 | 10 | (0, 50) | X33, 15 | AS 701 | 17 | (45, 35) | Z03, 20 |
| AS 343 | 11 | (0, 55) | C41, 33 | AS 712 | 18 | (55, 35) | Z07, 17 |
Figure 6.
The layout of the component’s warehouse and the position of picking points of each rack, where the components required by assembly cells within the time frame of analyses are available.
Figure 6.
The layout of the component’s warehouse and the position of picking points of each rack, where the components required by assembly cells within the time frame of analyses are available.

Table 4.
The locations of picking points in the component’s warehouse.
| Rack ID | Picking Point ID | Location (x, y) in [m] | Component ID | Rack ID | Picking Point ID | Location (x, y) in [m] | Component ID |
|---|---|---|---|---|---|---|---|
| Entry | 1 | (2, 0) | - | 407 | 16 | (12, 28) | F02 |
| 101 | 2 | (2, 52) | Y07 | 408 | 17 | (12, 24) | X33 |
| 102 | 3 | (2, 48) | X11 | 411 | 18 | (12, 12) | C09 |
| 104 | 4 | (2, 40) | X06 | 412 | 19 | (12, 8) | D40 |
| 106 | 5 | (2, 32) | Y05 | 501 | 20 | (16, 52) | X14 |
| 107 | 6 | (2, 28) | A51 | 502 | 21 | (16, 48) | A12 |
| 109 | 7 | (2, 20) | X12 | 504 | 22 | (16, 40) | X91 |
| 202 | 8 | (4, 48) | B35 | 511 | 23 | (16, 12) | B34 |
| 203 | 9 | (4, 44) | Z01 | 512 | 24 | (16, 8) | C41 |
| 206 | 10 | (4, 32) | D30 | 603 | 25 | (20, 44) | A02 |
| 302 | 11 | (8, 48) | Z07 | 605 | 26 | (20, 36) | A44 |
| 304 | 12 | (8, 40) | F03 | 606 | 27 | (20, 32) | Z02 |
| 307 | 13 | (8, 28) | G72 | 609 | 28 | (20, 20) | C33 |
| 308 | 14 | (8, 24) | X08 | 610 | 29 | (20, 16) | X05 |
| 406 | 15 | (12, 32) | X07 | 611 | 30 | (20, 12) | Z03 |
Within the frame of the next subchapters, the conventional and the hub-based milkrun supply solutions will be analyzed.
3.1. Computational Results of Conventional Milkrun Supply Optimization
In the case of the conventional milkrun supply, the collection process in the component’s warehouse and the distribution process in the assembly plant are performed by the same milkrun trolley. In this case, the operator (the milkrun driver) is responsible for the appropriate collection of required components and their distribution at the assembly cell in time. The conventional milkrun supply optimization is based on the mathematical model shown in Section 2.2. The optimization problem was solved by the OpenSolver 2.9.3. As Figure 7 shows, in the conventional milkrun supply, six milkrun routes represent the optimal solution; the maximum utilization of these milkrun routes is between 94.4% and 99.2%.
Using the same OpenSolver, it is possible to optimize the collection process of the milkruns in the component’s warehouse. The optimization resulted six different milkrun routes, as shown in Figure 8. The required components are collected by the same milkrun trolley, therefore the utilization of the milkrun trolleys is the same. The utilization in the first phase of the milkrun route (collection in the component’s warehouse) is increasing, while the utilization in the second phase of the milkrun route (distribution in the assembly plant) is decreasing.
Table 5 summarizes the results of the conventional milkrun supply including the collection and distribution sequences, and the current utilization of milkrun trolleys at each assembly cell and warehouse rack.
The total distance of the milkrun routes in the assembly plant is 960 m, the total time of travelling is 17.6 min, while the required time for materials handling is 16 min. The total distance of the milkrun routes in the component’s warehouse is 1220 m, the total time of travelling is 18.3 min, while the required time for materials handling is 12.5 min (Figure 9).
3.2. Computational Results of Hub-Based Milkrun Supply Optimization
In the case of hub-based milkrun supply, the collection process in the component’s warehouse and the distribution process in the assembly plant are performed by different milkrun trolleys and the sequencing of JIT trolleys is performed in the hub located between the warehouse area and the assembly area. In this case, the operator of the assembly plant’s milkrun (the milkrun driver) is responsible only for the appropriate distribution of the collected components from the hub to the assembly cells, while the collection of appropriate components and the sequencing of JIT trolleys in the hub is the responsibility of the driver of the milkrun trolleys in the warehouse. The optimization problem was solved by the OpenSolver. The optimization of the milkrun routes is both in the case of conventional milkrun supply and in the case of hub-based supply it is based on the assembly master plan (AMP), therefore the routes of the milkruns are not influenced by the methodology of routing of milkruns. It means, that in the case of hub-based milkrun supply, six milkrun routes represent the optimal solution; these routes are the same as in the case of conventional solution; their maximum utilization is between 94.4% and 99.2%.
Using the OpenSolver, it is possible to optimize the collection process of the milkrun routes in the component’s warehouse. In this case, the milkrun is operated by other milkrun drivers, therefore the collection milkrun and the distribution milkrun are not sequentially organized; it means that there does not need to be a direct link in time or space between the warehouse’s milkrun (collection milkrun) and the milkrun in the assembly plant. The optimization resulted in seven different milkrun routes, as shown in Figure 10.
Table 6 summarizes the results of the hub-based milkrun supply including the collection in the component’s warehouse and in the assembly plants, the current utilization of milkrun trolleys at each assembly cell and warehouse rack.
The total distance of the milkrun routes in the assembly plant is 960 m, the total time of travelling is 17.6 min, while the required time for materials handling is 16 min. The total distance of the milkrun routes in the component’s warehouse is 668 m, the total time of travelling is 10.02 min, while the required time for materials handling is 12.5 min (Figure 11). As Figure 11 shows, in this hub-based scenario the routes in the assembly plant and in the component’s warehouse are not sequenced, because they are not performed by the same milkrun. In the case of the conventional milkrun, the collection and distribution routes are sequenced and they are performed by the same milkrun (integrated collection and distribution milkrun), while in the case of the hub-based milkrun supply the collection milkrun routes are optimized, which means that it is possible to reduce the required time to perform collection routes in the component’s warehouse. Within the frame of Section 3.3, the computational results of the conventional and hub-based milkrun supply are compared to show the advantages of hub-based milkrun supply.
3.3. Comparison of the Computational Results
As the computational results in Section 3.1 and Section 3.2 show, it is possible to decrease the required time of in-plant milkrun supply of assembly cells using the hub-based milkrun supply approach. Figure 12 summarizes the main advantages of hub-based milkrun supply focusing on time-related parameters. In the case of the analyzed scenarios, the hub-based milkrun supply resulted in 12.85% savings in the total transportation and materials handling (loading and unloading) time. However, the hub-based milkrun supply has no impact on the materials handling time, because the same loading and unloading operations must be performed by the operators (milkrun drivers), but the transportation time is significantly influenced. The hub-based solution led to 23.06% savings in transportation time, including transportation in both the component’s warehouse and the assembly plant. The most significant result is that the hub-based solution resulted in 45.25% savings in the transportation time in the component’s warehouse. The mechanism of the milkrun supply led to these results, because of the following:
- The material handling time is the same both in the component’s warehouse and in the assembly plant, but there are additional sequencing operations in the hub, which led to increased materials handling time (sequencing);
- The collection routes are not based on the demands of the assembly stations, but they are optimized to minimize the collection routes in the component’s warehouse;
- The optimization of collection routes in the component’s warehouse and in the assembly plant is integrated, which means that the collection and distribution routes are optimized parallel, which can lead to decreased transportation time both in the component’s warehouse and in the assembly plant.
The utilization of milkrun trolleys in the component’s warehouse in the case of conventional milkrun supply is 97.19%, while in the case of hub-based supply it is 83.31%. However, in the analyzed scenario, the objective function was the minimization of required time to perform milkrun supply operations. In the case of automotive industry, the minimization of time required to perform in-plant supply operations plays a significant role in the efficiency, therefore in this approach the time minimization of in-plant supply operation was taken into consideration.
The implementation challenges and potential barriers are as follows:
- A free area is needed between the component’s warehouse and the assembly plant where the hub for the sequencing operations can be established. This hub will serve as a critical intermediate storage, performing the efficient transfer of components from component’s warehouse to the assembly cells. The hub’s primary task is to create optimized milkruns in the assembly plant, to ensure that the assembly plant receives the necessary components in a timely and organized manner. These milkruns must be tailored to meet the specific demands of the assembly cells, taking into consideration the assembly schedule, component usage rates, and any potential fluctuations in demand. By establishing a hub, the overall material flow can be streamlined, reducing bottlenecks and minimizing downtime in the assembly process.
- The synchronization of milkrun routes between the component’s warehouse and the assembly plant is crucial for maximizing efficiency. Proper synchronization can significantly reduce the floor space required for the hub, as it allows for a more continuous and predictable material flow. Without synchronization, there could be periods of congestion or underutilization, both of which could lead to inefficiencies. By aligning the milkrun schedules with the assembly master plan, the hub can operate more smoothly, ensuring that components are delivered just-in-time, thus minimizing inventory levels and reducing storage space requirements.
- Reliable demand data is essential for the effective operation of this proposed approach. Accurate and up-to-date information from ERP (Enterprise Resource Planning) or MES (Manufacturing Execution Systems) is critical in forecasting the component needs of the assembly plant. Without reliable data, the milkrun routes cannot be properly planned, leading to either shortages or surpluses of components. Such discrepancies could disrupt the assembly process, causing delays or assembly stoppages, and ultimately leading to increased costs and reduced product quality. Therefore, maintaining accurate demand forecasts is key to ensuring the reliability and efficiency of the entire supply chain. By integrating robust data systems with the hub’s operations, the assembly plant can achieve a more responsive and adaptive production process, capable of handling fluctuations in demand while maintaining high levels of operational efficiency.
4. Discussion
Milkrun material supply solutions are becoming increasingly important, not only for freight and passenger transport, but also for in-plant material supply. The most important reason for this is that a properly designed and operated milkrun material supply can enhance efficiency, availability, flexibility while sustainability aspects (ecological and social) are also taken into consideration. Within the frame of this article, the author focuses on the comparison of the conventional milkrun supply and the hub-based milkrun supply.
In the case of conventional milkrun supply, the collection and distribution processes of milkrun operations are generally sequenced and performed by the same milkrun. In the case of the proposed hub-based milkrun supply, the collection processes in the component’s warehouse and the distribution processes in the assembly plant are separated by a hub, where the collected components are sequenced according to the demands of assembly cells. To compare the conventional and hub-based solutions, a mathematical model was discussed which includes five objective functions (minimization of transportation routes, minimization of transportation time, minimization of total time including transportation and materials handling operations, minimization of energy consumption and minimization of virtual emission). The optimal solutions are limited by time- and capacity-related constraints. The scenario analysis demonstrates that the hub-based solution can significantly improve the efficiency of the milkrun supply: the total service time was decreased by 13%, the transportation time was decreased by 23%, while the most significant result was the 45% saving in transportation time in the component’s warehouse.
The proposed approach can be compared with most recent approaches as follows. While Karouani and Elgarej focus in their research work [5] on a milkrun collection system, the above-described approach discusses the integrated design and operation of collection and distribution systems taking both collection and distribution milkruns into consideration. Arvidsson discusses the load factor paradox with economic and environmental implications [1], Novaes et al. focus on the environmental implications of milkrun design [2], DeSouza et al. discuss the logistics costs of milkrun operations [12], Mohd et al. focus on the minimization of transportation distances [13] and Eroglu et al [14]. describe the capacity-related aspects of milkrun design. In this approach, these aspects are integrated into a design model, which makes it possible to take various aspects of milkrun design and operation into consideration.
The added value of this paper is the description of hub-based milkrun supply, which focuses on the improvement in milkrun supply efficiency. The scientific contribution of this paper for researchers is the mathematical model, which makes it possible to compare conventional and hub-based milkrun supply solutions from distance, time, energy consumption, and emission points of view. The results can be generalized because the mathematical model makes it possible to compare different types of milkrun solutions. Depending on the milkrun supply strategy, the strategy-related constraints can be redefined, and novel supply strategies can be analyzed.
The real-world applicability can be proved by a wide range of industrial field including internal transport, order picking, storage systems, assembly, packaging, and logistics [44]. The optimization of milkrun solutions can significantly increase the efficiency of industrial processes, especially in the case of integration with other tools (last-mile logistics, shipment management, and geocoding) [45]. Nitor assisted a leading Indian automotive manufacturer to develop a cutting-edge application that provides comprehensive visibility and tracking of their milkrun supply chain, significantly enhancing overall efficiency. This project serves as an exemplary case of a milkrun application, demonstrating how advanced technology can optimize supply chain operations [46]. These industrial examples significantly show and prove the proposed hub-based model’s real-world applicability.
The described method makes it possible to support managerial decisions, because based on the results of optimization, the supply strategy can be improved. However, there are also limitations of the study. The model and the optimization focus on deterministic parameters, the uncertainties of the demands, and the quantity and quality of the required components; transportation and material handling times are not taken into consideration [47]. A potential future research direction is to model uncertainties using fuzzy models. Another potential research direction is the analysis of the impact of Industry 4.0 technologies on the efficiency of routing and scheduling of milkrun routes. It is possible to apply digital twin technologies and smart sensor networks to support real-time decision making in the design and operation of routing of milkrun trolleys.
Funding
This research received no external funding.
Data Availability Statement
Data are unavailable due to privacy restrictions.
Conflicts of Interest
The author declares no conflicts of interest.
References
- Arvidsson, N. The milk run revisited: A load factor paradox with economic and environmental implications for urban freight transport. Transp. Res. Part A Policy Pract. 2013, 51, 56–62. [Google Scholar] [CrossRef]
- Novaes, A.G.N.; Bez, E.T.; Burin, P.J.; Aragão, D.P. Dynamic milk-run OEM operations in over-congested traffic conditions. Comput. Ind. Eng. 2015, 88, 326–340. [Google Scholar] [CrossRef]
- Emde, S.; Abedinnia, H.; Glock, C.H. Scheduling electric vehicles making milk-runs for just-in-time delivery. IISE Trans. 2018, 50, 1013–1025. [Google Scholar] [CrossRef]
- Luo, X.; Jiang, Y.; Wu, Q.; Zhao, B.; Yao, Z. Design of hub stops and milk-run routes in transit network between urban area and suburb. Harbin Gongye Daxue Xuebao J. Harbin Inst. Technol. 2019, 51, 135–140. [Google Scholar] [CrossRef]
- Karouani, Y.; Elgarej, M. Milk-run collection monitoring system using the internet of things based on swarm intelligence. Int. J. Inf. Syst. Supply Chain Manag. 2022, 15, 3. [Google Scholar] [CrossRef]
- Dewitz, M.; Günthner, W.A.; Arlt, T. Timetable optimization for in-plant milk-run systems. Logist. J. 2014, 1, 1–14. [Google Scholar] [CrossRef]
- Kilic, H.S.; Durmusoglu, M.B.; Baskak, M. Classification and modeling for in-plant milk-run distribution systems. Int. J. Adv. Manuf. Technol. 2012, 62, 1135–1146. [Google Scholar] [CrossRef]
- Bocewicz, G.; Banaszak, Z.; Rudnik, K.; Smutnicki, C.; Witczak, M. An ordered-fuzzy-numbers-driven approach to the milk-run routing and scheduling problem. J. Comput. Sci. 2021, 49, 101288. [Google Scholar] [CrossRef]
- Çakir, E.; Ulukan, Z.; Kahraman, C.; Saǧlam, C.Ö.; Kuleli Pak, B. Intuitionistic fuzzy multi-objective milk-run modelling under time window constraints. J. Intell. Fuzzy Syst. 2022, 42, 47–62. [Google Scholar] [CrossRef]
- Facchini, F.; Mossa, G.; Sassanelli, C.; Digiesi, S. IoT-based milk-run routing for manufacturing system: An application case in an automotive company. Int. J. Prod. Res. 2024, 62, 536–555. [Google Scholar] [CrossRef]
- Akkad, M.Z.; Bányai, T. Energy Consumption Optimization of Milk-Run-Based In-Plant Supply Solutions: An Industry 4.0 Approach. Processes 2023, 11, 799. [Google Scholar] [CrossRef]
- De Souza, R.; William, L.; Lee, C.K. Marginalizing last mile logistics cost through 4th party milk run. Adv. Sci. Technol. Eng. Syst. 2019, 4, 462–467. [Google Scholar] [CrossRef]
- Mohd, S.; Noor, A.; Ahmad, S.F.; Shaharudin, M.R.; Rahim, S.A. Evaluation of transportation distance optimization route for milk run logistics system. Int. J. Supply Oper. Manag. 2023, 10, 295–318. [Google Scholar] [CrossRef]
- Eroglu, D.Y.; Cagliano, A.C.; Rafele, C. A multi-capacity integrated vehicle routing and loading model for pickup milk run. Int. J. Mech. Control 2017, 18, 107–122. [Google Scholar]
- Adriano, D.D.; Montez, C.; Novaes, A.G.; Wangham, M. DMRVR: Dynamic milk-run vehicle routing solution using fog-based vehicular ad hoc networks. Electronics 2020, 9, 2010. [Google Scholar] [CrossRef]
- Gil Vilda, F.; Yagüe-Fabra, J.A.; Sunyer Torrents, A. An in-plant milk-run design method for improving surface occupation and optimizing mizusumashi work time. CIRP Ann. 2020, 69, 405–408. [Google Scholar] [CrossRef]
- Dat Minh, N.; Trung Kien, D.; Khac Hau, P. Applying milk-run method to optimize cost of transport: An empirical evidence. Int. J. Supply Oper. Manag. 2020, 7, 178–188. [Google Scholar] [CrossRef]
- Mai, J.-J.; Chen, F. Uncertain milk run-based cross docking scheduling: Model and algorithms. Shanghai Jiaotong Daxue Xuebao J. Shanghai Jiaotong Univ. 2011, 45, 159–163. [Google Scholar]
- Bocewicz, G.; Bozejko, W.; Wójcik, R.; Banaszak, Z. Milk-run routing and scheduling subject to a trade-off between vehicle fleet size and storage capacity. Manag. Prod. Eng. Rev. 2019, 10, 41–53. [Google Scholar] [CrossRef]
- Bocewicz, G.; Nielsen, I.; Gola, A.; Banaszak, Z. Reference model of milk-run traffic systems prototyping. Int. J. Prod. Res. 2021, 59, 4495–4512. [Google Scholar] [CrossRef]
- Chee, S.L.; Mong, M.Y.; Chin, J.F. Milk-run kanban system for raw printed circuit board withdrawal to surface-mounted equipment. J. Ind. Eng. Manag. 2012, 5, 382–405. [Google Scholar] [CrossRef]
- Du, T.; Wang, B.; Lu, P.-Y. A real-time vehicle-dispatching system for consolidating milk runs. Transp. Res. Part E Logist. Transp. Rev. 2007, 43, 565–577. [Google Scholar] [CrossRef]
- Emde, S.; Zehtabian, S.; Disser, Y. Point-to-point and milk run delivery scheduling: Models, complexity results, and algorithms based on Benders decomposition. Ann. Oper. Res. 2023, 322, 467–496. [Google Scholar] [CrossRef]
- Goto, M.; Masui, T.; Tawara, N. A mixed distribution system of direct and relay delivery methods based on an analogy of milk-run logistics. J. Jpn. Ind. Manag. Assoc. 2007, 58, 79–86. [Google Scholar]
- Klenk, E.; Galka, S.; Günthner, W.A. Potentials of a in-plant milk run control. ZWF Z. Fuer Wirtsch. Fabr. 2015, 110, 805–809. [Google Scholar] [CrossRef]
- Aragão, D.P.; Novaes, A.G.N.; Luna, M.M.M. An agent-based approach to evaluate collaborative strategies in milk-run OEM operations. Comput. Ind. Eng. 2019, 129, 545–555. [Google Scholar] [CrossRef]
- Marialuisa, M.; Matteo, M.; Muhammad, S. Optimizing milk-run system and IT-based Kanban with artificial intelligence: An empirical study on multi-lines assembly shop floor. Prod. Manuf. Res. 2023, 11, 2179123. [Google Scholar] [CrossRef]
- Korytkowski, P.; Karkoszka, R. Simulation-based efficiency analysis of an in-plant milk-run operator under disturbances. Int. J. Adv. Manuf. Technol. 2016, 82, 827–837. [Google Scholar] [CrossRef]
- Chen, J.; Wang, K.; Huang, Y. An integrated inbound logistics mode with intelligent scheduling of milk-run collection, drop and pull delivery and LNG vehicles. J. Intell. Manuf. 2021, 32, 2257–2265. [Google Scholar] [CrossRef]
- Meyer, A.; Amberg, B. Transport concept selection considering supplier milk runs—An integrated model and a case study from the automotive industry. Transp. Res. Part E Logist. Transp. Rev. 2018, 113, 147–169. [Google Scholar] [CrossRef]
- Baals, J. Environmental aspects in supplier networks-a bi-objective just-in-time truck routing problem. Int. J. Prod. Res. 2024, 62, 4290–4313. [Google Scholar] [CrossRef]
- Katon, Y.C.; Artana, K.B.; Pujawan, I.N.; Putra, B.W. Performance Assessment of Fertilizer Industry Supply Chain Using a System Dynamics Approach. Int. Rev. Mech. Eng. 2023, 17, 557–565. [Google Scholar] [CrossRef]
- Nalbur, B.E.; Yavas, O. System dynamics model and discrete-event simulation of green logistics cases for the electric bus industries. Int. J. Glob. Warm. 2024, 32, 148–159. [Google Scholar] [CrossRef]
- Zhou, B.; Zhu, Z. Optimally scheduling and loading tow trains of in-plant milk-run delivery for mixed-model assembly lines. Assem. Autom. 2020, 40, 511–530. [Google Scholar] [CrossRef]
- Sarkar, B.D.; Joshi, P.V.; Shah, N. Reverse milk run—The logistics retrenchment strategy. Emerald Emerg. Mark. Case Stud. 2023, 13, 1–23. [Google Scholar] [CrossRef]
- Kochanska, J.; Burduk, A.; Łapczynska, D.; Musiał, K. The solution of MRSLP with the use of heuristic algorithms. Bull. Pol. Acad. Sci. Tech. Sci. 2024, 72, 146407. [Google Scholar] [CrossRef]
- Zhou, B.; Zhao, Z. An adaptive artificial bee colony algorithm enhanced by Deep Q-Learning for milk-run vehicle scheduling problem based on supply hub. Knowl.-Based Syst. 2023, 264, 110367. [Google Scholar] [CrossRef]
- Ranjbaran, F.; Husseinzadeh Kashan, A.; Kazemi, A. Mathematical formulation and heuristic algorithms for optimisation of auto-part milk-run logistics network considering forward and reverse flow of pallets. Int. J. Prod. Res. 2020, 58, 1741–1775. [Google Scholar] [CrossRef]
- Amaral, V.P.; Ferreira, A.C.; Ramos, B. Internal Logistics Process Improvement using PDCA: A Case Study in the Automotive Sector. Bus. Syst. Res. 2022, 13, 100–115. [Google Scholar] [CrossRef]
- Humang, W.P.; Hadiwardoyo, S.P.; Nahry, A. Bi-level model on freight distribution network integration in archipelagic region with milk run time windows and uncertainty. Int. J. Eng. Res. Technol. 2020, 13, 831–841. [Google Scholar] [CrossRef]
- Kocaoglu, Y.; Cakmak, E.; Kocaoglu, B.; Taskin Gumus, A. A Novel Approach for Optimizing the Supply Chain: A Heuristic-Based Hybrid Algorithm. Math. Probl. Eng. 2020, 2020, 3943798. [Google Scholar] [CrossRef]
- Yan, B.; Chen, X.; Liu, Y.; Xia, C. Replenishment decision and coordination contract in cluster supply chain. Ind. Manag. Data Syst. 2019, 119, 1374–1399. [Google Scholar] [CrossRef]
- Ali, S.S.; Deka, S.; Ahmad, Z.; Ahmed, S.; Jaswal, M. Feasibility of drone integration as last mile delivery. Emerald Emerg. Mark. Case Stud. 2019, 9, 1–17. [Google Scholar] [CrossRef]
- The Power of Milkrun in Logistics. Available online: https://www.multitube.com/en/power-milk-run-in-logistics/l776c30 (accessed on 16 August 2024).
- Milkrun Optimization—Calculate Cost-Optimal Routes for Inbound and Outbound Shipments. Available online: https://log-hub.com/supply-chain-apps/milkrun-optimization/ (accessed on 16 August 2024).
- Milk Run Supply Chain Automation. Available online: https://www.nitorinfotech.com/wp-content/uploads/2021/05/Milk-Run-Supply-Chain-Automation.pdf (accessed on 16 August 2024).
- Chen, C. Supply-hub-based Collaborative Replenishment Decisions for Enterprise Supply Logistics Under Demand Uncertainty. Front. Bus. Econ. Manag. 2023, 8, 77–81. [Google Scholar] [CrossRef]
Figure 1.
Conceptual model of conventional milkrun supply.

Figure 2.
Conceptual model of hub-based milkrun supply.
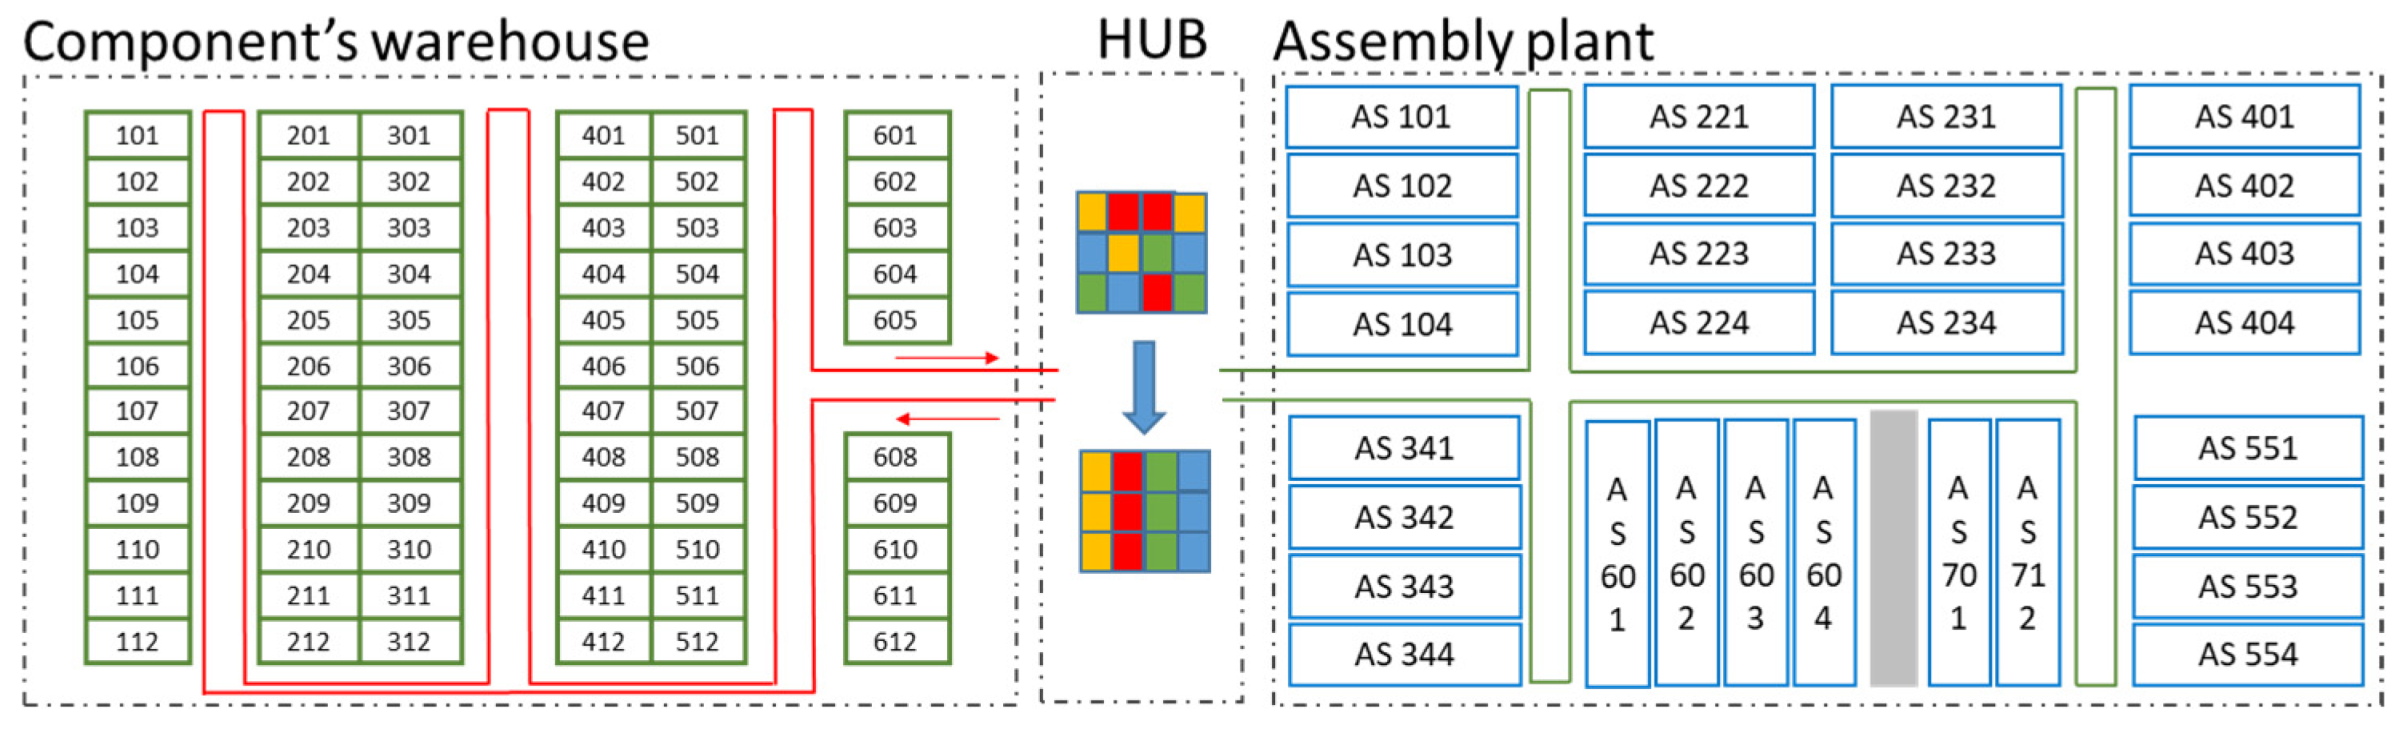
Figure 3.
Process of hub-based milkrun supply.
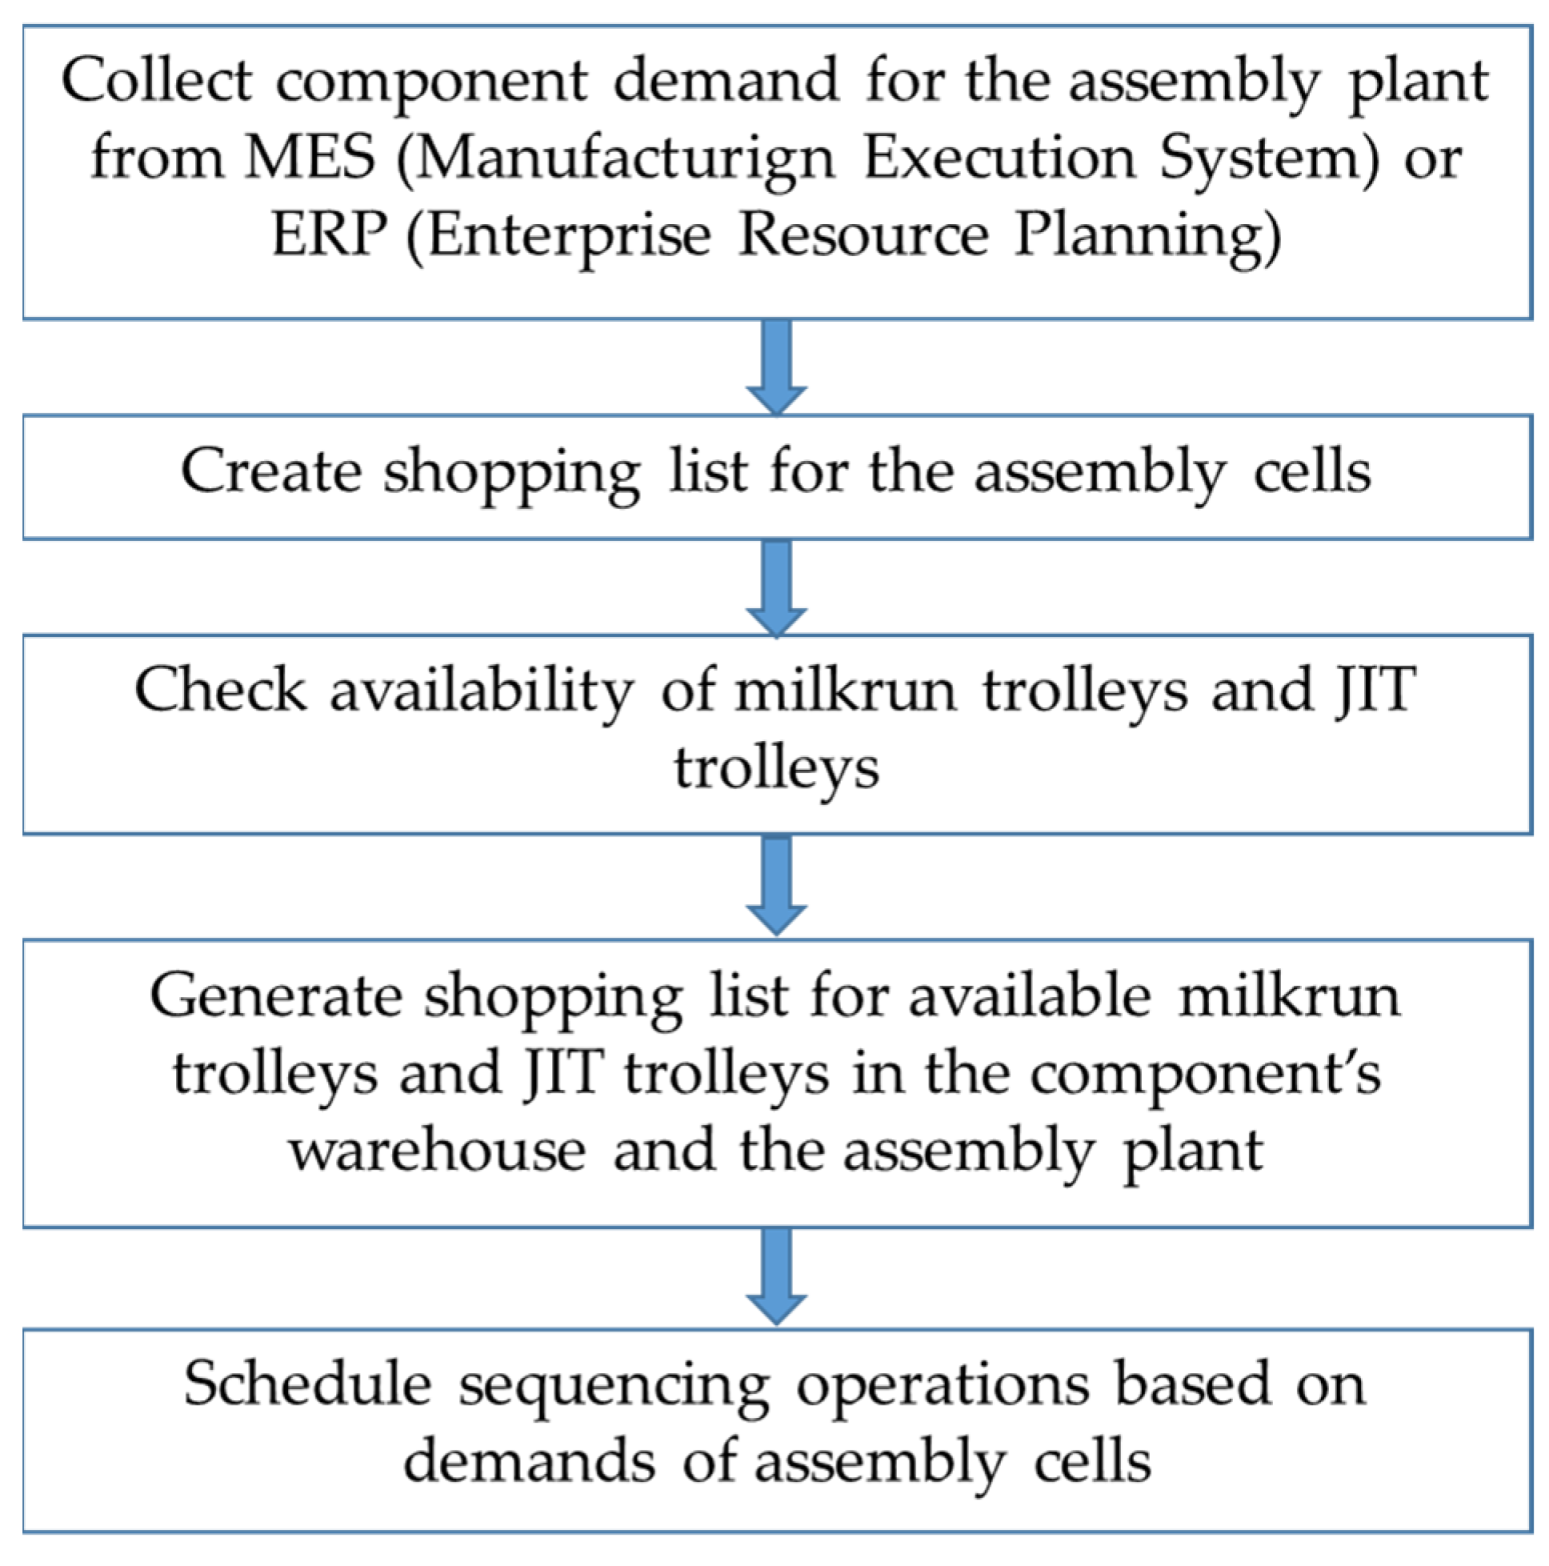
Figure 4.
The structure of the mathematical model.
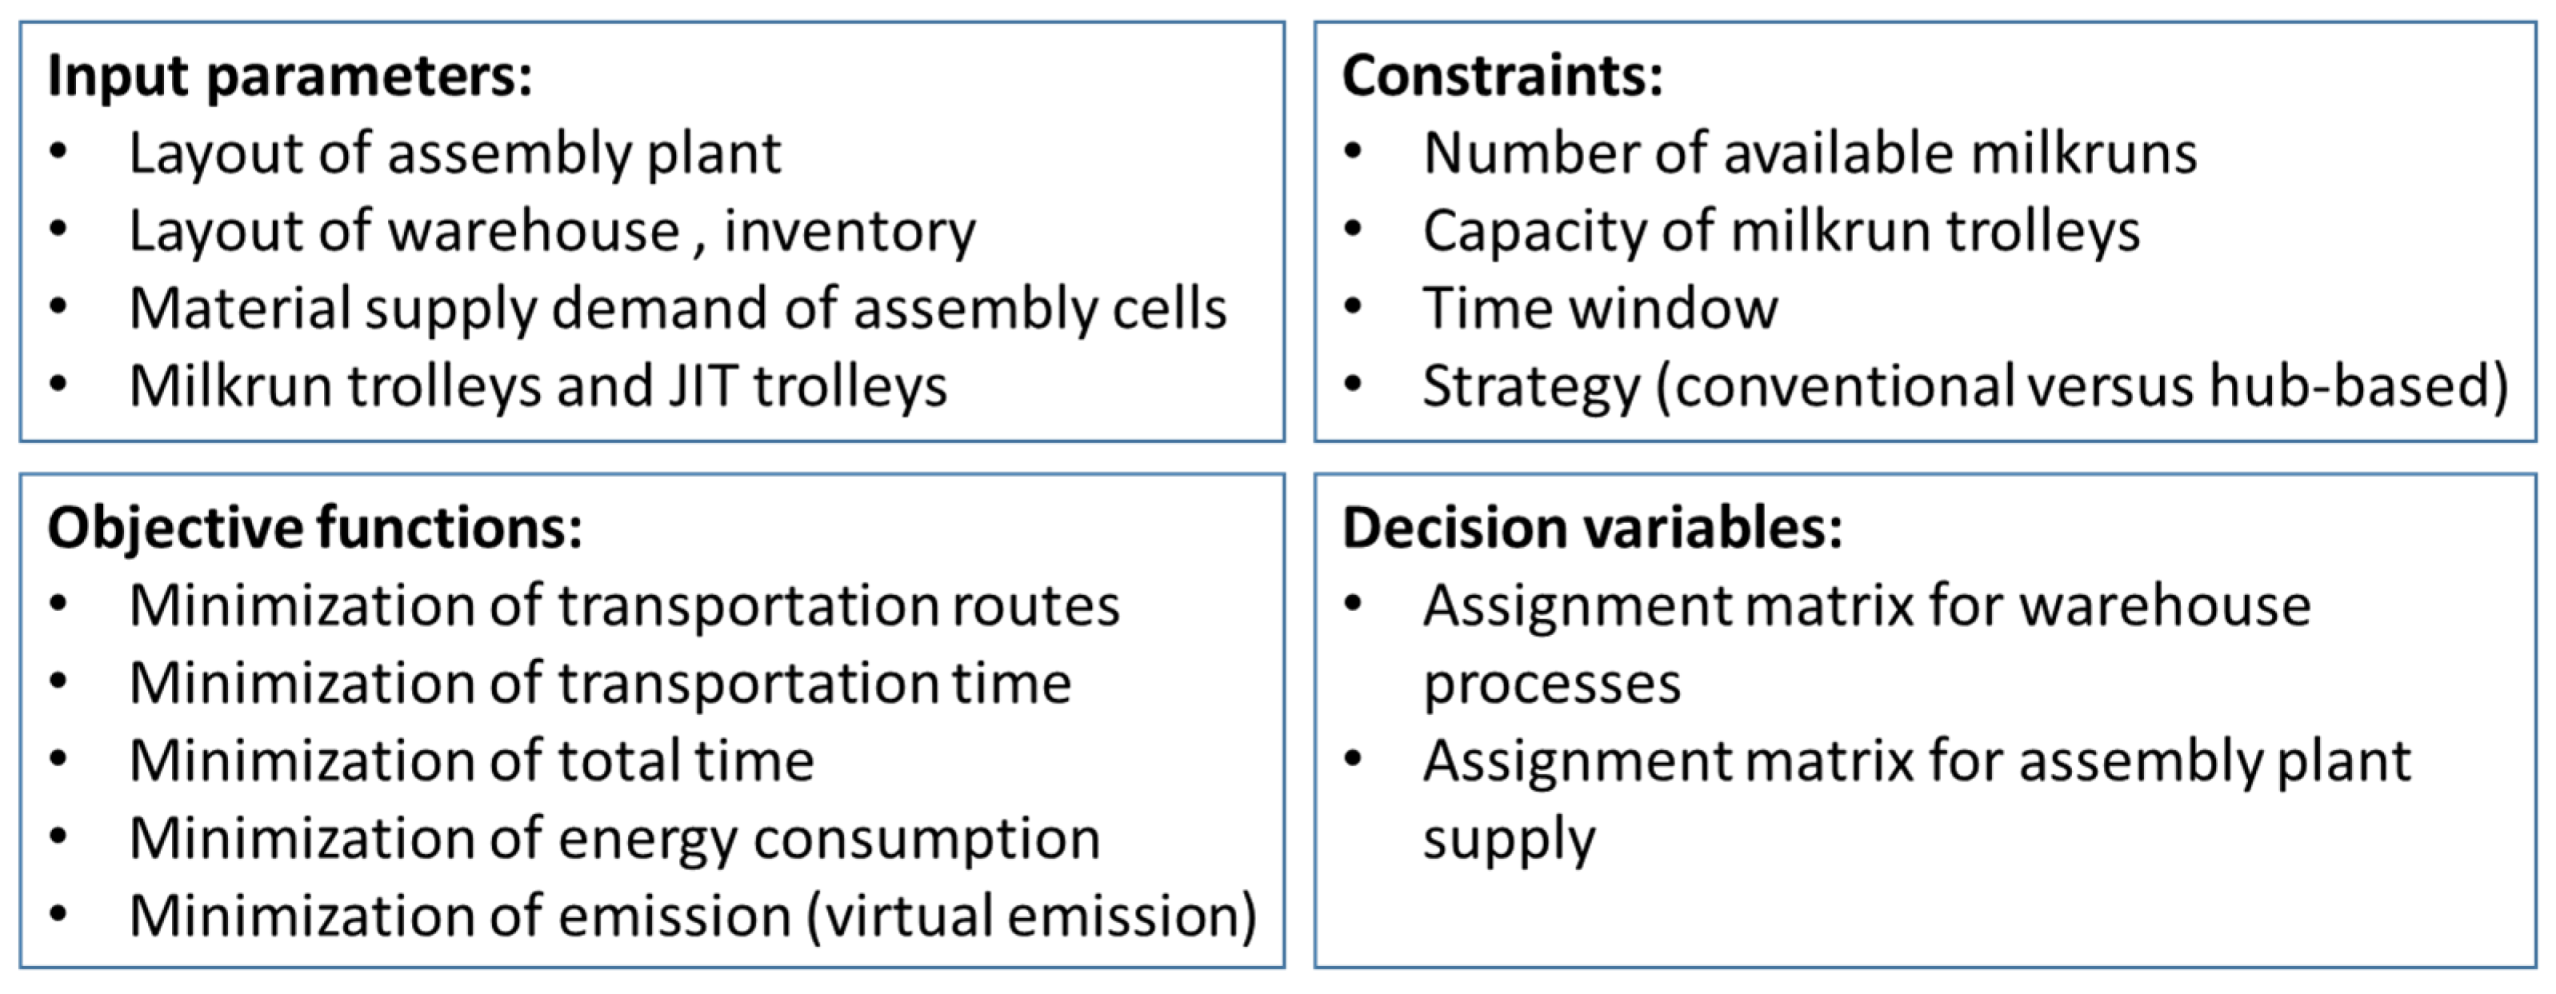
Figure 7.
The optimized milkrun routes within the analyzed time frame in the assembly plant in the case of conventional milkrun supply: (a) Route 1 with milkrun trolley utilization of ; (b) Route 2 with milkrun trolley utilization of ; (c) Route 3 with milkrun trolley utilization of ; (d) Route 4 with milkrun trolley utilization of ; (e) Route 5 with milkrun trolley utilization of ; (f) Route 6 with milkrun trolley utilization of .
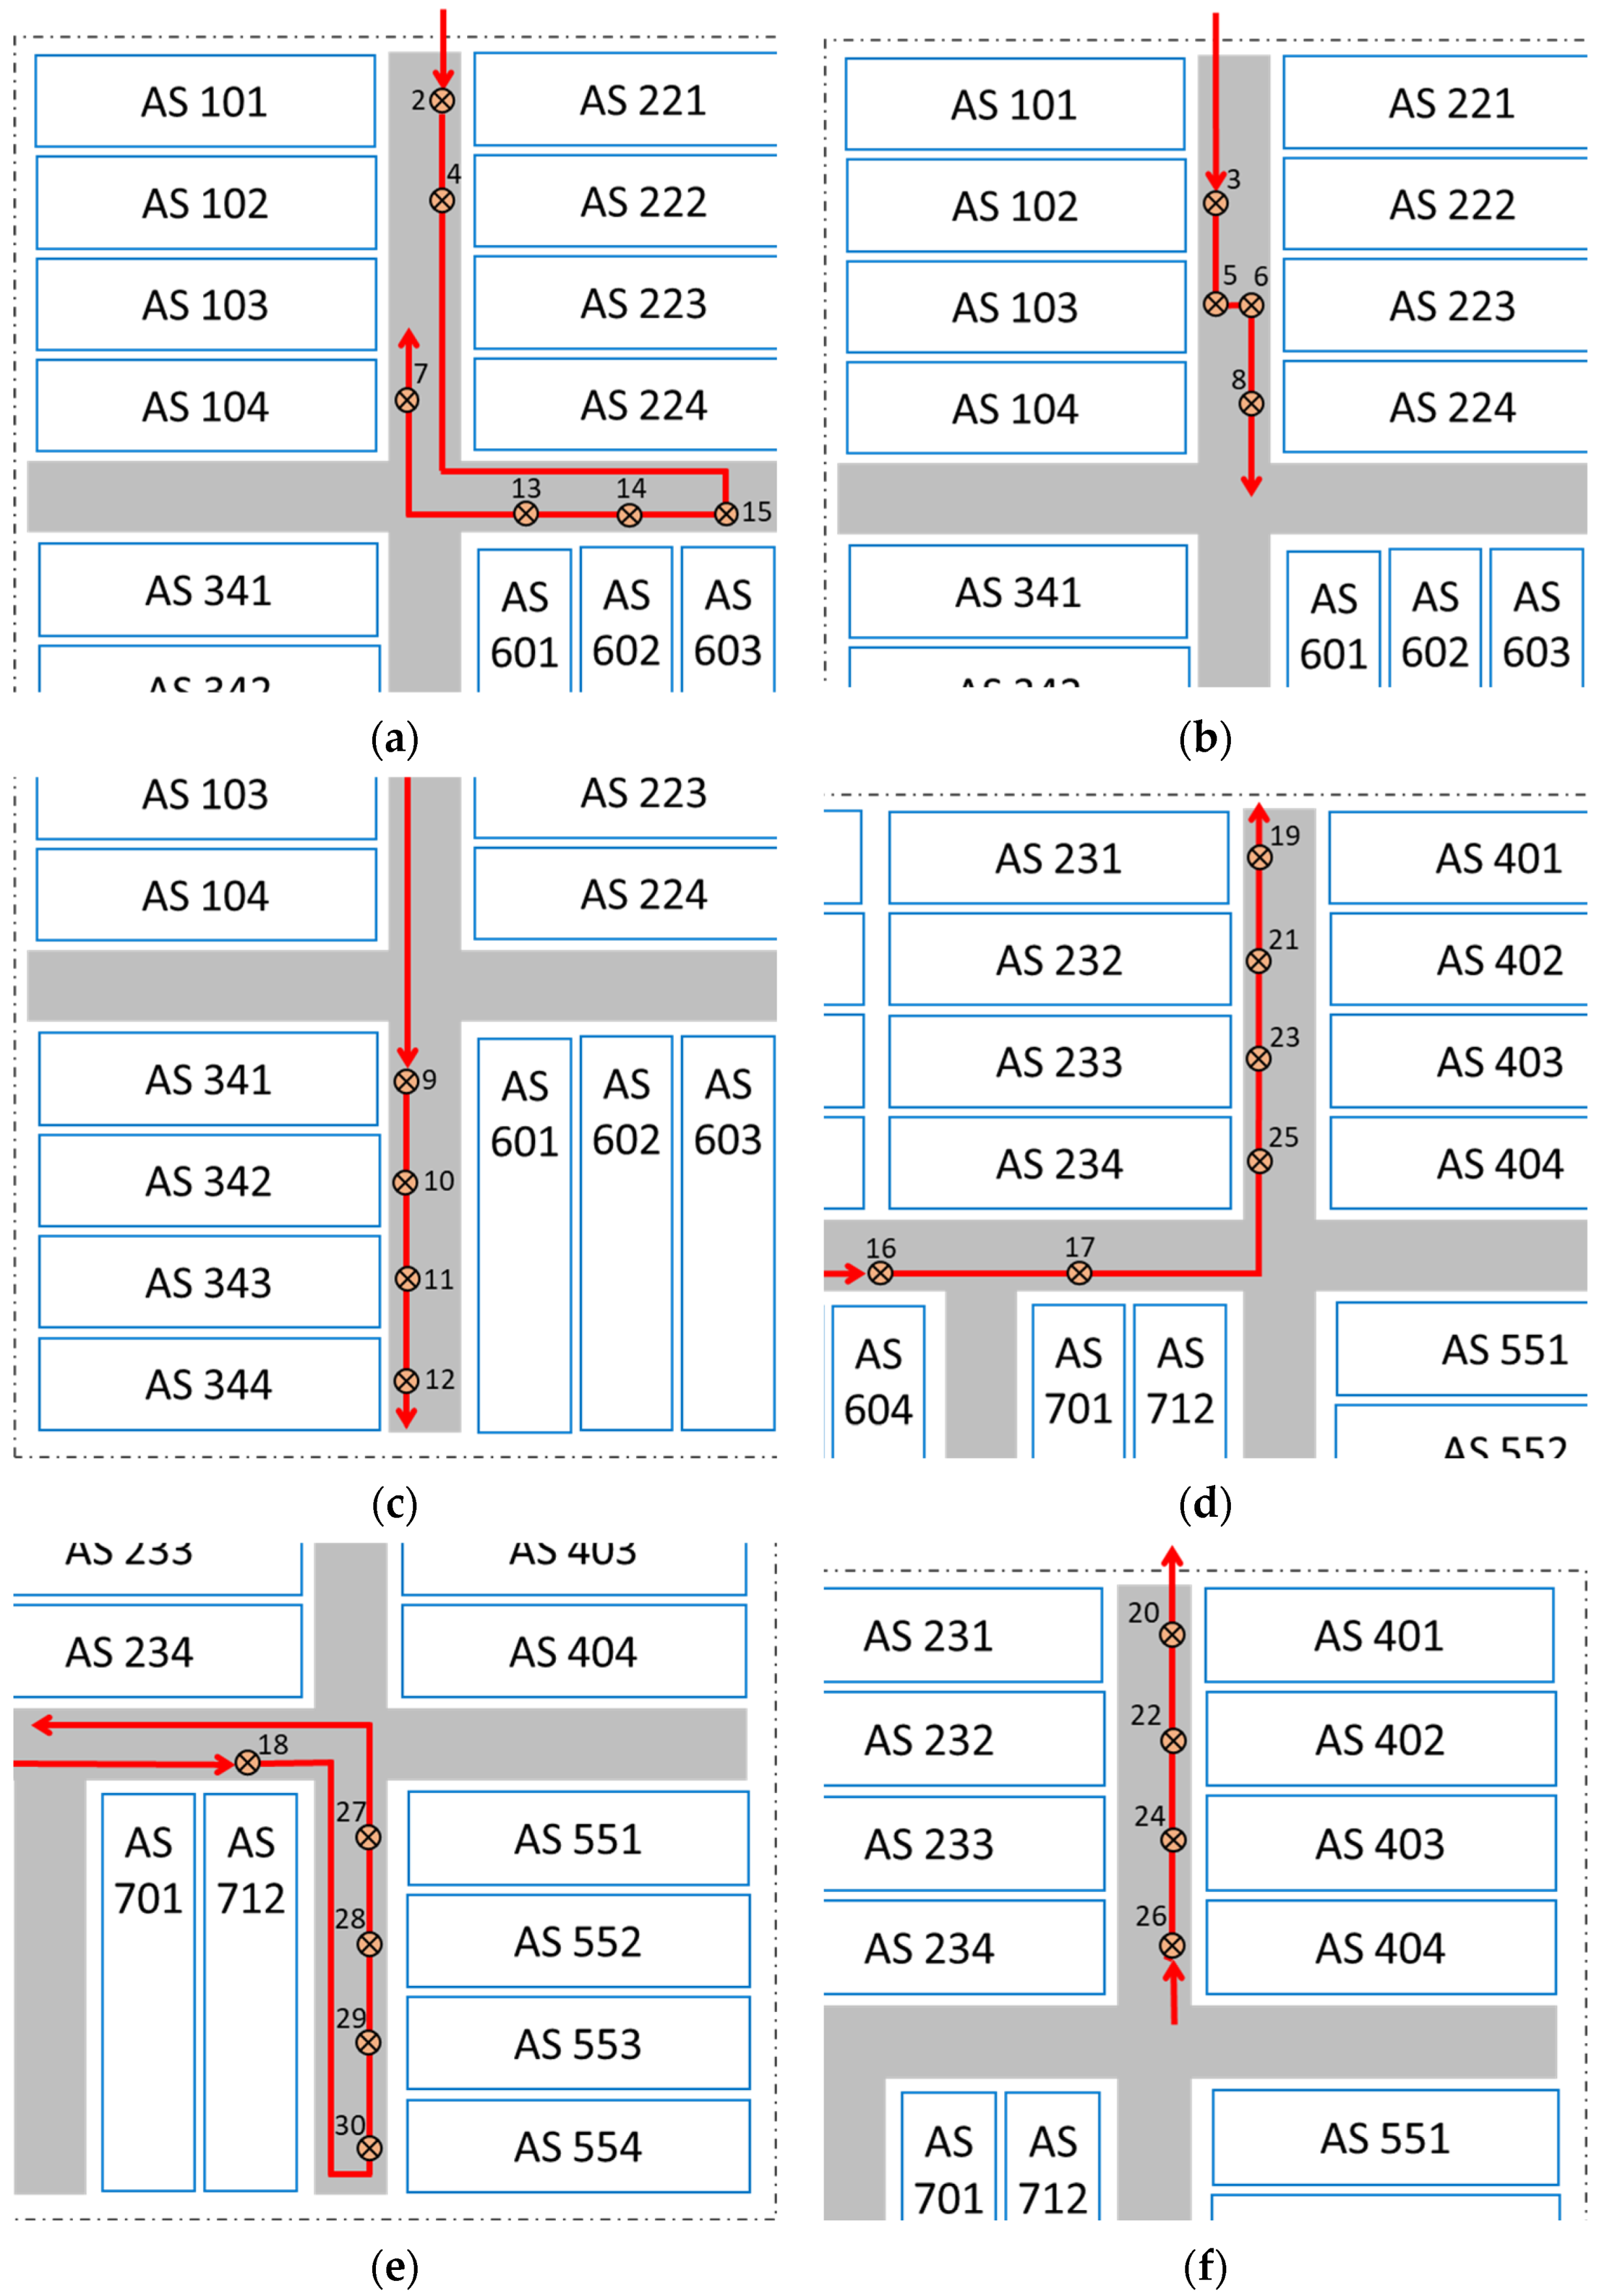
Figure 8.
The optimized milkrun routes within the analyzed time frame in the component’s warehouse in the case of conventional milkrun supply: (a) Route 1 with milkrun trolley utilization of ; (b) Route 2 with milkrun trolley utilization of ; (c) Route 3 with milkrun trolley utilization of ; (d) Route 4 with milkrun trolley utilization of ; (e) Route 5 with milkrun trolley utilization of ; (f) Route 6 with milkrun trolley utilization of .
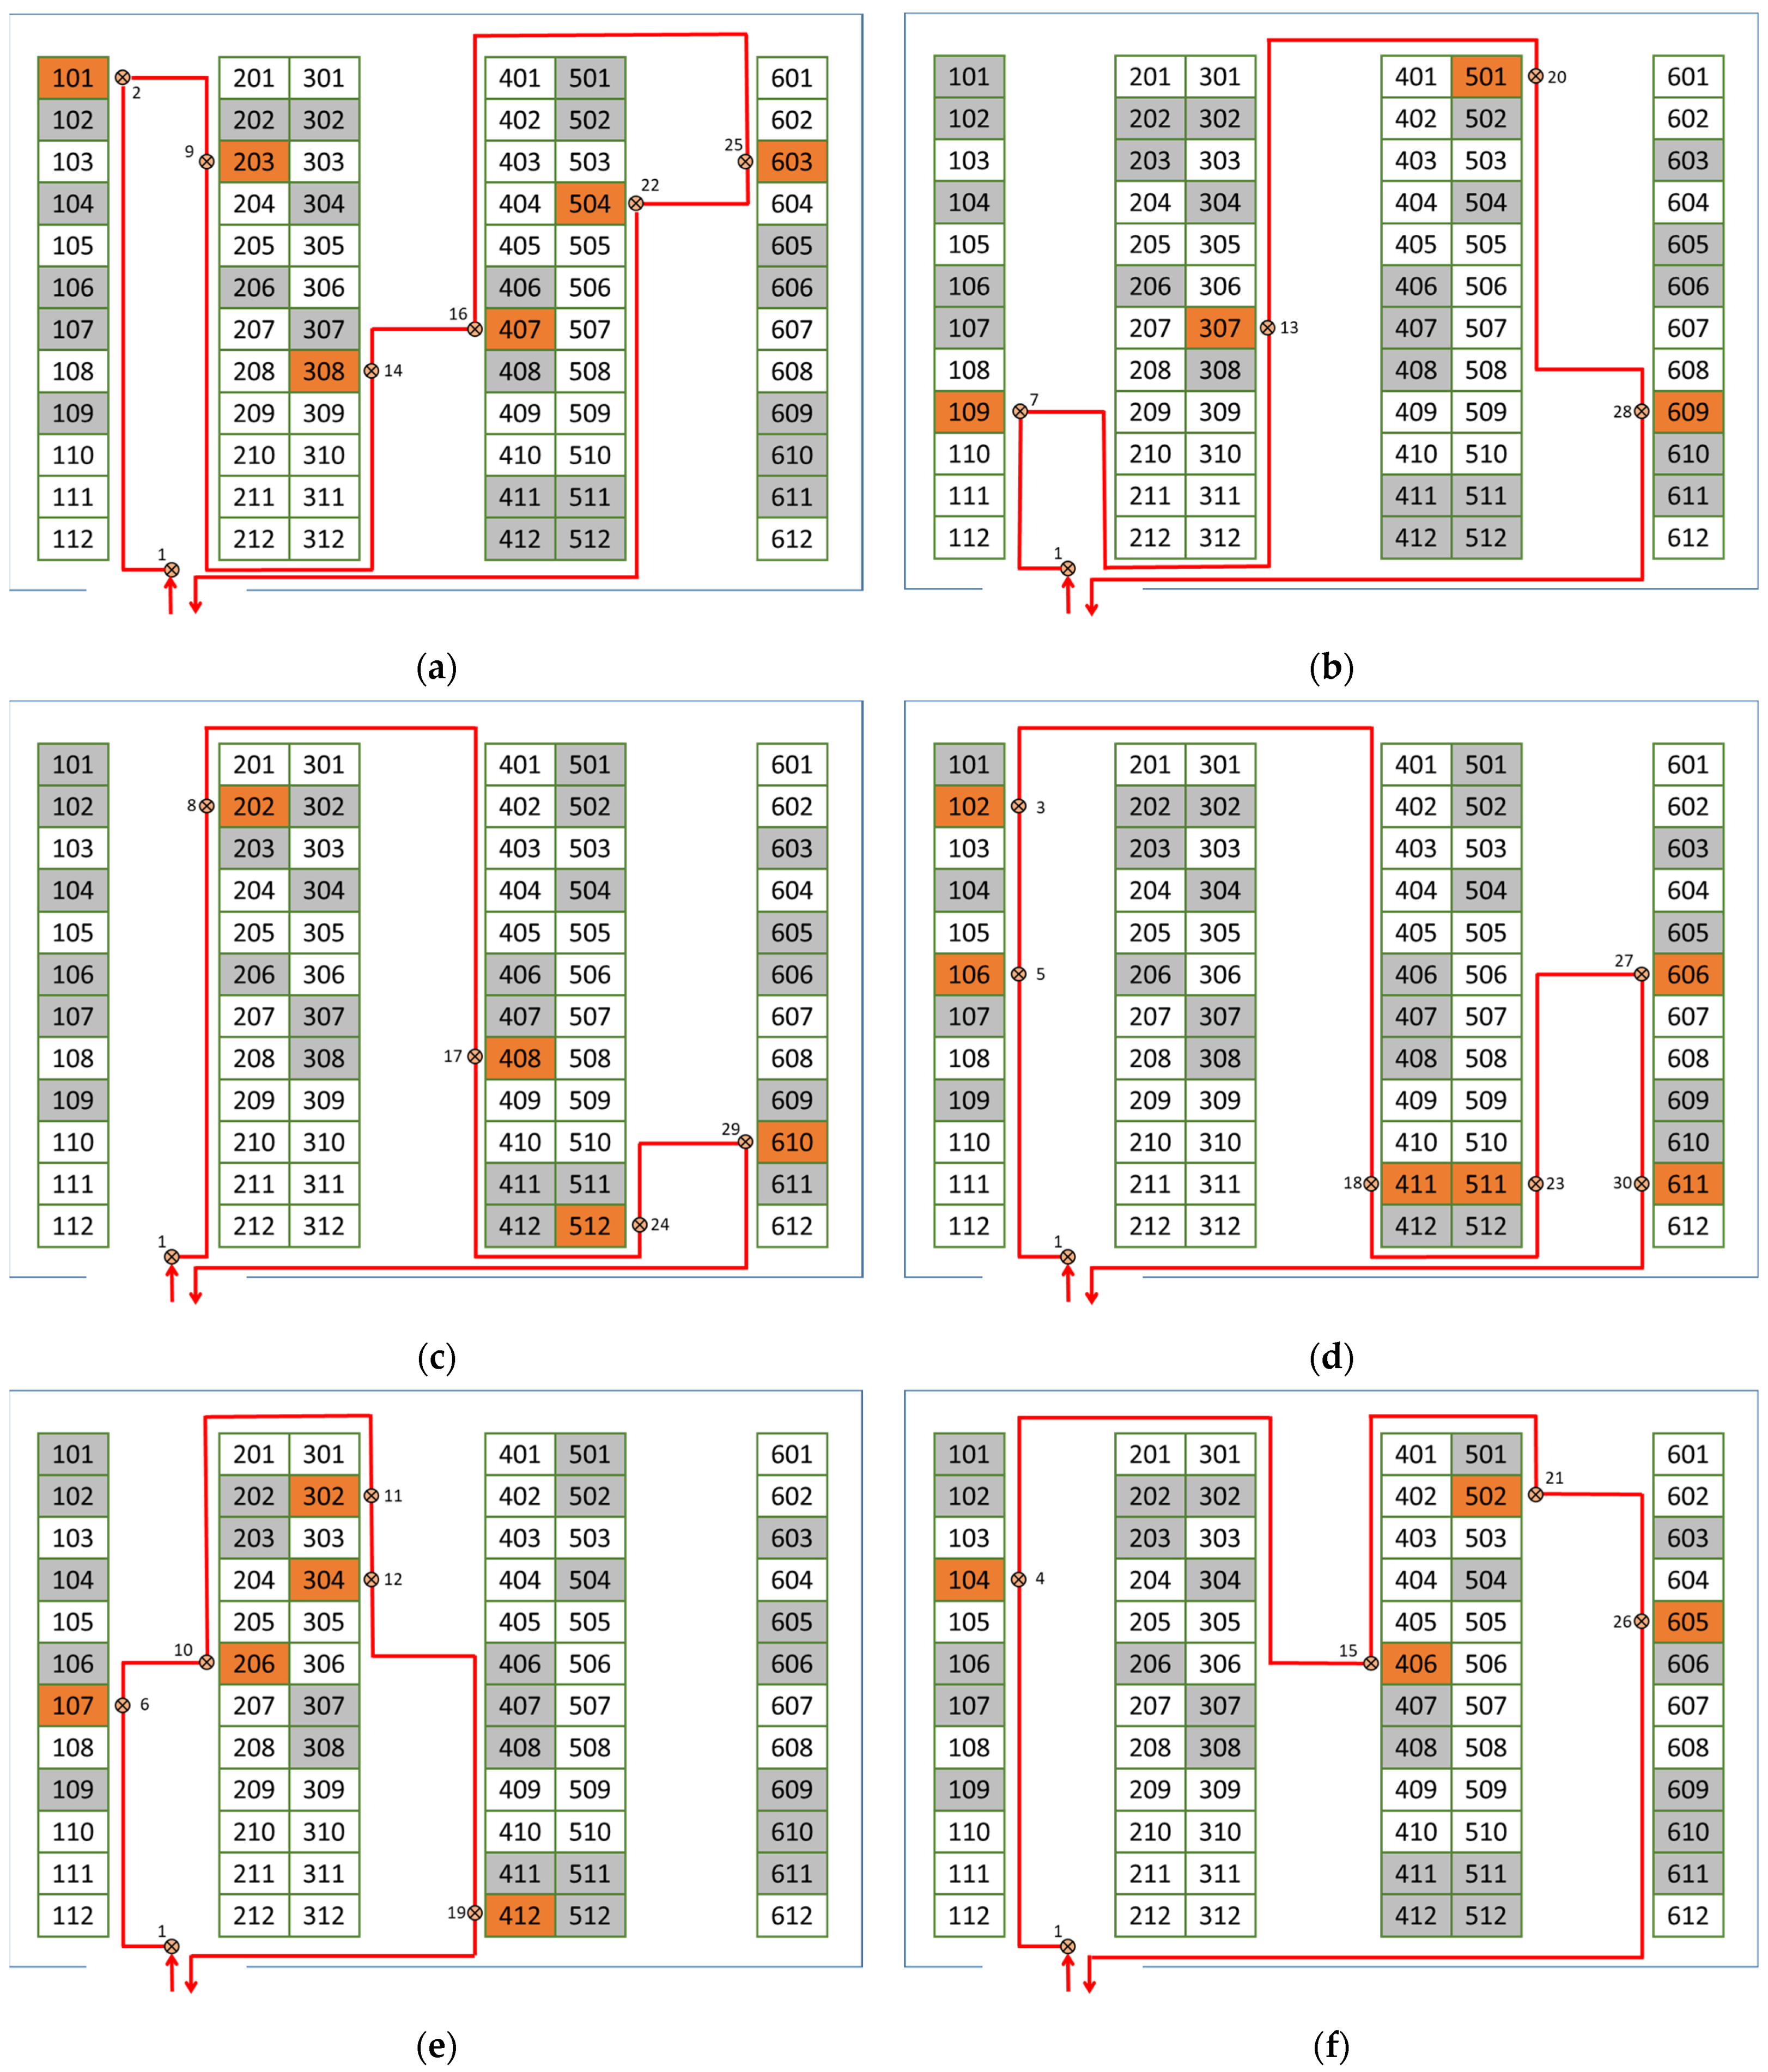
Figure 9.
The transportation and materials handling time of milkrun routes in the assembly plant and in the component’s warehouse in the case of the conventional milkrun supply, where the same milkrun performs both the pickup process in the component’s warehouse and in the assembly plant.
Figure 9.
The transportation and materials handling time of milkrun routes in the assembly plant and in the component’s warehouse in the case of the conventional milkrun supply, where the same milkrun performs both the pickup process in the component’s warehouse and in the assembly plant.

Figure 10.
The optimized milkrun routes within the analyzed time frame in the component’s warehouse in the case of hub-based milkrun supply: (a) Route 1 and Route 2 with milkrun trolley utilization of and ; (b) Route 3 and Route 4 with milkrun trolley utilization of and ; (c) Route 5 and routes 6 and 3 with milkrun trolley utilization of and ; (d) Route 7 with milkrun trolley utilization of .
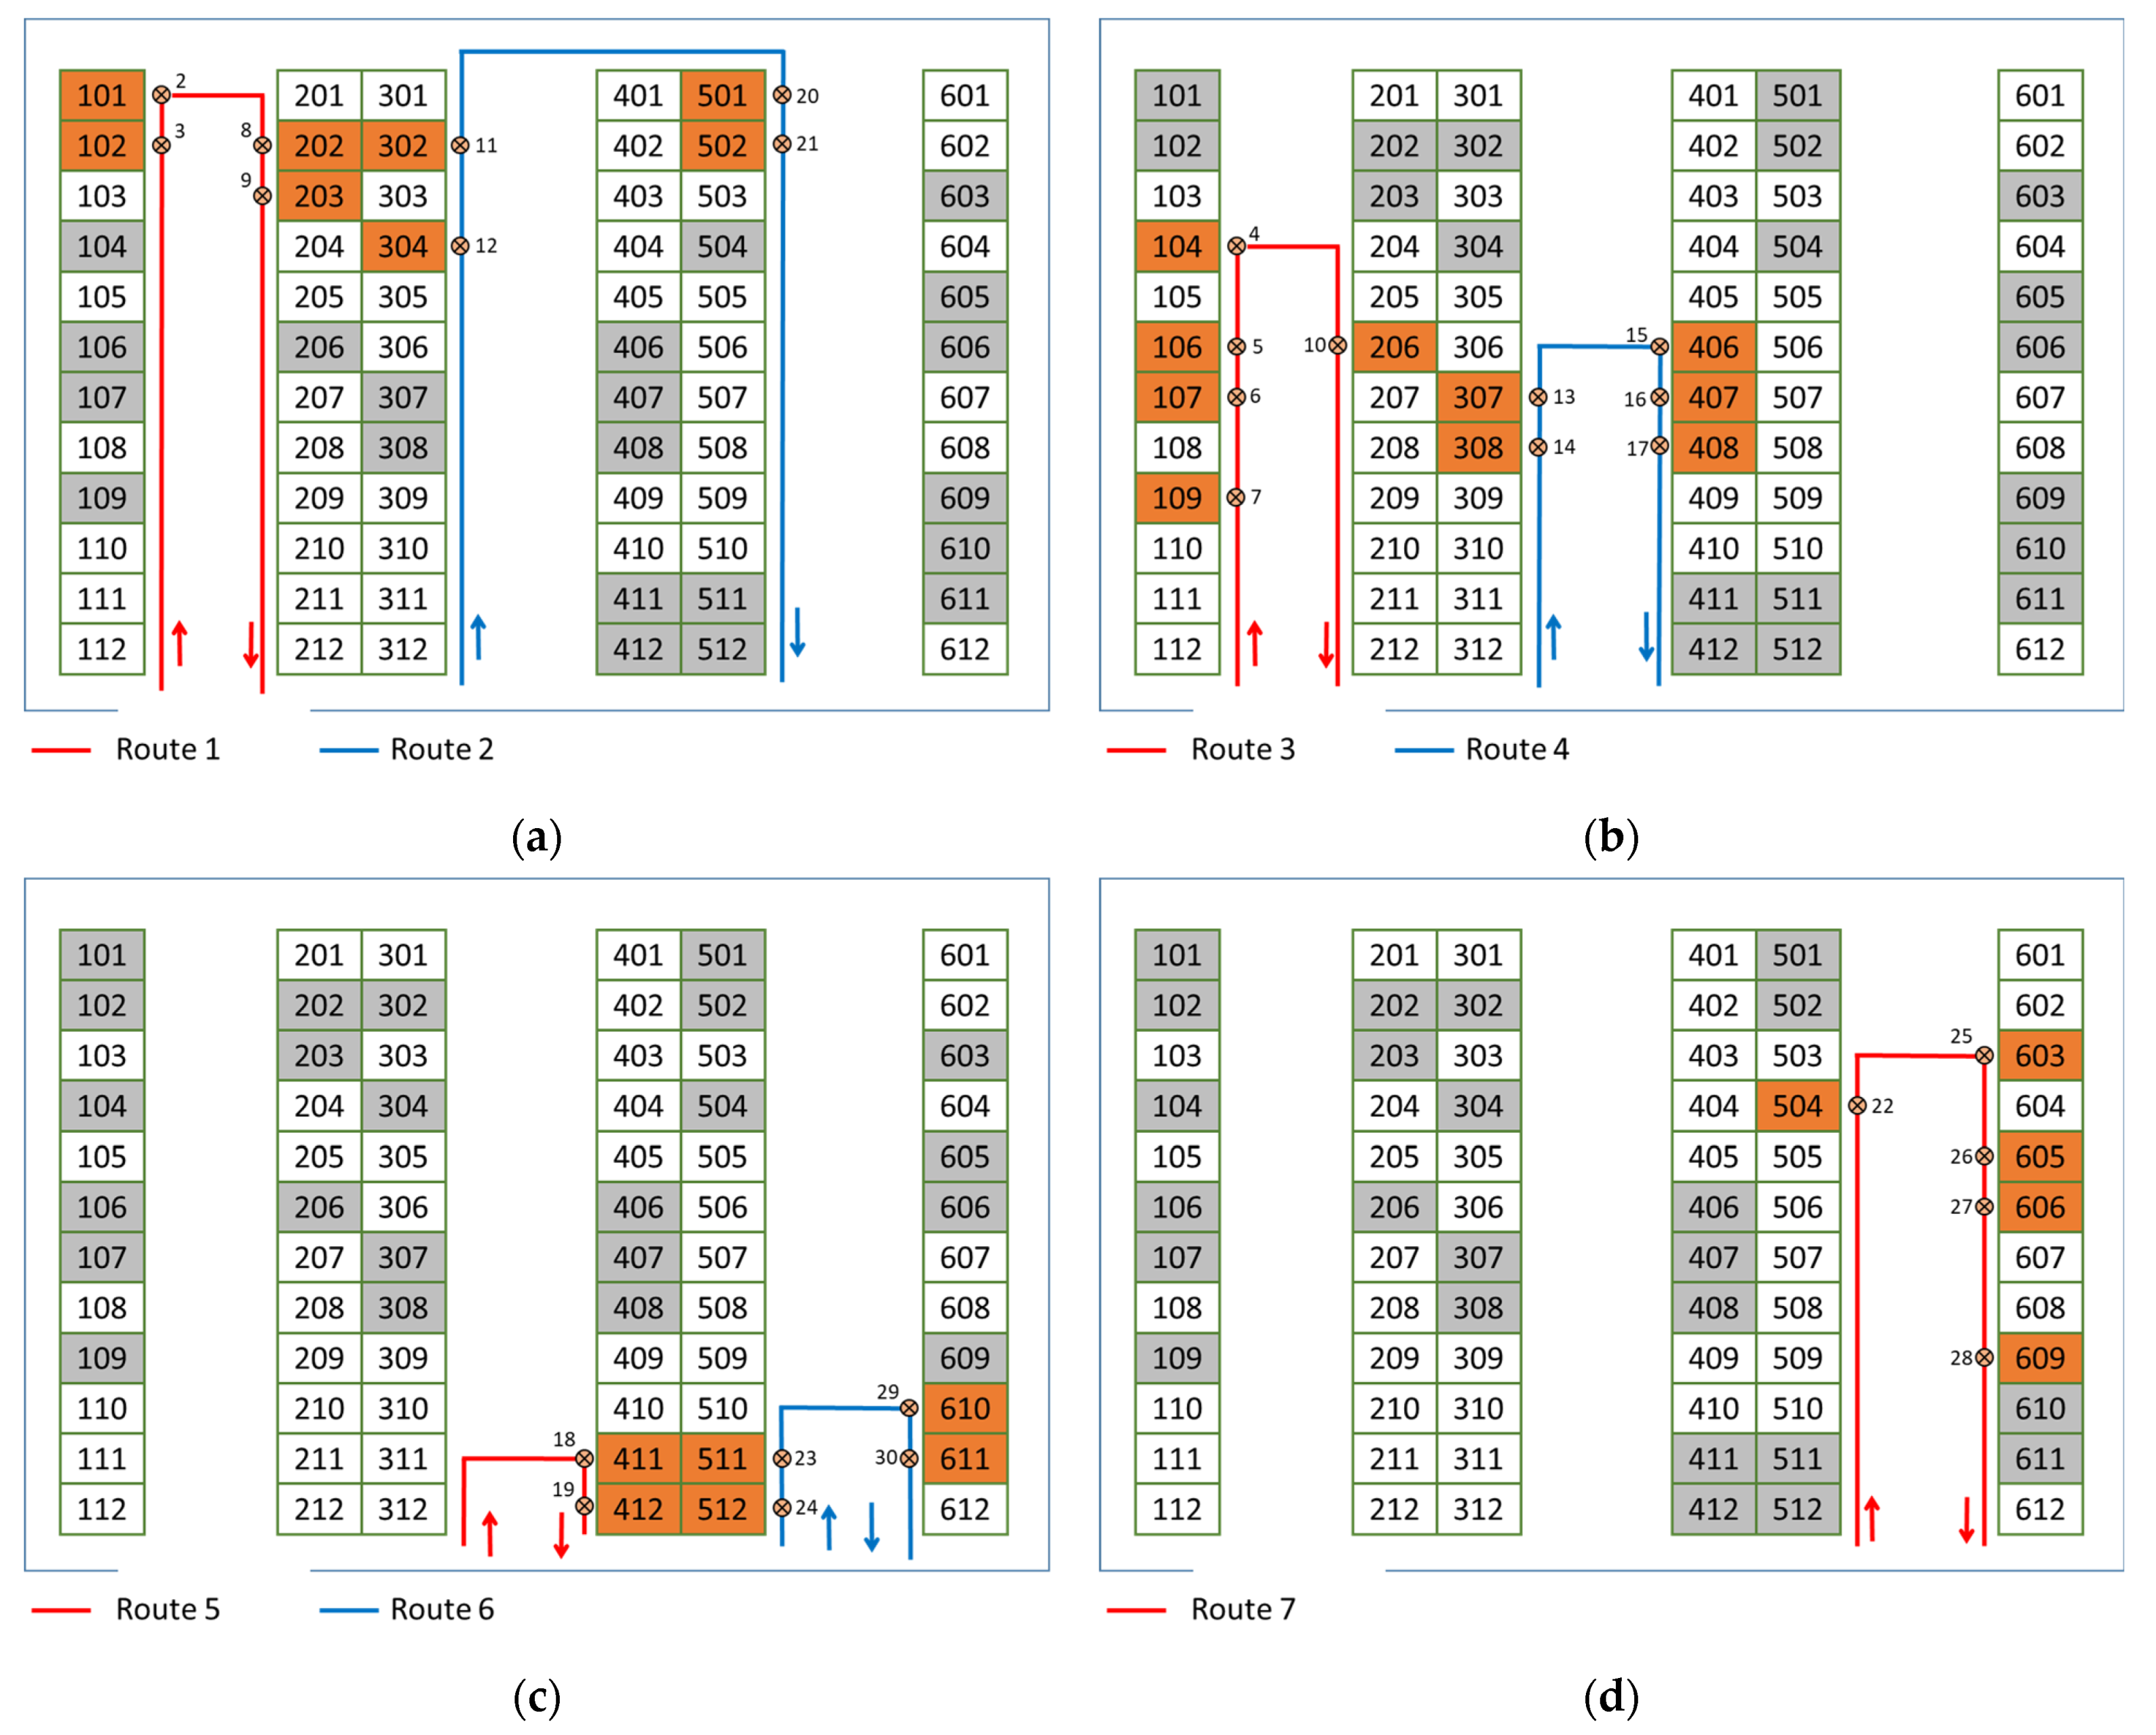
Figure 11.
The transportation and materials handling time of milkrun routes in the assembly plant and in the component’s warehouse in the case of the hub-based milkrun supply.
Figure 11.
The transportation and materials handling time of milkrun routes in the assembly plant and in the component’s warehouse in the case of the hub-based milkrun supply.
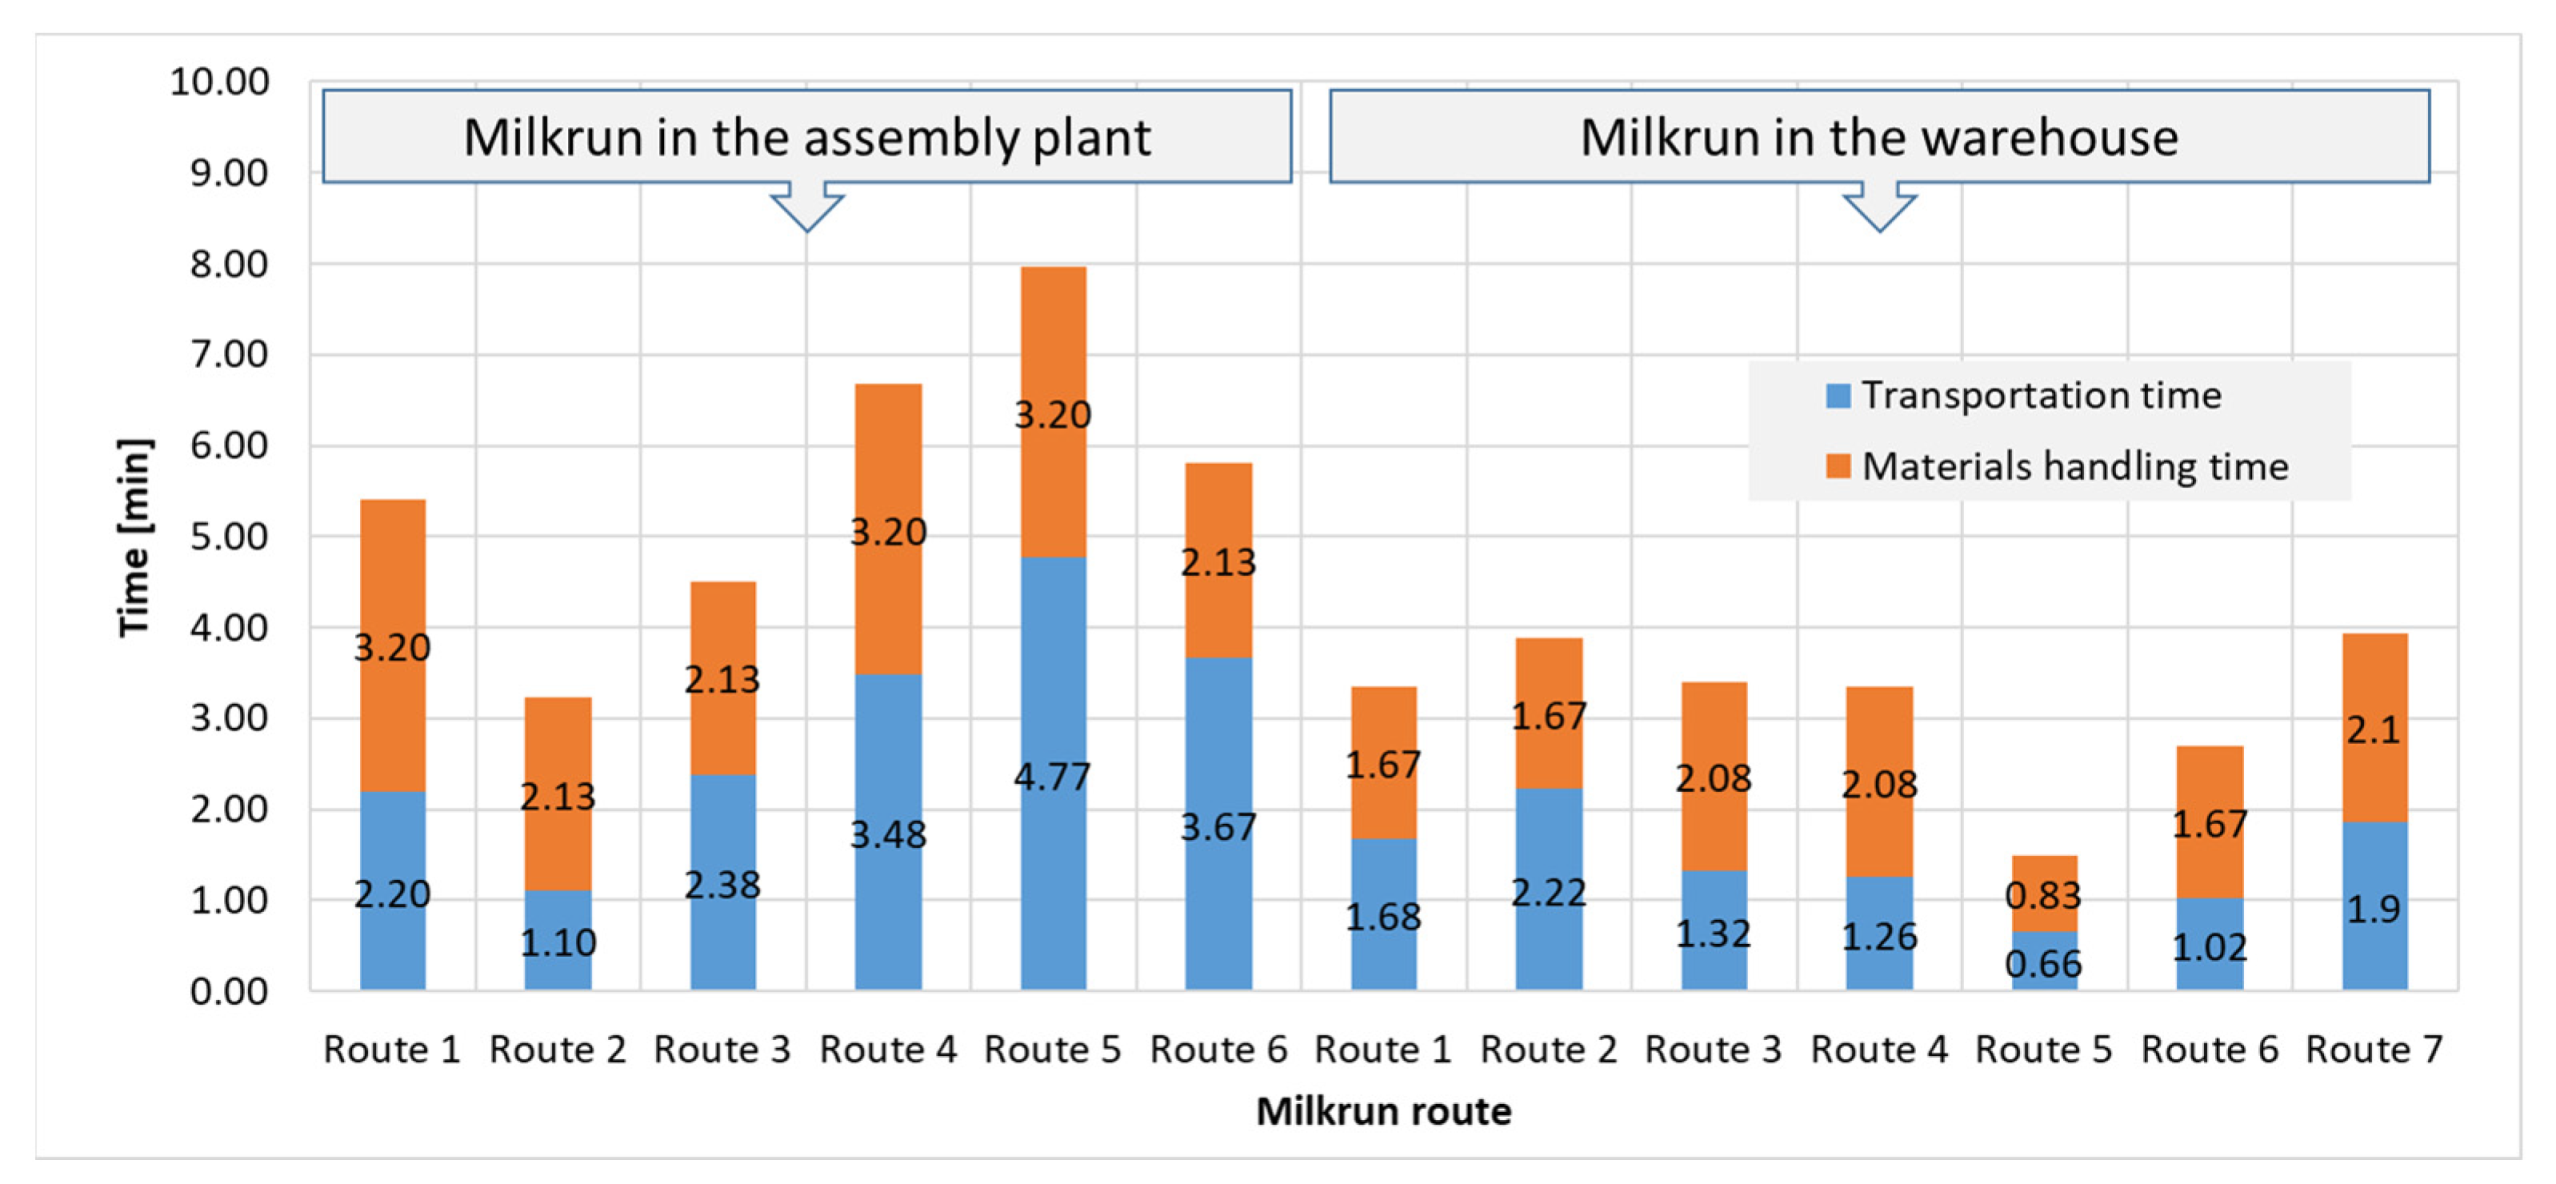
Figure 12.
Comparison of different time components (total time, transportation time, transportation time in the component’s warehouse) in the case of conventional and hub-based milkrun supply.
Figure 12.
Comparison of different time components (total time, transportation time, transportation time in the component’s warehouse) in the case of conventional and hub-based milkrun supply.

Table 1.
Main design aspects, application fields and used technologies.
| Design Aspects | Application Fields | Technologies and Tools |
|---|---|---|
| Economic implications [1] | Traffic networks [2,4,20] | Electric vehicles [3] |
| Environmental implications [2] | Distribution systems [7] | LNG vehicles [29] |
| Timetable optimization [6] | Automotive industry [10] | Internet of Things [5,10] |
| Uncertain environment [8,9,18] | Kanban systems [21,27] | Industry 4.1 technologies [11] |
| Logistics cost [12,17] | Mixed distribution [24] | Fog-based networks [15] |
| Transportation distance [13] | Inbound logistics [29] | Agent-based approaches [26] |
| Capacity [14] | Supplier networks [31] | Artificial intelligence [27] |
| Surface occupation [16] | Fertilizer industry [32] | Simulation-based design [28,33,34] |
| Fleet size optimization [19] | Reverse milkrun [35] | Heuristic optimization [36] |
| Consolidating milkruns [22] | Mixed-model assembly lines [34] | Deep Q-learning [37] |
| Complexity analysis [23] | Pallet flow [38] | PDCA [39] |
| Milkrun control [25] | Archipelagic region [40] | Hybrid algorithms [41] |
| Transport concept selection [30] | Cluster supply chain [42] | Drones in milkrun [43] |
Table 2.
Description of notations and symbols.
| Notations and Symbols | Description |
|---|---|
| . | |
| . | |
| Quantity of supply demand of assembly cell i in [LU]. | |
| Capacity of milkrun trolleys in [LU]. | |
| Average speed of milkrun trolleys in the assembly plant. | |
| Average speed of milkrun trolleys in the component’s warehouse. | |
| Specific materials handling time in the assembly plant (unloading time) in [s]. | |
| Specific materials handling time in the component’s warehouse (unloading time) in [s]. | |
| Total number of available milkrun trolleys in [pcs]. | |
| Specific energy consumption of milkrun trolleys in [kWh/km]. | |
| Specific GHG emission of milkrun trolleys in [CO2 g/km]. | |
| The length of milkrun routes in the component’s warehouse and in the assembly plant. | |
| The index of milkrun routes in the assembly plant. | |
| The index of stations of milkrun routes in the assembly plant. | |
| The index of milkrun routes in the component’s warehouse. | |
| The index of stations of milkrun routes in the component’s warehouse. | |
| Assignment of assembly cells to milkrun routes (first decision variable). | |
| The assignment of racks in the component’s warehouse to milkrun routes (second decision variable). | |
| The transportation time of milkrun routes in the component’s warehouse and in the assembly plant. | |
| The total time of milkrun routes in the component’s warehouse and in the assembly plant. | |
| The total energy consumption of milkrun trolleys. | |
| The current load of the milkrun at assembly cell. | |
| The total GHG emission of milkrun trolleys. | |
| . |
Table 5.
The picking points of the optimized routes and the current utilization of milkrun trolleys.
Table 5.
The picking points of the optimized routes and the current utilization of milkrun trolleys.
| Route ID | Parameter | Picking Points | |||||||||||
|---|---|---|---|---|---|---|---|---|---|---|---|---|---|
| Warehouse | Assembly Plant | ||||||||||||
| 1st | 2nd | 3rd | 4th | 5th | 6th | 1st | 2nd | 3rd | 4th | 5th | 6th | ||
| 1 | PPID 1 | 2 | 9 | 14 | 16 | 25 | 22 | 2 | 4 | 15 | 14 | 13 | 7 |
| Utilization | 21.6% | 54.4% | 63.2% | 72.0% | 81.6% | 96.0% | 96.0% | 87.2% | 77.6% | 68.8% | 36.0% | 21.6% | |
| 2 | PPID | 7 | 13 | 20 | 28 | - | - | 3 | 5 | 6 | 8 | - | - |
| Utilization | 18.4% | 44.0% | 74.4% | 96.8% | - | - | 96.8% | 66.4% | 40.8% | 18.4% | - | - | |
| 3 | PPID | 8 | 17 | 24 | 29 | - | - | 9 | 10 | 11 | 12 | - | - |
| Utilization | 20.8% | 32.8% | 59.2% | 94.4% | - | - | 94.4% | 73.6% | 61.6% | 26.4% | - | - | |
| 4 | PPID | 5 | 3 | 18 | 23 | 27 | 30 | 16 | 17 | 25 | 23 | 21 | 19 |
| Utilization | 8.8% | 21.6% | 47.2% | 55.2% | 83.2% | 99.2% | 99.2% | 71.2% | 55.2% | 47.2% | 21.6% | 12.8% | |
| 5 | PPID | 6 | 10 | 11 | 12 | 19 | - | 18 | 30 | 29 | 28 | 27 | - |
| Utilization | 24.0% | 40.8% | 54.4% | 70.4% | 98.4% | - | 98.4% | 84.8% | 68.0% | 52.0% | 24.0% | - | |
| 6 | PPID | 4 | 15 | 21 | 26 | - | - | 26 | 24 | 22 | 20 | - | - |
| Utilization | 21.6% | 48.0% | 74.4% | 98.4% | - | - | 98.4% | 74.4% | 48.0% | 21.6% | - | - | |
1 PPID = Picking Point Identification Number.
Table 6.
The picking points of the optimized routes and the current utilization of milkrun trolleys both in the component’s warehouse and in the assembly plant.
Table 6.
The picking points of the optimized routes and the current utilization of milkrun trolleys both in the component’s warehouse and in the assembly plant.
| Route | Parameter | Picking Point | |||||
|---|---|---|---|---|---|---|---|
| Route 1 Assembly Plant | PPID 1 | 2 | 9 | 14 | 16 | 25 | 22 |
| Utilization | 21.6% | 54.4% | 63.2% | 72.0% | 81.6% | 96.0% | |
| Route 2 Assembly Plant | PPID | 7 | 13 | 20 | 28 | - | - |
| Utilization | 18.4% | 44.0% | 74.4% | 96.8% | - | - | |
| Route 3 Assembly Plant | PPID | 8 | 17 | 24 | 29 | - | - |
| Utilization | 20.8% | 32.8% | 59.2% | 94.4% | - | - | |
| Route 4 Assembly Plant | PPID | 5 | 3 | 18 | 23 | 27 | 30 |
| Utilization | 8.8% | 21.6% | 47.2% | 55.2% | 83.2% | 99.2% | |
| Route 5 Assembly Plant | PPID | 6 | 10 | 11 | 12 | 19 | - |
| Utilization | 24.0% | 40.8% | 54.4% | 70.4% | 98.4% | - | |
| Route 6 Assembly Plant | PPID | 4 | 15 | 21 | 26 | - | - |
| Utilization | 21.6% | 48.0% | 74.4% | 98.4% | - | - | |
| Route 1 Warehouse | PPID | 3 | 2 | 8 | 9 | - | - |
| Utilization | 12.8% | 34.4% | 55.2% | 88.0% | - | - | |
| Route 2 Warehouse | PPID | 12 | 11 | 20 | 21 | - | - |
| Utilization | 1.0% | 29.6% | 60.0% | 86.4% | - | - | |
| Route 3 Warehouse | PPID | 7 | 6 | 5 | 4 | 10 | - |
| Utilization | 18.4% | 42.4% | 51.2% | 72.8% | 89.6% | - | |
| Route 4 Warehouse | PPID | 14 | 13 | 15 | 16 | 17 | - |
| Utilization | 8.8% | 34.4% | 60.8% | 69.6% | 81.6% | - | |
| Route 5 Warehouse | PPID | 18 | 19 | - | - | - | - |
| Utilization | 25.6% | 53.6% | - | - | - | - | |
| Route 6 Warehouse | PPID | 24 | 23 | 29 | 30 | - | - |
| Utilization | 26.4% | 34.4% | 69.6% | 85.6% | - | - | |
| Route 7 Warehouse | PPID | 22 | 25 | 26 | 27 | 28 | - |
| Utilization | 14.4% | 24.0% | 48.0% | 76.0% | 98.4% | - | |
1 PPID = Picking Point Identification Number.
Disclaimer/Publisher’s Note: The statements, opinions and data contained in all publications are solely those of the individual author(s) and contributor(s) and not of MDPI and/or the editor(s). MDPI and/or the editor(s) disclaim responsibility for any injury to people or property resulting from any ideas, methods, instructions or products referred to in the content. |
© 2024 by the author. Licensee MDPI, Basel, Switzerland. This article is an open access article distributed under the terms and conditions of the Creative Commons Attribution (CC BY) license (https://creativecommons.org/licenses/by/4.0/).
Share and Cite
MDPI and ACS Style
Bányai, T. Optimization of Hub-Based Milkrun Supply. Logistics 2024, 8, 86. https://doi.org/10.3390/logistics8030086
AMA Style
Bányai T. Optimization of Hub-Based Milkrun Supply. Logistics. 2024; 8(3):86. https://doi.org/10.3390/logistics8030086
Chicago/Turabian StyleBányai, Tamás. 2024. "Optimization of Hub-Based Milkrun Supply" Logistics 8, no. 3: 86. https://doi.org/10.3390/logistics8030086