Abstract
Background: The rise in natural and man-made disasters has increased the need for effective search-and-rescue tools, particularly in resource-limited areas. Unmanned Aerial Vehicles (UAVs) are increasingly used for this purpose due to their flexibility and lower operational costs. However, finding the most efficient paths for these UAVs remains a challenge, as it is essential to maximize victim location and minimize mission time. Methods: This study presents an autonomous UAV-based approach for identifying victims, prioritizing high-risk areas and those needing urgent medical attention. Unlike other methods focused solely on minimizing mission time, this approach emphasizes high-risk zones and potential secondary disaster areas. Using a partially observable Markov decision process, it simulates victim detection through an image classification algorithm, enabling efficient and independent operation. Results: Experiments with real data indicate that this approach reduces risk by 66% during the mission’s first half while autonomously identifying victims without human intervention. Conclusions: This study demonstrates the capability of autonomous UAV systems to improve search-and-rescue efforts in disaster-prone, resource-constrained regions by effectively prioritizing high-risk areas, thereby reducing mission risk and improving response efficiency.
1. Introduction
Between 2010 and 2019, the three main disasters were floods, storms, and earthquakes. Together, they represented 80% of all registered disasters and caused $2.67 trillion in economic impact [1]. According to [2], climate change is expected to increase the frequency and intensity of extreme weather events like hurricanes, floods, droughts, heatwaves, forest fires, and coastal flooding due to rising temperatures and melting glaciers.
Disasters often have a more severe impact in areas lacking the necessary infrastructure to manage such situations. Poorly constructed buildings, inadequate transportation networks, and scarce resources hamper effective response efforts and reduce victims’ chances of survival. For example, limited fuel availability for logistical operations due to destroyed fuel reservoirs [3] and damaged transportation routes isolate victims and impede supply deliveries [4].
In disaster-prone countries, high population density exacerbates these risks, largely due to the population’s economic and social conditions [5].
In Brazil, for example, one million people reside within the proximity of one of the 1220 dams with potential for accidents, a situation akin to the incidents in Brumadinho and Mariana [6]. Additionally, 8.2 million individuals live in environmentally hazardous areas, encompassing regions susceptible to landslides, floods, and intense rainfall [7]. Globally, nine developing countries have over 90% of their populations exposed to two or more disaster types, placing 266 million people at mortal risk [8].
Dealing with such disasters demands the fulfillment of a series of requirements like real-time information about the location of victims, the integrity of access routes, and the risk of buildings collapsing [9], as well as determining the optimal routes to assess the situation, evacuate and rescue people from the affected area, and transport supplies or rescue teams to the disaster-affected victims [10]. The research area aimed at placating the consequences caused by disasters is humanitarian logistics, which can be defined as the logistical activities necessary to alleviate the suffering of those affected by disasters and to help restore the situation to normalcy after the disaster’s occurrence [11]. Time and resource prioritization become even more relevant than in regular scenarios, making the planning and prioritization of actions a relevant topic of study in itself [12]. The unforeseen circumstances caused by disasters create a risk and high cost associated with the accomplishment of these tasks through conventional logistic means [13]. This factor has prompted professionals and scholars in the field to embrace the use of Unmanned Aerial Vehicles (UAVs) to provide support in humanitarian logistics. In [14], for example, it is mentioned how the use of trucks and helicopters may not be feasible during or after a disaster, given the potential damage to traditional routes, high operating costs, and the need for specialized professionals. Ref. [15] indicates that the lower cost associated with the use of UAVs compared to other means allows for improved vaccine delivery in countries with low infrastructure.
A UAV (Unmanned Aerial Vehicle) is an aircraft that does not have the presence of a pilot during its flight. Its lower cost compared to traditional helicopters or other logistics transport and its flexibility contribute to overcoming some of the challenges of humanitarian logistics. Its usage has been observed in disasters scenarios, such as hurricanes (Philippines-2012, Haiti-2013), earthquakes (Nepal-2015), and even dam collapses (Brazil-2016/2018) [16]. Some more specific examples of use are in [17], which demonstrates how UAVs can be used for the delivery of medicines and blood, preventing infection in pandemic scenarios, and dispersing disinfectants. Such uses were practiced during COVID-19 pandemic, for example.
The increasing use of Unmanned Aerial Vehicles (UAVs) in logistics, particularly within humanitarian contexts, underscores the need to adapt existing solutions for disaster scenarios. Key logistics elements like transportation, facility location, and inventory remain relevant, but variables, objectives, and priorities differ from conventional logistics scenarios. Despite the advantages of UAVs, challenges such as the low number of professionals able to operate UAVs [18] and the potential impact of human factors, like panic during missions or the likelihood of developing post-traumatic stress [19], emphasize the importance of researching autonomous UAVs in humanitarian logistics. These unmanned systems offer a solution that operates efficiently without extensive human intervention, addressing the limitations posed by traditional logistics means and minimizing the potential negative effects on both trained professionals and mission outcomes.
A preliminary analysis of the literature was conducted based on 86 articles, covering the period from 2000 to April 2024, with 63 of them published since 2019, indicating an increase in interest in the subject. As examples, Ref. [20] highlights multiples uses for UAVs in landslide investigations while [21] introduces a deep learning architecture that allows for better monitoring of landslides events. This literature analysis revealed a knowledge gap regarding the use of UAVs for locating victims in disaster environments. Among the possible applications of UAVs, this category had the least representation in articles relevant to the subject. Furthermore, even articles related to the search for victims involved a significant human dependency for mission completion, despite the use of UAVs.
The objective of this research is to offer a solution within this gap that allows multiple UAVs to fly through a recent disaster area looking for victims, without dependency from humans. This will be made possible using a POMDP algorithm for the routing and an image classification algorithm to identify victims within images taken from the UAV. Any evidence of the presence of a victim will be reported to the rescue teams, who will decide the next step of action.
The contributions of this study consist of the following points:
- -
- The combination of route optimization techniques with image classification techniques, allowing UAV missions to be carried out without human dependency;
- -
- The concept of classifying each sub-region of the disaster-affected area with a risk level (low, moderate, or high) so that victims at higher risk are found first;
- -
- The design of a scenario generator that allows for testing the solution in the same environment with dozens of disaster area variations automatically, ensuring the robustness of the results and facilitating testing for future work related to the topic.
The structure of this study is as follows: Section 2 has a literature review on the use of UAVs in humanitarian logistics, POMDP algorithms and image classification models. Section 3 is the methodology of how the study will contribute to the field of research. Section 4 presents and discusses the results for the case studies used to test the solution proposed in this study. Section 5 concludes the study, highlighting the key findings and limitations and indicating possible future research that may further advance the subject.
2. Literature Review
In this section, a review of the most relevant topics for this work is presented in the following sections: intersection between UAVs (Unmanned Aerial Vehicles) and humanitarian logistics focusing on the use for victim search; POMDP algorithm; and victim recognition in images.
To grasp the specific issue under investigation, a literature review was conducted encompassing articles about the utilization of UAVs in humanitarian logistics scenarios. The objective of this section of the review was to gain insight into the primary applications and challenges, pinpointing the knowledge gap to be further studied.
A predominant portion of the literature falls within the field of transport applications. Consequently, there is a higher concentration of articles addressing the location of facilities and routing, essential aspects of transport operations that demand optimization. Ref. [22] is an example that developed a routing solution in disaster scenarios aiming to minimize the energy consumption of UAVs.
Another portion of the articles dealt with the subject of area recognition, focused mainly on the need to understand the disaster area in order to plan and execute the logistics operations. As an example, we can cite [23], where a solution is proposed that aims to use UAVs to measure damage to infrastructure and accessibility of roads post-disaster. The solution aims to quickly map the environment so that rescue decisions can be executed with speed and precision, reducing the risk for the victims involved.
Articles aimed at optimizing coverage were the most prevalent. However, upon closer examination of these articles, it became apparent that one of the pivotal subjects was the effective location of victims. Recognizing the potential for further development in this specific area, it was chosen to narrow the focus in this study to the application of UAVs for victim location.
2.1. Review of Victim Localization Through the Use of UAVs
During a disaster, it is important to know how many victims have been affected and where they are located so that appropriate actions can be planned and executed. UAVs are inexpensive and often faster than conventional means, precisely because they are smaller and not sensitive to terrestrial obstacles.
There are various ways to perform the task of finding victims, and the main challenge is to execute so that everything is done as quickly as possible, the greatest number of victims is found and rescued, and the cost is feasible.
Regarding algorithms for the optimization found in the literature, at least six different ones were found: potential field [24,25], particle swarm optimization [26], POMDP [16,24,27], genetic [28], heuristics [29], and Monte Carlo [30].
The nature of POMDP (partially observable Markov decision process) matches the problems addressed in this study. Typically, victims will be concentrated as people live in groups. Consequently, finding victims in a certain area is an indicator that there are more people nearby. Given the objective of extracting insights from such scenarios and strategically planning subsequent actions, employing a Markov decision process can effectively guide the UAVs in accordance with the acquired knowledge during mission execution. As it is not possible to fully observe the states, since there is uncertainty associated with the presence or absence of victims and their number in each state, we have a partially observable scenario. POMDP allows optimizing decisions about which route the UAV should take even in the face of these uncertainties inherent in a disaster situation.
Regarding the optimization objective, there are three main ones present in the articles. In the first, the model aims to cover as much of the area as possible, assuming that by doing so, it will find the victims [26,29,30,31,32]. The second type aims to minimize the time to find the victims [16,24,27]. The third type aims to keep traversing the area until a victim is found [25,28].
There are some underexplored questions among the models. The first one is the mandatory presence of human interaction during the process. Often, it is a professional who understands both humanitarian logistics and the area where the disaster occurred. This type of professional may not always be available, especially in places with few resources or that are not well known. A model that can make decisions on its own may be more useful when the professional is unavailable and offer more scalability for decision-making. Only [26,28] present complex solutions that could still run without the need of human intervention or supervision.
Another question is that most of articles simulate their solutions in highly controlled and artificial areas. The only exception to this was [30], who tested a POMDP model using real data (Haiti earthquake), and [16], who also evaluated a POMDP in three real scenarios.
The third question is that, in the models analyzed, it is usually assumed that whenever there is a victim in some part of the environment, the UAV will identify them simply by passing by. In disaster situations, visually searching for victims, whether done by a human or an image recognition model, is not so straightforward. Errors will occur in both situations, and it is essential to make this clear when formulating the problem’s solution to avoid an overestimation of the model performance. Only [24,27] introduce some form of penalty in the result to simulate this uncertainty in the response.
And the last relevant question is whether the models try to maximize coverage or minimize the time to find victims. Both objectives are useful for humanitarian logistics since it is important to cover the entire area and find victims as quickly as possible. However, this means that the priority will be to visit locations with more victims first. It may not always be ideal since, in some cases, the location with more victims may already be mapped by rescue teams or naturally pose less risk to them. In some situations, more isolated victims may be at greater risk and still not be prioritized by the models in the review.
In addition to helping understand the uses and logistical problems, the review has helped discover case studies that can be used for comparison. It has also aided in understanding what is necessary in the model for it to be truly usable. This influenced the formulation of the ideal solution to the problem. A model was proposed that does not require human interaction during the mission, considers realistic accuracy in identifying victims, and can prioritize areas with higher risk. Table 1 and Table 2 makes it clear how this article compares to the ones in the review. Table 1 shows the algorithms found in the studies, while Table 2 shows all the other relevant information to compare among the articles.

Table 1.
Comparison between algorithms of the articles present in the literature review about the use of UAVs for victim location in humanitarian logistics.

Table 2.
Comparison between characteristics of the articles present in the literature review about the use of UAVs for victim location in humanitarian logistics.
2.2. Review of Partially Observable Markov Decision Processes (POMDPs)
Markov decision processes (MDPs) assist in decision-making in systems where an action must be chosen at each moment in order to reach a determined objective. There is a certain randomness in the outcome of each action, but with clarity in the observed states. Partially observable Markov decision processes (POMDPs) are generalizations of regular MDPs where a way is added to allow for decision-making in situations where states are not entirely observable, only having an idea of them based on the information available. As identified during the review, partially observable Markov decision processes (POMDPs) align well with the decision-making scenario for Unmanned Aerial Vehicles (UAVs) in disaster environments because of the way it deals with the lack of information [34].
Figure 1, extracted from [35], provides a simple example of a system where POMDP can be applied. Each block represents a state, with state 2 being the system’s goal represented by the star sign. The agent is always in one of the four states, and the possible actions are moving right or left. If the agent moves towards a wall, it stays in the same state. If the action leads to the goal state, the system receives a reward and has an equal probability of moving to any of the remaining three states next. Finding the optimal policy is straightforward with full knowledge of the current system state (MDP), but complexity increases when uncertainty exists (POMDP).

Figure 1.
POMDP system example.
To represent the agent’s location, a distribution of the observed state is used. For instance, if the agent just left state 2 in Figure 1, it has a 1/3 chance of being in each of the other states, resulting in a distribution of (1/3, 1/3, 0, 1/3). As the agent moves in a direction, the distribution is updated based on the outcome. If, for example, the agent moves left without encountering a wall and does not reach the goal state again, it can only be in state 0. The new distribution in this case would be (1, 0, 0, 0). Some actions may decrease uncertainty, common in systems where more information leads to less uncertainty. However, certain actions can increase uncertainty depending on the system.
A POMDP can be defined as a tuple (S, A, Ω, T, O, R) where S is the finite set of states, A is the set of possible actions, Ω is the set of observations, T is a transition function (T: S × A × S → [0,1]), O is an observation function (O: S × A × Ω → [0,1]), and R is the reward function (R: S × A × S → ℝ) [36].
The major difference compared to MDPs is precisely Ω, which indicates the possibility of more than one observation different from the state, varying according to O (probability of observing o in state s after executing action a).
2.3. Brief Review on Disaster Victim Recognition in Images
Most articles assume that the UAV (Unmanned Aerial Vehicle) passing through the area will find them. They do not consider an approach that details how the victim will be identified or the problems related to it. Even those that do address this in their solution at least consider that the UAV will always be able to identify the victim not considering any kind of penalty.
To obtain more realistic results, a survey of techniques specifically related to identifying victims through images captured by UAVs and their actual accuracy was conducted.
There are some challenges in trying to fulfill this task, such as possible obstacles between the UAV’s camera and the victim (e.g., debris, tree foliage), low image quality, considerable distance, visual similarity of victims to the image background, and even variability in images that can be considered victims.
The techniques that best address these issues are deep learning techniques, specifically convolutional neural networks (CNN). They are neural networks with multiple overlapping layers that use learned filters during network training to efficiently classify new images. Essentially, the presence of these filters activates the CNN’s activation functions, indicating the presence of the desired images, in this case, victims [37].
According to [38], to better understand how CNNs perform image classification, they can be divided into two main parts: The first part, known as convolution, is where filters are constructed. A filter is created for each group of adjacent pixels, and its dimensions are parameters defined during model construction. Smaller dimensions result in a greater number of filters.
The idea is that the resulting filters will be fewer than the total number of pixels in the image, reducing complexity for subsequent steps. Another advantage is that, by capturing portions with multiple pixels, the filters themselves are already learning patterns that exist between different regions of the image. In many cases, this step can be performed multiple times, with filters created within filters, increasing model complexity but potentially improving performance. However, excessive convolution can negatively impact accuracy, as filters may become too specific to the training images and generalize poorly to new images.
The second part involves a multilayer perceptron that constructs common neural networks for the classes obtained in the first part, that is, for each filter built during convolution. After this training, to classify an image, convolutions of equal dimensions are constructed and then submitted to the perceptron. If there are enough filters present in the new image that align it closely with a class, the image will be classified with the corresponding class.
The workflow in [37] operates as follows: the UAV captures the images, they are processed by the CNN, the network’s results are combined with those of other sensors, and the response regarding the presence or absence of a victim at the location is relayed to the search and rescue teams responsible for the area. The architecture proposed by them achieved an average accuracy of 77.05% with a standard deviation of 4.90%. This is slightly worse than other articles related to UAV images in disasters, but the others do not use real images to validate the model. It is precisely this decline in results that should be noted when applied to practical situations. Using the assumption that victims will always be detected will overestimate the results by an average of 22.95%.
3. Methodology
With a clear understanding of the problem to be addressed–using UAVs to locate victims in disaster environments–and with sufficient theoretical foundation to build the solution, a method on how to do so has been developed.
The two main objectives of this study are to identify the location of victims at higher risk before the rest of the victims and to minimize human interaction. To achieve these objectives, the solution involves using the POMDP (partially observable Markov decision process) reinforcement learning algorithm to determine the route to be followed by the UAV during the mission. At each small step of the mission, the algorithm optimizes the next move based on the information collected in previous steps (since the beginning of the mission). Positive interactions result in a reward (finding victims), while negative interactions do not generate rewards (not finding victims), directing the optimization toward where rewards seem more frequent.
Another necessary aspect to reduce human dependence is to verify the presence or absence of victims in each image captured by the UAV. The proposal for this aspect is to use image classification algorithms that can replace the need for human intervention with a reduction in accuracy. A model can analyze an image and classify the presence of victims based on previous images of victims.
The optimization, combined with image classification algorithms, allows the UAV to initiate its mission independently, navigate the disaster scenario as objectively as possible, and notify humans when there is evidence of victims in a particular location, allowing them to focus their efforts and remaining resources on other activities (such as caring for previously found victims).
3.1. Solution Construction
The solution to the problem involves a UAV (Unmanned Aerial Vehicle) initiating its mission in a specific point of the region affected by the disaster. In order to execute the operation, it is necessary to divide the area into small squares which will be referred to as quadrants from this point forward. At this initial moment, it will have the input information for the problem (disaster area, total affected population, and initial understanding of the risk associated with each area). It will then repeat the following steps for all the quadrants it traverses:
- Capture images of the quadrant;
- Identify if there is evidence of victims in the images using an image classification model;
- Utilize a route optimization model (which will use the data initially available plus the data discovered along the route) to decide which is the next quadrant to be reached.
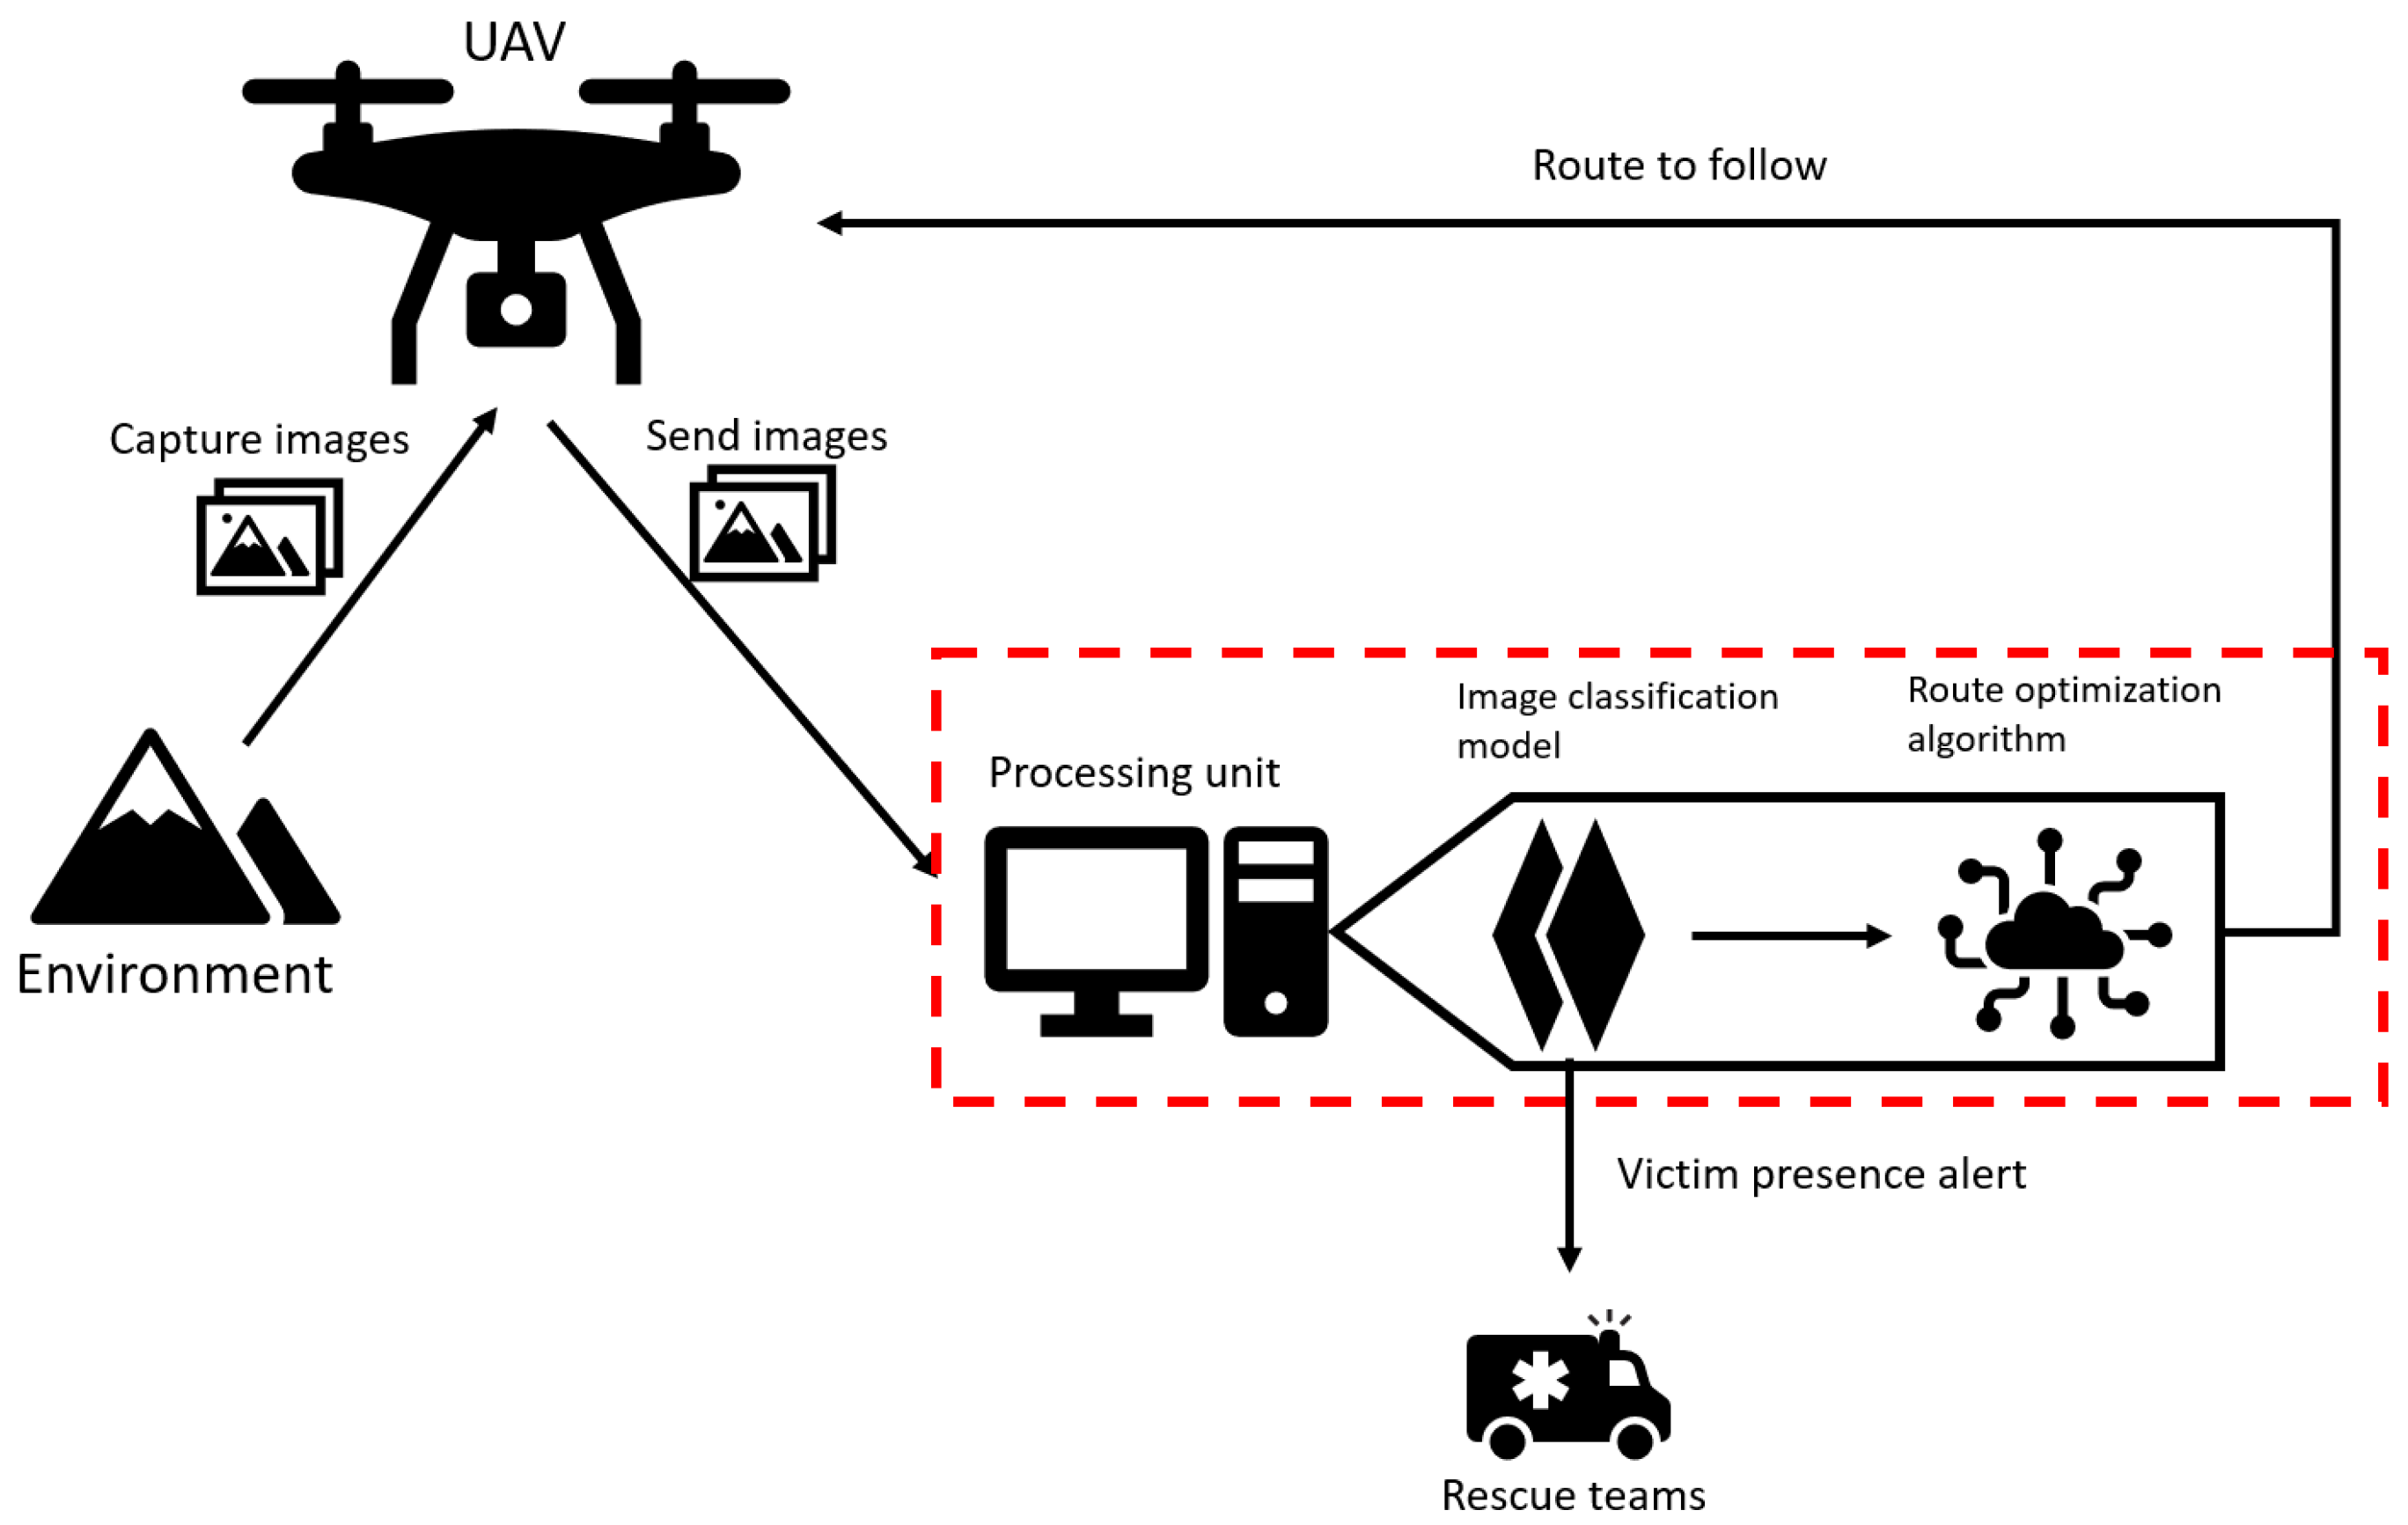
This cycle will repeat in every quadrant until the entire area is scanned. This flow can be seen in Figure 2, where the red dashed box represents where the solution is replacing the need of a constant human interaction, releasing the professionals to other critical tasks.
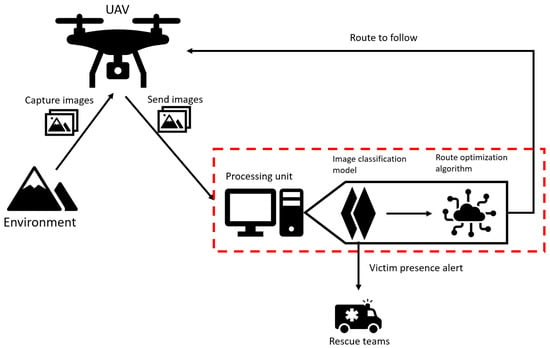
Figure 2.
Flow of solution designed by this study.
The size of each quadrant will be defined by camera parameters and flight height. This will affect the quality of the images and, consequently, the accuracy of the image classification model (since larger quadrants require the image to be taken from a higher altitude, reducing its resolution). On the other hand, exceedingly small quadrants generate an exponentially larger number of variables for optimization and can make the problem overly complex. A balance must be found to not affect the ability to identify victims but also not take too long to traverse the area.
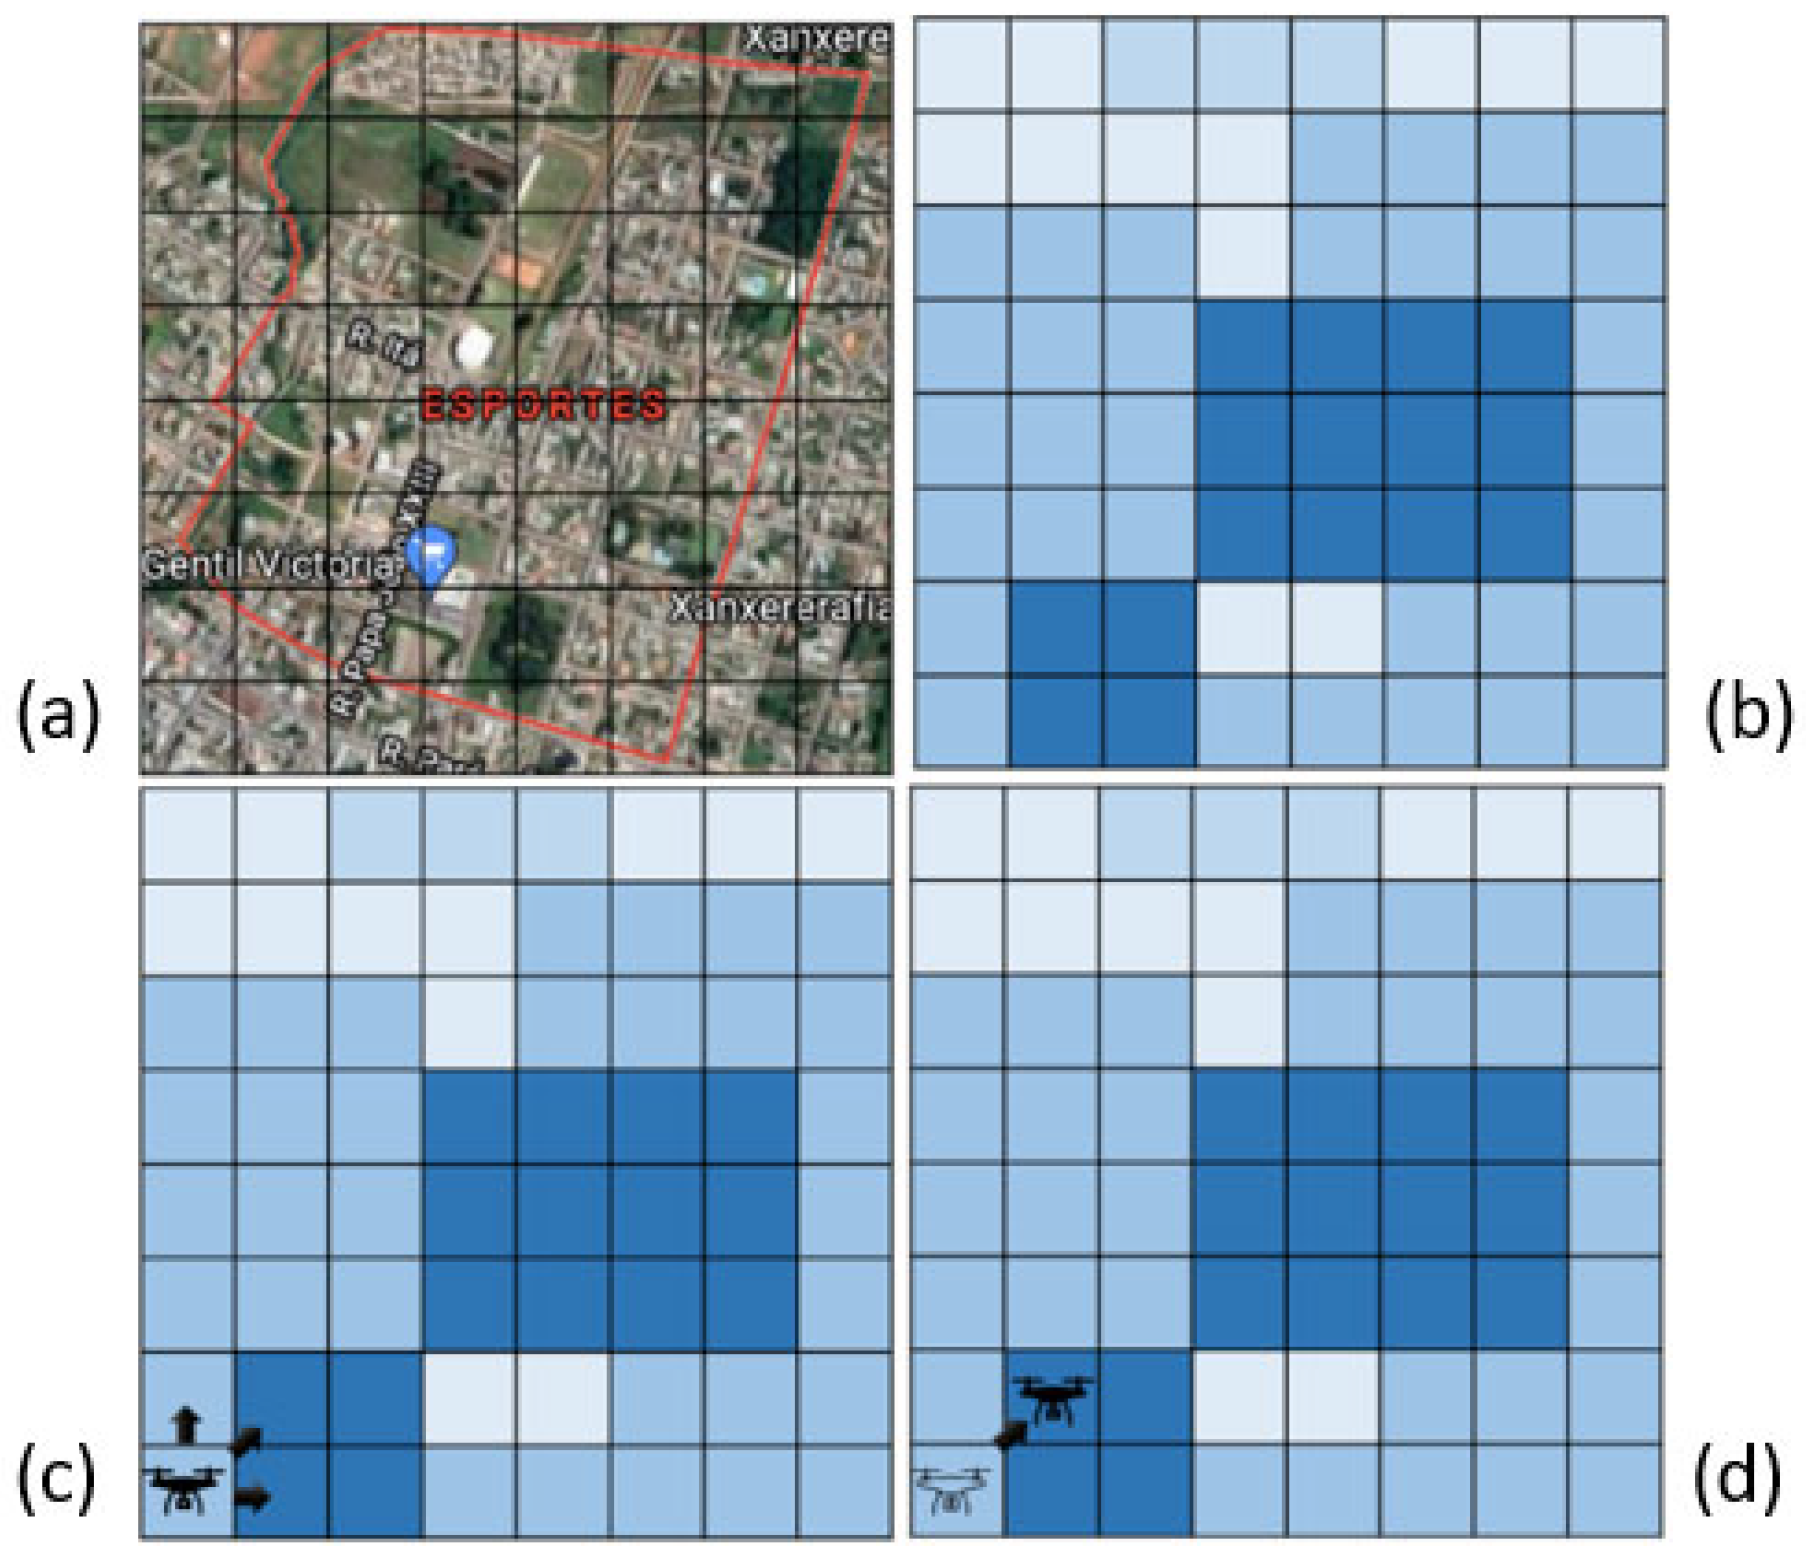
To clarify, Figure 3 can be used as an example. It is the Xanxerê region that will be used to evaluate the model. This area can be divided into 64 quadrants as seen in Figure 3a, and for each quadrant, a risk level associated with the location can be defined. The darker it is in Figure 3b, the higher the risk considered.
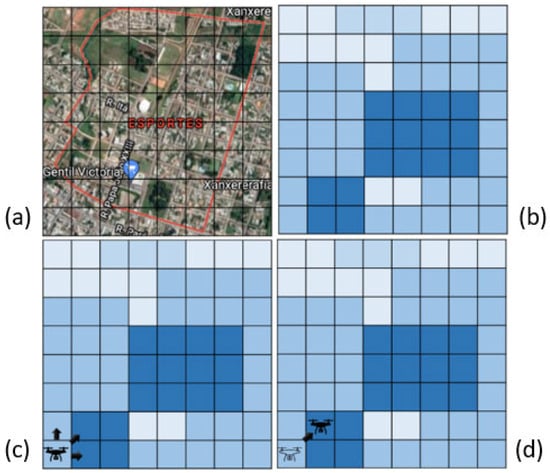
Figure 3.
(a) Study area split into quadrants; (b) Color representation of each quadrant risk (blue scale); (c) Initial position of the UAV and its possible actions; (d) UAV movement after the first optimization step.
In Figure 3c, the UAV starts in the lower-left quadrant of the region (represented by the UAV black icon). It will analyze that quadrant and decide which quadrant to move to in the next moment (in this example, the options would be upward, northeast diagonal, and right as represented by the black arrows). In Figure 3d, it is already possible to see it moving diagonally, meaning that after iterating in the first quadrant, the model indicated that the most suitable next step would be to move diagonally.
The processing time of each of the models may make it difficult for the performance to be continuous, meaning that the UAV may need to stop the route to decide where to continue going. So, another important variable is the processing capacity of the system. This problem will be minimized in the future when processing power is reduced and UAVs can do high processing by themselves, but initially, it will be interesting for the UAV to feed an external processing source.
3.2. Assumptions Adopted by the Solution
Several assumptions have been adopted for this dissertation with the aim of facilitating the comparison between the applied tests and ensuring that the focus is on route optimization and risk reduction. The first one is that all scenarios are simulated thirty times, allowing the number of victims per quadrant to vary. This variation increases the reliability of the results since it demonstrates that a specific outcome was not generated by chance and lets the scenario become closer to a real one.
The second assumption is that, to solve the optimization at each stage of the route, the approach of [39] is used, as it has shown to demand lower computational cost and provide more optimized results for problems with many variables. When the approaches were tested for the case 1 of this dissertation, it was the only approach that converged to an answer.
There are many factors that can affect the overall performance of the solution, such as weather, flight altitude, camera quality, and communication signal quality. To investigate whether the proposal of this dissertation indeed has a positive impact on the problem, the premise was set to keep every factor not directly related to the work’s objective constant for all cases and simulations.
UAVs capable of completing missions without the need for energy refueling were chosen; therefore, fuel resources or the need to return to refueling points are not part of the routing problem.
The last assumption is that the image classification model was not developed and applied in this work. Its accuracy is simulated based on other works more focused on the image issue. As this is a logistical work, the focus here is on routing, and therefore, it is deemed sufficient to simulate the image issue to bring it closer to the real scenario.
3.3. Case Studies
To measure the practical utility of the solution presented in this article, real-life situations were chosen. There are various options available among disasters, and specifically, three scenarios were chosen with different area sizes and population numbers to verify how the scale of the disaster can affect the results.
The minimum criteria for a case to be chosen were the availability of information on the size of the affected area and the population in the location. Among the options that met these criteria, case 1 was chosen because it was also used in [16] to assess a different solution with similar objectives. Cases 2 and 3 represent disasters like case 1, but in different situations regarding the size of the affected area and the way the population is impacted by the disaster, which would assist in assessing the solution under various conditions. Additionally, case 3 represents a recurring problem that happens every year in the Rio de Janeiro region affecting hundreds of people.
The creation of a scenario generator was proposed to simulate the variance of parameters related to each case so that the model of this study and future studies can be exhaustively tested in variations of the same scenario.
3.3.1. Xanxere Case Study (2015)
The first chosen case was a tornado in Xanxere (Santa Catarina) that occurred in April 2015. Winds of approximately 300 km/h hit the city and destroyed one hundred and fifteen houses. It affected various public buildings, four schools, a health center, a sports gymnasium, and the city’s stadium, resulting in a loss of R$29 million [40,41].
The damage left at least 2100 people displaced and 186 homeless. Considering Xanxere and nearby affected cities (Ponte Serrada and Passos Maia), at least 800,000 people in total were affected [40,41].
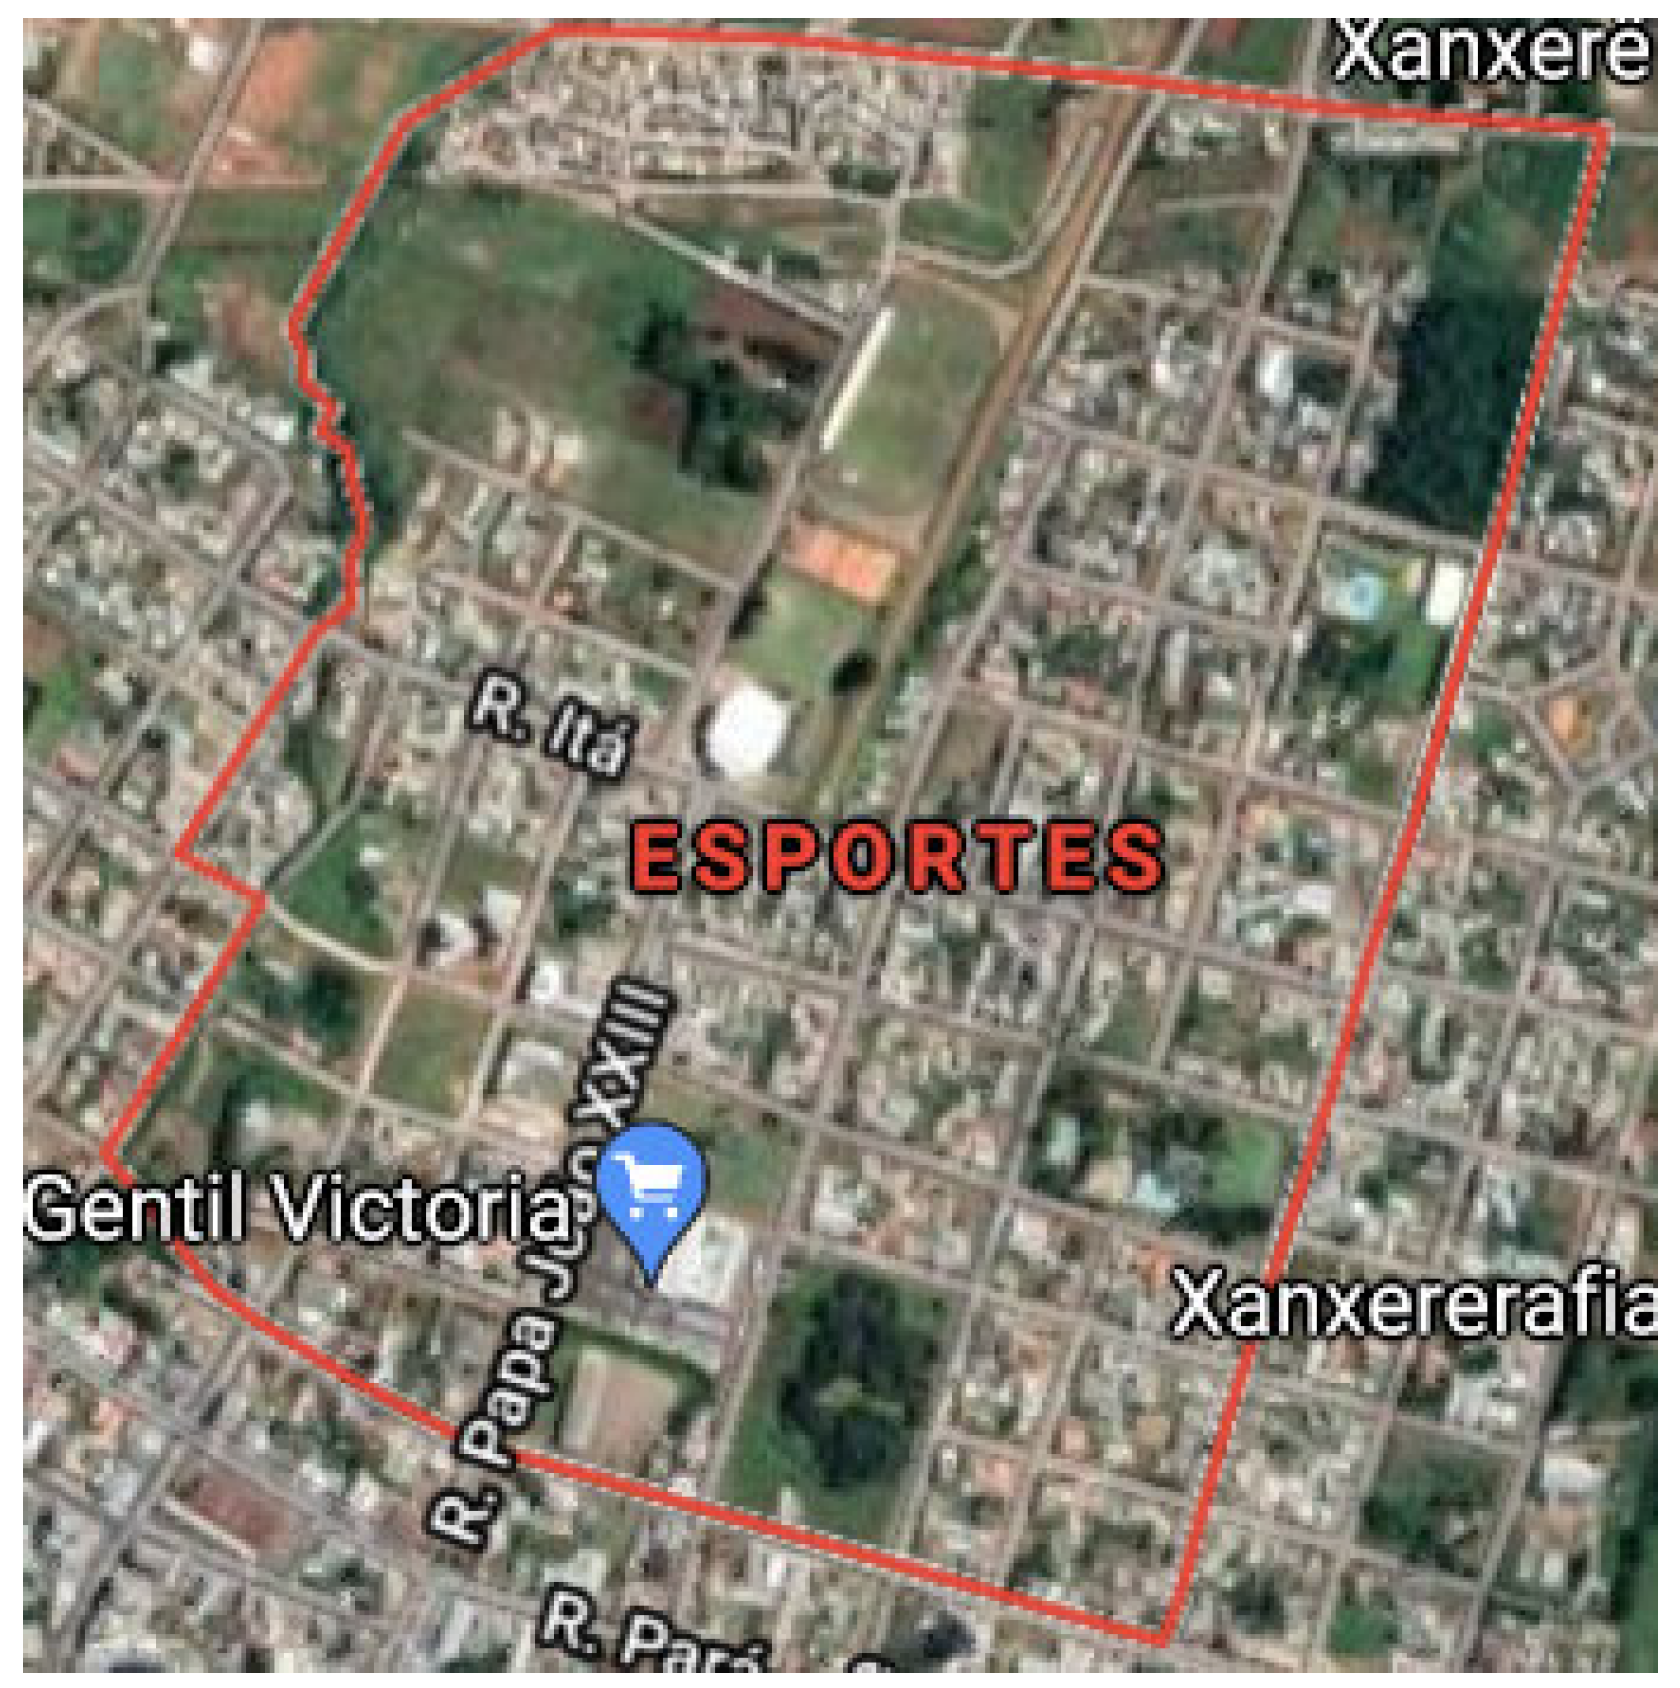
In particular, the area of the Esportes neighborhood in the aforementioned Xanxere was chosen (Figure 4).
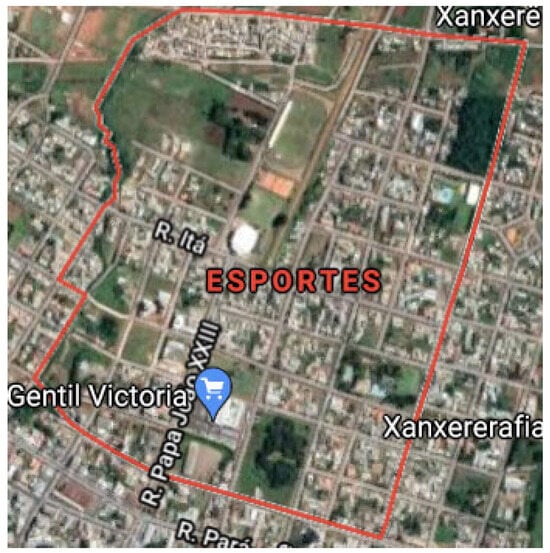
Figure 4.
Most affected area during the disaster of Xanxere.
3.3.2. South Sudan Case Study (2015)
The second chosen case was that of refugee camps in South Sudan. According to [42], conflicts in the country since 2013 have forced thousands of people to relocate to such camps every year. Heavy rain creates logistical difficulties in meeting the demand for food and other supplies for these people, as well as for volunteers residing there with the aim of helping.
The lack of security and logistical infrastructure makes aerial technology useful in delivering resources to the conflict victims. The lack of exact information on where to deliver the resources necessitates identifying the locations of these victims, especially in situations where the roads have recently been blocked due to heavy rains.
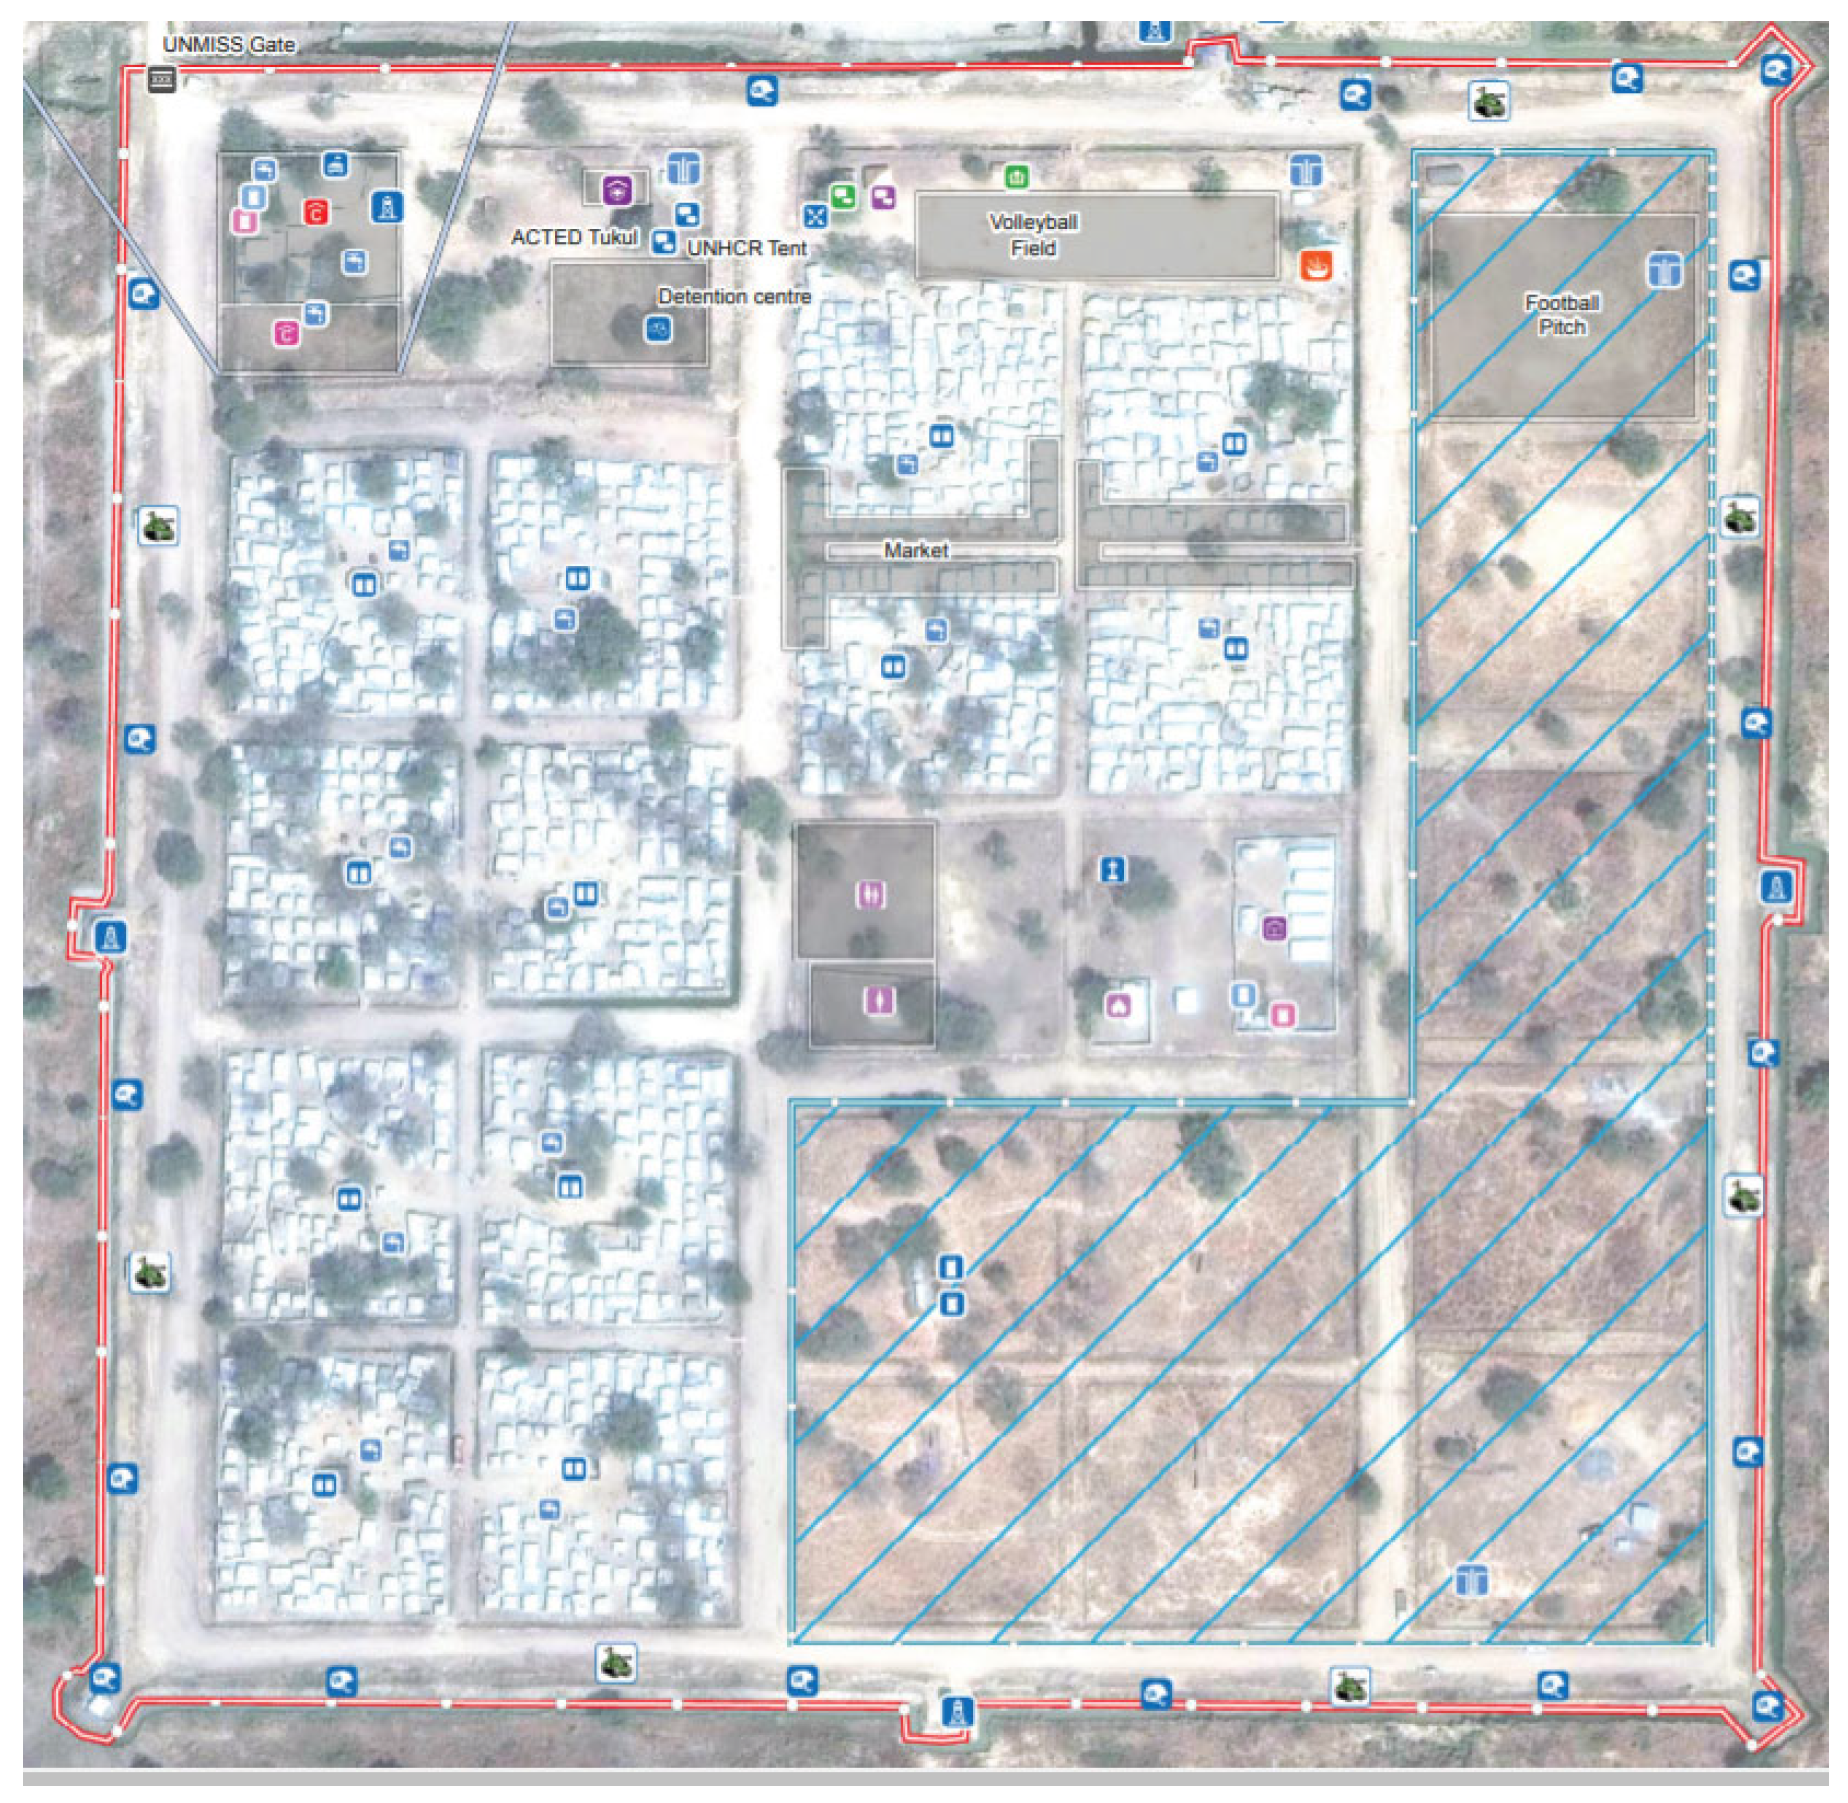
To assess the effectiveness of the model in assisting in this situation, Figure 5 was chosen, depicting the area of a camp in the state of Jonglei. The red lines represent the area delimited by the camp. In 2015, approximately 2300 people were located there. In November of the same year, a flood caused by heavy rains isolated people, leaving them without food and resources for several days.
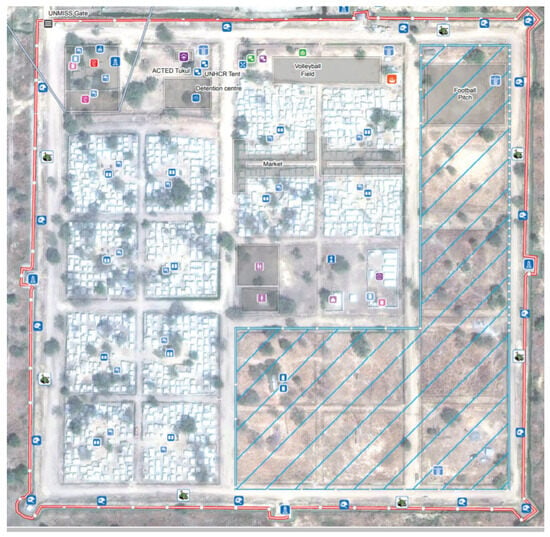
Figure 5.
Refugee camp in South Sudan.
3.3.3. Petropolis Case Study (2022)
Finally, for a more recent scenario compared to the other scenarios, the city of Petropolis was chosen. It is a city in Rio de Janeiro with a significant history of issues related to rainfall, experiencing episodes with a large number of displaced and deceased individuals, as seen in 2011 and 2022 [43].
In 2011, there were 918 in the Serrana region, with 71 occurring in Petropolis alone. In 2022, there were over 100 deaths. In addition to these two significant events, there were over 800 deaths in smaller rain incidents over the past three decades.
What makes the rain so harmful are the slopes surrounding inhabited areas. The large volume of water, coupled with the lack of containment measures, results in the formation of large amounts of mud on these slopes. This mud, in turn, sweeps down the city, carrying away houses, cars, and anyone in its path. The mud hinders the drainage of rainwater by creating more obstacles.
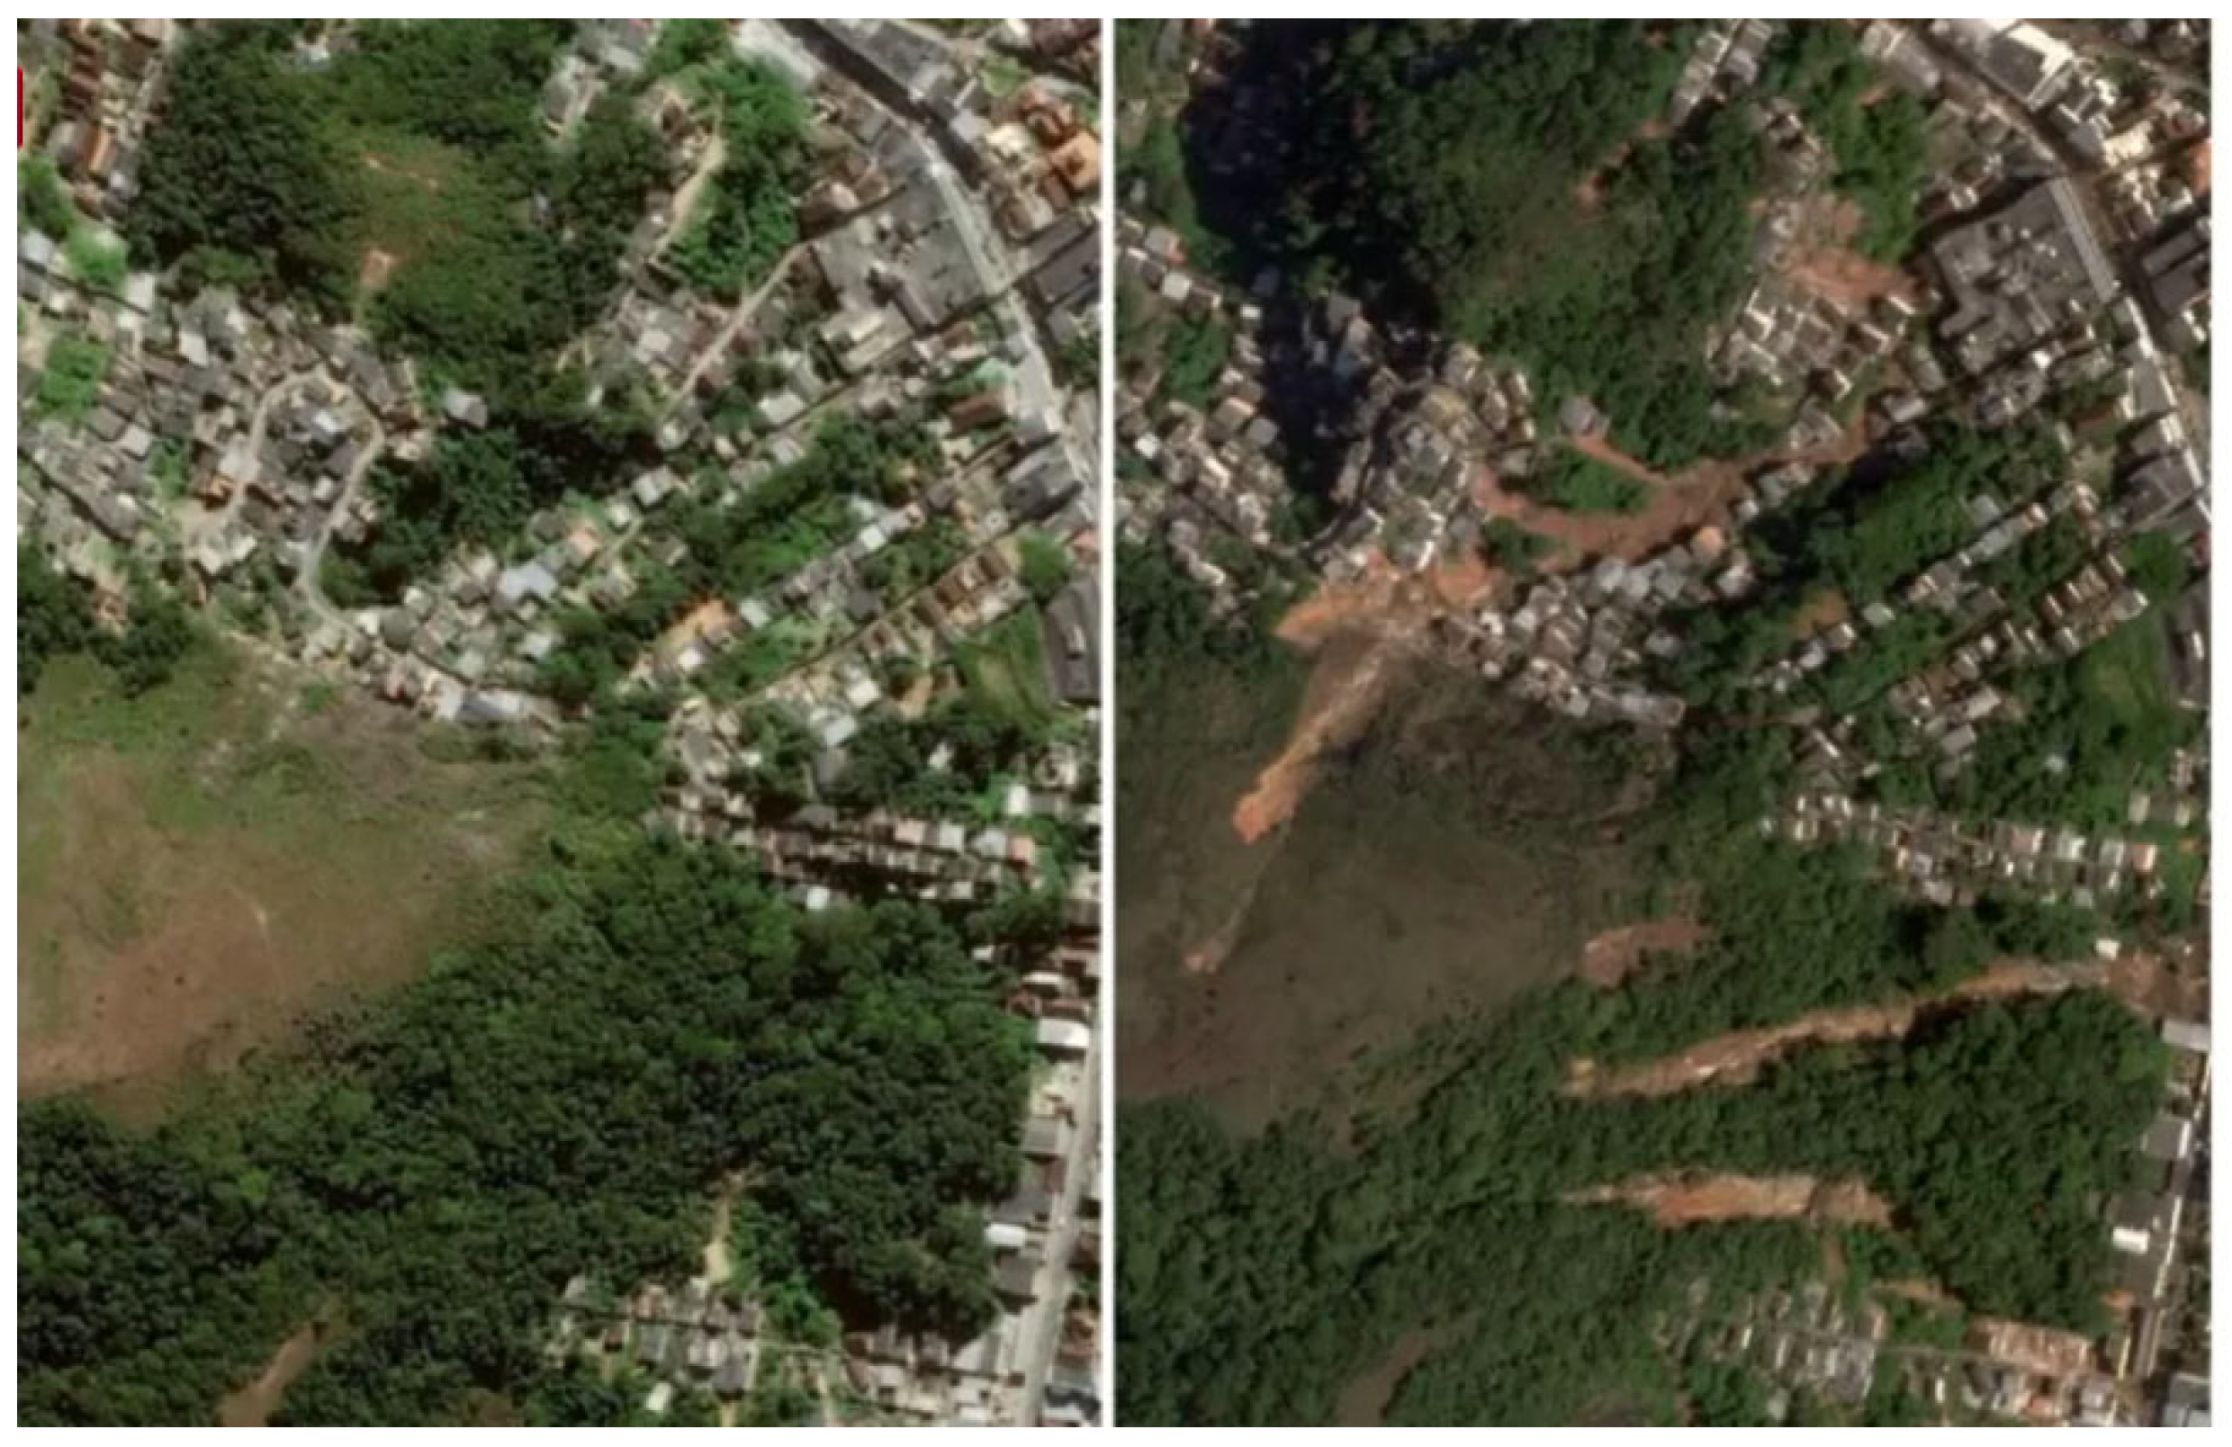
Figure 6, using satellite imagery, illustrates how the slope and the city looked before and immediately after the rains. It is possible to observe that the slope turned into mud, and most of the roads were covered with mud and water.
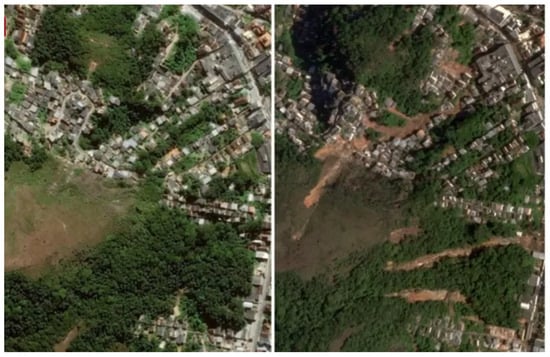
Figure 6.
Before the rain disaster in Petropolis (left); The same area after the rain disaster of 2022 (right).
3.4. Factors of the Scenarios Relevant to the Solution
All the situations remain dynamic, with constant fluctuations occurring in numerous factors every passing second. Variables such as weather conditions and wind patterns shift, victims change their positions, communication signals fluctuate, and unforeseen developments stemming from the disaster, such as building collapses or trees obstructing roads, may emerge. The solution proposed in this dissertation is sensitive to these natural variations in the problem, and therefore, they must be simulated to some extent so that the scenario becomes as close to reality as possible.
In order to accomplish this, a scenario generator was developed. This generator alters certain aspects of the selected scenarios, enabling the model to undergo testing with diverse information. This approach mitigated result bias, fostering more robust conclusions. Additionally, it proves valuable for forthcoming research endeavors that aim to assess other models.
The characteristics respected by the scenario generator were the distribution of the population, accuracy of the image model, and the flight and image processing time.
While this dissertation focused on simulating variations in certain factors, it is essential to acknowledge that numerous other elements can influence the practical implementation of UAVs in search and rescue missions. To maintain the logistical scope and simplicity of the solution, these factors, though subject to change, remained constant during the simulations. The key factors encompass structural and natural features of the region, weather conditions, power availability, intermittency levels in communication signals, terrain characteristics, camera quality on the UAV, UAV specifications, flight altitude, legislative constraints, and the accuracy of mapped risk. This list is provided not only to highlight their potential impact but also as a reference for future research.
3.5. Solution Steps
The solution can be divided into three phases: pre-mission, POMDP parameters, and execution. For the test conducted in this article, we also added a simulation phase that will not exist in practice.
Pre-mission: This phase involves preparing the model before starting the mission. This includes defining the mission area, determining the size of each quadrant, dividing the area into quadrants, allocating a risk level to each one, and finally choosing the starting point for the UAV. For our test, the area would be the Esportes region, which is a square approximately 0.9 km on each side. To maintain sufficient image quality, the UAV will fly at an altitude of 110 m, resulting in 49 quadrants of 129 m on each side. A low risk (1) was assigned to areas without buildings, medium risk (2) to houses, and high risk (3) to larger buildings. In this case, the upper-left corner was chosen as the starting point, as it seems to have a simpler access for launching the UAV.
Simulation: The number of victims was simulated in each quadrant as was the accuracy of the image classification model in each area (average of 77.05% with a standard deviation of 4.90%). These are pieces of information that will not be available in a real situation but are necessary for evaluating the model.
POMDP Parameters: These define the optimization states (each quadrant), possible observations (finding victims or not in the quadrant), possible actions (move horizontally, vertically, or diagonally), and the reward associated with finding victims or not (1 for positive cases and 0 for negative cases).
Execution: These are the steps to be repeated in each quadrant until the mission is completed. Capture the image, classify the presence or absence of victims, reset the risk map by zeroing the risk in already traversed quadrants, prepare the data for the POMDP solver, run the solver, and use the optimization response to determine the next quadrant to be visited. Move in the direction determined by the solver and repeat the steps in the next quadrant. If the direction has been traversed before, move in the direction with the highest unexplored reward.
3.6. Computational Implementation
To perform the optimization and simulate the conditions of the disasters highlighted above, a code was developed in the R language [44] on the Rstudio platform [45] to take advantage of the ‘pomdp’ library, created by [46], to facilitate the application of POMDP in optimization problems. The times spent on optimization in this dissertation were the result of a notebook with an Intel(R) Core (TM) i7-8565U CPU @ 1.80 GHz 1.99 GHz processor and 8 GB of installed RAM. Smaller capacities can result in longer times, just as better processing can result in shorter times. The full code is available in the Annex A and can be used to reproduce the scenarios and create new ones to test further studies in this area.
4. Results and Discussion
Results are presented for each case with multiple scenarios regarding the number of UAVs present in the mission. A comparison among the results of the three cases is also presented to show how the solution performs under different conditions.
4.1. Results for Case 1
The results obtained for Case 1 are presented in terms of total risk reduction, total mission time, and decomposed mission time. The total risk is the sum of the products between each victim and the risk associated with the region it is in. As victims are found, the associated risk changes to 0, and the total risk decreases.
For comparison, a reference simulation was executed where the UAV moves in a straight line to the nearest unvisited quadrant. Both results can be seen in the figure relevant to each scenario. Three scenarios were run for Case 1, varying the number of UAVs from 1 to 3.
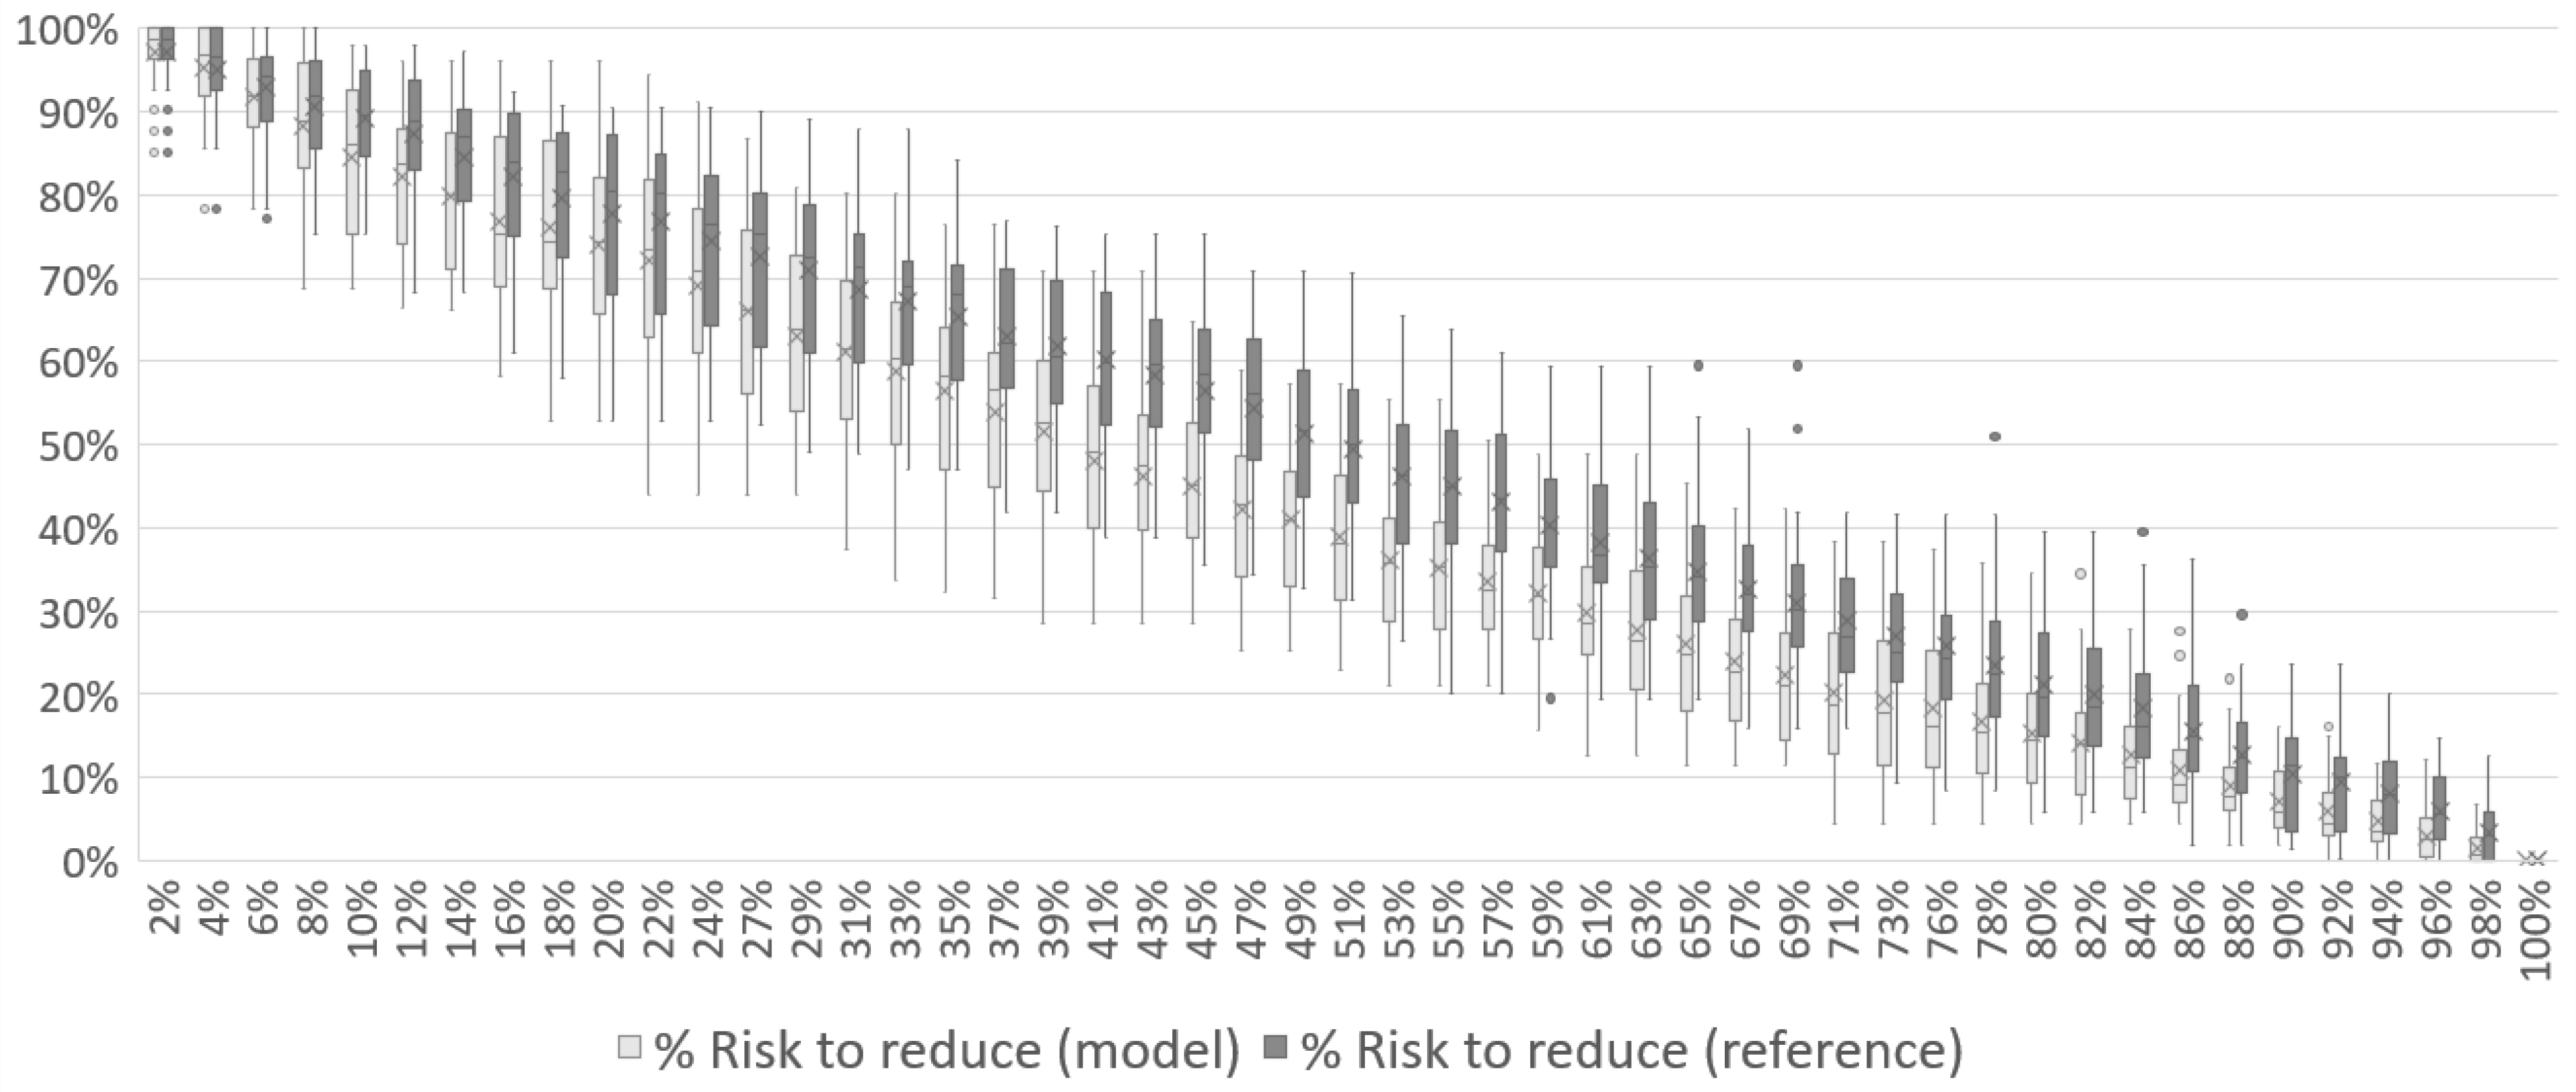
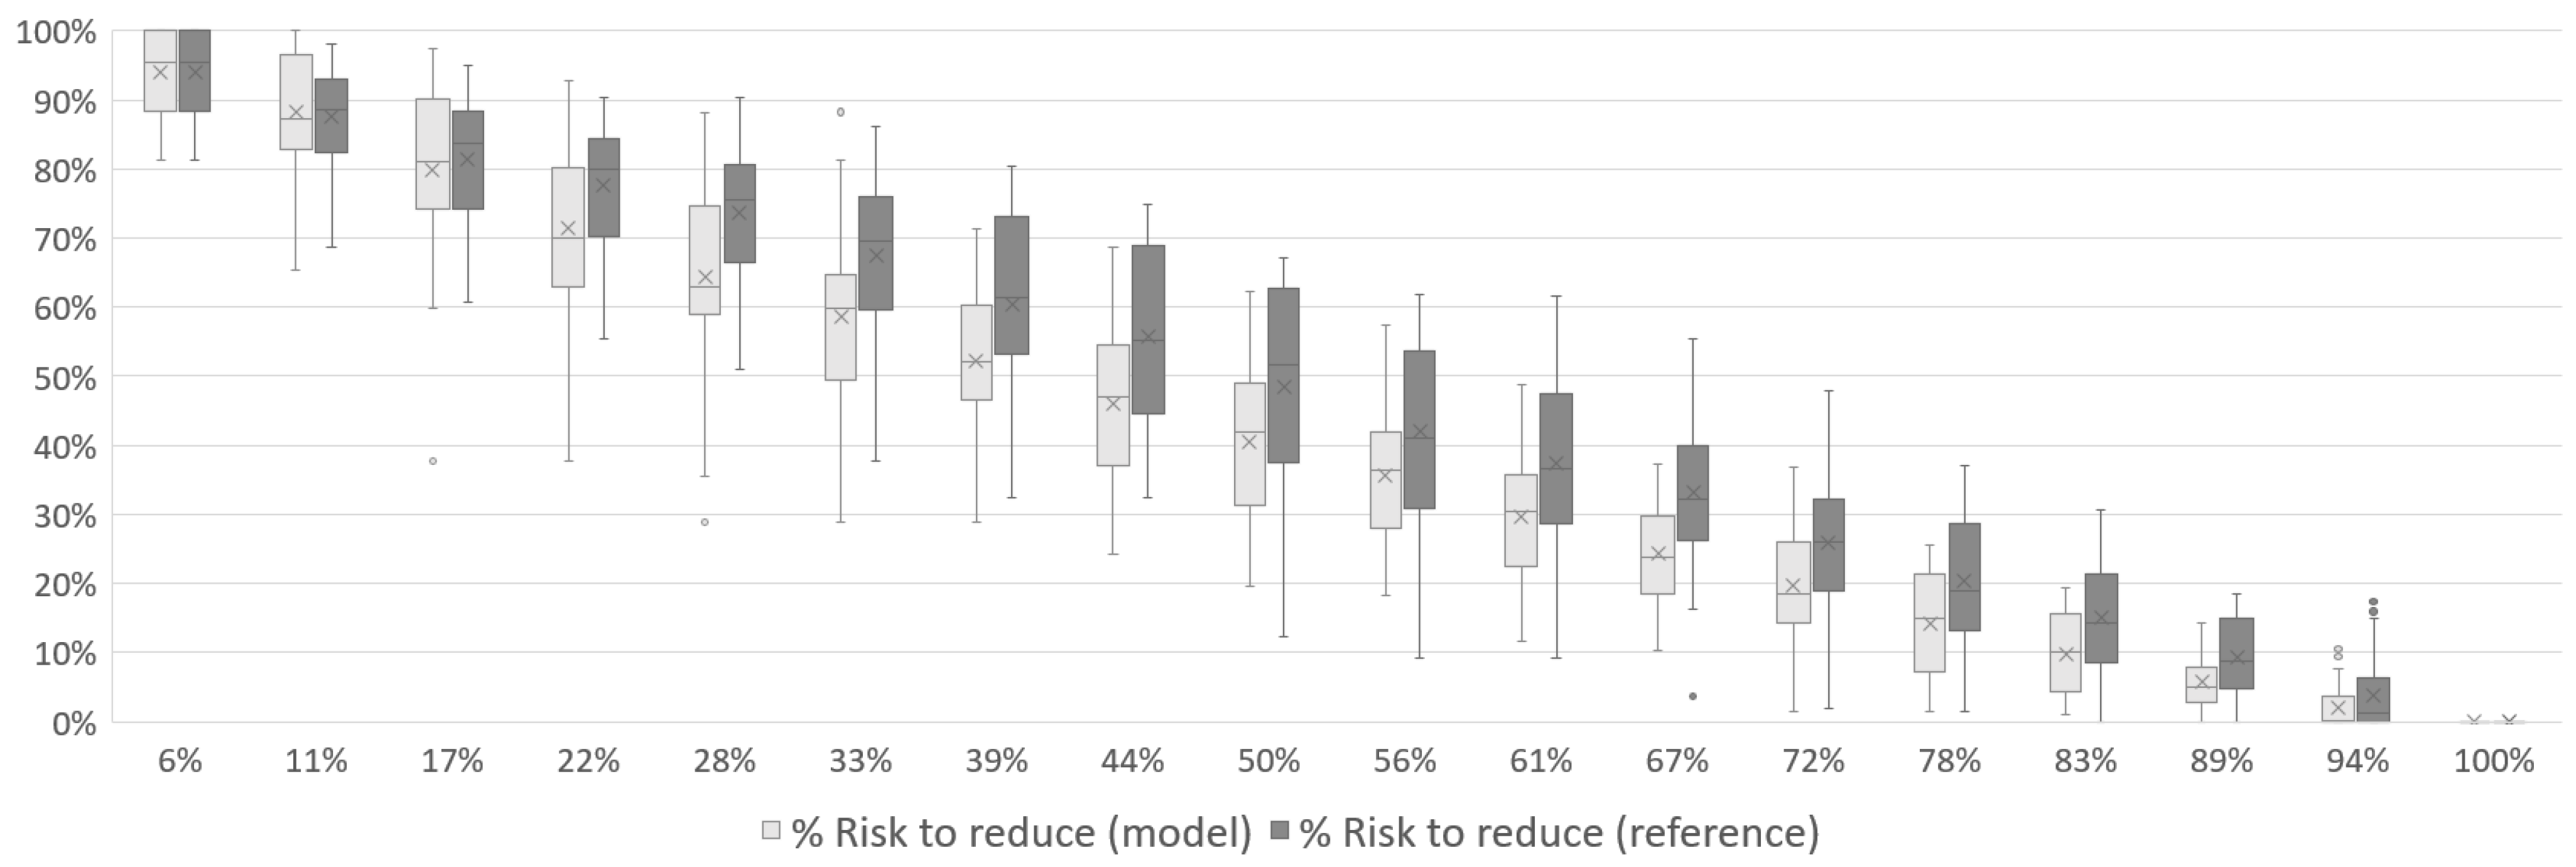
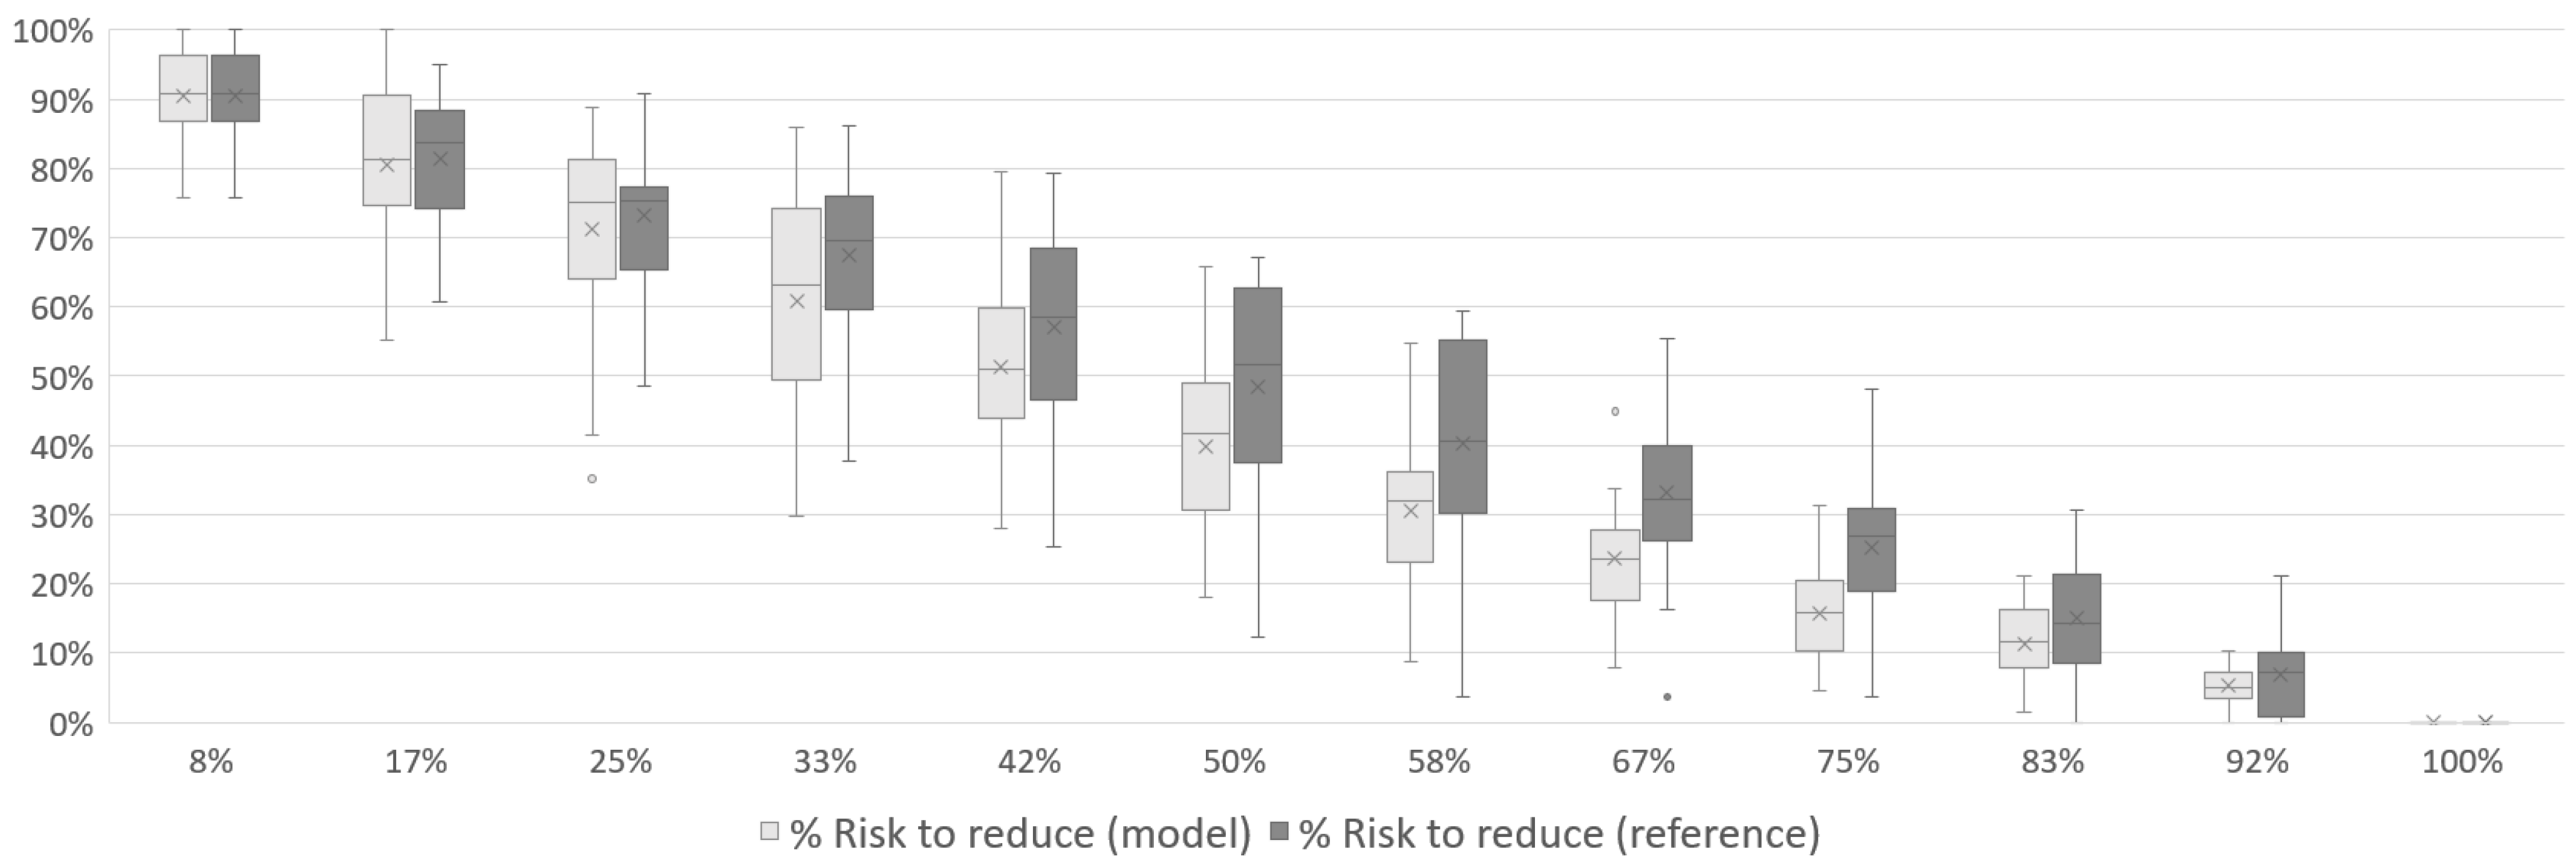
From Figure 7, Figure 8 and Figure 9, it can be seen how the associated risk starts at its maximum (100%) and decreases to zero by the end of the mission. Still regarding the associated risk, it is possible to see in each of the scenarios that the curve of the model reaches a lower value during the middle of the mission than the reference curve. In Figure 7, the risk has already fallen to 41% with the model while the reference was with 51%. In Figure 8, the same numbers are 33% and 44%, respectively, and 26% and 33% to Figure 9. The crosses in each iteration represents the average risk to reduce among all simulations while the dots represents simulations with outliers performances.
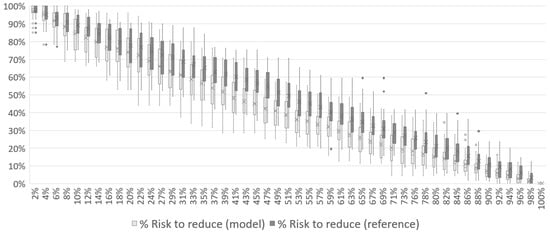
Figure 7.
Total risk reduction associated with the disaster over the course of Case 1 mission with 1 UAV.
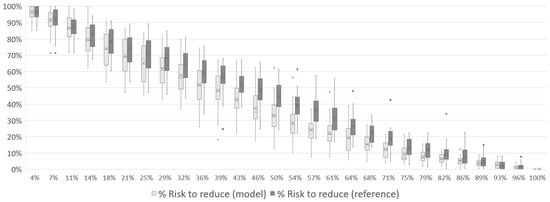
Figure 8.
Total risk reduction associated with the disaster over the course of Case 1 mission with 2 UAVs.
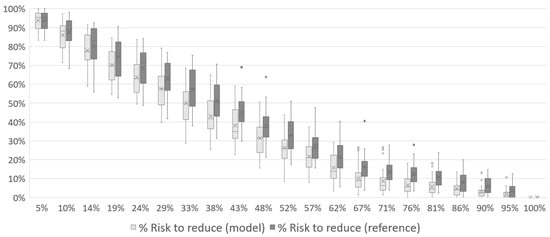
Figure 9.
Total risk reduction associated with the disaster over the course of Case 1 mission with 3 UAVs.
At no point in the mission is the reference curve better than the model’s. The reference curve starts similarly to the model’s curve, but in the first 10% of the time, it begins to diverge, reaching a ten-percentage point difference in the middle of the mission. This occurs because, as the UAV traverses the scenario, optimization uses the collected information to improve decision-making, which does not happen in the reference simulation. The curves converge again in the last quadrants when most victims have already been found by the model.
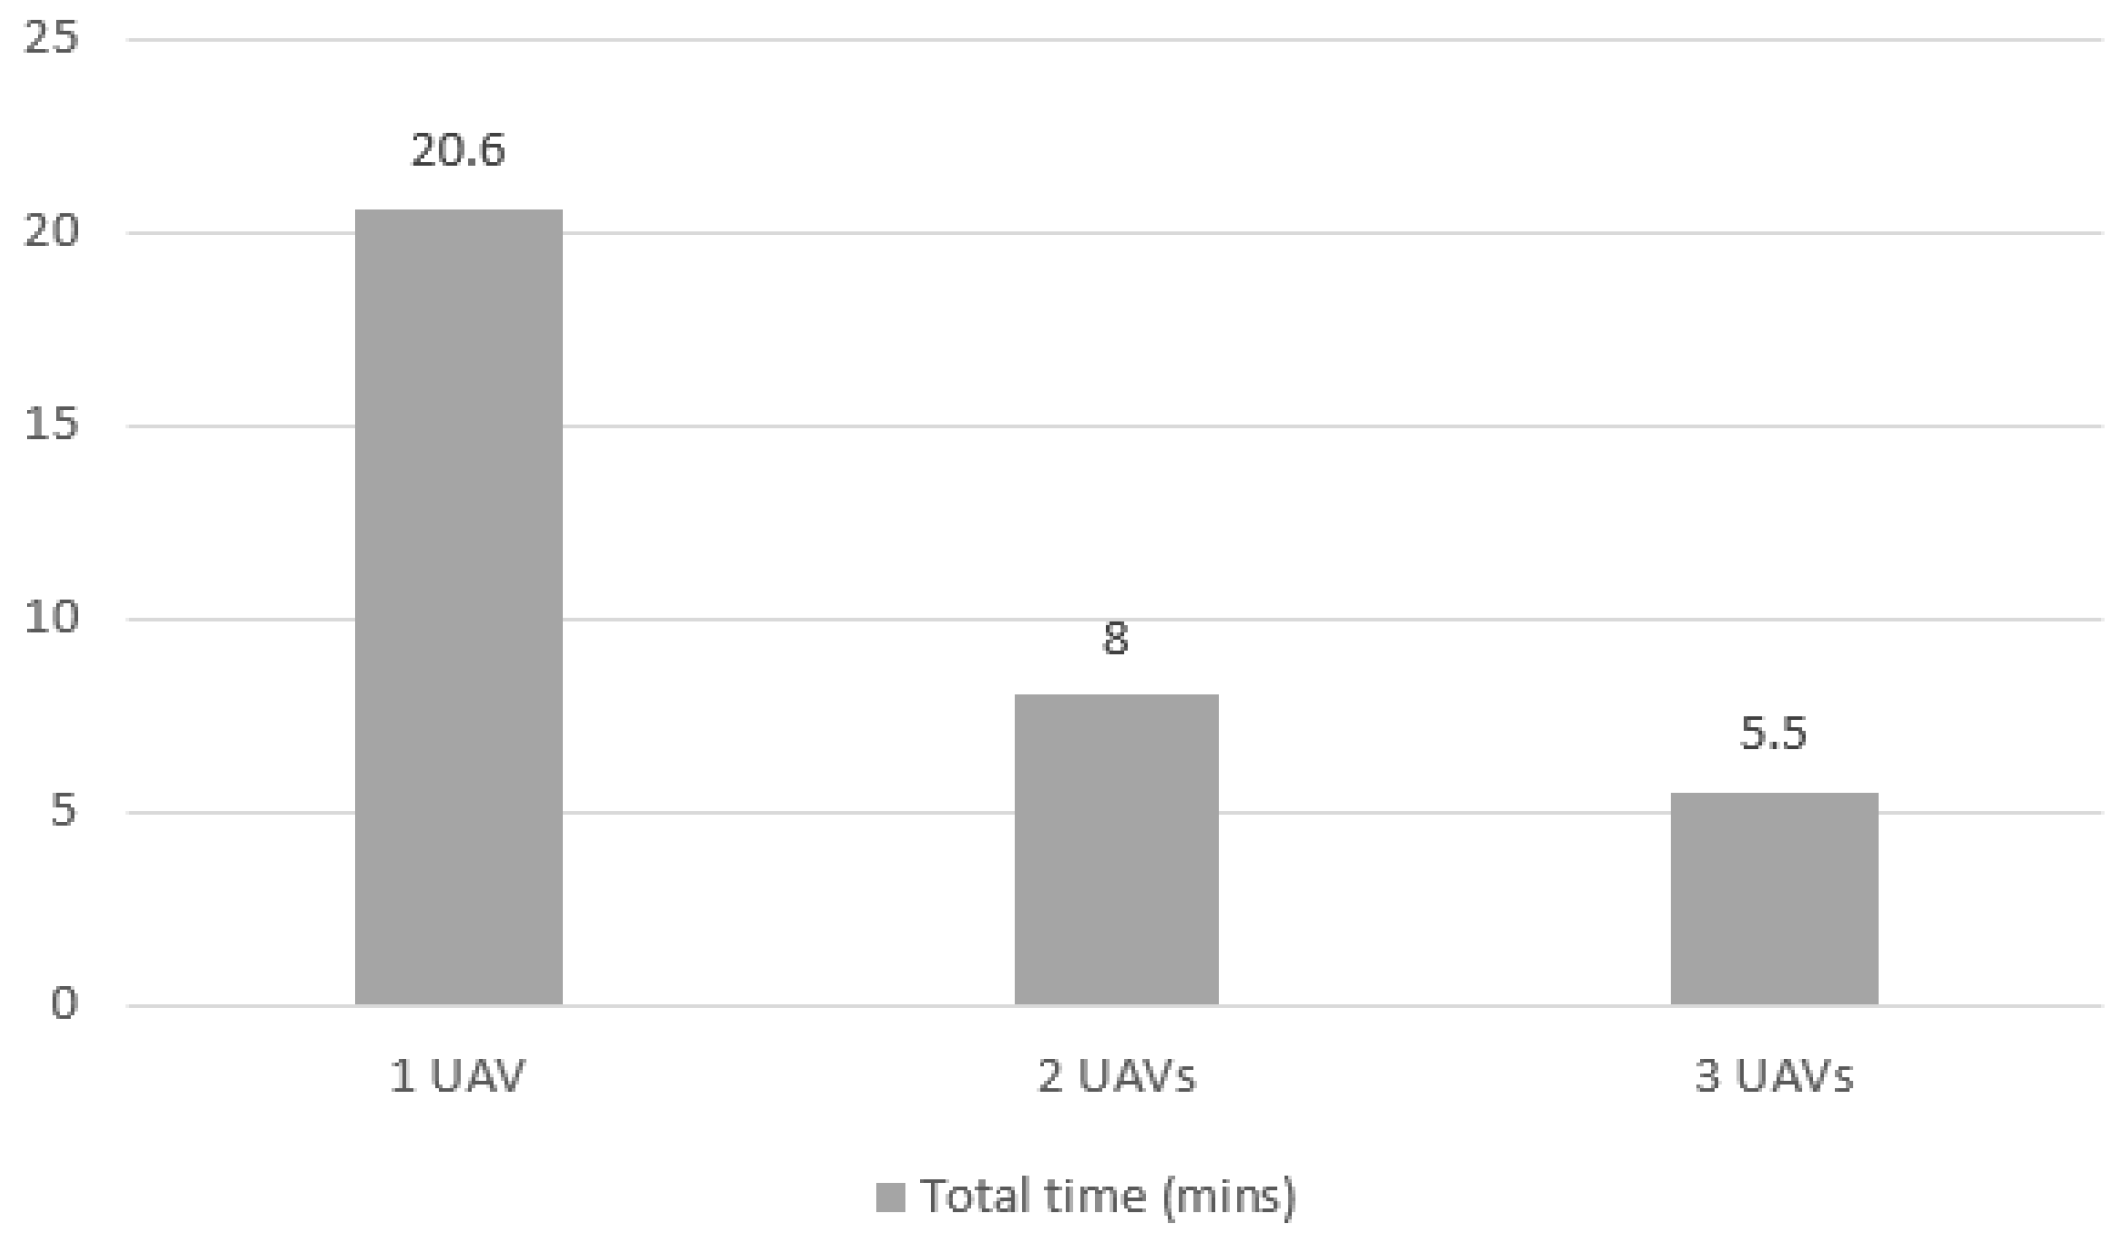
The different number of data points in the horizontal axis represents the number of quadrants each UAV had to go to. More UAVs mean less quadrants for each agent, which reduces the mission time, as can be seen more objectively in Figure 10. The total time of the mission falls from 20.6 min to 8 min when 2 UAVs are used instead of 1, meaning that the time fell more than proportionally to the increase in number of agents. The same happens when using 3 UAVs, as the time decreases to 5.5 min.
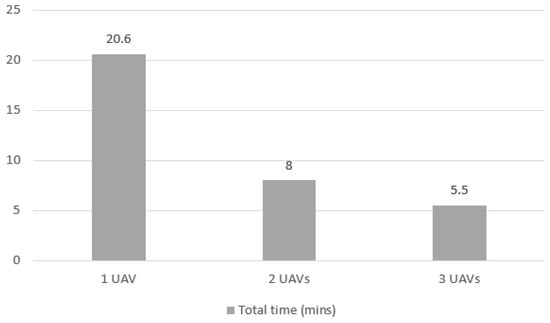
Figure 10.
Total elapsed time for Case 1 mission with 1, 2 and 3 UAVs.
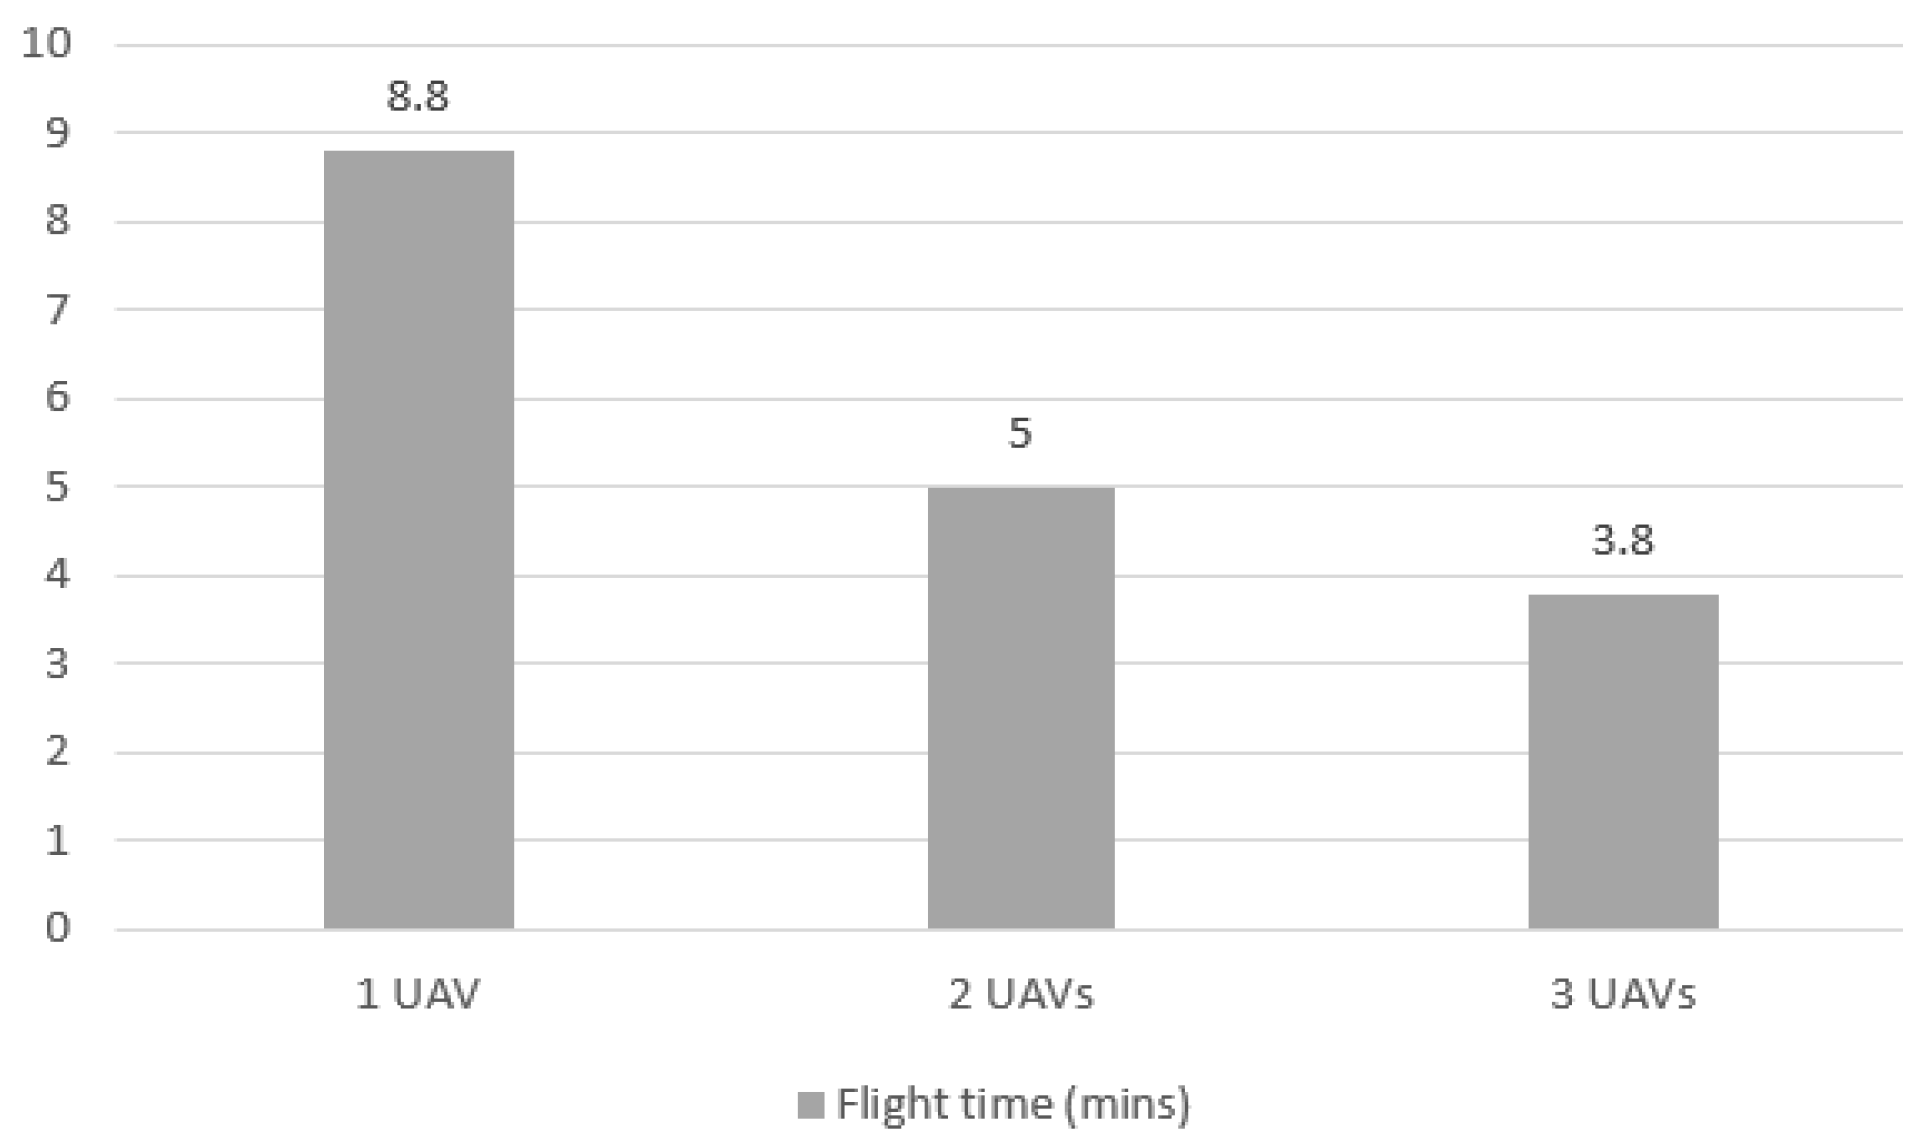
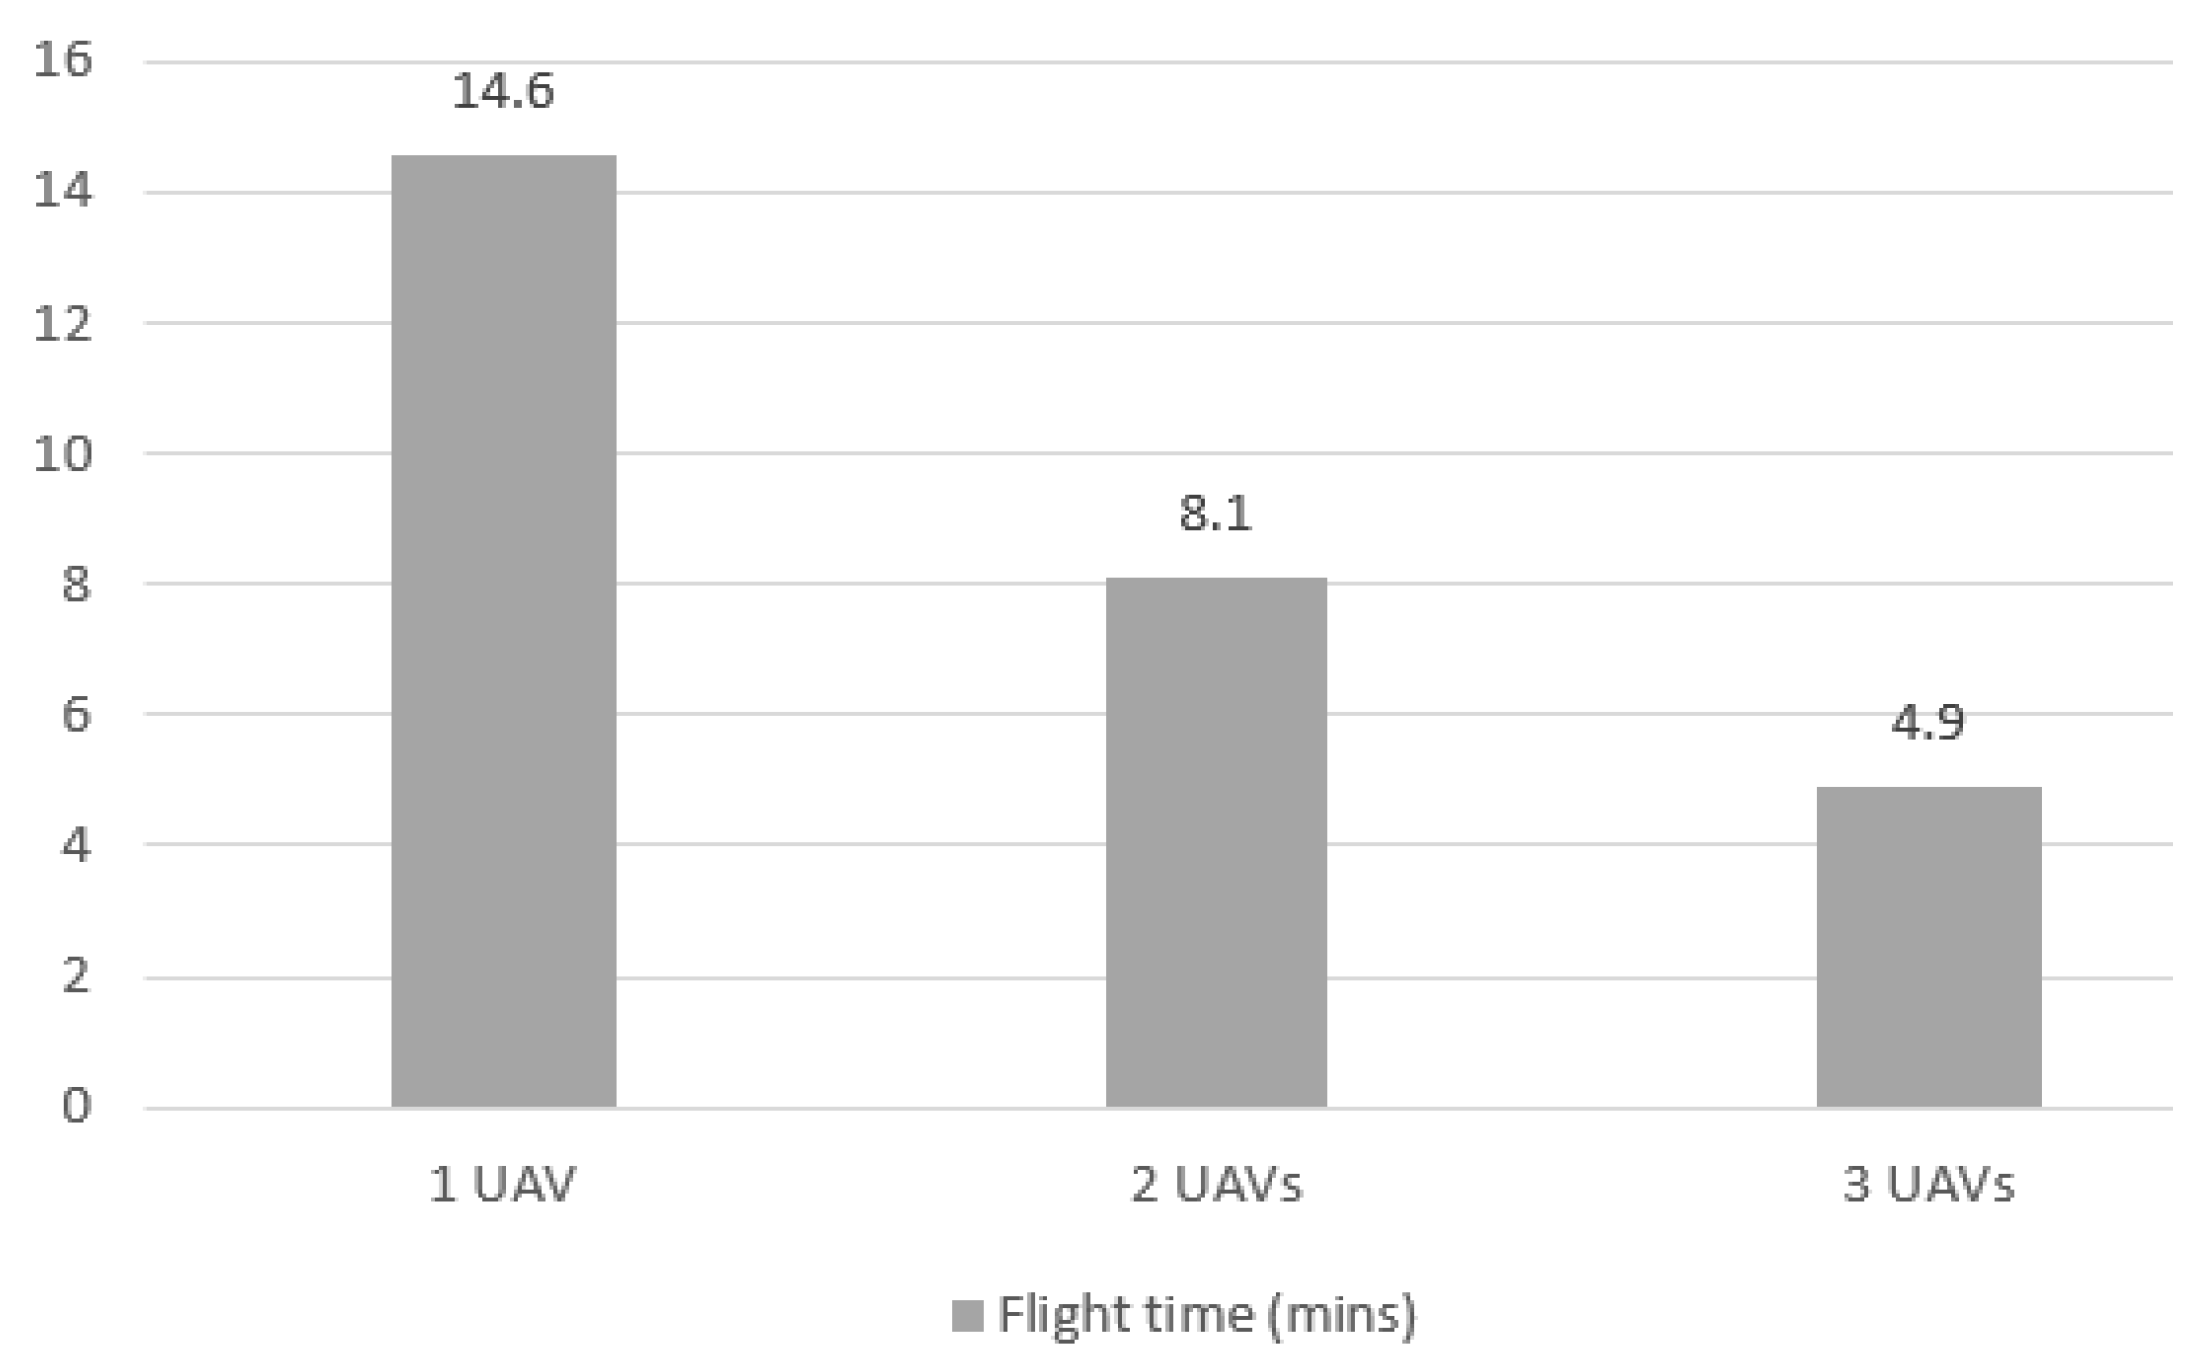
As shown in Figure 11, there is a proportional gain in flight time when the number of UAVs increases. This is an expected gain since UAVs can execute flights in parallel, and each UAV does not need to cover the entire mission scenario.
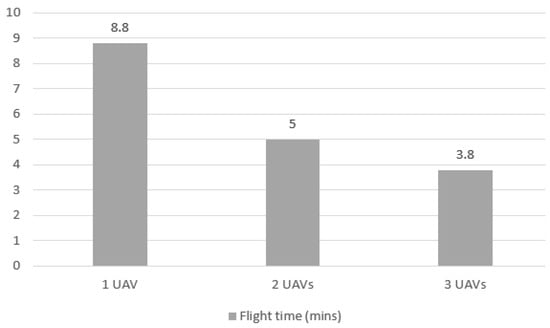
Figure 11.
Flight elapsed time for Case 1 mission with 1, 2 and 3 UAVs.
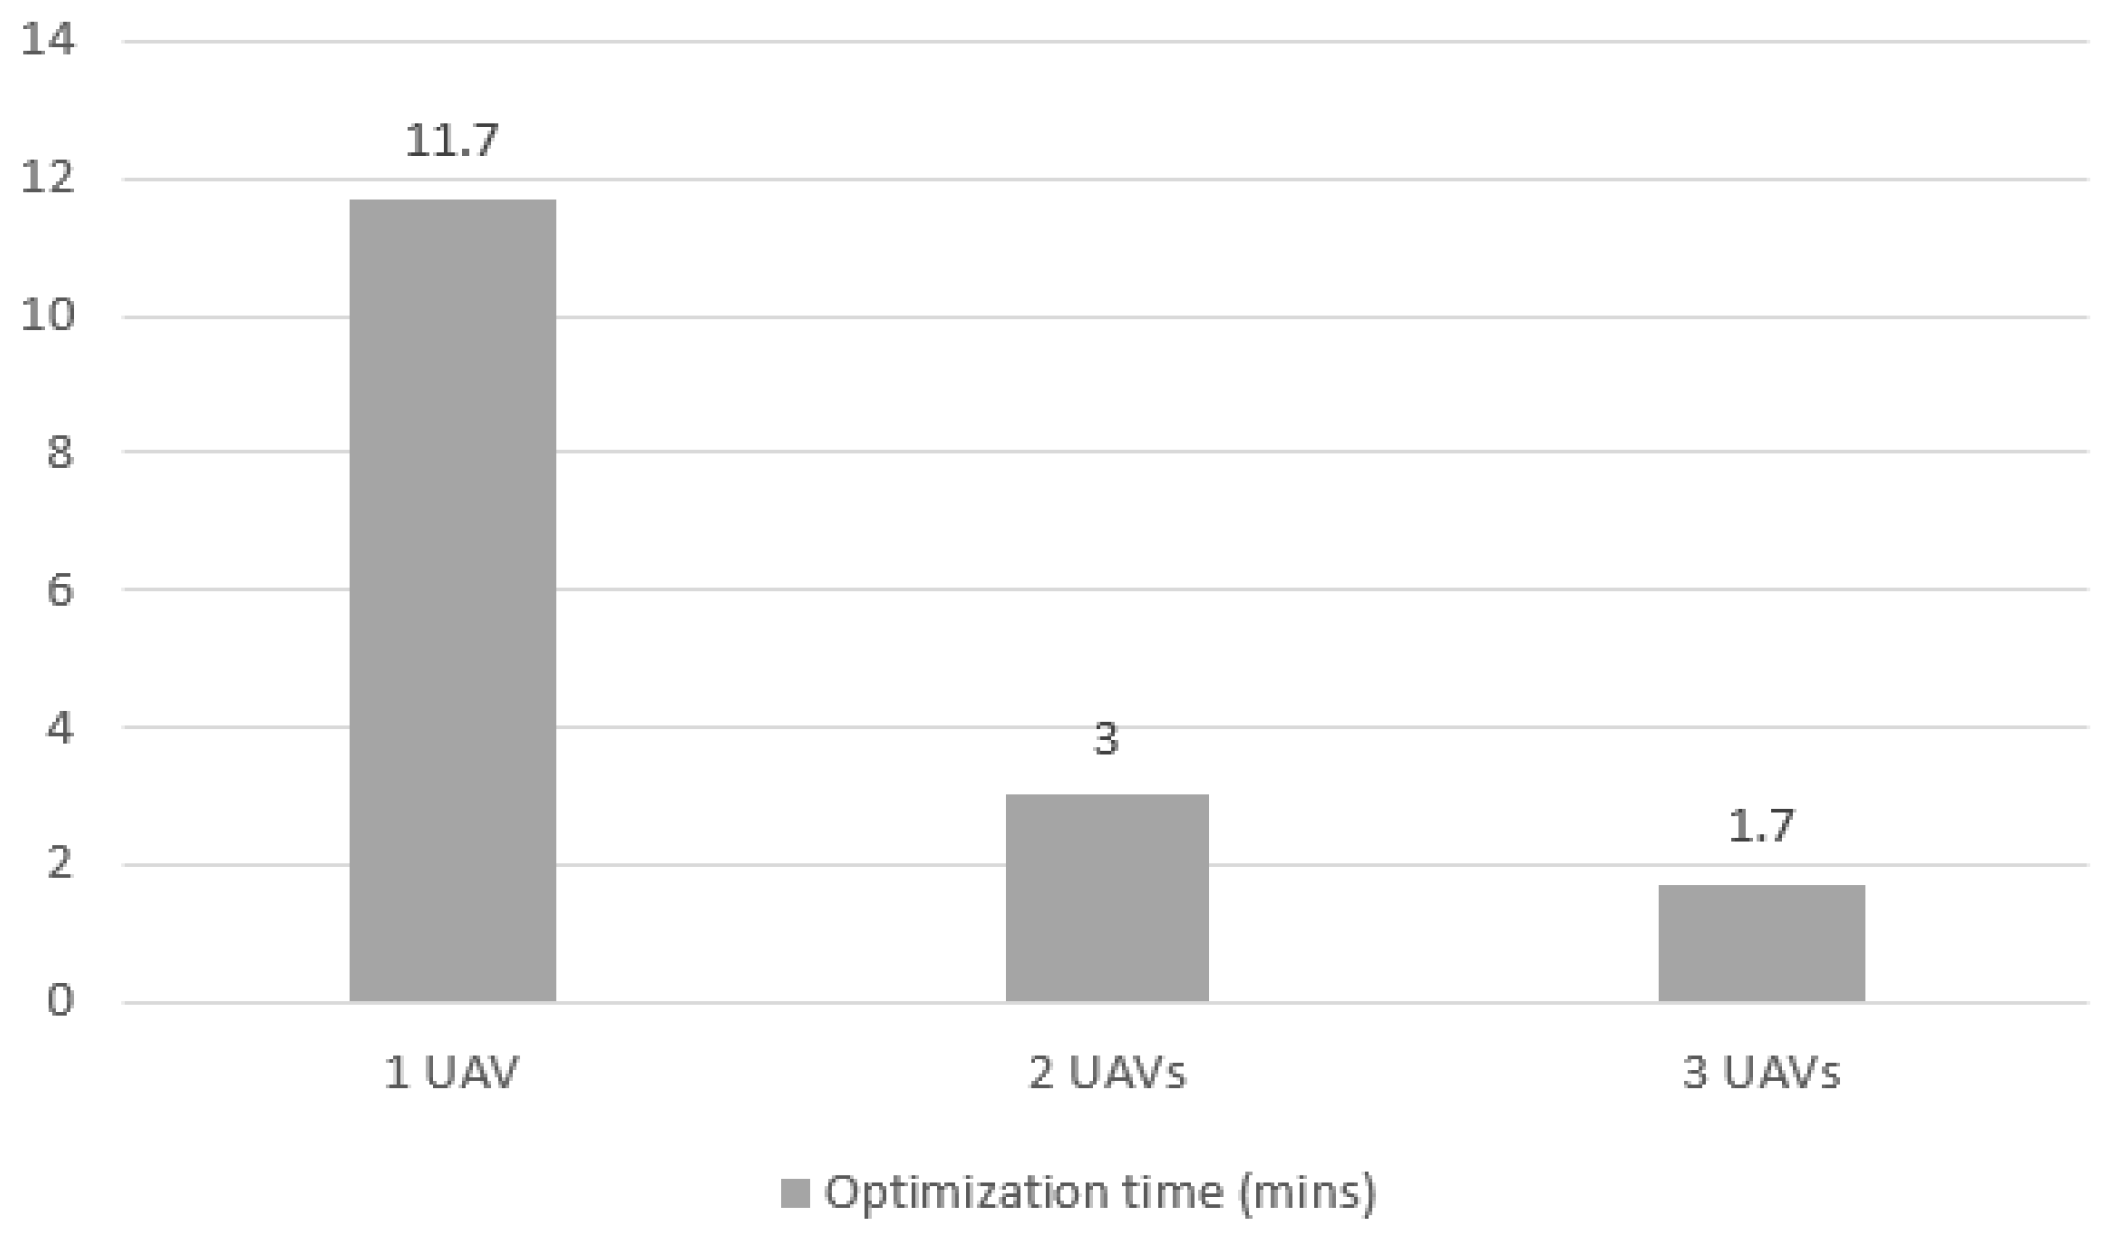
Figure 12 shows the optimization time to complete the mission for the three tested scenarios for Case 1. The most significant performance gain was in the increase from 1 to 2 UAVs, where the time dropped from an average of 11.7 min to 3 min. The 75.0% decrease shows that, in addition to the proportional gain of having 2 agents executing the mission, there is a reduction in the optimization time. When each UAV is responsible for a specific area, and the problem is divided for each area, the number of variables exponentially reduces, allowing a decrease in the number of calculations needed to converge to a decision.
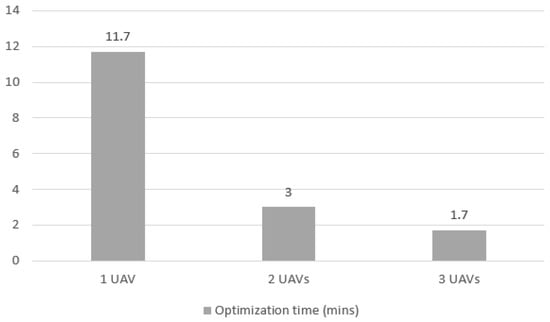
Figure 12.
Optimization elapsed time for Case 1 mission with 1, 2 and 3 UAVs.
From 2 to 3 UAVs, there was an expected proportional gain of 33.0%, and the observed gain was 43.0% (3 min to 1.7 min). It is a smaller time decrease than from 1 to 2, but still more than proportional, demonstrating a gain in optimization time as well.
This decomposition of the time in optimization and flight makes clear that increasing the number of agents has the potential to reduce the time exponentially as the optimization complexity has an exponential relation with the number of quadrants it has to visit. The smaller the number of quadrants it needs to visit, the lower the complexity.
The results of the simulations for Case 1 show that the proposed model performs better than a reference simulation without optimization. The gains observed in risk reduction and total mission time demonstrate the potential of the approach in solving the problem of victim search and risk reduction in disaster scenarios.
4.2. Results for Case 2
The second case aimed to evaluate the model’s performance when presented with a less complex scenario. This scenario introduces a reduction in the number of victims and in the area. The objective is to assess if the complexity of the model pays off when compared to the simpler reference solution.
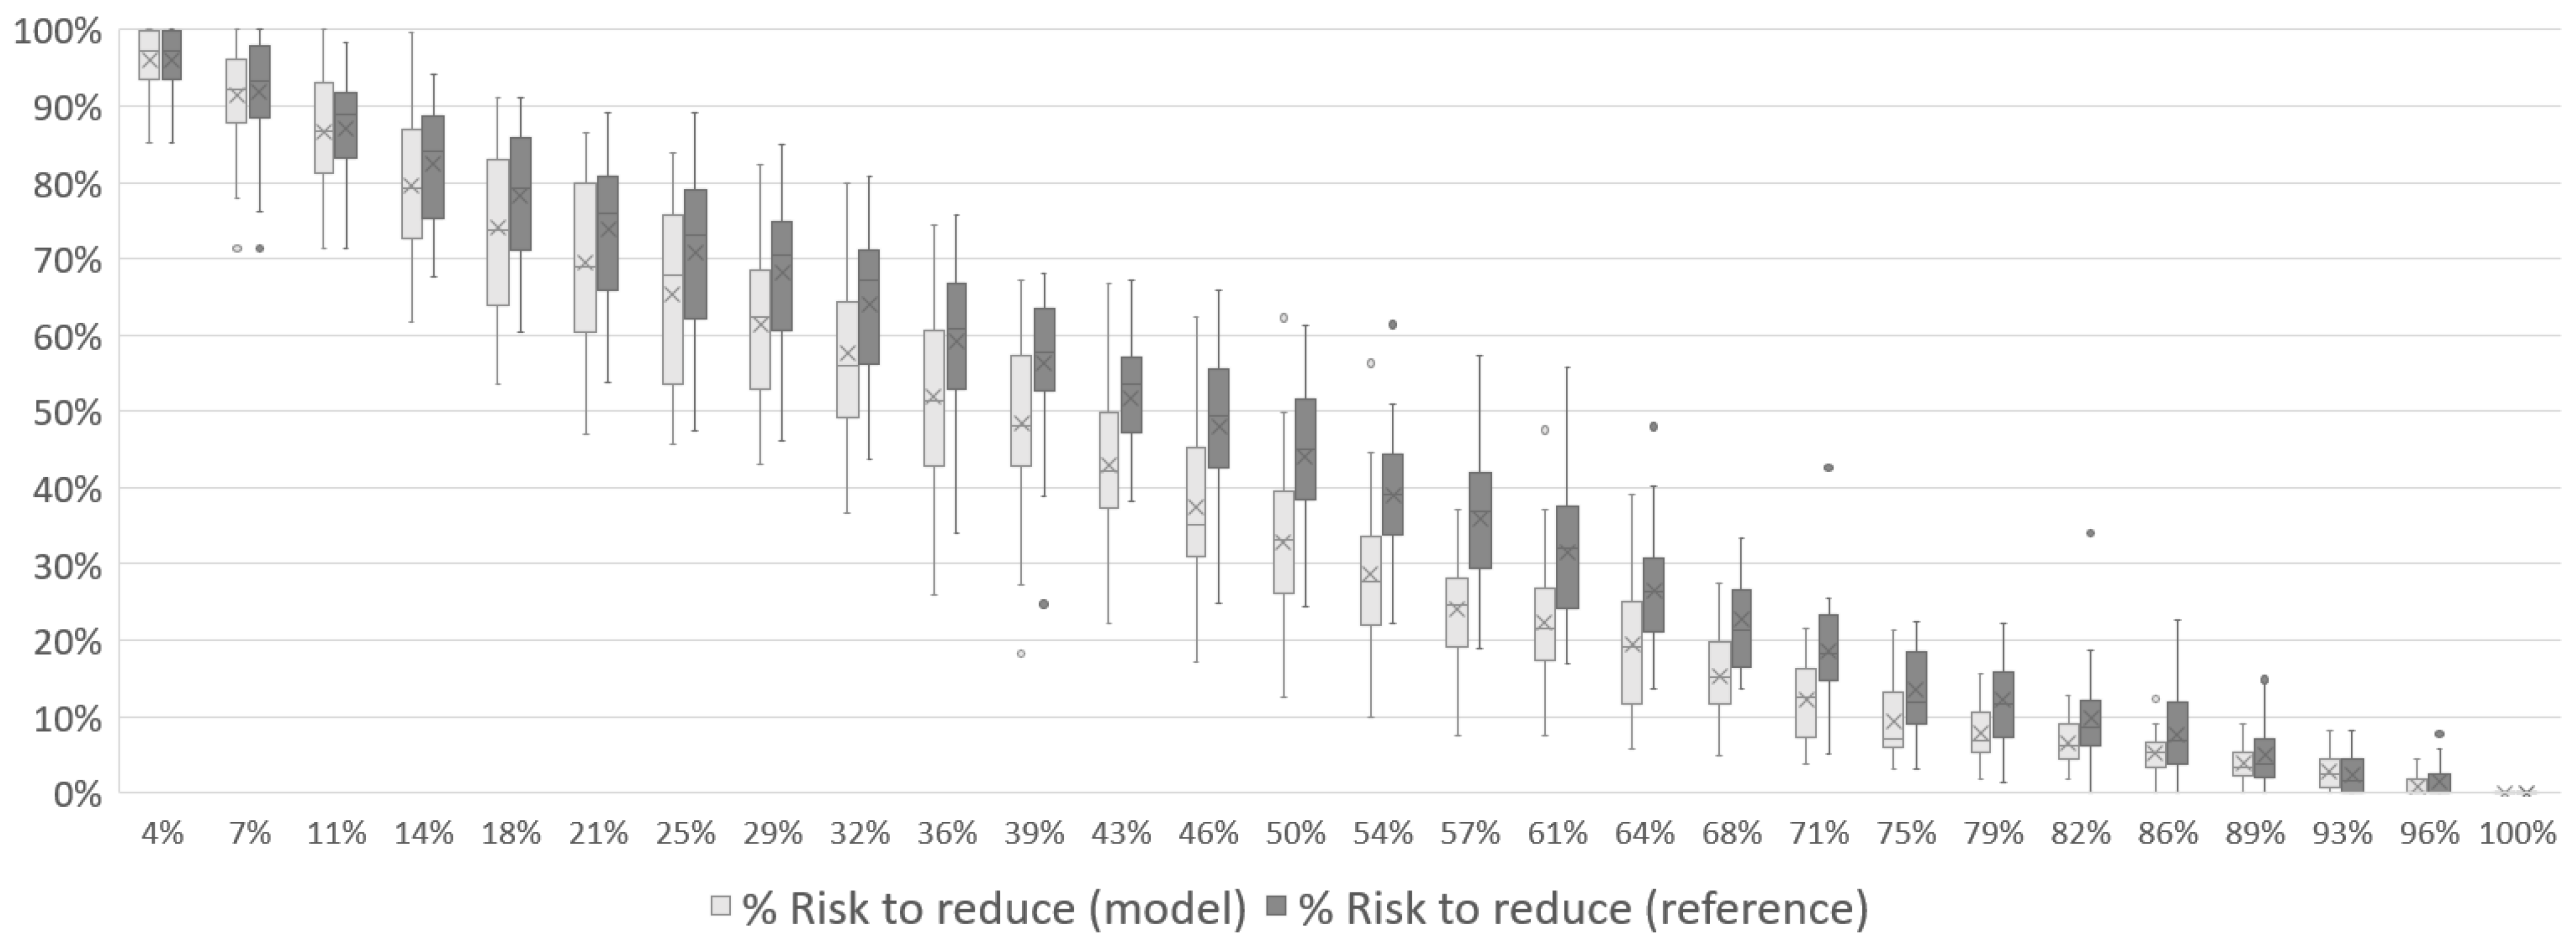
In Figure 13, Figure 14 and Figure 15, the results for Case 2 show a similar pattern to Case 1. The risk to be reduced starts at its maximum and decreases to zero by the end of the mission. Approximately halfway through the mission, the risk has already dropped to an average of less than 50% of its total value (39% for 1 UAV, 41% for 2 UAVs and 40% for 3 UAVs). The reference simulation has the same behavior observed in Case 1, with the model showing better results throughout the mission.

Figure 13.
Total risk reduction associated with the disaster over the course of Case 2 mission with 1 UAV.
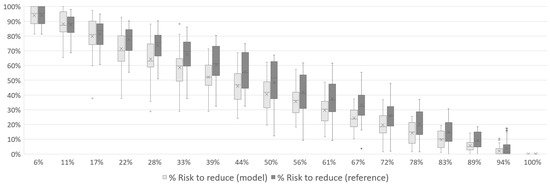
Figure 14.
Total risk reduction associated with the disaster over the course of Case 2 mission with 2 UAVs.
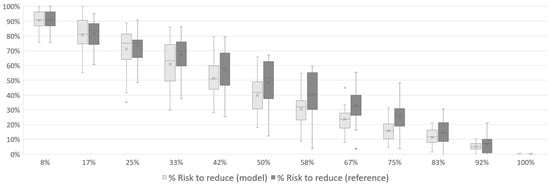
Figure 15.
Total risk reduction associated with the disaster over the course of Case 2 mission with 3 UAVs.
This behavior indicates that even with a smaller number of variables, derived from the reduction in complexity of the case, the model can still take advantage of the information gathered during the mission to outperform the reference curve.
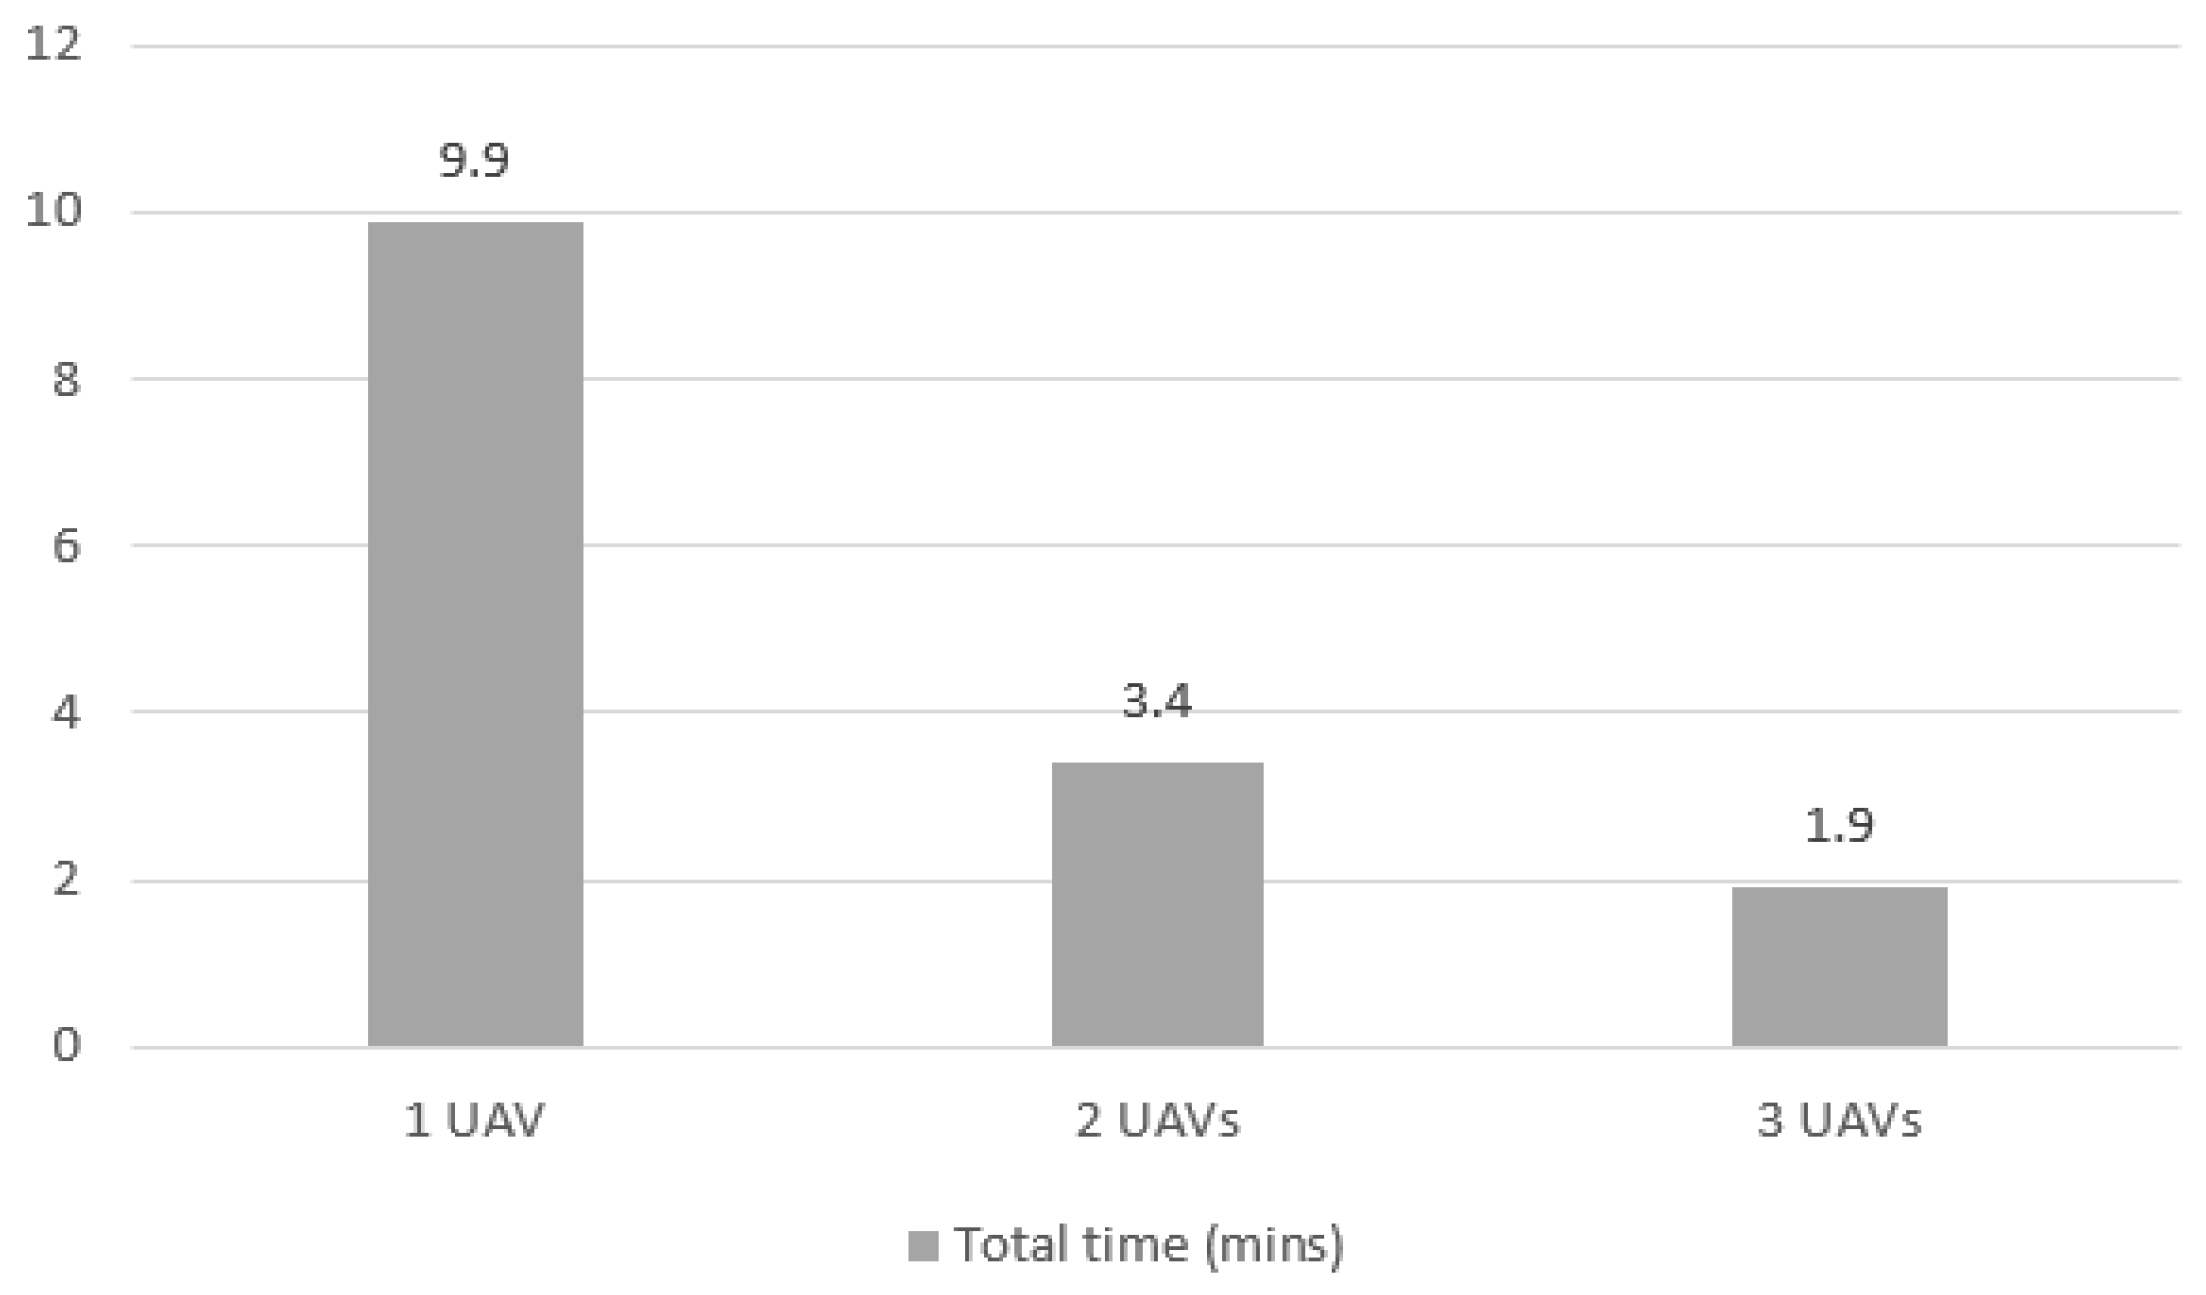
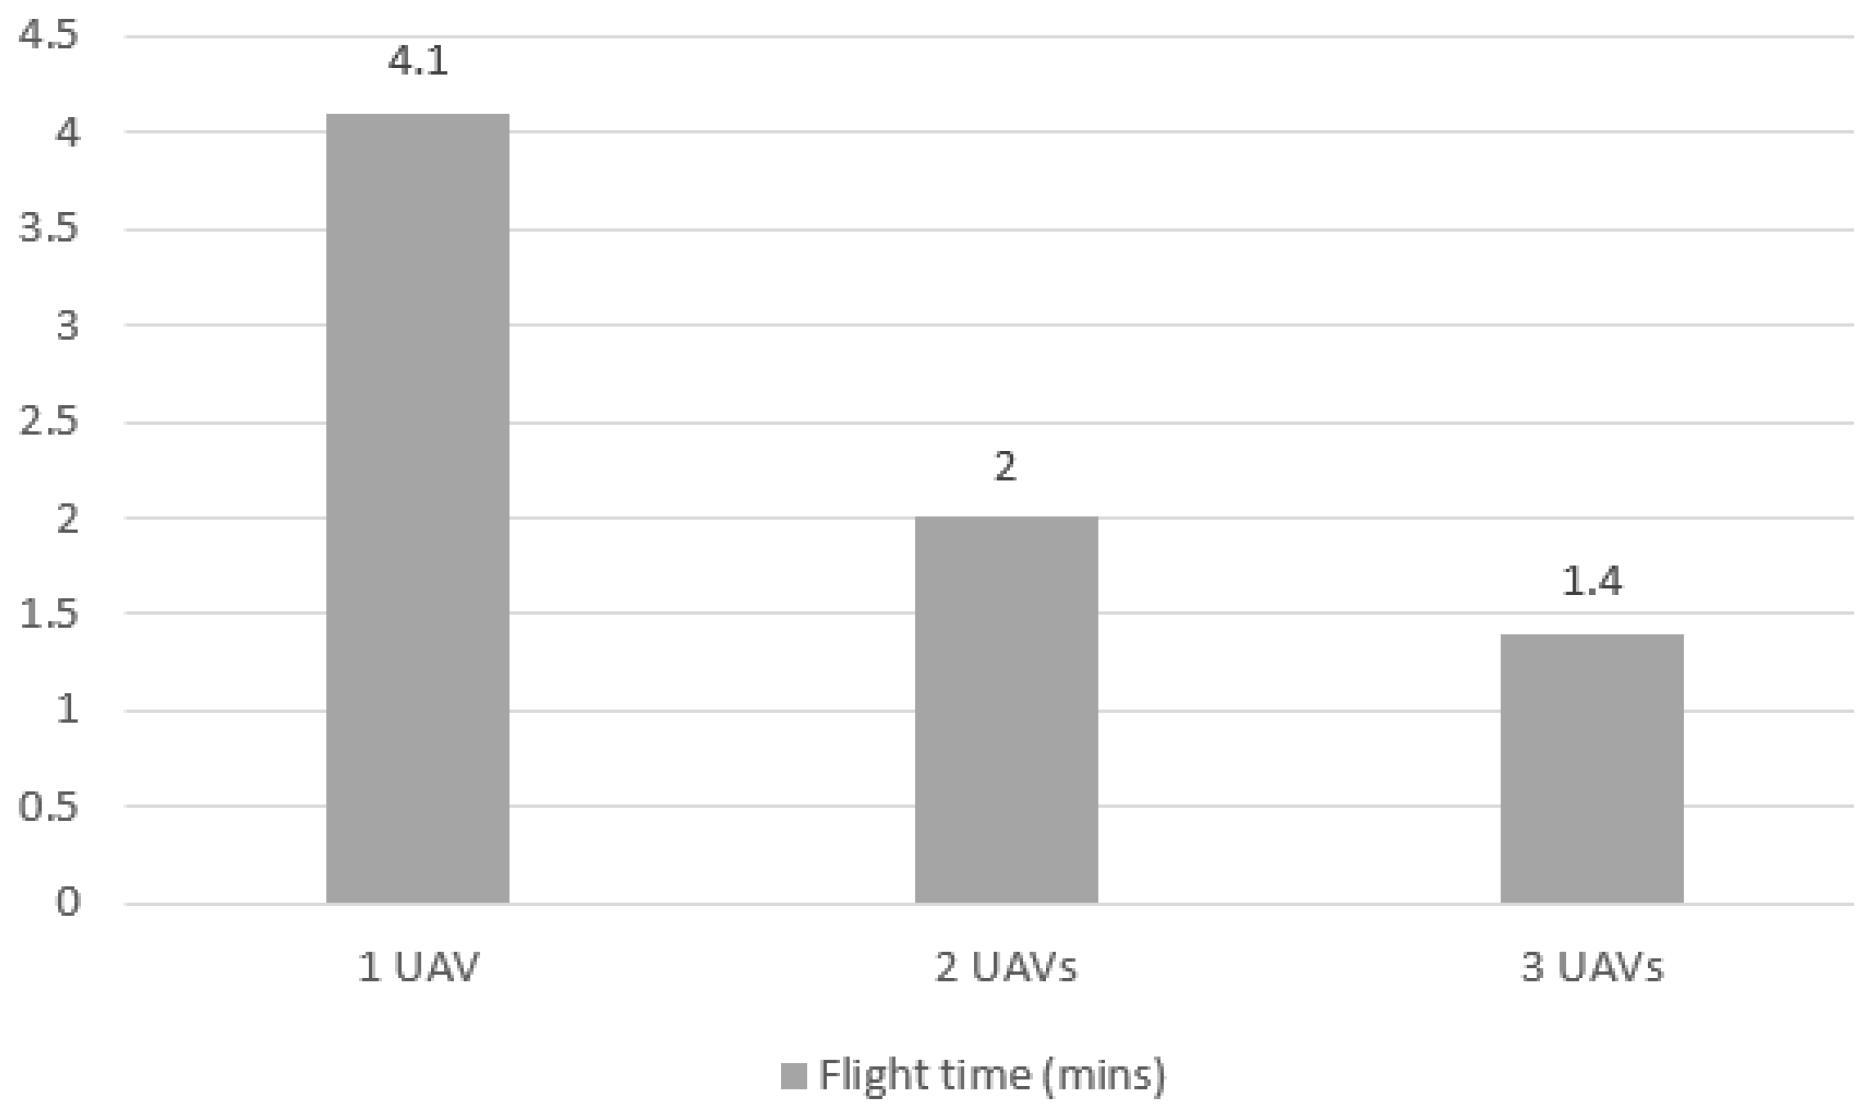
Figure 16 shows that the total mission time reduction for the scenarios in Case 2 are, as in Case 1, more than proportional reduction. The reduction from 1 to 2 UAVs is more pronounced than from 2 to 3 UAVs, with an 84.0% reduction compared to a 47.0% reduction, respectively.
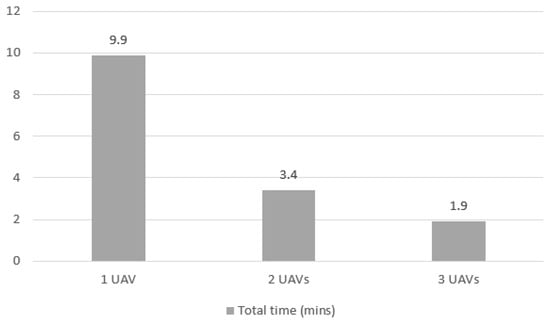
Figure 16.
Total elapsed time for Case 2 mission with 1, 2 and 3 UAVs.
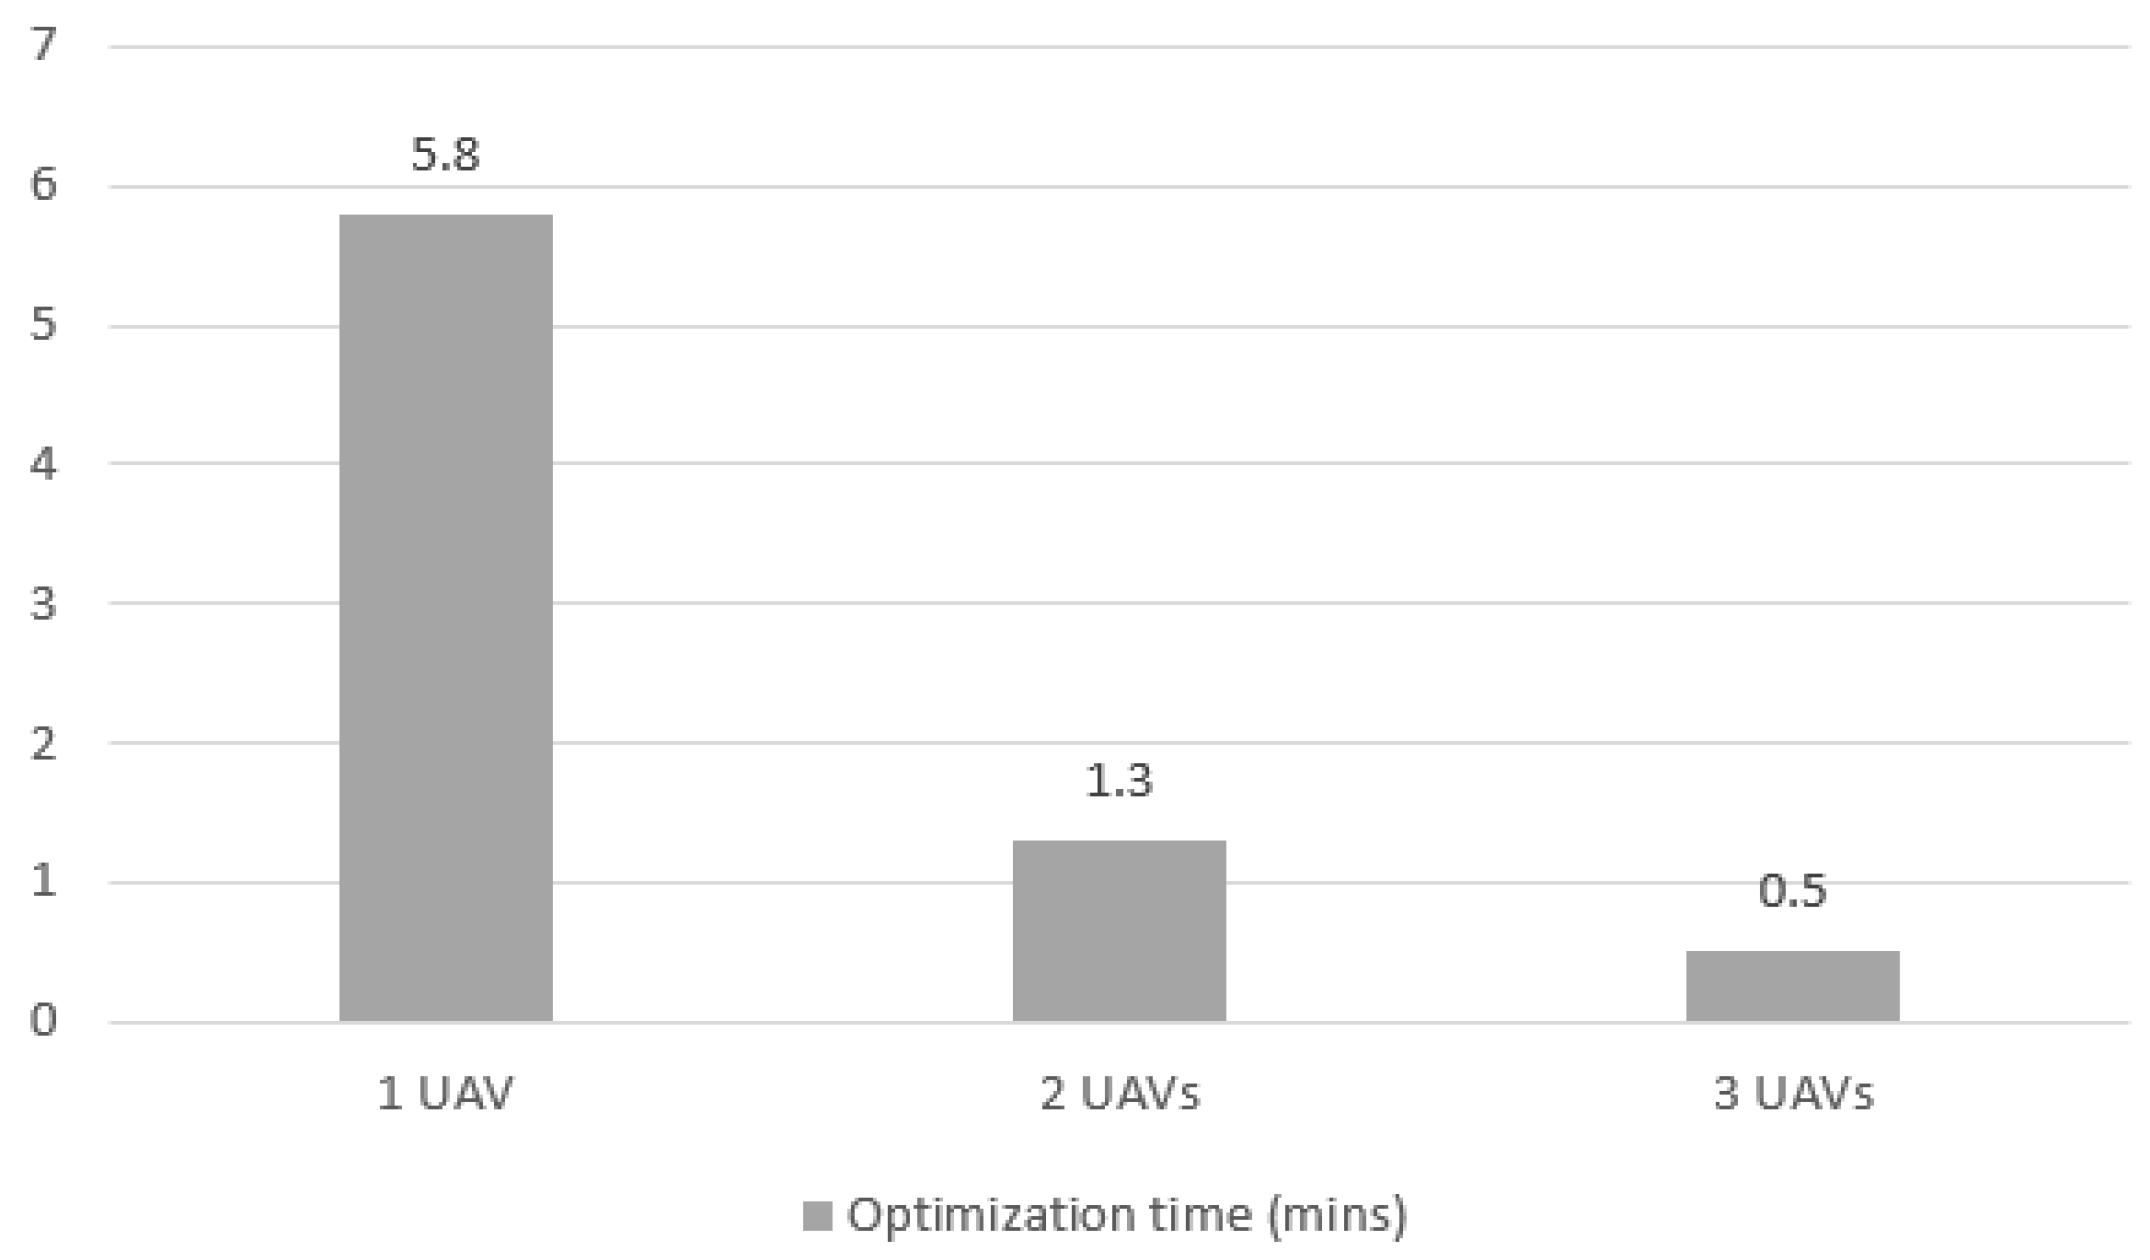
Figure 17 illustrates the proportional gain in flight time when the number of UAVs increases for Case 2. The time decreases are expected, given that UAVs can execute flights in parallel, and each UAV does not need to cover the entire mission scenario. In Figure 18, the optimization time to complete the mission for the three tested scenarios for Case 2 is shown. Similar to Case 1, the most significant performance gain was in the increase from 1 to 2 UAVs, where the time dropped an average of 79.0%. The decomposition of the times again shows that most of the gain comes from optimization time reduction.
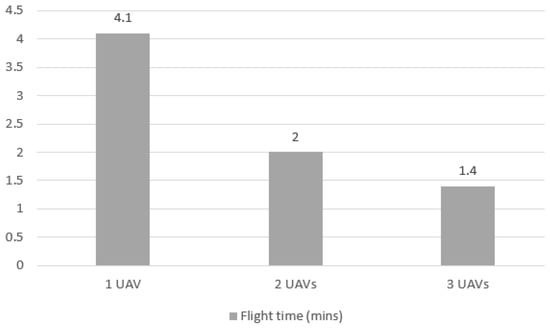
Figure 17.
Flight elapsed time for Case 2 mission with 1, 2 and 3 UAVs.
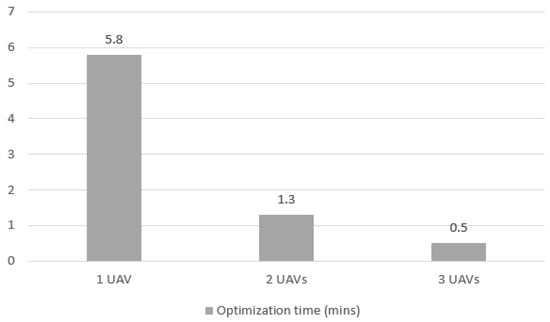
Figure 18.
Optimization elapsed time for case 2 mission with 1, 2 and 3 UAVs.
4.3. Results for Case 3
Case 3 has a bigger area and is more populous. The objective was to assess the model’s adaptability to scenarios with more variables and see if it was able to reach a feasible solution even under exponential complexity.
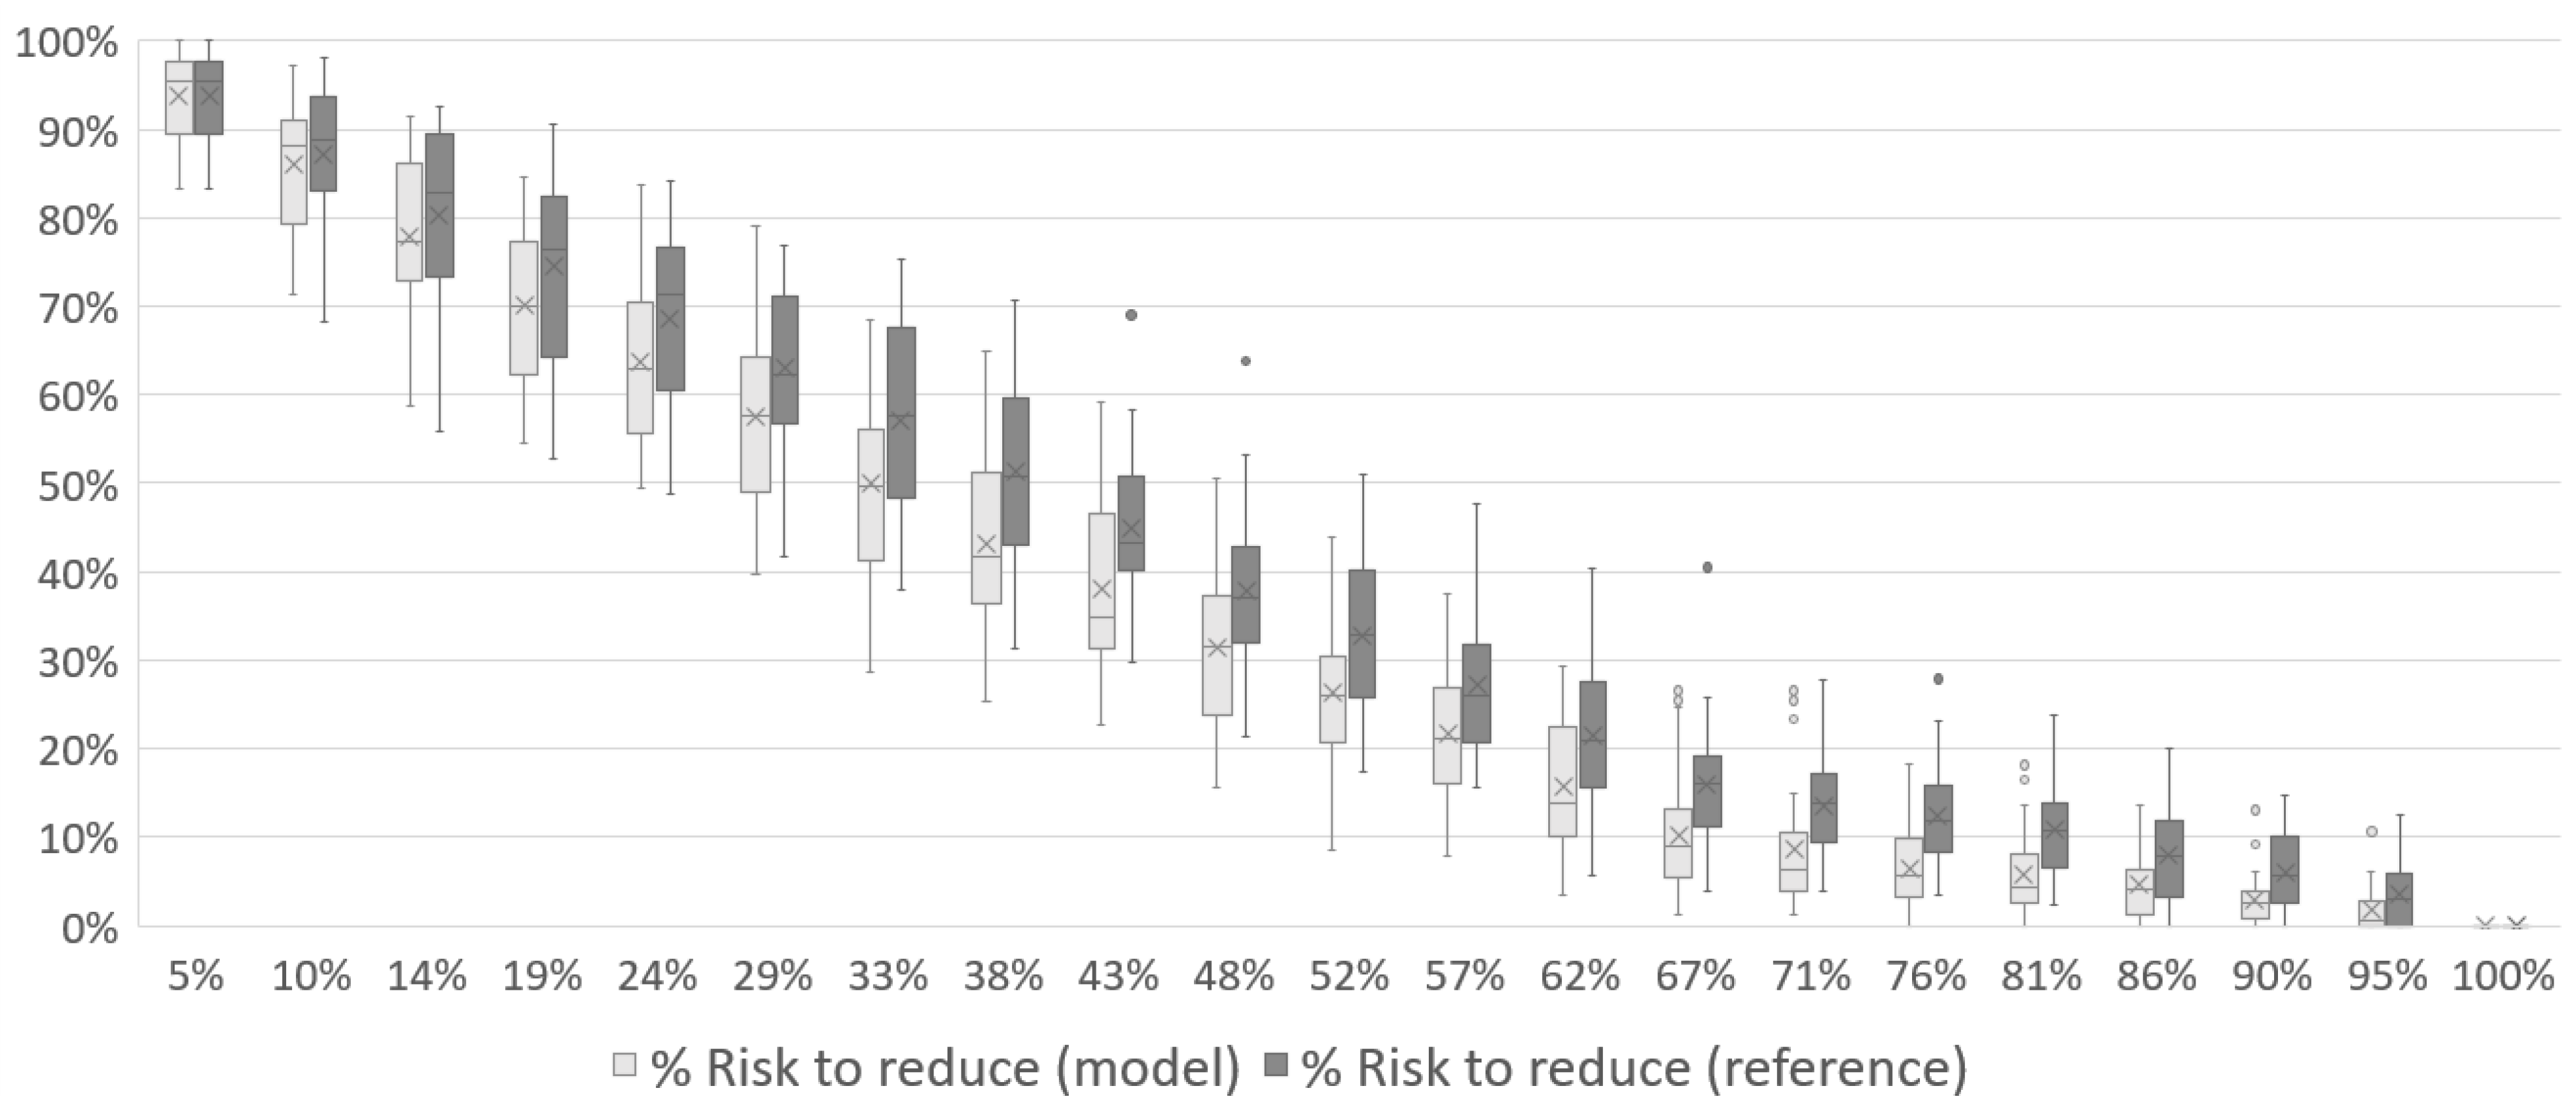
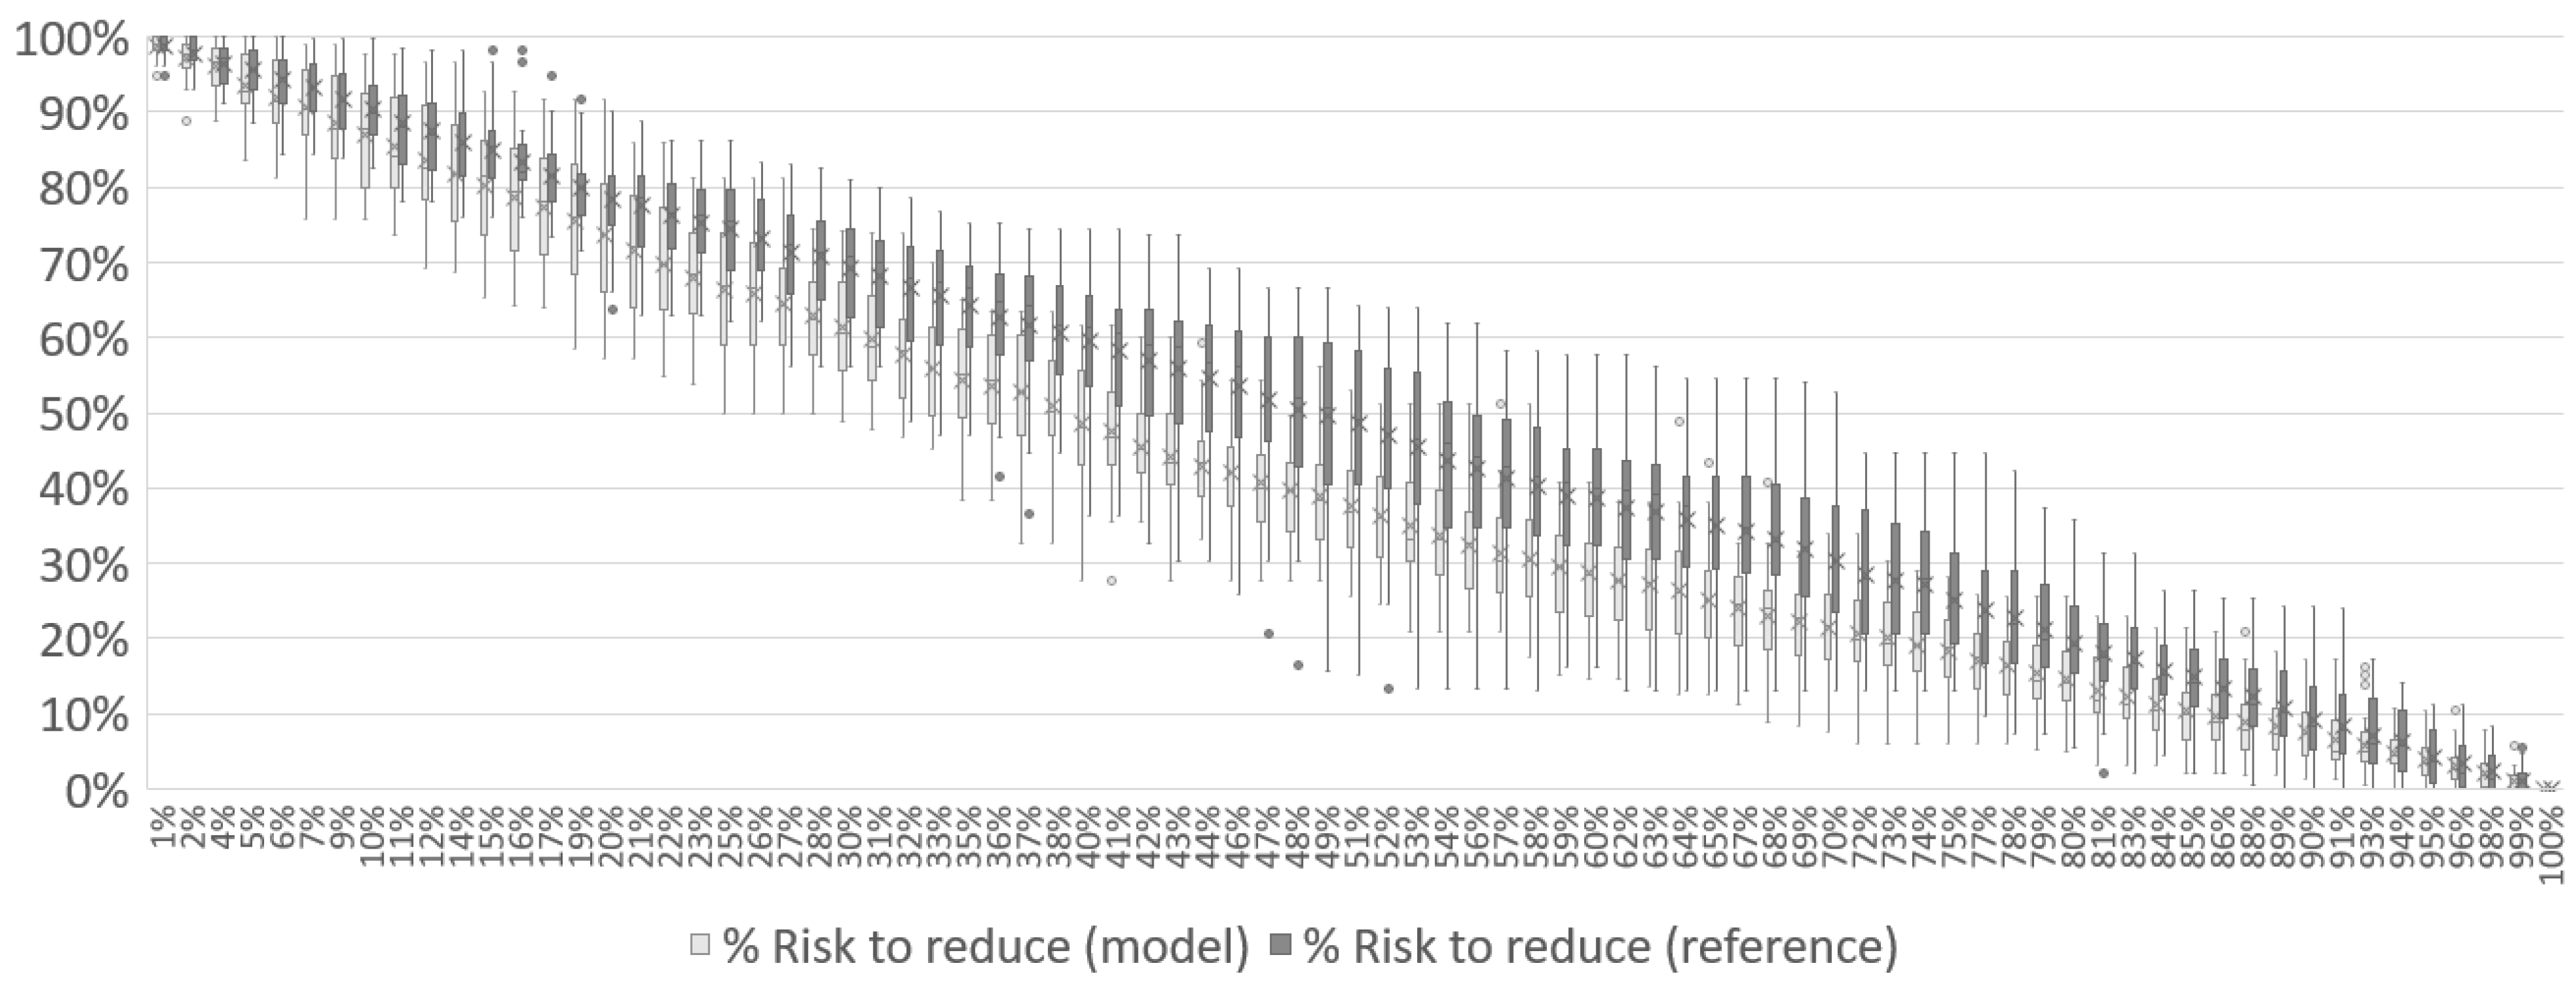
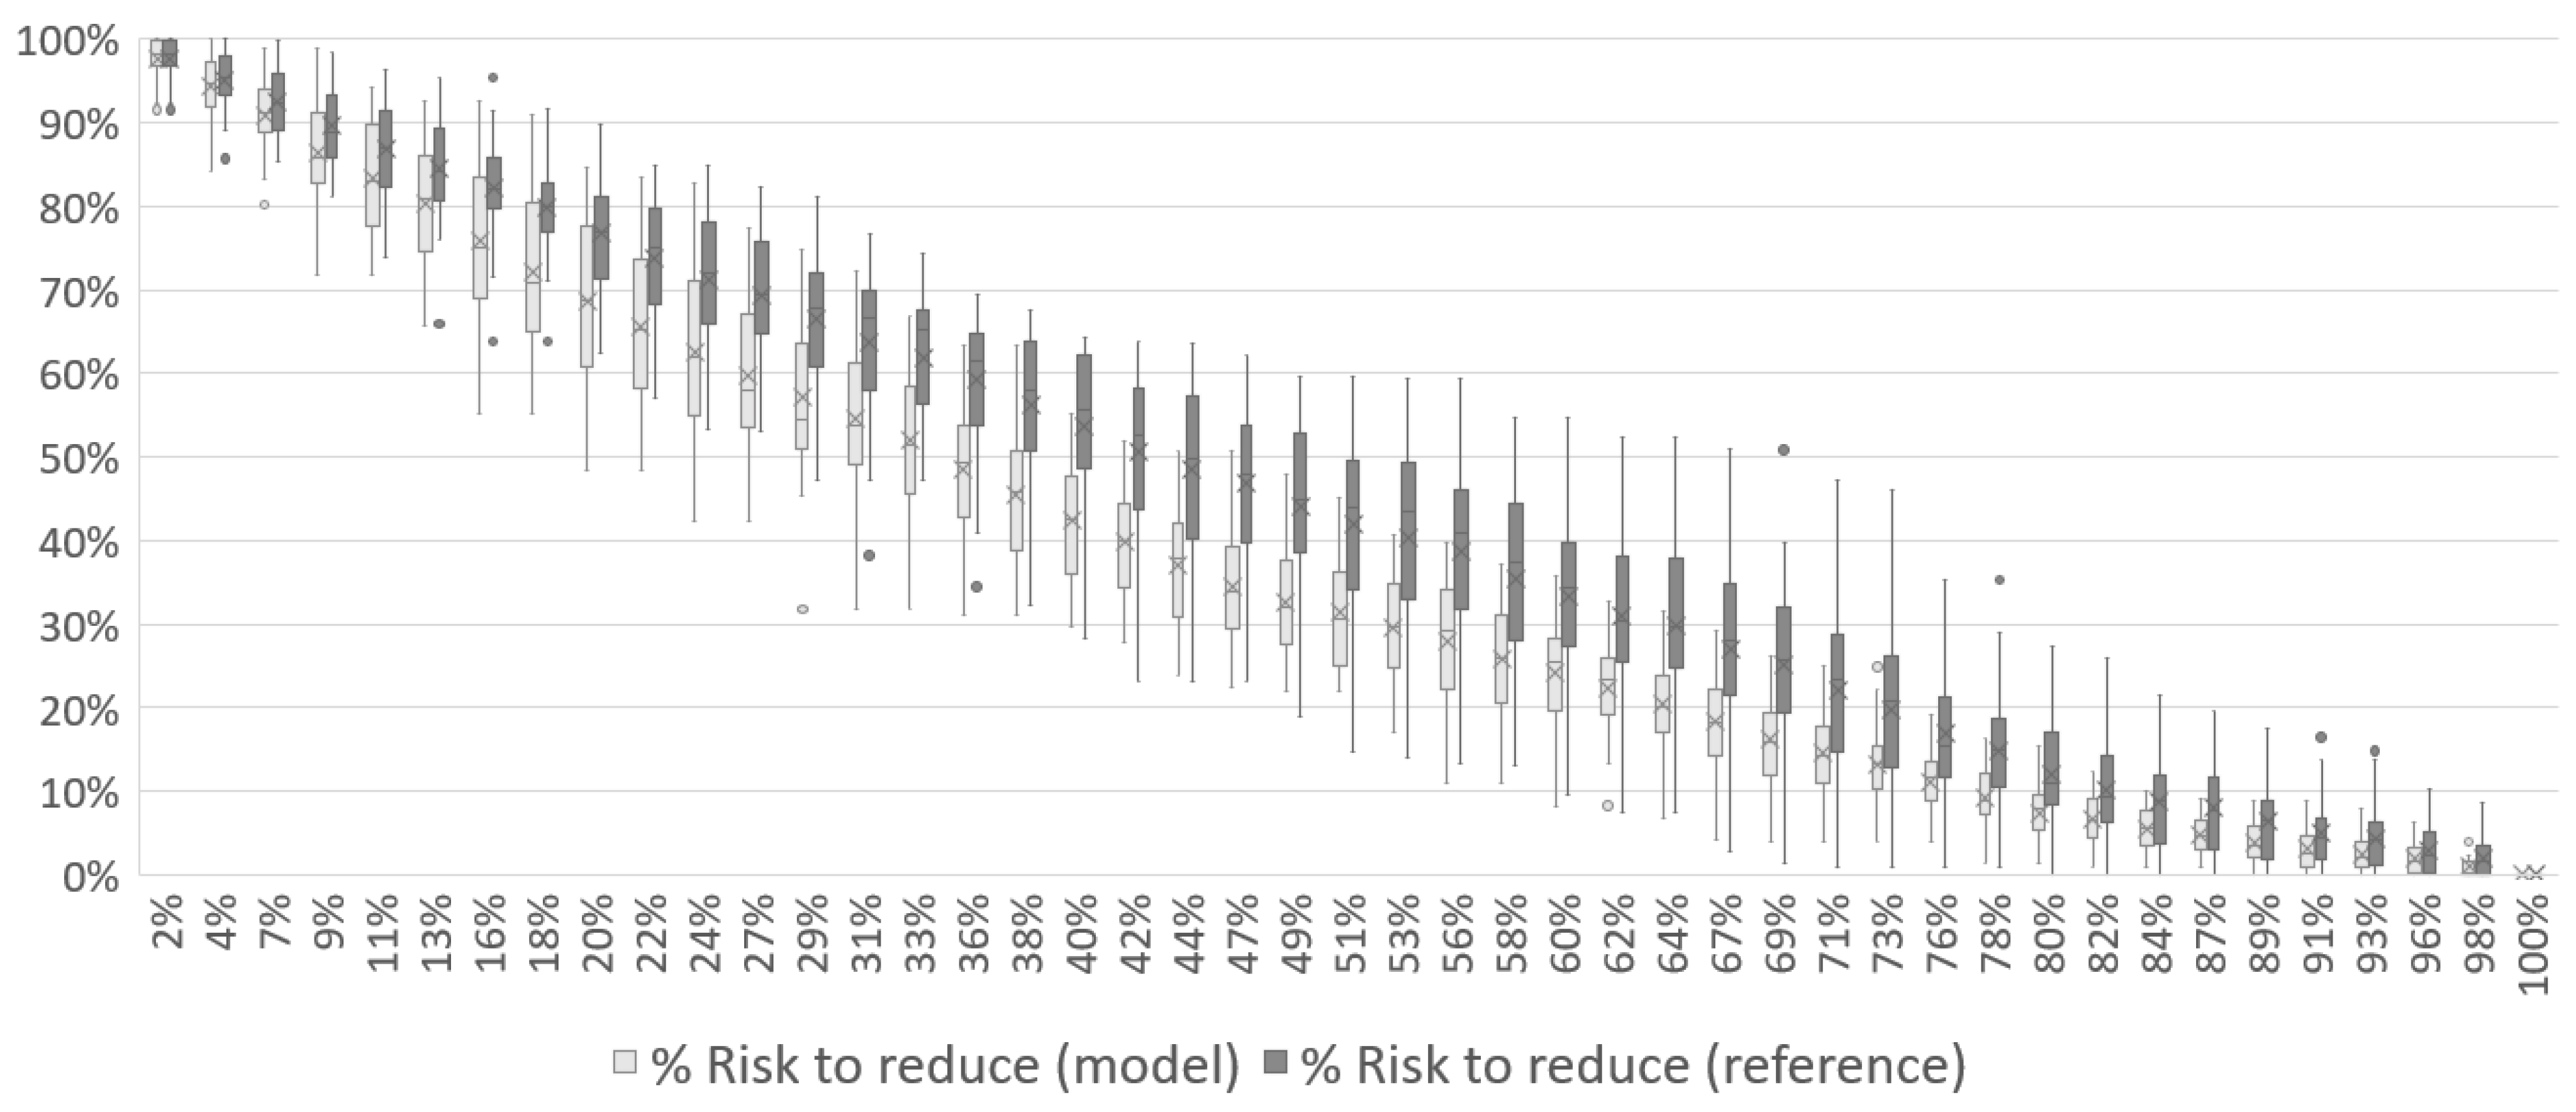
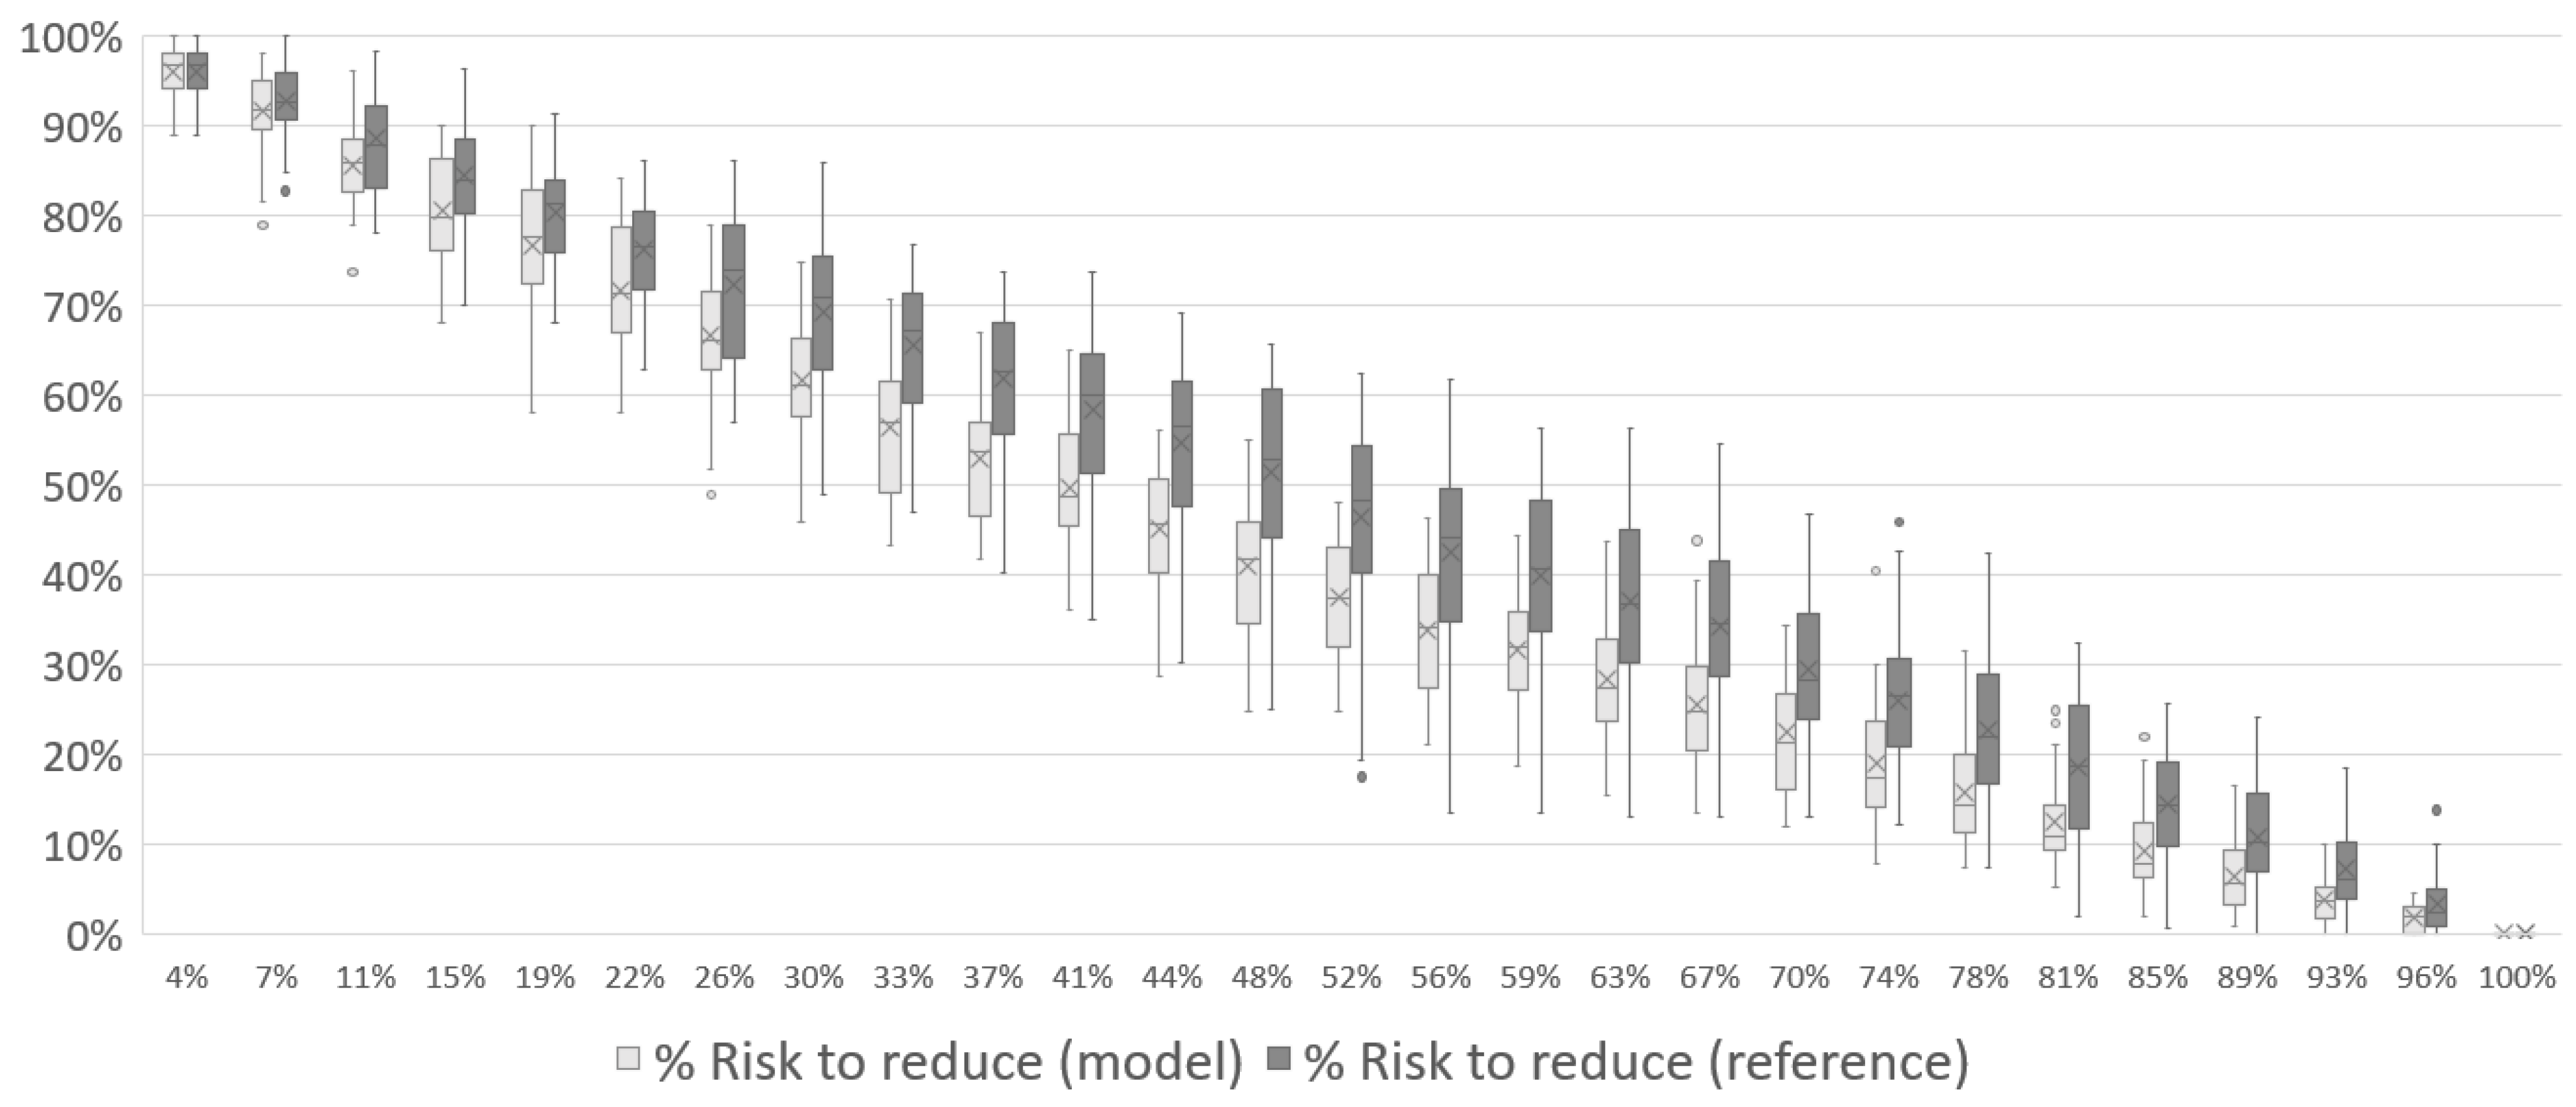
In Figure 19, Figure 20 and Figure 21, the results for Case 3 show patterns similar to what was observed for Case 1 and Case 2. The risk reduction starts at its maximum and varies down as the scenario evolves. Approximately halfway through the mission, the risk has already dropped to 38% with 1 UAV, 33% for 2 UAVs and 38% for 3 UAVs. The reference simulation has the same behavior observed in previous cases, with the model showing better results throughout the mission. In general, the reference seems to be reducing the risk linearly, while the model reduces with a concave curve.
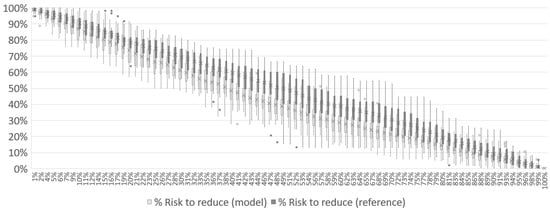
Figure 19.
Total risk reduction associated with the disaster over the course of Case 3 mission with 1 UAV.
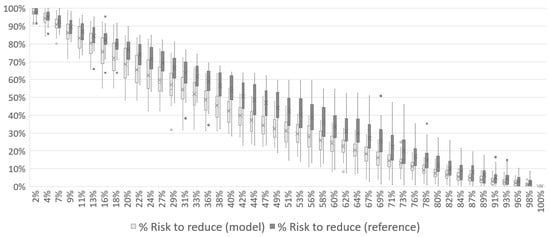
Figure 20.
Total risk reduction associated with the disaster over the course of Case 3 mission with 2 UAVs.
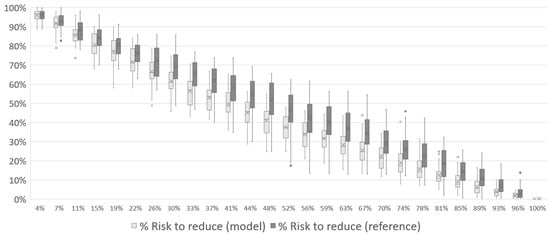
Figure 21.
Total risk reduction associated with the disaster over the course of Case 3 mission with 3 UAVs.
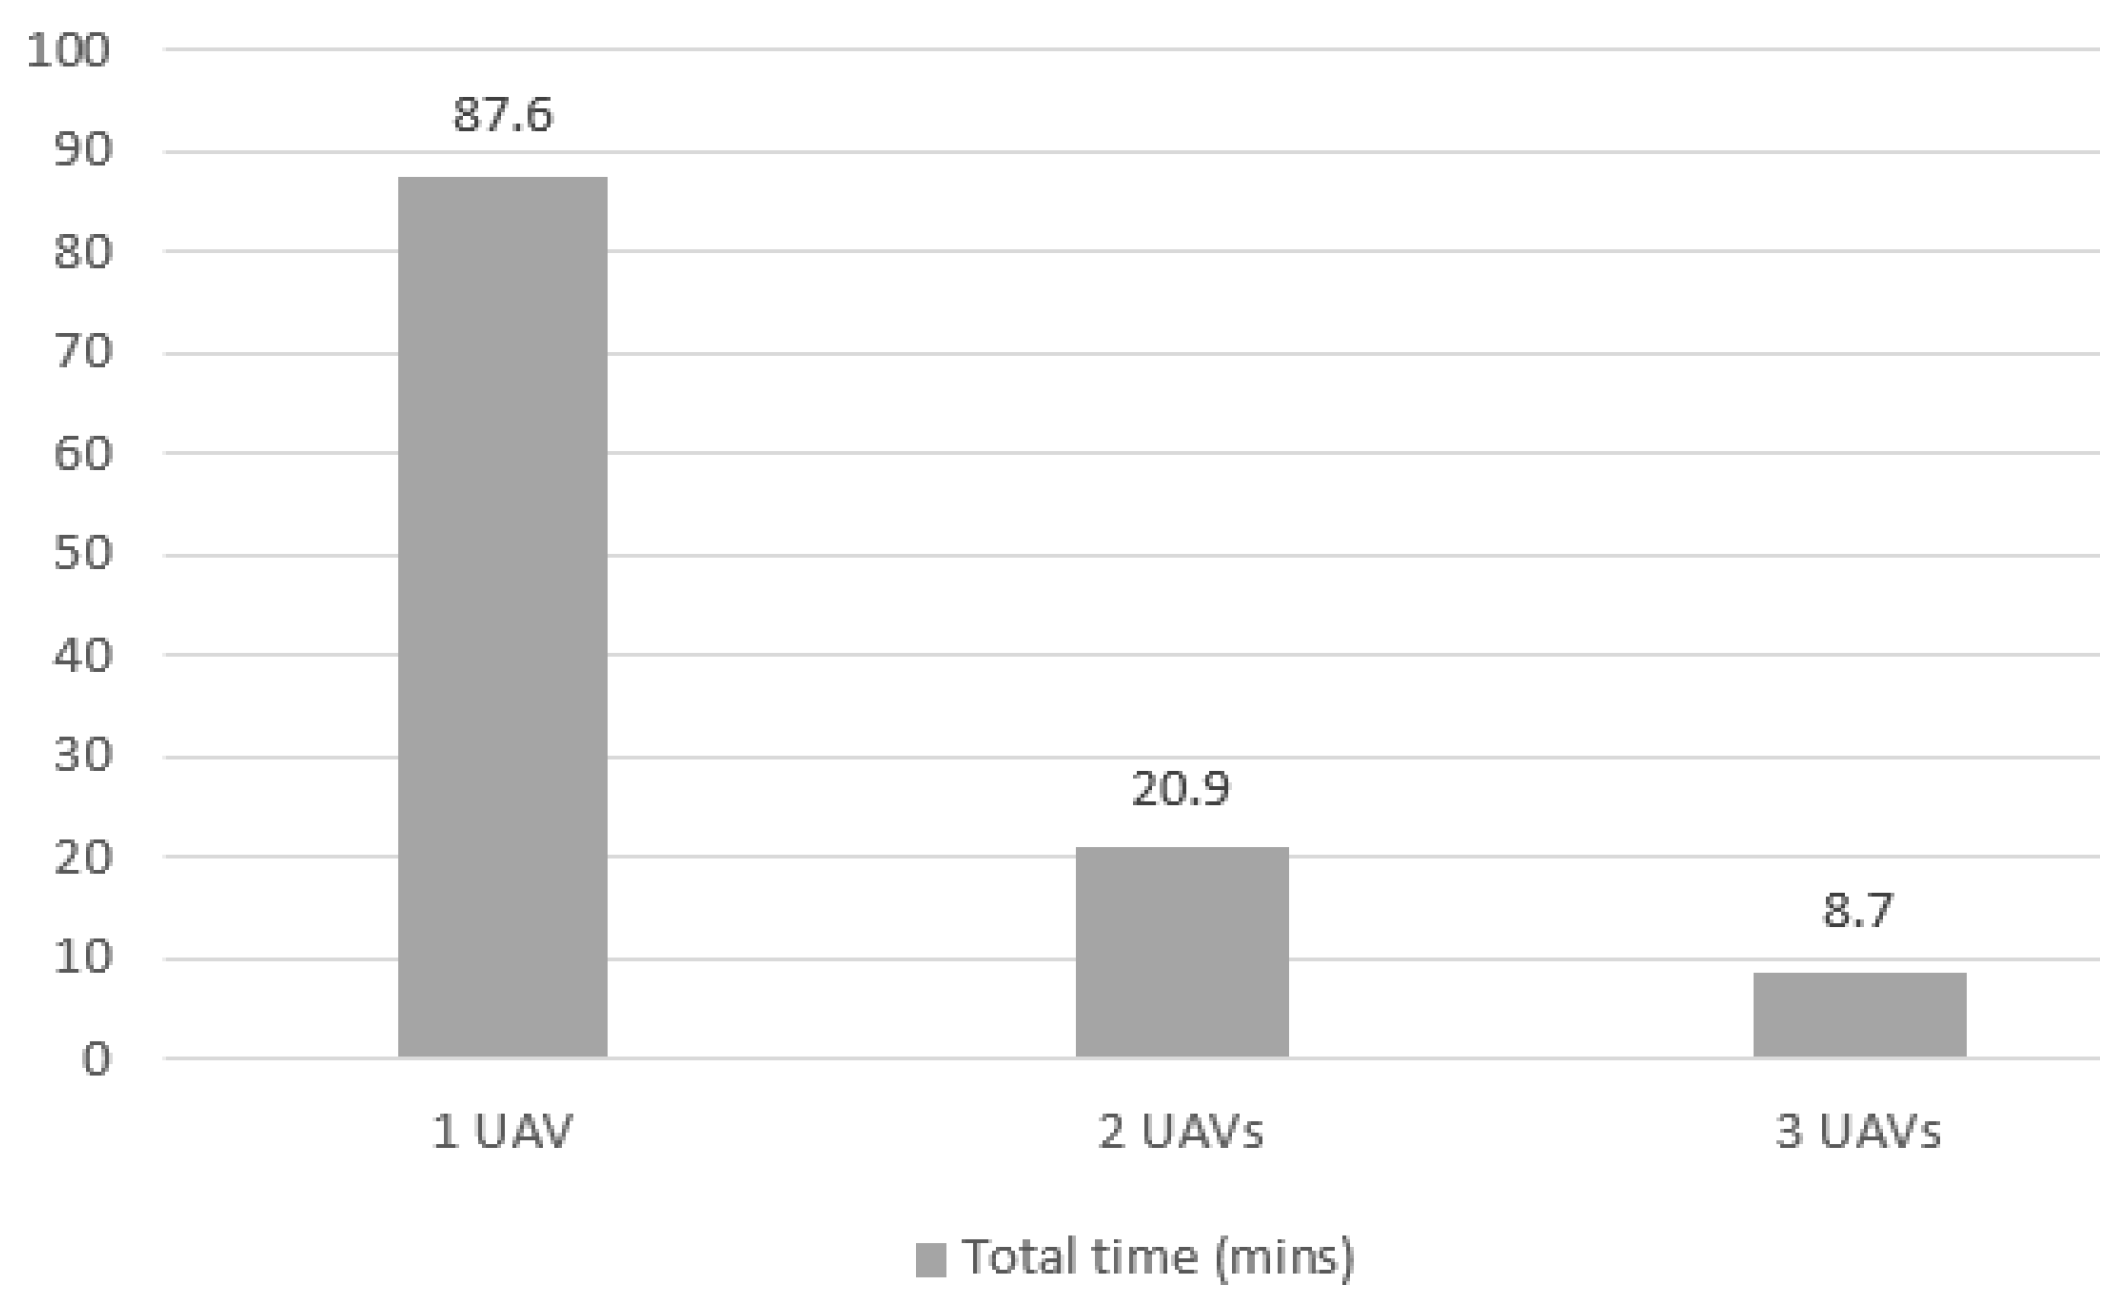
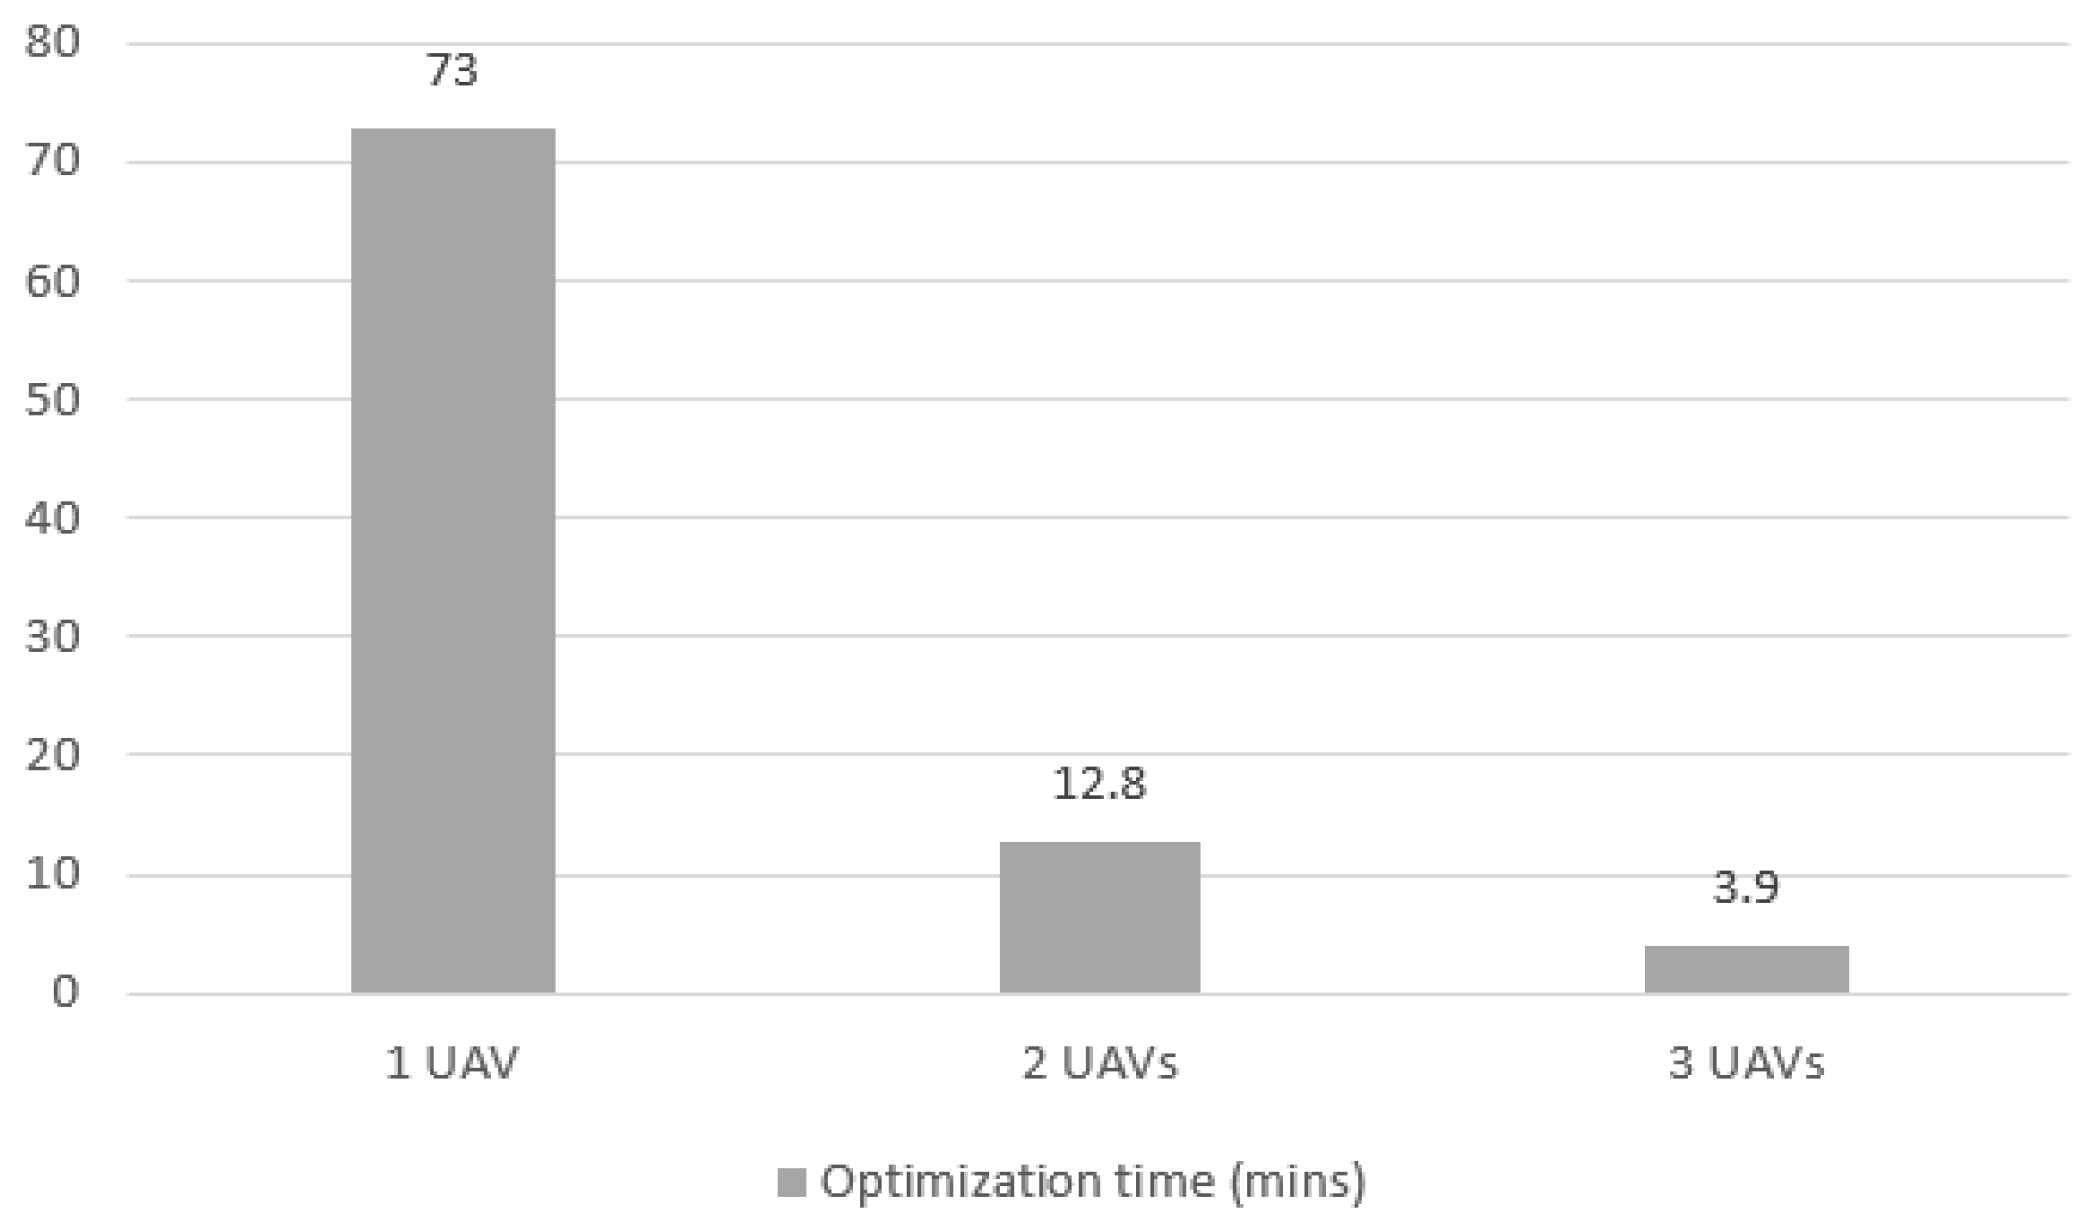
Figure 22 shows the sum of optimization and travel times. Since the optimization time is much higher for 1 UAV, the total mission time in this case is also longer. The mission lasts 90 min, while it lasts only 20 min with 2 UAVs and 9 min with 3 UAVs.
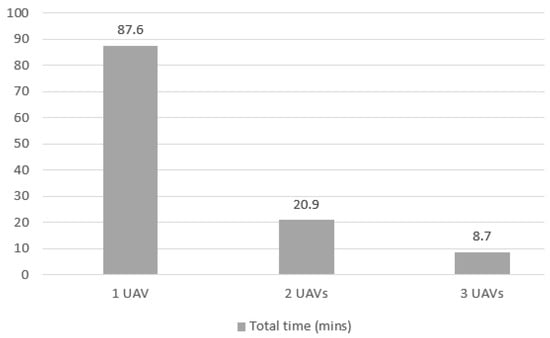
Figure 22.
Total elapsed time for Case 3 mission with 1, 2 and 3 UAVs.
In Figure 23, the evolution of travel time can be seen. As in other cases, the reduction in time as the number of UAVs increases is proportional to the number of UAVs. For 1 UAV, the travel time is 78.0% less than the optimization time, reinforcing the indication that some measures to reduce optimization time in large areas are necessary.
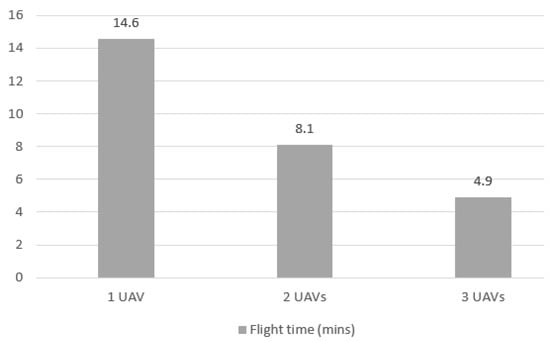
Figure 23.
Flight elapsed time for Case 3 mission with 1, 2 and 3 UAVs.
Figure 24 shows the evolution of optimization time for Case 3 in all UAV number scenarios. When using only 1 UAV, the time decreased from 73 min to 12.8 min with 2 UAVs and 3.9 min with 3 UAVs. The drops of 83.0% and 94.0%, respectively, represent greater improvements in time than in Cases 1 and 2 (as seen in Figure 12 and Figure 18), where the total mission area, and consequently the number of quadrants, was smaller. The significantly higher time for 1 UAV occurs due to the number of variables increasing exponentially, indicating that for the solution to be viable in larger areas, more processing capacity or a greater number of UAVs is needed. Thus, the problem can be broken down into smaller ones, and the optimizer can manage a smaller number of variables.
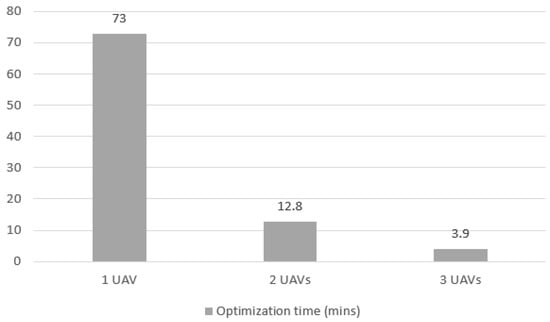
Figure 24.
Optimization elapsed time for Case 3 mission with 1, 2 and 3 UAVs.
4.4. Comparison Among the Results of the 3 Cases and Among Related Works
The three cases have distinct characteristics related to the disaster area, number of victims, and consequently, the number of victims per square kilometer. Therefore, comparing the results allows for an understanding of whether the performance remains constant under different conditions. Table 3 compares the basic parameters such as number of victims, area, number of quadrants and victims per square kilometer, but also the results of risk reduction by half the mission and time elapsed for the total mission run.

Table 3.
Comparison between parameters and results for all scenarios in all three cases.
Case 1 had 1509 victims per square kilometer, placing it intermediate among the three cases. Case 2 is the smallest with 788 victims per square kilometer, and Case 3 is the largest with 2251 victims per square kilometer. Despite the difference in the concentration of victims and the area of each case, the risk reduced at 50.0% of the mission is above 62% throughout all cases and scenarios, reaching values higher than 70% in some cases.
Regarding the number of quadrants, it is clear that all three cases follow the same pattern of reducing all times as the number of UAVs increases, and that the optimization time gain is greater than the flight time.
Table 4 presents a proportion between the rows of Table 3. The cell in the first column with values and the first row with values, for example, is the direct division of the number of quadrants of Case 2 over the number of quadrants of Case 1 (as indicated by the first column of the table), in this case, it is 73.5%. The same logic applies to all other cells with values. Through this logic it can be seen that, although in Case 2 there are 73.5% as many quadrants as in Case 1, all times had a lower proportion, reaching a maximum of 49.6% in the optimization time with 1 UAV and a minimum of 29.4% in the same optimization time, but with 3 UAVs. This reinforces what has already been seen in the individual result sections for each case when the time reduced in a greater proportion than the increase in the number of UAVs indicated. As the number of quadrants increases, the number of variables for optimization increases by a greater proportion, and therefore, the time also increases. This result indicates that the larger the problem, the less viable the solution becomes. However, the table line regarding the proportion between Case 1 and Case 3 shows the evolution of time performance when increasing the number of UAVs. With only 1 UAV, the time for Case 1 is 23.4% of that for Case 3, while the number of quadrants is 60.5%, meaning there is an inefficiency of 37.1%. As the number of UAVs increases, the difference decreases, reaching a negative value when 3 UAVs are used (62.6% of the total time against the same 60.5% of the number of quadrants). As the size of the scenario area grows, increasing the number of UAVs may be necessary to avoid an increase in time.

Table 4.
Comparison between parameters and results for all scenarios in all three cases.
The applied tests demonstrate that the approach of identifying regions with higher risk allows the POMDP to prioritize them, directing the UAV to first locate victims in situations of greater risk. Up to a certain disaster area size, this occurs without significantly increasing the total mission time. In other words, the remaining victims would still be found within a time window similar to existing models.
As the problem area increases, the runtime exponentially increases due to the exponential growth in optimization complexity. The higher number of quadrants generates more variables to consider during the decision-making process of the route to be followed. The increase in time has the potential to reduce the survival chances of victims, prompting the need to mitigate it. In this case, more UAVs were added to execute the mission in parallel. The low dependence on human supervision makes this feasible, with minimal obstacles beyond logistical costs. Experiments show that as more UAVs are added, the mission time decreases at a greater proportion than the number of additional agents, resulting in larger problem areas having similar times to smaller areas. For instance, Case 3, with an area of 1.33 km2, took a total time of 87.1 min with 1 UAV, a greater proportion than Case 2 with an area of 0.59 km2 and a total time of 9.9 min with the same 1 UAV. When we increased Case 3 to 3 UAVs, the total time dropped to 8.8 min.
The best way to compare with other works is with [16], as they also applied the solution to Case 1. In that case, the main success metric is area coverage, where they achieved 100%, which was also attained in this study through its exhaustive iteration characteristic. In terms of time, Ref. [16] only measured the UAV dislocation time, which averaged 5.5 min compared to 8.8 min for the same parameters in this study, i.e., 37.5% less. The greatest advantage of this work compared to [16] is the independence from human intervention during the process, which was precisely our goal. Ref. [16] relies on humans for 100% of the steps in their solution, while the solution presented in this study depends on humans for 17.6% of its steps. The lower human dependency facilitates the use of multiple UAVs, which can reduce the time gap between this work and related works or even become a faster solution.
5. Conclusions
Mapping the location of victims during a disaster in a short time is crucial to increasing their chances of survival, and this task can be facilitated using UAVs. The objective of this research was to create a solution that allows multiple UAVs to fly through a recent disaster area and effectively search for victims without dependency from humans.
This study proposes a model that combines route optimization and image classification techniques for UAV use in disaster victim search scenarios and was able to reduce more than 62% of the risk to the victims by the halfway point of the mission. This approach—reducing the risk associated with the scenario at the beginning of the mission—was not proposed by any other solution and is a contribution of this study. The results show that prioritization works without significantly affecting the remaining victims.
Additionally, it is important to note that using an image classifier allows the UAV complete autonomy in its mission, reaching another of this study’s goals. The image classifier was also observed to increase the mission time and reduce accuracy, which can be mitigated by adding more UAVs and repeating the search throughout the scenario, respectively.
In the current solution, it is necessary to allocate the initial risk in a spreadsheet (a specialist’s task), and then execute an R script (R studio version 1.1.456) containing the scenario preparation steps and the optimizer. Further details can be seen in the Section 3.6 and in Supplementary Materials.
There are limitations to this study regarding the complexity of the proposed solution. Some simplifications were made to allow a simpler solution, such as the lack of variation of parameters that can affect the mission, zero communication between UAVs, and the presence of other variables beyond images to find victims. Adding some or all of these complexities to the solution can improve its effectiveness for use in a search and rescue mission.
These limitations could be explored in future work. The risk allocation by a specialist could be replaced by an automatic risk allocation model. An automatic allocation could be done by assigning equal values to the entire region or to similar blocks, but this would mitigate the risk at the beginning of the mission to a much lesser extent than observed when using a specialist. A change that would help maintain the benefit and eliminate the need for human involvement would be to train an image classification model with classes representing the associated risks depending on the type of structure present at the disaster site before the incident. This way, satellite images from before the disaster could be used for the initial risk allocation.
Another topic to explore is the variation of other parameters related to the scenario mentioned in the Section 3.4, especially those with the potential to negatively affect the solution results, such as variations in weather during the mission and the intermittency and poor quality of communication signals between UAVs, processing units, and rescue teams.
The addition of other variables to decision-making is also something to be explored. This dissertation explores the benefit of using images in the search for victims in isolation, but the accuracy of victim identification can be further improved by using other variables in conjunction, such as signals from smartwatches, cell phones, locators, and even rescue requests.
Finally, when more than one UAV was used in this dissertation, the scenario was divided into smaller scenarios which were treated as separate problems. A future study could explore information collaboration among UAVs, meaning that as each agent advances in the scenario, it shares its findings with all other agents. This increases the solution’s complexity and dependence on data transmission signals but enhances learning about the scenario, allowing for greater optimization accuracy.
Supplementary Materials
The following supporting information can be downloaded at: https://www.mdpi.com/article/10.3390/logistics8040113/s1.
Author Contributions
Conceptualization, P.G.V.; Methodology, P.G.V.; Validation, P.G.V.; Formal analysis, P.G.V.; Data curation, P.G.V.; Writing—original draft, P.G.V.; Writing—review & editing, P.G.V. and P.S.C.; Supervision, P.S.C. All authors have read and agreed to the published version of the manuscript.
Funding
This research was funded by Coordination for the Improvement of Higher Education Personnel-Brazil (CAPES)-Funding Code 001. (PROAP-Process No. 88881.639130/2021-01).
Data Availability Statement
The original contributions presented in the study are included in the article/Supplementary Materials. Further inquiries can be directed to the corresponding author/s. The data is simulated with the aid of Supplementary Materials.
Conflicts of Interest
The authors declare no conflicts of interest.
References
- Mavrouli, M.; Mavroulis, S.; Lekkas, E.; Tsakris, A. The Impact of Earthquakes on Public Health: A Narrative Review of Infectious Diseases in the Post-Disaster Period Aiming to Disaster Risk Reduction. Microorganisms 2023, 11, 419. [Google Scholar] [CrossRef] [PubMed]
- Buszta, J.; Wójcik, K.; Santos, C.A.G.; Kozioł, K.; Maciuk, K. Historical Analysis and Prediction of the Magnitude and Scale of Natural Disasters Globally. Resources 2023, 12, 106. [Google Scholar] [CrossRef]
- Suzuki, Y. Disaster-Relief Logistics with Limited Fuel Supply. J. Oper. Res. Soc. 2012, 33, 120–135. [Google Scholar] [CrossRef]
- Almeida, L.S.; Goerlandt, F.; Pelot, R. Trends and Gaps in the Literature of Road Network Repair and Restoration in the Context of Disaster Response Operations. Saf. Sci. 2022, 84, 101398. [Google Scholar] [CrossRef]
- Rabta, B.; Wankmüller, C.; Reiner, G. A Drone Fleet Model for Last-mile Distribution in Disaster Relief Operations. Int. J. Disaster Risk Reduct. 2018, 28, 107–117. [Google Scholar] [CrossRef]
- Brasil Tem 1 Milhão Vivendo Perto de Barragens de Risco. 29 April 2022. Available online: https://www.brasildefato.com.br/2022/04/29/brasil-tem-1-milhao-de-pessoas-vivendo-perto-de-barragens-de-risco#:~:text=Quase%201%20milh%C3%A3o%20de%20pessoas,Seguran%C3%A7a%20de%20Barragens%20(SNISB) (accessed on 28 October 2024).
- Brasil Tem Mais de 27 Mil Áreas de Risco de Desastres. Available online: https://www.correiobraziliense.com.br/brasil/2022/05/5011789-brasil-tem-mais-de-27-mil-areas-de-risco-de-desastres.html (accessed on 17 May 2024).
- Croucamp, D. Natural Disaster Hotspots: A Global Risk Analysis [Book Review]. Disaster Prev. Manag. 2005, 20, 1–5. [Google Scholar]
- Roberts, M.; Apker, T.; Johnson, B.; Auslander, B.; Wellman, B.; Aha, D.W. Coordinating Robot Teams for Disaster Relief. In Proceedings of the Association for the Advancement of Artificial Intelligence (AAAI) Spring Symposium, Hollywood, FL, USA, 18–20 May 2015; Stanford University: Stanford, CA, USA, 2015; pp. 123–128. [Google Scholar]
- Oruc, B.E.; Kara, B.Y. Post-disaster Assessment Routing Problem. Transp. Res. Part B Methodol. 2018, 116, 23–38. [Google Scholar] [CrossRef]
- Kovács, G.; Sigala, I.F. Lessons Learned from Humanitarian Logistics to Manage Supply Chain Disruptions. J. Supply Chain Manag. 2021, 57, 34–45. [Google Scholar] [CrossRef]
- Quispe, M.F.C.; Couto, A.S.; Junior, I.d.B.; Cunha, L.R.A.; Siqueira, R.M.; Yoshizaki, H.T.Y. Humanitarian Logistics Prioritization Models: A Systematic Literature Review. Logistics 2020, 8, 60. [Google Scholar] [CrossRef]
- Tatham, P.; Stadler, F.; Murray, A.; Shaban, R.Z. Flying Maggots: A Smart Logistic Solution to an Enduring Medical Challenge. J. Humanit. Logist. Supply Chain Manag. 2017, 7, 123–138. [Google Scholar] [CrossRef]
- Hachiya, D.; Mas, E.; Koshimura, S. A Reinforcement Learning Model of Multiple UAVs for Transporting Emergency Relief Supplies. Appl. Sci. 2022, 12, 10427. [Google Scholar] [CrossRef]
- Gunaratne, K.; Thibbotuwawa, A.; Vasegaard, A.E.; Nielsen, P.; Perera, H.N. Unmanned Aerial Vehicle Adaptation to Facilitate Healthcare Supply Chains in Low-income Countries. Drones 2022, 6, 321. [Google Scholar] [CrossRef]
- Bittencourt Bravo, R.Z.; Leiras, A.; Oliveira, F.L.C. The Use of UAVs in Humanitarian Relief: An Application of POMDP-Based Methodology for Finding Victims. Prod. Oper. Manag. 2019, 28, 453–468. [Google Scholar] [CrossRef]
- Li, Y.; Liu, M.; Jiang, D. Application of Unmanned Aerial Vehicles in Logistics: A Literature Review. Sustainability 2022, 14, 4473. [Google Scholar] [CrossRef]
- Kamat, A.; Shanker, S.; Barve, A.; Muduli, K.; Mangla, S.K.; Luthra, S. Uncovering Interrelationships Between Barriers to Unmanned Aerial Vehicles in Humanitarian Logistics. Oper. Manag. Res. 2022, 15, 98–112. [Google Scholar] [CrossRef]
- Chappelle, W.; Goodman, T.; Reardon, L.E.; Thompson, W.W. An Analysis of Post-traumatic Stress Symptoms in United States Air Force Drone Operators. J. Anxiety Disord. 2014, 28, 480–487. [Google Scholar] [CrossRef]
- Sun, J.; Yuan, G.; Song, L.; Zhang, H. Unmanned Aerial Vehicles (UAVs) in Landslide Investigation and Monitoring: A Review. Drones 2024, 8, 30. [Google Scholar] [CrossRef]
- Xie, Y.; Zhan, N.; Zhu, J.; Xu, B.; Chen, H.; Mao, W.; Luo, X.J.; Hu, Y. Landslide Extraction from Aerial Imagery Considering Context Association Characteristics. Int. J. Appl. Earth Obs. Geoinf. 2024, 131, 103950. [Google Scholar] [CrossRef]
- Shikova, N. An Unmanned Aerial Vehicle (UAV) System for Disaster and Crisis Management in Smart Cities. Electronics 2023, 12, 1051. [Google Scholar] [CrossRef]
- Reyes-Rubiano, L.S.; Voegl, J.; Hirsch, P. An Online Algorithm for Routing an Unmanned Aerial Vehicle for Road Network Exploration Operations After Disasters Under Different Refueling Strategies. Algorithms 2022, 15, 217. [Google Scholar] [CrossRef]
- Waharte, S.; Trigoni, N. Supporting Search and Rescue Operations with UAVs. In Proceedings of the 2010 International Conference on Emerging Security Technologies, Canterbury, UK, 6–7 September 2010; pp. 142–147. [Google Scholar]
- Khandani, H.; Moradi, H.; Panah, J.Y. A Real-Time Coverage and Tracking Algorithm for UAVs Based on Potential Field. In Proceedings of the 2014 Second RSI/ISM International Conference on Robotics and Mechatronics (ICRoM), Tehran, Iran, 15–17 October 2014; pp. 700–705. [Google Scholar]
- Sánchez-García, J.; Gutiérrez Reina, D.; Toral, S. A Distributed PSO-Based Exploration Algorithm for a UAV Network Assisting a Disaster Scenario. Future Gener. Comput. Syst. 2019, 90, 90–105. [Google Scholar] [CrossRef]
- Murtaza, G.; Kanhere, S.S.; Jha, S. Priority-based Coverage Path Planning for Aerial Wireless Sensor Networks. In Proceedings of the 2013 IEEE Eighth International Conference on Intelligent Sensors, Sensor Networks and Information Processing, Melbourne, VIC, Australia, 2–5 April 2013; pp. 219–224. [Google Scholar]
- Hayat, S.; Yanmaz, E.; Bettstetter, C. Multi-UAV Path Planning for Search and Rescue Missions with Human Body Detection. IEEE Trans. Aerosp. Electron. Syst. 2017, 53, 1561–1572. [Google Scholar] [CrossRef]
- Shafiq, M.A.; Wang, Z.; Amin, A.; Hegazy, T.; Deriche, M.; AlRegib, G. Detection of Salt-Dome Boundary Surfaces in Migrated Seismic Volumes Using Gradient of Textures; Society of Exploration Geophysicists: Houston, TX, USA, 2015. [Google Scholar]
- Baker, C.; Ramchurn, G.; Teacy, L.; Jennings, N.R. Planning Search and Rescue Missions for UAV Teams; IOS Press: Amsterdam, The Netherlands, 2016. [Google Scholar]
- Recchiuto, C.T.; Nattero, C.; Sgorbissa, A.; Zaccaria, R. Coverage Algorithms for Search and Rescue with UAV Drones—Abstract. In Proceedings of the XIII AIIA Symposium on Artificial Intelligence, AIRO Workshop, Pisa, Italy, 10–12 December 2014; Volume 12. [Google Scholar]
- Bryant, G. An Autonomous Multi-uav System for Avalanche Search. Master’s Thesis, Norwegian University of Science and Technology, Trondheim, Norway, 2019. [Google Scholar]
- Sandino, J.; Vanegas, F.; Maire, F.; Caccetta, P.; Sanderson, C.; Gonzalez, F. UAV Framework for Autonomous Onboard Navigation and People/Object Detection in Cluttered Indoor Environments. Remote Sens. 2020, 12, 3386. [Google Scholar] [CrossRef]
- Monahan, G.E. State of the Art—A Survey of Partially Observable Markov Decision Processes: Theory, Models, and Algorithms. Manag. Sci. 1982, 28, 1–16. [Google Scholar] [CrossRef]
- Cassandra, A.R.; Kaelbling, L.P.; Littman, M.L. Acting Optimally in Partially Observable Stochastic Domains; American Association for Artificial Intelligence: Washington, DC, USA, 1994. [Google Scholar]
- Littman, M. Inducing Partially Observable Markov Decision Processes. In Proceedings of the Eleventh International Conference on Grammatical Inference, PMLR 21, College Park, MD, USA, 5–8 September 2012. [Google Scholar]
- Implementation of Victims Detection Framework on Post Disaster Scenario. Available online: https://ieeexplore.ieee.org/document/8615503 (accessed on 24 May 2024).
- Jmour, N.; Zayen, S.; Abdelkrim, A. Convolutional Neural Networks for Image Classification. In Proceedings of the 2018 International Conference on Advanced Systems and Electric Technologies (IC_ASET), Hammamet, Tunisia, 22–25 March 2018. [Google Scholar] [CrossRef]
- Pineau, J.; Gordon, G.; Thrun, S. Point-Based Value Iteration: An Anytime Algorithm for POMDPs; Morgan Kaufmann Publishers Inc.: San Francisco, CA, USA, 2003. [Google Scholar]
- Inmet Confirma Tornado Em Xanxerê, No Oeste Catarinense. Available online: https://g1.globo.com/sc/santa-catarina/noticia/2015/04/inmet-confirma-tornado-em-xanxere-no-oeste-catarinense.html (accessed on 28 October 2024).
- Defesa Civil Anuncia Reconstrução de 102 Casas Atingidas Por Tornados. Available online: https://g1.globo.com/sc/santa-catarina/noticia/2015/05/defesa-civil-anuncia-reconstrucao-de-102-casas-atingidas-por-tornados.html (accessed on 28 October 2024).
- Conflict Sensitivity Resource Facility South Sudan. Available online: https://www.csrf-southsudan.org/repository/ (accessed on 28 October 2024).
- Um passado Que Se Repete: Acompanhe O Histórico De Enchentes Em Petrópolis. Available online: https://soupetropolis.com/2022/02/22/um-passado-que-se-repete-historico-de-enchentes-em-petropolis-revela-urgencia-na-adocao-de-providencias/ (accessed on 28 October 2024).
- R: The R Project for Statistical Computing. Available online: https://www.r-project.org/ (accessed on 28 October 2024).
- Rstudio: Integrated Development Environment for, R. Available online: http://www.rstudio.com/ (accessed on 28 October 2024).
- Pomdp: Infrastructure for Partially Observable Markov Decision Processes (POMDP). Available online: https://cran.r-project.org/web/packages/pomdp/index.html (accessed on 28 October 2024).
Disclaimer/Publisher’s Note: The statements, opinions and data contained in all publications are solely those of the individual author(s) and contributor(s) and not of MDPI and/or the editor(s). MDPI and/or the editor(s) disclaim responsibility for any injury to people or property resulting from any ideas, methods, instructions or products referred to in the content. |
© 2024 by the authors. Licensee MDPI, Basel, Switzerland. This article is an open access article distributed under the terms and conditions of the Creative Commons Attribution (CC BY) license (https://creativecommons.org/licenses/by/4.0/).


