Article

Enhancing Logistical Performance in a Colombian Citrus Supply Chain Through Joint Decision Making: A Simulation Study

by
Juan Camilo Vargas-Muñoz
1,
Flor Angela Sanchez-Nitola
1,
Wilson Adarme Jaimes
1 and
Richard Rios
2,*
1
Grupo de Investigación SEPRO, Facultad de Ingeniería, Universidad Nacional de Colombia, Sede de Bogotá, Bogotá 111321, Colombia
2
Dirección Académica, Universidad Nacional de Colombia, Sede de La Paz, La Paz 202017, Colombia
*
Author to whom correspondence should be addressed.
Logistics 2025, 9(1), 30; https://doi.org/10.3390/logistics9010030
Submission received: 31 October 2024 / Revised: 31 January 2025 / Accepted: 7 February 2025 / Published: 13 February 2025

Abstract

:
Background: Agriculture plays a key role in Colombia’s economy. However, the sector faces persistent logistics, infrastructure, and supply chain integration challenges that hinder its development. While background studies have primarily addressed socio-economic needs and strategies to overcome these long-standing challenges, supply chain coordination remains critical for enhancing efficiency and sustainability. This study examined the impact of joint decision-making mechanisms on the logistical performance of a citrus food supply chain in Colombia. Methods: We employed agent-based modeling and simulation to evaluate three scenarios: single distribution (the current system referred to as Single-distribution), joint consolidation (Joint-consolidation), and joint consolidation–distribution (Joint-consolidation-distribution). Key performance indicators, including total logistics costs, Staytime, and load capacity utilization, were analyzed to evaluate the scenarios. Results: The joint-consolidation–distribution model emerged as the most effective, reducing logistical costs, improving load utilization, and increasing farmers’ revenues by 55.9% compared to individual sales. Consolidating harvest and distribution through a food hub improved efficiency by centralizing logistics and reducing the reliance on middlemen. Conclusions: Our findings provide actionable insights into how joint coordination enhances smallholder farmers’ economic outcomes, strengthens supply chain sustainability, and fosters community development. These results support policies promoting productive associations and local food hubs as key facilitators of market access and logistical efficiency in rural agricultural sectors.

1. Introduction

Agriculture plays a vital role in Colombia’s economy. The country’s diverse terrain and climate support the cultivation of a wide variety of crops and enable the production of two agricultural cycles per year—unlike the single cycle typical in many other countries [1,2]. In 2023, for instance, the Colombian agricultural sector was the fourth-largest economic sector, contributing 5.2% of GDP and 17.5% of total employment [2,3]. Despite this potential, the sector faces persistent historical challenges that have hindered its development, including inadequate tertiary roads, low productivity, and poor infrastructure and logistics [1,2,3,4,5]. Smallholder farmers dominate the agricultural sector, yet they often rely on intermediaries to reach consumers and struggle with poor integration into the agricultural value chain due to these longstanding challenges [1,2]. In response, public policies have been proposed to address these issues, focusing on improving infrastructure and logistics, enhancing coordination among supply chain stakeholders, and expanding market access and economic opportunities for small agricultural producers [2,4,6,7,8].
The Department of Cesar, located in Colombia’s northern region, relies on primary sector economic activities, with agriculture being its third most important sector [4]. According to the Rural Development Agency (ADR), key crops in the region include palm oil, rice, and citrus, cultivated across 607,567 hectares of land suitable for high-quality agricultural production [4]. Within Cesar is the municipality of Chimichagua, a territorial entity located within the ecoregion of the Zapatosa wetland complex, recognized as a RAMSAR territory due to its high biodiversity and multiple ecosystem services [4,5,9,10]. This municipality of Chimichagua is known for its highly productive soil, which supports key production processes for the Department’s economic development, and its important natural and water resources [4,9,10]. In 2019, 73.6% of the territory of Chimichagua was suitable for agricultural activities [4,9].
However, both Cesar and Chimichagua have faced historical challenges, including poor support from territorial entities, low social investment, and poor infrastructure, among others [1,4,5,7,10]. These historical challenges have then led to low indices of competitiveness and productivity, with the Department ranking 20th out of 26 departments in Colombia. In addition, they have led to a lack of associativity and low returns for small farmers in Chimichagua [10]. To address these challenges, national and regional authorities must implement supportive public policies and foster initiatives that empower small farmers through strengthened productive associations. These policies should aim to integrate small farmers as key players in agricultural value chains by fostering collaboration, improving their access to resources and markets, and enhancing their capacity to adopt sustainable productive practices. Heretofore, background studies have focused on the social-economics needs and strategies to overcome these longstanding challenges and strengthen the regional food supply chains [10]. Therefore, the core questions in this study were as follows: Does the implementation of joint decision-making mechanisms improve the logistical performance of the citrus supply chain in Chimichagua, Colombia? How does joint decision making affect the integration of smallholder farmers into the agricultural value chains? Does joint decision making improve smallholder farmers’ access to better opportunities and minimize the reliance on middlemen? What impact does joint decision making have on the economic viability and sustainability of the citrus supply chain in Colombia?
FSCs are systems that require complex management because of their multiple and interconnected stages and stakeholders, the limited shelf life of products, and the quality and safety standards of products, among other factors [11,12]. Supply chain coordination has recently emerged as a critical process to synchronize stakeholder activities, achieve mutual goals, and improve efficiency and sustainability [11,12,13,14]. Resource sharing is fundamental to defining coordination mechanisms and resilience strategies by pooling resources and capabilities to meet consumers’ needs [15]. Food hubs (FHs) have served as logistics platforms to coordinate stakeholders to meet consumer demands and ensure fair prices for both producers and buyers [16,17,18]. Thus, supply chain coordination and food hubs have improved producers’ income, supported rural development, and implemented short and sustainable food supply chains [16,17,18].
This study aimed to examine the value of coordinating collection and distribution to enhance logistical performance in a citrus FSC in Colombia. Our research evaluated whether joint decision-making mechanisms improve efficiency and financial performance. To achieve this, we simulated three scenarios: a first scenario, named Single-distribution, which represented the existing food supply system, relying on middlemen and single distribution; a second scenario, named Joint-consolidation, which simulated joint decision making among farmers to consolidate harvests at ASOCITRICOS; and the third, named Joint-consolidation–distribution, which simulated joint decision making among farmers and ASOCITRICOS to consolidate and distribute harvests without middlemen. ASOCITRICOS is a cooperative producer that operates a food hub. We used efficiency and financial key performance indicators (KPIs) to measure the impact of coordination on logistical performance. Our study examined a citrus supply chain with seasonal production, where both demand and supply are predictable. The study supply chain is multi-actor and multi-echelon constrained by capacity limitations. The findings of this study serve as a starting point to propose public policies and development plans aimed at strengthening local FSCs and producer cooperatives, enhancing the sustainability of these chains, and fostering the sustainable development of Chimichagua.

2. Literature Review

2.1. Supply Chain Coordination

Globalization has transformed FSCs into complex systems, enabling economies of scale, boosting revenues, and reducing costs [11,18,19]. However, these advancements have also led to significant negative social and environmental externalities [12,18,20]. For example, freight transportation—a crucial component of logistics—is a major contributor to environmental impacts such as air pollution and noise pollution [21,22]. Additionally, globalization has promoted competition among large wholesalers and supermarket chains, often at the expense of small farmers by replacing direct relationships with consumers [18]. In response, sustainability has become a crucial focus as policy maker, civil society, researchers, and businesses recognize the negative externalities of a globalized food system [14,16,18,20,21,22,23,24,25].
Coordination, defined as two or more stakeholders working together to achieve mutual objectives with greater benefits, can enhance supply chain efficiency, maximize overall profitability, and support the achievement of sustainability goals [11,12,13,14,26,27,28]. Previous studies on supply chain coordination have explored perspectives, conceptual models, mechanisms, and impacts, emphasizing that effective coordination can improve resource allocation, foster long-term partnerships, and enhance system resilience [12,13,14,26,29,30,31]. As the importance of supply chain coordination is well recognized, we conducted a selective and relevant background review to position our study, highlight similarities with previous studies, identify gaps in the field, and underscore our study’s contributions.

2.2. Coordination in Logistics and at Interfaces of the Supply Chain

Logistics involves transporting, storing, and handling products from raw materials to final consumption. It has been examined in the context of supply chain coordination, aiming at addressing the uncertainty and complexity of its operations [11,12,13,21,31,32,33,34,35,36]. For instance, Huiskonen and Pirttila [33] examined the lateral coordination in outsourcing relationship between logistics providers and manufacturers, utilizing mechanisms such as information sharing and integrating roles. Their findings highlighted that lateral coordination may enhance communication and operational coordination across organizational boundaries. Similarly, Stock et al. [32] introduced the concept of enterprise logistics, a framework designed to enhance the logistical performance of an organization within its supply chain structure. This framework utilized information technology as a coordination mechanism to integrate logistics activities, with improvements measured in terms of operational and financial performance. Logistical performance has been extensively used to assess coordination mechanisms, primarily through operational and financial key indicators such as distance traveled, vehicle utilization, and total system costs, among others [11,21,27,30,31,35,37,38].
Previous studies have examined the coordination in logistics interfaces such as production–distribution. Chikán et al. [39] provided guidelines for integrating production and distribution to reduce global costs, improve service levels, and enhance product value. Similarly, Pyke and Cohen [40] proposed a stochastic model to coordinate production–distribution in an integrated supply chain consisting of a single-product, three-location network: a factory, a finished goods stockpile, and a single retailer. They introduced a constrained optimization problem to define a joint consideration of cost (coordination mechanism) between production and distribution systems, aiming at meeting the demand of a market with frequent changeovers.

2.3. Joint Decision-Making Mechanisms

Mechanisms are tools or methods that address coordination problems [12,26,41]. Several studies have defined and classified coordination mechanisms, and examined their role in supply chains [11,12,13,14,26,41]. Joint decision making, a process in which stakeholders collaboratively coordinate decisions, is one of the most widely used mechanisms for resolving coordination conflicts in supply chains at the strategic, tactical, and operational levels [12,13,29]. It has been applied to various activities and interdependencies to solve issues, such as replenishment costs, batch sizes, collaborative planning, and joint cost considerations across activities (e.g., production–distribution or inventory–distribution) [12,13,40,42,43,44,45]. For instance, Haq and Kannan [43] utilized the joint consideration of costs to coordinate inventory and distribution in a multi-echelon supply chain. They proposed a mathematical model to select the best supplier. They used fuzzy and genetic algorithms to optimize the distribution and inventory costs of the supply chains. Similarly, Z. Lin et al. [46] proposed joint decision-making models under symmetrical information, asymmetrical information, and varying power structures to optimize decision making and profits for each stakeholder in a two-level fresh supply chain involving a supplier and an e-commerce enterprise. Table 1 presents some coordination problems where joint decision making has been applied across various supply chain activities and interfaces.
As shown in [12,13,47] and Table 1, several methodologies have been employed to implement joint decision making, including mathematical modeling, statistical modeling, simulations, and case studies. Among these approaches, mathematical modeling has been the most widely implemented, followed by case studies, particularly in agri-food supply chains. Often assuming a centralized perspective, mathematical approaches have employed optimization techniques such as linear programming or genetic algorithms to address specific, well-defined problems with clear constraints [11,12,13,27,30,40,42,43,44,45,46,47,48,49]. These problems included determining the optimal batch size, planning pricing strategies, and managing joint costs across functions or interfaces within the supply chain, among others. For example, Guo et al. [27] proposed a lateral collaboration model to integrate multiple companies and supply chain levels to achieve triple-bottom-line (3BL) sustainability goals. Their framework employed several mixed-integer linear programming (MILP) models to minimize total costs, reduce environmental impacts, and maximize social responsibility across various sustainable supply chains. While effective, mathematical approaches may struggle to adequately capture the decentralized decision making of stakeholders and the dynamic behavior of supply chains [12,13]. In this context, simulation approaches, designed to replicate the behavior of real-world processes or systems over time, remain underexamined for implementing coordination mechanisms [18,22]. Arshinder et al. [13], for instance, emphasized that simulation approaches provide a valuable means to view the overall coordination scenario, offering a holistic and dynamic perspective on supply chain processes and interactions.
Table 1. Literature review of joint decision making in various activities and interfaces of the supply chain.
AuthorsFunction/
Interface
Structure of Supply ChainCoordination ProblemMethodologyPerformance Measures
[21]Logistics and transportationHub-and-spoke supply chain structure with a single distributor and multiple retailersInefficient vehicle utilization caused by isolated decision making by individual retailers, leading to suboptimal vehicle usage and higher CO2 emissionsA simulation-based case study to analyze collaborative distribution scenarios in the logistics network Transport distances, CO2 emissions, truck utilization, and cost savings
[27]Network design Multi-echelon, involving suppliers, production sites, and distribution centersIntegrate multiple companies and supply chain levels to achieve the triple-bottom-line (3BL) sustainability goalsMixed-integer linear programming (MILP) model to optimize supply chain decisionsTotal costs, profitability, carbon emissions
[29]Coordination and collaborationTwo-echelon supply chains in high-tech industries: B2B supplier-customerLimited understanding in the literature regarding why and when companies prefer joint over individual supply chain decision making, despite its benefits.Case studies, semi-structured interviews conducted with supply chain managers of high-tech industries, conceptual framework of drivers and facilitatorsIdentification of key drivers and facilitators to enable joint decisions
[30]Resource planning, forecasting, inventory management, distributionMultiple echelon of the emergency care supply chainLack of centralized decision making between the healthcare services of the emergency care pathway to rationalize investments decisionsDiscrete Event Simulation (DES) combined with mathematical modeling and multi-objective optimization techniques Total number of incoming and served patients, response time, length of stay, door-to-doctor time, boarding time, total wait time
[31]Logistics and transportationRetail food supply chains (vendors, carriers, and retailers)Achieve cooperation among vendors to optimize delivery planning and reduce transport costs while balancing competitive and cooperative delivery regimesInteger linear programming (ILP) model to solve the vehicle routing (VR) problem, enabling multi-scenario sensitivity analysis for assessing the impact of cooperative delivery planningTotal cost, service level, vehicle utilization, delivery time-window constraints
[37]Inventory management, demand forecasting, quality controlTwo-echelon supply chain: buyer (retailer) and a vendor (manufacturer) systemAligning the objectives of the buyer and the vendor to minimize total costs while complying with emission regulations (cap-and-trade or tax)Mathematical modeling for minimizing total costs under environmental constraints, comparing decentralized and centralized decision makingTotal cost, carbon emissions, cost efficiency of coordination, environmental impact
[46]Order fulfillmentTwo-level structure: single supplier and a single e-commerce enterpriseAddress the supplier’s misreporting decision and its impact on fresh supply chain performance under conditions of information asymmetryStackelberg game models to analyze decision-making dynamics under various information transparency and power structuresFresh-keeping level, after-sales rate, supply chain profit, sensitivity to fresh-keeping technology
[50]Cybersecurity investment and coordinationTwo-echelon supply chain (a retailer and multiple suppliers)Externalities, such as free-riding and the prisoner’s dilemma, lead to poor security investments, causing inefficiencies and higher vulnerabilities in the network.A game theory model is used to analyze optimal cybersecurity investment strategies, considering third-party risk propagation and externalitiesExpected cost, investment efficiency, security level
[51]Procurement-distribution Three-tier supply chain structureAlign the objectives of diverse participants (suppliers, manufacturers, retailers) under supply disruption risks and capacity constraintsMathematical modeling and arithmetic simulation to address a dual-source procurement optimization problem, incorporating capacity constraintsExpected profit, revenue sharing coefficient, repurchase coefficient
[52]Logistics, transportation management Small and medium enterprises (SMEs) in the wine industry in Western Australia: wine producersSMEs face high transportation costs and a lack of resources, limiting their ability to engage in effective collaborative transportation without proper coordinationQualitative and exploratory approach using case studies and the Theory of Planned Behavior (TPB) to model SMEs’ intentions to engage in collaborative transportationIntentions to collaborate, cost reduction, and market expansion potential
[53]LogisticsA single online store and a third-party logistics (TPL) providerAchieve an optimal preservation effort level and address low preservation capacity in the online shopping supply chain, considering the allocation of cargo damage costs between stakeholders.Game-theoretic modeling and numerical simulation to analyze different centralized and decentralized decision-making modelsPreservation effort level, system profit, cost of damaged goods
Our studyLogisticsMulti-echelon food supply chain (small farmers, food hub, customers)Address the logistical challenges faced by a smallholder-dominated supply chain while supporting broader sustainability goalsA simulation-based case study combining agent-based modeling to describe the system and simulate coordination mechanisms, with a case study approach to estimate model parametersTotal distance traveled, average travel times, loading/unloading times, and Load Capacity Utilization, total distribution cost, revenue, and gross profit margin.
Previous studies have employed modeling and computer simulation to address logistics and supply chain management (SCM) challenges, such as last-mile delivery, parcel logistics, and the distribution of organic food under supply chain volatility [19,30,35,54,55,56,57]. For instance, Rosca et al. [54] employed agent-based modeling and simulation (ABMS) to evaluate parcel locker activities in urban last-mile deliveries. In their study, agents described each supply chain stakeholder as an autonomous entity with distinct actions, attributes, and decision-making rules. This approach enabled them to simulate and assess scenarios of daily delivery shifts. Additionally, discrete-event systems (DES) methods, such as colored Petri-nets and discrete-event simulation, have been employed in SCM to model processes or activities, aiming at capturing realistic features or modeling dynamic behavior of the system [30,57]. These methods have been instrumental in evaluating alternative supply chain designs, particularly in terms of logistical performance improvements.

2.4. Concluding Remarks

Rather than introducing new methods, this study explored the underutilized potential of simulation approaches in enhancing supply chain coordination. We applied agent-based modeling to simulate and evaluate two joint coordination mechanisms aimed at improving logistical performance in a Colombian citrus supply chain. These mechanisms fostered collaboration among farmers to consolidate harvests and channel them through a food hub, optimizing logistics processes to streamline the flow of goods from production to final distribution. This work addressed the logistical challenges faced by a smallholder-dominated supply chain while supporting broader sustainability goals, including fostering collaboration among stakeholders, improving working conditions, and promoting inclusive growth.

3. Materials and Methods

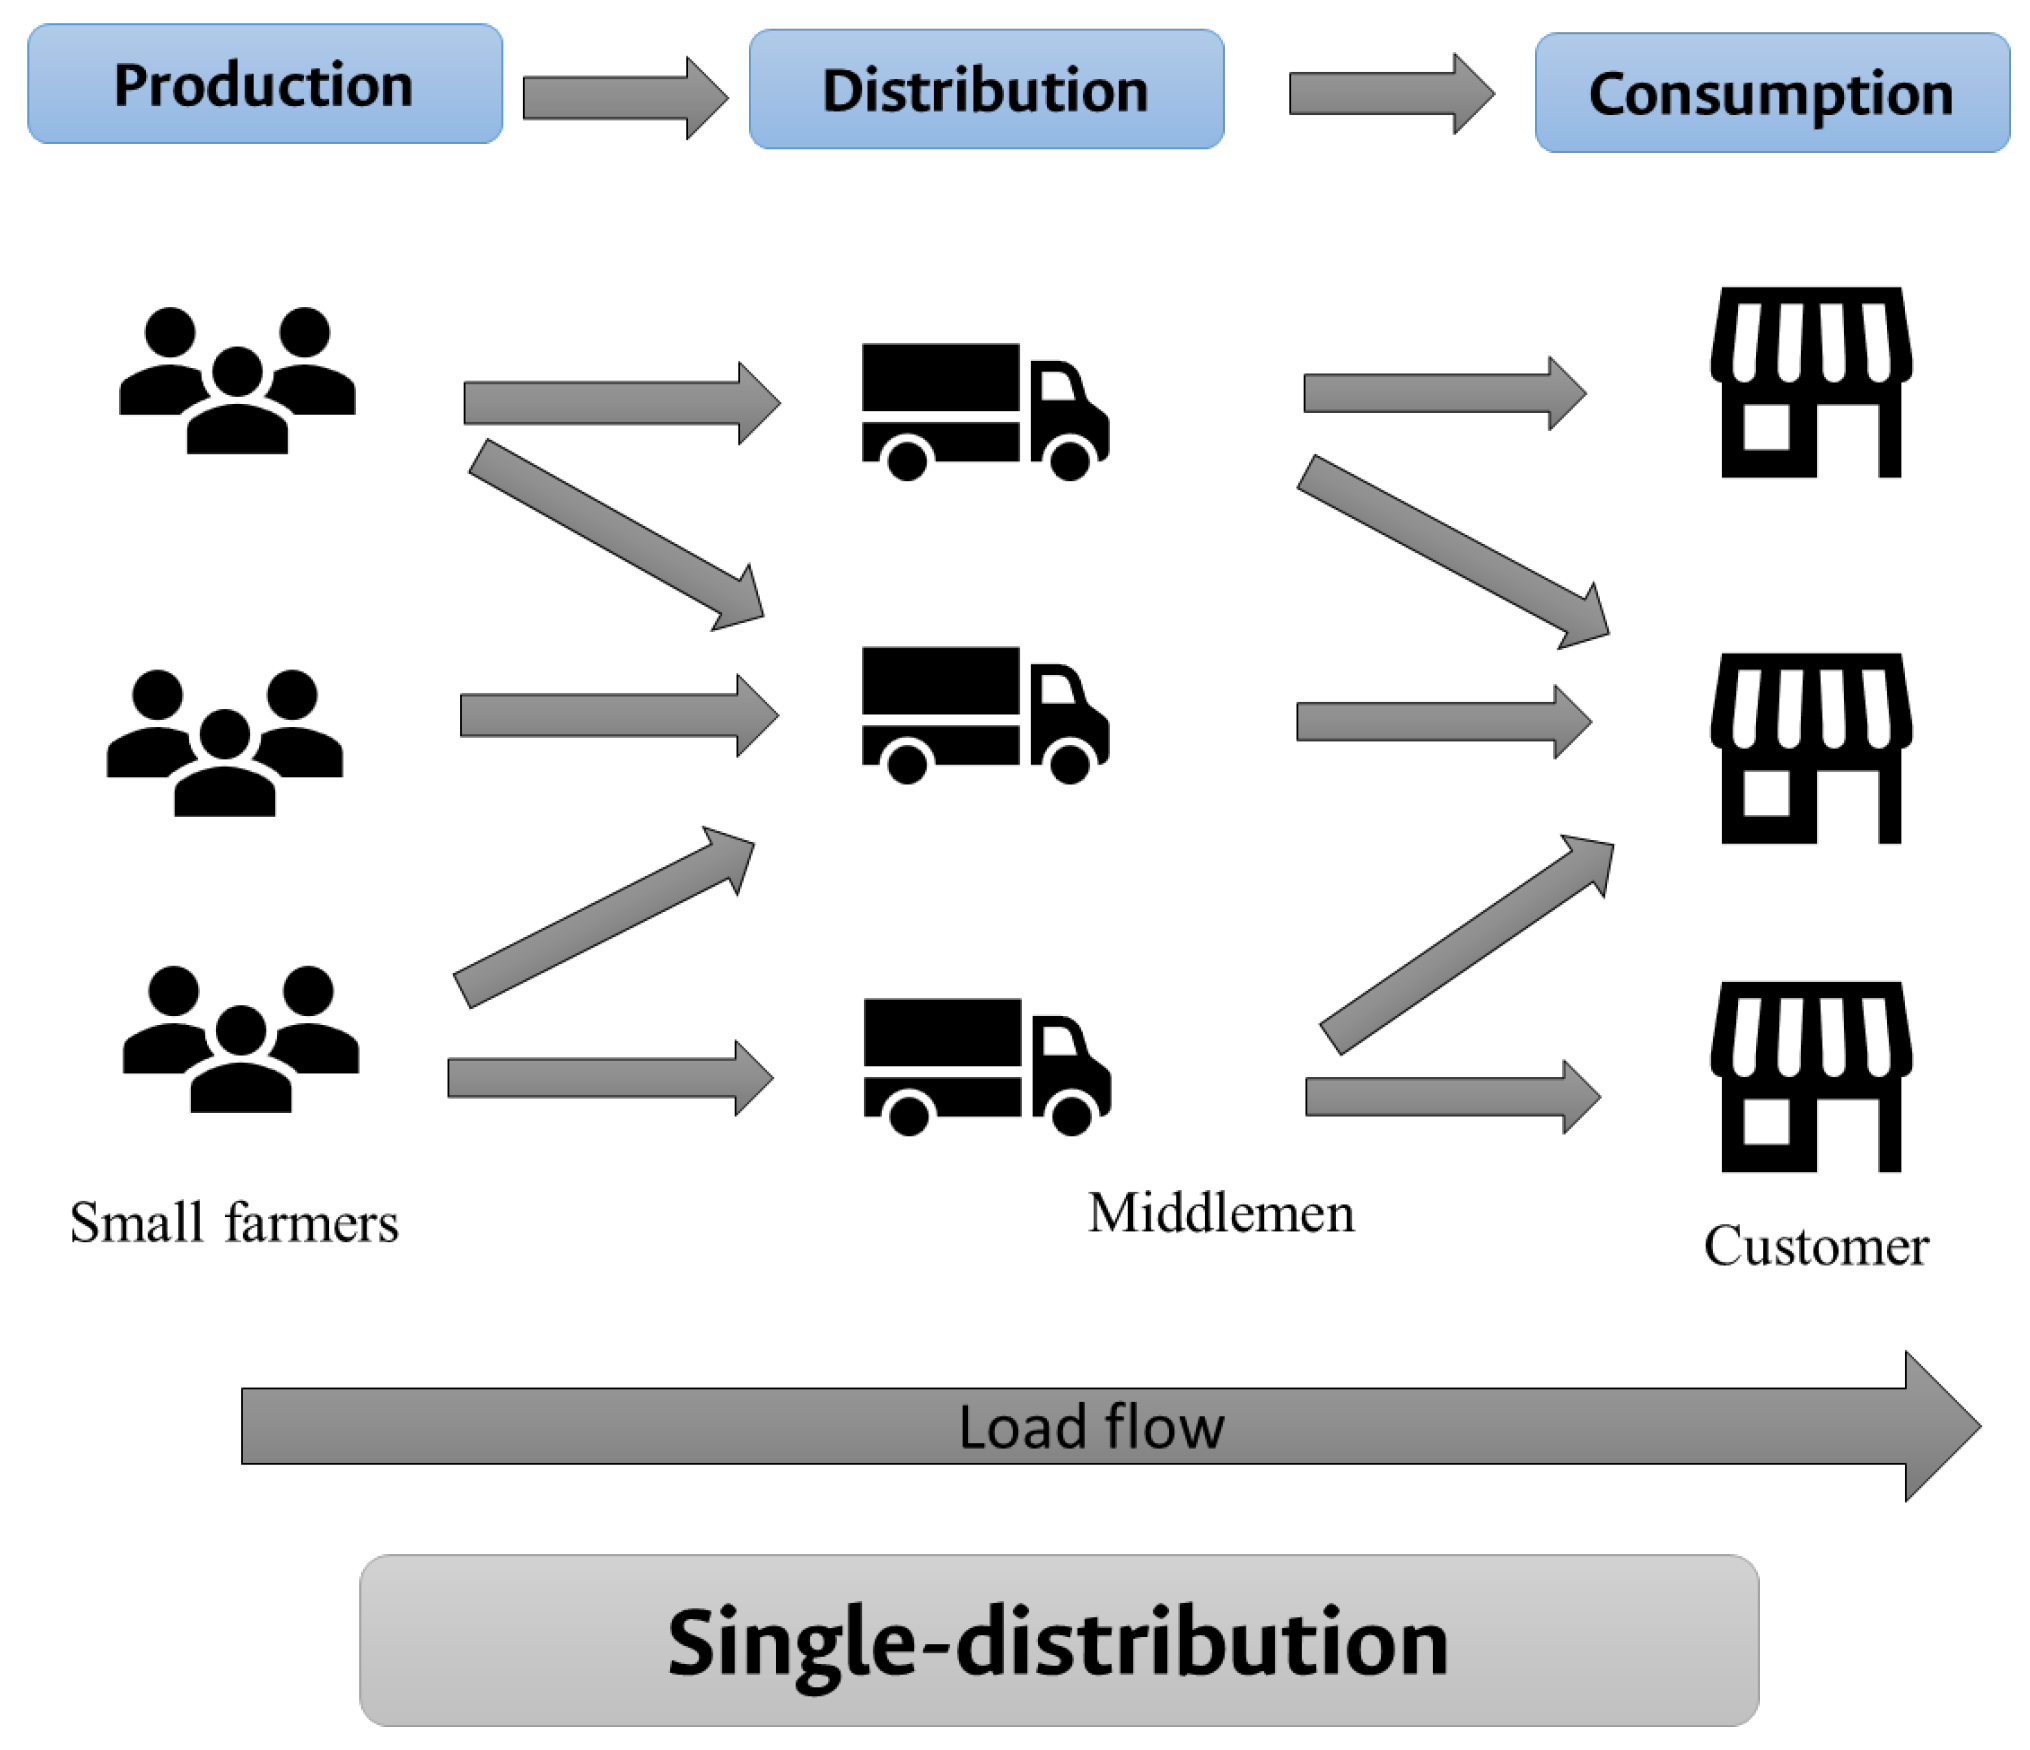
3.1. System Description and Base Scenario

The study’s supply chain focused on citrus fruits in Chimichagua, the municipality with the largest share of the Zapatosa Marsh Complex. This wetland and the Cesar River valley form a strategic ecoregion for Colombia [5,10,58,59,60]. The municipality of Chimichagua ranks as one of the most populated in the department of Cesar, with low social investment, low agricultural productivity, and few economic alternatives outside of extractive practices, leading to socio-ecological conflicts between competing interests: the conservation of the Zapatosa marsh complex and the community’s economic growth and food security [5,10,58]. The agricultural sector is the primary economic activity in the municipality of Chimichagua. The municipality has 60,000 hectares suitable for developing various crops, including citrus fruits, with 800 hectares dedicated to their cultivation [4,9].
Figure 1 illustrates the geographical layout of the citrus fruit supply chain in northern Colombia. The supply chain involves the following stakeholders: small farmers, ASOCITRICOS, middlemen, and customers. ASOCITRICOS is a citrus fruit producer association established in 2013 in Mandinguilla, a rural district within the municipality of Chimichagua. The association aims to organize producers, improve crop management and marketing, and gain recognition from public and private entities [9]. In 2022, it had 154 members distributed across the municipalities of Astrea and Chimichagua. It supplies markets in Colombia’s northern and central regions, including cities such as Barranquilla, Bogota, Cartagena, Santa Marta, and Valledupar. ASOCITRICOS owns a facility that can serve as a food hub, consolidating and marketing food products while serving as a meeting point between small farmers and wholesalers to secure fair prices. In this study, we included 21 farmers from ASOCITRICOS.
Farmers who sell directly to the cooperative can set their prices, with the cooperative managing sales at higher prices. However, delays in sales and payments by ASOCITRICOS often prompt farmers to prefer selling to middlemen, who offer immediate payment. As a result, small farmers usually market their harvests independently to middlemen, accepting lower prices for their goods. Middlemen manage the distribution process by purchasing products in bulk at the farm gates and then reselling them to retailers, food service providers, or other customers in urban centers.
Based on primary source information, two-axle trucks are used for collection, while three-axle trucks are used for distribution. Truck descriptions can be found in Resolution 4100 of 2004 from the Ministry of Transportation, Colombia [61]. Trucks are dedicated to delivering goods exclusively within their assigned city without making additional stops.
Figure 2 depicts the current logistics distribution, which relies on a decentralized, single-distribution system managed by middlemen. In this system, individual middlemen are fully liable for each load. The absence of collection trucks (2-axle trucks) reflects the independent sales process, with all distribution handled directly using 3-axle vehicles.

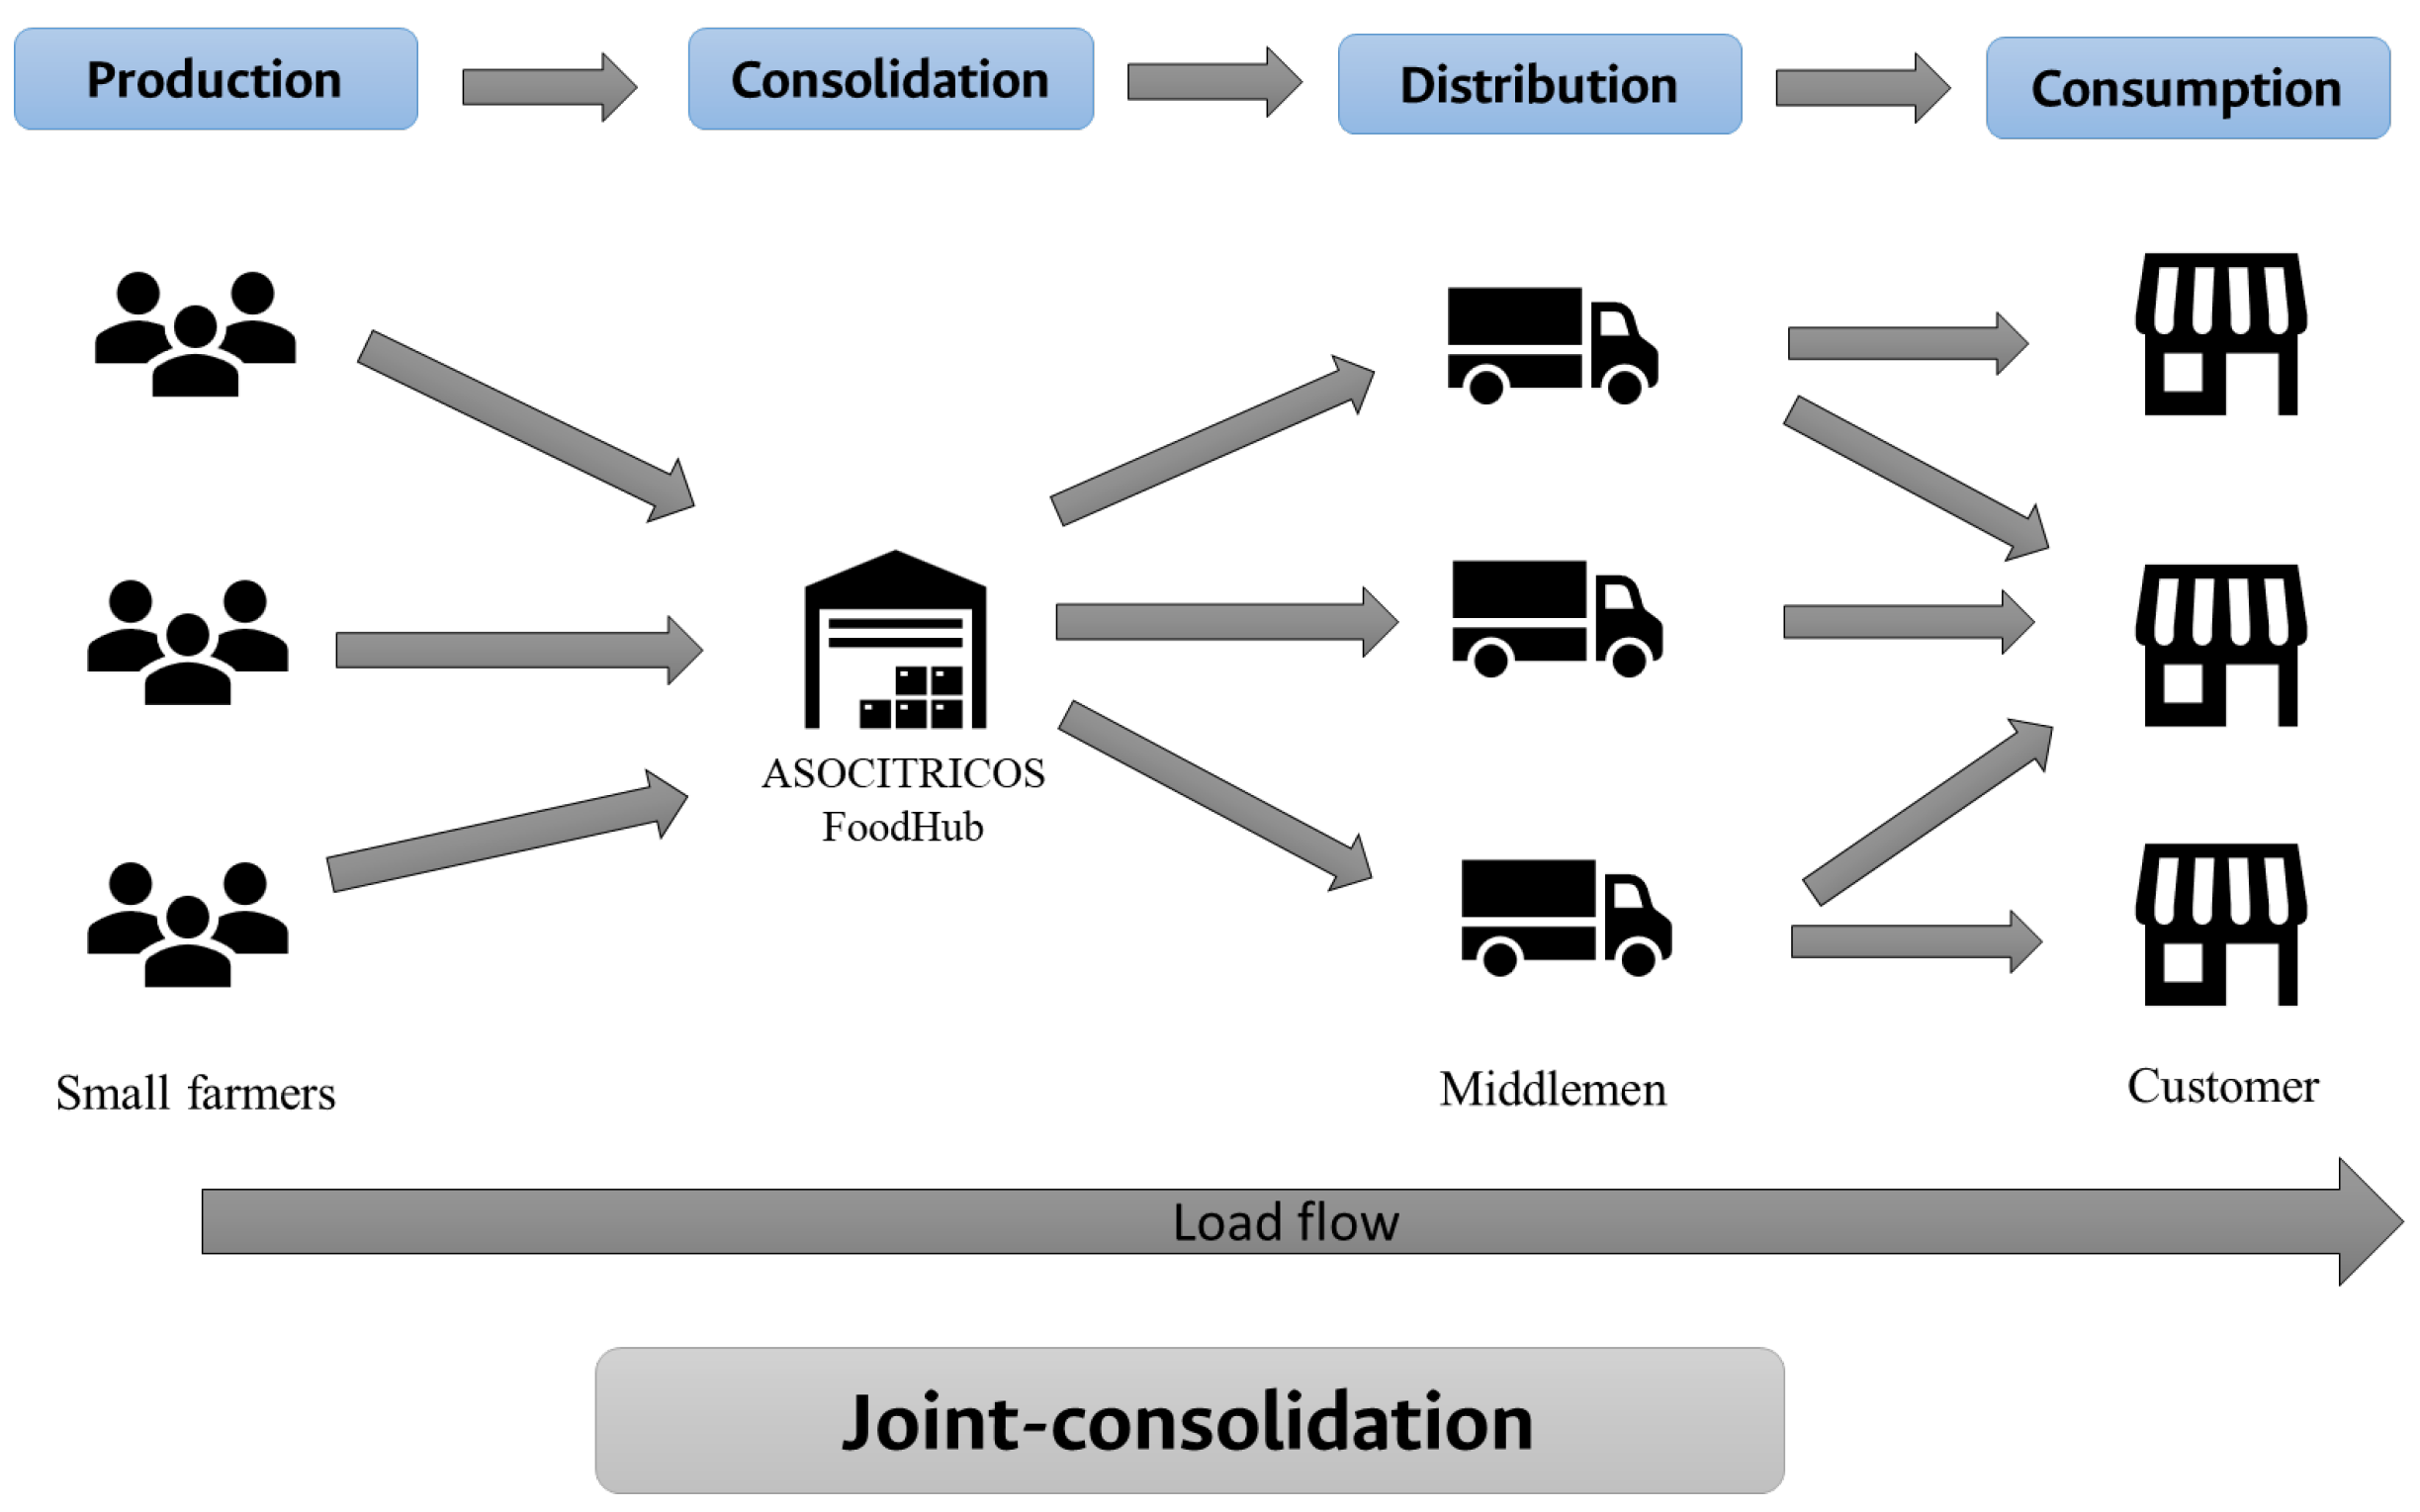
3.2. Joint-Consolidation Scenario

This scenario represents the joint decision by farmers to consolidate their harvests at ASOCITRICOS’s food hub (see Figure 3). Each farm agreed to deliver its harvest to the food hub, incorporating transportation costs in the selling price. Similarly, ASOCITRICOS set the price and sells the harvest to middlemen, who then distribute it to customers while assuming full liability for their loads and customer interactions.

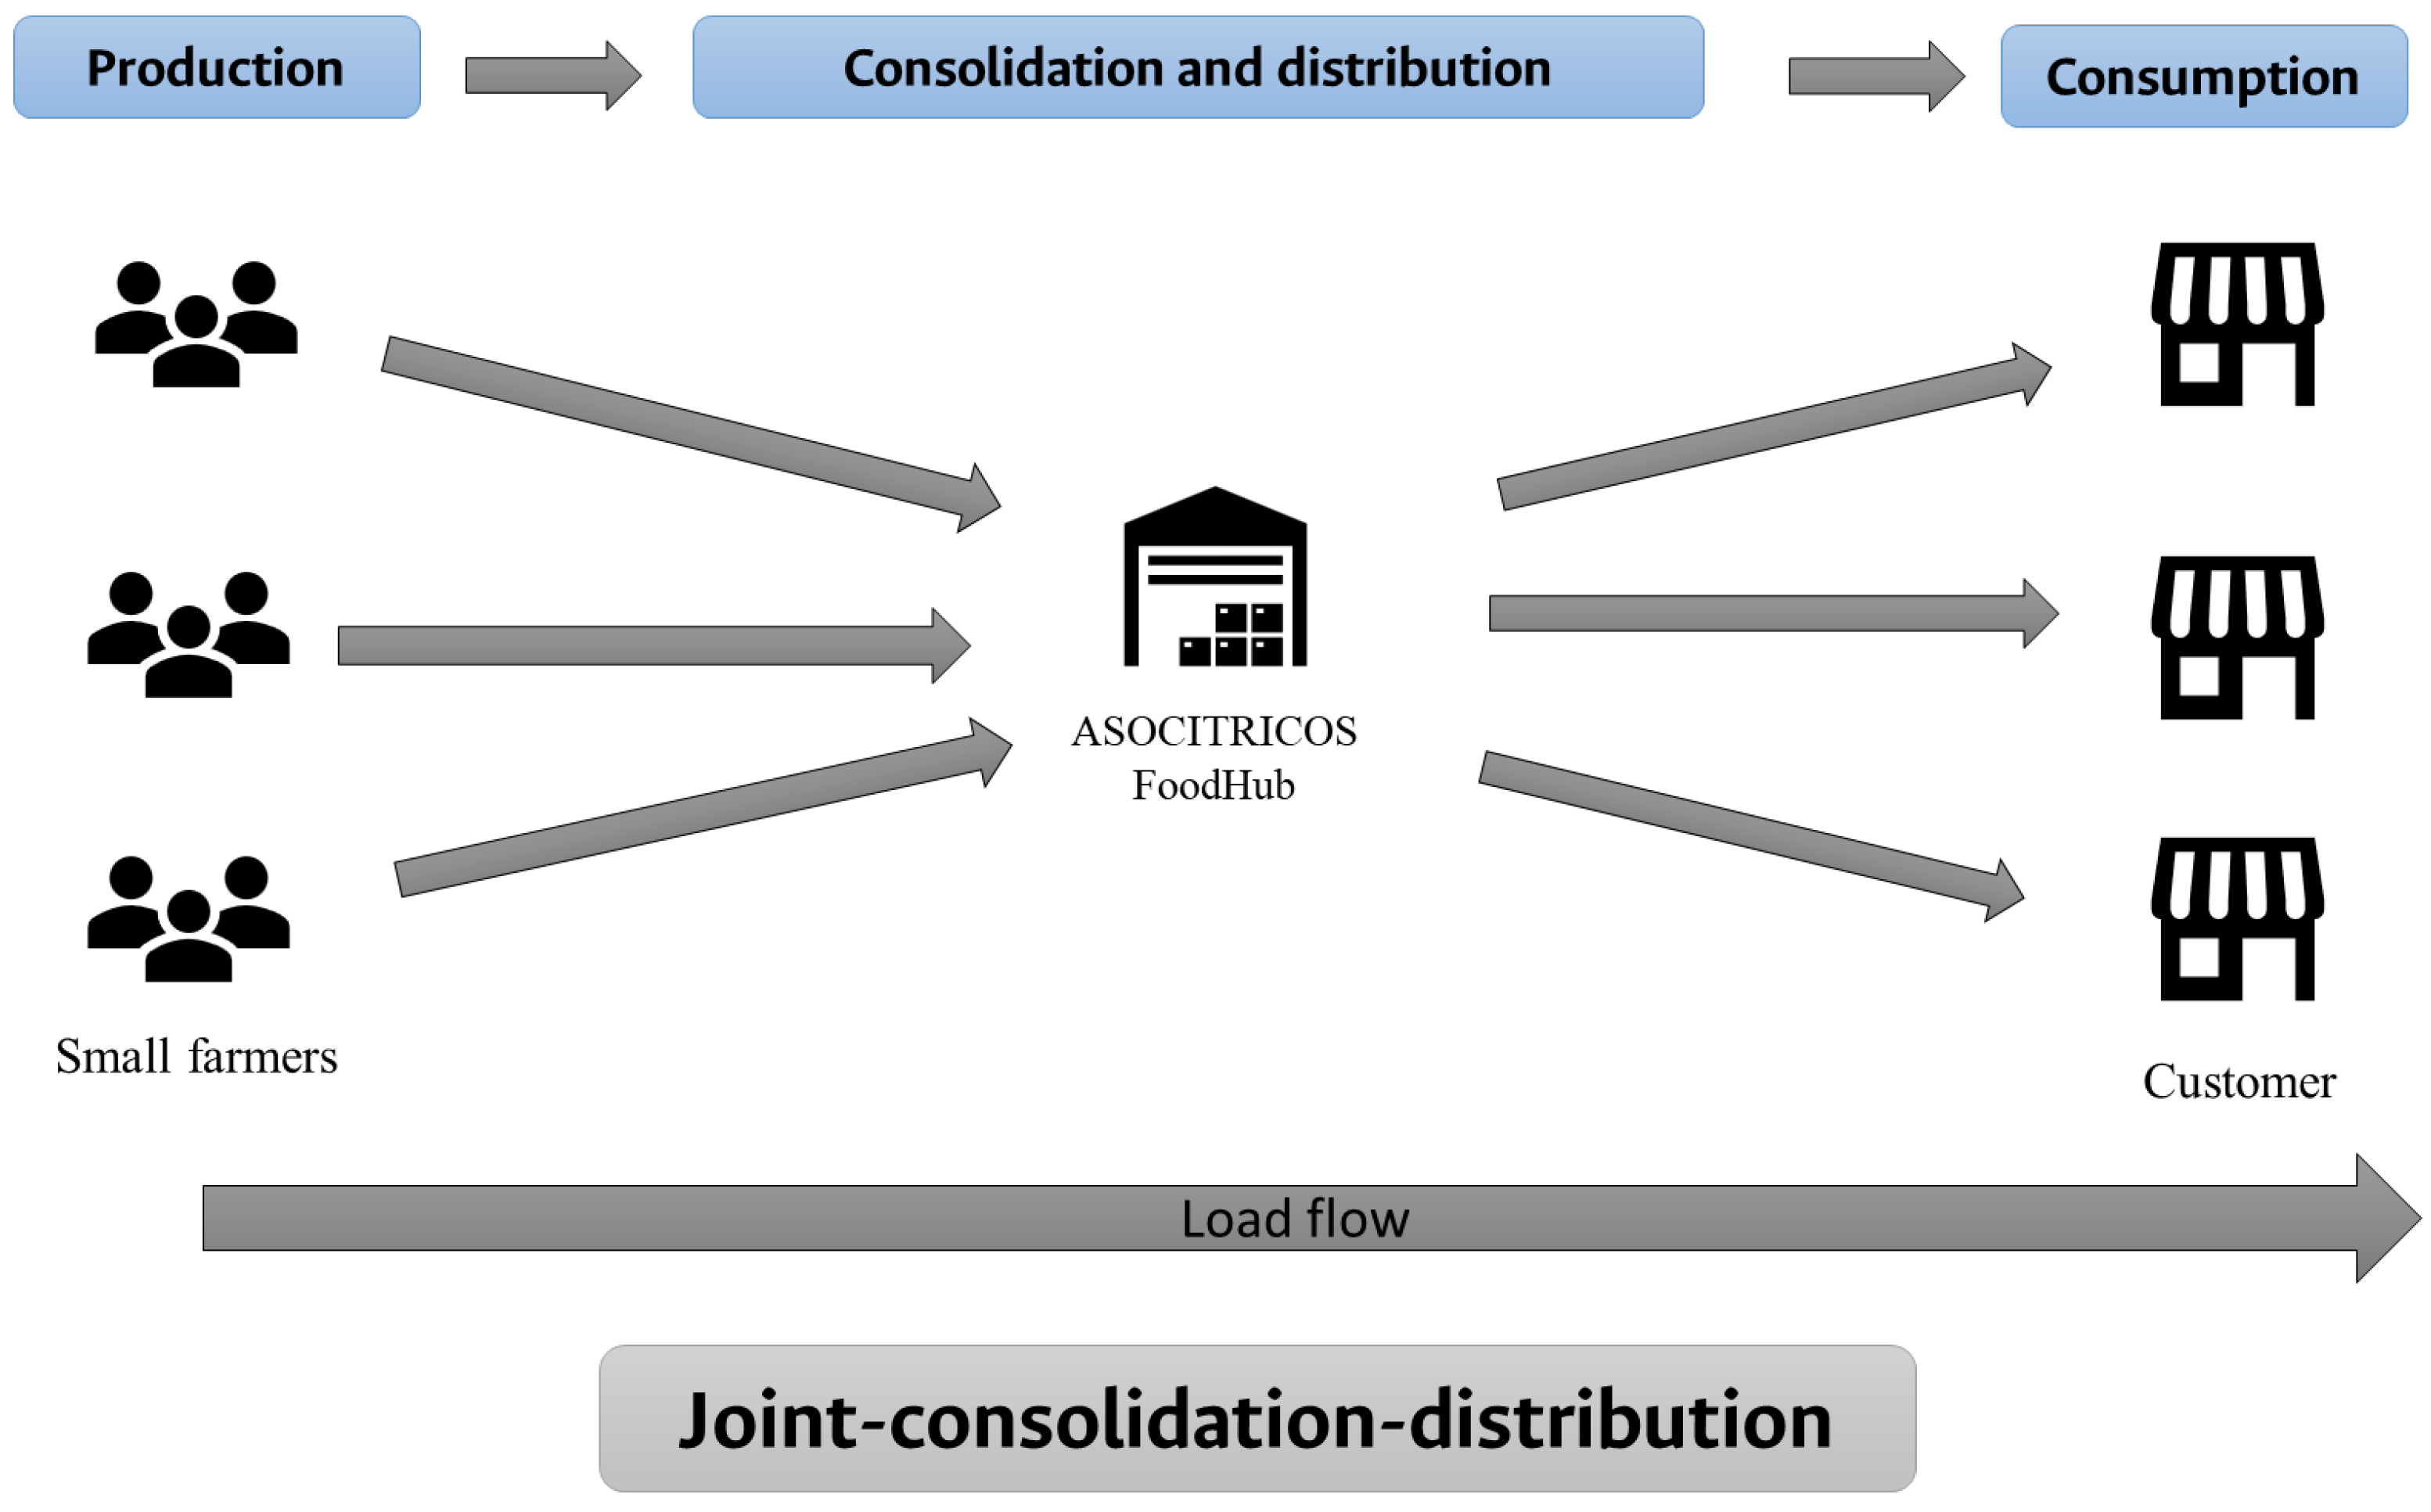
3.3. Joint-Consolidation-Distribution Scenario

This scenario represents the joint decision by farmers and ASOCITRICOS to consolidate and distribute the harvest directly to customers without involving middlemen (see Figure 4). Each farm agreed to deliver its harvest to the food hub, including transportation costs in the selling price. ASOCITRICOS sets the selling prices, markets the harvest to customers, and manages the logistics of distribution to the urban centers. As a result, distribution is centralized, with ASOCITRICOS assuming full liability for delivering the harvest to customers.

3.4. Modeling

This study was based on the following assumptions:
  • The demand was known and matched supply, assuming that the farmers’ entire harvest was sold to consumers.
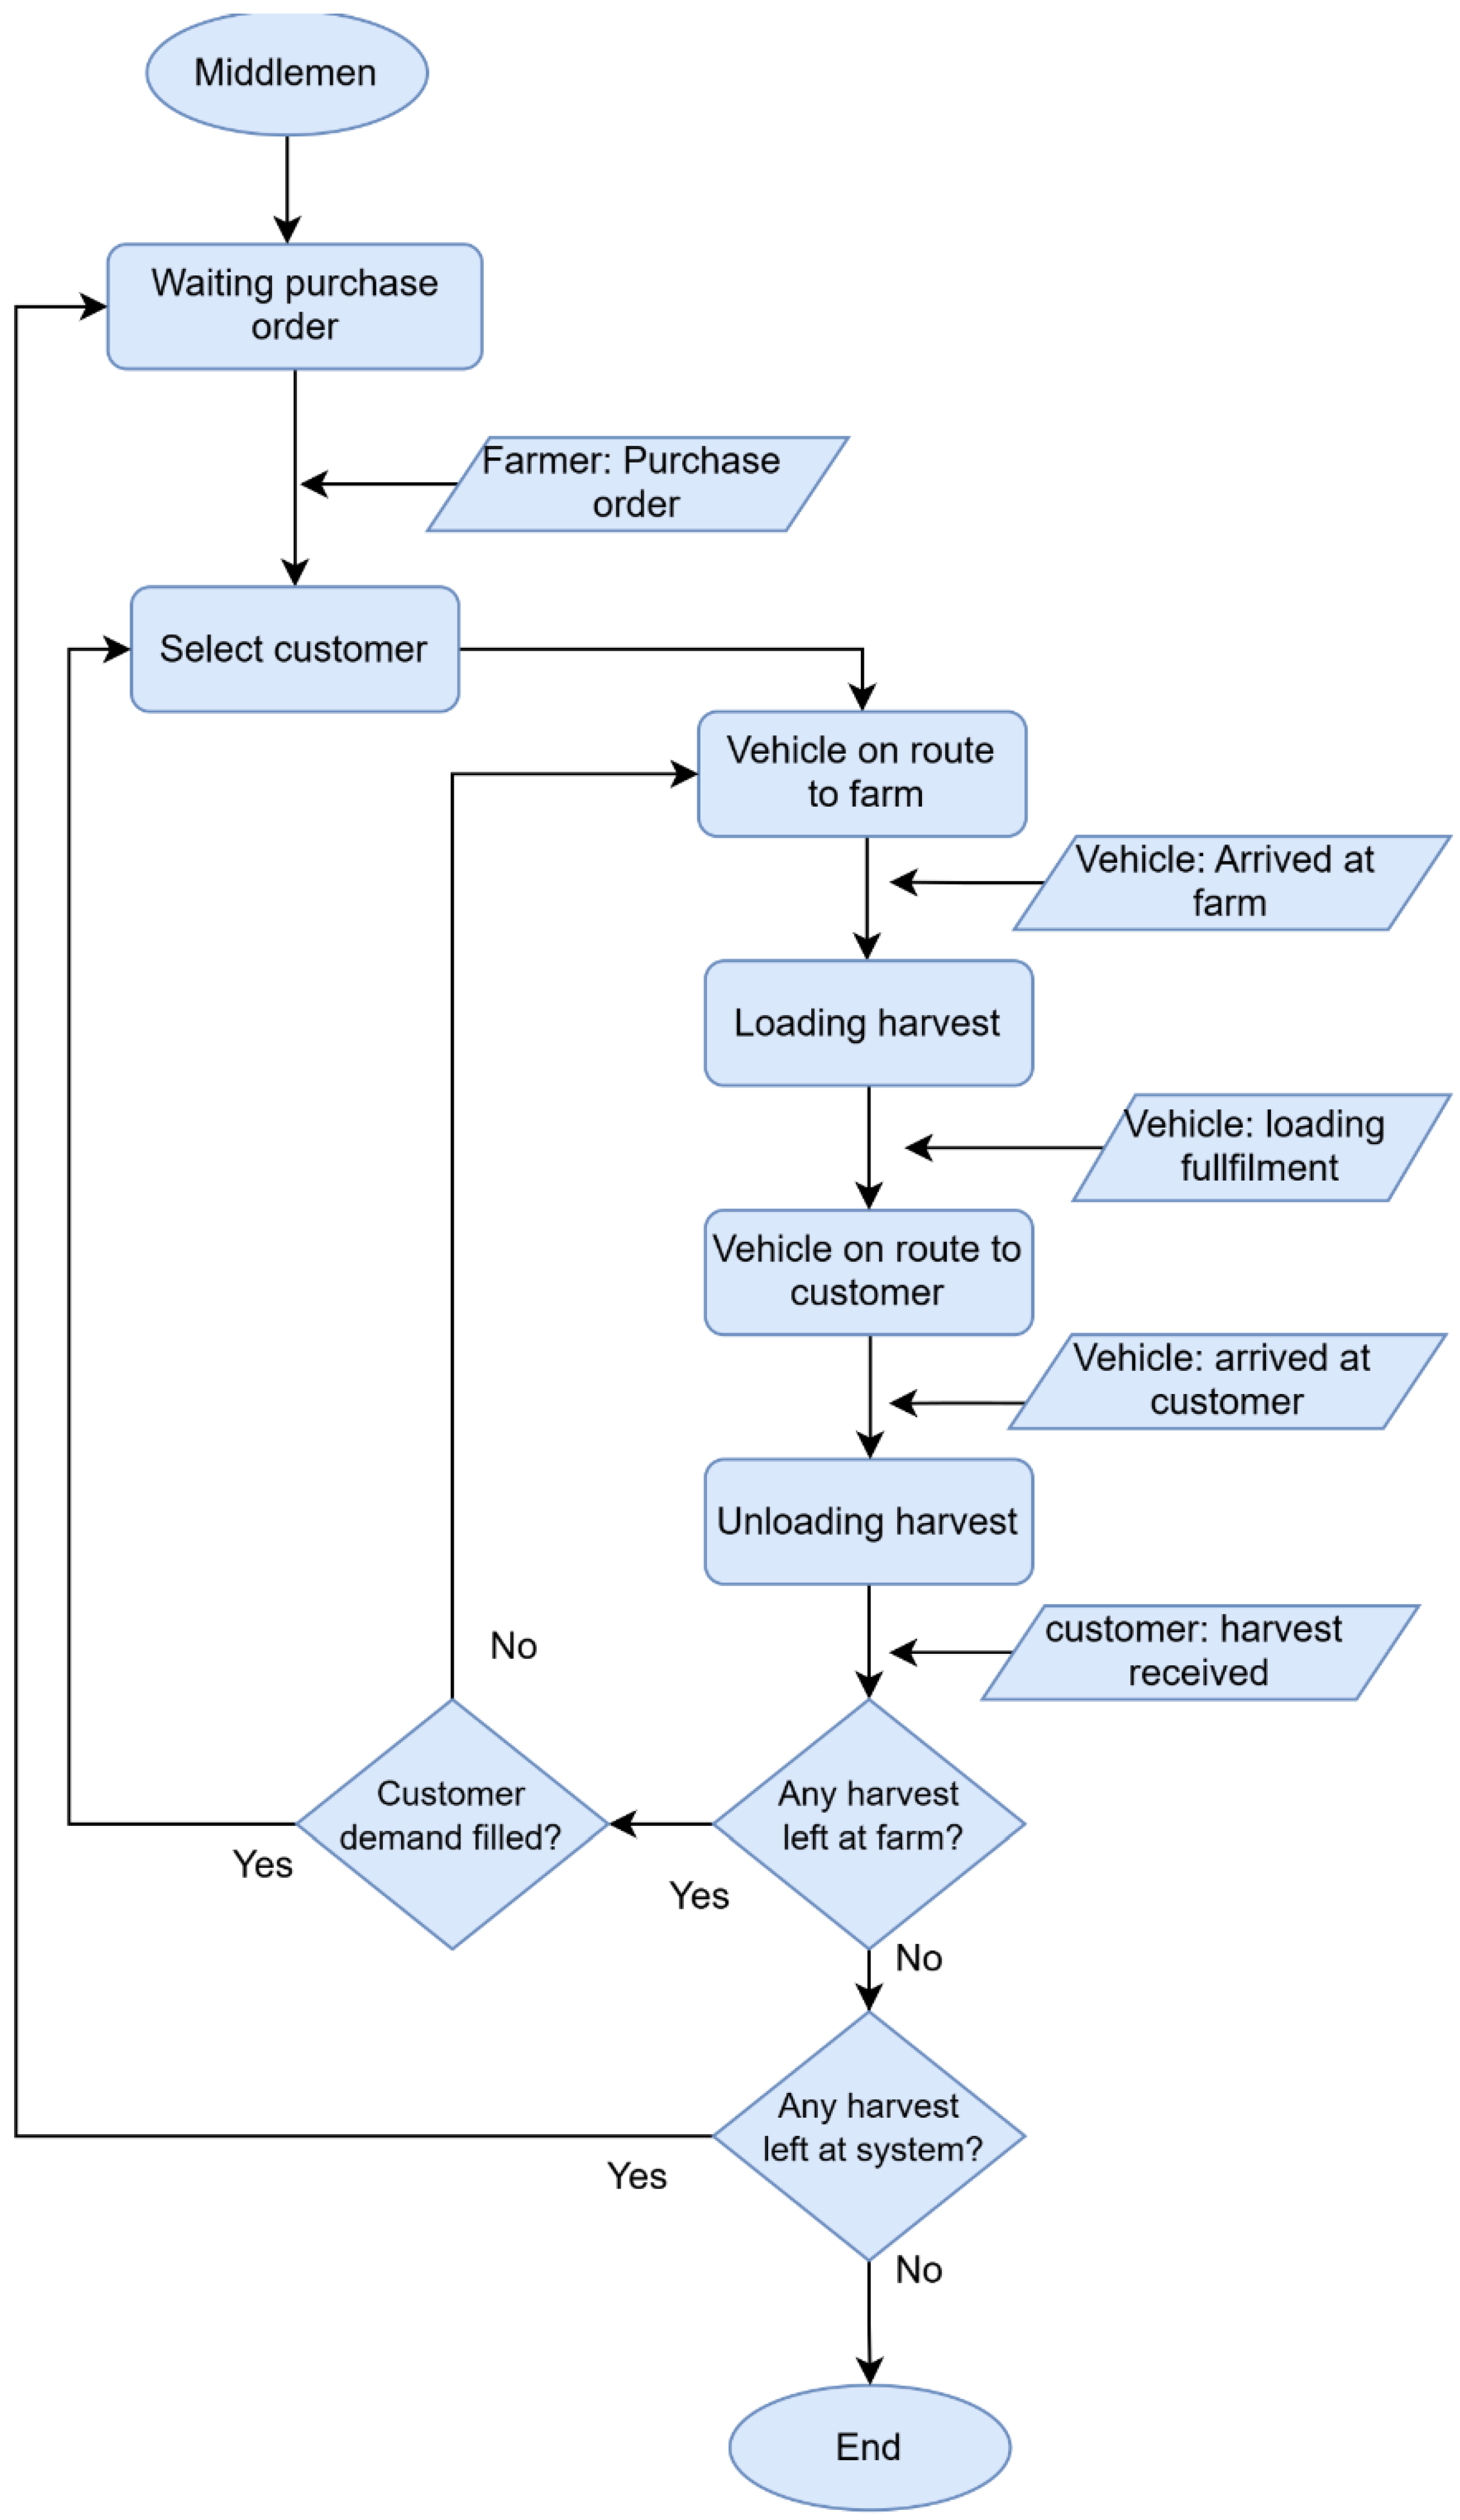
  • Vehicles could exist in one of the following states: Idle/Available (0), when a vehicle was idle and ready to travel; Empty-Travel (1), when a vehicle was traveling without a load; Loading (2), when a vehicle was being loaded with a harvest; Load-Travel (3), when a vehicle was traveling with a load (operating at either full or partial capacity); and Unloading (4), when a vehicle was unloading a harvest.
  • Collection and distribution were treated as separate systems to enable a clear comparison of coordination scenarios.
  • Two-axle and three-axle trucks were used for collection and distribution, respectively.
  • Maintenance of trucks was performed every 20,000 km or every year [61].
  • Trucks were dedicated to delivering goods exclusively to their assigned customer, without making additional stops.
  • An optimal route was determined for each scenario, considering the distances between farms, clients, and the food hub.
  • Each farmer and customer were georeferenced to identify the optimal path.
  • Fixed storage costs and revenues from sales were assumed to remain constant across all study scenarios.
  • The simulation began at the time of harvest and ended upon delivery of the product to the customer.
  • Our study focused on a citrus supply chain with seasonal production, characterized by predictable demand and supply.
Table 2 and Table 3 provide the parameters and variables used in this study. The parameter values were estimated using raw data collected in fieldwork in September 2023. The researchers employed a questionnaire-based instrument to guide data collection from farmers and ASOCITRICOS members, requesting information such as annual sales history, customer details, and farm location. This data, gathered from the stakeholders’ experiences and records, were essential for accurately predicting each farmer’s supply and customer demand. The number of trucks was determined by simulating each scenario multiple times using different fleet sizes, ranging from 1 to 20 distribution trucks. We calculated the mean values of Staytime (Equation (5)) and total logistics costs (Equation (12)) across all scenarios and normalized them to a mean of 0 and a standard deviation of 1. These normalized values were then plotted as functions of the number of trucks. We selected the number of trucks at the intersection point of the two curves, balancing between efficiency and financial performance.
We measured logistical performance using the following variables as key performance indicators (KPI), which are defined in Equations (1)–(12):
S 2 = p = 1 n s p
S 3 = q = 1 m s q
T P i , q , 3 = 1 m q = 1 m t i , q , 3 T 100
T P i , p , 2 = 1 n p = 1 n t i , p , 3 T 100
S t a y T i m e = 1 D c k = 1 D c t e x i t , k t i n i t , k
R q , 3 = 1 m q = 1 m w q , 3 w m a x , 3
R E V = c = 1 7 D c · P = W · P
C o s t D i s t = F · s f u e l , 3 · S 3 + s f u e l , 2 · S 2
C o s t s t o r a g e = C o s t l a b o r + C o s t u t i l i t y
C o s t m a i n t = C o s t m a i n t , 2 + C o s t m a i n t , 3 + C o s t u n p r e d
C o s t = C o s t D i s t + C o s t m a i n t + C o s t s t o r a g e
G P M = R E V C o s t R E V
where j was the j-th farmer (ranging from 1 to 24 ), and c was the c-th customer (ranging from 1 to 7). Similarly, k was the k-th unity (tonne) of harvest load produced by the supply chain (ranging from 1 to W ). Additionally, i was the i-th vehicle state in the logistics process (ranging from 0 to 4 ), p was the p-th two-axle truck, and q was the q-th three-axle truck. The KPIs were categorized as follows: S 2 ,   S 3 ,   T P i , q , 3 , T P i , q , 2 , S t a y T i m e C , and R q , 3 as efficiency indicator; and R E V ,   C o s t ,   C o s t D i s t , C o s t m a i n t , and G P M as financial indicators.
We conducted agent-based modeling to represent local knowledge and stakeholder interactions through autonomous agents, each with distinct objectives, attributes, and decision-making rules. Agent-Based Modeling and Simulation (ABMS) is a computational approach used to simulate dynamic systems, where individual autonomous agents interact with one another and their environment based on predefined rules, allowing the emergence of complex behaviors and outcomes [54,56,62]. Table 4 provides an overview of the types of agents used to model and simulate the existing supply chain and coordination scenarios, detailing their attributes and descriptions.
These agents were predefined and initialized as active at the start of the simulation, maintaining a constant population throughout its duration. Each agent was characterized by specific objectives and behaviors that guided their interactions and decision-making processes (see Figure 5 and Figure 6, and Supplementary Material). Agents transitioned between various states (e.g., Idle, Loading, Load-Travel, Unloading), with state changes triggered by specific events or conditions (e.g., loading or unloading activities, or receipt of purchase orders). Depending on the state and scenario, these transitions could occur instantaneously or over a defined time interval. Agents communicated and coordinated through message exchanges, facilitating the simulation of local knowledge and stakeholder interactions. For instance, vehicles transitioned between travel and loading states based on their assignments, while farmers delivered harvests to middlemen or the food hub in accordance with the predefined logistics established in the coordination scenario. All agents were temporary and became inactive once their specific role in the supply chain process was completed.
Figure 5 depicts the state chart of the farmer agent in the base scenario. Ater initialization, the farmer places a purchase order with the middleman for the harvest. The farmer then waits for the arrival of the middleman at the farm gate. Once the middleman arrives, the loading process begins. When the vehicle becomes full, the farmer waits for the middleman to return if there is still harvest remaining at the farm. Otherwise, once the harvest is fully delivered, the farmer transitions to an inactive state and no longer participates in the system’s operations for the remainder of the simulation.
Similarly, Figure 6 depicts the state chart of the middleman in the base scenario. Each vehicle agent is assigned to a specific middleman at initialization, stablishing a one-to-one correspondence in which vehicles effectively represent middlemen. The middleman waits for purchase order from farmer. Upon receiving a purchase order, the middleman selects a customer and proceeds to the corresponding farm. Once they arrive at the farm gate, the loading process begins and continues until the vehicle reaches full capacity. The middleman then delivers the harvest to the customer. If there is still harvest left at the farm, the middleman returns to the farm to collect additional harvest or select another customer, if the customer’s demand is fully satisfied. If an uncollected harvest still exists in the system, the middleman continues waiting for purchase orders from farmers. Otherwise, middleman transitions to an inactive state and ceases participation in the system’s operations for the remainder of the simulation.
For the scenarios of joint-consolidation and joint-consolidation-distribution, agents and their rules are as described in the Supplementary Materials.

3.5. Simulation

We simulated the three logistics distribution models using FlexSim 24.2.2, a simulation software designed to replicate real-world conditions in a production environment. Our simulations were deterministic, relying on the field-collected data. According to [41,62], deterministic models consistently produce the same outputs when given identical inputs, as their components follow fixed rules. The model stop time and warmup time were defined following model assumptions. The results were compared to identify potential improvements in KPIs.

3.6. Sensitivity Analysis

A sensitivity analysis was carried out to evaluate the parametric uncertainty in some parameters on the simulation:
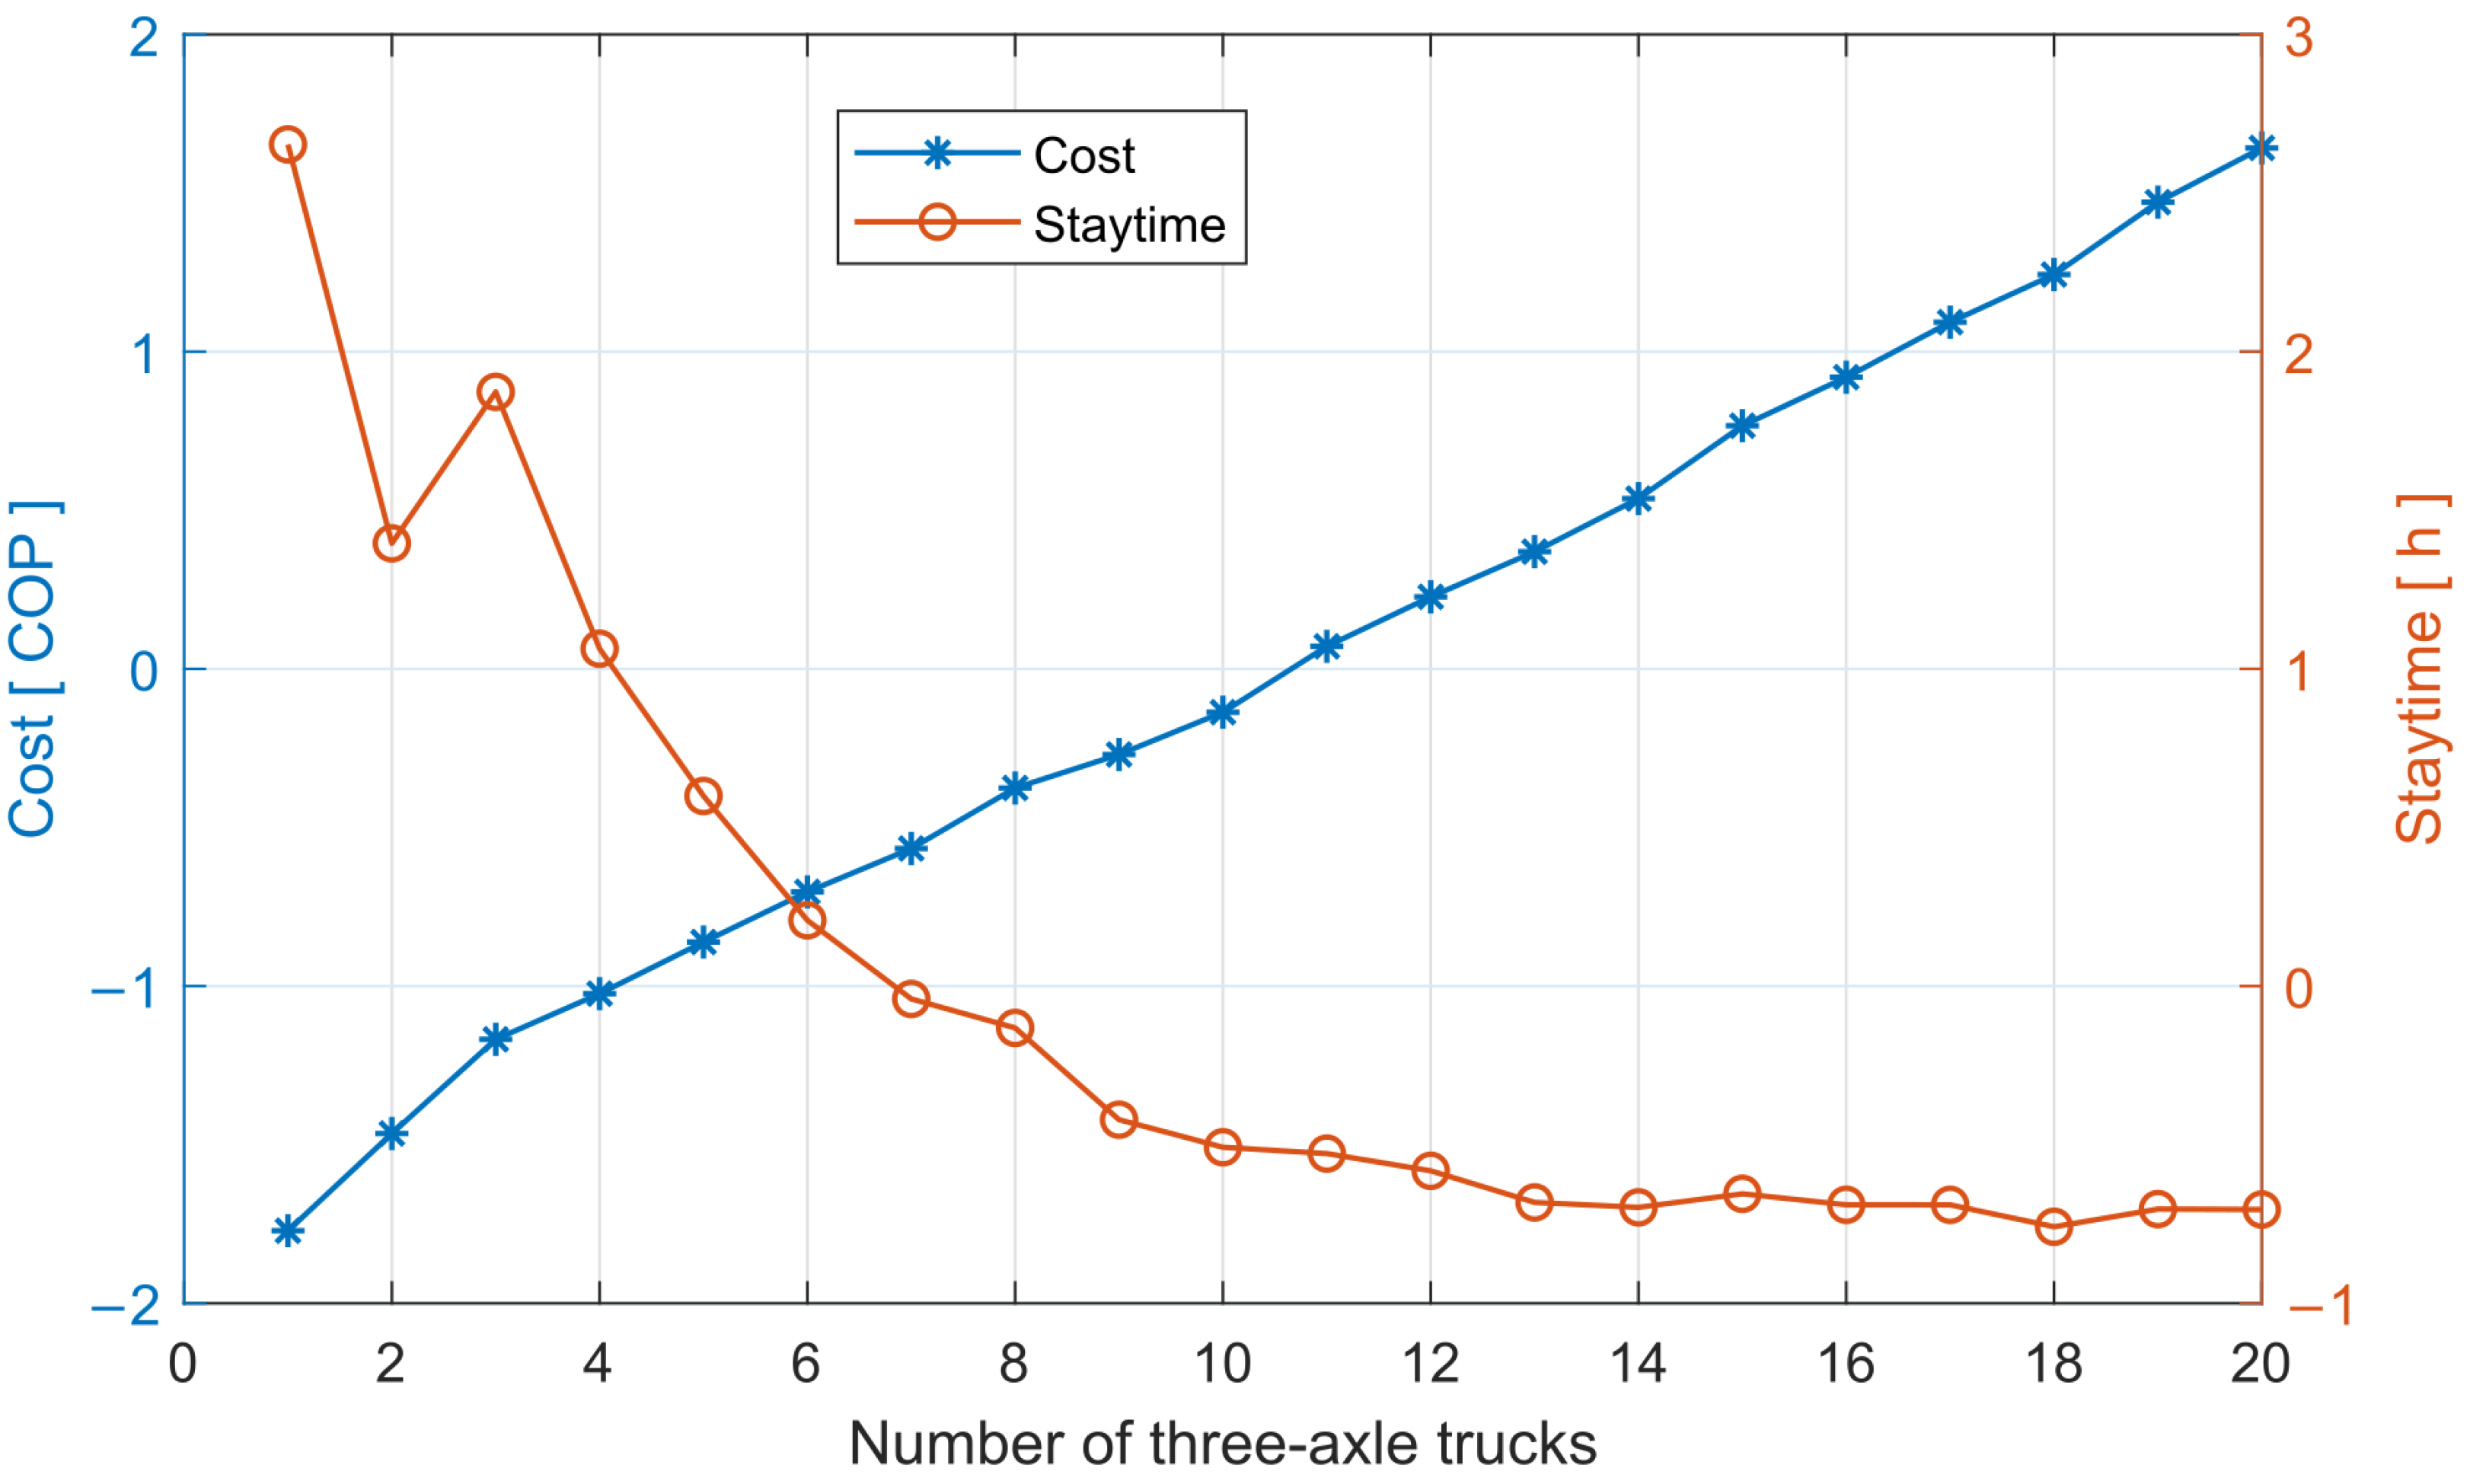
  • Number of three-axle trucks (m): variations of ±2 vehicles were analyzed, corresponding to a change of ±33.34%.
  • Maximum load capacity of three-axle trucks (wmax,3): Changes of ±2 tons were evaluated, equivalent to ±28.57%.
  • Fuel price per gallon (F): This parameter was evaluated considering a variation in its value of ±20%.
We used the KPI values obtained with the nominal model parameter values as the reference for each scenario. The scenarios were then re-simulated using adjusted parameter values. The resulting changes in KPI values were compared, and percentage variations were calculated to quantify the sensitivity of each parameter.

4. Results

4.1. Modeling Parameters

All participating farmers cultivated oranges, more than half grow grapefruits, and a few have lime trees. The association produced 102,476 oranges, 5958 grapefruits, and 2300 limes per harvest, with average losses of fruit of 15%, 4%, and 13%, respectively. In terms of prices, grapefruit was the most expensive product, averaging COP 850 per unit. Oranges were sold at COP 120 per unit, while limes were sold at COP 66 per unit. The total load of harvest produced by the supply chain was 634 tons. COP 536.405 was the weighted average per-unit price of citrus fruit in the supply chain. According to ASOCITRICOS’s reports, they estimated the selling price to be 20% and 100% higher for the joint-consolidation and joint-consolidation-distribution scenarios, respectively. Table 2 provides the model parameters estimated using raw data collected in fieldwork. Similarly, Figure 7 shows the plot of normalized values for Staytime and total logistics costs C o s t as functions of the number of three-axle trucks. The intersection point between both curves occurred at six trucks, which was selected as the distribution fleet size for all scenarios. Following a similar procedure, the number of two-axle trucks required for consolidation was also determined. Based on primary sources, farmers also estimated that two trucks was the appropriate number of two-axle vehicles to collect the current production managed by ASOCITRICOS.

4.2. Efficiency Key Performance Indicators

Table 5 presents the efficiency KPIs for the three scenarios. In the single-distribution scenario, vehicles traveled a total distance of 107,660.00 km and required 123 h to deliver the entire load to all customers. This scenario obtained the highest travel distance and the shortest Staytime. The load capacity was 50.24% (3.52 tons), while vehicles traveled loaded for approximately 56.78% of the total time. However, it also had the highest idle time (5.6%) compared to the other scenarios.
In the joint-consolidation scenario, vehicles traveled the lowest total distance of 104,261.38 km, requiring 135.34 h to deliver the entire load to all customers. Vehicles traveled loaded for approximately 41.83% of the total time, as trips to the FH were generally made without a load, resulting in multiple trips with low occupancy. This scenario also achieved the lowest vehicle idle time percentage at 3.24% with a load capacity of 29% (2.07 tons).
In the joint-consolidation-distribution scenario, vehicles traveled the second-shortest total distance, covering 105,449.21 km, and required 125.06 h to complete all deliveries—the second-lowest Staytime. The load capacity was approximately 42.40% (2.97 tons), as some trips were conducted with partial loads. This scenario achieved the highest percentage of time that vehicles spent traveling loaded, at 57.22%, along with one of the lowest percentages for idle time (3.25%) and loading and unloading times (7.16% and 7.02%, respectively). Additionally, this scenario achieved one of the lowest percentages of empty travel time (25.34%) because, during the distribution process, ASOCITRICOS can deliver cargo to multiple customers on the same trip (Figure S4).

4.3. Financial Key Performance Indicators

Table 6 presents the financial KPIs for the three scenarios. Distribution and maintenance costs were not considered in the single-distribution and joint-consolidation scenarios, as middlemen assumed full liability for their own loads. Similarly, the gross profit margin (GPM) was calculated from the perspective of ASOCITRICOS and farmers. The joint-consolidation-distribution scenario incurred the highest total logistics costs ( C o s t ) , requiring COP 150,072,695.00, as ASOCITRICOS assumed liability for its own loads. This scenario required COP 67,330,650.00 for vehicle maintenance and COP 59,283,073.00 for load distribution. The joint-consolidation scenario increased GPM by 16.8% compared to the single distribution scenario (individual farm sales), as ASOCITRICOS sold directly to middlemen at a higher price. Similarly, despite higher logistical costs, in the joint-consolidation-distribution scenario, GPM increased by 55.9% compared to individual sales and by 33.4% compared to the joint-consolidation scenario, as the association sold directly to end customers.

4.4. Sensitivity Analysis

Table 7 presents the sensitivity analysis of the number of three-axle trucks m . The findings revealed that reducing the number of distribution trucks by 33% led to an average increase of 31% in Staytime, 12% in the loading time percentage, and 7.5% in the total load capacity across all scenarios. Additionally, the idle time percentage and the total distribution distance decreased by 44.8% and 12.6%. These changes can be explained by the need for middlemen or ASOCITRICOS to perform more trips to distribute the entire system’s production. Regarding the financial indicators, the reduction in trucks led to a 6.32% increase in profits and a 22% decrease in total costs for ASOCITRICOS in the joint-consolidation–distribution scenario, as fewer trucks resulted in lower distribution and maintenance costs. Financial KPIs remained unchanged in the other scenarios.
Conversely, increasing the number of distribution trucks by 33% resulted in an average increment of 27.72% in idle time percentage and 13.8% in the total distribution distance ( s t o t a l , 3 ). Additionally, the increment in trucks reduced the Staytime by 12.5% and total load capacity by 13.1% across all scenarios. Changes in time percentage (TP) indicators can be explained due to middlemen or ASOCITRICOS to perform fewer trips to distribute the entire harvest. Regarding the financial indicators, this increase in trucks led to a 6.32% reduction in profits while simultaneously increasing total costs by 22% for ASOCITRICOS in the joint-consolidation–distribution scenario. Financial KPIs remained unchanged in the other scenarios.
Table 8 presents the sensitivity analysis of the maximum load capacity of three-axle trucks ( w m a x , 3 ). The findings revealed that reducing the load capacity of distribution trucks by 28.57% led to an average increase of 11.14% in Staytime and 16.8% in the empty travel time percentage, while the idle travel time percentage decreased by 30.1% across all scenarios. Regarding the financial indicators, this reduction in load capacity led to a 4.86% increment in total costs while reducing profits by −1.37%. These changes can be attributed to the reduced load capacity of trucks, which required that middlemen or ASOCITRICOS to perform more trips to distribute the entire harvest, leading to higher maintenance and distribution costs.
Table 9 presents the sensitivity analysis of the fuel price ( F ). The findings revealed that reducing (or increasing) the fuel price by 20% led to an average increase (or reduction) of 6.2% in profits while reducing (increasing) total costs 22.4% in the joint-consolidation–distribution scenario. The other scenarios were not affected by changes in the fuel prices as the middlemen assumed total liability of the distribution of the harvest while the transportation costs of the harvest to the food hub was incorporated in the selling price. The efficiency indicators remained unchanged in all scenarios.

5. Discussion

This study assessed the impact of coordinating consolidation and distribution on the logistical performance of a citrus supply chain in Colombia. We simulated the existing system and two joint decision-making mechanism scenarios using agent-based modeling, enabling us to evaluate their effects on the logistics operations and financial performance. Our findings demonstrated that the decision-making coordination improved both operational efficiency and financial performance, supporting the hypothesis that such mechanism could enhance supply chain performance and sustainability. The simulation results indicated that small farmers who coordinate with ASOCITRICOS can secure better prices, gain greater decision-making power, and strengthen their roles within agricultural value chains. By eliminating middlemen through joint coordination, both ASOCITRICOS and small farmers can improve their financial performance and access to better opportunities. Furthermore, this collaborative mechanism has the potential to contribute to the sustainability and economic viability of the local supply chain, fostering the sustainable development of Chimichagua.
This study contributes to the literature by examining the impact of joint decision-making coordination using agent-based simulation. While most previous studies have relied on traditional optimization methods to address the joint consideration of costs across various supply stages (e.g., production), these methodologies often focused on determining the best strategy or solution under fixed parameters and predefined criteria [11,12,13,27,30,40,42,43,44,45,46,47,48,49]. In contrast, simulation-based approaches can model local knowledge and stakeholder interaction rules through autonomous agents, each with distinct objectives, attributes, and decision-making rules [19,35,54,56]. This approach enabled us to achieve a more decentralized representation of the joint decision-making mechanisms, capturing their dynamic behavior within the supply chain and assessing their impact on the system under changing conditions (e.g., food hub capacity, fuel cost, and harvest price).
By emulating these interactions, we revealed tangible benefits of the coordination mechanism, including improved logistical performance, increased revenues for ASOCITRICOS and small farmers, and reduced reliance on middlemen. By addressing the complex and dynamic nature of logistics operations, the simulation-based method served as a valuable tool for modeling alternative logistics scenarios under changing conditions (e.g., truck capacity, fuel cost, and number of trucks). Additionally, using model parameters estimated from field data, we developed a virtual environment to emulate the system under real-world conditions and explore joint decision-making mechanisms (which are not yet operational).
Implementing these mechanisms in the real world would be expensive, time-consuming, and challenging due to the longstanding limitations in the Colombian agricultural sector. For example, ASOCITRICOS can store only 40 tons out of the 600 tons produced by the supply chain, making full consolidation of the system’s harvest difficult. Additionally, ASOCITRICOS does not have distribution trucks, prompting the need for strategic partnerships with stakeholders who can provide them with vehicles or transportation services. Previous studies have emphasized that insufficient distribution infrastructure poses significant challenges for farmers, limiting their access to markets such as retail and commercial food services [17]. Therefore, we believe that the findings of this study can be used as a starting point for national and regional authorities to formulate development projects to strengthen productive associations and local food hubs as key players in the agricultural chain. Similarly, the financial improvements from joint coordination could foster the adoption of sustainable agricultural practices, integrating small farmers as key players in value chains, and enhancing their access to markets [17]. These findings may also encourage local authorities to develop training programs that promote collaboration among small farmers through productive associations and local food hubs, empowering them to secure better prices and decision-making power, which would contribute to the sustainability of the local supply chain and the community’s economic development [17].
Another contribution of this study was the heuristic method used to determine the optimal number of trucks for collection and distribution. In logistics network design, previous studies have defined model parameters using a combination of optimization and heuristic-based methods, such as local search, genetic algorithms, and integer linear programming [63,64]. Instead of employing a mathematical optimization method, our approach used a grid search simulation over a range of truck numbers to balance Staytime and Total Logistics Costs. The intersection of these KPIs served as a rule of thumb for determining the optimal number of trucks, achieving the best balance between efficiency and cost. We chose this brute-force approach because the truck number was a discrete parameter with predefined values (i.e., a smaller search space), making it computationally feasible to implement with ABMS. Additionally, after normalizing the data, the visual representation (plot) of both KPIs as function of the truck number simplified the decision-making process, focusing on the intersection point to balance between efficiency and cost. Therefore, although our approach may not guarantee a global optimum, we believe it provided a reasonable and practical estimate based on the trade-off analysis within a feasible time frame.
We simulated all the scenarios using the same number of trucks to establish a reference framework for comparison. Nevertheless, in the joint-consolidation scenario, the number of 3-axle trucks could be higher, as the middlemen assumed the distribution costs while ASOCITRICOS acted solely as the harvest consolidator. However, deploying more than eight middlemen would increase the idle time by 26.5% and total distribution distance by 23%, while reducing the utilization load capacity by 19% within the system (see Figure 7 and Table 7). This approach could result in less optimal delivery routes and vehicle utilization, despite the middlemen covering the distribution costs. Previous studies have emphasized that transportation is a key driver of the overall environmental impact of logistics, significantly influencing supply chain sustainability [16,21,27,65]. Consequently, there is a growing interest in integrating environmental considerations across all stages of the supply chain to minimize impacts while maintaining efficiency and economic performance. Collaborative distribution has emerged as a promising approach, where supply chain stakeholders, such as customers, share trucks or information to improve transportation efficiency by increasing filling rates, enhancing loaded travel, and reducing empty travel [21,35]. Future research could focus on modeling and simulating a collaborative distribution system between customers, with ASOCITRICOS serving as a consolidator. In this system, customers would share three-axle trucks to deliver their products, potentially improving sustainability and operational efficiency.
This study demonstrated that coordination mechanisms provide a cost-effective solution for improving logistical efficiency within supply chains. Our findings indicated that joint coordination could enhance the utilization of logistical vehicles by increasing the time percentage of vehicles traveling with a load, reducing the total distribution distance, and reducing the idle time percentage of vehicles, among other logistical improvements. These results align with previous studies that emphasized the role of logistics collaboration in addressing inefficiencies within supply chains [16,21,27,35,65]. Such collaboration can be achieved through resource sharing (e.g., distribution trucks or food hubs) and information sharing among stakeholders. Food hubs, which often play a central role in agricultural value chains, can act as active managers of information flows and traceability between stakeholders [16,17,18]. This enables them to oversee production, processing, transportation, and marketing activities, thereby contributing to value chain stakeholders being able to negotiate fair and mutually beneficial returns [16,17,18]. Our findings support initiatives like the National Agro-Food Alliance, which could improve logistical efficiency through effective coordination mechanisms and infrastructure, such as consolidation centers. These efficiencies could reduce production costs for farmers and enable more effective distribution and marketing through short supply chains [66]. In turn, such improvements could contribute to reducing multidimensional poverty and boosting regional productivity. However, challenges persist, as highlighted by Fawcett et al. [67]. Resistance to coordination persists, particularly because selling through the association often entails longer wait times for financial returns compared to selling directly to middlemen.
Our study faced some limitations. First, field data and local knowledge from stakeholders (e.g., farmers and ASOCITRICOS) were used to estimate the parameters of our agent-based model. However, the geographical conditions of the municipality of Chimichagua and budgetary constraints restricted access to the territory, limiting the ability to obtain comprehensive records and to include more farmers for proper parameter estimation. Therefore, the true values of these parameters may be difficult to obtain. We performed a sensitivity analysis on three parameters to assess how variations in these parameters influence the results. Nevertheless, a more comprehensive stochastic simulation, including uncertainties in additional model parameters (e.g., random purchase orders) or external factors (e.g., the El Niño phenomenon affecting production), would provide a richer, more nuanced analysis that is better aligned with the study’s objectives [54]. Additionally, future research should focus on validating the model and joint coordination mechanisms using real-world data. We faced challenges in performing field validation due to a sharp decline in demand, budgetary and time constraints, and difficulties in coordinating joint distribution efforts. As a result, field validation data were only obtained from three farmers and were restricted to two logistical performance indicators: total distribution costs and load capacity utilization.
Further constraints included the small sample size of 21 ASOCITRICOS farmers, which may not fully capture the diversity of practices or challenges faced by other farmers in the region, thus limiting the generalizability of the findings. Moreover, the simulation’s fixed demand and supply assumptions ignored potential fluctuations due to market conditions, weather, and crop yield variability; these factors could significantly influence logistical outcomes in real-world scenarios. External influences, such as road infrastructure quality, transportation delays, and political or economic disruptions, were also not accounted for, which could impact the feasibility of the proposed joint decision-making models. Finally, the financial analysis focused predominantly on logistical costs and revenues without addressing broader economic factors such as price volatility, input costs, and access to financing, which could provide a more comprehensive picture of the models’ financial viability.
Additionally, it is essential to explore the social dimensions of FSCs, particularly the influence of informality, local traditions, and cultural practices on the adoption and effectiveness of coordination mechanisms. Moreover, research should examine how KPIs like Staytime and Load Capacity Utilization are affected by the perishability of foods, as these variables are crucial in maintaining product quality and minimizing losses during distribution.

6. Conclusions

This study evaluated the impact of joint coordination mechanisms in the collection and distribution processes to enhance the logistical performance of a citrus FSC in Colombia. We simulated three scenarios using agent-based modeling: single-distribution (the current system), joint-consolidation, and joint-consolidation–distribution. The methodology enabled modeling of local knowledge and stakeholder interaction rules through autonomous agents, each with distinct objectives, attributes, and decision-making rules. It offered a dynamic supply chain representation, providing deeper insights into key performance indicators such as Total Logistics Costs, Staytime, and Load Capacity Utilization. The study provided simulation-based evidence that consolidating logistical operations through a food hub can significantly improve efficiency and financial performance. Among the coordination scenarios, the joint-consolidation–distribution scheme was the most effective, reducing logistical costs, improving load utilization, and increasing farmer revenues by eliminating middlemen. This joint coordination centralized logistics and led to a 16.8% higher gross profit margin compared to middleman-driven sales.
This study lays the groundwork for policies and projects aimed at strengthening productive associations and local food hubs as key players in the Colombian agricultural chain, especially in regions with limited infrastructure and market access, ultimately contributing to the sustainable development of local agricultural sectors. Joint consolidation enhances economic outcomes for smallholder farmers, supports supply chain sustainability, and fosters community development through better coordination. These findings could encourage local authorities to provide training that promotes collaboration among farmers, helping them to integrate into agricultural value chains with improved market access and greater decision-making power. Future research should focus on validating the model and joint coordination mechanisms using real-world data.

Supplementary Materials

The following supporting information can be downloaded at: https://www.mdpi.com/article/10.3390/logistics9010030/s1, Figure S1: Farmer agent state chart in the Joint-consolidation scenario; Figure S2: ASOCITRICOS state chart as consolidator in the joint-consolidation and joint-consolidation-distribution scenarios; Figure S3: Middlemen state chart in the joint-consolidation scenario; Figure S4: ASOCITRICOS state chart as distributor in the joint-consolidation-distribution scenario.

Author Contributions

Conceptualization, J.C.V.-M., F.A.S.-N. and W.A.J.; methodology, J.C.V.-M., F.A.S.-N. and R.R.; software, J.C.V.-M.; validation, F.A.S.-N.; formal analysis, J.C.V.-M., F.A.S.-N. and R.R.; investigation, J.C.V.-M., F.A.S.-N., W.A.J. and R.R.; resources, W.A.J. and R.R.; data curation, J.C.V.-M. and F.A.S.-N.; writing—original draft preparation, J.C.V.-M., F.A.S.-N. and R.R.; writing—review and editing, J.C.V.-M., F.A.S.-N., W.A.J. and R.R.; visualization, J.C.V.-M. and F.A.S.-N.; supervision, W.A.J. and R.R.; project administration, W.A.J. and R.R.; funding acquisition, R.R. All authors have read and agreed to the published version of the manuscript.

Funding

This research was funded by the Sistema General de Regalías (SGR) de Colombia, under project ID: BPIN 2020000100730. The content is solely the responsibility of the authors and does not necessarily represent the SGR.

Institutional Review Board Statement

This study was conducted in accordance with the ethical regulations of the Universidad Nacional de Colombia, which has a National Ethics Committee established under Agreement 1 of 19 April 2021 (Acuerdo 1 de 2021, 19 de abril). According to the committee’s regulations, the requirement for ethical approval is determined by the terms of reference of the specific research funding call, prior to project approval and execution. This research was funded by the Sistema General de Regalías (SGR) de Colombia under Call No. 10 of the Biennial Call Plan 2019–2021, which did not require ethical approval. Therefore, no separate ethical approval was sought for this study. During the fieldwork conducted in September 2023, all study participants —smallholder farmers and members of ASOCITRICOS—were invited to a workshop where they were informed about the objective and scope of the study, their role within the broader research project, and the data privacy policy. The workshop covered details on data usage, anonymity assurance, and confidentiality measures to ensure ethical handling of participant information.

Informed Consent Statement

Informed consent was obtained from all subjects involved in the study.

Data Availability Statement

The list of stakeholders underlying this article cannot be shared publicly due to privacy restrictions. To the extent allowed by the Law of Personal Data Protection, the data from this manuscript will be shared upon written requests to the corresponding author.

Conflicts of Interest

The authors declare no conflicts of interest. The funders had no role in the study’s design; in the collection, analysis, or interpretation of data; the writing of the manuscript; or the decision to publish the results.

References

  1. Arathoon, L.; Ruiz, A. Digital Agriculture Ecosystem Assessment: Colombia; Feed the future, the U.S. Government’s global hunger & food security initiative; The United States Agency for International Development (USAID), The AgTech Network: Washington, DC, USA, 2023.
  2. OECD. OECD Review of Agricultural Policies: Colombia 2015; OECD Review of Agricultural Policies; OECD Publishing: Paris, France, 2015; ISBN 978-92-64-22763-7. [Google Scholar]
  3. DANE. Producto Interno Bruto (PIB) IV Trimestre 2023 Preliminar; Technical Report; DANE: Bogotá, Colombia, 2024. Available online: https://www.dane.gov.co/files/operaciones/PIB/bol-PIB-IVtrim2023.pdf (accessed on 30 October 2024).
  4. ADR; FAO. Plan Integral de Desarrollo Agropecuario y Rural Con Enfoque Territorial: Departamento Del Cesar, TOMO I; Technical Report; ADR: Bogotá, Colombia, 2019. [Google Scholar]
  5. Hoz, J.R.V.D.L. Economía extractiva y pobreza en la ciénaga de Zapatosa. Rev. Banco República 2008, 81, 23–64. [Google Scholar]
  6. Ovalle Angarita, F.; Vigna, E.M. Plan de Desarrollo Departamento Del Cesar 2016–2019: El Camino Del Desarrollo y La Paz 2016. Available online: https://cesar.gov.co/d/filesmain/plan_desarrollo/plan_de_desarrollo_departamental_2016-2019_el_camino_del_desarrollo_y_la_paz.pdf (accessed on 30 October 2024).
  7. Hanson, C.; Davey, E.; Martínez, C.; Falla, P.; Katz, D.; Pinilla, S.; Thiercelin, L.; Velásquez, P.; Florido, A. Hoja de Ruta Para Una Nueva Economía de La Alimentación y Uso Del Suelo; Technical Report; The Food and Land Use Coalition: Bogotá, Colombia, 2019. [Google Scholar]
  8. Padilla Cabarcas, A.; Castillo Varela, Z.; Tovar, J.; Zahgui, N.; Martínez Zuleta, C.; Pinilla Pérez, S.; Katz Asprilla, D.; Rodriguez Díaz, A.; Veálasquez Espinosa, P. Hoja de Ruta Para Un Desarollo Sostenible y En Paz: Corredor Perija-Zapatosa 2018. Available online: https://e3asesorias.com/wp-content/uploads/documentos/Version%20m%C3%B3vil%20-%20Perija%20Zapatosa-compressed.pdf (accessed on 30 October 2024).
  9. Bedoya Mejía, L.M.; Barrera Gonzales, A.L.; Cabrera Bravo, J.A. El Cesar Productivo Ayer y Hoy; Universidad Nacional De Colombia: La Paz, Colombia, 2022; ISBN 978-958-50-5031-0. [Google Scholar]
  10. Mejía Montoya, J.W.; González, S.A.; Vargas, J.J.; Rios, R. Environmental Expectations, Socioeconomic Demands and Sustainability of the Zapatosa Marsh, Colombia: Perspectives from Local Stakeholders. Sustainability 2024, 16, 10806. [Google Scholar] [CrossRef]
  11. Soosay, C. Coordination in Supply Chains. In The Palgrave Handbook of Supply Chain Management; Sarkis, J., Ed.; Springer International Publishing: Cham, Switzerland, 2024; pp. 983–1008. ISBN 978-3-031-19884-7. [Google Scholar]
  12. Handayati, Y.; Simatupang, T.M.; Perdana, T. Agri-Food Supply Chain Coordination: The State-of-the-Art and Recent Developments. Logist. Res. 2015, 8, 5. [Google Scholar] [CrossRef]
  13. Arshinder; Kanda, A.; Deshmukh, S.G. Supply Chain Coordination: Perspectives, Empirical Studies and Research Directions. Int. J. Prod. Econ. 2008, 115, 316–335. [Google Scholar] [CrossRef]
  14. Sabbaghnia, A.; Heydari, J.; Ülkü, M.A.; Zolfaghari, S. Sustainable Supply Chain Coordination: Extant Literature, Trends, and Future Research Directions. Ann. Oper. Res. 2024. [Google Scholar] [CrossRef]
  15. Bygballe, L.E.; Dubois, A.; Jahre, M. The Importance of Resource Interaction in Strategies for Managing Supply Chain Disruptions. J. Bus. Res. 2023, 154, 113333. [Google Scholar] [CrossRef]
  16. Palacios-Argüello, L.; Sanchez-Diaz, I.; Gonzalez-Feliu, J.; Gondran, N. The Role of Food Hubs in Enabling Local Sourcing for School Canteens. In Food Supply Chains in Cities: Modern Tools for Circularity and Sustainability; Aktas, E., Bourlakis, M., Eds.; Springer International Publishing: Cham, Switzerland, 2020; pp. 233–263. ISBN 978-3-030-34065-0. [Google Scholar]
  17. Barham, J.; Tropp, D.; Enterline, K.; Farbman, J.; Fisk, J.; Kiraly, S. Regional Food Hub Resource Guide; U.S. Department of Agriculture, Agricultural Marketing Service: Washington, DC, USA, 2012.
  18. Cleveland, D.A.; Müller, N.M.; Tranovich, A.C.; Mazaroli, D.N.; Hinson, K. Local Food Hubs for Alternative Food Systems: A Case Study from Santa Barbara County, California. J. Rural Stud. 2014, 35, 26–36. [Google Scholar] [CrossRef]
  19. Binsfeld, T.; Gerlach, B. Quantifying the Benefits of Digital Supply Chain Twins—A Simulation Study in Organic Food Supply Chains. Logistics 2022, 6, 46. [Google Scholar] [CrossRef]
  20. Michel-Villarreal, R. Towards Sustainable and Resilient Short Food Supply Chains: A Focus on Sustainability Practices and Resilience Capabilities Using Case Study. Br. Food J. 2022, 125, 1914–1935. [Google Scholar] [CrossRef]
  21. Danloup, N.; Mirzabeiki, V.; Allaoui, H.; Goncalves, G.; Julien, D.; Mena, C. Reducing Transportation Greenhouse Gas Emissions with Collaborative Distribution: A Case Study. Manag. Res. Rev. 2015, 38, 1049–1067. [Google Scholar] [CrossRef]
  22. McKinnon, A.C.; Browne, M.; Whiteing, A. Green Logistics: Improving the Environmental Sustainability of Logistics, 3rd ed.; Kogan Page: Londo, UK, 2009; ISBN 978 0 7494 5678 8. [Google Scholar]
  23. Chauhan, C.; Kaur, P.; Arrawatia, R.; Ractham, P.; Dhir, A. Supply Chain Collaboration and Sustainable Development Goals (SDGs). Teamwork Makes Achieving SDGs Dream Work. J. Bus. Res. 2022, 147, 290–307. [Google Scholar] [CrossRef]
  24. FAO. SAFA (Sustainability Assessment of Food and Agriculture Systems) Guidelines, 1st ed.; Food and Agriculture Organization of the United Nations (FAO): Rome, France, 2014; ISBN 978-92-5-108485-4. [Google Scholar]
  25. United Nations Sustainable Development Goals: Resolution Adopted by the General. 2015. Available online: www.un.org/sustainabledevelopment (accessed on 25 September 2015).
  26. Xu, L.; Beamon, B.M. Supply Chain Coordination and Cooperation Mechanisms: An Attribute-Based Approach. J. Supply Chain Manag. 2006, 42, 4–12. [Google Scholar] [CrossRef]
  27. Guo, Y.; Yu, J.; Allaoui, H.; Choudhary, A. Lateral Collaboration with Cost-Sharing in Sustainable Supply Chain Optimisation: A Combinatorial Framework. Transp. Res. Part E Logist. Transp. Rev. 2022, 157, 102593. [Google Scholar] [CrossRef]
  28. Malone, T.W.; Crowston, K. The Interdisciplinary Study of Coordination. ACM Comput. Surv. 1994, 26, 87–119. [Google Scholar] [CrossRef]
  29. Nurhayati, K.; Tavasszy, L.; Rezaei, J. Joint B2B Supply Chain Decision-Making: Drivers, Facilitators and Barriers. Int. J. Prod. Econ. 2023, 256, 108721. [Google Scholar] [CrossRef]
  30. Aboueljinane, L.; Frichi, Y. A Simulation Optimization Approach to Investigate Resource Planning and Coordination Mechanisms in Emergency Systems. Simul. Model. Pract. Theory 2022, 119, 102586. [Google Scholar] [CrossRef]
  31. Accorsi, R.; Baruffaldi, G.; Manzini, R.; Tufano, A. On the Design of Cooperative Vendors’ Networks in Retail Food Supply Chains: A Logistics-Driven Approach. Int. J. Logist. Res. Appl. 2018, 21, 35–52. [Google Scholar] [CrossRef]
  32. Stock, G.N.; Greis, N.P.; Kasarda, J.D. Enterprise Logistics and Supply Chain Structure: The Role of Fit. J. Oper. Manag. 2000, 18, 531–547. [Google Scholar] [CrossRef]
  33. Huiskonen, J.; Pirttilä, T. Lateral Coordination in a Logistics Outsourcing Relationship. Int. J. Prod. Econ. 2002, 78, 177–185. [Google Scholar] [CrossRef]
  34. Mason, R.; Lalwani, C.; Boughton, R. Combining Vertical and Horizontal Collaboration for Transport Optimisation. Supply Chain Manag. Int. J. 2007, 12, 187–199. [Google Scholar] [CrossRef]
  35. Yuan, Y.; Viet, N.; Behdani, B. The Impact of Information Sharing on the Performance of Horizontal Logistics Collaboration: A Simulation Study in an Agri-Food Supply Chain. IFAC-Pap. 2019, 52, 2722–2727. [Google Scholar] [CrossRef]
  36. Kirono, I.; Armanu, A.; Hadiwidjojo, D.; Solimun, S. Logistics Performance Collaboration Strategy and Information Sharing with Logistics Capability as Mediator Variable (Study in Gafeksi East Java Indonesia). Int. J. Qual. Reliab. Manag. 2019, 36, 1301–1317. [Google Scholar] [CrossRef]
  37. Toptal, A.; Çetinkaya, B. How Supply Chain Coordination Affects the Environment: A Carbon Footprint Perspective. Ann. Oper. Res. 2017, 250, 487–519. [Google Scholar] [CrossRef]
  38. Brinkmann, D.; Lang, J.; Petersen, B.; Wognum, N.; Trienekens, J. Towards a Chain Coordination Model for Quality Management Strategies to Strengthen the Competitiveness of European Pork Producers. J. Chain Netw. Sci. 2011, 11, 137–153. [Google Scholar] [CrossRef]
  39. Chikán, A. Integration of Production and Logistics—In Principle, in Practice and in Education. Int. J. Prod. Econ. 2001, 69, 129–140. [Google Scholar] [CrossRef]
  40. Pyke, D.F.; Cohen, M.A. Performance Characteristics of Stochastic Integrated Production-Distribution Systems. Eur. J. Oper. Res. 1993, 68, 23–48. [Google Scholar] [CrossRef]
  41. Fugate, B.; Sahin, F.; Mentzer, J.T. Supply Chain Management Coordination Mechanisms. J. Bus. Logist. 2006, 27, 129–161. [Google Scholar] [CrossRef]
  42. Yang, P.C.; Wee, H.M. A Single-Vendor and Multiple-Buyers Production–Inventory Policy for a Deteriorating Item. Eur. J. Oper. Res. 2002, 143, 570–581. [Google Scholar] [CrossRef]
  43. Noorul Haq, A.; Kannan, G. Design of an Integrated Supplier Selection and Multi-Echelon Distribution Inventory Model in a Built-to-Order Supply Chain Environment. Int. J. Prod. Res. 2006, 44, 1963–1985. [Google Scholar] [CrossRef]
  44. Hwarng, H.B.; Chong, C.S.P.; Xie, N.; Burgess, T.F. Modelling a Complex Supply Chain: Understanding the Effect of Simplified Assumptions. Int. J. Prod. Res. 2005, 43, 2829–2872. [Google Scholar] [CrossRef]
  45. Huq, F.; Cutright, K.; Jones, V.; Hensler, D.A. Simulation Study of a Two-level Warehouse Inventory Replenishment System. Int. J. Phys. Distrib. Logist. Manag. 2006, 36, 51–65. [Google Scholar] [CrossRef]
  46. Lin, Z.; Chen, R.; Luo, L.; Ren, H. Research on Coordination of Fresh Supply Chain Considering Supplier Misreporting and Consumer Return. Sustainability 2024, 16, 6225. [Google Scholar] [CrossRef]
  47. Ramanathan, U. Performance of Supply Chain Collaboration—A Simulation Study. Expert Syst. Appl. 2014, 41, 210–220. [Google Scholar] [CrossRef]
  48. Boyacı, T.; Gallego, G. Coordinating Pricing and Inventory Replenishment Policies for One Wholesaler and One or More Geographically Dispersed Retailers. Int. J. Prod. Econ. 2002, 77, 95–111. [Google Scholar] [CrossRef]
  49. Cai, X.; Chen, J.; Xiao, Y.; Xu, X. Optimization and Coordination of Fresh Product Supply Chains with Freshness-Keeping Effort. Prod. Oper. Manag. 2010, 19, 261–278. [Google Scholar] [CrossRef]
  50. Rosca, E.; Rusca, F.; Rosca, M.A.; Rusca, A. Performance Analysis of Automated Parcel Lockers in Urban Delivery: Combined Agent-Based–Monte Carlo Simulation Approach. Logistics 2024, 8, 61. [Google Scholar] [CrossRef]
  51. Kaboudvand, S.; Montreuil, B. Simulation-Based Assessment of Hyperconnected Megacity Parcel Logistics. Logistics 2024, 8, 66. [Google Scholar] [CrossRef]
  52. Aslam, T.; Ng, A. Agent-Based Simulation and Simulation-Based Optimisation for Supply Chain Management. In Enterprise Networks and Logistics for Agile Manufacturing; Wang, L., Koh, S.C.L., Eds.; Springer: London, UK, 2010; pp. 227–247. ISBN 978-1-84996-244-5. [Google Scholar]
  53. Van der Vorst, J.G.; da Silva, C.; Trienekens, J.H. Agro-Industrial Supply Chain Management: Concepts and Applications; Agricultural Management Marketing and Finance Occasional Paper; FAO: Rome, Italy, 2007; Volume 17, ISBN 978-92-5-105831-2. [Google Scholar]
  54. Luna Acosta, A.; Ortiz, C.; Corrales, E.; Sarmiento López, A.; Nieto, O.; Restrepo, S. Caracterización Socioecológica de Las Tres Ventanas Piloto de Humedales Ciénaga de Zapatosa, Ciénaga de La Virgen, Paz de Ariporo-Hato Corozal; Pontificia Universidad Javeriana: Bogotá, Colombia; Instituto de Investigación de Recursos Biológicos Alexander von Humboldt: Bogotá, Colombia, 2015. [Google Scholar]
  55. Nieto Moreno, O. Propuesta de Limite Del Humedal En La Ventana Piloto Ciénaga de Zapatosa. In Convenio Interadministrativo 13-014 (FA 005 de 2013), Equipo Humedales Fondo Adaptación; Instituto de Investigación de Recursos Biológicos Alexander von Humboldt—Fondo de Adaptación: Bogotá, Colombia, 2016. [Google Scholar]
  56. Castaño-Barreto, A.C.; Jaramillo-Cruz, C.A.; Molina Benavides, R.A.; Atzori, A.S. Scenarios of Sustainable Fishing in the Zapatosa Marsh (Colombia) Simulated with a System Dynamics Model. Sustainability 2020, 12, 3458. [Google Scholar] [CrossRef]
  57. Ministerio de Transporte Resolución 4100 de 2004 Ministerio de Transporte. Por La Cual Se Adoptan Los Límites de Pesos y Dimensiones En Los Vehículos de Transporte Terrestre Automotor de Carga Por Carretera, Para Su Operación Normal En La Red Vial a Nivel Nacional. Available online: https://www.alcaldiabogota.gov.co/sisjur/normas/Norma1.jsp?i=15600 (accessed on 23 January 2025).
  58. Li, Y.; Xu, L. Cybersecurity Investments in a Two-Echelon Supply Chain with Third-Party Risk Propagation. Int. J. Prod. Res. 2021, 59, 1216–1238. [Google Scholar] [CrossRef]
  59. Liu, L.; Huang, N.; Qian, Q.; Zhao, Y.; Yang, T.; Han, C. Coordination and Optimization Decision of Assembly Building Supply Chain under Supply Disruption Risk. Int. J. Ind. Eng. Comput. 2024, 15, 909–930. [Google Scholar] [CrossRef]
  60. Galbreath, J.; Georgiou, K.; Oloruntoba, R. Intention to Use Collaborative Transportation Among SMEs: An Exploratory Investigation of the Wine Industry. J. Small Bus. Strategy 2022, 32, 128–141. [Google Scholar] [CrossRef]
  61. Ren, H.; Hu, Y. Coordination of Online Shopping Supply Chain Considering Fresh Product Preservation Efforts and Cargo Damage Costs. J. Theor. Appl. Electron. Commer. Res. 2024, 19, 1337–1357. [Google Scholar] [CrossRef]
  62. Borshchev, A. The Big Book of Simulation Modeling: Multimethod Modeling with AnyLogic 6: Amazon.Com: Books, 1st ed.; Lightning Source Inc.: La Vergne, TN, USA, 2013; ISBN 978-0-9895731-7-7. [Google Scholar]
  63. Ghezavati, V.; Nia, N.S. Development of an Optimization Model for Product Returns Using Genetic Algorithms and Simulated Annealing. Soft Comput. 2015, 19, 3055–3069. [Google Scholar] [CrossRef]
  64. Roghanian, E.; Pazhoheshfar, P. An Optimization Model for Reverse Logistics Network under Stochastic Environment by Using Genetic Algorithm. J. Manuf. Syst. 2014, 33, 348–356. [Google Scholar] [CrossRef]
  65. Morganti, E. Urban Food Planning and City Logistics for Food Products: New Solutions for the Last Food Mile; CIHEAM Briefing Notes; International Centre for Advanced Mediterranean Agronomic Studies: Paris, France, 2013. [Google Scholar]
  66. Aguado-Gragera, C.; Sama-Berrocal, C.; Mesías, F.J.; Crespo-Cebada, E.; Diaz-Caro, C. Challenges and Opportunities of Short Food Supply Chains in Spain: A Stakeholder Participatory Study. J. Agric. Food Res. 2024, 18, 101276. [Google Scholar] [CrossRef]
  67. Fawcett, S.E.; McCarter, M.W.; Fawcett, A.M.; Webb, G.S.; Magnan, G.M. Why Supply Chain Collaboration Fails: The Socio-Structural View of Resistance to Relational Strategies. Supply Chain Manag. Int. J. 2015, 20, 648–663. [Google Scholar] [CrossRef]
Figure 1. Geographical layout of the citrus fruit supply chain in northern Colombia, supplying markets in Barranquilla, Bogotá, Cartagena, Santa Marta, and Valledupar.
Logistics 09 00030 g001
Figure 2. Overview of the current logistics distribution. The current logistics distribution relies on single distribution through middlemen, who purchase the harvest in bulk from farmers and resell it to retailers or food service providers.
Logistics 09 00030 g002
Figure 3. Overview of the joint-consolidation scenario. Farmers jointly consolidate the harvests at ASOCITRICOS’s food hub, incorporating transportation costs into the selling price. ASOCITRICOS sets the price and sells to middlemen, who then distribute to customers, assuming full liability for their loads.
Logistics 09 00030 g003
Figure 4. Overview of the joint-consolidation–distribution scenario. Farmers and ASOCITRICOS jointly consolidate harvests at the food hub for direct distribution to customers, eliminating middlemen. ASOCITRICOS sets prices, markets the harvest, and manages centralized logistics, assuming delivery liability.
Logistics 09 00030 g004
Figure 5. Farmer agent state chart in the base scenario.
Logistics 09 00030 g005
Figure 6. Middleman agent state chart in the base scenario.
Logistics 09 00030 g006
Figure 7. Normalized Staytime and total logistics costs (Cost) as functions of the number of three-axle trucks. COP: Colombian Peso.
Logistics 09 00030 g007
Table 2. Study parameters. The values of the parameters were derived from raw data collected during fieldwork. COP: Colombian Peso.
SymbolDescriptionValue
n The number of two-axle trucks2
m The number of three-axle trucks6
x j   [ lat , long ] The location of the j-th farmer Twenty-one coordinates
x c   [ lat ,   long ] The location of the c-th customer Seven coordinates
W   [ ton ] The total annual harvest produced by the supply chain634
w m a x , 2   [ ton ] The maximum load capacity of the 2-axle truck6
w m a x , 3   [ ton ] The maximum load capacity of the 3-axle truck7
D c   [ ton ] The total annual harvest demanded by the c-th customer634
P w [COP]The average price of citrus fruits per unit (ton) in the supply chainCOP 536,405
C o s t m a i n t , 2 [ C O P ] The maintenance cost per year of the two-axle trucksCOP 11,221,775
C o s t m a i n t , 3   [COP]The maintenance cost per year of the three-axle trucksCOP 11,221,775
C o s t u n p r e d [ C O P ] Unpredictable and varied costs associated with the consolidation and distribution of the harvest10% Cost
F [COP]The fuel price per gallonCOP 9000
s f u e l , 3 [km]The estimated distance traveled per gallon by the three-axle truck16 km
s f u e l , 2 [km]The estimated distance traveled per gallon by the two-axle truck16 km
C o s t u t i l i t y   [ C O P ] The annual utility expenses related with the consolidation and distribution of the harvest (e.g., electricity, water, and gas)COP 6,316,000
C o s t l a b o r   [ C O P ] The total wages paid to employees working at the food hubCOP 3,500,000
W F H   [ t o n ] The maximum storage capacity (in tons) of the food hub for the harvest40
T l o a d i n g , 2   [ h ] The average loading time (in hours) of a two-axle truck for the harvest1
T l o a d i n g , 3   [ h ] The average loading time (in hours) of a three-axle truck for the harvest1.2
T u n l o a d i n g , 3   [ h ] The average unloading time (in hours) of a two-axle truck for the harvest0.5
T u n l o a d i n g , 3   [ h ] The average unloading time (in hours) of a three-axle truck for the harvest0.8
v m a x , 2   [ k m / h ] The maximum speed (in kilometers per hour) of a two-axle truck60
v m a x , 3   [ k m / h ] The maximum speed (in kilometers per hour) of a three-axle truck60
Table 3. Study variables. COP: Colombian Peso.
SymbolDescription
T   h The total simulation time to collect and distribute the entire production within the system
s q , 3   h The distance traveled by the q-th three-axle truck
s p , 2   h The distance traveled by the p-th two-axle truck
t i , q , 3   h The time spent by the q-th three-axle truck at the i-th state
t i , p , 2   h The time spent by the p-th two-axle truck at the i-th state
w q , 2   t o n The harvest load transported by the p-th two-axle truck during the travel state
w q , 3   [   t o n   ] The harvest load transported by the q-th three-axle truck during the travel state
t e x i t , k   h The time at which the k-th unit of harvest reaches the customer location
t i n p u t , k   h The time at which the k-th unit of harvest departs from the farm
S 2   k m The total distance traveled by the two-axle trucks
S 3   k m The total distance traveled by the three-axle trucks
t i , p , 2   k m The time spent by the p-th two-axle truck at the i-th state
t i , q , 3   k m The time spent by the p-th three-axle truck at the i-th state
T P i , p , 2   k m The time percentage spent by the p-th two-axle truck at the i-th state
T P i , q , 3   k m The time percentage spent by the p-th three-axle truck at the i-th state
S t a y T i m e c     h   The StayTime of the harvest demanded by the c-th customer
R q , 3 The proportion of the total load capacity used by the q-th three-axle truck at the load state
REV  [ C O P ] The total revenue
C o s t D i s t   [ C O P ] The total distribution costs
C o s t s t o r a g e   [ C O P ] The total storage costs
C o s t m a i n t   [ C O P ] The total truck maintenance costs
C o s t   [ C O P ] Total logistics costs
G P M Gross profit margin
Table 4. Agent description and attributes.
AgentAttributeTypeDescription
FarmerLocationNumericalGeographic location of the farmer
Load NumericalThe load of harvest produced by farmers (in tons)
Food HubCapacityNumericalTotal harvest capacity (in tons) that the food hub can handle
StateCategorical (full/empty)State in which the food hub is at a specific time
CustomerLocationNumericalGeographic location of the customer
LoadNumericalThe load of harvest required by customer farmer (in tons)
Vehicle OwnerStringOwner of the vehicle (i.e., ASOCITRICOS or Middlemen)
TypeCategoricalType of the truck (i.e., two-axle or three-axle)
StateCategoricalState in which the vehicle was at a specific time (i.e., idle, travel loaded, travel unloaded, waiting, among others).
Loading timeNumericalTime spent loading a ton of citrus in the vehicle
Unloading timeNumericalTime spent unloading a ton of citrus out of the vehicle
DestinationNumericalVehicle’s destination (customers’ geographical locations) for delivering the load
CapacityNumericalTotal harvest capacity (in tons) that the vehicle can carry per travel
Table 5. Efficiency key performance indicators (KPIs) across the scenarios. N/A: “Not applicable”.
Indicator DescriptionSingle-DistributionJoint-ConsolidationJoint-Consolidation-Distribution
s t o t a l , 2   k m N/A56.3857.21
s t o t a l , 3   k m 107,660.00104,205.00105,392.00
T P l o a d e d _ t r a v e l , m e a n , 3   % 56.78%41.83%57.22%
T P e m p t y _ t r a v e l , m e a n , 3   % 21.71%40.71%25.34%
T P l o a d i n g , m e a n , 3   % 10.46%7.12%7.16%
T P i d l e , m e a n , 3   % 5.6%3.24%3.25%
T P u n l o a d i n g , m e a n , 3   % 10.46%7.09%7.02%
R m e a n , 3   % 50.24%29.55%42.40%
S t a y T i m e   h 123.06135.34125.06
Table 6. Financial key performance indicators (KPIs) across the scenarios. Costs are reported in COP per year. KPIs were calculated from the farmers and ASOCITRICOS perspective. COP: Colombian Peso.
Indicator DescriptionSingle-DistributionJoint-ConsolidationJoint-Consolidation-Distribution
C o s t D i s t   [ C O P ] Not assumed by association Not assumed by association COP 59,283,073.00
C o s t s t o r a g e   [ C O P ]  1Individual cost borne by farmerCOP 9,816,000COP 9,816,000.00
C o s t m a i n t   [ C O P ]  2Not assumed by association Not assumed by associationCOP 67,330,650.00
C o s t u n p r e d [ C O P ] COP 0COP 981,600.00COP 13,642,972.00
C o s t   [ C O P ] COP 0COP 10,797,600.00COP 150,072,695.00
REV   [ C O P ] COP 340,081,000.00COP 408,097,200.00COP 680,162,000.00
G P M COP 340,081,000.00 COP 397,299,600.00COP 530,089,305.00
1 Based on ASOCITRICOS’s reports, this cost included the construction of the food hub, the building itself, and various operational expenses. 2 In Colombia, annual maintenance cost was estimated at EUR 2500 per truck in 2023, or approximately COP 11 million.
Table 7. Sensitivity analysis of the number of three-axle trucks (m). All the scenarios were simulated with ±2 vehicles from the nominal value of this parameter, representing a change of ±33.34%. COP: Colombian Peso.
Indicator DescriptionSingle-Distribution 4 Trucks
(−33%)
Single-Distribution 6 TrucksSingle-Distribution 8 Trucks (+33%)Joint- Consolidation 4 Trucks
(−33%)
Joint- Consolidation 6 TrucksJoint-Consolidation 8 Trucks (+33%)Joint-Consolidation-Distribution 4 Trucks (−33%)Joint-Consolidation-Distribution 6 TrucksJoint-Consolidation-Distribution 8 Trucks (+33%)
Efficiency
s t o t a l , 2   h N/AN/AN/A75.5956.3858.0573.9257.2152.62
s t o t a l , 3   h 85,848.44107,659.8113,683.04100,096.26104,205.38128,139.1491,072.28105.392.13118,920.84
T P l o a d e d t r a v e l , m e a n , 3 % 50.05%56.78%55.73%41.99%41.83%42.17%55.02%57.22%52.87%
T P e m p t y _ t r a v e l , m e a n , 3   % 23.37%21.71%18.48%41.30%40.71%41.88%26.60%25.34%30.29%
T P l o a d i n g , m e a n , 3   % 12.25%10.46%9.35%7.46%7.12%5.96%8.20%7.16%6.43%
T P i d l e , m e a n , 3   % 2.08%5.6%7.10%2.00%3.24%4.10%2.17%3.25%4.22%
T P u n l o a d i n g , m e a n , 3   % 12.25%10.46%9.35%7.25%7.09%5.89%8.02%7.02%6.18%
R m e a n , 3   % 51.93%50.24%51.07%31.04%29.55%23.96%48.32%42.40%34.38%
S t a y T i m e   h 161.06123.06102.68174.57135.34122.86168.02125.06110.28
Financial
C o s t D i s t   [ C O P ] Not assumed by association Not assumed by association Not assumed by association Not assumed by association Not assumed by association Not assumed by association COP 51,228,158COP 59,283,073COP 66,892,973
C o s t s t o r a g e   [ C O P ] Cost borne by each farmerCost borne by each farmerCost borne by each farmerCOP 9,816,000COP 9,816,000COP 9,816,000COP 9,816,000COP 9,816,000COP 9,816,000
C o s t m a i n t   [ C O P ] Not assumed by association Not assumed by association Not assumed by association Not assumed by association Not assumed by association Not assumed by association COP 44,887,100COP 67,330,650COP 89,774,200
C o s t u n p r e d   [ C O P ] COP 0COP 0COP 0COP 981,600.00COP 981,600.00COP 981,600.00COP 10,593,126COP 13,642,972COP 16,648,317
C o s t   [ C O P ] COP 0COP 0COP 0COP 10,797,600.00COP 10,797,600.00COP 10,797,600.00COP 116,524,383COP 150,072,695COP 183,131,490
REV   [ C O P ] COP 340,081,000COP 340,081,000COP 340,081,000COP 408,097,200COP 408,097,200COP 408,097,200COP 680,162,000COP 680,162,000COP 680,162,000
G P M   COP 340,081,000COP 340,081,000COP 340,081,000COP 397,299,600COP 397,299,600COP 397,299,600COP 563,637,617COP 530,089,305COP 497,030,510
Table 8. Sensitivity analysis of the maximum load capacity of three-axle trucks (wmax,3). All the scenarios were simulated with ±2 tons from the nominal value of this parameter, representing a change of ±28.57%. COP: Colombian Peso.
Indicator DescriptionSingle-Distribution 5 Ton (−28%)Single-Distribution 7 Ton Single-Distribution 9 Ton (+28%)Joint-Consolidation 5 Ton (−28%)Joint-Consolidation 7 Ton Joint-Consolidation 9 Ton (+28%)Joint-Consolidation-Distribution —5 Ton (−28%)Joint-Consolidation-Distribution 7 Ton Joint-Consolidation-Distribution 9 Ton (+28%)
Efficiency
s t o t a l , 2   h N/AN/AN/A74.7556.3855.5479.3457.2153.04
s t o t a l , 3   h 123,974.99107,659.8114,178.26128,871.52104,205.3888,382.86117,169.77105,392.1391,597.55
T P l o a d e d t r a v e l , m e a n , 3 % 60.39%56.78%54.95%43.60%41.83%34.64%53.40%57.22%51.41%
T P e m p t y _ t r a v e l , m e a n , 3   % 25.97%21.71%14.31%42.94%40.71%33.86%31.76%25.34%17.50%
T P l o a d i n g , m e a n , 3   % 6.00%10.46%12.26%5.42%7.12%14.57%5.96%7.16%14.87%
T P i d l e , m e a n , 3   % 1.63%5.6%6.22%2.81%3.24%3.27%3.05%3.25%3.64%
T P u n l o a d i n g , m e a n , 3   % 6.00%10.46%12.26%5.22%7.09%14.45%5.82%7.02%13.78%
R m e a n , 3   % 53.30%50.24%49.76%32.67%29.55%29.09%45.60%42.40%47.15%
S t a y T i m e   h 131.55123.06140.6154.46135.34135.78140.56125.06137.38
Financial
C o s t D i s t   [ C O P ] Not assumed by association Not assumed by association Not assumed by association Not assumed by association Not assumed by association Not assumed by association COP 65,907,996COP 59,283,073COP 51,274,395
C o s t s t o r a g e   [ C O P ] Cost borne by each farmerCost borne by each farmerCost borne by each farmerCOP 9,816,000COP 9,816,000COP 9,816,000COP 9,816,000COP 9,816,000COP 9,816,000
C o s t m a i n t   [ C O P ] Not assumed by association Not assumed by association Not assumed by association Not assumed by association Not assumed by association Not assumed by association COP 67,330,650COP 67,330,650COP 67,330,650
C o s t u n p r e d [ C O P ] COP 0COP 0COP 0COP 981,600COP 981,600COP 981,600COP 14,305,465COP 13,642,972COP 12,842,105
C o s t   [ C O P ] COP 0COP 0COP 0COP 10,797,600COP 10,797,600COP 10,797,600COP 157,360,110COP 150,072,695COP 141,263,150
REV   [ C O P ] COP 340,081,000COP 340,081,000COP 340,081,000COP 408,097,200COP 408,097,200COP 408,097,200COP 680,162,000COP 680,162,000COP 680,162,000
G P M COP 340,081,000COP 340,081,000COP 340,081,000COP 397,299,600COP 397,299,600COP 397,299,600COP 522,801,890COP 530,089,305COP 538,898,851
Table 9. Sensitivity analysis of the fuel price (F). All the scenarios were simulated with ±20% from the nominal value of this parameter. COP: Colombian Peso.
Indicator DescriptionSingle-DistributionJoint-Consolidation Joint-Consolidation-Distribution −20% Fuel Price/GallonJoint- Consolidation-Distribution Joint-Consolidation-Distribution +20% Fuel Price/Gallon
Efficiency
s t o t a l , 2   h N/A56.00 km57.00 km57.21 km57.00 km
s t o t a l , 3   h 107,660.00 km104,205.00 km105,392.00 km105,392.00 km105,392.00 km
T P l o a d e d _ t r a v e l , m e a n , 3   % 21.71%40.72%57.22%57.22%57.22%
T P e m p t y _ t r a v e l , m e a n , 3   % 51.78%41.83%25.34%25.34%25.34%
T P l o a d i n g , m e a n , 3   % 10.46%7.12%7.16%7.16%7.16%
T P i d l e , m e a n , 3   % 10.46%7.09%7.03%7.03%7.03%
T P u n l o a d i n g , m e a n , 3   % 5.60%3.24%3.25%3.25%3.25%
R m e a n , 3   % 50.24%29.55%42.40%42.40%42.40%
S t a y T i m e   h 123.00 h135.00 h125.00 h125.00 h125.00 h
Financial
C o s t D i s t   [ C O P ] Not assumed by association Not assumed by association COP 47,426,459COP 59,283,073COP 71,139,688
C o s t s t o r a g e   [ C O P ] Cost borne by each farmerCOP 9,816,000COP 9,816,000COP 9,816,000COP 9,816,000
C o s t m a i n t   [ C O P ] Not assumed by association membersNot assumed by association membersCOP 67,330,650COP 67,330,650COP 67,330,650
C o s t u n p r e d   [ C O P ] COP 0COP 981,600COP 12,457,311COP 13,642,972COP 14,828,634
C o s t   [ C O P ] COP 0COP 10,797,600COP 137,030,419COP 150,072,695COP 163,114,972
REV [ C O P ] COP 340,081,000COP 408,097,200COP 680,162,000COP 680,162,000COP 680,162,000
G P M   COP 340,081,000COP 397,299,600COP 543,131,581COP 530,089,305COP 517,047,028
Disclaimer/Publisher’s Note: The statements, opinions and data contained in all publications are solely those of the individual author(s) and contributor(s) and not of MDPI and/or the editor(s). MDPI and/or the editor(s) disclaim responsibility for any injury to people or property resulting from any ideas, methods, instructions or products referred to in the content.

