Article

Design of a Remanufacturing Line Applying Lean Manufacturing and Supply Chain Strategies

by
Rosa Hilda Félix-Jácquez
1,2,
Óscar Hernández-Uribe
3,*,
Leonor Adriana Cárdenas-Robledo
4 and
Zaida Antonieta Mora-Alvarez
5
1
Posgrado CIATEQ A.C., Av. del Retablo #150, Constituyentes-Fovissste, Queretaro 76150, Mexico
2
Tecnológico Nacional de México, Tecnológico S/N, Col. Unidad, San Luis Potosi 78436, Mexico
3
CIATEQ A.C., Av. Manantiales #23-A, Parque Industrial Bernardo Quintana, Queretaro 76246, Mexico
4
CIATEQ A.C., Parque Industrial Tabasco Business Center, Tabasco 86693, Mexico
5
Freelance in Industrial Engineering, Aguascalientes 20218, Mexico
*
Author to whom correspondence should be addressed.
Logistics 2025, 9(1), 33; https://doi.org/10.3390/logistics9010033
Submission received: 24 December 2024 / Revised: 4 February 2025 / Accepted: 12 February 2025 / Published: 20 February 2025

Abstract

:
Background: Remanufacturing products for sustainability involves layout and production planning, tools and equipment, material arrangement and handling, inventory management, technology integration, and more. This study presents an empirical vision through a discrete event simulation (DES) model integrating lean manufacturing (LM) and supply chain (SC) strategies with industry 4.0 (I4.0) technologies, applied to a case in a railway company. Methods: The work presents scenarios following a methodology with an incremental approach to implement strategies of lean manufacturing (LM) and supply chain (SC) in the context of I4.0 and their effects represented in DES models with applicability in remanufacturing and production line management. Five simulation scenarios were analyzed according to strategies layered incrementally. Results: Behaviors and outcomes were compared across the scenarios considering the remanufactured engines, percentage of process time, human labor occupation, and the statistical analysis of the process capability. Scenario five achieved the objective of remanufacturing 40 engines in one year with a cycle time of 214.45 h. Conclusions: The purpose was to design an engine remanufacturing line incorporating LM and SC strategies via a DES model, highlighting the importance of their gradual adoption toward I4.0 implementation. The integration of previous strategies improves flexibility and productivity in manufacturing processes.

1. Introduction

The evolving manufacturing environments drive rapid technological advances to handle resources efficiently, optimize processes, and innovate products to increase sustainability [1]. Remanufacturing is a cornerstone of sustainability and plays a key role in the circular economy [2]. It includes cleaning, repairing, and replacing components for disassembling and restoring used products to meet or exceed original specifications [3]. Remanufacturing is a recovery strategy to return used products to their original state with minimal material waste and energy [4], extend equipment life, increase fuel efficiency, and reduce customers’ costs [5].
Notwithstanding, when designing a new product, companies should consider a remanufacturing line or processes (e.g., ease of disassembly), select business models that support product return rates, and participate in a circular economy system [6]. The design of a remanufacturing line involves several key aspects, such as layout and production planning, which includes layout optimization, tools and equipment, material arrangement and handling, inventory management, and technology integration, among others [7,8]. Nevertheless, remanufacturing operations (e.g., inventory management) are complicated due to the high uncertainty of what parts are recovered [9]. In this vein, the life cycle inventory of a remanufactured diesel engine supplies significant reductions in energy, natural resources consumption, and environmental emissions. A remanufactured engine requires fewer new parts and less manufacturing than a new engine and is more labor-intensive rather than energy-intensive [10]. In addition, when designing a remanufacturing line, it is essential to adopt key enabling technologies for Industry 4.0 (I4.0) that contribute toward manufacturing excellence and the digital transformation of industries [11].
I4.0 technologies, such as simulation and the Internet of Things (IoT), support pervasive digitalization [12] and drive performance enhancement with recognized benefits by manufacturers [13]. Lean manufacturing (LM) is a set of production management principles and techniques that add value to the final products by reducing waste in the processes [14] and eradicating unnecessary activities to product quality or function [15]. The link between LM and I4.0 practices enables higher grades of operational excellence (e.g., financial control, workload optimization, and machinery efficiency) [16]. These approaches reveal a positive correlation, particularly in methods oriented to logistics and quality [17].
The supply chain (SC) satisfies customers’ needs by facilitating and distributing options to procure materials and their transformation into products [18]. It has undergone globalization, embracing I4.0 to address challenges, such as transparency and traceability [19], optimization of processes, and product innovation [20]. In addition, green supply chain management (GSCM) improves processes, product performance, and environmental impact [21]. I4.0 fosters sustainability and a circular economy to connect physical and information flows for environmental uncertainty [22]. Thus, the digital transformation of the SC enriches the adoption of LM practices, such as Kanban, just-in-time, value stream mapping (VSM), total predictive maintenance (TPM), and the 5S techniques [23].
Companies make decisions about the course of actions concerning production (e.g., plant capacity), inventory (e.g., an optimal buffer against uncertainty), location (e.g., facilities), transportation (e.g., movement among locations), and information (e.g., data collection and sharing) [24]. In this context, the discrete event simulation (DES) offers tools and techniques for experimenting with and validating products, processes, system designs, and configurations [25]. DES models capture an abstraction or simplified representation of a complex system [26]. Furthermore, the user can design ad hoc strategies to estimate outcomes in a manufacturing environment [27]. Hence, DES supports decision making to assess the benefits and risks of remanufacturing operations and minimize time with the potential to reduce costs [28].
This work stresses the need to reveal strategies for remanufacturing approaches by integrating LM and SC systems assisted by I4.0 technologies. The motivation lies in addressing challenges undergoing an engineering project implementation by a railway company to support the circular economy of diesel engines. The contribution of this endeavor is twofold. First, it provides a practical demonstration of applying manufacturing strategies through DES to optimize the production process and transfer knowledge, offering insights, potential benefits, and challenges. Second, it adds to the body of knowledge toward I4.0 implementation via modernization efforts, and based on these findings, small and medium enterprises (SMEs) may formulate strategies to implement I4.0 technologies.
The article’s organization is as follows. Section 1 describes the context of LM, SC, and I4.0. Section 2 presents a background on the research topics. Section 3 exposes the methodology used, and Section 4 delivers a proof of concept. Section 5 discloses the results, Section 6 delves into the discussion, and Section 7 provides the conclusions.

2. Related Works

The I4.0 revolution is impacting the performance of many industries [29]. Hence, numerous research endeavors focus on LM and SC to employ I4.0 technologies and enhance companies’ performance by delivering methodologies, frameworks, and tools [30,31,32]. This section explores articles highlighting remanufacturing aspects that could be addressed with LM and SC using DES and identifies strategies to offer valuable insights toward I4.0 implementation.
Zhang et al. [33] focused on remanufacturing high-value end-of-life auto parts, such as engines, to maximize their reuse potential. They implement a blockchain as a service platform to ensure transparency and traceability throughout the supply chain. Guchhait and Sarkar [34] studied a flexible production system combined with fourth-party logistics out sourcing to manage deteriorating products. They focused on refrigeration-enabled logistics to reduce deterioration during transportation. Guchhait et al. [35] investigated a smart production system combining renewable energy and RFID technology to improve energy efficiency and material requirement planning in a logistics framework. Sarkar and Bhuniya [36] validated an efficient remanufacturing inventory model under variable demand with flexible production rates to optimize total profit by integrating green investment. Dey et al. [37] minimized the work-in-process (WIP) inventory through an autonomation policy to perform an error-free inspection by detecting imperfect items from the production process.
The LM fosters a culture of continuous improvement and waste reduction. Midilli and Elevli [38] suggested a simulation-based optimization method for transitioning to future states in LM, showcasing a 50% reduction in stock and machine allocation in a tobacco company. Pekarcikova et al. [39] created a simulation model to test the lean production concept of Milk run, improving logistic flows in the automotive industry. Trebuna et al. [40] deployed a DES simulation model to optimize material and information flows in a manufacturing system using VSM and Kanban cards. Similarly, Aksar et al. [41] presented a model using LM principles to analyze the implementation of VSM, identifying bottlenecks in the centering and tapering processes. Afy-Shararah and Salonitis [42] created a hybrid model using a stock and flow diagram solved by system dynamics and a DES model to replicate existing VSM.
In addition, Possik et al. [43] employed simulation to explore the impact of LM techniques (e.g., Poka Yoke and 5S) integration across various contexts: market fluctuations, demand diversification, and resource uncertainty. Martinez and Ahmad [44] built a DES model to support decision making using LM principles and probabilistic defect propagation. Tomaszewska [45] utilized simulation to compare LM and the theory of constraints. The drum–buffer–rope (DBR) method was more cost-effective than Kanban for managing production processes. Abd Rahman et al. [46] proposed a framework integrating LM and I4.0 through a model-driven decision support system for the food industry, enhancing the processes using the overall equipment effectiveness data. Likewise, Ferreira et al. [47] implemented a framework using VSM, DES, and agent-based modeling to analyze I4.0 production scenarios in an SME.
Strategies aimed at improving processes are centered on digital technologies to enhance the efficiency and productivity of systems. Mahdiraji et al. [48] found that big data (BD) and digital platforms facilitate moving toward a lean, agile, resilient, and sustainable SC, which applies to other industrial sectors such as the pharmaceutical.
Machado et al. [49] stated that developing sustainable aspects in business models, circular production systems, SC, product design, and policies contributes toward I4.0 implementation. Javaid et al. [50] applied VSM and IoT strategies associated with Lean 4.0 to innovate manufacturing industries and promote their capabilities in waste reduction. Also, Korchagin et al. [51] proposed a simulation process methodology and aircraft flow chart to improve the quality of maintenance, repair, and overhaul operations by integrating LM and I4.0. In this context, Sarker et al. [52] identified 22 barriers to implementing GSCM practices in the footwear industry, revealing that management commitment, financial constraints, and the lack of eco-friendly materials are primary concerns that affect sustainability strategies.
Moreover, Contini et al. [53] built a tool for a corporate SC using virtual reality (VR) and augmented reality (AR) to support data visualization through dashboards. They evaluate environmental, social, and governance data to promote green design products. Pattanaik [54] balanced agility and leanness in SC, employing DES to identify the optimal production rate and meet the dynamic demand while minimizing stock inventories. Likewise, Gurbuz et al. [55] explored how SMEs can mitigate SC risks post-COVID-19 via simulation. They stress the effectiveness of network configuration strategies (collaboration and multi-sourcing) to overcome these risks. Wei [56] designed a multi-agent GSCM system for retailers with a three-layer hierarchical evaluation index to gauge SC greenness. The author remarked on green strategies to optimize profits and integrate environmental factors into decision making.
The ensuing studies developed methodological frameworks to support companies toward I4.0. Rashad and Nedelko [57] focused on lean strategies for SC and their sustainability, providing a tool for global cooperation business. In addition, Yadav et al. [58] identified I4.0 enablers with five categories for sustainability adoption: information technology, SC, organizational and social, managerial and economical, and environmental. Abideen et al. [59] proposed a real-time digital twin (DT) integrating SC and logistics as input of a simulation model. It uses reinforced learning to replicate problematic scenarios and responses to overcome them. Whereas Schulze and Dallasega [60] classified classic losses in engineer-to-order companies, mapping LM and I4.0 technologies to diminish them and improve productivity.
The scope of this work focuses on the context of a railway domain. In this regard, the manufacturing of modern locomotives has changed in the last 20 years, incorporating models and simulations such as a DT [61]. Daniyan et al. [62] simulated a flexible manufacturing system, including the assembly line, lean production, logistics, and quality assurance, to drive performance under different operating and load conditions. Ricondo et al. [63] proposed a DT framework, which is implemented in a manufacturing line of railway axles for design and operation tasks to understand and improve shop performance. Similarly, Magnanini and Tolio [64] applied a DT model for tactical decisions in responsiveness and improvement in manufacturing systems in an axle production company. Liebrecht et al. [65] delivered a tailored strategy for a company toward I4.0, considering production typology, scenarios, and simulation.
The above works reported LM strategies such as VSM, single-minute exchange of die (SMED), Kanban, just in time (JIT), overall equipment effectiveness (OEE), TPM, Poka-Yoke, DBR, and 5s. Further, SC includes enterprise resource planning (ERP), GSCM, supplier management (SM), logistics, and sustainable models (SMo). I4.0 comprises IoT, BD, robotics, cyber–physical systems (CPS), artificial intelligence (AI), DT, cloud computing (CC), AR, and VR. Table 1 depicts works classified by LM, SC, and I4.0, with the strategy cited. Regardless, there is a gap in the literature about LM, SC, and I4.0 strategies applied to the railway domain, contrasting theory with practical implementation.

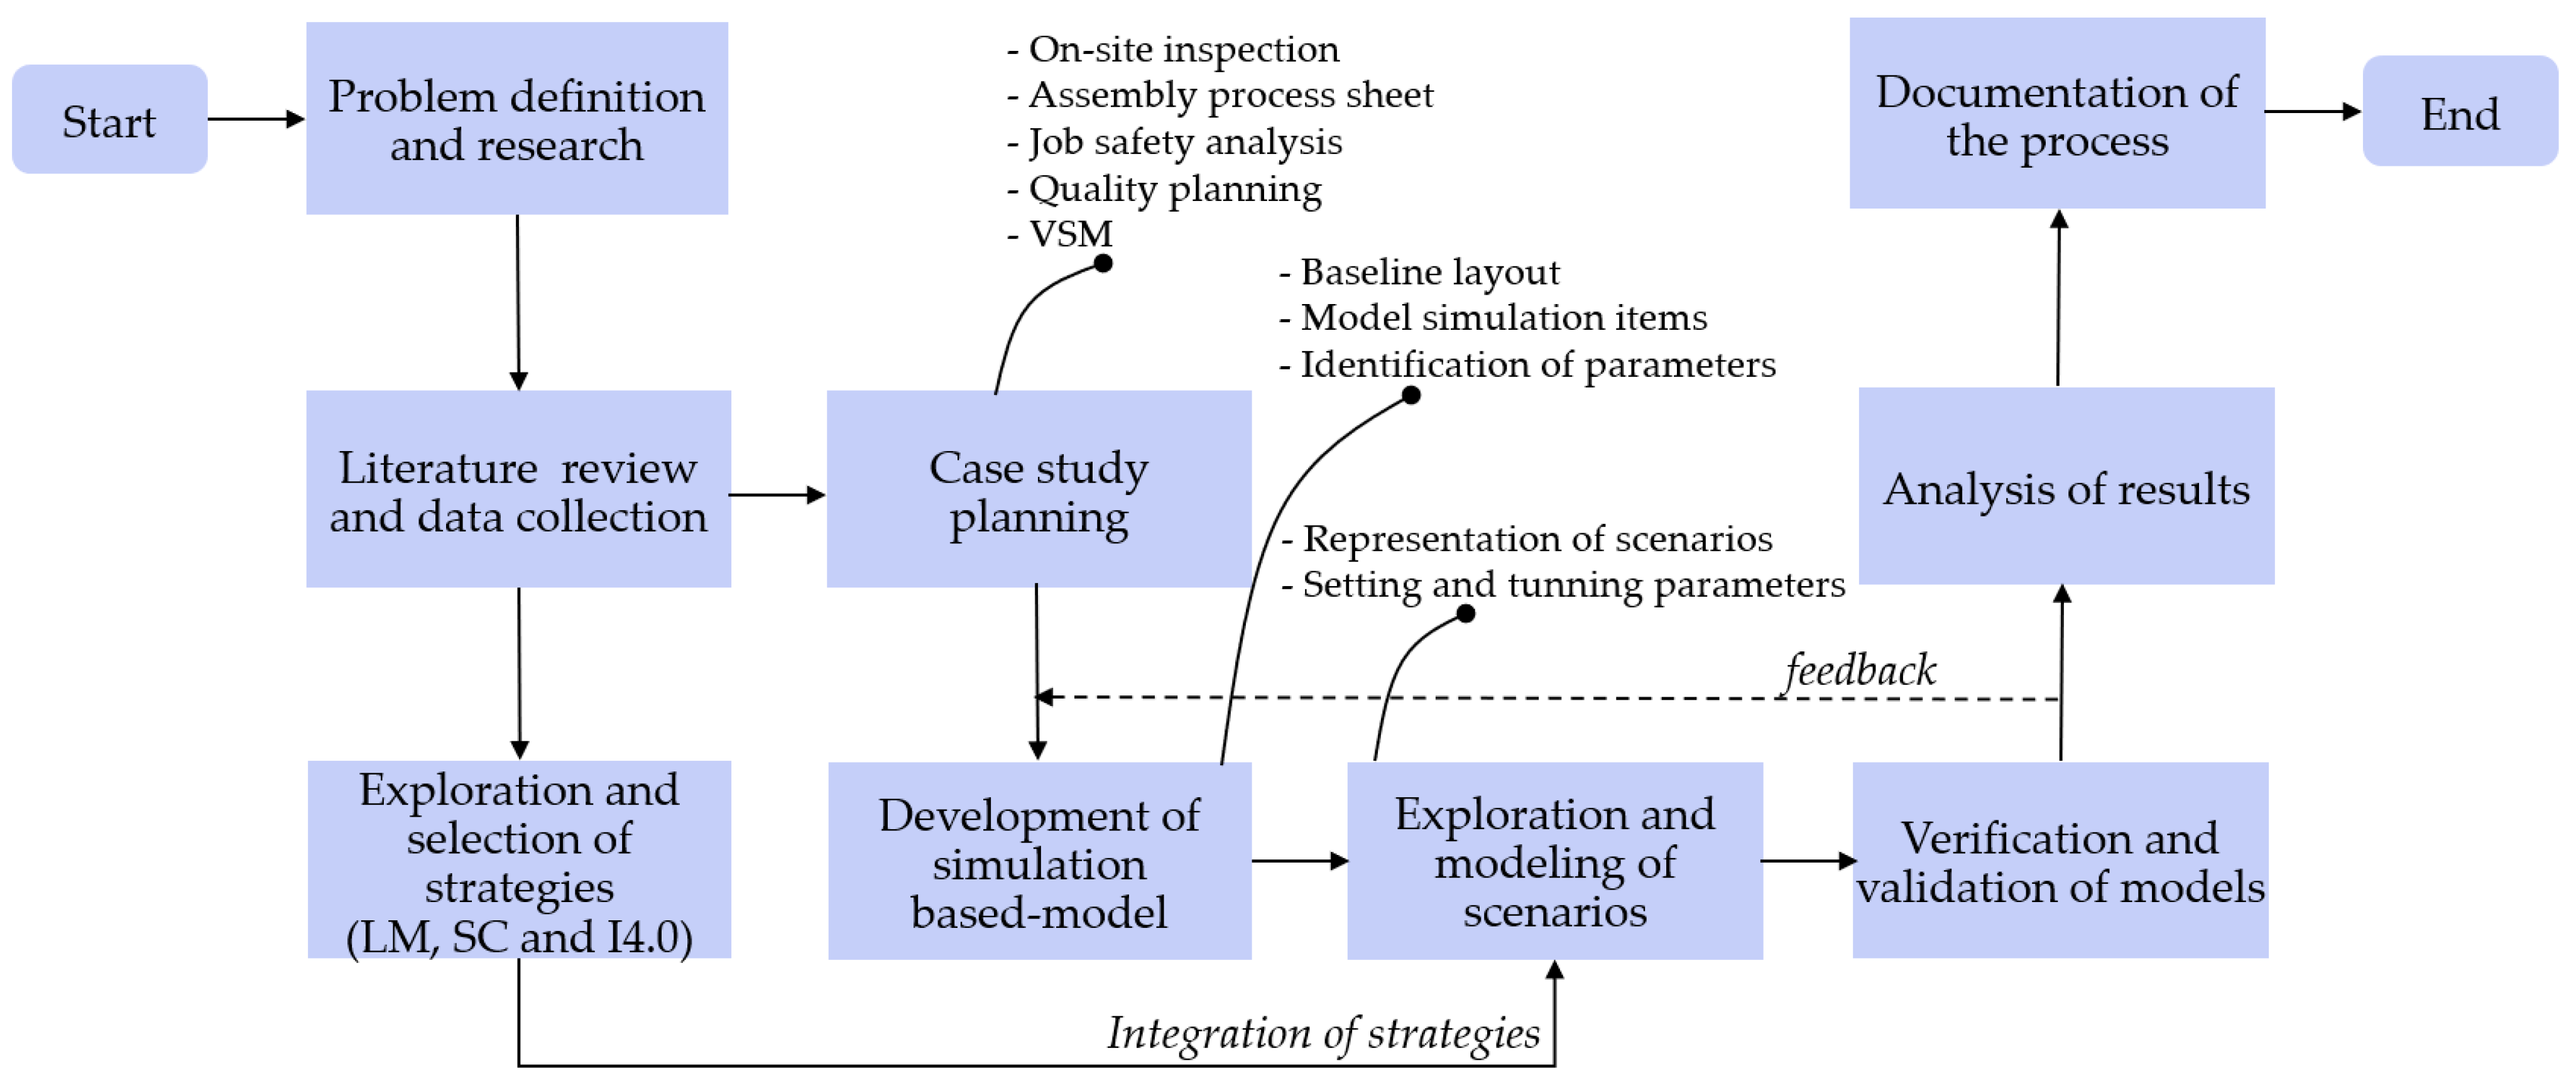
3. Material and Methods

The encouragement of existing manufacturers toward I4.0 technologies with continuous improvement through flexible systems is a challenge for managers from a strategic point of view. This research focuses on the need for companies to support digital transformation in industrial processes in terms of a strategic path. The study presents scenarios following a methodology with an incremental approach to implement strategies LM and SC in the context of I4.0 and their effects represented in DES models with applicability in remanufacturing and production line management. To this end, the research questions that guided this work are the following:
  • RQ1. Do LM, SC, and I4.0 strategies represented in DES models facilitate decision making?
  • RQ2. How does integrating LM, SC, and I4.0 strategies into DES models support the design of a new remanufacturing line based on expected demands?
  • RQ3. What are the outcomes of using LM and SC strategies with the support of I4.0 technologies to remanufacture engines?
The developed scenarios are based on a case study in the railway industry domain. For that purpose, the authors used the ProModel software package [66] to analyze and evaluate the performance of the remanufacturing system through modeling and simulation. Minitab [67] and Stat-Fit software [68] supported the statistical analysis. The Edraw Max application [69] helped to create the conceptual model in an object flow diagram (OFD). The OFD supplies an effective means to represent systems modeled using DES [70]. The Tecnológico Nacional de México facilitated all the available resources and software licenses. The scenarios follow a systematic approach to study and improve the system via DES from the system definition, conceptual model through model verification, and validation with scenarios for the analysis [71]. The employment of strategies is gradual across five scenarios, incorporating core tools to enhance system performance.
The research process begins with the definition of the problem and the formulation of the research questions. It continues with a literature review and data collection. Then comes the exploration and selection of strategies, whereas case study planning guides the development of the base model and the exploration and modeling of scenarios. The integration of strategies starts incrementally, and these scenarios undergo validation and verification with a feedback loop to make fine adjustments. Once validated, the results are analyzed and documented. Figure 1 depicts a graphical view of the research workflow.

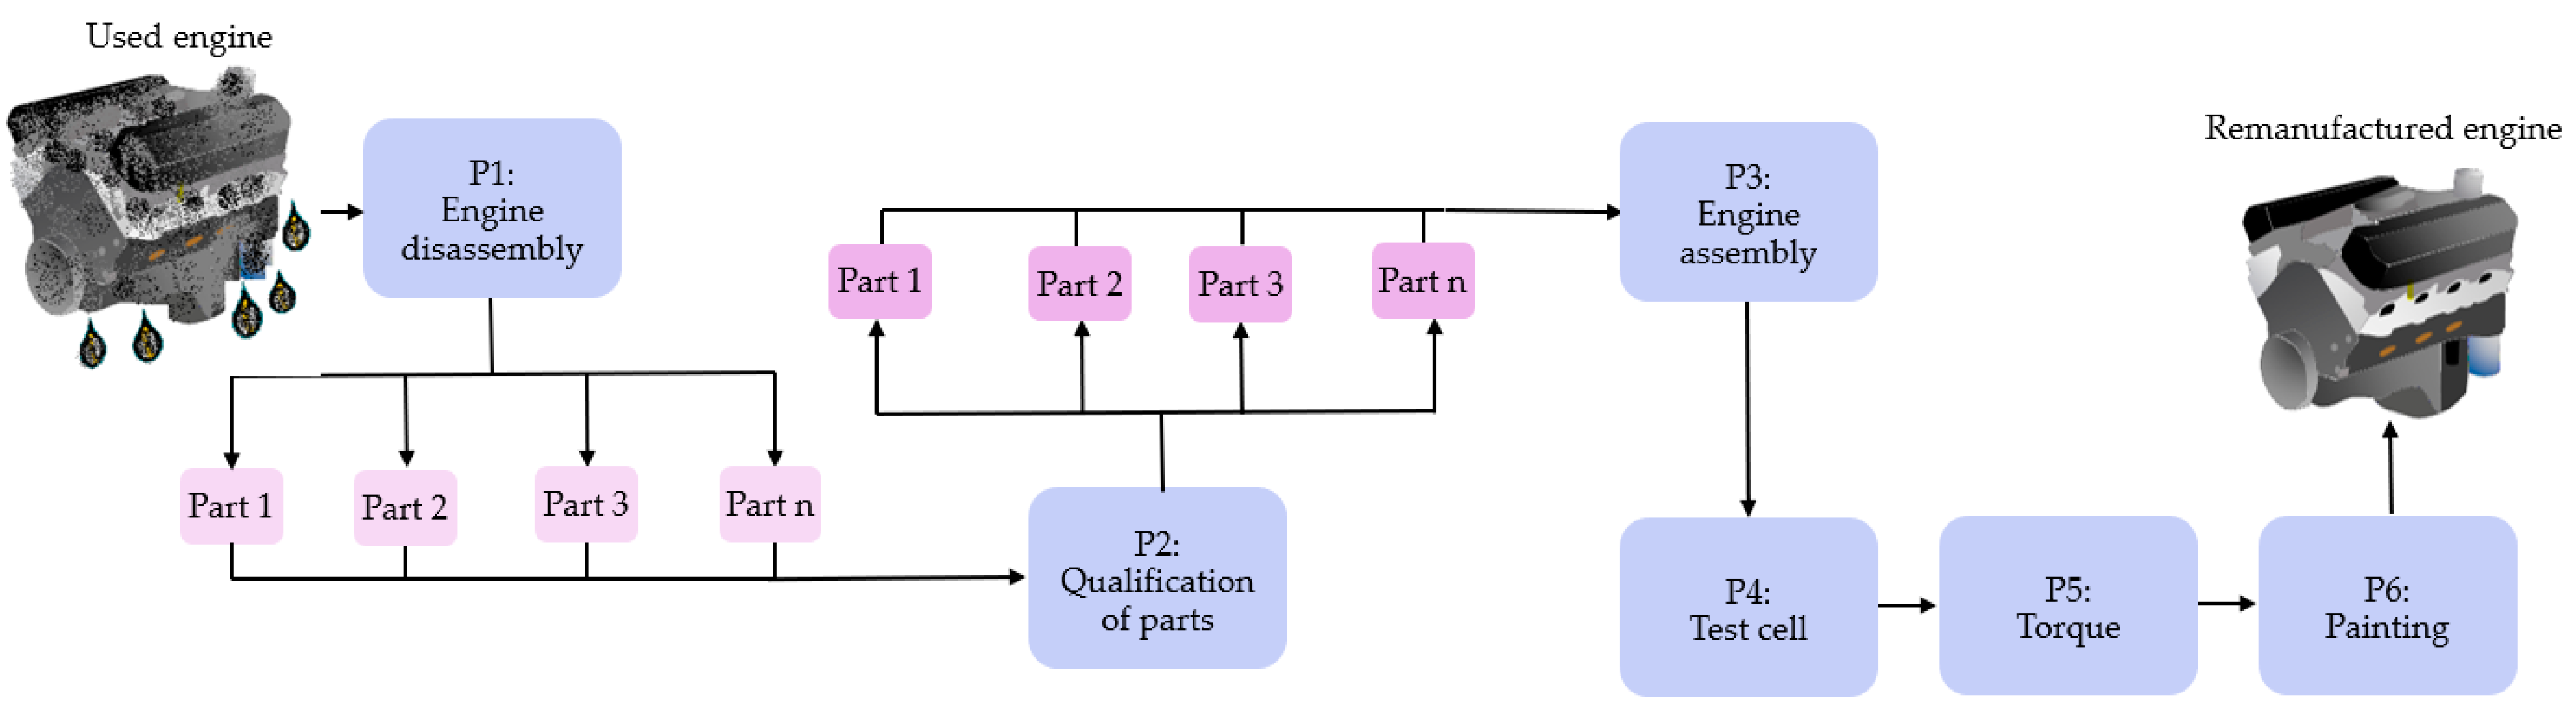
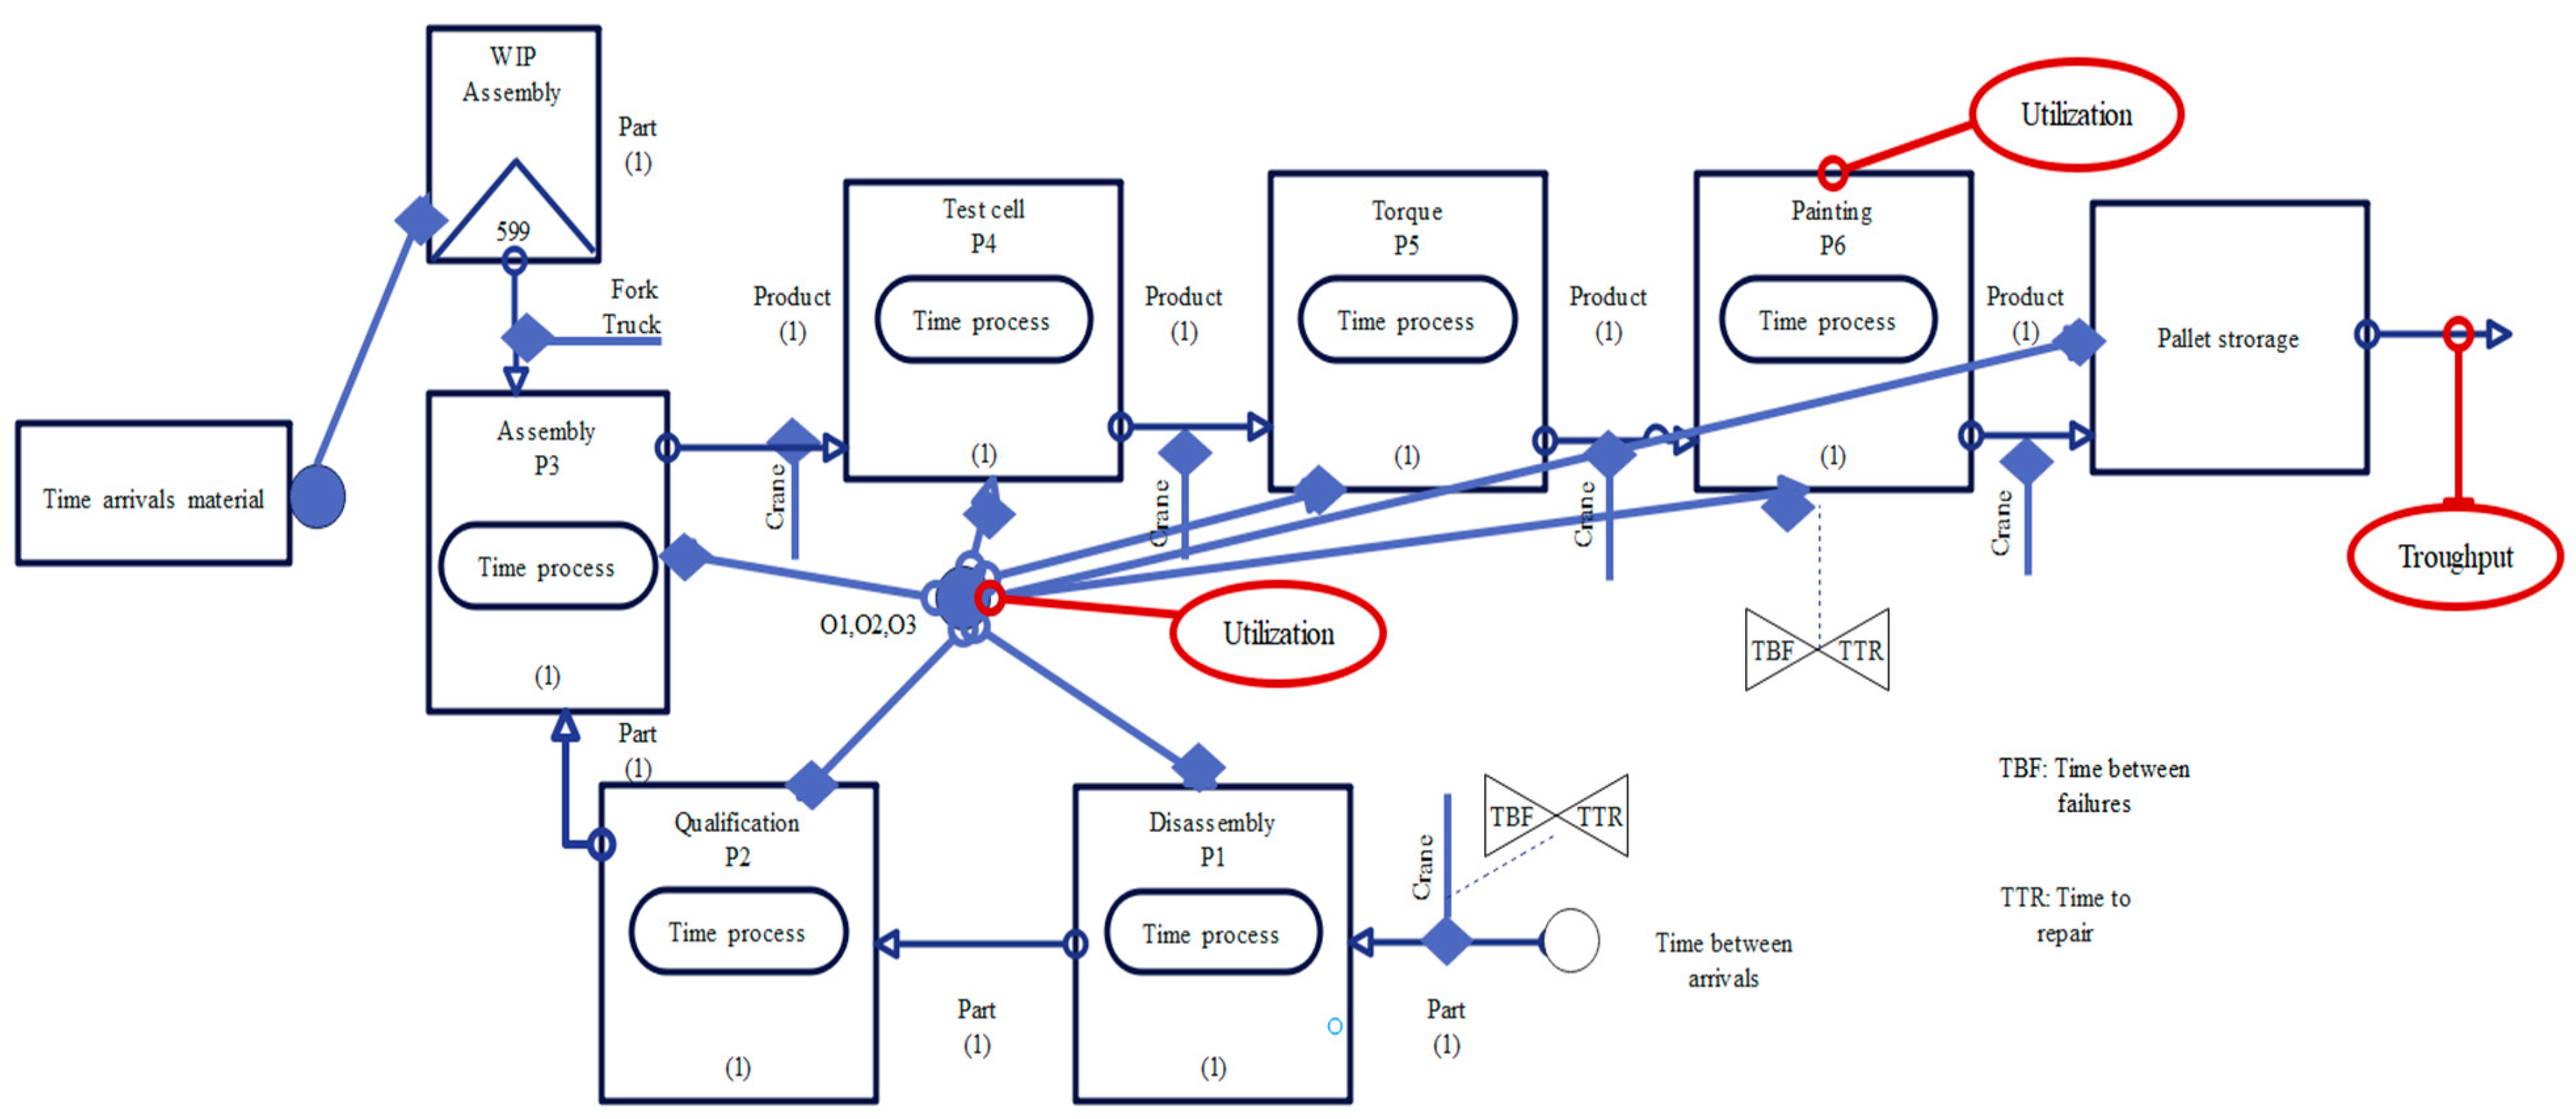
4. A Proof of Concept for a Remanufacturing Line Based on DES Scenarios

The primary goal is to design a proof of concept for a new line facility for remanufacturing railway diesel engines. The work responds to customers’ needs by incorporating the strategies LM, SC, and I4.0 performed and evaluated on five simulation scenarios. The aim is to supply a precise production plan capable of maximizing the use of workstations in unpredictable environments. With this in mind, the company expects its foreign factories to approve the work plan, proceed with the physical implementation of the remanufacturing line, and send parts of engines equal to 10% of their production to the plant. The proof of concept considered an existing remanufacturing line as a case study and a model with the initial conditions as a baseline. Due to the increasingly strict pollution regulations, the engines are transformed from model 0 to model 1+ to reduce emissions.
The engine arrives for remanufacturing, and the process finishes with the repaired machine ready for delivery to the customer. Table 2 depicts the state and conditions of the observed items in the remanufacturing line. The team analyzes the information, processes, and activities at the shop level, identifying a production workflow, depicted in Figure 2, that comprises the following six basic operations in the remanufacturing line:
P1.
Engine disassembly. The parts are extracted and classified to be reused or reworked;
P2.
Qualification of parts. The parts are identified through the bill of materials (BOM) and selected for repair, recycling, and reuse using the critical to-quality tool;
P3.
Engine assembly. The desired transformation from the initial engine model to one that produces fewer CO2 emissions;
P4.
Test Cell. A series of tests to verify that the engine meets the quality standards;
P5.
Torque. The engine passes the process of bolt and screw tightening;
P6.
Painting. The engine is painted and packed as a final product.
The objective is to maximize the use of workstations (Uw) and optimize throughput (TP) under unpredictable conditions while maintaining product quality and minimizing delays. Table 3 illustrates the notation of decision variables and parameters used in the implemented DES model considering five scenarios. On the other hand, Equation (1) presents the objective function.
M a x i m i z e : Z = j = 1 J U w j + λ 1 T P + λ 2 j = 1 J ( T B F j + T T R j ) λ 3 ( 1 L h )
where
U w j = Σ i = 1 N X i j T i j C j T × 100
T P = i = 1 N j = 1 J X i j Q i
λ 1 , λ 2 ,   a n d   λ 3 are weighting coefficients used to balance the importance of the components to be optimized. λ 1 indicates the relative importance of maximizing the total production output or throughput at the end of the remanufacturing process. λ 2 represents the cost or impact of disruptions caused by failures and repairs during the process. λ 3 reflects the importance of maximizing human labor occupation while ensuring workers are efficiently utilized but not overburdened. The model’s constraints ensure the process’s compliance with physical, operational, and resource limitations. A breakdown of the constraints derived from the provided scenario are the following:
Workstation capacity guarantees that engines processed at each step do not exceed the workload capacity.
i = 1 N X i j T i j C j j J
Resource availability ensures the concurrent operations that can involve manual labor.
j 6 O j 3
Failure and repair determines that the total downtime by failures and repairs for each operation j do not exceed a certain fraction of the total available production time T.
T B F j + T T R j P f × T , j J
Storage capacity ensures, at a given time, that the sum of all stored parts across different types does not exceed the maximum storage capacity.
i = 1 N X i j S , j J
Human labor occupation fixes that the workforce is allocated efficiently across workstations. Thus, all available are fully employed, and no excess labor is idle or wasted.
L h = i = 1 N j = 1 J X i j T i j j = 1 J C j
Cycle time ensures that each operation does not exceed the maximum allowable time. The production stays within time limits to meet demand.
C T j T m a x c y c l e j w h e r e   T m a x c y c l e   i s   t h e   m a x i m u m   a l l o w a b l e   t i m e   f o r   t h e   c y c l e
Quality and market demand ensure that such demand D is sufficient regarding output quality Q, Q ≥ D. The following constraints tackle non-negativity and integer values.
X i j , Q i 0,1 , i I , j j
C T i j , U w j , T T R j , T B F j , L h , T P 0 i I , j J , h H
T i j , C j , S > 0 i I , j J
Figure 3 illustrates a schematic overview of the conceptual model represented by OFD with the operations planned in the remanufacturing engine. The cell contains six processing equipment (P1–P6), one storage location (pallet storage), and three operators (O1–O3). The parts undergo processing and assembly operations while trucks and cranes perform the transportation process. The time between failures (TBF) and time to repair (TTR) are represented in the painting process and on the crane. The key performance indicators (KPIs) are the throughput for the process output, the CT, and the percentage of the human labor occupation.
The proposed solution consists of designing a proof of concept based on a DES model to support the decision making to approve changes at a remanufacturing line in response to customer needs. It presents five scenarios with an incremental approach that implements LM, SC, and I4.0 strategies, applying the well-known tools described in Table 4.

5. Results

This section presents the results of five scenarios simulated using the incremental strategies approach and compares them with a summary of indicators. The following subsections show the simulation scenarios, the percentage of time process, human labor occupation, and the statistical analysis of the process capability for each scenario.

5.1. Statistics of the Simulation Models by Scenario

This subsection describes the strategies and results of the production state in remanufacturing diesel engines. It considers each scenario by year with their respective indicators or KPIs. From the analysis carried out with the incremental strategies integration, the statistics obtained are the work-in-process (WIP) inventory measured in engine units, the value-added time (VAT), and the non-value-added time (NVAT) measured in hours. The indicators that represent the dependent variables are throughput and total production time or CT. Table 5 exhibits the strategy applied incrementally, followed by the throughput values, WIP inventory, CT, and VAT considering the average time process (ATP). NVAT is defined by the average time in move logic (ATML), the average time waiting (ATW), and the average time blocking (ATB). The results for the scenarios are as follows:
Scenario 1. The basic model (initial model without any strategy) with a throughput of 29 engines remanufactured, a WIP inventory of 1, and a CT value of 269.89 h, distributed in 125.54 h of VAT and 144.35 h of NVAT, representing 46.51% and 53.48%, respectively. The results are far below the expectations of manufacturing 40 engines.
Scenario 2. The strategy implied a layout redesign (LM1) using VSM and SD tools to reduce the ATML. The results indicate the throughput of 29 engines, pending 1 in process and resulting in a CT value of 238.41 h. The ATP for the engine is 123.65 h, representing 51.87% of VAT, and the total NVAT resulted in 114.76 h, representing 48.13%. There is a reduction in CT without productivity improvement.
Scenario 3. This scenario maintains the strategy LM1 applied in scenario 2, adding two strategies: reduction in operator downtime (LM2) using KA and a new arrangement of materials (SC1) with SM to improve the process. It completed 31 finished engines during a CT of 213.18 h, distributed in 122.17 h of VAT and 91.01 h of NVAT, representing 57.30% and 42.69% of the CT, respectively. The results present a reduction in the CT and an increment of two remanufactured engines.
Scenario 4. The strategies implemented on top of scenario 3 included one kit of materials in point of use (LM3) with the Kanban technique and one order of materials by kit (SC2) with MK. The results indicate a total production of 34 engines without a WIP inventory, a CT of 216.12 h with 115.18 h of VAT, and 100.94 h of NVAT, representing 53.29% and 46.7%, respectively. The throughput value in this scenario improved to 34 engines, which is still far from the goal.
Scenario 5. In addition to the previous strategies, this scenario implemented digital technologies (I4.0) using IoT and CC to improve the communication between the warehouse and the production line. The result obtained is a total production of 40 engines, with a CT of 214.45 h, distributed in 115.06 h of VAT, representing 53.65% of the CT and 99.39 h of NVAT, equivalent to 46.35% of the CT.
The average throughput for scenarios 1–4 results in 29, 29, 31, and 34 remanufactured engines. Scenario 5 integrates all improvement strategies, reaching the expected goal of 40 engines in one year. The CT of permanence for remanufacturing the motor is 216.79 h, a lower value than in the basic model, exhibiting a reduction in the ATP, ATW, and ATB values. Figure 4 illustrates an example of scenario 5, which adds real-time communication between the warehouse and the remanufacturing process stations. The I4.0 strategy ensured the synchronization to guarantee that materials arrived just in time at each station, streamlining production and reducing downtime and delays.

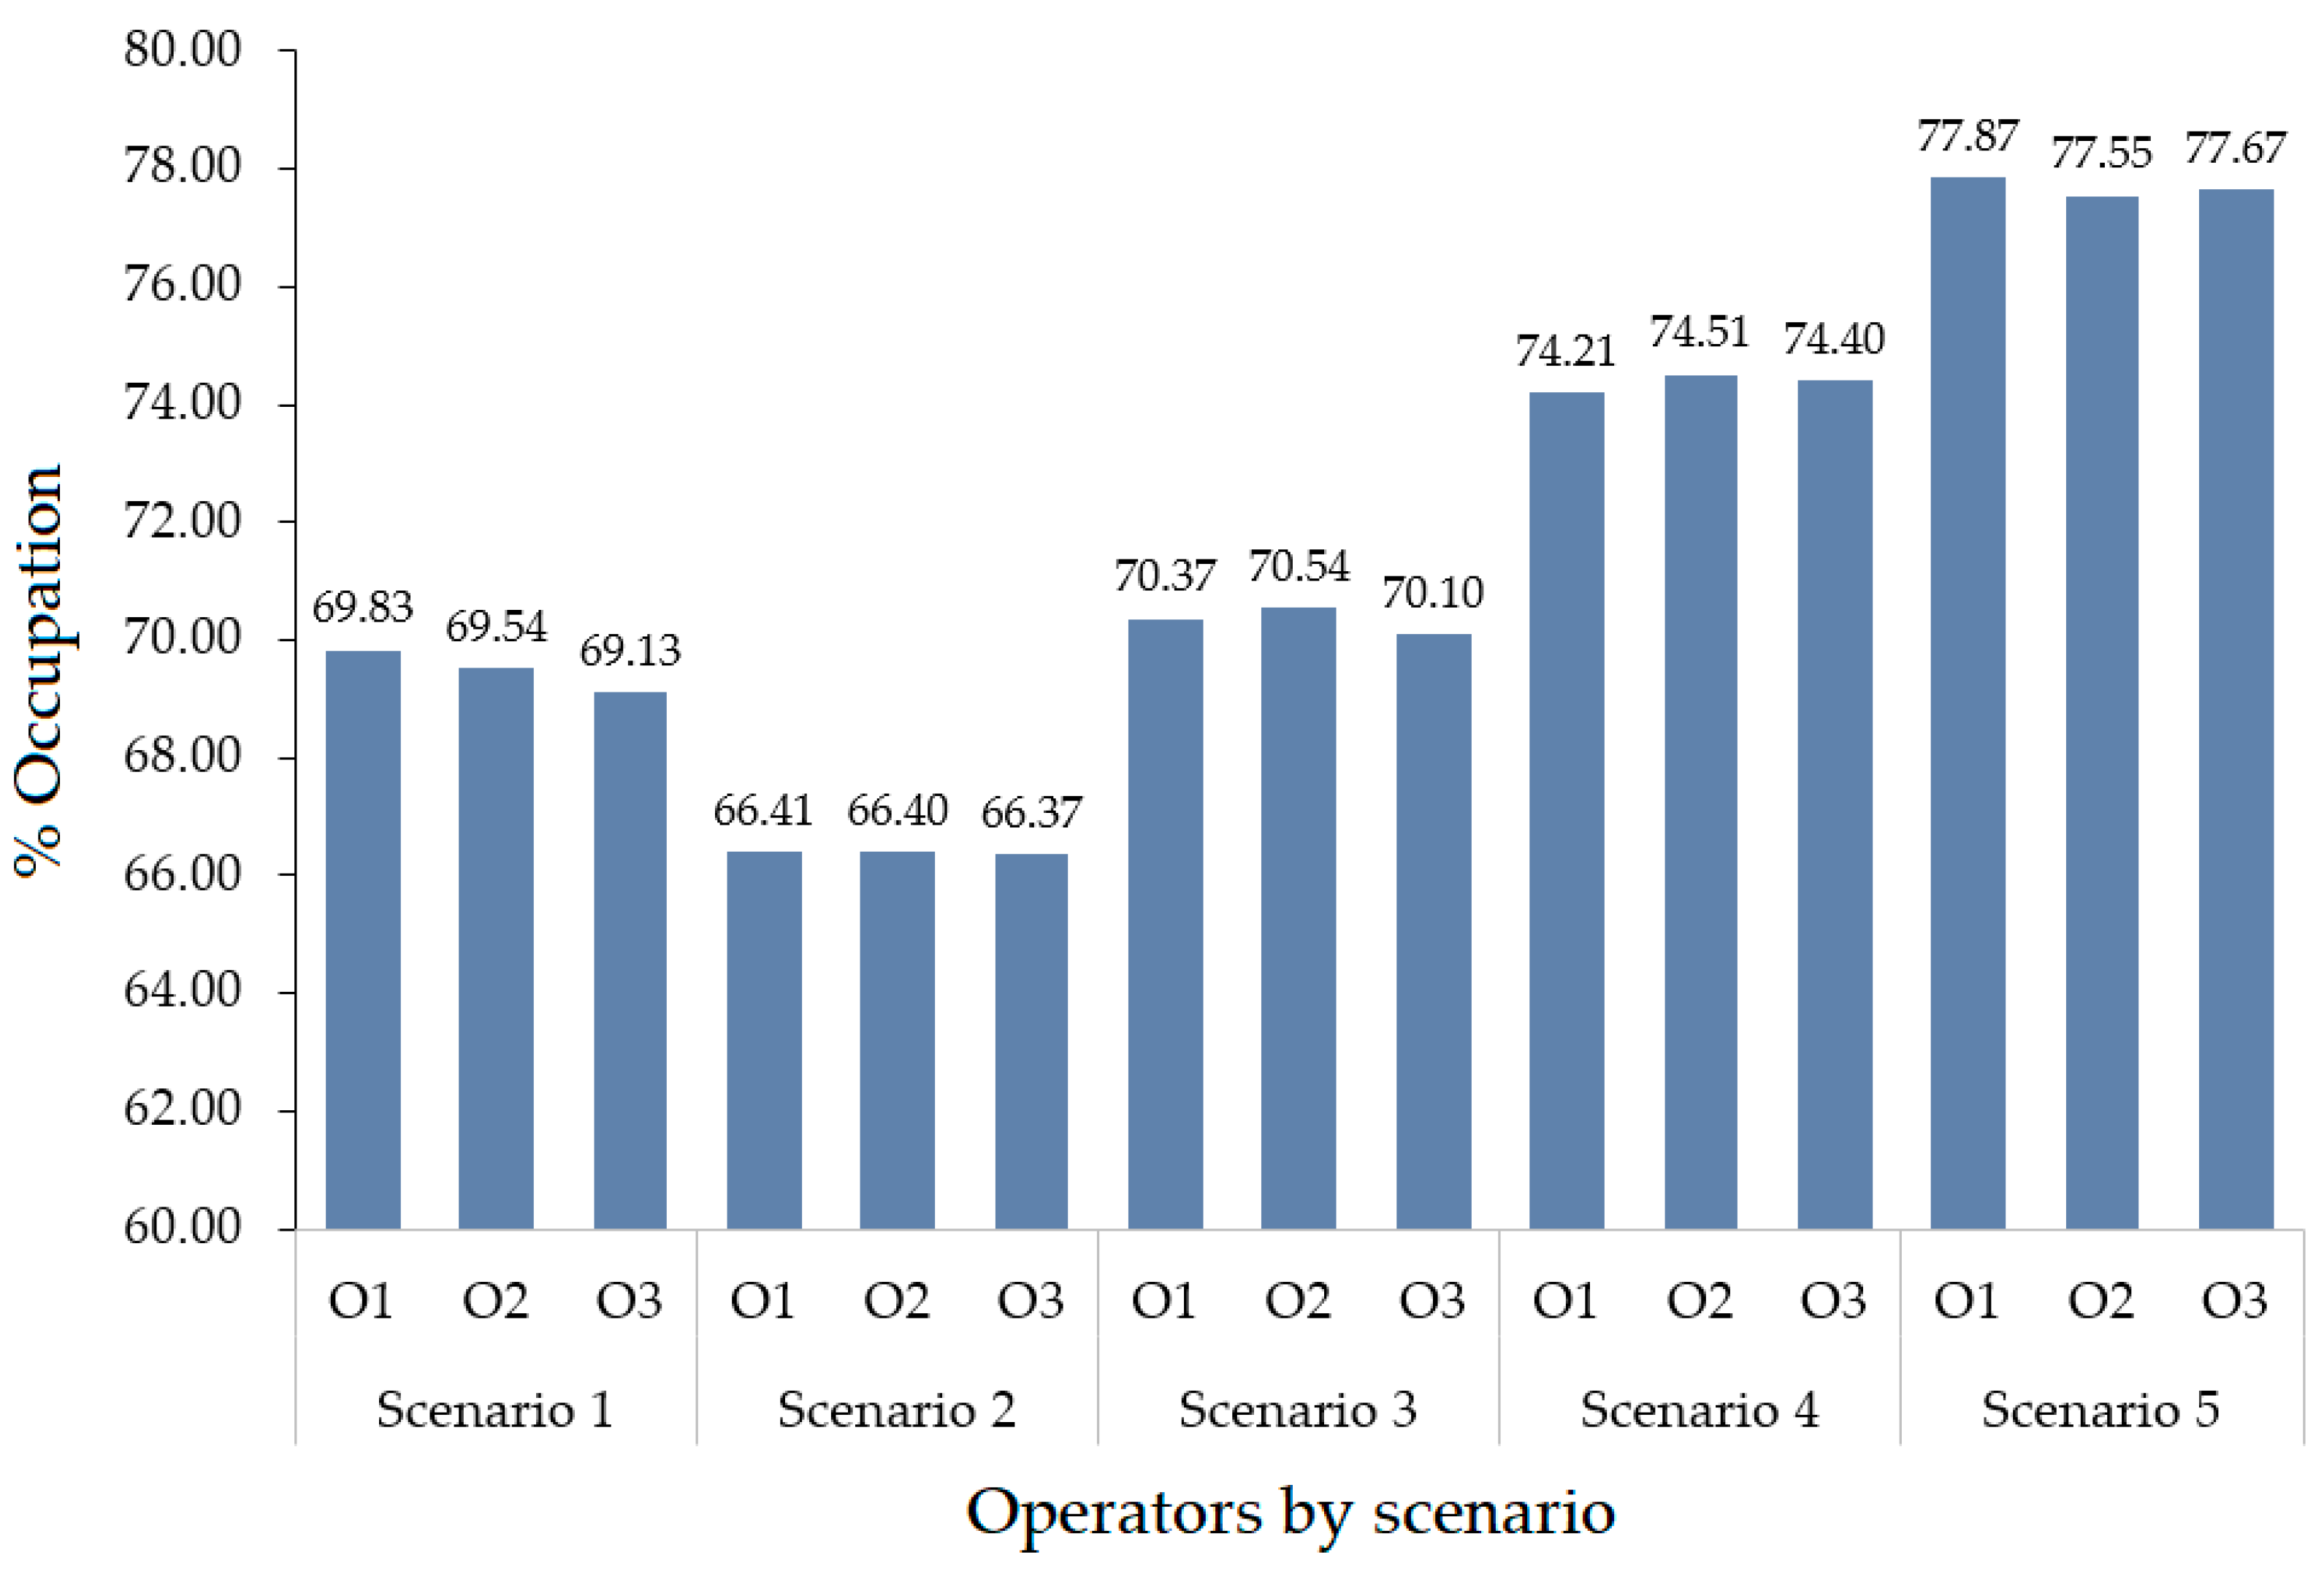
5.2. Statistics by Percentage of Time Process and Human Labor

Table 6 summarizes the results of the percentages of the total production time by scenario. For instance, scenario 5 reflects the following values: ATML 42.01%, ATW 1.54%, ATP 53.66%, and ATB 2.79%. The simulation model includes three operators, showing a variable behavior for each scenario, as depicted in Figure 5. The X-axis represents the operators by scenario, and the Y-axis is the percentage of human labor occupation. To illustrate, in scenario 5, the human resources O1, O2, and O3 had an average occupation rate of 77.87%, 77.55%, and 77.67%, respectively.

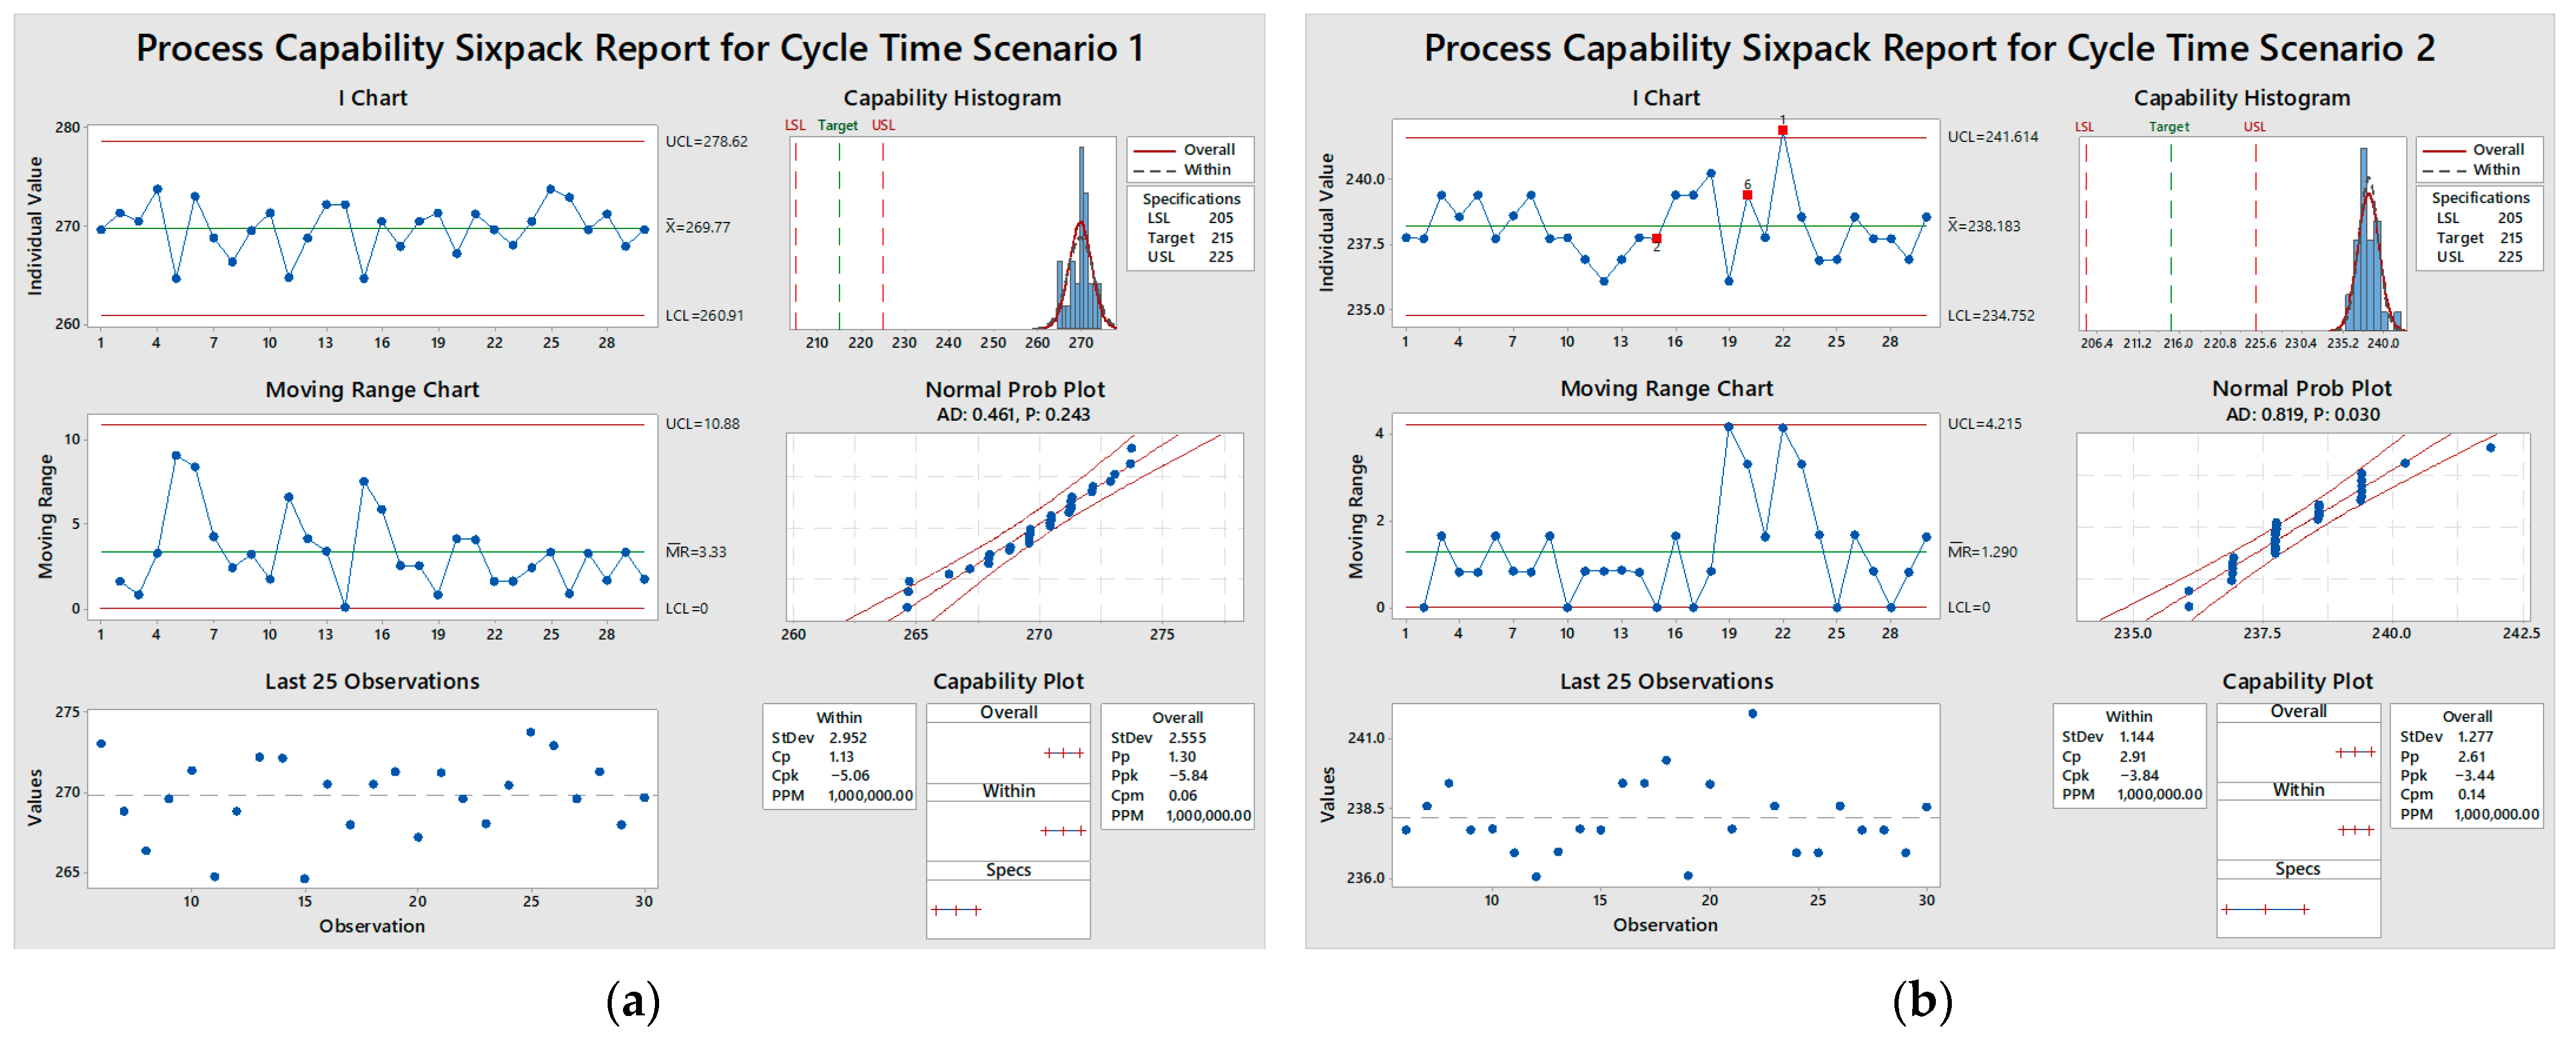
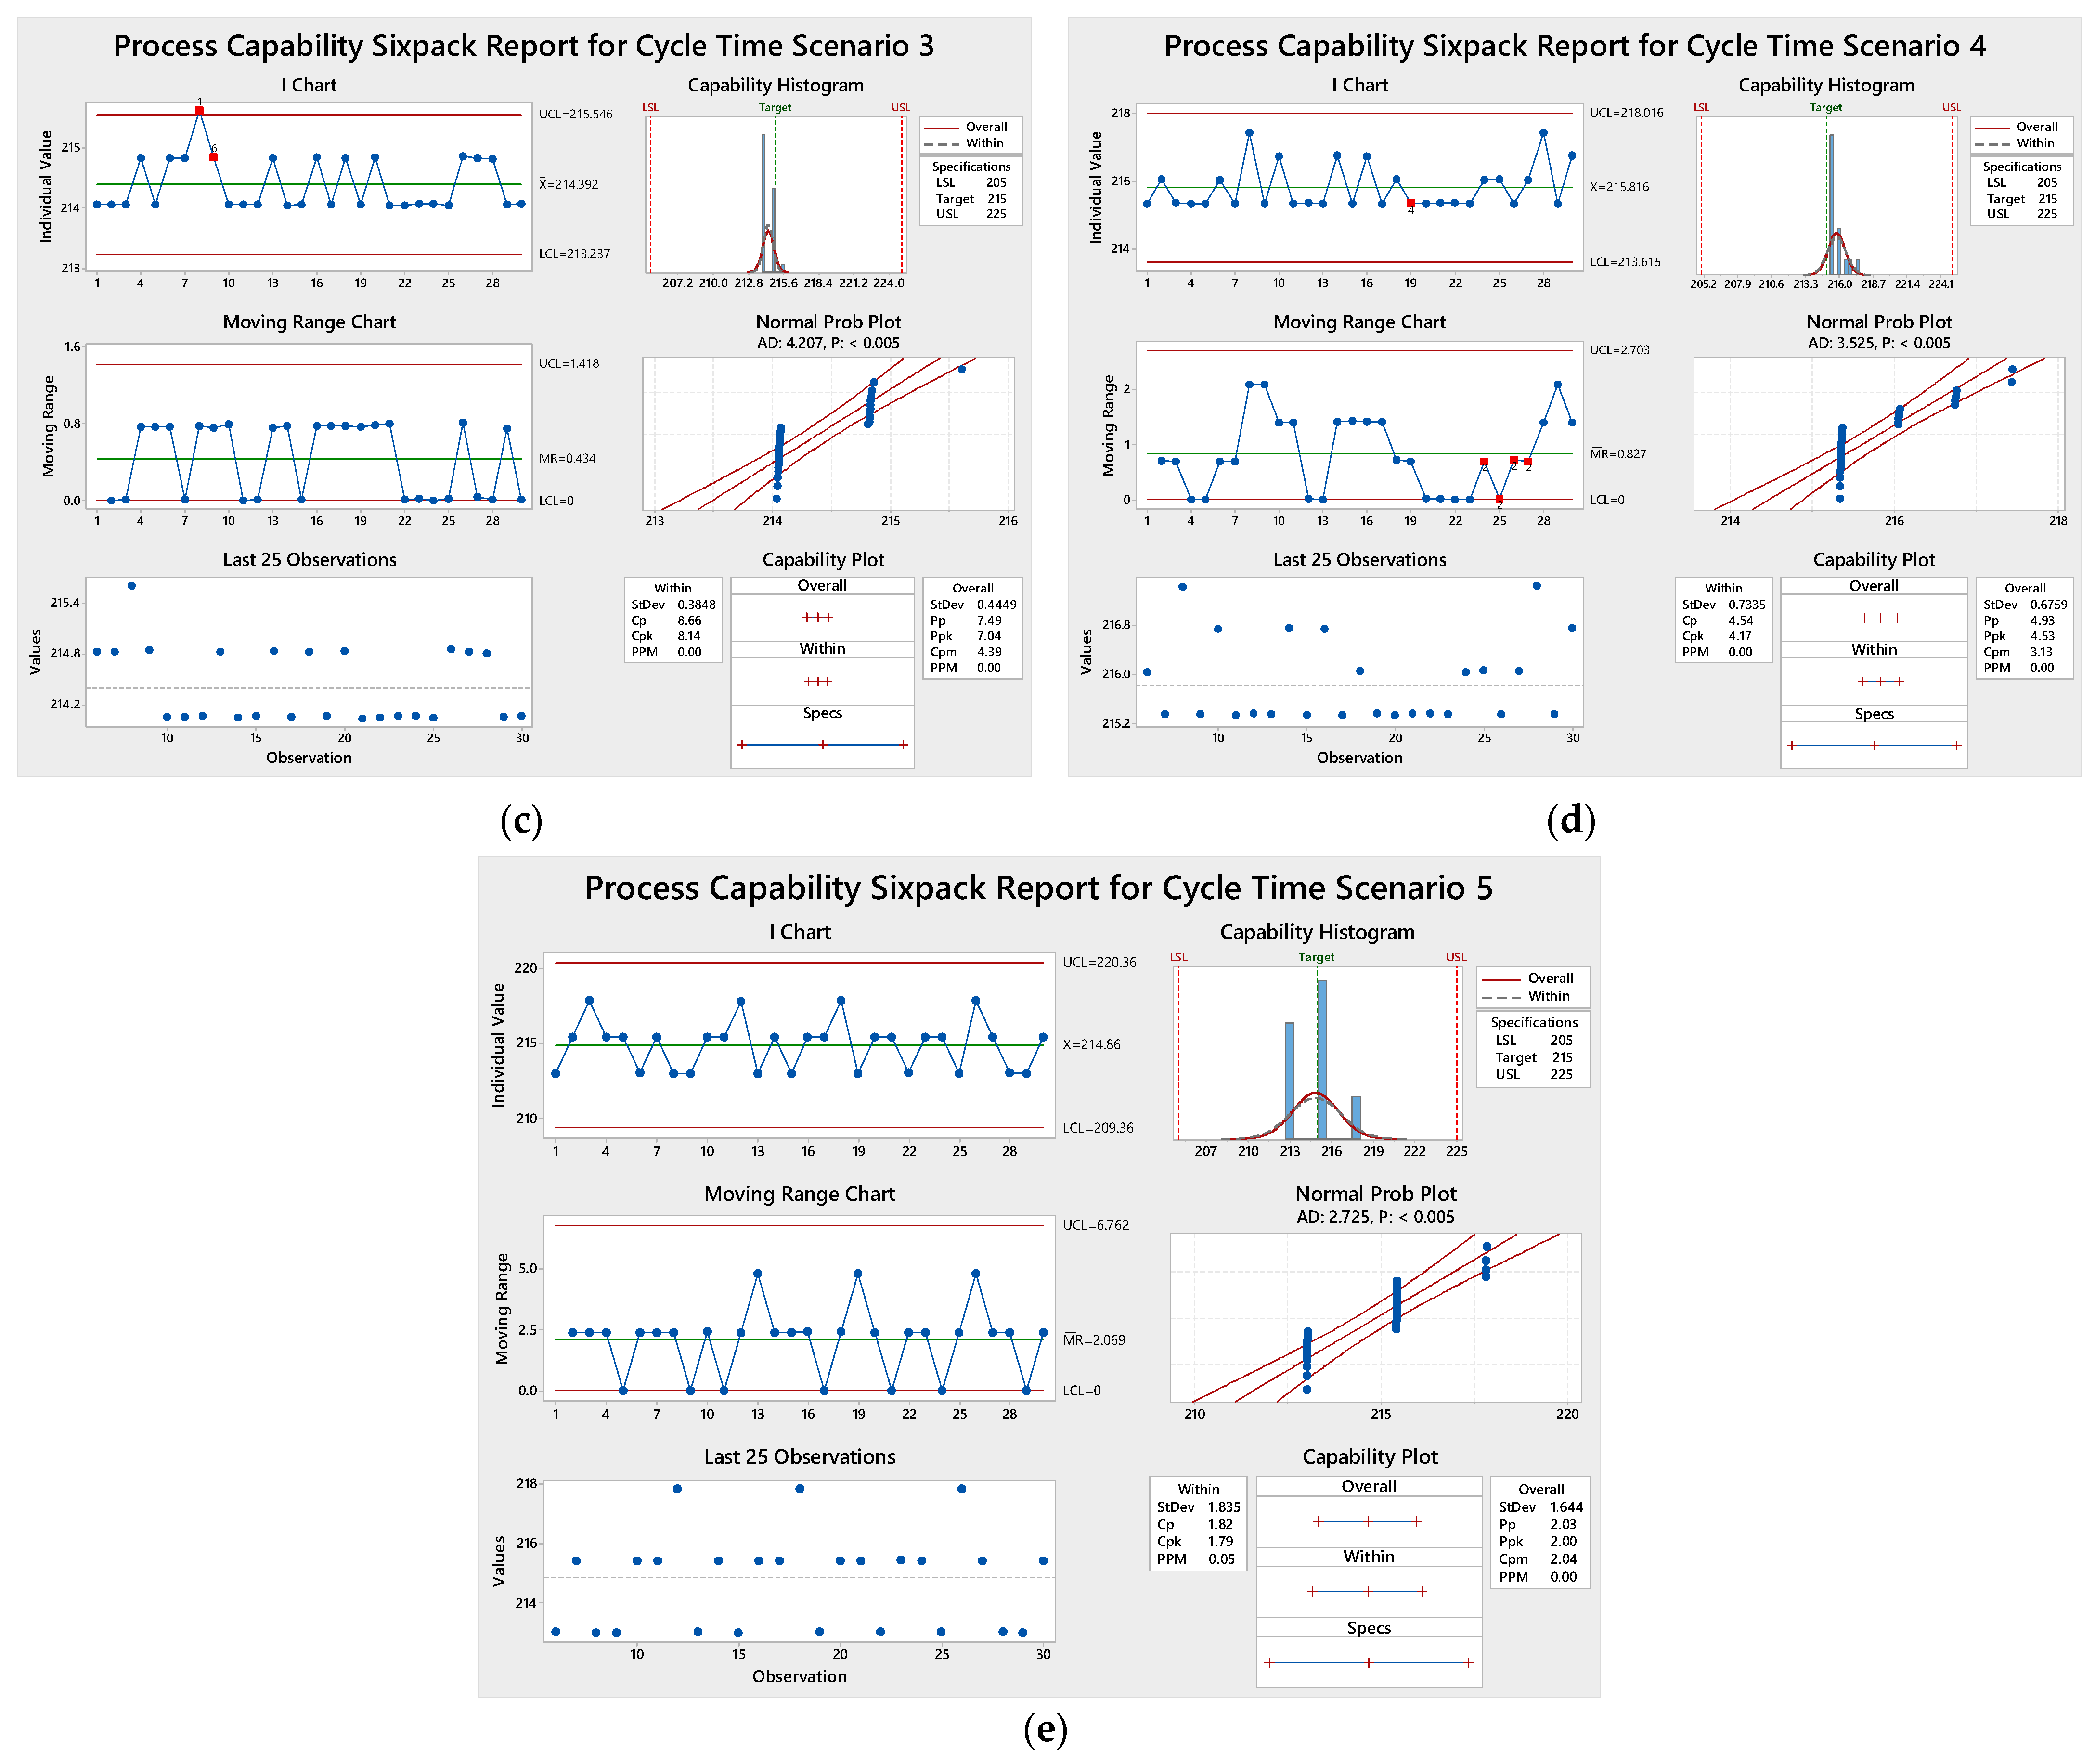
5.3. Process Capability Report by Scenario

The capability analysis of the process uses the CT results of 30 replicas for each scenario, comparing their behavior. The confidence level is 95% for normality tests and tests of means. Regarding statistical process control, the production line needs to meet the CT specification limits to remanufacture engines before assessing its capability, considering the following: the lower is 205 h, the upper is 225 h, and there is a target value of 215 h. Figure 6 illustrates the capability of the process by scenario, where scenario 1 presents stability in the process mean and the variation. There are no points out of statistical control and all pass the normality test. However, in the capability analysis, the mean differs significantly from the target with p < 0.001; the CT is outside the specification limits, as depicted in Figure 6a.
Furthermore, scenario 2 obtains points out of statistical control, and the data fail the normality test. The process mean value in the capability analysis differs significantly from the target with p < 0.001, and the CT values are outside the specification limits, as depicted in Figure 6b. Scenario 3 reflects points out of statistical control and fails the normality test. The process mean value in the capability analysis differs significantly from the target, and the CT values are outside the specification limits, as illustrated in Figure 6c. Scenario 4 exhibits stability in the process mean value and CT values without points out of statistical control. The data fails the normality test, where the process mean value in the capability process differs significantly from the target with p < 0.005, and the CT values are within the specification limits, as presented in Figure 6d. Finally, in scenario 5, the process mean value and CT values have stability without points out of control, and the data fail the normality test. The capability analysis shows that the process mean value does not differ significantly from the target with p < 0.640, and the CT values are within the specification limits, as depicted in Figure 6e.
Figure 5. Percentage of the human labor occupation by scenario.
Logistics 09 00033 g005
Figure 6. Process capability by scenario: (a) Scenario 1; (b) Scenario 2; (c) Scenario 3; (d) Scenario 4; (e) Scenario 5.
Logistics 09 00033 g006aLogistics 09 00033 g006b
Table 6. Time percentage by scenario in process.
Scenario% ATML% ATW% ATP% ATB
133.3917.5146.522.58
243.762.9251.871.45
338.341.6357.312.72
440.721.8253.304.16
542.011.5453.662.79

6. Discussion

The adoption of I4.0 technologies poses challenges in complex organizational frameworks, principally entities with non-standardized business processes and limited stakeholder collaboration [72]. Moreover, a lack of experience and a short-term strategic mindset can pose obstacles [73,74], such as fear of job loss [75], a lack of motivation, and failure in applying I4.0 technologies [76,77]. In response to the above issues, the modeling and simulation represent a system scenario that either will happen in the future or is already present [59]. It allows the study of such scenarios and process development without interrupting the physical systems and the risk associated with testing specific premises [78].
Regarding the RQ1 stated, the simulation experiments provided data and information about processes that support decision making. The proposed DES model helps to optimize the remanufacturing line and facilitate system behavior assessment and reconfiguration. It boosts the synchronism among the remanufacturing stations, materials, and human resources. The changes and strategies incorporated into the current line configuration (basic model), layered incrementally through the five scenarios, gradually improved the KPIs. With this in mind, the managers or decision-makers are aware and capable of visualizing the strategies’ impact in each scenario.
The LM and SC tools and I4.0 technologies have a positive effect and increase throughput values by optimizing the utilization of resources [79]. Bottalico [80] suggests an incremental introduction of I4.0 tool deployment in companies to improve their digital maturity and capabilities. Pagliosa et al. [81] express that manufacturers embarking on an LM initiative to leverage I4.0 technologies should prioritize investments in IoT and CPS technologies. In response to RQ2, the DES solution proposed in this work introduces improvements in the manufacturing line based on designing a model of a physical baseline. With that in mind, the five developed scenarios for the proof of concept revealed that the implemented strategies modeled and simulated justified changes to the current engine remanufacturing line. Consequently, scenario 5 satisfies the characteristics to fulfill the expected demand of 40 remanufactured engines in one year, incorporating a layout change, new materials arrangement, the materials kits on the point of use, and digital communication tools (see Table 4).
Concerning RQ3, the LM and SC strategies supported by core tools applied gradually eliminate potential sources of waste, where I4.0 technologies incorporated into lean production can improve companies’ productivity and flexibility, allowing them to map the entire remanufacturing process to ensure a continuous assembly flow and optimized production [82,83,84]. Thus, LM and SC are support functions for I4.0 implementation and an essential condition for intelligent manufacturing. The proposed DES model and the analysis provide a framework for integrating efficient I4.0 technologies into the LM systems environment. The proof of concept results were promising for the company to visualize the improvements in the KPI values (see Table 5 and Figure 5). Scenario 5 meets the throughput of 40 engines, a lower CT of 214.45, and human labor occupation above 75%. In such a way, the decision-makers can select the appropriate design for the physical remanufacturing process and increase the throughput.
Regarding the work limitations, the aspects modeled in each scenario correspond only to those elements directly associated with throughput, CT, and human labor occupation. The present work lacks an economical analysis and operational feasibility of the real-world implementation. Thus, the implementation costs related to each strategy, the management of the purchase of new and used components required in the manufacturing line, and the economic profitability of recovery operations are outside the scope of the study. Regardless of the positive comments of the plant manager about implementing the proposed scenarios, they emphasized a gradual I4.0 integration to improve digital maturity, investing in IoT, CC, and CPS technologies.
More stakeholders and managerial perceptions are required to plan actionable insights and provide the industrial valuation of this study. In future work, further exploration is necessary for more complex remanufacturing environments and to evaluate the scalability and flexibility for extensive operations, the lifecycle assessment of railway engines, and the sustainability of the remanufacturing line.

7. Conclusions

The main goal of this research was to design a remanufacturing line using LM and SC strategies, employing DES models in the context of I4.0. In this sense, the proposal developed a proof of concept based on a real case in a railway company. It begins with a baseline scenario and four additional scenarios employing incremental LM, SC, and I4.0 strategies to compare the results. According to the statistics obtained from the simulation model, the I4.0 technologies integrated with LM and SC strategies improve both flexibility and productivity in manufacturing processes. Scenario 5 incorporates all the proposed approaches, including digital technologies, achieving the objective of remanufacturing 40 engines per year with a CT of 214.45 h. Consequently, it delivers the closest design to the company’s requirements.
The proof of concept returns simulated performance data based on the current physical information of the engine manufacturing line to allow an understanding of the potential benefits of an integrated solution with the elements studied. On the other hand, it establishes that the coexistence of I4.0 technologies and LM and SC practices is consistent and could achieve better compliance with future market demands. It is worth noting that the major limitation of this work lies in its application to a particular case in the railway remanufacturing sector. Even though the simulation scenarios offer insights, the case study approach limits the versatility of assorted operational environments and the applicability of the findings. Hence, additional studies may investigate whether a specific collection of different I4.0 technologies and LM tools can yield advantages compared to a limited selection of both. Another line of study can focus on the best practices to integrate these tools and technologies into other application areas.

Author Contributions

Conceptualization, R.H.F.-J.; methodology, all authors; software, R.H.F.-J.; validation, R.H.F.-J. and Ó.H.-U.; investigation, all authors; data curation, R.H.F.-J. and Ó.H.-U.; writing—original draft preparation, R.H.F.-J. and Ó.H.-U.; writing—review and editing, R.H.F.-J., Ó.H.-U., and L.A.C.-R.; visualization, R.H.F.-J., L.A.C.-R., and Z.A.M.-A.; supervision, Ó.H.-U. and L.A.C.-R.; project administration, R.H.F.-J., Ó.H.-U., and Z.A.M.-A. All authors have read and agreed to the published version of the manuscript.

Funding

This research received no external funding.

Data Availability Statement

The data presented in this study are available on request from the corresponding author.

Acknowledgments

The authors acknowledge Wabtec Company for the administrative and technical support. To the Secretaría de Ciencia, Humanidades, Tecnología e Innovación (SECIHTI) for the Ph.D. scholarship support number 388127 and SECIHTI SNII of Mexico.

Conflicts of Interest

The authors declare no conflicts of interest.

References

  1. Lothary, D.; Tomov, P.; Dimitrov, L. Combination of an ERP System with Other Technological Approaches to Increase Sustainability in Discrete Manufacturing. In Proceedings of the International Conference on Electronics, Engineering Physics and Earth Science, Kavala, Greece, 21–23 June 2023. [Google Scholar] [CrossRef]
  2. Pawlewski, P. Scientific and Practical Challenges for the Development of a New Approach to the Simulation of Remanufacturing. Sustainability 2024, 16, 3857. [Google Scholar] [CrossRef]
  3. Paul, M.; Reinhart, G. Towards the integration of remanufacturing into existing manufacturing systems. Procedia CIRP 2024, 130, 1447–1453. [Google Scholar] [CrossRef]
  4. Gunasekara, H.; Gamage, J.; Punchihewa, H. Remanufacture for sustainability: Barriers and solutions to promote automotive remanufacturing. Procedia Manuf. 2020, 43, 606–613. [Google Scholar] [CrossRef]
  5. Wabtec Corporation. Revolutionizing the Way the World Moves for Future Generations. In 2023 Sustainability Report. Available online: https://www.wabteccorp.com/sustainability (accessed on 20 June 2024).
  6. Boorsma, N.; Peck, D.; Bakker, T.; Bakker, C.; Balkenende, R. The strategic value of design for remanufacturing: A case study of professional imaging equipment. J. Remanuf. 2022, 12, 187–212. [Google Scholar] [CrossRef]
  7. Corum, A. Remanufacturing: A Case Study in Mercedes-Benz Bus Factory. In Proceedings of the 12th Annual International Conference on Industrial Engineering and Operations Management, Istanbul, Turkey, 7–10 March 2022. [Google Scholar] [CrossRef]
  8. Crotti, G. Review and new horizons of Facility Layout Planning. Master’s Thesis, Politecnico di Milano, Milan, Italy, 2022. [Google Scholar]
  9. Goodall, P.; Sharpe, R.; West, A. A data-driven simulation to support remanufacturing operations. Comput. Ind. 2019, 105, 48–60. [Google Scholar] [CrossRef]
  10. Dias, A.S.; Kim, H.; Sivakumar, P.K.; Liu, Z.C.; Zhang, H.C. Life Cycle Assessment: A Comparison of Manufacturing and ReManufacturing Processes of a Diesel Engine. In Re-Engineering Manufacturing for Sustainability; Nee, A., Song, B., Ong, S.K., Eds.; Springer: Singapore, 2013; pp. 675–678. [Google Scholar] [CrossRef]
  11. Teixeira, E.L.S.; Tjahjono, B.; Beltran, M.; Julião, J. Demystifying the digital transition of remanufacturing: A systematic review of literature. Comput. Ind. 2022, 134, 103567. [Google Scholar] [CrossRef]
  12. Kumar, D.; Soni, G.; Jabeen, F.; Tiwari, N.K.; Sariyer, G.; Ramtiyal, B. A hybrid Bayesian approach for assessment of industry 4.0 technologies towards achieving decarbonization in manufacturing industry. Comput. Ind. Eng. 2024, 190, 110057. [Google Scholar] [CrossRef]
  13. Buer, S.V.; Semini, M.; Strandhagen, J.O.; Sgarbossa, F. The complementary effect of lean manufacturing and digitalisation on operational performance. Int. J. Prod. Res. 2021, 59, 1976–1992. [Google Scholar] [CrossRef]
  14. Rahardjo, B.; Wang, F.-K.; Yeh, R.-H.; Chen, Y.-P. Lean manufacturing in industry 4.0: A smart and sustainable manufacturing system. Machines 2023, 11, 72. [Google Scholar] [CrossRef]
  15. Palange, A.; Dhatrak, P. Lean manufacturing a vital tool to enhance productivity in manufacturing. Mater. Today Proc. 2021, 46, 729–736. [Google Scholar] [CrossRef]
  16. Ejsmont, K.; Gladysz, B.; Corti, D.; Castaño, F.; Mohammed, W.M.; Martinez Lastra, J.L. Towards ‘Lean Industry 4.0’—Current trends and future perspectives. Cogent Bus. Manag. 2020, 7, 1781995. [Google Scholar] [CrossRef]
  17. Dillinger, F.; Tropschuh, B.; Dervis, M.Y.; Reinhart, G. A systematic approach to identify the interdependencies of lean production and Industry 4.0 elements. Procedia CIRP 2022, 112, 85–90. [Google Scholar] [CrossRef]
  18. Rizzi, A. Introduction to the Supply Chain Concept. In Supply Chain: Fundamentals and Best Practices to Compete by Leveraging the Network, 1st ed.; Springer: Cham, Switzerland, 2022; pp. 1–14. [Google Scholar] [CrossRef]
  19. Boudouaia, M.A.; Ouchani, S.; Qaisar, S.M.; Almaktoom, A.T. Supply Chain 5.0: Vision, Challenges, and Perspectives. In Proceedings of the 21st Learning and Technology Conference, Jeddah, Saudi Arabia, 15–16 January 2024. [Google Scholar]
  20. Figliè, R.; Amadio, R.; Tyrovolas, M.; Stylios, C.; Paśko, Ł.; Stadnicka, D.; Carreras-Coch, A.; Zaballos, A.; Navarro, J.; Mazzei, D. Towards a taxonomy of industrial challenges and enabling technologies in industry 4.0. IEEE Access 2024, 12, 19355–19374. [Google Scholar] [CrossRef]
  21. De Giovanni, P.; Cariola, A. Process innovation through industry 4.0 technologies, lean practices and green supply chains. Res. Transp. Econ. 2021, 90, 100869. [Google Scholar] [CrossRef]
  22. Núñez-Merino, M.; Maqueira-Marín, J.M.; Moyano-Fuentes, J.; Castaño-Moraga, C.A. Industry 4.0 and supply chain. A systematic science mapping analysis. Technol. Forecast. Soc. Change 2022, 181, 121788. [Google Scholar] [CrossRef]
  23. Reyes, J.; Mula, J.; Díaz-Madroñero, M. Development of a conceptual model for lean supply chain planning in industry 4.0: Multidimensional analysis for operations management. Prod. Plann. Control 2023, 34, 1209–1224. [Google Scholar] [CrossRef]
  24. Hugos, M.H. Essentials of Supply Chain Management, 5th ed.; John Wiley & Sons: Hoboken, NJ, USA, 2024; pp. 5–17. [Google Scholar]
  25. Mourtzis, D. Simulation in the design and operation of manufacturing systems: State of the art and new trends. Int. J. Prod. Res. 2020, 58, 1927–1949. [Google Scholar] [CrossRef]
  26. Wang, Y.; Li, J.; Hongbo, S.; Li, Y.; Akhtar, F.; Imran, A. A survey on VV&A of large-scale simulations. Int. J. Crowd Sci. 2019, 3, 63–86. [Google Scholar] [CrossRef]
  27. Abdullah, F.M.; Saleh, M.; Al-Ahmari, A.M.; Anwar, S. The impact of industry 4.0 technologies on manufacturing strategies: Proposition of technology-integrated selection. IEEE Access 2022, 10, 21574–21583. [Google Scholar] [CrossRef]
  28. Tania, R.; Josefa, M.; Raquel, S. Quantitative modelling approaches for lean manufacturing under uncertainty. Int. J. Prod. Res. 2024, 62, 5989–6015. [Google Scholar]
  29. Dikhanbayeva, D.; Tokbergenova, A.; Lukhmanov, Y.; Shehab, E.; Pastuszak, Z.; Turkyilmaz, A. Critical factors of industry 4.0 implementation in an emerging country: Empirical study. Future Internet 2021, 13, 137. [Google Scholar] [CrossRef]
  30. Dolgui, A.; Ivanov, D. 5G in digital supply chain and operations management: Fostering flexibility, end-to-end connectivity and real-time visibility through internet-of-everything. Int. J. Prod. Res. 2022, 60, 442–451. [Google Scholar] [CrossRef]
  31. Ding, B.; Hernández, X.F.; Jané, N.A. Combining lean and agile manufacturing competitive advantages through industry 4.0 technologies: An integrative approach. Prod. Plann. Control 2021, 34, 442–458. [Google Scholar] [CrossRef]
  32. Raji, I.O.; Shevtshenko, E.; Rossi, T.; Strozzi, F. Modelling the relationship of digital technologies with lean and agile strategies. Supply Chain Forum Int. J. 2021, 22, 323–346. [Google Scholar] [CrossRef]
  33. Zhang, X.; Zhu, S.; Dai, S.; Jiang, Z.; Gong, Q.; Wang, Y. Optimization of third party take-back enterprise collection strategy based on blockchain and remanufacturing reverse logistics. Comput. Ind. Eng. 2024, 187, 109846. [Google Scholar] [CrossRef]
  34. Guchhait, R.; Sarkar, B. Economic evaluation of an outsourced fourth-party logistics (4PL) under a flexible production system. Int. J. Prod. Econ. 2025, 279, 109440. [Google Scholar] [CrossRef]
  35. Guchhait, R.; Sarkar, M.; Sarkar, B.; Yang, L.; AlArjani, A.; Mandal, B. Extended material requirement planning (MRP) within a hybrid energy-enabled smart production system. J. Ind. Inf. Integr. 2024, 42, 100717. [Google Scholar] [CrossRef]
  36. Sarkar, B.; Bhuniya, S. A sustainable flexible manufacturing–remanufacturing model with improved service and green investment under variable demand. Expert Syst. Appl. 2022, 202, 117154. [Google Scholar] [CrossRef]
  37. Dey, B.K.; Pareek, S.; Tayyab, M.; Sarkar, B. Autonomation policy to control work-in-process inventory in a smart production system. Int. J. Prod. Res. 2021, 59, 1258–1280. [Google Scholar] [CrossRef]
  38. Midilli, Y.E.; Elevli, B. Value stream mapping with simulation to optimize stock levels: Case study. Jordan J. Mech. Ind. Eng. 2020, 14, 295–302. [Google Scholar]
  39. Pekarcikova, M.; Trebuna, P.; Kliment, M.; Schmacher, B.A.K. Milk run testing through tecnomatix plant simulation software. Int. J. Simul. Modell. 2022, 21, 101–112. [Google Scholar] [CrossRef]
  40. Trebuna, P.; Pekarcikova, M.; Edl, M. Digital value stream mapping using the tecnomatix plant simulation software. Int. J. Simul. Modell. 2019, 18, 19–32. [Google Scholar] [CrossRef]
  41. Aksar, O.; Elgun, D.; Beldek, T.; Konyalioglu, A.K.; Camgöz-Akdag, H. An integrated value stream mapping and simulation approach for a production line: A Turkish automotive industry case. In Digitizing Production Systems, LNME; Durakbasa, N.M., Gençyılmaz, M.G., Eds.; Springer: Cham, Switzerland, 2022; pp. 357–371. [Google Scholar] [CrossRef]
  42. Afy-Shararah, M.; Salonitis, K. Integrated modeling of “soft” and “hard” variables in manufacturing. Int. J. Adv. Manuf. Technol. 2022, 122, 4259–4265. [Google Scholar] [CrossRef] [PubMed]
  43. Possik, J.; Zouggar-Amrani, A.; Vallespir, B.; Zacharewicz, G. Lean techniques impact evaluation methodology based on a co-simulation framework for manufacturing systems. Int. J. Comput. Integr. Manuf. 2022, 35, 91–111. [Google Scholar] [CrossRef]
  44. Martinez, P.; Ahmad, R. Quantifying the impact of inspection processes on production lines through stochastic discrete-event simulation modeling. Modelling 2021, 2, 406–424. [Google Scholar] [CrossRef]
  45. Tomaszewska, K. Comparative simulation of the production flow with the implementation of Kanban and DBR. Manag. Prod. Eng. Rev. 2023, 14, 79–87. [Google Scholar] [CrossRef]
  46. Abd Rahman, M.S.; Mohamad, E.; Abdul Rahman, A.A. Enhancement of overall equipment effectiveness (OEE) data by using simulation as decision making tools for line balancing. Indones. J. Electr. Eng. Comput. Sci. 2020, 18, 1040–1047. [Google Scholar] [CrossRef]
  47. de Paula Ferreira, W.; Armellini, F.; de Santa-Eulalia, L.A.; Thomasset-Laperrière, V. Extending the lean value stream mapping to the context of Industry 4.0: An agent-based technology approach. J. Manuf. Syst. 2022, 63, 1–14. [Google Scholar] [CrossRef]
  48. Mahdiraji, H.A.; Yaftiyan, F.; Abbasi-Kamardi, A.; Garza-Reyes, J.A. Investigating potential interventions on disruptive impacts of industry 4.0 technologies in circular supply chains: Evidence from SMEs of an emerging economy. Comput. Ind. Eng. 2022, 174, 108753. [Google Scholar] [CrossRef]
  49. Machado, C.G.; Winroth, M.P.; Ribeiro da Silva, E.H.D. Sustainable manufacturing in industry 4.0: An emerging research agenda. Int. J. Prod. Res. 2019, 58, 1462–1484. [Google Scholar] [CrossRef]
  50. Javaid, M.; Haleem, A.; Singh, R.P.; Rab, S.; Suman, R.; Khan, S. Exploring relationships between lean 4.0 and manufacturing industry. Ind. Robot 2022, 49, 402–414. [Google Scholar] [CrossRef]
  51. Korchagin, A.; Deniskin, Y.; Pocebneva, I.; Vasilyeva, O. Lean maintenance 4.0: Implementation for aviation industry. Transp. Res. Procedia 2022, 63, 1521–1533. [Google Scholar] [CrossRef]
  52. Sarker, M.R.; Ahmed, F.; Deb, A.K.; Chowdhury, M. Identifying barriers for implementing green supply chain management (GSCM) in footwear industry of Bangladesh: A Delphi study approach. Leather Footwear J. 2018, 18, 175–186. [Google Scholar] [CrossRef]
  53. Contini, G.; Grandi, F.; Peruzzini, M. A framework to enhance corporate sustainability in manufacturing through digital technologies and system thinking. In Advances in Transdisciplinary Engineering; Cooper, A., Trigos, F., Stjepandić, J., Curran, R., Lazar, I., Eds.; IOS Press: Amsterdam, The Netherlands, 2024; pp. 504–513. [Google Scholar] [CrossRef]
  54. Pattanaik, L.N. Simulation optimization of manufacturing takt time for a leagile supply chain with a de-coupling point. Int. J. Ind. Eng. Manag. 2021, 12, 102–114. [Google Scholar] [CrossRef]
  55. Gurbuz, M.C.; Yurt, O.; Ozdemir, S.; Sena, V.; Yu, W. Global supply chains risks and COVID-19: Supply chain structure as a mitigating strategy for small and medium-sized enterprises. J. Bus. Res. 2023, 155, 113407. [Google Scholar] [CrossRef] [PubMed]
  56. Wei, D. Modeling and simulation of a multi-agent green supply chain management system for retailers. J. Eur. Des Systemes Automatises 2020, 53, 549–557. [Google Scholar] [CrossRef]
  57. Rashad, W.; Nedelko, Z. Global sourcing strategies: A framework for lean, agile, and leagile. Sustainability 2020, 12, 7199. [Google Scholar] [CrossRef]
  58. Yadav, G.; Kumar, A.; Luthra, S.; Garza-Reyes, J.A.; Kumar, V.; Batista, L. A framework to achieve sustainability in manufacturing organisations of developing economies using industry 4.0 technologies’ enablers. Comput. Ind. 2020, 122, 103280. [Google Scholar] [CrossRef]
  59. Abideen, A.Z.; Sundram, V.P.K.; Pyeman, J.; Othman, A.K.; Sorooshian, S. Digital twin integrated reinforced learning in supply chain and logistics. Logistics 2021, 5, 84. [Google Scholar] [CrossRef]
  60. Schulze, F.; Dallasega, P. Industry 4.0 concepts and lean methods mitigating traditional losses in engineer-to-order manufacturing with subsequent assembly on-site: A framework. Procedia Manuf. 2020, 51, 1363–1370. [Google Scholar] [CrossRef]
  61. Spiryagin, M.; Wu, Q.; Polach, O.; Thorburn, J.; Chua, W.; Spiryagin, V.; Stichel, S.; Shrestha, S.; Bernal, E.; Ahmad, S.; et al. Problems, assumptions and solutions in locomotive design, traction and operational studies. Rail. Eng. Science 2022, 30, 265–288. [Google Scholar] [CrossRef]
  62. Daniyan, I.; Mpofu, K.; Ramatsetse, B.; Zeferino, E.; Monzambe, G.; Sekano, E. Design and simulation of a flexible manufacturing system for manufacturing operations of railcar subassemblies. Procedia Manuf. 2021, 54, 112–117. [Google Scholar] [CrossRef]
  63. Ricondo, I.; Porto, A.; Ugarte, M. A digital twin framework for the simulation and optimization of production systems. Procedia CIRP 2021, 104, 762–767. [Google Scholar] [CrossRef]
  64. Magnanini, M.C.; Tolio, T.A.M. A model-based digital twin to support responsive manufacturing systems. CIRP Annals 2021, 70, 353–356. [Google Scholar] [CrossRef]
  65. Liebrecht, C.; Kandler, M.; Lang, M.; Schaumann, S.; Stricker, N.; Wuest, T.; Lanza, G. Decision support for the implementation of industry 4.0 methods: Toolbox, assessment and implementation sequences for industry 4.0. J. Manuf. Syst. 2021, 58, 412–430. [Google Scholar] [CrossRef]
  66. ProModel. Available online: https://www.promodel.com/products/learnpromodel (accessed on 28 June 2024).
  67. Minitab, Statistical Software. Available online: https://www.minitab.com/en-us/products/minitab/ (accessed on 25 June 2024).
  68. Geer Mountain, Statistically Fit Software. Available online: https://www.mcssl.com/store/geermountainsoftwarecorp/statfit-student-version-3121Sd (accessed on 15 June 2024).
  69. Wondershare, EdrawMax. Available online: https://www.edrawsoft.com/edraw-max/ (accessed on 15 June 2024).
  70. Greenwood, A.G.; Pawlewski, P.; Bocewicz, G. A conceptual design tool to facilitate simulation model development: Object flow diagram. In Proceedings of the Winter Simulation Conference, Washington, DC, USA, 8–11 December 2013. [Google Scholar] [CrossRef]
  71. Banks, J.; Carson II, J.S.; Nelson, B.L.; Nicol, D.M. Discrete-Event System Simulation, 5th ed.; Pearson: London, UK, 2013; pp. 8–12. [Google Scholar]
  72. Agostinho Jr, V.; Baldo, C.R. Assessment of the impact of industry 4.0 on the skills of lean professionals. Procedia Cirp 2021, 96, 225–229. [Google Scholar] [CrossRef]
  73. Moeuf, A.; Pellerin, R.; Lamouri, S.; Tamayo-Giraldo, S.; Barbaray, R. The industrial management of SMEs in the era of industry 4.0. Int. J. Prod. Res. 2018, 56, 1118–1136. [Google Scholar] [CrossRef]
  74. Sony, M.; Naik, S. Critical factors for the successful implementation of industry 4.0: A review and future research direction. Prod. Plann. Control 2020, 31, 799–815. [Google Scholar] [CrossRef]
  75. Mahmood, A.; Ali, A.A.; Nazam, M.; Nazim, M. Developing an interplay among the psychological barriers for the adoption of industry 4.0 phenomenon. PLoS ONE 2021, 16, e0255115. [Google Scholar] [CrossRef]
  76. Alaloul, W.S.; Liew, M.S.; Zawawi, N.A.W.A.; Kennedy, I.B. Industrial revolution 4.0 in the construction industry: Challenges and opportunities for stakeholders. Ain Shams Eng. J. 2020, 11, 225–230. [Google Scholar] [CrossRef]
  77. Kumar, R.; Singh, R.K.; Dwivedi, Y.K. Application of industry 4.0 technologies in SMEs for ethical and sustainable operations: Analysis of challenges. J. Clean. Prod. 2020, 275, 124063. [Google Scholar] [CrossRef] [PubMed]
  78. Kikolski, M. Study of production scenarios with the use of simulation models. Procedia Eng. 2017, 182, 321–328. [Google Scholar] [CrossRef]
  79. Tripathi, V.; Chattopadhyaya, S.; Mukhopadhyay, A.K.; Sharma, S.; Li, C.; Di Bona, G. A Sustainable methodology using lean and smart manufacturing for the cleaner production of shop floor management in industry 4.0. Mathematics 2022, 10, 347. [Google Scholar] [CrossRef]
  80. Bottalico, A. Automation processes in the port industry and union strategies: The case of Antwerp. New Global Stud. 2022, 16, 31–47. [Google Scholar] [CrossRef]
  81. Pagliosa, M.; Tortorella, G.; Ferreira, J.C.E. Industry 4.0 and lean manufacturing: A systematic literature review and future research directions. J. Manuf. Technol. Manag. 2021, 32, 543–569. [Google Scholar] [CrossRef]
  82. Cioffi, R.; Travaglioni, M.; Piscitelli, G.; Petrillo, A.; Parmentola, A. Smart manufacturing systems and applied industrial technologies for a sustainable industry: A systematic literature review. Appl. Sci. 2020, 10, 2897. [Google Scholar] [CrossRef]
  83. Uriarte, A.G.; Ng, A.H.C.; Moris, M.U. Supporting the lean journey with simulation and optimization in the context of industry 4.0. Procedia Manuf. 2018, 25, 586–593. [Google Scholar] [CrossRef]
  84. Varela, L.; Araújo, A.; Ávila, P.; Castro, H.; Putnik, G. Evaluation of the relation between lean manufacturing, industry 4.0, and sustainability. Sustainability 2019, 11, 1439. [Google Scholar] [CrossRef]
Figure 1. Description of the research methodology.
Logistics 09 00033 g001
Figure 2. Flow chart remanufacturing process.
Logistics 09 00033 g002
Figure 3. Object flow diagram of the remanufacturing line.
Logistics 09 00033 g003
Figure 4. Scenario 5 with the LM, SC, and I4.0 strategies integrated.
Logistics 09 00033 g004
Table 1. Strategies and core tools, methods, and techniques.
Strategies
Lean Manufacturing
VSM: Midilli and Elevli [38], Pekarcikova et al. [39], Trebuna et al. [40], Aksar et al. [41], Afy-Shararah and Salonitis [42], Ferreira et al. [47], Javaid et al. [50], Schulze and Dallasega [60]. SMED: Possik et al. [43]. Kanban: Pekarcikova et al. [39], Trebuna et al. [40], Tomaszewska [45], Schulze and Dallasega [60]. JIT: Korchagin et al. [51], Pattanaik [54], Schulze and Dallasega [60]. OEE: Abd Rahman et al. [46]. TPM: Korchagin et al. [51], Schulze and Dallasega [60]. Poka Y.: Possik et al. [43], Korchagin et al. [51], Schulze and Dallasega [60]. DBR: Tomaszewska [45]. 5s: Possik et al. [43].
Supply Chain
ERP: Abideen et al. [59], Ricondo et al. [63], Magnanini and Tolio [64]. GSCM: Machado et al. [49], Sarker et al. [52], Wei [56], Yadav et al. [58]. SM: Martinez and Ahmad [44], Machado et al. [49], Pattanaik [54], Gurbuz et al. [55], Rashad and Nedelko [57], Yadav et al. [58], Abideen et al. [59], Schulze and Dallasega [60]. Logistic: Pekarcikova et al. [39], Pattanaik [54], Gurbuz et al. [55], Wei [56], Rashad and Nedelko [57], Yadav et al. [58], Abideen et al. [59]. SMo: Machado et al. [49].
Industry 4.0
IoT: Machado et al. [49], Javaid et al. [50], Korchagin et al. [51], Yadav et al. [58], Abideen et al. [59], Schulze and Dallasega [60], Daniyan et al. [62], Ricondo et al. [63], Magnanini and Tolio [64]. BD: Mahdiraji et al. [48], Machado et al. [49], Korchagin et al. [51]. Robotics: Machado et al. [49], Schulze and Dallasega [60], Daniyan et al. [62]. CPS: Machado et al. [49], Yadav et al. [58]. AI: Yadav et al. [58], Abideen et al. [59]. DT: Abideen et al. [59], Ricondo et al. [63], Magnanini and Tolio [64]. AR/VR: Machado et al. [49], Korchagin et al. [51], Contini et al. [53], Schulze and Dallasega [60]. CC: Machado et al. [49], Schulze and Dallasega [60], Ricondo et al. [63].
Table 2. Experimental conditions for the remanufacturing line.
Observed ItemDescription
ProductTransportation
Type of productionOne piece flow
Number of basic operations6
Remanufacturing lineManual
Number of workers3
Planned downtime30 min
Total working time480 min
Readiness IoTInitial
Readiness LMInitial
Readiness SCInitial
KPIsThroughput, cycle time (CT), human labor occupation
Table 3. Notation of variables and parameters in the model.
NotationDecision VariablesNotationParameters
CTijCycle time for engine i at operation j (hours)JTotal number of operations (P1–P6)
UwjUtilization of workstation j (percentage).NTotal number of engines to be remanufactured
TTRjTime to repair at operation j (hours)OkNumber of operators available (k=3)
TBFjTime between failures for operation j (hours)TijProcessing time for engine i at operation j (hours)
XijBinary variable (1 if engine i is processed at operation j, 0 otherwise)PfProbability of failure at operation j
QiQuality compliance of engine i (1 if meets standards, 0 otherwise)CjCapacity of workstation j (units/hour)
LhHuman labor occupation (percentage of total available labor)TTotal available working time (hours per shift/day)
TPTotal throughput (engines remanufactured per time unit) S Storage location capacity (pallets).
QOutput Qualityλ123Weighting coefficients for the objective function
DMarketing demand
Table 4. The strategies applied to the scenarios for the remanufacturing line.
ScenarioDescriptionStrategies LM, SC and I4.0Core Tools
1Remanufacturing line initial conditions. A forklift hauls
materials from the warehouse to stations, a crane transports
engines, and a warehouse holds materials.
Basic model-
2Scenario 1, plus the change in the layout distribution that decreases the distance by 66% from P3 station to P2 and P4 to reduce personnel trips, CT, and throughput.LM1: Layout redesign to reduce travel times in the process.VSM,
SD, LR
3Scenario 2, plus the supply of SM type materials for a better disposition of the materials, using a forklift to station P3
reduces delivery time by 9.91%.
LM2: Reduction in operator
down time. SC1: New
arrangement of materials.
KA,
SM
4Scenario 3, plus the employment of MK ready to use at P3 station, previously checked BOM at P2, the materials are ordered and sent to continue the flow of a piece with KN systems.LM3: Installation of material
kits at the point of use.
SC2: Order of materials by kit.
MK
KN
5Scenario 4, plus IoT for communication in the areas, exploiting CC, statistics, and information. A synchronization between P2 and the warehouse occurs for the arrival of the MK to P3.I4.0: Integration of IoT and
data in the cloud.
IoT,
CC
VSM: Value stream mapping; SD: Spaguetti diagram; LR: Layout redesign; KA: Kaizen; SM: Supply management; MK: Material kits; KN: Kanban; CC: Cloud computing.
Table 5. Results of the scenarios, remanufactured engines, and average times.
ScenarioStrategies VATNVAT
Throughput
(Engines)
WIP
(Components)
CT
(h)
ATP
(h)
ATML
(h)
ATW
(h)
ATB
(h)
1Basic model29.01.0269.89125.5490.0847.286.99
2LM129.01.0238.41123.65104.336.693.46
3LM2, SC131.01.0213.18122.1781.733.485.80
4LM3, SC234.40.0216.12115.1888.013.948.99
5I4.040.00.0214.45115.0690.113.305.99
Disclaimer/Publisher’s Note: The statements, opinions and data contained in all publications are solely those of the individual author(s) and contributor(s) and not of MDPI and/or the editor(s). MDPI and/or the editor(s) disclaim responsibility for any injury to people or property resulting from any ideas, methods, instructions or products referred to in the content.

