Abstract
Background: In today’s business world, where competition lies between supply chains, customer expectations are changing dynamically. Effective order picking in warehouses has become a top concern given expectations for rapid delivery, a larger product range, and continuous support. Methods: In this study, it is aimed to find a simultaneous solution to the problems of picker routing and order batching, which have an important place in order picking. A genetic algorithm-based solution with group-based coding is proposed to minimize the travel time of pickers. Results: A new set of equations for rectangular warehousing systems with three or more blocks (multi-blocks) is presented to directly determine the shortest distances between order points. It is found that the proposed solution methodology gives better results than traditional approaches. Conclusions: The study is expected to contribute to the improvement of order picking, which is the most costly and repetitive activity in warehouses, within the scope of practical and academic applications.
1. Introduction
Warehouses have always been essential components of supply chains. The growth and development of both online and offline commerce have facilitated the evolution of increasing retail system needs into highly sophisticated order fulfillment centers today [1]. A greater emphasis has been placed on warehousing systems as a consequence of the integration of supply chain management with approaches such as just-in-time. The development of demand, including enhanced stock control, reduced response times, and increased product diversity, has made the meticulous management of warehouse operations an increasingly critical task [2,3].
The expression “travel” is often related to good stuff. For a mall, the longer the consumer’s travel time, the more satisfying it can be for the business. But in a logistics service provider’s warehouse, excessive picker travel time is the main enemy of an efficient order picking process [4]. Order picking has often been regarded as one of the most laborious and time-intensive processes of warehousing [5]. The travel time shall increase as the distance that should be used by the picker to recover the items demanded in the order from the customer. The minimization of this distance is then usually proposed as a possible leverage to reduce the overall picking time [6]. Customer satisfaction is directly influenced by the correct organization and execution of order picking operations [7]. Regarding e-commerce, customer demands for immediate fulfillment are even more significant [8].
In fact, a huge proportion of warehouses are run according to the principle of picker-to-part and work manually [9]. Automatic storage systems are on the agenda of many companies as a popular approach, but automatic systems are used in more than 10% of US warehouses [10]. The main reason is that conventional warehouse systems still have the advantage of very competitive installation and usage costs, especially for logistics service providers. When the literature is examined, it is seen that the studies focused on order picking in conventional warehouses with cross-aisles have increased gradually in recent years [11,12,13,14,15,16,17].
The main goal in warehouses is to minimize the operational costs of internal operations and reduce the duration of operations for this purpose. It is therefore necessary to minimize the estimated distance traveled in the unit-load warehouse [18]. Order picking can consume up to 60% of all work in the warehouse, and it is estimated that with the average warehouse in mind, the picking cost is 50–75% of the overall operational cost of the facility [19,20,21,22]. Currently, warehouses supporting retail systems can serve both traditional stores and e-commerce sales channels. In both cases, warehouse experts consider order picking the most vital activity for enhancing efficiency due to the factors mentioned above [23,24,25]. With digitalization, it is suggested as a strong opinion that the solution to the problems in all areas passes through innovation. However, conventional operations are largely ongoing in many of the industries and greatly in need of improvement in terms of costs in the case.
Over the past decades, the offer of value-added logistics services has risen with the growing trend towards outsourcing [26,27]. The importance of the warehouse function has become even more important in logistics activities with the widespread demand-oriented organizations and the just-in-time understanding of requests such as high product diversity, smaller batch sizes, less product demand, low delivery times, and quick response needs.
The rapid growth of e-commerce [28,29] has seemingly simplified the purchase and delivery of goods to customers; however, it has imposed considerable pressure on logistics service providers regarding time and cost efficiency [30]. This research presents a new set of equations for determining the shortest distance between order points, as well as a new group of coding genetic algorithm (GA) solutions that reduces travel distance in the order picking operation. Genetic algorithms are stochastic optimization methods derived from natural selection, commonly utilized to address several categories of NP-hard problems [31]. The goal of this study is to address the subsequent three research questions:
- ▪
- How can one accurately ascertain the shortest distance between two orders in warehouses with multiple blocks?
- ▪
- How to solve the issues of batching and routing for the order picker being addressed concurrently?
- ▪
- Can the proposed approach enhance the warehouse operations of a real-world logistics service provider?
Initially presented together with their effects on intra-warehouse movement were back-to-back racking, multi-block arrangement, and cross-aisle in order to answer the first research question. Then, a novel set of equations was developed to determine distances between two locations, therefore permitting the construction of a distance matrix applied in heuristic and metaheuristic solution methods. To address the remaining two inquiries, we designed a genetic algorithm-based solution approach that simultaneously handles order batching and order picker routing. Methods based on genetic algorithms (GAs), the Clarke–Wright (CW) heuristic, and randomized savings (RS) heuristic were evaluated against various solution parameters utilizing real-world data. The development of distance matrices based on the formulated equations and the coding of the proposed genetic algorithm-based solution were performed using the C# programming language within the Visual Studio environment. The third-party logistics warehouse located in Türkiye provided the data used in this research.
The fundamental gap that our research focuses on can be expressed as follows: While professional warehouse managers aim to implement practical policies, they increasingly move away from optimal solutions. On the other hand, researchers, struggling to take practitioners’ perspectives into account, may become detached from real-world field conditions [32]. Additionally, modern warehouses increasingly feature multi-block-based layouts. However, in the academic literature, analyses predominantly focus on single-block and two-block warehouses. These existing solutions often fail to effectively address order picking problems in warehouses with multi-block layouts [33,34,35]. The present research proposes a solution by introducing an approach that uses explicit equations on the most often utilized layout in practice.
This study’s key contributions can be encapsulated as follows: From a practitioner’s viewpoint, it enhances warehouse efficiency through reduced journey distances. From a research standpoint, it demonstrates the efficacy of metaheuristic techniques in intra-facility logistics challenges by employing novel distance computation methods. This paper organizes the subsequent sections as follows: Section 2 delineates the order picking problem and introduces distance modeling. The suggested group-based coded genetic algorithm approach is elucidated in Section 3. Real-world scenarios are illustrated in Section 4, which demonstrates the implementation of the application and the subsequent outcomes. The Conclusions Section of this study summarizes findings and proposes topics for future research.
2. Order Picking: An Overview
In the past, warehouses were typically designed and operated as single-block systems. However, the demand for efficient warehouse operations has led modern storage systems to incorporate cross-aisles. In warehouses where order-picking activities are intense, one or more cross-aisles can be integrated to minimize the travel distance of order pickers [36,37,38]. While traditional storage systems are represented as single-block systems (a), the cross-aisles shown in options b and c of Figure 1 enable the creation of two-block or multi-block shelving configurations. Recent academic studies have also recommended conducting research on warehouses with multiple blocks [16].
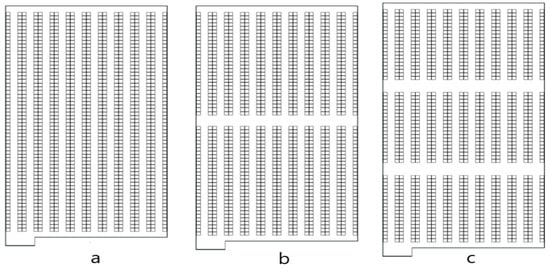
Figure 1.
One (a)-, two (b)-, and three (c)-block warehouses.
Order picking refers to the process of retrieving products from their designated locations within the warehouse racking system and delivering them to the required destination to meet customer demands [39]. Within the supply chain, particularly in warehouses managed by logistics service providers where workflows are intensive, the planning of order picking operations is carried out in two main stages. The first stage involves grouping incoming orders, while the second entails order pickers collecting the grouped orders in a specified sequence and delivering them to the pick-and-drop (P/D) or depot point [40].
Unproductive picker walking time is undoubtedly the most significant issue in the picker-to-parts configuration. It is frequently estimated that this time consumes 50% or more of the pickers’ time at work [41]. The racking system provides a significant problem in terms of direct access to the relevant orders. To go between aisles, order pickers must pass via aisle entrances and exits, which complicates the process. Furthermore, parallel racking systems limit the movement of order pickers since they frequently have to travel through certain nodes at aisle crossings even when there are no orders to pick. These properties cause the problem to differ greatly from previous models such as the traveling salesman problem (TSP) and the vehicle routing problem (VRP), making direct adaption impractical. Because of its computational complexity, researchers have classified the order picking issue as NP-hard [9,42].
In the literature, studies on single-block warehouses frequently employ various heuristic methods such as S-shape, midpoint, largest gap, and return. However, for higher-level problems, metaheuristic approaches like simulated annealing, genetic algorithms, ant colony optimization, particle swarm optimization, and tabu search have also been utilized to achieve better results [9,39,40,43]. One of the most difficult aspects of handling the order picking problem is determining the distances between orders. As the picker seeks to go from one order position to another, the racking system can function as a barrier, and depending on the layout, there may be various paths and distance alternatives between two spots rather than a single straight path. This intricacy makes it more difficult to solve the problem and involves the creation of equations that offer location-specific rectilinear distances between order sites. Euclidean distances between points are not appropriate for this sort of situation. The basic rectilinear distance computation, which includes accumulating vertical and horizontal distances based on the target locations’ x and y coordinates, may appear to be a simple procedure. However, it does not apply to orders placed in various aisles of the same block [44]. Furthermore, when considering order placements within the warehouse, a large number of alternate rectilinear distance alternatives may occur for orders located in various aisles and blocks. In research trying to reduce the order picker’s journey distance, it is critical to utilize the shortest rectilinear distance among the available possibilities. Some studies have estimated distance values using specific formulas [45], while others have proposed that the order picker completes the picking tour using the S-shape method to determine the distance between orders to be picked [39]. Regardless of which approach is used to improve the order picking process, it is critical that operations are carried out with the minimum distance between two order points [44,46].
In Figure 2a, the distance between two points, shown as X1 and X2, is calculated using Euclidean measurement by applying Equation (1), yielding the specified result. Rectilinear distance measurement, on the other hand, is expressed using Equation (2).
d (X1, X2) = [(x1j – x2j)2 + (x2i – x1i)2 ]1/2
d (X1, X2) = [(6 – 2)2 + (5 – 2)2 ]1/2 =5
d (X1, X2) = [(6 – 2)2 + (5 – 2)2 ]1/2 =5
d (X1, X2) = (x1j – x2j) + (x2i – x1i)
d (X1, X2) = (6 – 2) + (5 – 2) =7
d (X1, X2) = (6 – 2) + (5 – 2) =7
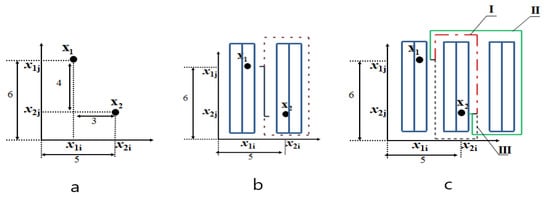
Figure 2.
Some possible distances between two points in different aisles within the same block of the racking system (Racking system represented by blue rectangle; (a,b): The distance based on conventional distance calculation methods; (c): three kinds of the distances represented by red dotted-dashed (I), and green solid lines (II) and black dashed (III)).
As seen in Figure 2a,b, when points X1 and X2 represent orders to be picked from a back-to-back racking system, even for a single-block system, calculating the distance reveals a complex structure. Conventional distance calculation methods for determining the shortest path between two points cannot be directly applied. In warehouses with cross-aisles, the calculation of the distance between shipments located in various sections is further complicated. Distance calculations are significantly influenced by factors such as the position of items within the storage spaces, rack dimensions, and aisle dimensions.
In Figure 2c, the distances between points X1 and X2 are illustrated with three different case routes, represented by dashed, dotted-dashed, and solid lines. Depending on the racking system, a multitude of similar distances can be identified between the specified X1 and X2 points. While distances between a few orders in a small warehouse can be visually determined, for modern industrial multi-block warehouses with order lists containing more than a hundred points, finding the shortest distance between orders becomes a problem in its own right. To optimize the travel distance of order pickers, it is crucial to determine the shortest travel distance between orders to be picked and to design solution algorithms accordingly. An efficient order picking system facilitates rapid item retrieval and consequently reduces order lead times, enhancing responsiveness to last-minute orders and minimizing delivery times to customers [47].
This study simultaneously addresses two distinct warehousing problems. Within the scope of order picking, the picker routing and order batching problems are combined into a single model, emphasizing the minimization of total travel distance. The formulated model and the developed approach for the stated problem incorporate the following parameters [48]: The set F includes all possible batches, while the set J includes every customer’s order. If a batch does not exceed the picking device’s capacity restriction, it is said to be feasible. A customer’s order j ∈ J is either included in batch f ∈ F (afj = 1) or not (afj = 0), as indicated by the constant afj. Additionally, the constant df denotes the minimal length of an order picking tour that encompasses all items of the customer’s orders included in batch f ∈ F. The associated routing problem must be solved for each feasible batch f ∈ F in order to calculate the constant df. Lastly, the variable xf denotes whether batch f ∈ F is selected (xf = 1) or not (xf = 0). The mathematical model can be expressed as follows:
Constraints (4) and (5) guarantee that a selection of batches is made such that each customer’s order is included in precisely one of these batches. The objective function denotes the total tour length resulting from the selected batches [48]. In this integrated problem, which can also be represented by more comprehensive mathematical models, the key objectives are to accurately calculate the distances between orders and to perform grouping under capacity constraints, especially in warehouses with a large number of blocks. In recent years, there has been a noticeable increase in studies addressing the solution of the integrated picker routing and batching problem.
Scholz et al. [49] conducted a study on a two-block warehouse, simultaneously addressing the batching, assignment, sequencing, and routing issues. When tested on large sample sets of 100 and 200 orders, they implemented a variable neighborhood descent algorithm and reported highly promising outcomes. Cano et al. [50] solved the problem’s order batching phase using a metaheuristic approach based on an item-oriented genetic algorithm and a unique chromosomal representation. The picker routing step used the S-shape routing policy. The researchers emphasized that their solution, in which each gene correlates to a customer order, was first described in the literature. They also reported a considerable improvement in overall distance traveled after using the application in a warehouse with two cross-aisles.
Aerts et al. [51] handled the integrated problem with a Hausdorff distance-based methodology, which included a two-tier variable neighborhood search technique. Their findings indicated that, in most situations analyzed, the method produced favorable outcomes regarding travel distance and computational time. Attari et al. [52] examined the integrated batching-routing problem by introducing three separate meta-heuristic methods: the genetic algorithm, particle swarm optimization algorithm, and artificial bee colony algorithm. The results indicated little differences among the strategies regarding traveled distance, with the genetic algorithm demonstrating superior computing efficiency, surpassing the other two algorithms in processing time. Haouassi et al. [53] offered a comprehensive approach that addressed picker routing and batch scheduling. They used a constraint programming model to identify the best routes and sequences after first employing a heuristic strategy to sort orders into batches. Cao et al. [54] used a hybrid iterated local search algorithm combined with heuristic criteria to solve batching, sequencing, and picker routing problems simultaneously. Using the Manhattan distance strategy, they ran several simulations and concluded that their proposed method performed effectively. Hedayati et al. [55] concentrated on the accurate formulation of the distance matrix, which functions as the input for addressing the integrated batching and routing problem. They designed a specific procedure for single-block warehouses including three main vertical aisles and one central depot. Their suggested mixed-integer programming approach was evaluated with order sizes of 8, 12, and 16 items.
Pinto and Nagano [56] stated in their most recent review on the topic that research using picking optimization methods frequently focuses on hypothetical scenarios formed in realistic circumstances for single-block or two-block warehouses. They underlined the need for studies reflecting real-life dynamics as practically accurate.
3. Methodology
Order picking is the most time-consuming and labor-intensive task in a warehouse; thus, even minor improvements can lead to significant increases in productivity [57]. Warehouses rely largely on human order picking procedures, making it crucial to minimize order picking time [58]. Reducing the distance traveled by the order picker is the primary basis for minimizing picking time, so attention should be paid to precisely constructing the distance matrix as the first step. The distance between two storage locations is calculated using the Manhattan distance metric [59].
For warehouses with more than two blocks, a specific set of equations has been developed in this study to facilitate calculations using this type of distance approach. This ensures the accurate construction of the distance matrix, allowing progression to the subsequent phase of the solution process. After that, we discuss conventional solutions, including the Clarke–Wright (CW) heuristic and the randomized savings (RS) heuristic. Moreover, this work presents a new group-based genetic algorithm method as a sophisticated solution for the problem. The flowchart of the applied methodology is presented in Figure 3.
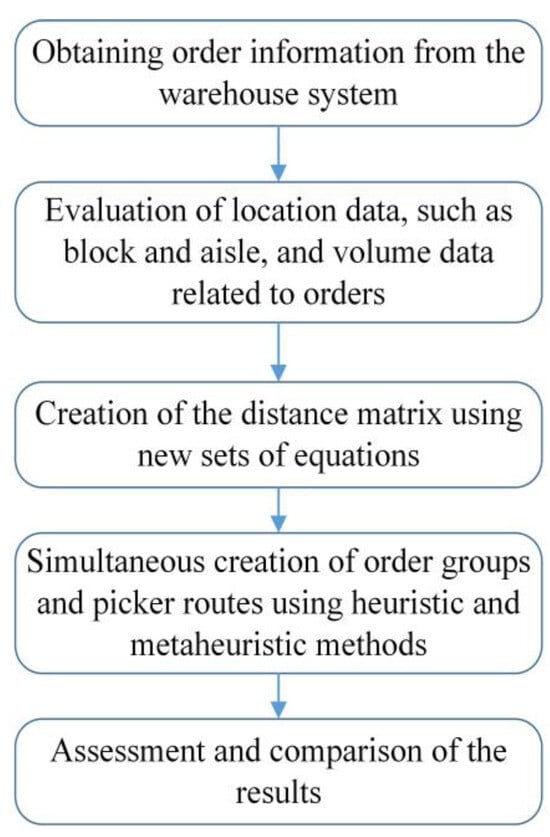
Figure 3.
Flowchart of the methodology.
3.1. Computing the Distance Matrix
The features of the warehouse racking system and their locations provide one of the main inputs when creating the distance matrix and applying the methodologies. In the facility under study, the designated products are stored in a back-to-back racking system. This section of the warehouse features main cross-aisles at the front and rear, as well as two additional cross-aisles in the middle, designed to facilitate operations.
The order picker starts from the depot and, if necessary, utilizes the cross-aisles to collect the items on their list before returning to the depot. Figure 4 illustrates the layout of the warehouse, which consists of three blocks with parallel back-to-back racking systems. Based on the current technical specifications, the features of the six-level back-to-back racking system are outlined as follows:
Number of rack rows in the warehouse: 24;
Number of aisles in the warehouse: 12;
Aisle width: 2.5 m;
Number of blocks: 3 blocks;
Number of cross-aisles: 4 (2 main cross-aisles and 2 cross-aisles in the middle);
Cross-aisle width: 3 m;
Number of storage cells in a single block’s row: 38;
Storage cell dimensions (length and width): 1.3 m × 1.3 m;
Block length: 38 × 1.3 = 49.4 m;
Total number of storage locations: 2736.
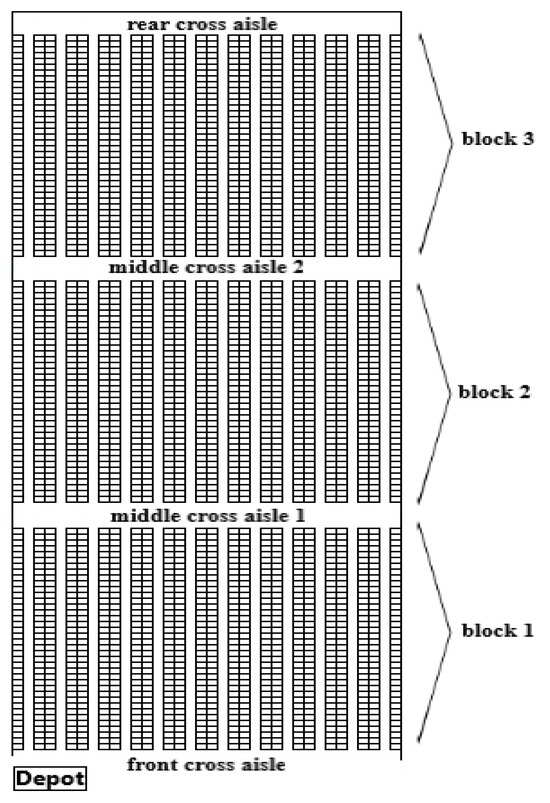
Figure 4.
Three-block warehouse layout.
Figure 4.
Three-block warehouse layout.

To maximize the order picking process in warehouses with back-to-back racking systems, one must employ particular rectilinear spacing rather than Euclidean distances. Further complicating the calculation of the shortest travel distance is a rise in the number of cross-aisles in the warehouse, introducing many rectilinear distance options between two sites. This paper presents a series of equations presented to find the shortest distance between two orders depending on their locations in 14 different scenarios, therefore applicable not only to three-block systems but also to multi-block warehouses. Denoted as i and j, the equations solve the locations of any two orders inside the parallel racking system. These formulas are show as follows:
| Case 1: If ONi = 0, ONj ≠ 0, and Ai = Aj, D (i,j) = (Cj × HU) + [(Bj − 1) × (CA + BL)]; | |
| Case 2: If ONi ≠ 0, ONj = 0, and Ai = Aj, D (i,j) = (Ci × CL) + [(Bi − 1) × (CA + BL)]; | |
| Case 3: If ONi = 0, ONj ≠ 0, and Ai ≠ Aj and if Rj is odd, use Rj + 1 for D(i,j) = (Cj × CL) + [(Bj − 1) × (CA + BL)] + [(Rj − 2) × CW] + [((Rj/2) − 1) × AW]; | |
| Case 4: If ONi ≠ 0, ONj = 0, and Ai ≠ Aj and if Ri is odd, use Ri + 1 for D (i,j) = (Ci × CL) + [(Bi − 1) × (CA + BL)] + [(Ri − 2) × CW] + [((Ri/2) − 1) × AW]; | |
| Case 5: If ONi ≠ 0, ONj ≠ 0, and Ai = Aj, D (i,j) = |[(Bi − 1) × (BL)] + [((Bi − 1) × CA) + Ci × CL] − [(Bj − 1) × (BL)] − [((Bj − 1) × CA) + Cj × CL]|; | |
| Case 6: If ONi ≠ 0, ONj ≠ 0, Ai ≠ Aj, Bi = Bj, (Ci + Cj) × CL > BL, and |Ri − Rj| is an even number, D (i,j) = (BL − Ci × CL) + (BL − Cj × CL) + 2 × CL + (|Ri − Rj| × CW) + (|Ai − Aj| × AW); | |
| Case 7: If ONi ≠ 0, ONj ≠ 0, Ai ≠ Aj, Bi = Bj, (Ci + Cj) × CL > BL, and |Ri − Rj| = (2 × |Ai − Aj|) − 1, D (i,j) = (BL − Ci × CL) + (BL − Cj × CL) + 2 × CL + ((|Ri − Rj| × CW) + CW) + (|Ai − Aj| × AW); | |
| Case 8: If ONi ≠ 0, ONj ≠ 0, Ai ≠ Aj, Bi = Bj, and (Ci + Cj) × CL > BL, D (i,j) = (BL − Ci × CL) + (BL − Cj × CL) + 2 × CL + ((|Ri − Rj| × CW) − CW) + (|Ai − Aj| × AW); | |
| Case 9: If ONi ≠ 0, ONj ≠ 0, Ai ≠ Aj, Bi = Bj, (Ci + Cj) × CL ≤ BL, and |Ri − Rj| is an even number, D (i,j) = ((Ci + Cj) × CL) + (|Ri − Rj| × CW) + (|Ai − Aj| × AW); | |
| Case 10: If ONi ≠ 0, ONj ≠ 0, Ai ≠ Aj, Bi = Bj, (Ci + Cj) × CL ≤ BL, and |Ri − Rj| = (2 × |Ai − Aj|) − 1, D (i,j) = ((Ci + Cj) × CL) + ((|Ri − Rj| × CW) + CW) + (|Ai − Aj| × AW); | |
| Case 11: If ONi ≠ 0, ONj ≠ 0, Ai ≠ Aj, Bi = Bj, and (Ci + Cj) × CL ≤ BL, D (i,j) = ((Ci + Cj) × CL) + ((|Ri − Rj| × CW) − CW) + (|Ai − Aj| × AW); | |
| Case 12: If ONi ≠ 0, ONj ≠ 0, Ai ≠ Aj, Bi ≠ Bj, and |Ri − Rj| is an even number, D (i,j) = |[(Bi − 1) × (BL)] + [((Bi − 1) × CA) + Ci × CL] − [(Bj − 1) × (BL)] − [((Bj − 1) × CA) + Cj × CL]| + (|Ri − Rj| × CW) + (|Ai − Aj| × AW); | |
| Case 13: If ONi ≠ 0, ONj ≠ 0, Ai ≠ Aj, Bi ≠ Bj, and |Ri − Rj| = (2 × |Ai − Aj|) − 1, D (i,j) = |[(Bi − 1) × (BL)] + [((Bi − 1) × CA) + Ci × CL] − [(Bj − 1) × (BL)] − [((Bj − 1) × CA) + Cj × CL]| + ((|Ri − Rj| × CW) + CW) + (|Ai − Aj| × AW); | |
| Case 14: If ONi ≠ 0, ONj ≠ 0, Ai ≠ Aj, and Bi ≠ Bj, D (i,j) = |[(Bi − 1) × (BL)] + [((Bi − 1) × CA) + Ci × CL] − [(Bj − 1) × (BL)] − [((Bj − 1) × CA) + Cj × CL]| + ((|Ri − Rj| × CW) − CW) + (|Ai − Aj| × AW). |
In addition to the equations describing the 14 different positional situations between two points, it is necessary to express the distance between two orders as zero when ONi = ONj. Since the distance from a point to itself is defined as zero units, this case is not explicitly stated. The notations used in the equations are explained in the Abbreviations Section. One can outline the procedures for building the distance matrix as follows:
- Sort the block, shelf, aisle, and cell row numbers for the orders to be picked;
- Define the aisle width, cross-aisle width, cell length, and cell width;
- Examine the block, aisle, shelf, and order numbers of the two items for which the distance needs to be calculated;
- Use the correct equation based on the relative positions of the two orders to calculate the travel distance;
- Proceed to enter the computed distance into the distance matrix;
- Finally, complete the procedure by measuring the distance between all orders in the order list.
This method guarantees the correct and methodical construction of the distance matrix for applications in optimization computations. Before proceeding with the real-world application, the working logic of the proposed distance calculation equations is illustrated through a calculation performed on a sample layout containing 8 orders. Two specific points from Figure 5 are considered for demonstration. The locations of the orders are depicted on the left side of Figure 5. For example, the distance computation between Orders 1 and 4 is fully given below. To confirm, a sketch of the figure is shown here and cross-checked to the right side of Figure 5. In practical applications, visual computations with, for example, 50 order points are not feasible, so constructing a distance matrix using equations becomes indispensable. Initially, the block, shelf, row, and aisle numbers for both orders were considered. The block, shelf, row, and aisle numbers associated with the orders are presented in Table 1. In addition to these values, it is known that the aisle width is 2.5 m; the cross-aisle width is 3 m, and both the cell length and cell width are 1.3 m.
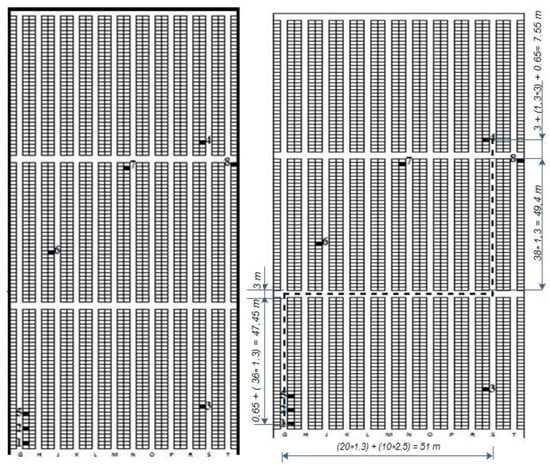
Figure 5.
Order locations within the warehouse for illustrative application.

Table 1.
Location characteristics of Orders 1 and 4.
Order numbers differ from zero, so we obtain the requirements ONi ≠ 0 and ONj ≠ 0. Different aisles and blocks hold the orders. Order 4 comes in Block 3 and Aisle 11; Order 1 is found in Block 1 and Aisle 1. Ai ≠ Aj and Bi ≠ Bj, so the requirements are fulfilled. Under these conditions, you must apply one of the distance-calculating formulas from Case 12, 13, or 14. The equation’s choice relies on the rack row placements of the orders.
“Case 12” will be followed should the criterion |Ri − Rj| be an even number. “Case 13” will be applied should |Ri − Rj| = (2 × (|Ai − Aj|) − 1). If neither of these requirements be met, the equation derived in Case 14 will be used. The condition |Ri − Rj| is not an even number considering Ri = 2 and Rj = 21. Examining the condition |Ri − Rj| = (2 × (|Ai − Aj|) − 1), we obtain |2 − 21| = (2 × (|1 − 11|) − 1), which is valid. The distance between the two orders was thus computed using the equation used for Case 13.
The calculation with the equation for Case 13 was carried out as follows:
| D (i,j) = |[(Bi − 1) × (BL)] + [((Bi − 1) × CA) + Ci × CL] − [(Bj − 1) × (BL)] − [((Bj − 1) × CA) + Cj × CL]| + ((|Ri − Rj| × CW) + CW) + (|Ai − Aj| × AW) | |
| D (1,4) = |[(1−1) × (49.4)] +[((1-1) × 3) + 2 × 1.3] − [(3-1) × (49.4)] − [((3-1) × 3) + 4 × 1.3]| + ((|2 − 21| × 1.3) + 1.3) + (|1 − 11| × 2.5) = 158.4 m |
The different positions of orders within the back-to-back racking system require the use of various situational equations. In real-world order picking applications, regardless of the number of blocks in the warehouse layout, the set of proposed equations can be applied to any scenario in a parallel aisle system, which is the most used in the industry. Due to page limitations, further example calculations are not included in this section.
3.2. Clarke–Wright Heuristic
The Clarke–Wright algorithm is a popular heuristic approach for solving capacity-constrained routing problems [60]. It is one of the basic heuristic methods where order grouping and order picker routing can be performed simultaneously. The CW heuristic is designed based on an algorithm that calculates the savings value of visiting two different points and returning to the starting point, instead of visiting and returning to each point separately [61]. The standard CW heuristic is referred to as the parallel version in the literature, but there is also an application known as the sequential version [62]. Studies have shown that the heuristic method implemented as the parallel version yields better results [63,64,65]. Research has demonstrated that the CW heuristic performs better than core algorithms and first-in, first-out methods in parallel racking systems [66]. The steps of the parallel version of the method are expressed as follows [67,68]:
Step 1: For all (i, j) pairs where i ≠ j, calculate the saving values using the formula si,j = c0,i + c0,j − ci,j;
Step 2: Sort the saving values (si,j) in descending order;
Step 3: If the (i, j) pair with the highest saving value satisfies the capacity constraint, create a route. If it does not meet the constraint, reject the (i, j) pair. Form the first route with the next highest saving value pair that satisfies the capacity constraint;
Step 4: Take the next (i, j) pair from the list. Add the pair to the current route if it can be extended, thereby satisfying the capacity constraint. Otherwise, mark the pair as a fresh route should the capacity limit be satisfied and the pair not have been visited;
Step 5: Repeat Step 4 until routes are created for all points that need to be visited.
3.3. Randomized Savings Heuristic
Saving algorithms are based on the CW algorithm, aiming to reduce travel distance by merging a series of smaller tours into a reduced number of larger tours [69]. Using this approach, from the ranked list of saving values, a pair with the p-th best saving value is chosen rather than the (i, j) pair with the highest saving value. p is chosen at random between 1 and the depth parameter (Ø). The number of iterations is also another factor applied in this approach. The answer to the problem is regarded as the best value acquired following the execution of the algorithm for the designated number of iterations. Under the capacity limitation, this approach lets orders be grouped simultaneously and order-picking trucks be routed. The RS heuristic’s procedural phases are as follows [70,71]:
Step 1. Start the process by including all order points in individual tours;
Step 2. Calculate the savings resulting from merging routes between order points i and j for all (i, j) pairs using the formula si,j = c0,i + c0,j − ci,j. Create a savings list by sorting the savings values (si,j) in descending order;
Step 3. Choose randomly from Ø number of pairs (i, j) with the highest savings value. If the capacity constraint is satisfied, connect (i, j) and merge the routes. Update the savings list. For the next iteration, randomly select another (i, j) pair. If the tour can be extended while meeting the capacity constraint, add it to the current tour. Otherwise, if the capacity constraint is satisfied and the order point has not yet been visited, start a new tour and add it to the list. Repeat this process for the specified number of iterations;
Step 4. Repeat Step 3 until all order points are included in a route;
Step 5. After completing the specified number of iterations, select the solution that provides the best value as the final result.
3.4. Genetic Algorithms
Based on evolutionary theory, genetic algorithms are metaheuristics including ideas of natural selection, reproduction, genetic legacy, and mutation [72]. Each genetic algorithm functions on a population of synthetic chromosomes. Every chromosome signifies a solution to a problem and possesses a fitness value, a real number that quantifies the efficacy of the solution for the specific problem [73]. All genetic algorithms need a strong genetic representation of the issue, an initial population generator, an appropriate fitness function, and genetic operators such as crossover and mutation if they are to run efficiently [74]. The application steps of genetic algorithms can be generally expressed as follows [75,76]:
Step 1. Construct the fitness function, express the genetic representation, and code to determine the parameters,
Step 2. Create an initial population by considering possible solutions,
Step 3. Calculate the fitness values of each solution in the population,
Step 4. Select chromosomes with high fitness value from the population,
Step 5. Apply crossover and mutation procedures,
Step 6. Create the new population,
Step 7. Repeat Step 3 to Step 6 until the set-stopping criterion is met. When the stopping criterion is met, the loop is stopped, and the solution is expressed.
The parameters employed within the genetic algorithm’s scope have a substantial impact on the resolution of problems. The primary parameters can be expressed as the coding type, population size, crossover type and rate, and mutation type and rate. Diversity is enhanced, and the likelihood of premature convergence to local optima is diminished as the population size increases. Additionally, the time required to reach the optimal value in the search space is increased by the use of large population sizes. The crossover rate is the ratio of the population size to the number of individuals that must be crossed in the population for each generation. The mutation rate is the proportion of the total number of individuals in the population that will undergo mutation. Selecting a high crossover rate promotes diversity; however, it may result in the degradation of gene sequences that are highly adaptive [77,78]. Various studies employed different values, and there was no precise rate based on the type of problem.
Hsu et al. [39] performed order batching with a genetic algorithm in a single-block warehouse. With a population size of 20 and considering the volumetric capacity of the order picker, the researchers used a coding type that expressed order numbers as rows and group numbers as genes and applied a two-point crossover operator and a mutation operator in the displacement type in the solution they made. The selection operator was the roulette wheel method, and the researchers employed a crossover rate of 0.6 and a mutation rate of 0.05. The research, which was conducted using clusters with 40–300 orders, was said to produce reasonable travel distance values.
Using several datasets spanning 25 to 250 orders, Tsai et al. [79] solved the order picking challenge in a single-block warehouse. Their work applied swap mutation operators, partially matched crossover (PMX), and two-point crossover. They used the roulette wheel approach for the selecting operator. Utilizing different encoding systems and crossover operators, the researchers evaluated two proposed approaches, GA-batch and GA-TSP. Their study showed that the suggested solutions successfully reduced travel distances with a population size set at 20, a crossover rate of 0.9, and varied mutation rates between 0.04 and 0.05. Ene and Öztürk [80] addressed batching and routing problems simultaneously by applying their proposed genetic algorithm-based solution to a two-block warehousing system. Within the genetic representation framework they developed, based on order locations and batch numbers, they utilized crossover rates between 0.6 and 0.8, mutation rates of 0.008 to 0.01, elitism rates from 0.02 to 0.04, and population sizes ranging from 75 to 125. The researchers underlined that their solution could potentially be applied with success. In their paper on order batching, Koch and Wäscher [81] proposed a grouping genetic algorithm. Looking at a single-block warehouse, they examined between 20 and 60 customer orders. Using a two-point crossover operator, the crossover rate was set at 0.50 and the mutation rate at 0.10. The results showed that the recently suggested evolutionary algorithm, which uses a group-oriented encoding technique, beats conventional methods and provides high-quality solutions in a fair time period. In order to address the issue of integrated batching, sequencing, and routing, Pinto and Nagano [82] developed a computational tool by utilizing two genetic algorithms. The study was carried out in a directed-flow rectangle layout warehouse with a range of 20 to 300 different SKUs and 10 to 50 orders. They used a population size ranging from 20 to 50, a crossover probability between 20% and 100%, and a mutation probability between 10% and 100%. Highlighting real-world warehouse conditions, they stated that their proposed approach provided solutions of satisfactory quality.
In their recent literature review, Ou et al. [83] underlined the major contributions of genetic algorithm-based solutions in addressing the batching and picker routing issues common in warehouse operations. They emphasized the need for extra research and innovation in this field since they stressed the ongoing necessity to progress these approaches to improve operational efficiency and solution quality.
4. Case Study
4.1. Current Conditions and Assumptions in the Application
The data utilized in this study, which includes layout and order sizes, are completely derived from real-world records that were obtained from the warehouse of a logistics company. For the purpose of testing the algorithms, we employed four distinct order sets that were collected at separate times. The number of locations to be visited within the warehouse corresponds to the 108, 129, 152, and 187 orders in these sets. Detailed information, including a unique order code, production number, material number, quantity (e.g., crates or individual units), weight, volume, shelf location, and product name, was included in each order list.
Various assumptions have been made in similar studies [44,47,84], and analyses have been conducted based on these assumptions. The following assumptions are made within the scope of this study:
- ▪
- The objective is to minimize the total travel distance;
- ▪
- Operating as a picker-to-parts system, the order picker manually moves through the warehouse using a picking tool to reach the specified areas and pick the items;
- ▪
- The order picking operations are based on a three-block parallel back-to-back racking system, as shown in Figure 4;
- ▪
- Orders listed in the picking list are indivisible, meaning the order picker must collect the entire quantity of an item from its designated shelf location. The partial collection of an order is not allowed;
- ▪
- Each batch of orders assigned to an order picker must not exceed the volumetric capacity of the picker. Real-world applications help to define the capacity limit;
- ▪
- Every order picker has an equal volumetric capacity. The volumetric capacity of all order pickers is considered to be identical, set at 3.4 m3. Calculated as a 1.3 × 1.3 m2 stacking space with about 2 m of product height, this number matches practical situations;
- ▪
- Beginning their path from the front left corner of the warehouse, each order picker gathers all of their orders and returns to the same starting position upon completion.
- ▪
- The order picker can pick items from racks on both the left and right sides as they traverse a given aisle. It is assumed that the picker stops precisely at the center of the cell containing the required item to retrieve it.
The steps for solving the order picking problem in the application can be summarized as follows:
Step 1. Acquiring the raw list of incoming orders for the warehouse;
Step 2. Transforming the order list into an application-specific list containing block, shelf, cell, aisle numbers, and order volumes;
Step 3. Using the application list data and the case equations outlined in the previous section to calculate distance values based on the order locations;
Step 4. Constructing a distance matrix that includes all locations within the warehouse;
Step 5. Creating a distance matrix including every order location;
Step 6. Grouping orders under capacity constraints and creating order picker routes using heuristic and metaheuristic methods;
Step 7. Comparing heuristic and metaheuristic order picking algorithms;
Step 8. Expressing the solution that provides the shortest travel distance for the order pickers.
Initially, distance matrices were constructed using raw lists containing 108, 129, 152, and 187 orders. For a set of 108 orders, it is practically impossible to manually determine the shortest distances between 108 order points identified on the warehouse layout within an acceptable time frame while ensuring absolute accuracy. For a 108-order list, calculating the distance from each location to every other order, including the starting point, requires a total of 109 × 109 = 11,881 distance computations. The distance matrix’s (109 values) zero diagonal members mean that 11,772 distance equations must be solved. Given the problem’s symmetric characteristics, this figure simplifies to 5886 distinct comparisons and distance computations. The number of distance computations rises to 17,574 for an order list of 187 rows.
Based on the positional characteristics of the compared points, the appropriate distance equations were identified, and the calculations were carried out. To illustrate this process, the locations for the second order set are presented in Table 2, while a condensed representation of the distance matrix is provided in Table 3. The same procedures were applied for all order sets.
Table 2.
Location characteristics of items in the second order set.
Table 3.
Representation of the distance matrix for the second order set.
Considering the volumes of the orders as well, optimization processes for the order picking activity in the parallel back-to-back racking system were started with different heuristic and metaheuristic approaches after the distance matrices were generated to identify the distances between the orders to be collected. Apart from the distance matrix, another crucial piece of information needed is the product volumes at the order locations.
4.2. Solutions with CW and RS Heuristics
To solve the order picking problem, the parallel version of the CW heuristic, which has been highlighted in the literature for its better performance, was first applied. Using the steps explained in the previous section, the order pair (i, j) was ranked based on the savings in travel distance. The pair was consolidated if the capacity constraint allowed, and if not, it was handled as separate routes in the order picking plan.
The RS heuristic was then applied using the same data. In this method, instead of selecting the (i, j) pair with the highest savings value, the pair with the p-th-best savings value is chosen from the sorted list of savings values. In various studies encountered in the literature, the number of iterations is typically taken as 20 and 300, and the depth value is taken as 5 and 20 [67,70]. For problems involving 108, 129, 152, and 187 order picking points, depth values of 5, 10, and 20 and iteration counts of 100, 300, and 500 were used, and the resulting differences were evaluated. The tour numbers and distances traveled resulting from iterations using the RS heuristic were expressed alongside the CW heuristic results (Table 4). It is observed that the RS heuristic results in shorter distance values compared to the results obtained with the CW heuristic.
Table 4.
Results obtained with the CW heuristic and the RS heuristic.
4.3. Proposed Genetic Algorithm
Genetic algorithms are effective methods for solving various optimization problems. A representation similar to the one proposed in this study has also been observed in several studies conducted in areas outside the scope of order picking [85,86,87]. The following describes the several phases of the genetic algorithm applied in the implementation stage:
Step 1. Group-based sequential encoding was carried out in the first step;
Step 2. An initial population consisting of 30 and 50 individuals was generated randomly;
Step 3. Fitness values were determined based on the distances traveled by order pickers for the order groups represented in the chromosomes;
Step 4. The roulette wheel approach was used in the choosing process;
Step 5. The PMX and OX-1 (Order Crossover-1) varieties of crossover operators were applied for the crossover procedure;
Step 6. Swap and inversion types of mutation operators were applied;
Step 7. The chromosome pool was replenished with newly generated individuals;
Step 8. The fitness values of the new population were determined by calculating the total travel distances walked by the order pickers;
Step 9. The algorithm was stopped after iterations ranging from 100,000 to 3,000,000. Step 10 was executed until the required number of iterations satisfying the termination criteria was reached;
Step 10. The process returned to Step 3, and the cycle continued based on the resulting population.
A single chromosome was designed for the solution, comprising genes reflecting the tours of the order-picking vehicles and the order locations inside the clusters. As an example, Figure 6 illustrates a coding scheme containing a specific number of genes. For the first order cluster, the number of genes in the chromosome was determined by considering 108 orders and a given number of order-picking vehicles. Genetic algorithm operators were applied to this chromosome. The “0” gene represents either an order-picking vehicle departing from the depot or the separation between vehicle routes.
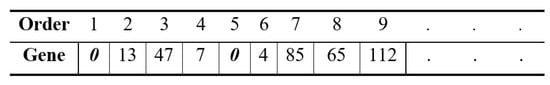
Figure 6.
Typical representation of each chromosome.
By using the minimum number of order pickers needed approach, one was able to ascertain the count of “0” genes. Appropriate mutation and crossover operators helped to maintain a constant count of “0” genes in the chromosome. Figure 7 shows how to prohibit too many pickers in the solution set depending on the number of “0” genes in the chromosome. As seen, the ninth and tenth genes seem to be consecutive “0” values. This suggests that one of the order pickers will not be used since it is a duplicate.

Figure 7.
Chromosome representation in the case of excess order pickers.
Since the problems of order batching and determining the route of the order picker are addressed simultaneously, a group-based encoding method has been utilized. In this method, the identification of genes in the chromosome is determined based on the capacity constraints of the order pickers. The minimum number of pickers or tours required to collect all orders can be calculated by dividing the total volume of all orders by the volumetric capacity of the order picker [39]. Accordingly, the number of pickers (t) to be used cannot be less than tmin. The minimum number of pickers is expressed as follows:
tmin = ∑ Order volume/Order picker’s volumetric capacity
The chromosome must contain at least as many “0” genes as the minimum number of order pickers required. Having an excessive number of “0” genes relative to the number of pickers will expand the search space, thereby increasing the computational time required to reach an optimal solution, particularly in large-scale problems.
Considering similar studies in the literature, the initial population size was set to 20, 30, and 50 [39,79,88,89]. Based on the order clusters analyzed within the scope of the solution, experiments conducted with the specified population sizes revealed that the shortest distances in meters were obtained with population sizes of 30 and 50. A total of 300 experiments were conducted for four different order clusters, with 25 experiments per population size. Using the approach proposed by Engin and Fiğlalı [90], the arithmetic mean and standard deviation of the results were calculated. Based on the results, populations of 30 and 50 individuals were established. The fitness value for each chromosome was calculated using the formula Fi = DL − Di. Here, Fi represents the fitness value of the chromosome; DL is the highest distance value in the population, and Di is the distance value of the chromosome whose fitness is being calculated. The roulette wheel method was used for selection [31,39]. Crossover and mutation operators were employed in the implementation. In the literature on the order picking problem, PMX [79] and OX-1 [91,92] crossover operators are commonly used.
During the use of operators, care was taken to ensure that the number of “0” genes in the chromosome was not negatively affected. An alternative approach involved using only the mutation operator [85]. However, using only mutation failed to produce sufficient gene variation to generate diverse gene sequences. Therefore, both crossover and mutation operators were used in this study. The swap mutation [39] and inversion mutation [91] were applied. While ensuring diversity with mutation operators, no genes representing locations or vehicles were lost, allowing them to be carried over to the next generation. Based on experiments involving all analyzed order clusters and considering the traveled distances, it was determined that the PMX and OX-1 crossover operators, along with a mutation rate of 0.3, were optimal. Crossover rates of 0.6 and 0.9 were applied, and swap and inversion mutation types were used [39,79,88]
Although various termination criteria are used in the literature for optimization problems based on genetic algorithms, there is no universally accepted standard. Common criteria include a fixed number of iterations, a fixed CPU time, or a fixed number of consecutive iterations without improvement in the current solution [93,94]. In their study focusing on order grouping with genetic algorithms, Hsu et al. [39] analyzed workloads of 40 to 300 orders, identifying distances of 711 to 9905 m, and terminated their algorithm after 40 generations without solution improvement.
In this study, real-world application times were considered when determining the termination criterion. In the warehouse analyzed, order grouping and routing plans must be completed within an hour after order lists containing 100 to 200 orders are received by the personnel responsible for order-picking activities. It was observed that for the largest problem size in the thesis, approximately 2,760,000 to 2,940,000 iterations were completed when the GA-based method was run for an hour. Since iteration counts vary depending on the performance in different computer configurations, a termination criterion based on iterations was chosen instead of time. Similar transformations have been applied in studies in other fields [95]. This ensured that the process was controlled through iteration counters, regardless of the computer used. In this study, experiments were conducted with iteration counts ranging from 100,000 to 3,000,000.
Using a chromosome design based solely on the minimum number of tours (order-picking vehicles) resulted in solutions where orders at significantly distant locations were grouped, satisfying the capacity constraint but failing to optimize the traveled distance. Since the problem focuses on minimizing the order-picking travel distance and does not impose a constraint on the number of tours, a chromosome design that allowed an increase in tour numbers was created. When there were excess tour genes, consecutive “0-0” genes appeared, enabling feasible solutions with shorter tour distances. However, adding many “0” genes to the chromosome significantly increased the processing time, especially for high iteration counts. Therefore, experiments were conducted to determine the optimal number of “0” genes, balancing the number of tours or order groups with the traveled distances. These experiments revealed that adding 20% more “0” genes than the calculated minimum number of tours significantly improved distance optimization, with no additional benefits from further increases in “0” genes, which only increased the processing time.
For the order picking problem of the first order cluster, containing 108 orders, the total volume was calculated as 91.5 m3. For a vehicle capacity of 3.4 m3,
tmin = 91.5/3.4 = 26.91
Thus, the minimum required number of order-picking vehicles or tours is 27. When designing the chromosome, 20% more “0” genes were added to this value. In total, 32 “0” genes were included in the chromosome. This enabled a representation of 108 order genes, along with one gene for the starting point, forming a chromosome with 141 genes (Figure 8).
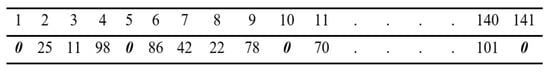
Figure 8.
Sample representation of the chromosome for the solution of the first order cluster.
The solution for four order clusters was performed using the specified genetic operators and their corresponding rates under various parameters. The parameters utilized in the analysis and the resulting distance values for the first order cluster are presented in Table 5. For each parameter combination, the genetic algorithm was executed 25 times at each processing stage.
Table 5.
Genetic algorithm results for the first order cluster.
The order batches and picker routes generated by the genetic algorithm-based method, the traveled distance values, the volumetric loads of the pickers, and the utilization rates of the order pickers are summarized for the second order cluster in Table 6.
Table 6.
Results for the parameter combination providing the shortest distance from the application of a genetic algorithm to the second order cluster.
The results for the CW heuristic, the RS heuristic, and the proposed GA-based solution method used for solving the order picking problem are presented in Table 7 for comparison.
Table 7.
Comparative analysis of the methods employed.
5. Discussion
With the growth of e-commerce, increasing demand, and a wide range of products, order picking in warehouses is becoming more complex, making logistics operations increasingly challenging [96]. In the context of the order picking problem, order batching and picker routing are essential for minimizing the overall travel distance of order pickers. This paper focuses on the back-to-back parallel shelf system, which is the most common storage layout in logistics provider warehouses. It also looks at the hand order picking process, whereby employees gather goods from shelves using order-picker vehicles. The analysis is based on a three-block warehouse arrangement that more closely reflects actual warehouse designs. Although most studies concentrate on single-block systems, multiple-block systems more accurately represent real warehouse operations because cross-aisles enable the flow through aisles.
The findings from the distance analysis indicate that the RS heuristic consistently results in significantly shorter total travel distances than the Clarke–Wright (CW) heuristic. Furthermore, the results from the RS heuristic are comparable to those obtained using the genetic algorithm-based approach. The genetic algorithm consistently offers order pickers shorter trip distances across all the order clusters investigated than the CW heuristic. Since the genetic algorithm-based technique produces solutions with shorter trip distances than both the CW and RS heuristics, these results imply that it is a more efficient way for improving the order choosing process. By reducing the distance traveled during order pickup, this study shows that the genetic algorithm is generally a useful tool for optimizing logistics operations.
6. Conclusions
The order picking process in warehouses should be completed as quickly and accurately as possible, and the products should be put into a truck for delivery to the customer. The effective execution of warehousing activities is of great importance in terms of ensuring continuity in the supply of raw materials, semi-finished products, and parts for manufacturing companies, and in terms of distribution channel management, it is of great importance in terms of starting fast and accurate product shipment according to customer demands following the storage of the final products. Although it may seem like a simple operation within warehousing activities, the biggest cost element, especially in logistics service provider companies that provide warehousing services, is order picking operations.
In comparison to the CW and RS methods across all order clusters, the proposed genetic algorithm-based solution method results in reduced order picking distances when analyzing the total distance traveled by all order pickers in a given order batch. Based on the results, it can be stated that the GA-based solution method is relatively effective for the order batches examined. When examining the results of the GA-based method used in this study, it is found that, in general, the OX-1 crossover operator produces better results when combined with the inversion mutation operator, while the PMX operator results in better order picking distance values when combined with the displacement mutation operator. When comparing the results obtained with the genetic algorithm-based method to the total distance values achieved with the CW heuristic, the following improvements in the traveled distance values are observed for the analyzed order batches: 5.4%, 2.6%, 2.1%, and 1.7%, respectively. When comparing the RS heuristic results to the CW heuristic, it is observed that the GA-based method provides reductions in the traveled distances by 4.9%, 2.2%, 1.9%, and 1.4%, respectively. In comparison with the RS heuristic, the GA-based method yields better total distance values for the analyzed order clusters by 0.5%, 0.4%, 0.1%, and 0.3%, respectively. Similar group-based genetic algorithm codings have been reported to yield good results in off-site vehicle routing problems [86,87]. In the context of warehouse-specific order picking and related problem-solving, improved travel distance values have also been achieved using different genetic algorithm approaches [80,97,98]. In this respect, the results of our current study are consistent with the literature.
The improvement is noteworthy since warehouse managers and logistics rely on better order picking processes to reach targets of efficiency. Order picking is a repeating operation in warehouses, so even little changes can result in major labor and time savings. Key performance criteria for supply chain managers are tracking logistics costs over certain periods and minimizing them by means of ongoing improvements without affecting quality, delivery, or workforce conditions. In this sense, order picking optimization can yield profound benefits.
Together with the suggested solutions in this paper, the newly proposed distance determining method is expected to add to the body of knowledge already in publication. In addition, the calculations performed within the scope of this study are not based on a theoretical warehouse and order structure, but on real application data. Although parallel rectangular warehouse racking systems are the most commonly used in the industry, the suggested new set of equations does not cover other racking systems, such as a fishbone layout. Another limitation of this study is the ability to work with only a limited number of datasets due to the use of real data obtained from an actual company and the desire to apply the model to actual-life scenarios.
An aspect that is generally not addressed in academic papers, but one we wanted to highlight thanks to the valuable contributions of one of our reviewers, pertains to the challenges of applying solutions to real-world logistics problems. Observing a physically existing warehouse to gather parameters and produce knowledge for both the business world and academia in a live operational environment is, in fact, more challenging than working at a desk. For academics or researchers in some fields, being present on-site is unavoidable. Physically visiting a warehouse known for its efficient operations, explaining to the relevant managers the type of research and application you want to conduct, dealing with the sometimes curious and sometimes skeptical glances of operators when stepping onto the warehouse floor, addressing the safety concerns while moving around, understanding the company-specific software systems where the order data are located, and facing the fundamental challenges of conducting real-world fieldwork can all be seen as core difficulties.
In future studies, the solution algorithm can be improved by using different crossover and mutation operators for the genetic algorithm-based method. Different coding and selection methods can be used in the solution. In addition, models in which different heuristics or metaheuristics can be used can be developed and compared with the results obtained with the genetic algorithm and the RS heuristic. Furthermore, the development of a variety of solution models can be achieved by incorporating rules such as the prioritization of different orders within the order picking procedure and the time window.
Funding
This research received no external funding.
Institutional Review Board Statement
Not applicable.
Informed Consent Statement
Not applicable.
Data Availability Statement
Due to confidentiality agreements with the private business that provided the data, access can be granted upon reasonable request.
Conflicts of Interest
The author declares no conflict of interest.
Abbreviations
The following abbreviations are used in this manuscript:
| Bi | Block number of order i |
| Bj | Block number of order j |
| Ai | Aisle number where order i is located |
| Aj | Aisle number where order j is located |
| Ci | Cell position of order i within the shelf |
| Cj | Cell position of order j within the shelf |
| Ri | Rack row number of order i |
| Rj | Rack row number of order j |
| ONi | Order number of order i |
| ONj | Order number of order j |
| ON0 | Depot point |
| BL | Block length |
| CA | Width of the cross-aisle |
| CL | Cell length (the length of the area where the product is placed on the shelf) |
| CW | Cell width (the width of the area where the product is placed on the shelf) |
| AW | Aisle width |
| CN | Number of cells within a single block in one rack row |
| HU | Cell length (the length of the area where the product is placed on the shelf) |
| HG | Cell width (the width of the area where the product is placed on the shelf) |
| KG | Aisle width |
| S | Number of cells within a single block in one rack row |
| D (i,j) | The shortest rectilinear distance between any two orders within the racking system |
References
- Boysen, N.; Schwerdfeger, S.; Stephan, K. A review of synchronization problems in parts-to-picker warehouses. Eur. J. Oper. Res. 2023, 307, 1374–1390. [Google Scholar] [CrossRef]
- Derpich, I.; Sepúlveda, J.M.; Barraza, R.; Castro, F. Warehouse Optimization: Energy Efficient Layout and Design. Mathematics 2022, 10, 1705. [Google Scholar] [CrossRef]
- Gu, J.; Goetschalckx, M.; McGinnis, L.F. Research on warehouse operation: A comprehensive review. Eur. J. Oper. Res. 2007, 177, 1–21. [Google Scholar] [CrossRef]
- Amware Fulfillment. Available online: https://www.amwarelogistics.com/blog/reducing-warehouse-labor-costs-smarter-order-picking (accessed on 19 June 2024).
- Masae, M.; Glock, C.H.; Vichitkunakorn, P. Optimal order picker routing in the chevron warehouse. IISE Trans. 2020, 52, 665–687. [Google Scholar] [CrossRef]
- Bottani, E.; Volpi, A.; Montanari, R. Design and optimization of order picking systems: An integrated procedure and two case studies. Comput. Ind. Eng. 2019, 137, 106035. [Google Scholar] [CrossRef]
- Van Gils, T.; Ramaekers, K.; Caris, A.; de Koster, R.B. Designing efficient order picking systems by combining planning problems: State-of-the-art classification and review. Eur. J. Oper. Res. 2018, 267, 1–15. [Google Scholar] [CrossRef]
- Li, Y.; Zhang, R.; Jiang, D. Order-picking efficiency in e-commerce warehouses: A literature review. J. Theor. Appl. Electron. Commer. Res. 2022, 17, 1812–1830. [Google Scholar] [CrossRef]
- Masae, M.; Glock, C.H.; Grosse, E.H. Order picker routing in warehouses: A systematic literature review. Int. J. Prod. Econ. 2020, 224, 107564. [Google Scholar] [CrossRef]
- Trottmann, M.; Zhang, S. The Trend Towards Warehouse Automation. Westernacher & Partner Consulting Inc. 2017. Available online: https://westernacher.com/white-paper-the-trends-towards-warehouse-automation/ (accessed on 25 July 2024).
- Van Nieuwenhuyse, I.; de Koster, R.B. Evaluating order throughput time in 2-block warehouses with time window batching. Int. J. Prod. Econ. 2009, 121, 654–664. [Google Scholar] [CrossRef]
- Pansart, L.; Catusse, N.; Cambazard, H. Exact algorithms for the order picking problem. Comput. Oper. Res. 2018, 100, 117–127. [Google Scholar] [CrossRef]
- Van Gils, T.; Ramaekers, K.; Braekers, K.; Depaire, B.; Caris, A. Increasing order picking efficiency by integrating storage, batching, zone picking, and routing policy decisions. Int. J. Prod. Econ. 2018, 197, 243–261. [Google Scholar] [CrossRef]
- Öztürkoğlu, Ö.; Hoser, D. A discrete cross aisle design model for order-picking warehouses. Eur. J. Oper. Res. 2019, 275, 411–430. [Google Scholar] [CrossRef]
- Cano, J.A.; Correa-Espinal, A.A.; Gómez-Montoya, R.A. Mathematical programming modeling for joint order batching, sequencing and picker routing problems in manual order picking systems. J. King Saud Univ.-Eng. Sci. 2020, 32, 219–228. [Google Scholar] [CrossRef]
- Masae, M.; Glock, C.H.; Vichitkunakorn, P. Optimal order picker routing in a conventional warehouse with two blocks and arbitrary starting and ending points of a tour. Int. J. Prod. Res. 2020, 58, 5337–5358. [Google Scholar] [CrossRef]
- Ouyang, Z.; Leung, E.K.; Shen, C.; Huang, G.Q. Synchronizing order picking and delivery in e-commerce warehouses under community logistics. Transp. Res. Part E Logist. Transp. Rev. 2024, 188, 103631. [Google Scholar] [CrossRef]
- Tutam, M.; White, J.A. Multi-dock unit-load warehouse designs with a cross-aisle. Transp. Res. Part E Logist. Transp. Rev. 2019, 129, 247–262. [Google Scholar] [CrossRef]
- Tompkins, J.A.; White, J.A.; Bozer, Y.A.; Tanchoco, J.M.A. Facilities Planning, 4th ed.; John Wiley & Sons: Hoboken, NJ, USA, 2010. [Google Scholar]
- Chiang, D.M.H.; Lin, C.P.; Chen, M.C. The adaptive approach for storage assignment by mining data of warehouse management system for distribution centres. Enterp. Inf. Syst. 2011, 5, 219–234. [Google Scholar] [CrossRef]
- Shetty, N.; Sah, B.; Chung, S.H. Route optimization for warehouse order picking operations via vehicle routing and simulation. SN Appl. Sci. 2020, 2, 311. [Google Scholar] [CrossRef]
- Casella, G.; Volpi, A.; Montanari, R.; Tebaldi, L.; Bottani, E. Trends in order picking: A 2007–2022 review of the literature. Prod. Manuf. Res. 2023, 11, 2191115. [Google Scholar] [CrossRef]
- Grosse, E.H. Application of supportive and substitutive technologies in manual warehouse order picking: A content analysis. Int. J. Prod. Res. 2024, 62, 685–704. [Google Scholar] [CrossRef]
- Pedrielli, G.; Vinsensius, A.; Chew, E.P.; Lee, L.H.; Duri, A.; Li, H. Hybrid order picking strategies for fashion E-commerce warehouse systems. In Proceedings of the Winter Simulation Conference (WSC), Washington, DC, USA, 11–14 December 2016. [Google Scholar]
- Zhong, S.; Giannikas, V.; Merino, J.; McFarlane, D.; Cheng, J.; Shao, W. Evaluating the benefits of picking and packing planning integration in e-commerce warehouses. Eur. J. Oper. Res. 2022, 301, 67–81. [Google Scholar] [CrossRef]
- Baruffaldi, G.; Accorsi, R.; Manzini, R. Warehouse management system customization and information availability in 3pl companies: A decision-support tool. Ind. Manag. Data Syst. 2019, 119, 251–273. [Google Scholar] [CrossRef]
- Shi, Y.; Zhang, A.; Arthanari, T.; Liu, Y.; Cheng, T.C.E. Third-party purchase: An empirical study of third-party logistics providers in China. Int. J. Prod. Econ. 2016, 171, 189–200. [Google Scholar] [CrossRef]
- Zennaro, I.; Finco, S.; Calzavara, M.; Persona, A. Implementing E-commerce from logistic perspective: Literature review and methodological framework. Sustainability 2022, 14, 911. [Google Scholar] [CrossRef]
- Yang, P.; Zhao, Z.; Shen, Z.J.M. A flow picking system for order fulfillment in e-commerce warehouses. IISE Trans. 2021, 53, 541–551. [Google Scholar] [CrossRef]
- Kumar, S.; Narkhede, B.E.; Jain, K. Revisiting the warehouse research through an evolutionary lens: A review from 1990 to 2019. Int. J. Prod. Res. 2021, 59, 3470–3492. [Google Scholar] [CrossRef]
- Mahjoob, M.; Fazeli, S.S.; Milanlouei, S.; Tavassoli, L.S.; Mirmozaffari, M. A modified adaptive genetic algorithm for multi-product multi-period inventory routing problem. Sustain. Oper. Comput. 2022, 3, 1–9. [Google Scholar] [CrossRef]
- Vanheusden, S.; van Gils, T.; Ramaekers, K.; Cornelissens, T.; Caris, A. Practical factors in order picking planning: State-of-the-art classification and review. Int. J. Prod. Res. 2023, 61, 2032–2056. [Google Scholar] [CrossRef]
- Haouassi, M.; Kergosien, Y.; Mendoza, J.E.; Rousseau, L.M. The picker routing problem in mixed-shelves, multi-block warehouses. Int. J. Prod. Res. 2025, 63, 1304–1325. [Google Scholar] [CrossRef]
- Cano, J.A.; Cortés, P.; Muñuzuri, J.; Correa-Espinal, A. Solving the picker routing problem in multi-block high-level storage systems using metaheuristics. Flex. Serv. Manuf. J. 2023, 35, 376–415. [Google Scholar] [CrossRef]
- Prunet, T.; Absi, N.; Cattaruzza, D. A note on the complexity of the picker routing problem in multi-block warehouses and related problems. Ann. Oper. Res. 2025, 1–11. [Google Scholar] [CrossRef]
- Gue, K.R.; Meller, R.D. Aisle configurations for unit-load warehouses. IIE Trans. 2009, 41, 171–182. [Google Scholar] [CrossRef]
- Kocaman, Y.; Öztürkoğlu, Ö.; Gümüşoğlu, Ş. Aisle designs in unit-load warehouses with different flow policies of multiple pickup and deposit points. Cent. Eur. J. Oper. Res. 2021, 29, 323–355. [Google Scholar] [CrossRef]
- Wildt, C.; Weidinger, F.; Boysen, N. Picker routing in scattered storage warehouses: An evaluation of solution methods based on TSP transformations. OR Spectr. 2024, 1–32. [Google Scholar] [CrossRef]
- Hsu, C.M.; Chen, K.Y.; Chen, M.C. Batching orders in warehouses by minimizing travel distance with genetic algorithms. Comput. Ind. 2005, 56, 169–178. [Google Scholar] [CrossRef]
- De Koster, R.; Le-Duc, T.; Roodbergen, K.J. Design and control of warehouse order picking: A literature review. Eur. J. Oper. Res. 2007, 182, 481–501. [Google Scholar] [CrossRef]
- Boysen, N.; Stephan, K.; Weidinger, F. Efficient order consolidation in warehouses: The product-to-order-assignment problem in warehouses with sortation systems. IISE Trans. 2022, 54, 963–975. [Google Scholar] [CrossRef]
- Manzini, R.; Gamberi, M.; Regattieri, A. Design and control of a flexible order-picking system (FOPS) A new integrated approach to the implementation of an expert system. J. Manuf. Technol. Manag. 2005, 16, 18–35. [Google Scholar] [CrossRef]
- Ho, Y.C.; Su, T.S.; Shi, Z.B. Order-batching methods for an order-picking warehouse with two cross aisles. Comput. Ind. Eng. 2008, 55, 321–347. [Google Scholar] [CrossRef]
- Theys, C.; Bräysy, O.; Dullaert, W.; Raa, B. Using a TSP heuristic for routing order pickers in warehouses. Eur. J. Oper. Res. 2010, 200, 755–763. [Google Scholar] [CrossRef]
- Vaughan, T.S. The effect of warehouse cross aisles on order picking efficiency. Int. J. Prod. Res. 1999, 37, 881–897. [Google Scholar] [CrossRef]
- Chabot, T.; Coelho, L.C.; Renaud, J.; Côté, J.F. Mathematical model, heuristics and exact method for order picking in narrow aisles. J. Oper. Res. Soc. 2018, 69, 1242–1253. [Google Scholar] [CrossRef]
- Kübler, P.; Glock, C.H.; Bauernhansl, T. A new iterative method for solving the joint dynamic storage location assignment, order batching and picker routing problem in manual picker-to-parts warehouses. Comput. Ind. Eng. 2020, 147, 106645. [Google Scholar] [CrossRef]
- Scholz, A.; Wäscher, G. Order Batching and Picker Routing in manual order picking systems: The benefits of integrated routing. Cent. Eur. J. Oper. Res. 2017, 25, 491–520. [Google Scholar] [CrossRef]
- Scholz, A.; Schubert, D.; Wäscher, G. Order picking with multiple pickers and due dates–simultaneous solution of order batching, batch assignment and sequencing, and picker routing problems. Eur. J. Oper. Res. 2017, 263, 461–478. [Google Scholar] [CrossRef]
- Cano, J.A.; Correa-Espinal, A.; Gómez-Montoya, R. Using genetic algorithms for order batching in multi-parallel-aisle picker-to-parts systems. Int. J. Appl. Decis. Sci. 2020, 13, 417–434. [Google Scholar] [CrossRef]
- Aerts, B.; Cornelissens, T.; Sörensen, K. The joint order batching and picker routing problem: Modelled and solved as a clustered vehicle routing problem. Comput. Oper. Res. 2021, 129, 105168. [Google Scholar] [CrossRef]
- Yousefi Nejad Attari, M.; Ebadi Torkayesh, A.; Malmir, B.; Neyshabouri Jami, E. Robust possibilistic programming for joint order batching and picker routing problem in warehouse management. Int. J. Prod. Res. 2021, 59, 4434–4452. [Google Scholar] [CrossRef]
- Haouassi, M.; Kergosien, Y.; Mendoza, J.E.; Rousseau, L.M. The integrated orderline batching, batch scheduling, and picker routing problem with multiple pickers: The benefits of splitting customer orders. Flex. Serv. Manuf. J. 2022, 34, 614–645. [Google Scholar] [CrossRef]
- Cao, Z.; Zhou, L.; Lin, C.; Zhou, M. Solving an order batching, picker assignment, batch sequencing and picker routing problem via information integration. J. Ind. Inf. Integr. 2023, 31, 100414. [Google Scholar] [CrossRef]
- Hedayati, S.; Setak, M.; Demir, E.; Van Woensel, T. A new approach to the joint order batching and picker routing problem with alternative locations. IMA J. Manag. Math. 2024, 35, 241–265. [Google Scholar] [CrossRef]
- Pinto, A.R.F.; Nagano, M.S. A comprehensive review of batching problems in low-level picker-to-parts systems with order due dates: Main gaps, trade-offs, and prospects for future research. J. Manuf. Syst. 2022, 65, 1–18. [Google Scholar] [CrossRef]
- Liu, M.; Poh, K.L. E-commerce warehousing: An efficient scattered storage assignment algorithm with bulky locations. Comput. Ind. Eng. 2023, 181, 109236. [Google Scholar] [CrossRef]
- Pawar, N.S.; Rao, S.S.; Adil, G.K. Scattered storage for retail e-commerce fulfillment warehouses with consideration for product turnover. Comput. Ind. Eng. 2024, 197, 110551. [Google Scholar] [CrossRef]
- Li, X.; Hua, G.; Huang, A.; Sheu, J.B.; Cheng, T.C.E.; Huang, F. Storage assignment policy with awareness of energy consumption in the Kiva mobile fulfilment system. Transp. Res. Part E Logist. Transp. Rev. 2020, 144, 102158. [Google Scholar] [CrossRef]
- Cengiz Toklu, M. A fuzzy multi-criteria approach based on Clarke and Wright savings algorithm for vehicle routing problem in humanitarian aid distribution. J. Intell. Manuf. 2023, 34, 2241–2261. [Google Scholar] [CrossRef]
- Zäpfel, G.; Braune, R.; Bögl, M. Metaheuristic Search Concepts: A Tutorial with Applications to Production and Logistics; Springer: Berlin, Germany, 2010. [Google Scholar]
- Girard, S.; Renaud, J.; Boctor, F.F. A Simple and Efficient Perturbation Heuristics to Solve the Vehicle Routing Problem. In Network Organization Technology Research Center—Working Paper; Université Laval: Québec, QC, Canada, 2005; pp. 1–19. [Google Scholar]
- Laporte, G.; Semet, F. Classical Heuristics for the Capacitated VRP. In The Vehicle Routing Problem-SIAM Monographs on Discrete Mathematics and Applications; Toth, P., Vigo, D., Eds.; SIAM Publishing: Philadelphia, USA, 2001. [Google Scholar]
- Cordeau, J.F.; Gendreau, M.; Laporte, G.; Potvin, J.Y.; Semet, F. A guide to vehicle routing heuristics. J. Oper. Res. Soc. 2002, 53, 512–522. [Google Scholar] [CrossRef]
- Altınel, İ.K.; Öncan, T. A new enhancement of the Clarke and Wright savings heuristic for the capacitated vehicle routing problem. Journal of the Oper. Res. Soc. 2005, 56, 954–961. [Google Scholar] [CrossRef]
- Dukic, G.; Oluic, C. Order-picking methods: Improving order-picking efficiency. Int. J. Logist. Syst. Manag. 2007, 3, 451–460. [Google Scholar] [CrossRef]
- Eryavuz, M.; Gencer, C. An application of the vehicle routing problem. Süleyman Demirel Univ. Fac. Econ. Adm. Sci. J. 2001, 6, 139–155. [Google Scholar]
- Djebali, S.; Segonds, S.; Redonnet, J.M.; Rubio, W. Using the global optimisation methods to minimise the machining path length of the free-form surfaces in three-axis milling. Int. J. Prod. Res. 2015, 53, 5296–5309. [Google Scholar] [CrossRef]
- Chen, F.; Wei, Y.; Wang, H. A heuristic based batching and assigning method for online customer orders. Flex. Serv. Manuf. J. 2018, 30, 640–685. [Google Scholar] [CrossRef]
- Francis, P.; Smilowitz, K.; Tzur, M. The period vehicle routing problem with service choice. Transp. Sci. 2006, 40, 439–454. [Google Scholar] [CrossRef]
- Daskin, S.M. Service Science; Wiley Publications: New York, NY, USA, 2010. [Google Scholar]
- Arakaki, R.K.; Usberti, F.L. Hybrid genetic algorithm for the open capacitated arc routing problem. Comput. Oper. Res. 2018, 90, 221–231. [Google Scholar] [CrossRef]
- McCall, J. Genetic algorithms for modelling and optimisation. J. Comput. Appl. Math. 2005, 184, 205–222. [Google Scholar] [CrossRef]
- Tasan, A.S.; Gen, M. A genetic algorithm based approach to vehicle routing problem with simultaneous pick-up and deliveries. Comput. Ind. Eng. 2012, 62, 755–761. [Google Scholar] [CrossRef]
- Saraç, T.; Özçelik, F. Generation of production cells in the presence of alternative routes using genetic algorithm. Ind. Eng. 2006, 17, 22–36. [Google Scholar]
- Karaboga, D. Artificial Intelligence Optimization Algorithms, 2nd ed.; Nobel Publishing: Ankara, Türkiye, 2011. [Google Scholar]
- Gen, M.; Cheng, R. Genetic Algorithms and Engineering Design; Wiley Series in Engineering Design and Automation: New York, NY, USA, 1997. [Google Scholar]
- Kumar, A.; Tiwari, M.K.; Shankar, R.; Baveja, A. Solving machine-loading problem of a flexible manufacturing system with constraint-based genetic algorithm. Eur. J. Oper. Res. 2006, 175, 1043–1069. [Google Scholar] [CrossRef]
- Tsai, C.Y.; Liou, J.J.; Huang, T.M. Using a multiple-GA method to solve the batch picking problem: Considering travel distance and order due time. Int. J. Prod. Res. 2008, 46, 6533–6555. [Google Scholar] [CrossRef]
- Ene, S.; Öztürk, N. Storage location assignment and order picking optimization in the automotive industry. Int. J. Adv. Manuf. Technol. 2012, 60, 787–797. [Google Scholar] [CrossRef]
- Koch, S.; Wäscher, G. A grouping genetic algorithm for the order batching problem in distribution warehouses. J. Bus. Econ. 2016, 86, 131–153. [Google Scholar] [CrossRef]
- Pinto, A.R.F.; Nagano, M.S. An approach for the solution to order batching and sequencing in picking systems. Prod. Eng. 2019, 13, 325–341. [Google Scholar] [CrossRef]
- Ou, S.; Ismail, Z.H.; Sariff, N. Hybrid Genetic Algorithms for Order Assignment and Batching in Picking System: A Systematic Literature Review. IEEE Access 2024, 12, 23026–23042. [Google Scholar] [CrossRef]
- Wu, G.-H.; Cheng, C.-Y.; Liu, M.-H. Two-Stage Metaheuristic Algorithms for Order-Batching and Routing Problems. Appl. Sciende 2022, 12, 10921. [Google Scholar] [CrossRef]
- Wu, Y.; Ji, P.; Wang, T. An empirical study of a pure genetic algorithm to solve the capacitated vehicle routing problem. ICIC Express Lett. 2008, 2, 41–45. [Google Scholar]
- Ghoseiri, K.; Ghannadpour, S.F. A hybrid genetic algorithm for multi-depot homogenous locomotive assignment with time windows. Appl. Soft Comput. 2010, 10, 53–65. [Google Scholar] [CrossRef]
- Ghannadpour, S.F.; Zandiyeh, F. An adapted multi-objective genetic algorithm for solving the cash in transit vehicle routing problem with vulnerability estimation for risk quantification. Eng. Appl. Artif. Intell. 2020, 96, 103964. [Google Scholar] [CrossRef]
- Chang, Y.; Chen, L. Solve the vehicle routing problem with time windows via a genetic algorithm. Discret. Contin. Dyn. Syst.-Spec. Issue 2007, 2007, 240–249. [Google Scholar] [CrossRef]
- Hsieh, L.F.; Huang, C.J.; Huang, C.L. Applying particle swarm optimization to schedule order picking routes in a distribution center. Asian J. Manag. Humanit. Sci. 2007, 1, 558–576. [Google Scholar]
- Engin, O.; Fığlalı, A. Determination of appropriate crossover operator in the solution of flow type scheduling problems by genetic algorithm. J. Doğuş Univ. 2002, 6, 27–35. [Google Scholar]
- Molnar, B.; Lipovszki, G. Multi-objective routing and scheduling of order pickers in a warehouse. Int. J. Simul. 2005, 6, 22–32. [Google Scholar]
- Ozmen, M.; Sahin, H. Real-time Optimization of School Bus Routing Problem in Smart Cities using Genetic Algorithm. In Proceedings of the International Conference on Inventive Computation Technologies (ICICT), Coimbatore, India, 20–22 January 2021; pp. 1152–1158. [Google Scholar]
- Aytug, H.; Koehler, G.J. New stopping criterion for genetic algorithms. Eur. J. Oper. Res. 2000, 126, 662–674. [Google Scholar] [CrossRef]
- Hillier, F.S.; Lieberman, G.J. Introduction to Operations Research, 8th ed.; McGraw-Hill: New York, NY, USA, 2005. [Google Scholar]
- Machado, P.; Tavares, J.; Pereira, F.B.; Costa, E. Vehicle Routing Problem: Doing It The Evolutionary Way. In Proceedings of the Genetic and Evolutionary Computation Conference-GECCO, New York, NY, USA, 9–13 June 2002. [Google Scholar]
- Ma, B.J.; Kuo, Y.H.; Jiang, Y.; Huang, G.Q. RubikCell: Toward robotic cellular warehousing systems for e-commerce logistics. IEEE Trans. Eng. Manag. 2023, 71, 9270–9285. [Google Scholar] [CrossRef]
- Bottani, E.; Cecconi, M.; Vignali, G.; Montanari, R. Optimisation of storage allocation in order picking operations through a genetic algorithm. Int. J. Logist. Res. Appl. 2012, 15, 127–146. [Google Scholar] [CrossRef]
- Cergibozan, Ç.; Tasan, A.S. Genetic algorithm based approaches to solve the order batching problem and a case study in a distribution center. J. Intell. Manuf. 2022, 33, 137–149. [Google Scholar] [CrossRef]
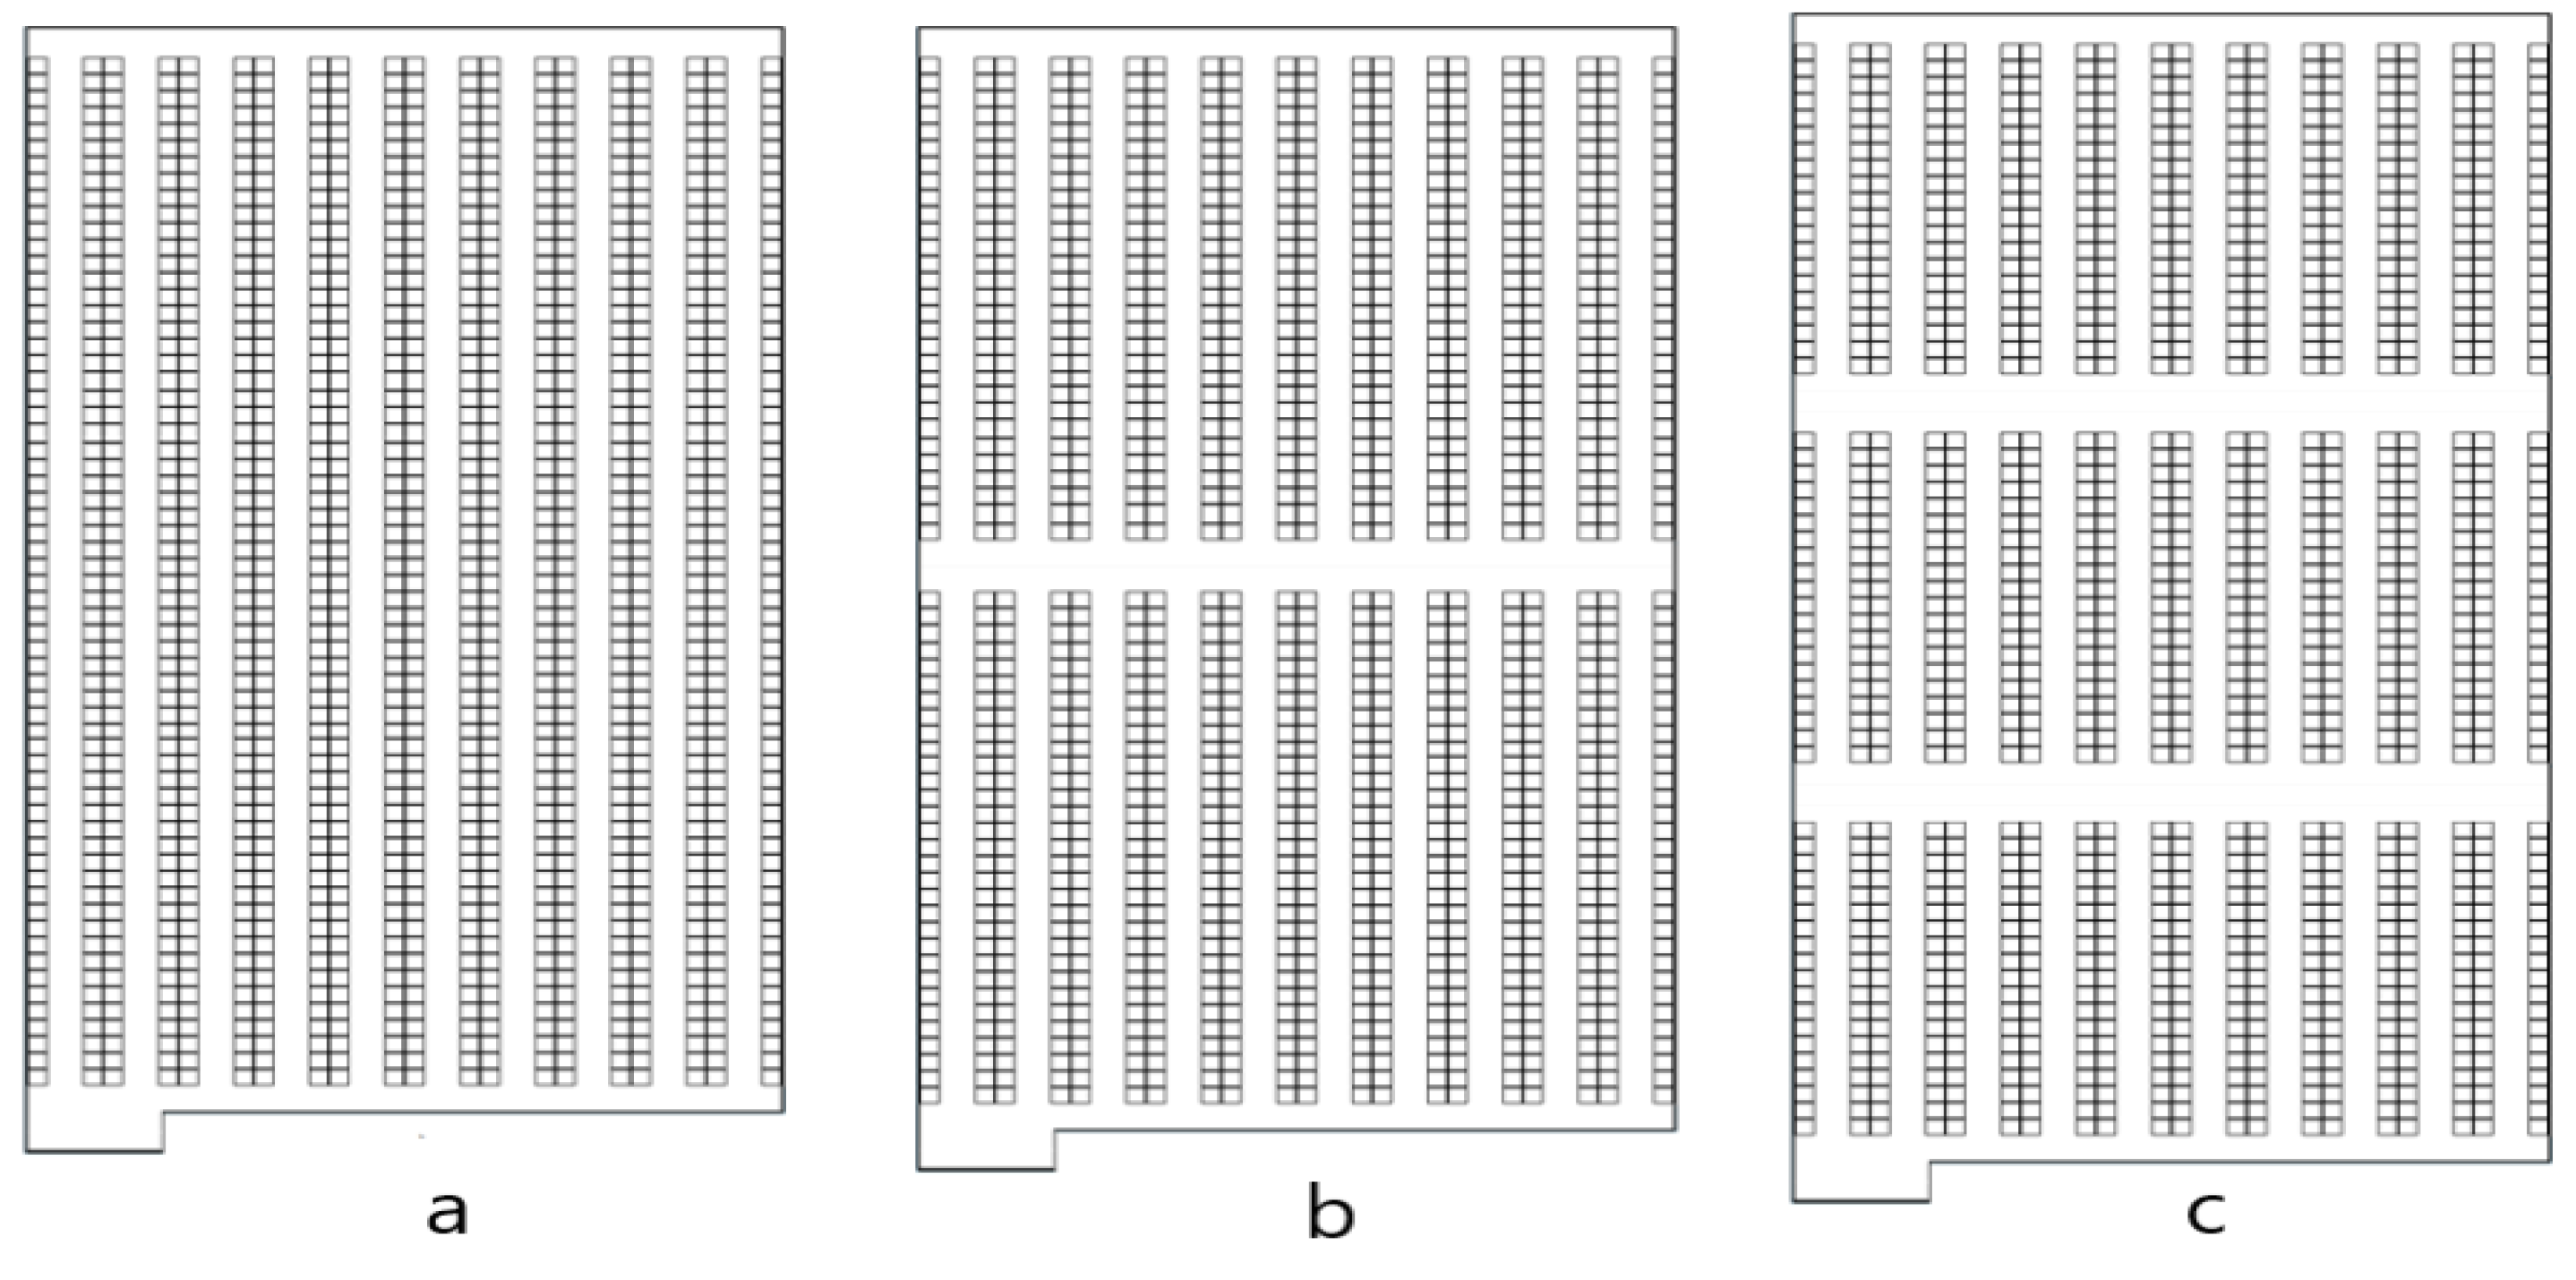
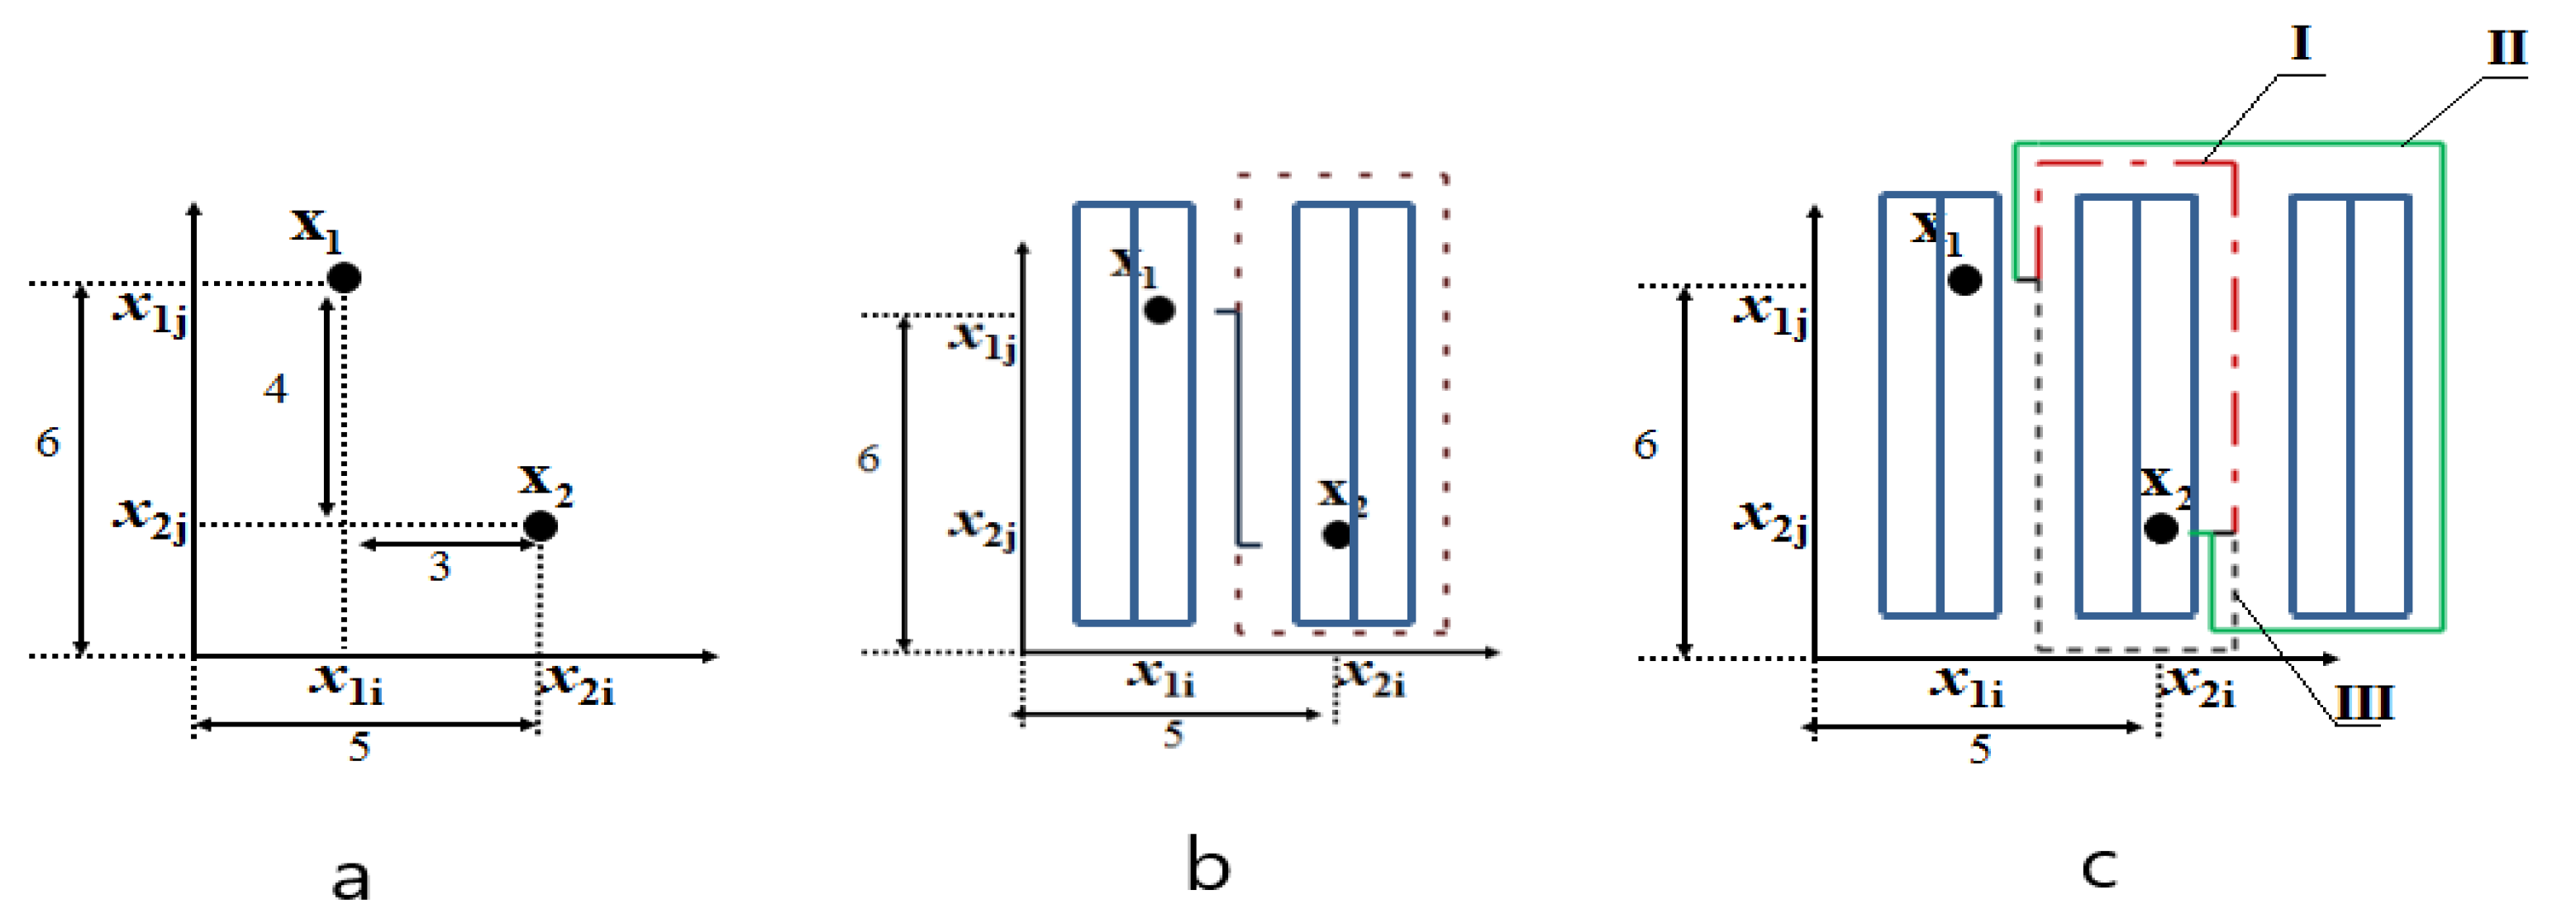
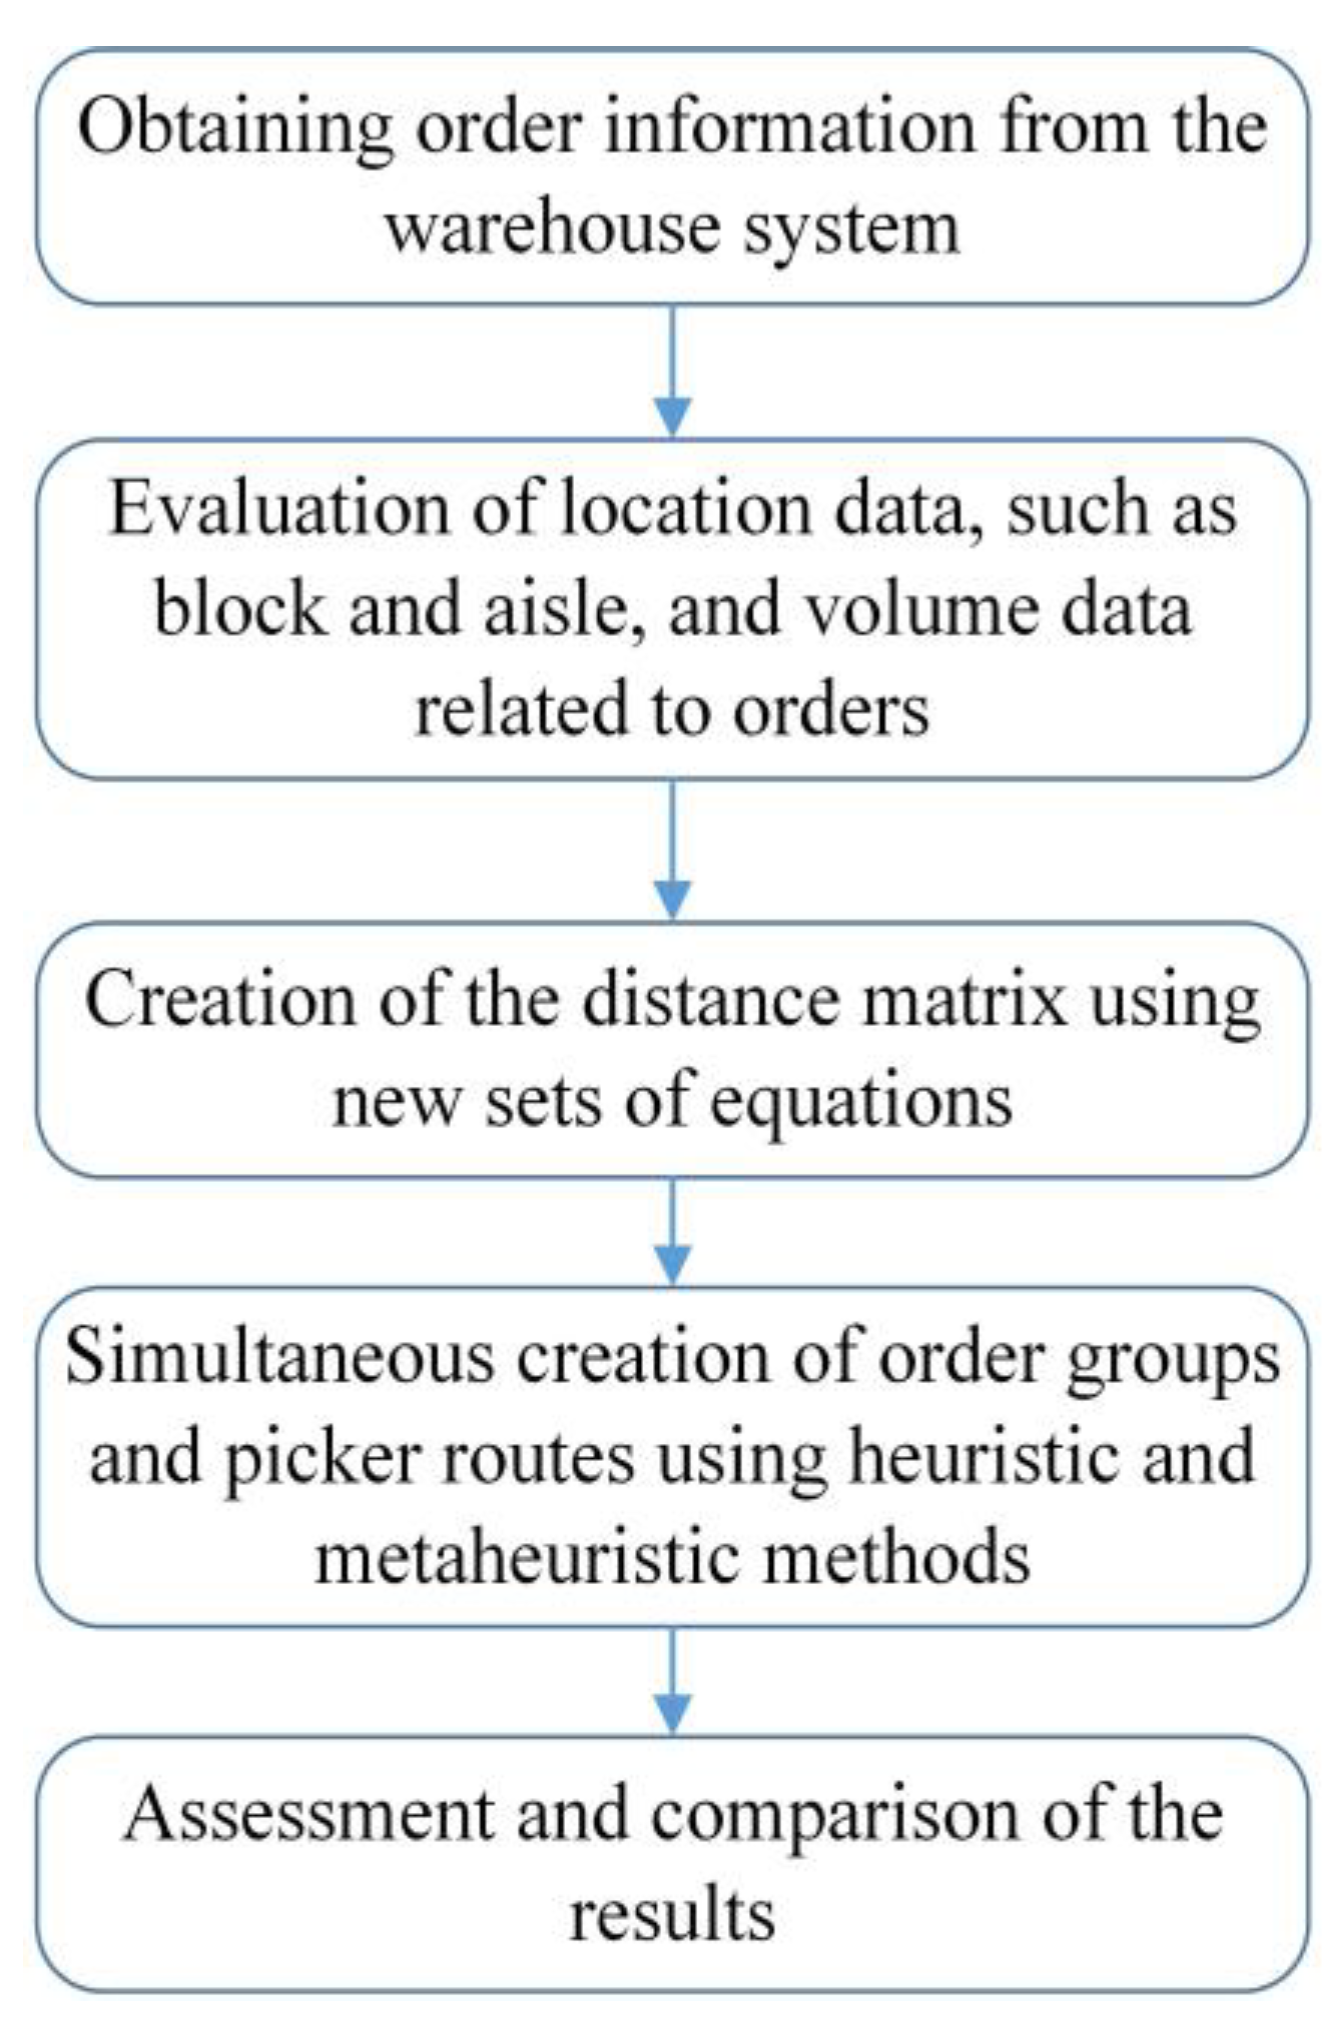
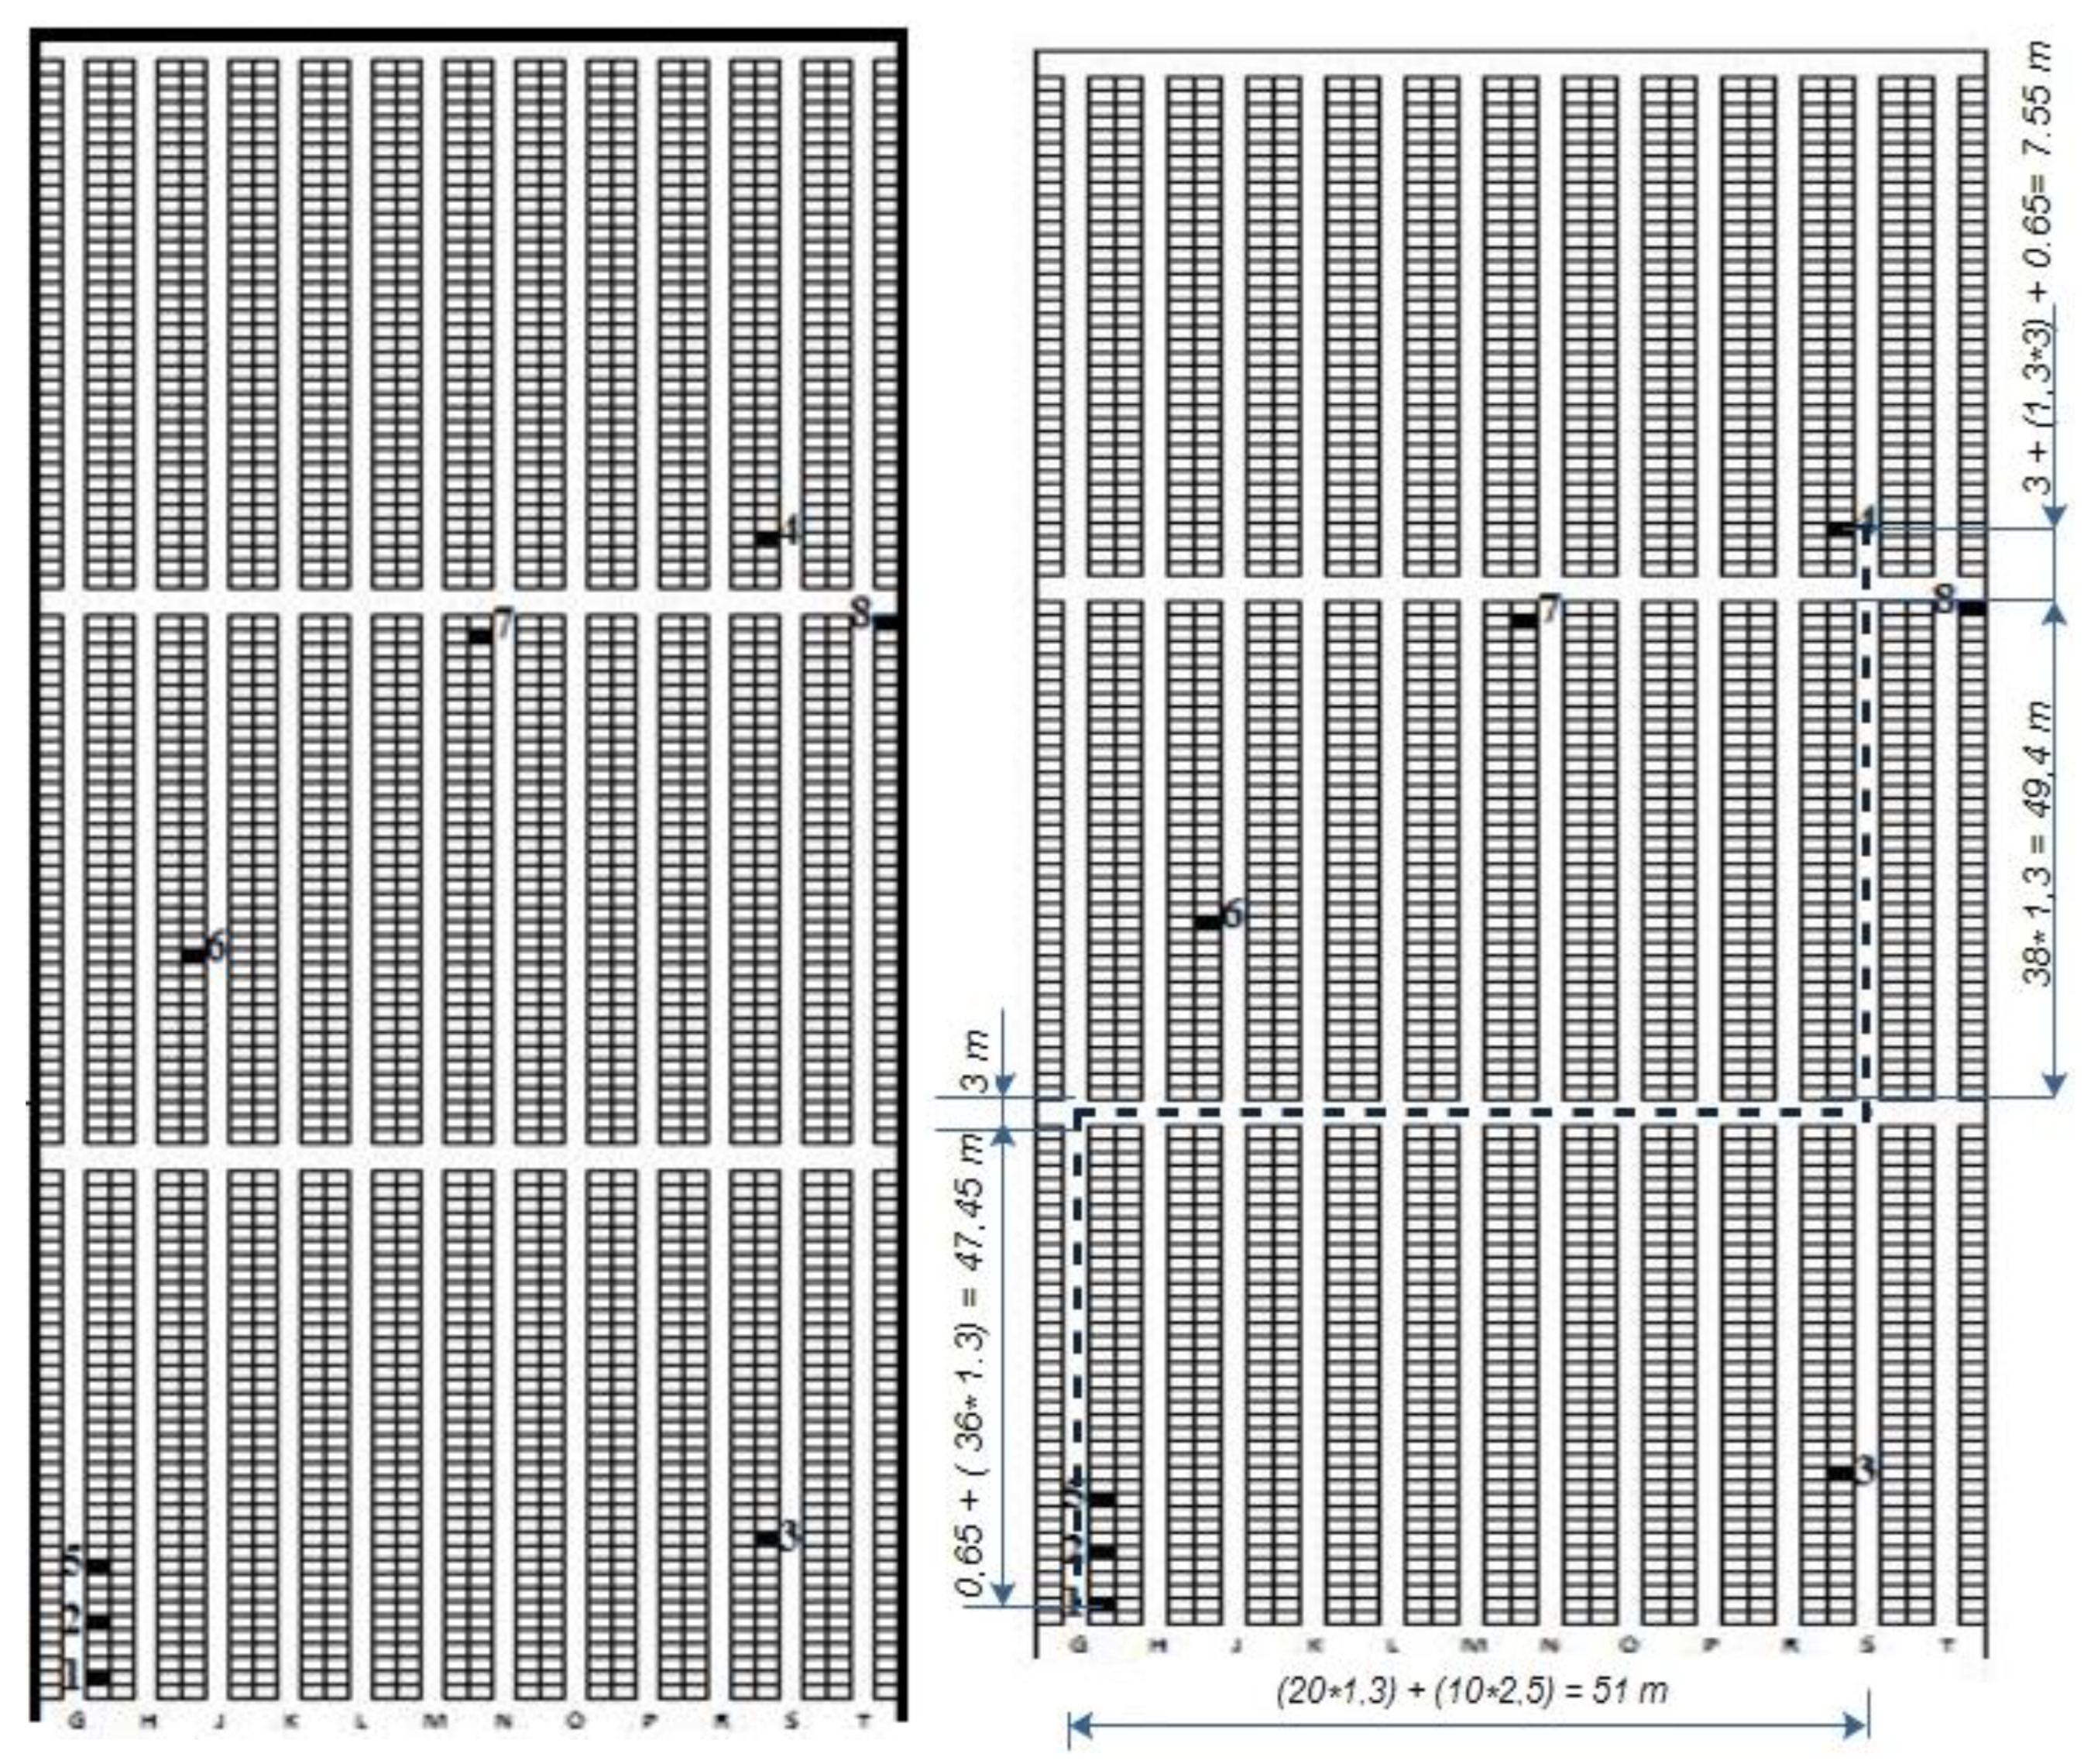
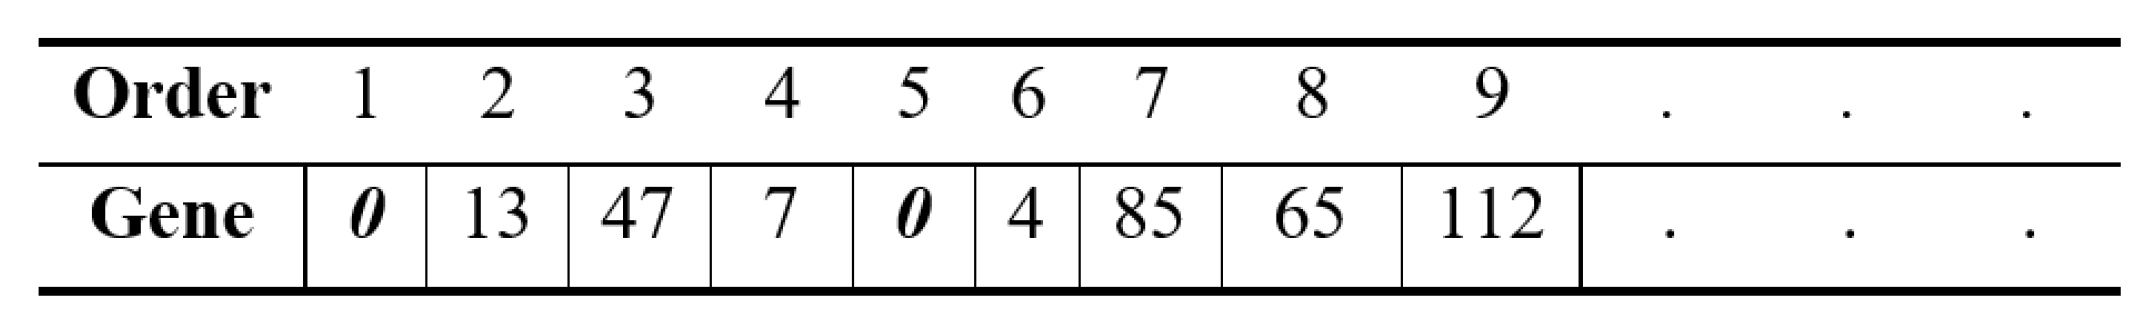
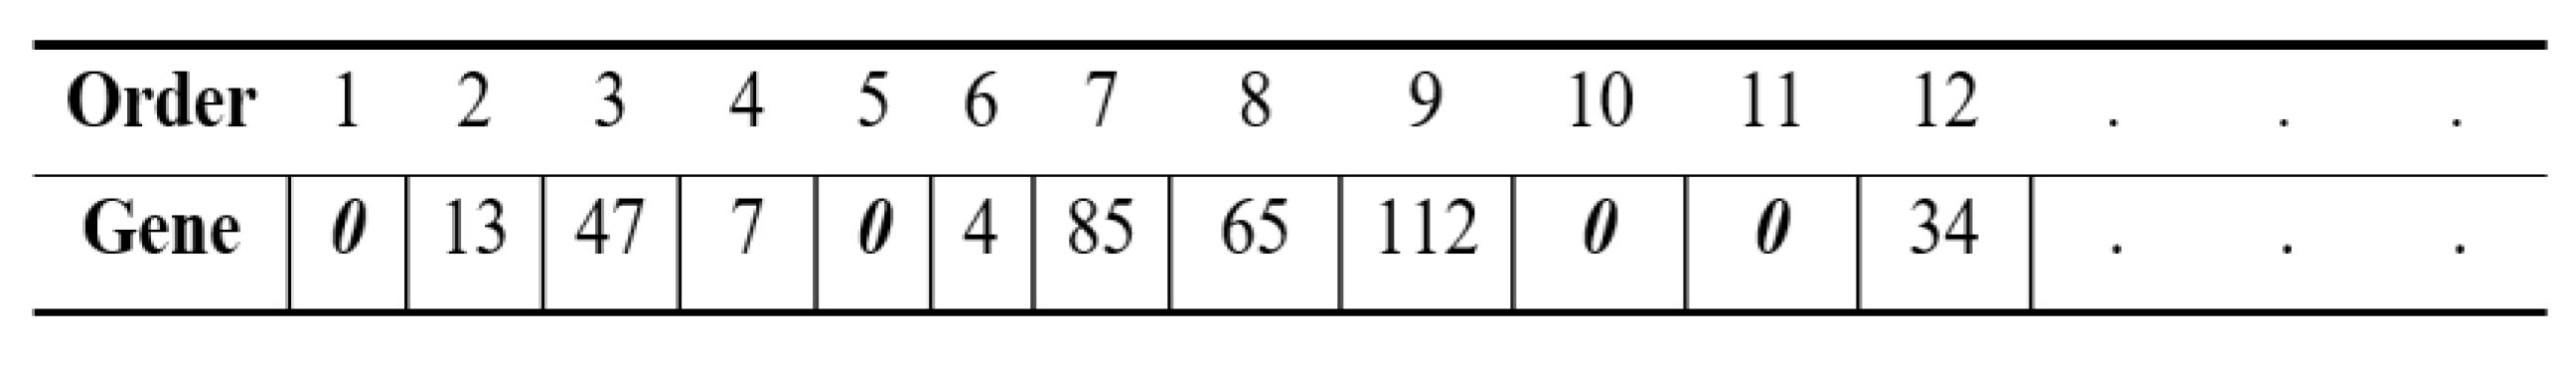
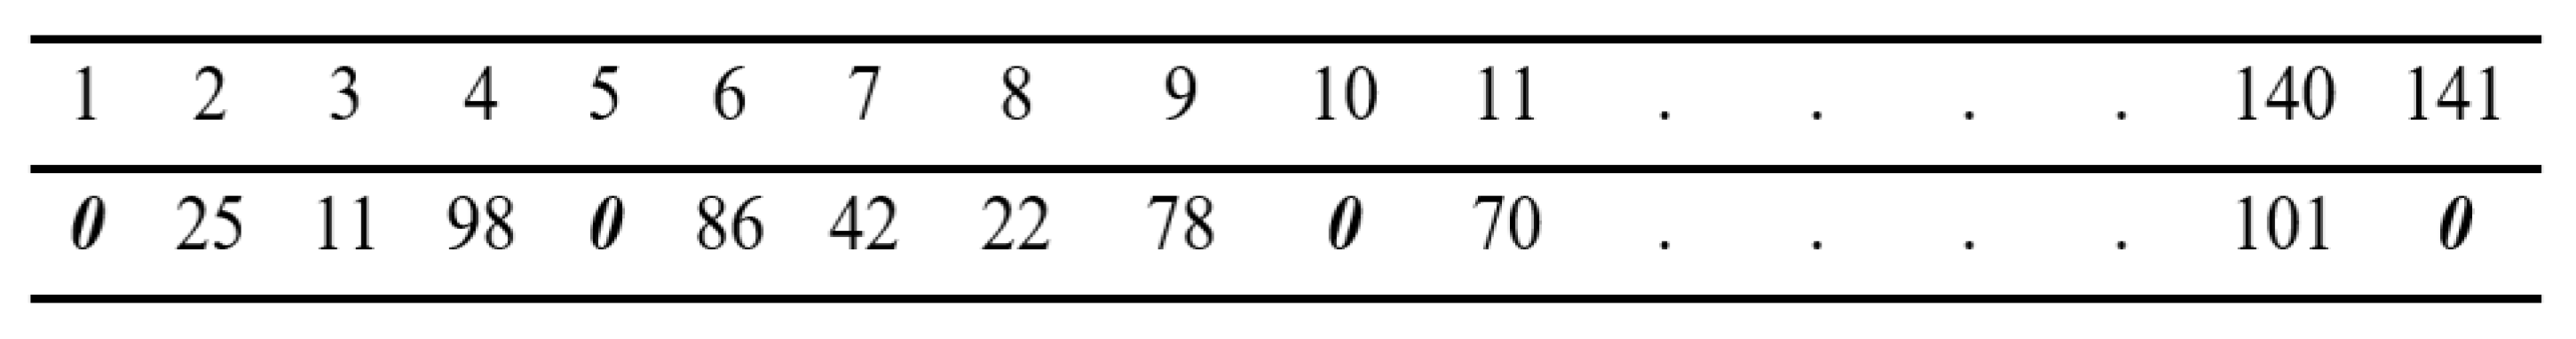
Disclaimer/Publisher’s Note: The statements, opinions and data contained in all publications are solely those of the individual author(s) and contributor(s) and not of MDPI and/or the editor(s). MDPI and/or the editor(s) disclaim responsibility for any injury to people or property resulting from any ideas, methods, instructions or products referred to in the content. |
© 2025 by the author. Licensee MDPI, Basel, Switzerland. This article is an open access article distributed under the terms and conditions of the Creative Commons Attribution (CC BY) license (https://creativecommons.org/licenses/by/4.0/).