The Need to Accurately Define and Measure the Properties of Particles
Abstract
:1. Introduction
2. Particle Size and Its Size Distribution (PSD)
2.1. The Average Particle Size
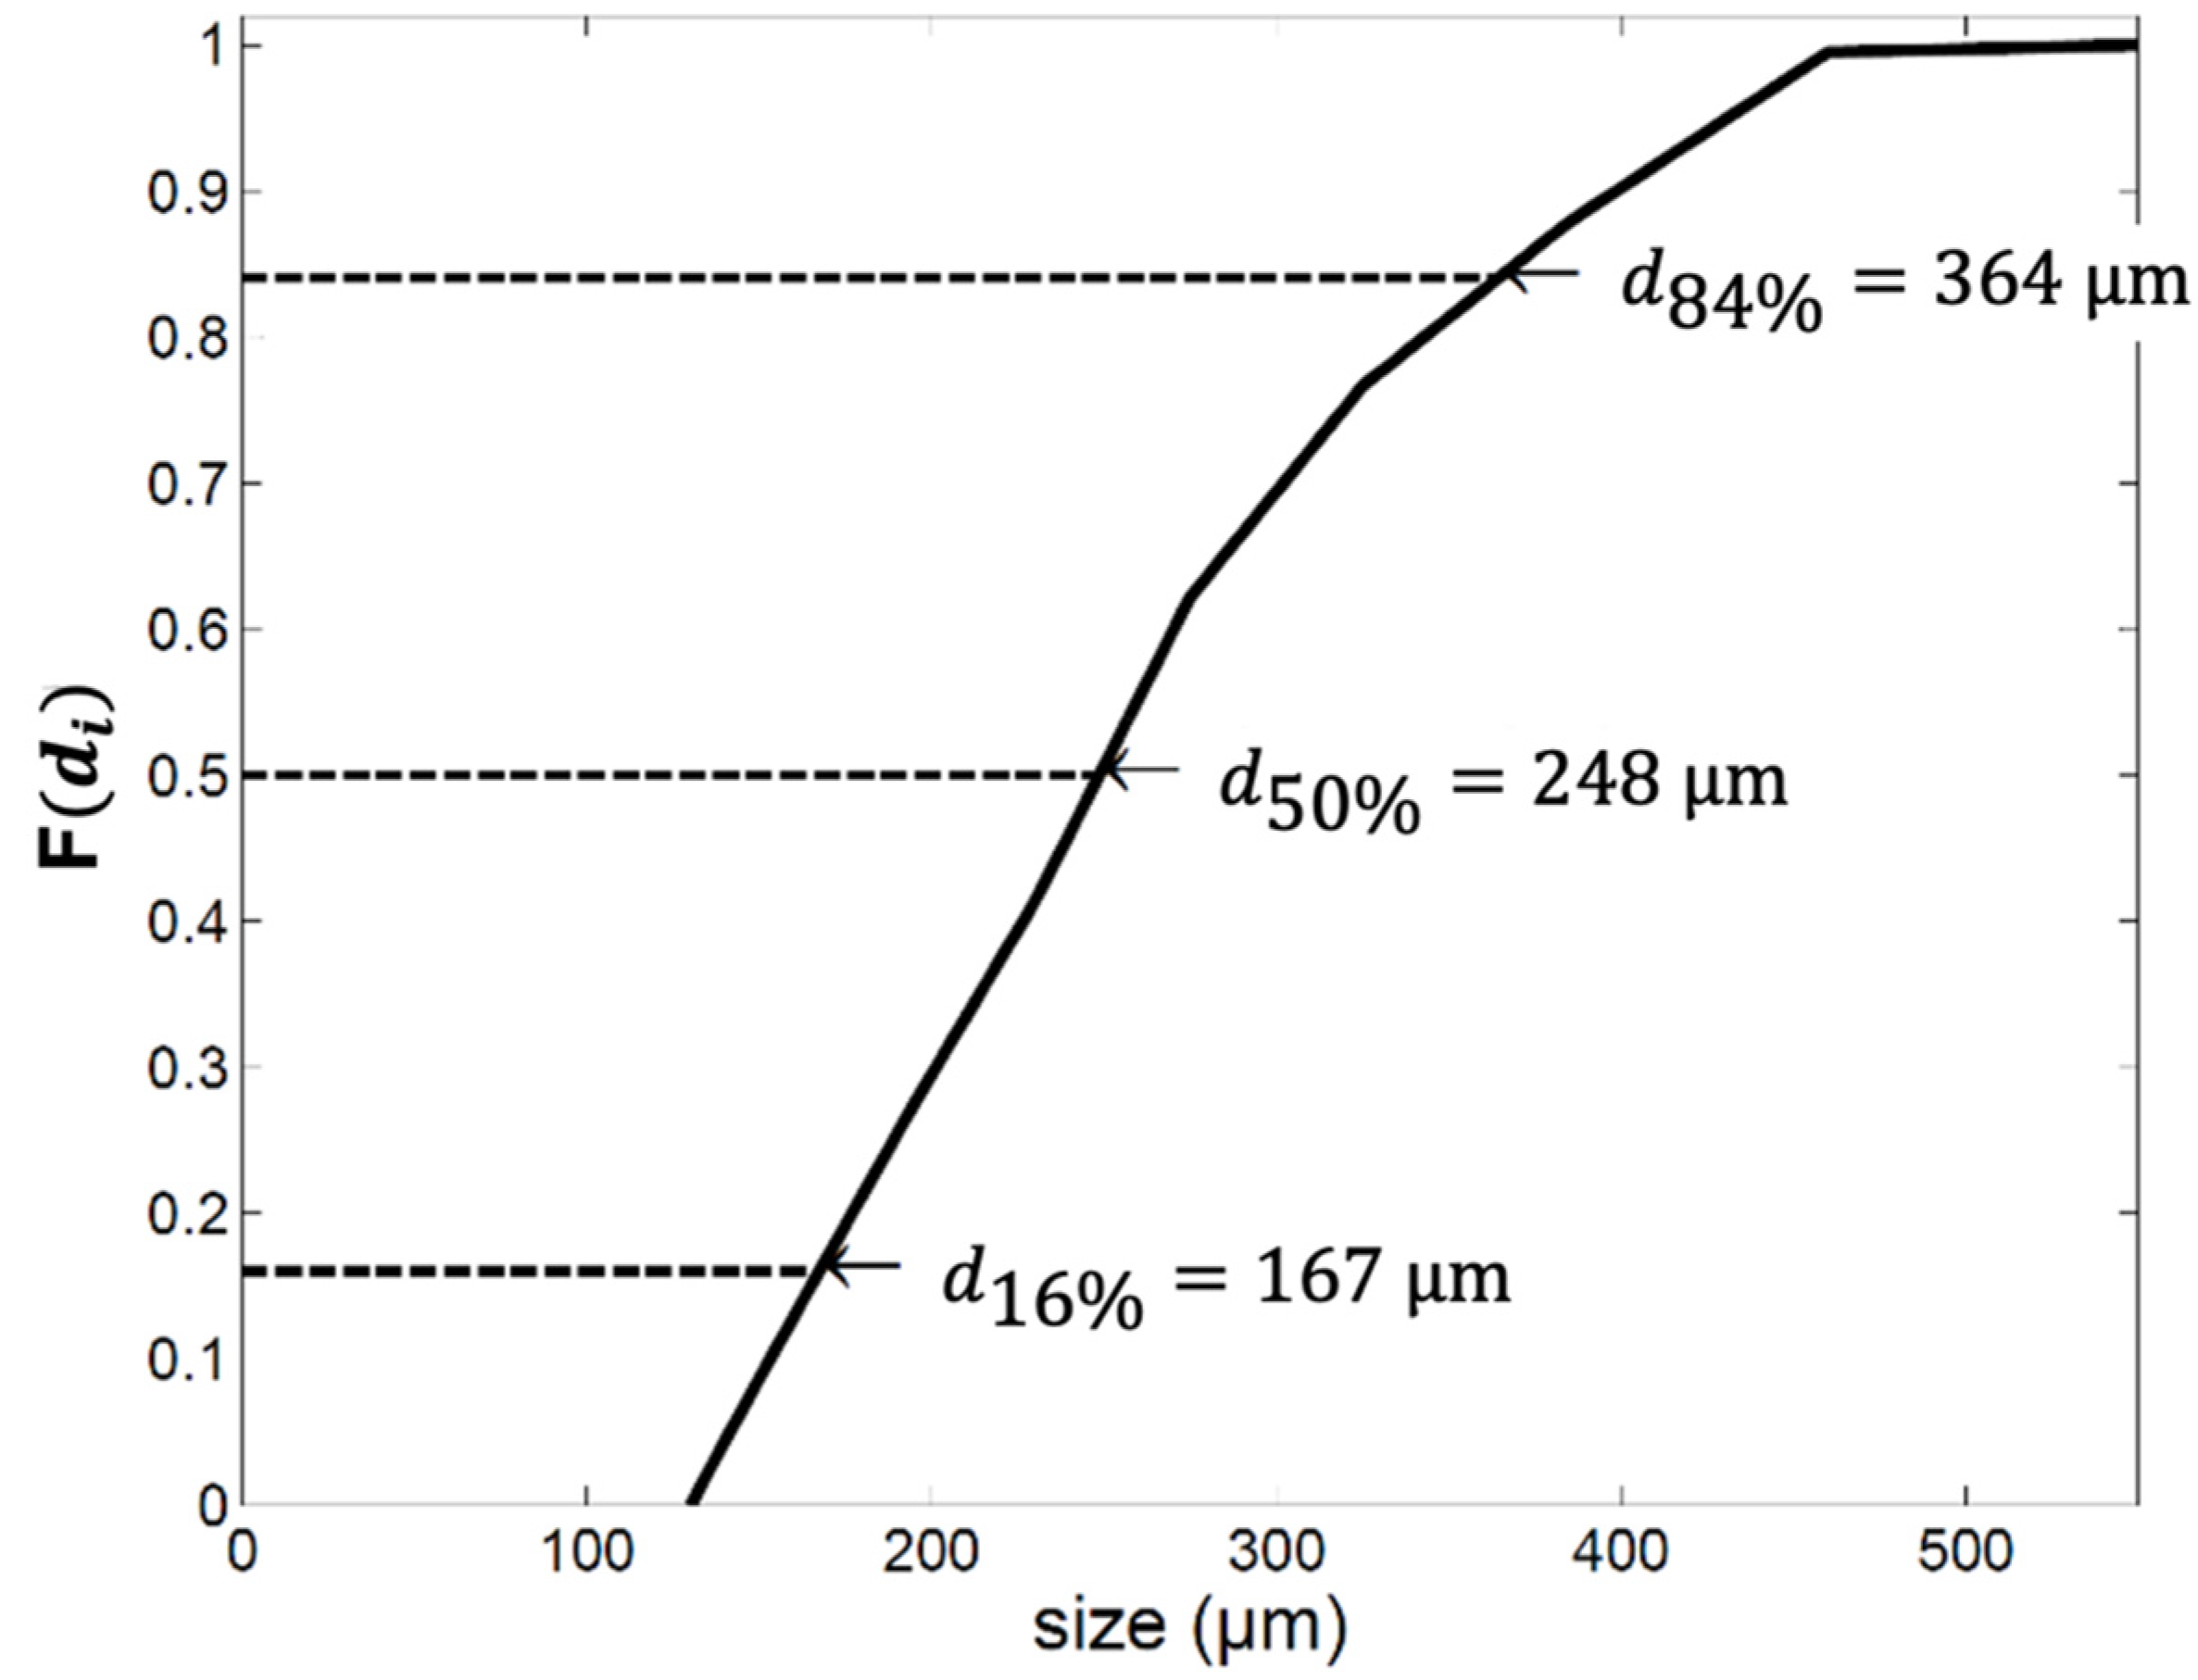
2.2. The Particle Size Distribution
2.3. Particle Size and Size Distribution Measurements
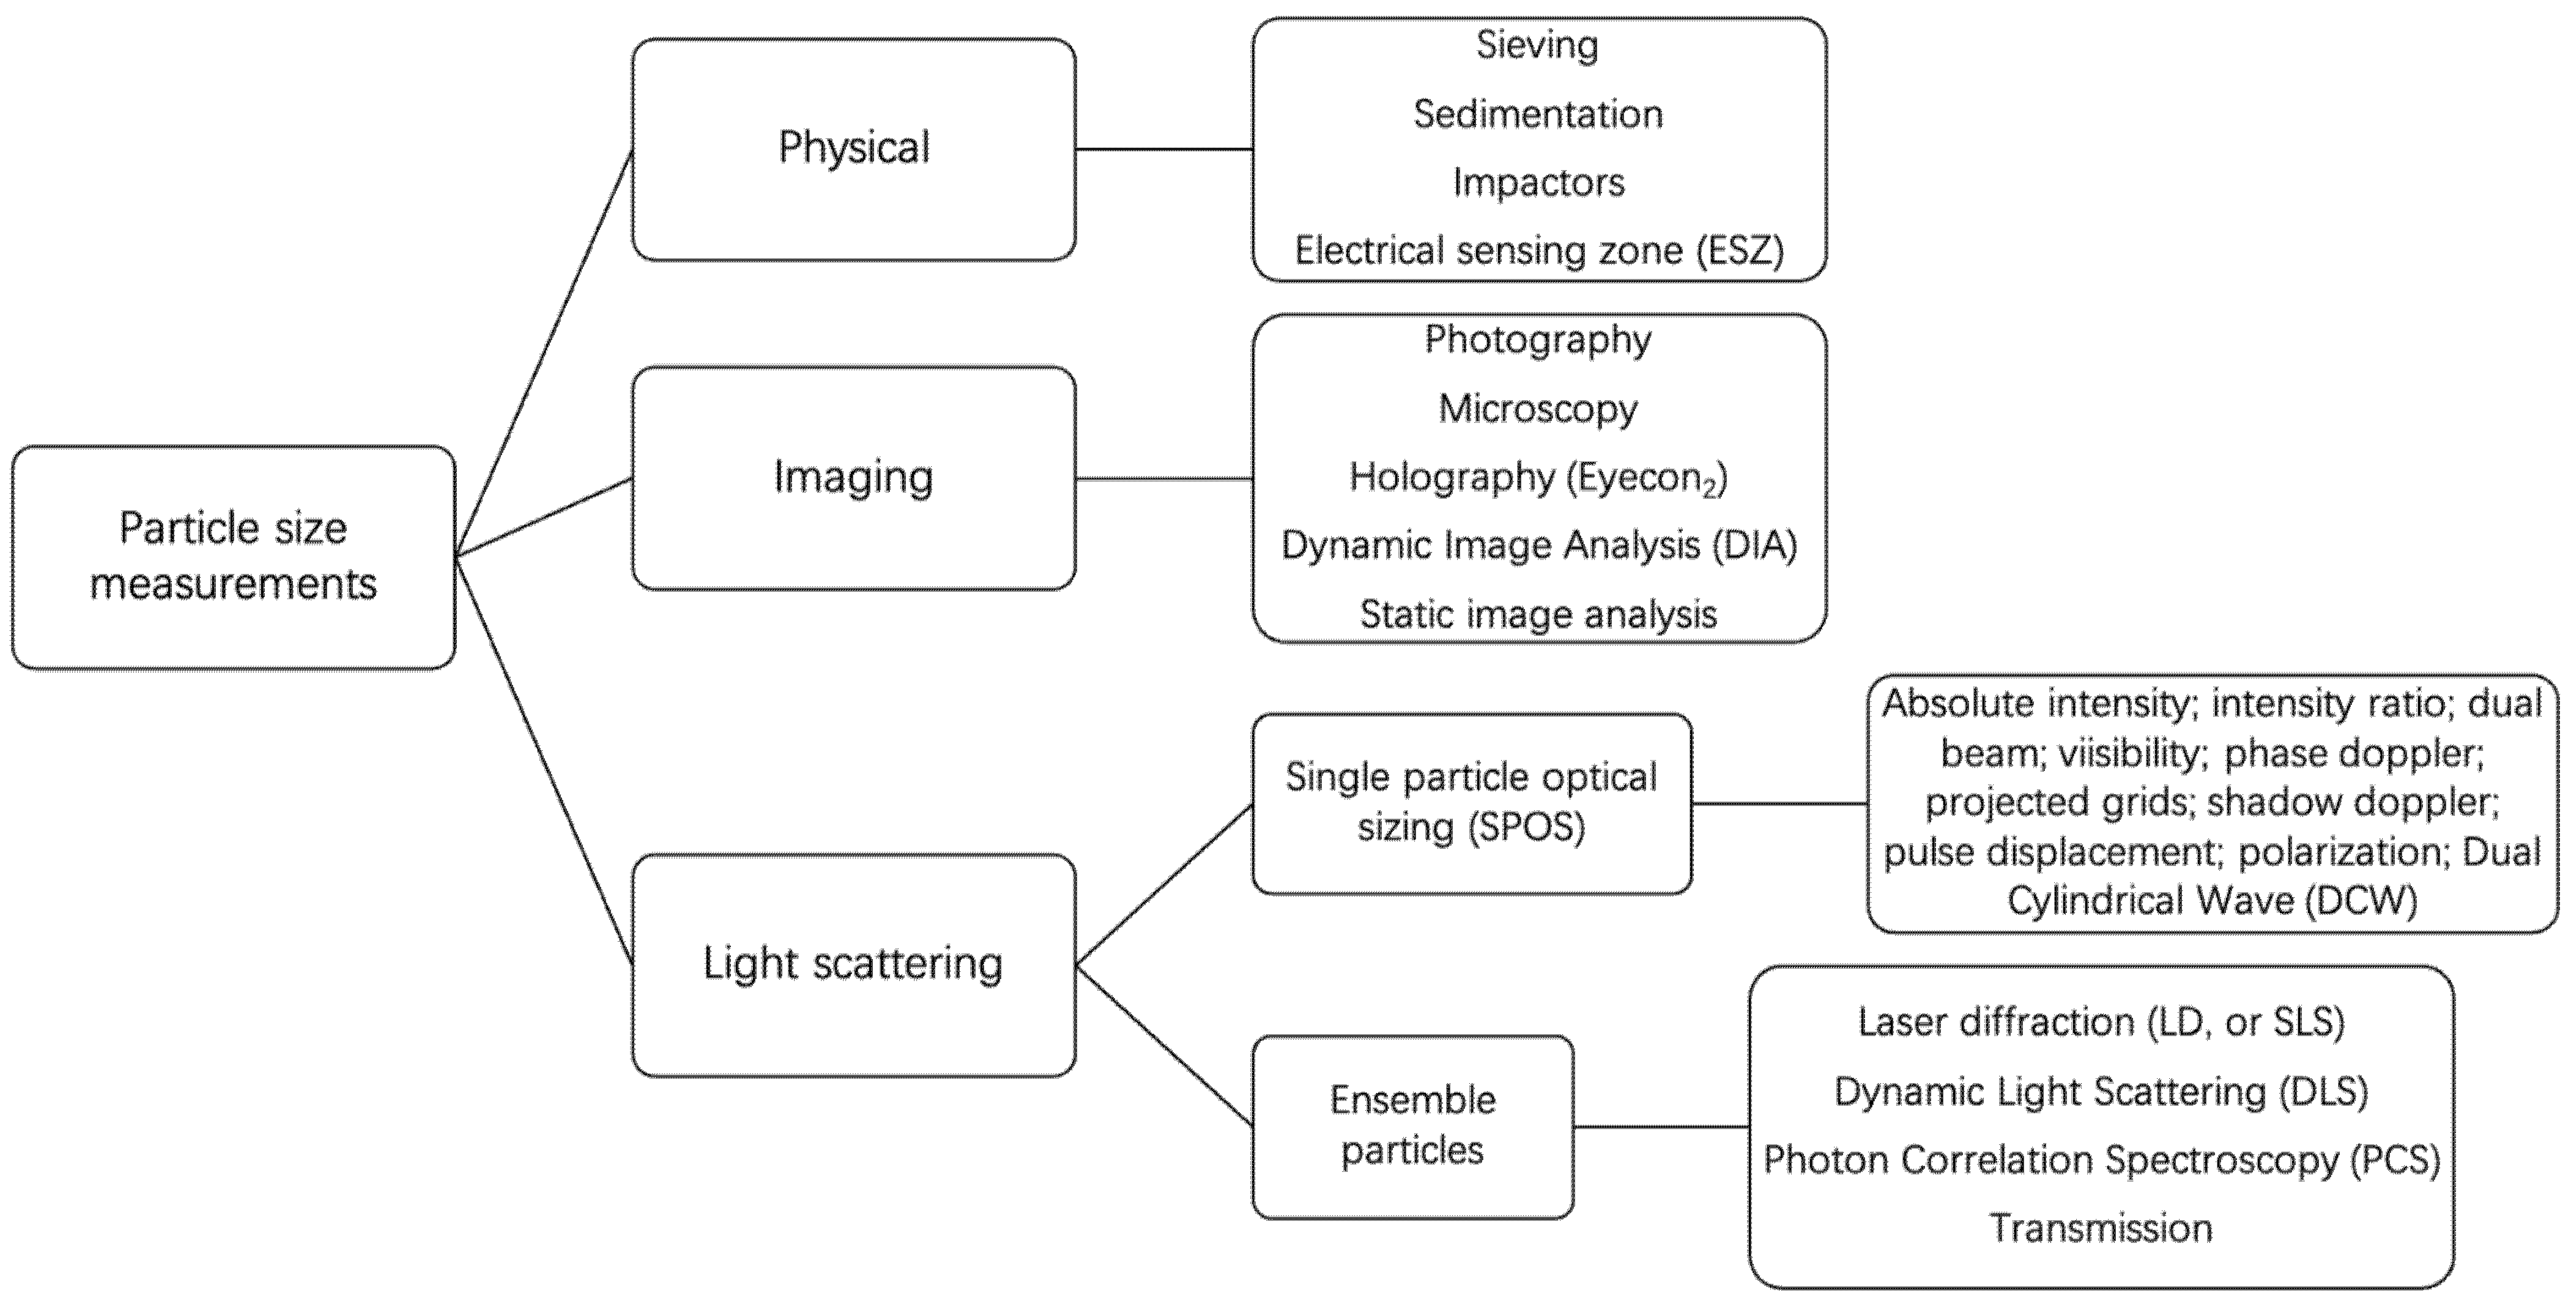
2.3.1. Common Instrumental Techniques
2.3.2. Parameters Affecting the Instrumental Particle Size Measurement
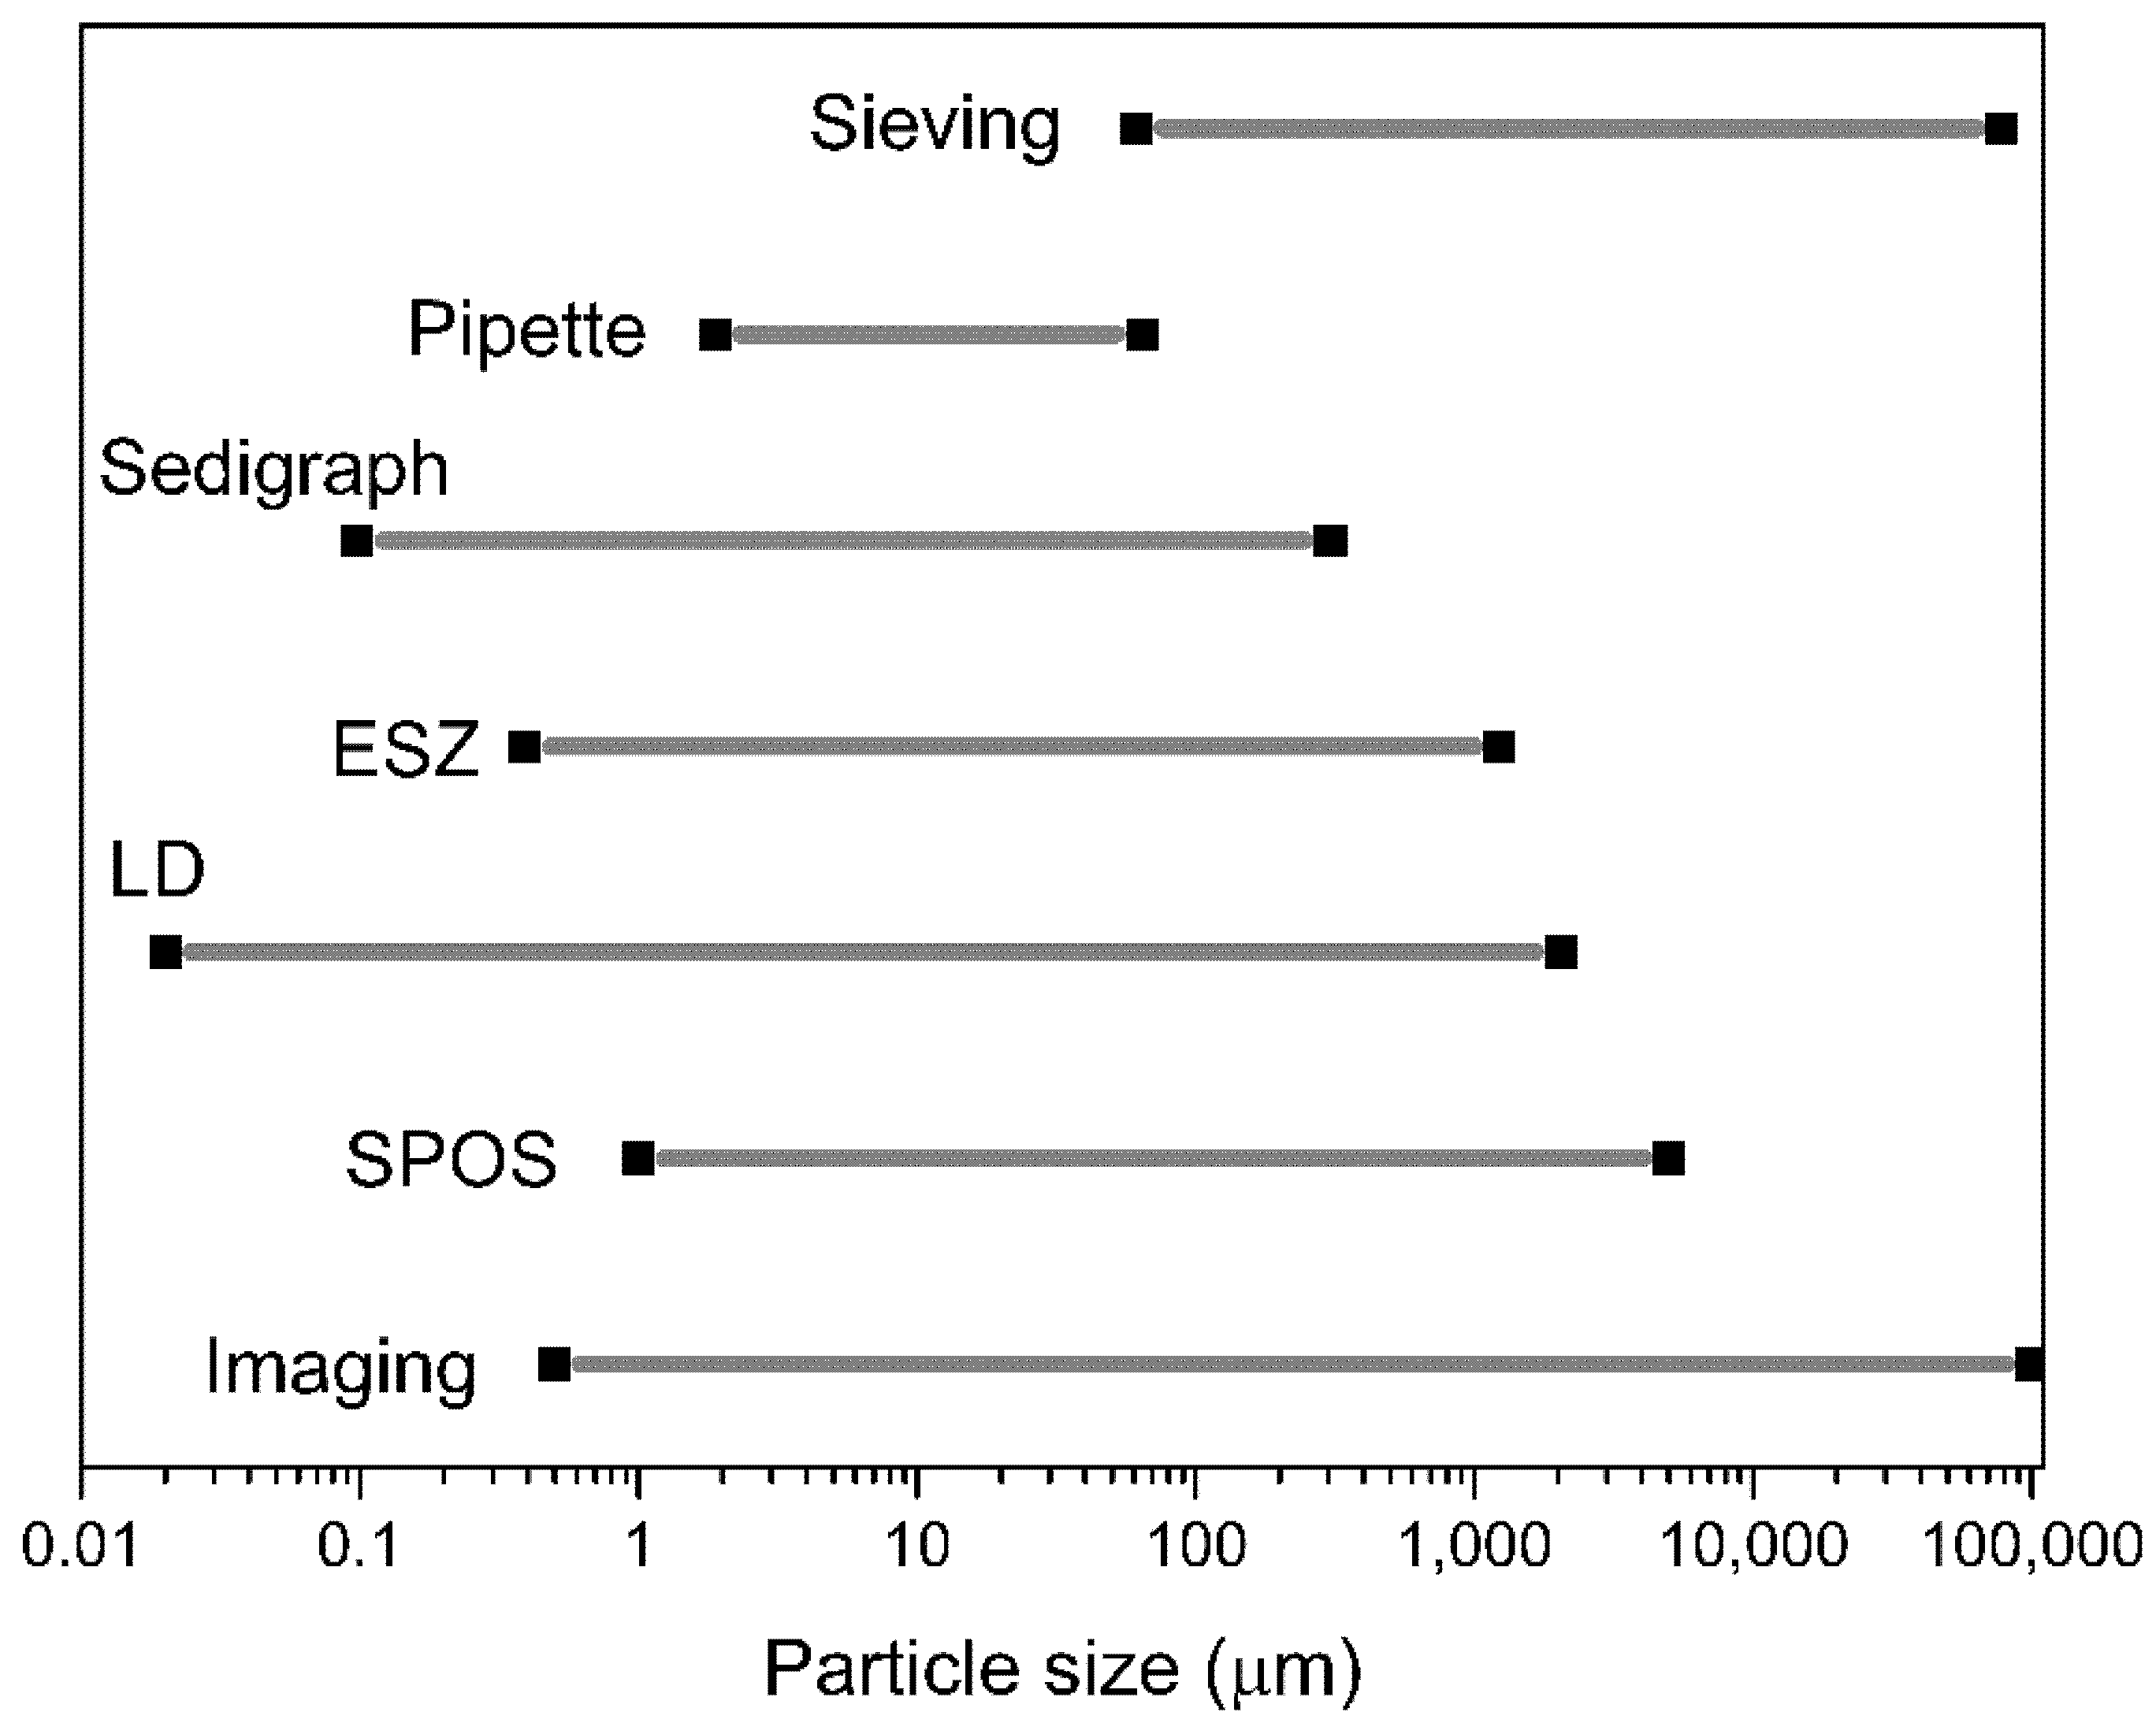
2.3.3. Comparing the Common Particle Size Analyzers
3. Particle Shape
4. Particle Density and Bed Voidage
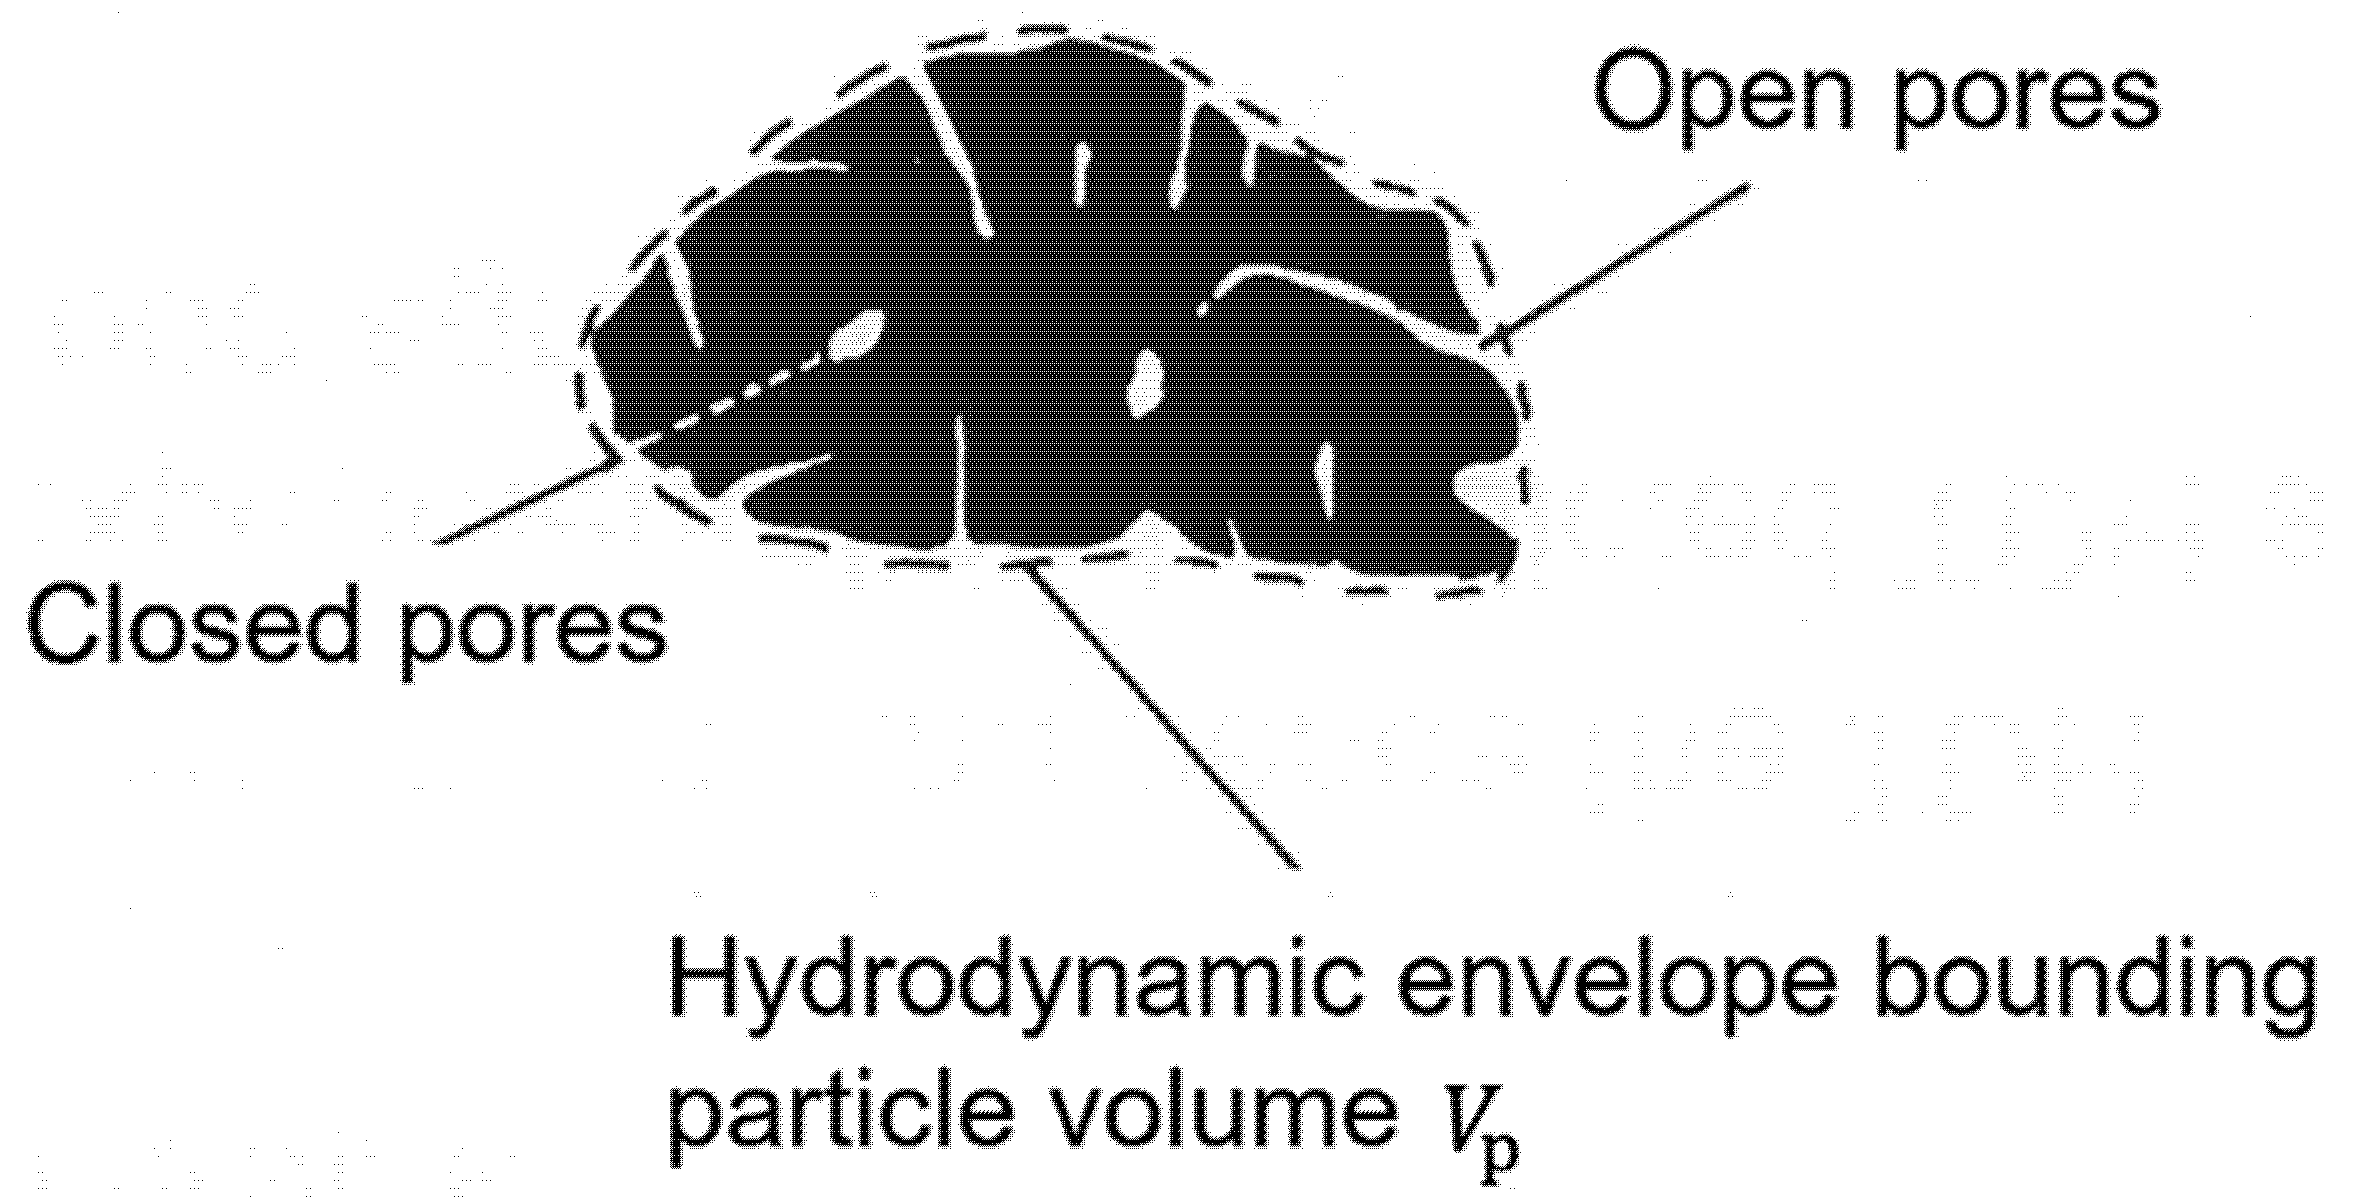
4.1. Particle Density
- (1)
- Caking end-point measurements are sometimes performed in the petrochemical industry for rapid and cheap estimations of pore volume. In these measurements, the investigated powder is put in a vibrating flask and a liquid with low viscosity or volatility (for example, water) is added incrementally. As long as the liquid is absorbed into the microscopic pores, the powder remains free-flowing. If the pores are completely filled, any surplus of liquid will coat the surface of the particles and cause the formation of liquid bridges, i.e., caking. This surplus depends on pore size and the surface tension. A complete filling-up of the pores is often impossible due to surface tension constraints. As a result, the caking end-point measurement method tends to overestimate the particle density. If the pore volume is determined, the particle density can be calculated with:with x as the specific pore volume (m3/kg).
- (2)
- In a porosimeter, mercury under high pressure is forced into to the pores of the particles. Eventually, the pore size can be determined. As in the caking end-point method, the particle density is determined from Equation (30). A major setback of this measuring method is its high cost.
- (3)
- The particle density can also be determined in the comparative method by examining the tapped bulk density, , of both the sample and a control powder. Then, applying Equation (31) yields the particle density of the investigated sample powder.with and as the tapped bulk density of the sample and the control powder and and as the particle density of the sample and control powder. Since the control powder might have a different particle shape than that of the unknown powder, a shape factor k is introduced, with illustrative values as given below:
- k = 1 for identically shaped sample particles and control particles
- k ≈ 0.82 for rounded or spherical sample particles and angular control particles
- k ≈ 1/0.82 for angular sample particles and spherical or rounded control particles
- (4)
- In the adapted gas flow technique of Ergun, the particle density is determined by comparing the pressure drop over a bed with minimum voidage to a bed with a maximum voidage. Maximum voidage can be achieved by fluidizing the sample and letting it gently settle. The resulting bed can next be tapped for a sufficient length of time to reach the state of minimal voidage. In both situations, the bed height LA (aerated) and LT (tapped) is measured. Additionally, the pressure drop, ∆p, is recorded for at least four different gas velocities. Next, the pressure drop is plotted against the superficial velocity (v) and the slope within the laminar flow regime (Re < 2) is measured. With these values, the particle density can be calculated using a rearranged form of Equation (28), i.e., the Ergun equation in the laminar flow regime, with L, the bed length (m), ε the bed voidage (-) and µ the gas viscosity (Pa s).
- (5)
- Rearranged, the slopes of the graphs SA and SB for the two beds are
- (6)
- In the powder displacement method, the particle density is measured by comparing the tapped bulk density of a control powder with a mixture of the control and the sample powder. This technique is specific because the fine powder is used as pycnometric fluid to fill the open pores in the investigated particles. As such, the pycnometric powder must be free-flowing, non-porous and sufficiently smaller than the sample particles. If the latter condition is not fulfilled, the comparison between the control powder and the mixture of control and sample powder will give erroneous results. This test can be performed in the apparatus illustrated in Figure 10b. If the control tapped bulk density is , up to 20 wt% of the larger unknown porous particles is mixed with the control powder and tapped in the cup of Figure 10b.
- (7)
- Additionally, the minimum fluidization velocity is related to the particle density in the Ergun equation:with the subscript MF denoting the conditions at minimum fluidization velocity.
- (8)
4.2. Bulk Density
- RH < 1.25: Group A, B, or D
- RH > 1.4: Group C
- 1.25 < RH < 1.4: Transition group AC
4.3. Bed Voidage
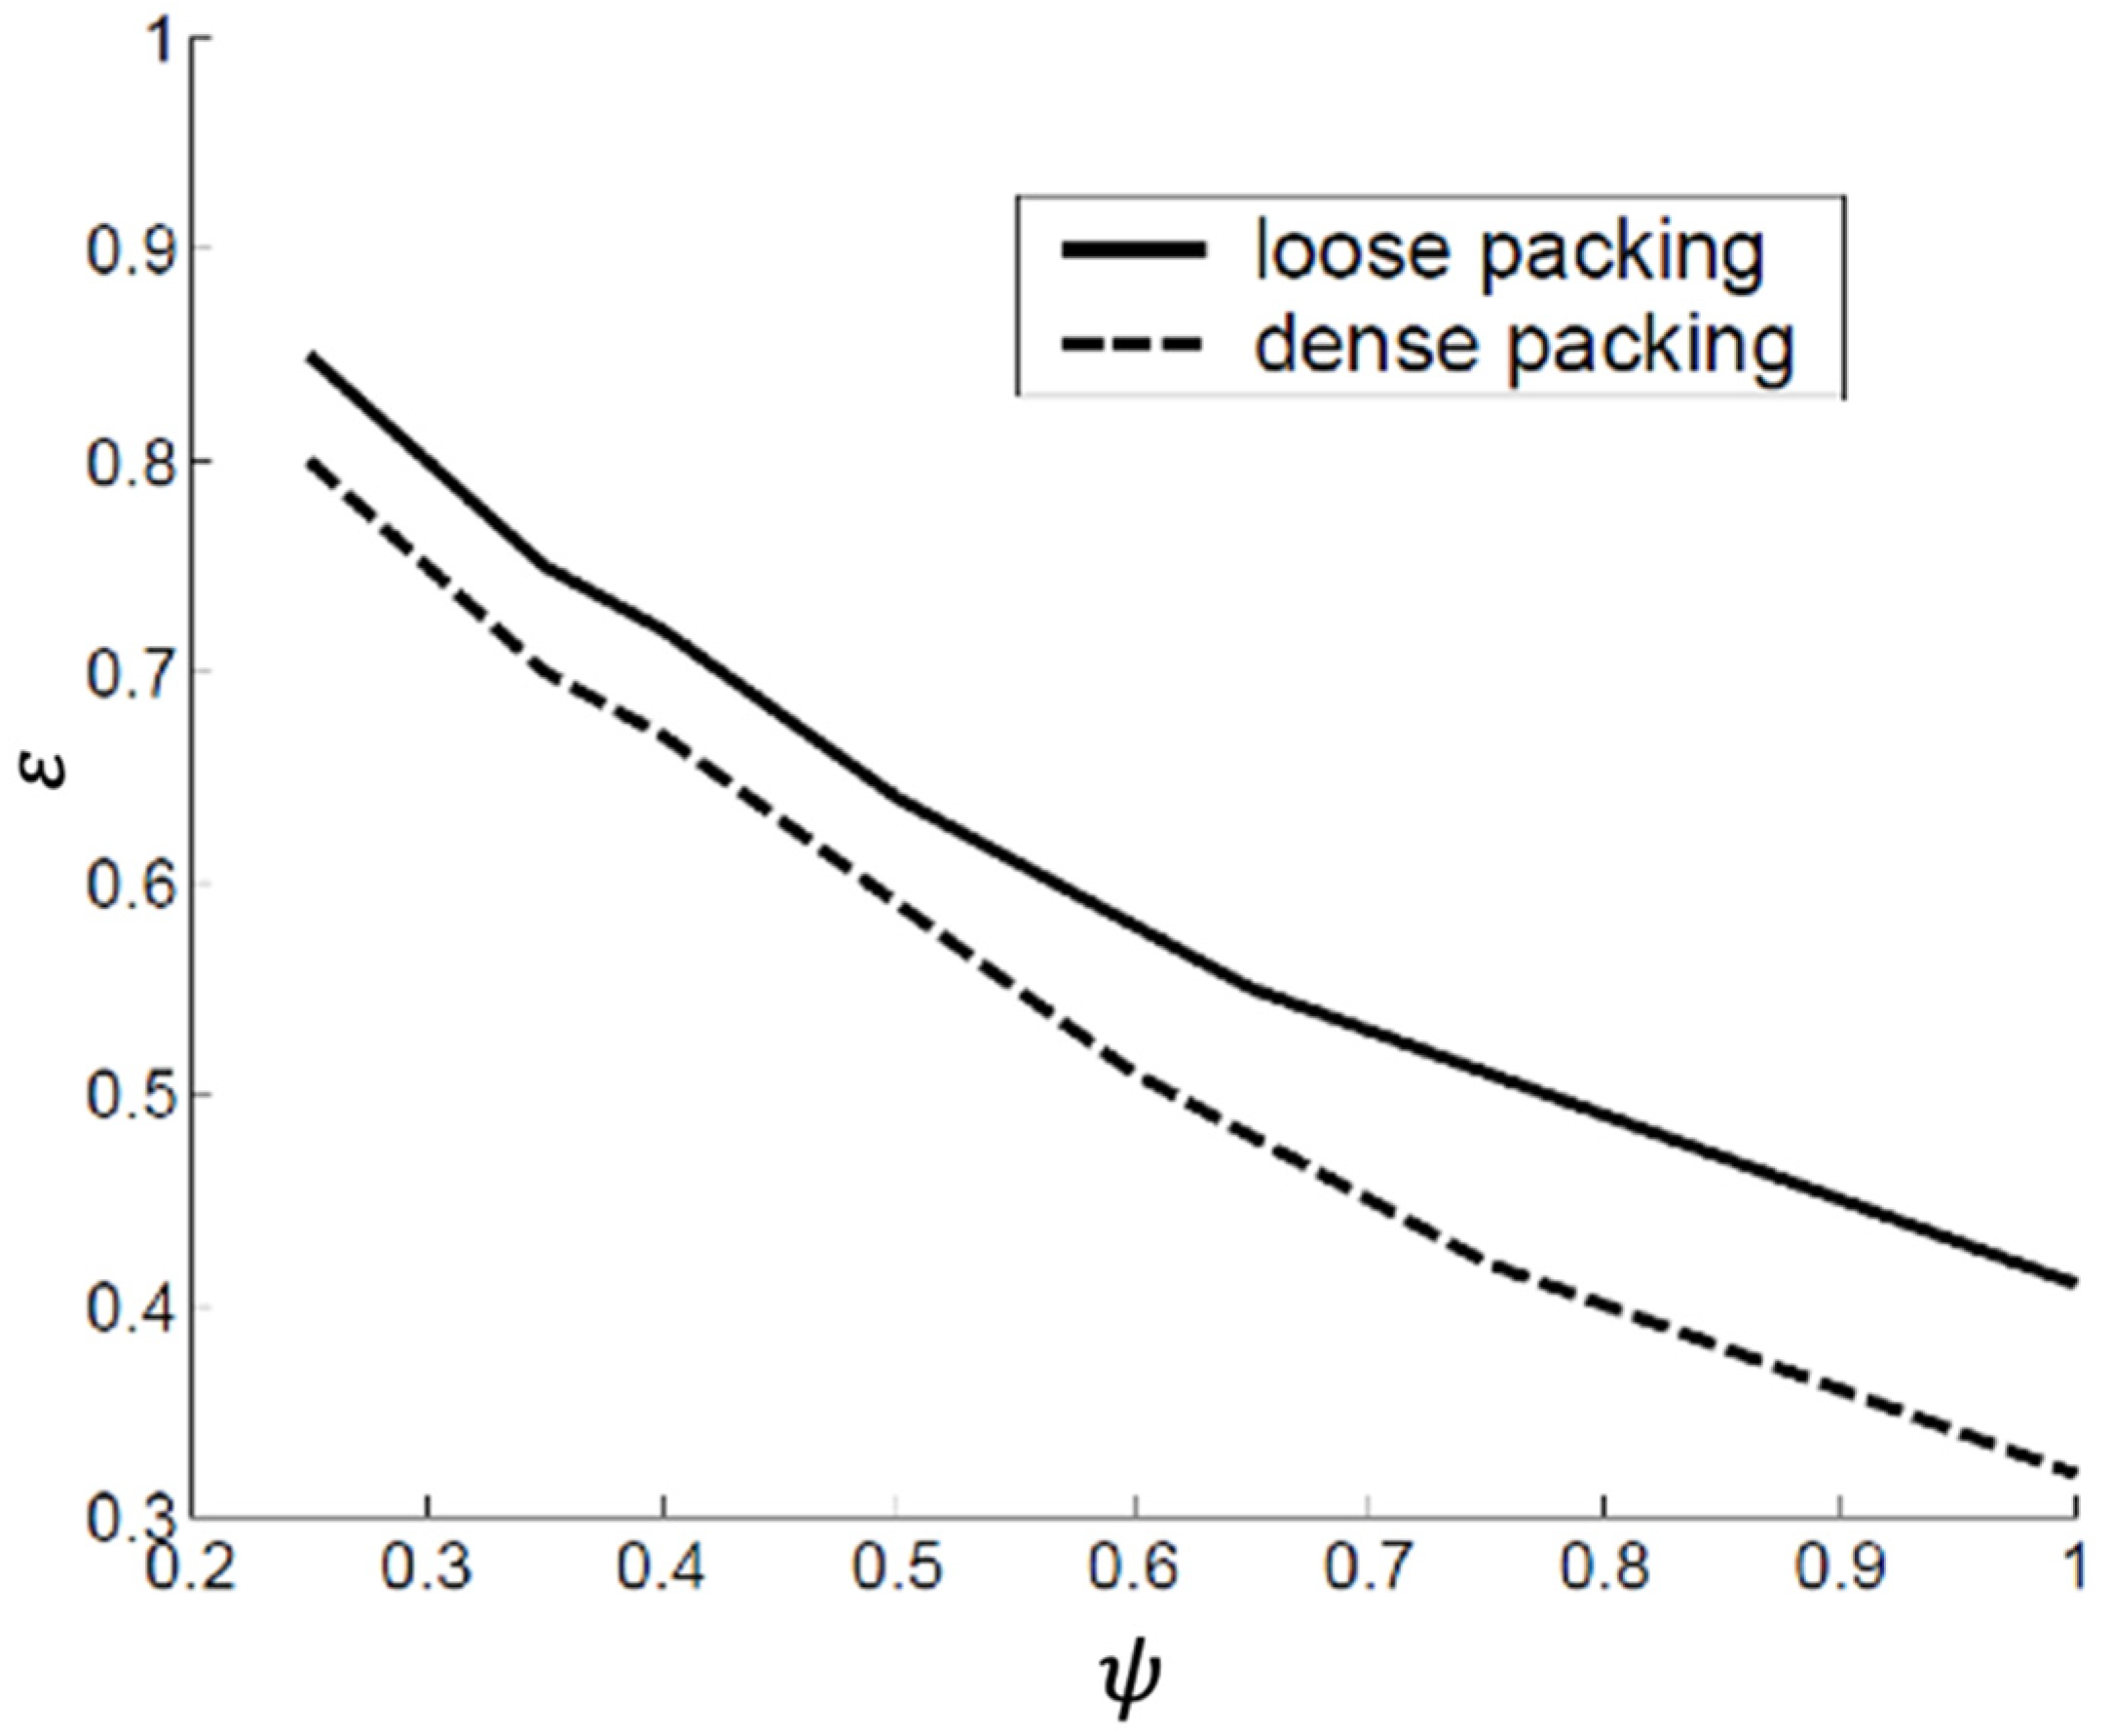
- The compaction state: Obviously, a tapped bed will have a smaller voidage than an aerated bed. Two extreme conditions, assuming random packing, are used as a reference: ‘loose’ packing with the maximum voidage and ‘dense’ packing with minimum voidage.
- The particle shape: The voidage increases with decreasing sphericity. This is illustrated in Figure 11.
- The particle size: For loosely packed beds, the voidage decreases with increasing particle size. The densely packed bed voidage, on the other hand, is quite insensitive to size. This is illustrated in Figure 12.
- The particle size distribution: The voidage decreases with increasing spread.
- The particle and wall roughness: The voidage increases with increasing surface roughness.
5. Conclusions
Author Contributions
Funding
Institutional Review Board Statement
Informed Consent Statement
Data Availability Statement
Conflicts of Interest
References
- Deng, Y.; Sabatier, F.; Dewil, R.; Flamant, G.; Le Gal, A.; Gueguen, R.; Baeyens, J.; Li, S.; Ansart, R. Dense upflow fluidized bed (DUFB) solar receivers of high aspect ratio: Different fluidization modes through inserting bubble rupture promoters. Chem. Eng. J. 2021, 418, 129376. [Google Scholar] [CrossRef]
- Deng, Y.; Dewil, R.; Appels, L.; Li, S.; Baeyens, J.; Degrève, J.; Wang, G. Thermo-chemical water splitting: Selection of priority reversible redox reactions by multi-attribute decision making. Renew. Energy 2021, 170, 800–810. [Google Scholar] [CrossRef]
- Li, S.; Baeyens, J.; Dewil, R.; Appels, L.; Zhang, H.; Deng, Y. Advances in rigid porous high temperature filters. Renew. Sustain. Energy Rev. 2021, 139, 110713. [Google Scholar] [CrossRef]
- Liu, J.; Baeyens, J.; Deng, Y.; Tan, T.; Zhang, H. The chemical CO2 capture by carbonation-decarbonation cycles. J. Environ. Manag. 2020, 260, 110054. [Google Scholar] [CrossRef] [PubMed]
- Deng, Y.; Ansart, R.; Baeyens, J.; Zhang, H. Flue Gas Desulphurization in Circulating Fluidized Beds. Energies 2019, 12, 3908. [Google Scholar] [CrossRef] [Green Version]
- Zhang, H.; Degrève, J.; Baeyens, J.; Dewil, R. The Voidage in a CFB Riser as Function of Solids Flux and Gas Velocity. Procedia Eng. 2015, 102, 1112–1122. [Google Scholar] [CrossRef] [Green Version]
- Zhang, H.L.; Baeyens, J.; Degrève, J.; Brems, A.; Dewil, R. The convection heat transfer coefficient in a Circulating Fluidized Bed (CFB). Adv. Powder Technol. 2014, 25, 710–715. [Google Scholar] [CrossRef]
- ISO 13317-4:2014(en). Determination of Particle Size Distribution by Gravitational Liquid Sedimentation Methods. Available online: https://www.iso.org/obp/ui/#!iso:std:46263:en (accessed on 30 July 2021).
- ISO 13320:2020. Particle Size Analysis—Laser Diffraction Methods. 2020. Available online: https://www.iso.org/standard/69111.html (accessed on 30 July 2021).
- ISO 19.120. Particle Size Analysis.Sieving-Including Test Sieves and Porosimetry. 2020. Available online: https://www.iso.org/ics/19.120/x/ (accessed on 30 July 2021).
- ISO 9276-2:2014. Representation of Results of Particle Size Analysis—Part 2: Calculation of Average Particle Sizes/Diameters and Moments from Particle Size Distributions, Reviewed and Confirmed in 2019. Available online: https://www.iso.org/standard/57641.html (accessed on 30 July 2021).
- ISO 9276-6:2008 Representation of Results of Particle Size Analysis—Part 6: Descriptive and Quantitative Representation of Particle Shape and Morphology, Reviewed and Confirmed in 2017. Available online: https://www.iso.org/standard/39389.html (accessed on 30 July 2021).
- Sundahl, M.; Berg, E.; Svensson, M. Aerodynamic particle size distribution and dynamic properties in aerosols from electronic cigarettes. J. Aerosol Sci. 2017, 103, 141–150. [Google Scholar] [CrossRef]
- Miyamoto, K.; Taga, H.; Akita, T.; Yamashita, C. Simple Method to Measure the Aerodynamic Size Distribution of Porous Particles Generated on Lyophilizate for Dry Powder Inhalation. Pharmaceutics 2020, 12, 976. [Google Scholar] [CrossRef] [PubMed]
- Sjoholm, P.; Ingham, D.B.; Lehtimaki, M.; Perttu-Roiha, L.; Goodfellow, H.; Torvela, H. Gas-Cleaning Technology. In Industrial Ventilation Design Guidebook; Elsevier: Amsterdam, The Netherlands, 2001; pp. 1197–1316. [Google Scholar]
- Centre for Atmospheric Science Differential Mobility Particle Sizer (DMPS). Available online: http://www.cas.manchester.ac.uk/restools/instruments/aerosol/differential/ (accessed on 30 July 2021).
- Svarovsky, L. Solid-Liquid Separation, 3rd ed.; Butterworths: London, UK, 1990. [Google Scholar]
- Svarovsky, L. A contribution to the use of the log-probability paper for particle size measurement. Powder Technol. 1973, 7, 351–352. [Google Scholar] [CrossRef]
- Dukhin, A.S.; Goetz, P.J.; Fang, X.; Somasundaran, P. Monitoring nanoparticles in the presence of larger particles in liquids using acoustics and electron microscopy. J. Colloid Interface Sci. 2010, 342, 18–25. [Google Scholar] [CrossRef]
- Naito, M.; Hayakawa, O.; Nakahira, K.; Mori, H.; Tsubaki, J. Effect of particle shape on the particle size distribution measured with commercial equipment. Powder Technol. 1998, 100, 52–60. [Google Scholar] [CrossRef]
- Tinke, A.P.; Govoreanu, R.; Vanhoutte, K.; Brewster, M. Particulate system characterization: Evaluation of particle size distribution data. Am. Pharm. Rev. 2007, 10, 68. [Google Scholar]
- Strokotov, D.I.; Moskalensky, A.E.; Nekrasov, V.M.; Maltsev, V.P. Polarized light-scattering profile-advanced characterization of nonspherical particles with scanning flow cytometry. Cytom. Part A 2011, 79A, 570–579. [Google Scholar] [CrossRef] [PubMed]
- Saveyn, H.; Thu, T.L.; Govoreanu, R.; Meeren, P.; Vanrolleghem, P.A. In-line Comparison of Particle Sizing by Static Light Scattering, Time-of-Transition, and Dynamic Image Analysis. Part. Part. Syst. Charact. 2006, 23, 145–153. [Google Scholar] [CrossRef]
- Abbireddy, C.O.R.; Clayton, C.R.I. A review of modern particle sizing methods. Proc. Inst. Civ. Eng. Geotech. Eng. 2009, 162, 193–201. [Google Scholar] [CrossRef]
- Zhang, H.; Baeyens, J.; Kang, Q. Measuring Suspended Particle Size with High Accuracy. Int. J. Petrochem. Sci. Eng. 2017, 2. [Google Scholar] [CrossRef] [Green Version]
- Lide, D.R. (Ed.) CRC Handbook of Chemistry and Physics, 85th ed.; Chemical Rubber Company Press: Baco Raton, FL, USA, 2004. [Google Scholar]
- Chappell, A. Dispersing sandy soil for the measurement of particle size distributions using optical laser diffraction. CATENA 1998, 31, 271–281. [Google Scholar] [CrossRef]
- Beuselinck, L.; Govers, G.; Poesen, J.; Degraer, G.; Froyen, L. Grain-size analysis by laser diffractometry: Comparison with the sieve-pipette method. CATENA 1998, 32, 193–208. [Google Scholar] [CrossRef]
- Vdović, N.; Obhođaš, J.; Pikelj, K. Revisiting the particle-size distribution of soils: Comparison of different methods and sample pre-treatments. Eur. J. Soil Sci. 2010, 61, 854–864. [Google Scholar] [CrossRef]
- Storti, F.; Balsamo, F. Particle size distributions by laser diffraction: Sensitivity of granular matter strength to analytical operating procedures. Solid Earth 2010, 1, 25–48. [Google Scholar] [CrossRef] [Green Version]
- Schulte, P.; Lehmkuhl, F. The difference of two laser diffraction patterns as an indicator for post-depositional grain size reduction in loess-paleosol sequences. Palaeogeogr. Palaeoclimatol. Palaeoecol. 2018, 509, 126–136. [Google Scholar] [CrossRef]
- Yang, Y.; Wang, L.; Wendroth, O.; Liu, B.; Cheng, C.; Huang, T.; Shi, Y. Is the Laser Diffraction Method Reliable for Soil Particle Size Distribution Analysis? Soil Sci. Soc. Am. J. 2019, 83, 276–287. [Google Scholar] [CrossRef]
- Sousan, S.; Regmi, S.; Park, Y.M. Laboratory Evaluation of Low-Cost Optical Particle Counters for Environmental and Occupational Exposures. Sensors 2021, 21, 4146. [Google Scholar] [CrossRef]
- Kubínová, R.; Neumann, M.; Kavka, P. Aggregate and Particle Size Distribution of the Soil Sediment Eroded on Steep Artificial Slopes. Appl. Sci. 2021, 11, 4427. [Google Scholar] [CrossRef]
- Galacgac, J.A.; Ooi, P.S.K. Use of a Laser Diffractometer to Obtain the Particle Size Distribution of Fine-Grained Soils. Transp. Res. Rec. J. Transp. Res. Board 2018, 2672, 1–11. [Google Scholar] [CrossRef]
- Perry Perry’s chemical engineers’ handbook. Choice Rev. Online 1998, 35. [CrossRef] [Green Version]
- Mc Cabe, W.L.; Smith, J.C.; Harriott, P. Unit Operation of Chemical Engineering, 5th ed.; McGraw-Hill: New York, NY, USA, 1993. [Google Scholar]
- Jurtz, N.; Wehinger, G.D.; Srivastava, U.; Henkel, T.; Kraume, M. Validation of pressure drop prediction and bed generation of fixed-beds with complex particle shapes using discrete element method and computational fluid dynamics. AIChE J. 2020, 66, e16967. [Google Scholar] [CrossRef]
- Koekemoer, A.; Luckos, A. Effect of material type and particle size distribution on pressure drop in packed beds of large particles: Extending the Ergun equation. Fuel 2015, 158, 232–238. [Google Scholar] [CrossRef]
- Geldart, D. Gas Fluidization Technology; John Willy & Sons: Chichester, UK, 1986. [Google Scholar]
- Santomaso, A.C.; Lazzaro, P.; Canu, P. Powder flowability and density ratios: The impact of granule packing. Chem. Eng. Sci. 2003, 58, 2857–2874. [Google Scholar] [CrossRef]
- Li, L.; Iskander, M. Comparison of 2D and 3D dynamic image analysis for characterization of natural sands. Eng. Geo. 2021, 290, 106052. [Google Scholar] [CrossRef]
- Grace, J.R.; Ebeyamini, A. Connecting particle sphericity and circularity. Particuology 2021, 54, 1–4. [Google Scholar] [CrossRef]
- Montillon, G.H. Unit Operations. By G. G. Brown, A. S. Foust, D. L. Katz, R. Schneidewind, R. R. White, W. P. Wood, J. T. Banchero, G. M. Brown, L. E. Brownell, J. J. Martin, G. B. Williams, and J. L. York. J. Phys. Chem. 1951, 55, 614–616. [Google Scholar] [CrossRef]


| Symbol | Diameter Definition | Equivalent Sphere Diameters |
|---|---|---|
| dA | Sieve | Largest sphere diameter that can pass through the square aperture of the sieve. |
| dv | Volume | Sphere diameter when particle and sphere volumes are equal. |
| ds | Surface | Sphere diameter when particle and sphere surfaces are equal. |
| dSV | Surface to Volume | Sphere diameter when the surface area to volume ratio of the sphere and the particle are equal. |
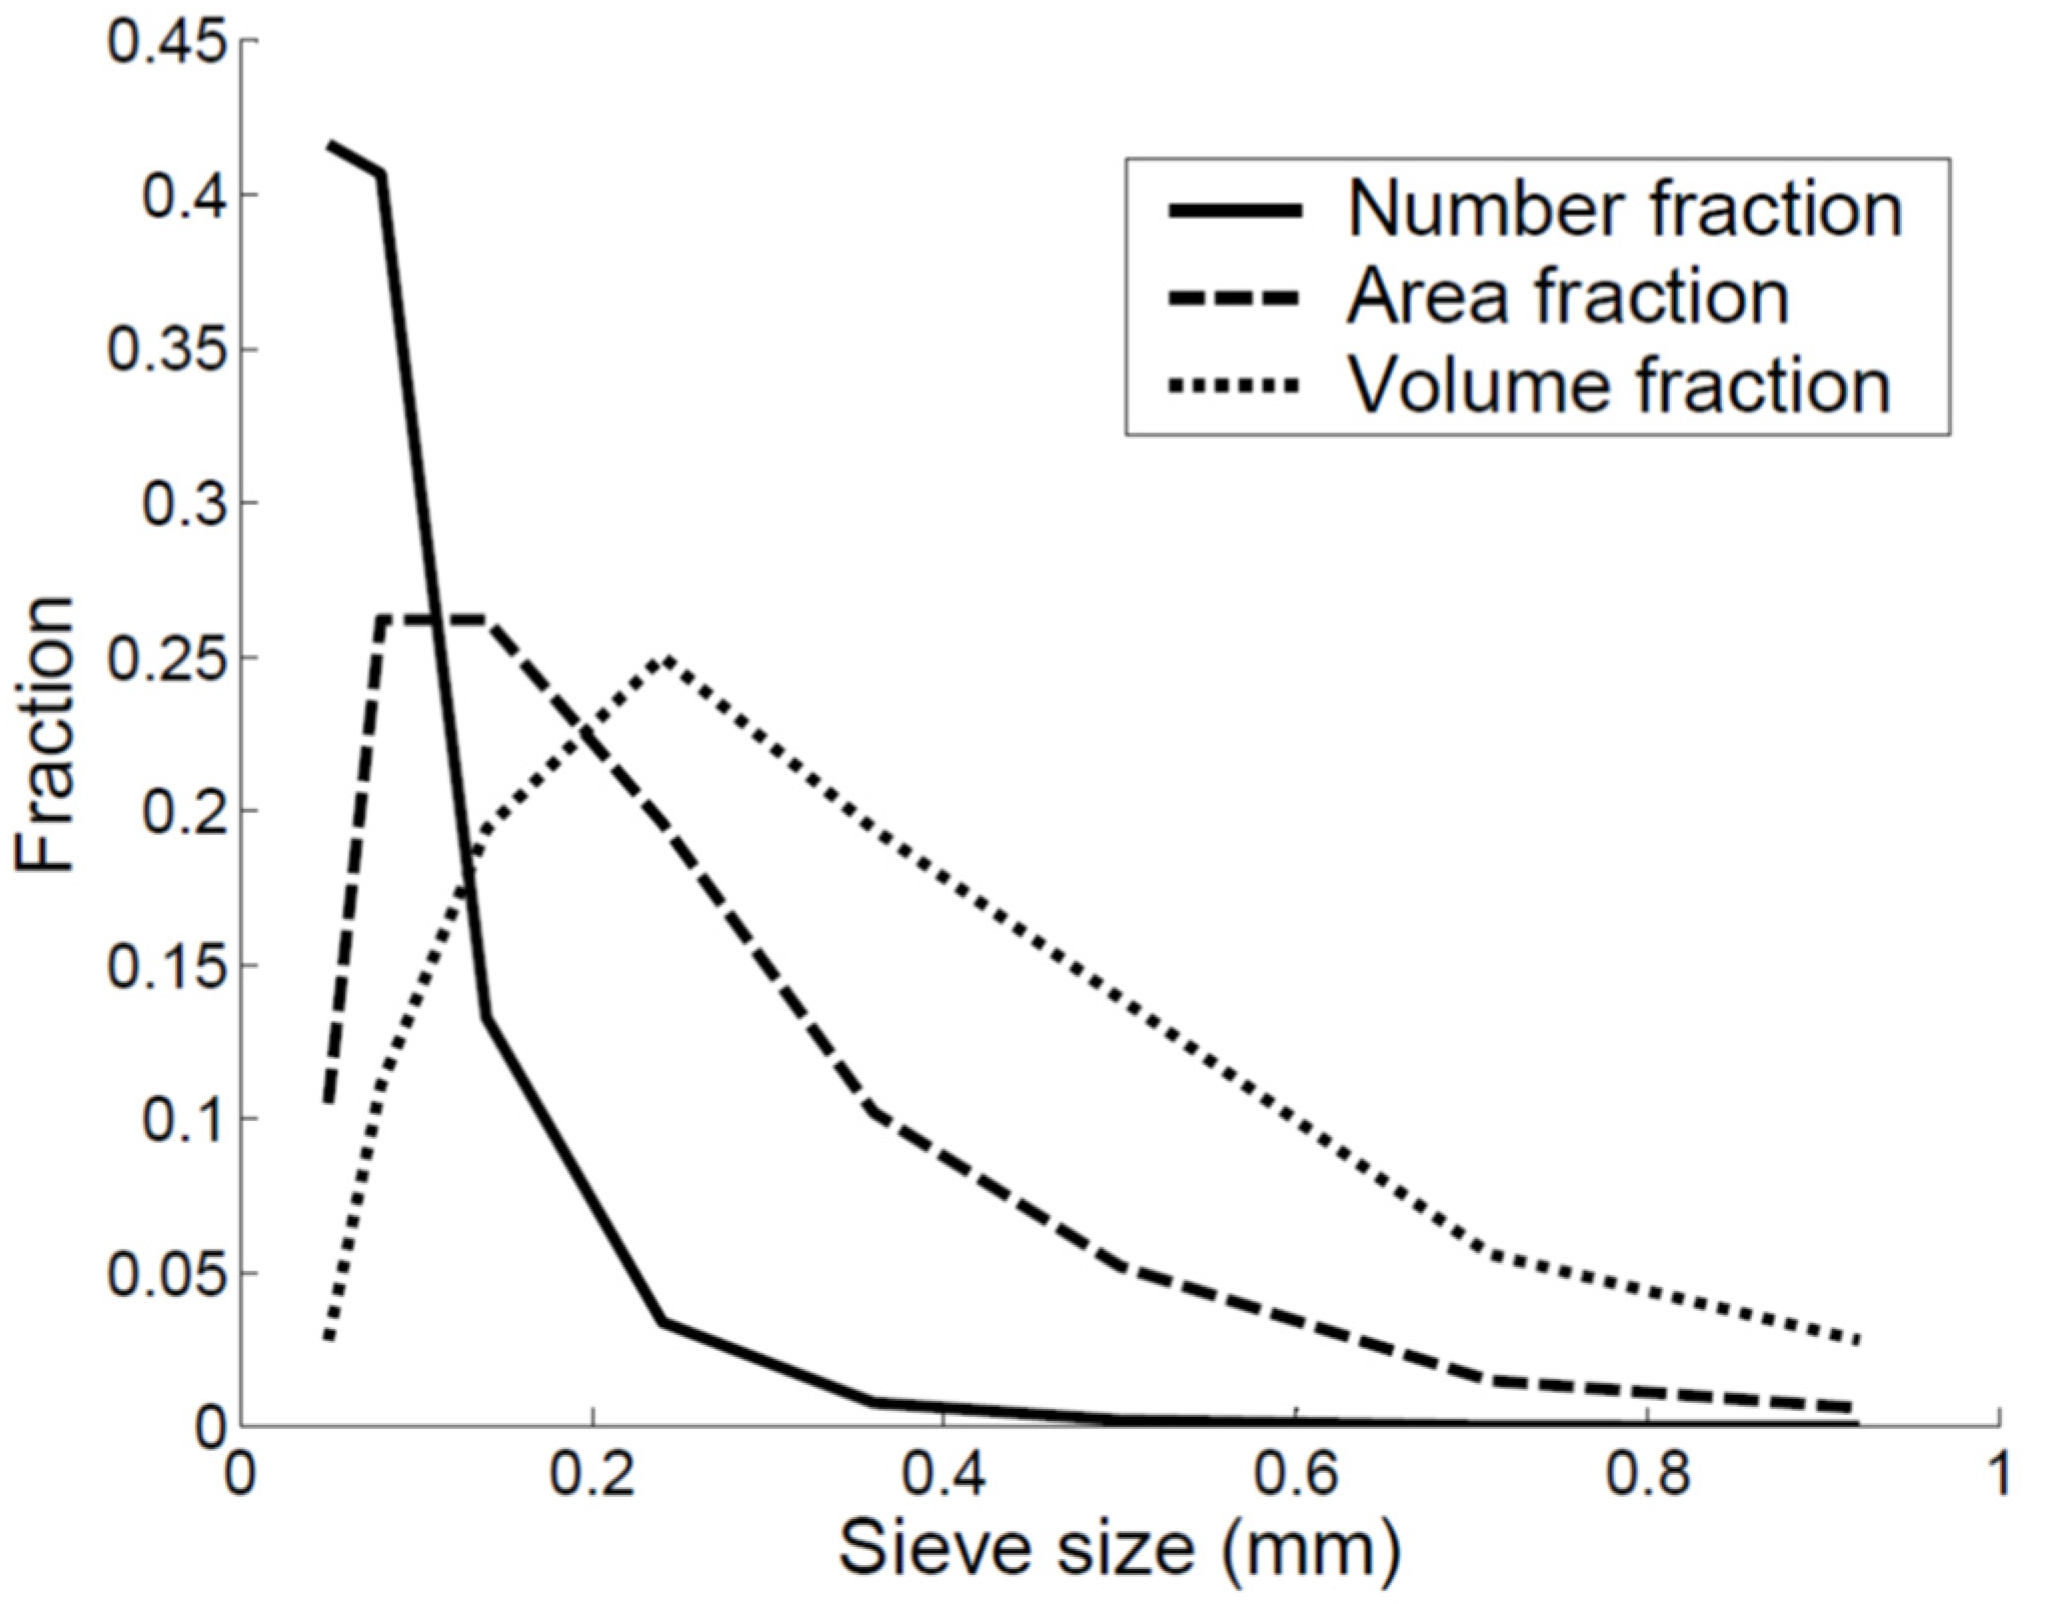
| Sieve Size (mm) | Average Size (mm) | Sieve Mass (g) | Mass Fraction |
|---|---|---|---|
| 0.04–0.06 | 0.05 | 0.1 | 0.03 |
| 0.06–0.10 | 0.08 | 0.4 | 0.11 |
| 0.010–0.18 | 0.14 | 0.7 | 0.19 |
| 0.18–0.30 | 0.24 | 0.9 | 0.25 |
| 0.30–0.42 | 0.36 | 0.7 | 0.19 |
| 0.42–0.59 | 0.5 | 0.5 | 0.14 |
| 0.59–0.83 | 0.71 | 0.2 | 0.06 |
| 0.83–1.00 | 0.92 | 0.1 | 0.03 |
| Total | 3.6 | 1 |
| Mean | g(d) | Formula |
|---|---|---|
| Arithmetic | d | |
| Quadratic | d2 | |
| Cubic | d3 | |
| Geometric | Log(d) | |
| Harmonic | d−1 |
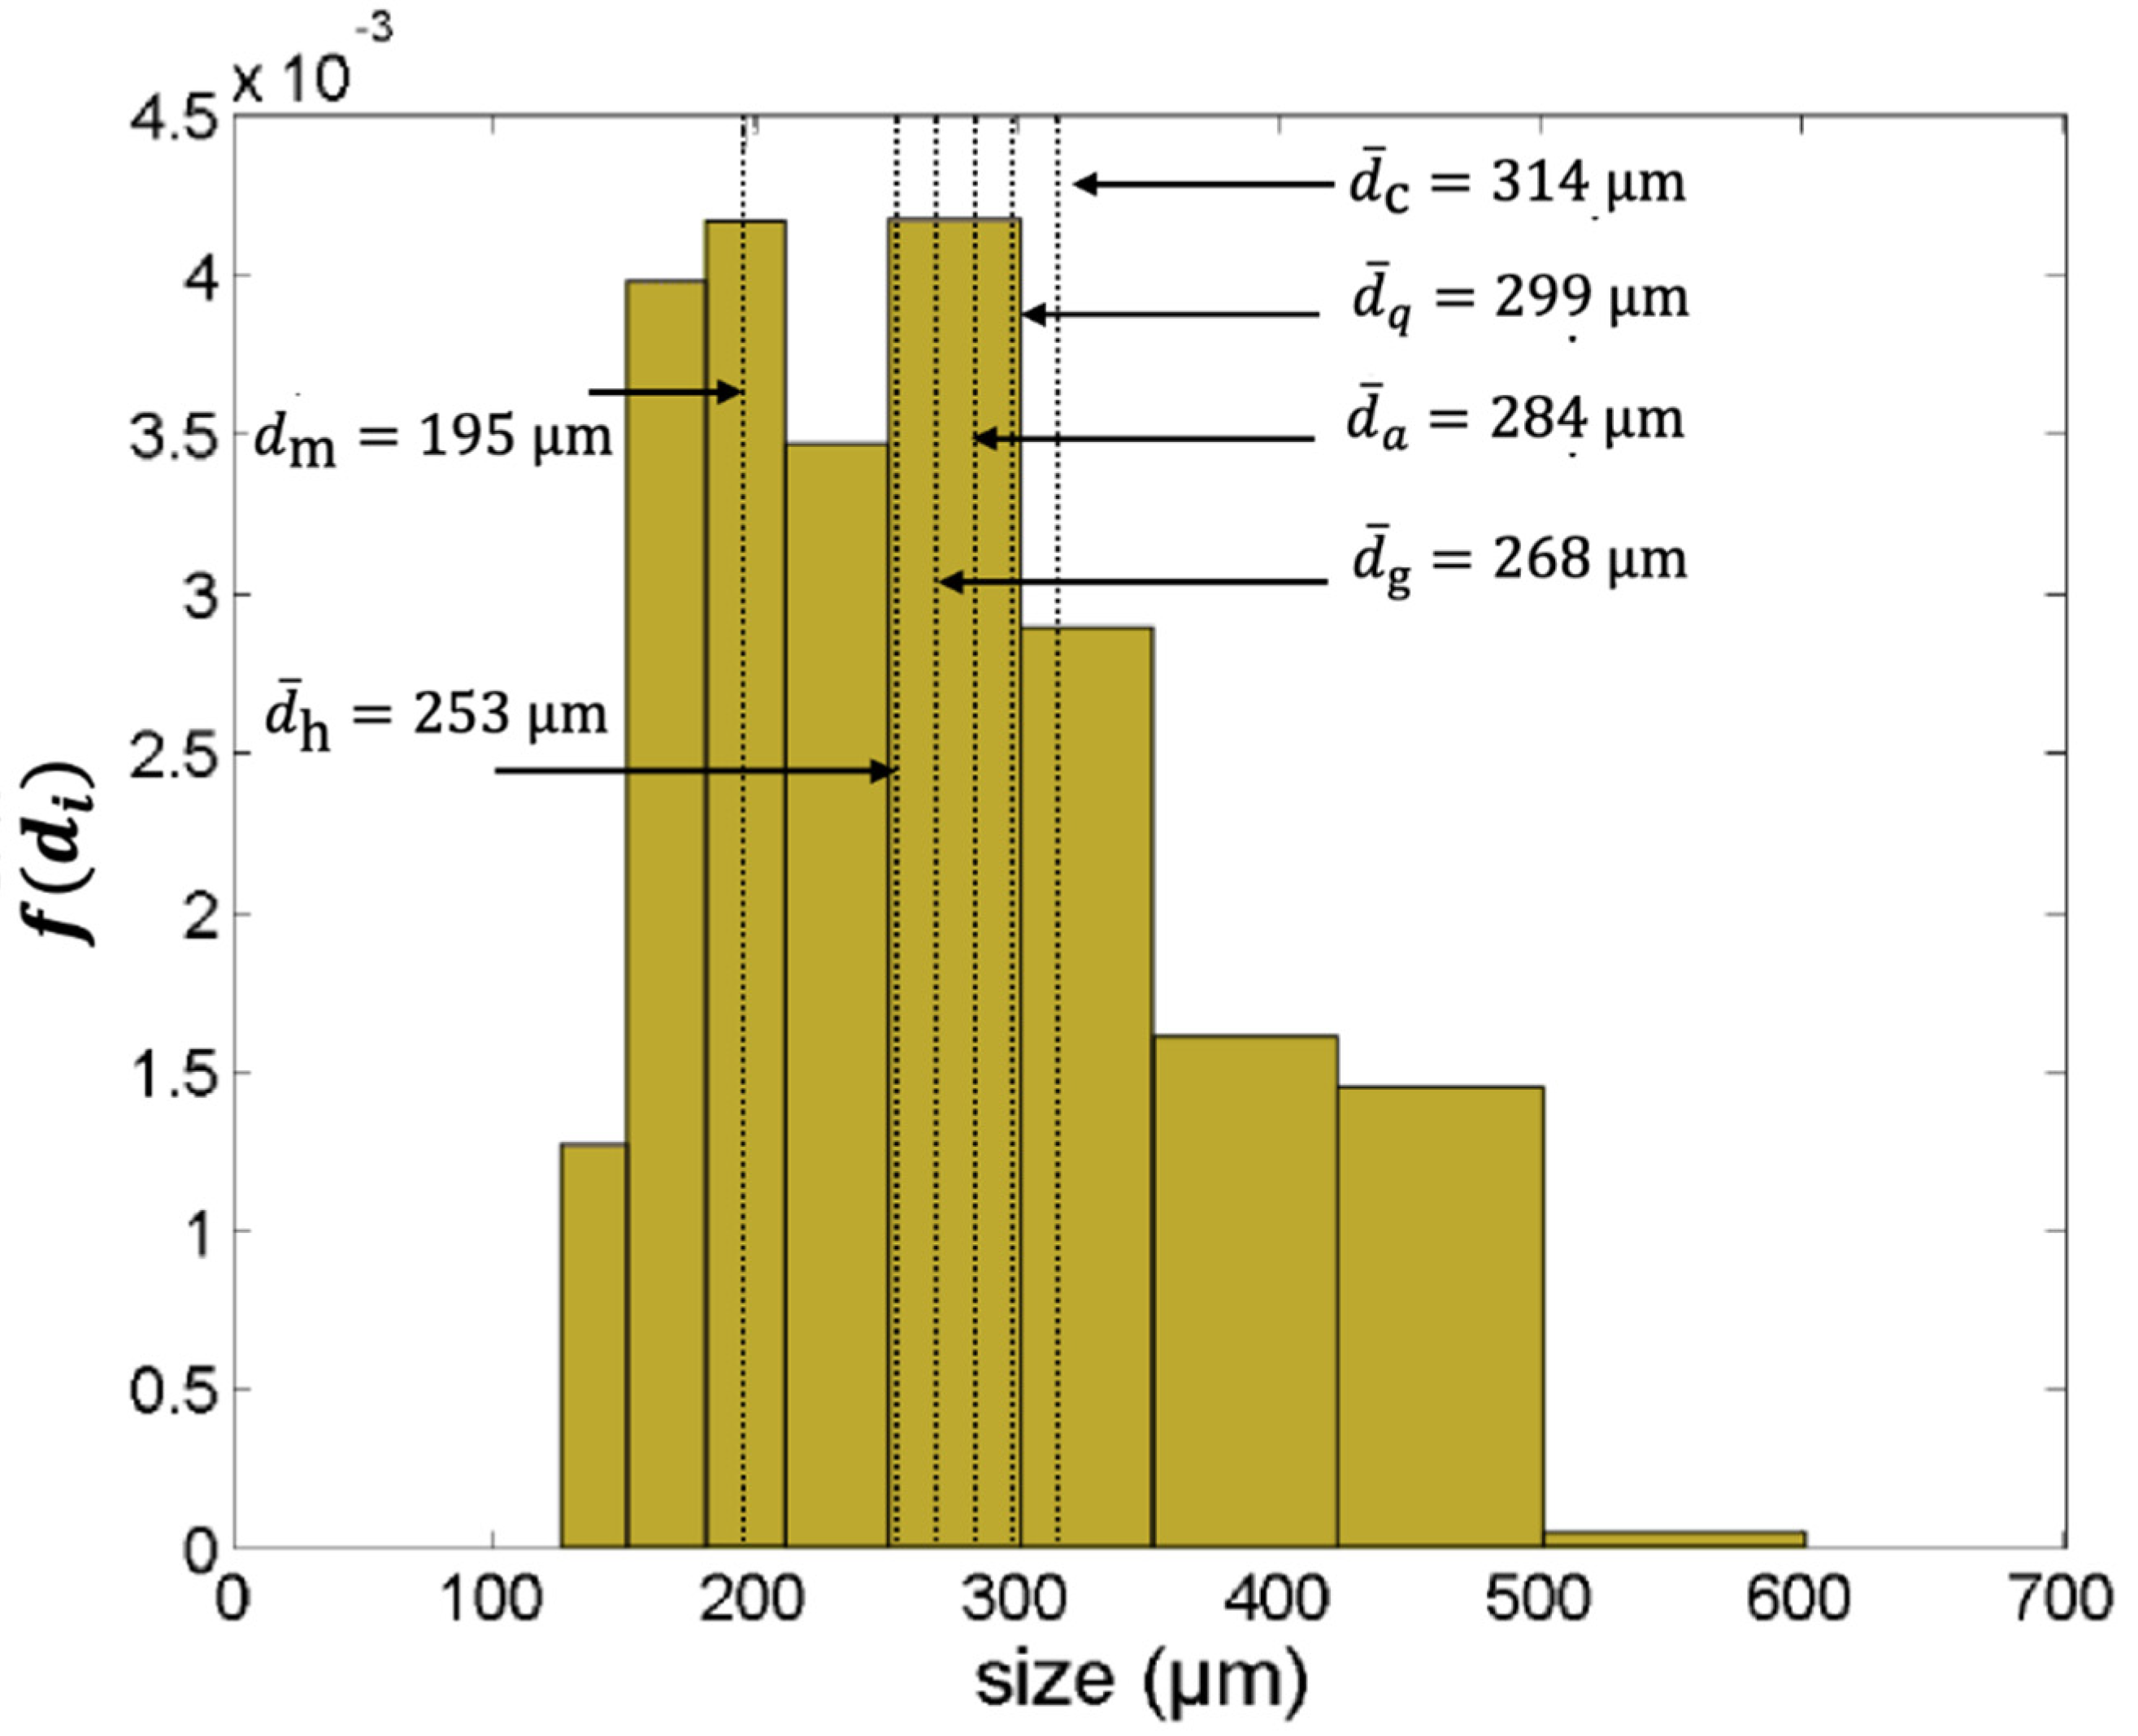
| Sieve Aperture (µm) | Size dA (µm) | Weight% in Range ∆di |
|---|---|---|
| 600–500 | 550 | 0.5 |
| 500–420 | 460 | 11.6 |
| 420–350 | 385 | 11.25 |
| 350–300 | 325 | 14.45 |
| 300–250 | 275 | 20.8 |
| 250–210 | 230 | 13.85 |
| 210–180 | 195 | 12.5 |
| 180–150 | 165 | 11.9 |
| 150–125 | 137 | 3.15 |
| Method | Approx. Size (µm) | Size Type | Basis of the Size Distribution |
|---|---|---|---|
| Sieving (wet/dry) | 25–4000 5–120 | dA | Mass |
| Woven mesh | |||
| Electro-formed mesh | |||
| Microscopy | 0.8–150 0.001–5 | dz, dF, dM dSH,dCH | Number |
| Optical | |||
| Electron | |||
| Gravity sedimentation | 2–100 | dSt, df | Mass |
| Centrifugal sedimentation | 0.01–10 | dSt, df | Mass |
| Elutriation (dry) | 5–100 | dSt, df | Mass |
| Centrifugal elutriation (dry) | 2–50 | Mass | |
| Impactors (dry) | 0.3–50 | Mass or number | |
| Coulter Counter (electrical resistance) | 0.8–200 | dv | Number |
| Fraunhofer diffraction (laser) | 1–2000 | Specific diameter | Volume |
| Mie light scattering (laser) | 0.1–40 | Specific diameter | Volume |
| Photon correlation spectroscopy | 0.003–3 | Specific diameter | Number |
| Doppler phase shift (laser) | 1–104 | Specific diameter | Mean only |
| Parameters | |
|---|---|
| Powder sample | Particle density, particle refractive index and weight of the sample |
| Solvent | Type, density, refractive index and viscosity |
| Dispersant | Organic/anorganic, concentration |
| Dispersion | Ultrasonication bath or tip (position, size, material), suspension volume, power, frequency and ultrasonication duration |
| SiC | Al2O3 | |
|---|---|---|
| refractive index (−) | 2.65 | 1.76 |
| dispersant and concentration (wt%) | tri-sodium phosphate 0.025 | sodium hexametaphosphate 0.05 |
| ζ-potential (mV) | −64 | −97.5 |
| Al2O3 | X-ray Sedimentation | Photo-Sedimentation | Light Obscuration | Electrical Sensing Zone | Laser Diffraction |
|---|---|---|---|---|---|
| d10 (µm) | (0.95) | (0.95) | 1.16 | 1.16 | 0.71 |
| CV (%) | 2.80 | 14.20 | 5.80 | 8.30 | 35.9 |
| d50 (µm) | 1.81 | 1.69 | 2.88 | 2.16 | 2.10 |
| CV (%) | 3.00 | 12.60 | 7.20 | 4.80 | 12.70 |
| d90 (µm) | 3.68 | 4.13 | 4.89 | 4.07 | 4.69 |
| CV (%) | 5.20 | 41.80 | 3.20 | 4.60 | 9.60 |
| SiC | X-ray Sedimentation | Photo-Sedimentation | Light Obscuration | Electrical Sensing Zone | Laser Diffraction |
| d10 (µm) | (0.11) | (0.16) | 0.63 | (0.20) | (0.24) |
| CV (%) | (15.20) | (27.20) | 3.50 | (21.30) | 34.50 |
| d50 (µm) | 0.47 | 0.47 | 1.02 | 0.68 | 0.64 |
| CV (%) | 21.70 | 39.40 | 6.90 | 10.40 | 18.00 |
| d90 (µm) | 1.92 | 1.60 | 3.12 | 2.71 | 1.96 |
| CV (%) | 10.80 | 34.70 | 17.70 | 14.50 | 31.20 |
| Shape | Relative Proportions | ψ |
|---|---|---|
| Spheroid | 1 : 1 : 2 | 0.93 |
| 1 : 2 : 2 | 0.92 | |
| 1 : 1 : 4 | 0.78 | |
| 1 : 4 : 4 | 0.70 | |
| 1 : 2 : 4 | 0.79 | |
| Cylinder | Height = 0.5 × diameter | 0.83 |
| Height = 0.25 × diameter | 0.69 | |
| Cube | - | 0.81 |
| Material | ψ |
|---|---|
| Crushed coal | 0.75 |
| Crushed sandstone | 0.8–0.9 |
| Sand (average) | 0.75 |
| Round sand | 0.83 |
| Flint sand, jagged | 0.65 |
| Crushed glass | 0.65 |
| Common salt | 0.84 |
| Most crushed materials | 0.6–0.8 |
| Method | Relative Equipment Cost | Suitable Types of Powder in Rank Order According to Geldart’s Classification |
|---|---|---|
| Caking end-point | Negligible | A |
| Mercury porosimeters | Very high | D, B, A |
| Comparative | Low | B, A |
| Gas flow | Low | A, B |
| Powder displacement | Low | D, B |
| Minimum fluidization velocity | Low | D, B, A spherical |
| Photographic | High | B, D, A |
Publisher’s Note: MDPI stays neutral with regard to jurisdictional claims in published maps and institutional affiliations. |
© 2021 by the authors. Licensee MDPI, Basel, Switzerland. This article is an open access article distributed under the terms and conditions of the Creative Commons Attribution (CC BY) license (https://creativecommons.org/licenses/by/4.0/).
Share and Cite
Deng, Y.; Dewil, R.; Appels, L.; Zhang, H.; Li, S.; Baeyens, J. The Need to Accurately Define and Measure the Properties of Particles. Standards 2021, 1, 19-38. https://doi.org/10.3390/standards1010004
Deng Y, Dewil R, Appels L, Zhang H, Li S, Baeyens J. The Need to Accurately Define and Measure the Properties of Particles. Standards. 2021; 1(1):19-38. https://doi.org/10.3390/standards1010004
Chicago/Turabian StyleDeng, Yimin, Raf Dewil, Lise Appels, Huili Zhang, Shuo Li, and Jan Baeyens. 2021. "The Need to Accurately Define and Measure the Properties of Particles" Standards 1, no. 1: 19-38. https://doi.org/10.3390/standards1010004
APA StyleDeng, Y., Dewil, R., Appels, L., Zhang, H., Li, S., & Baeyens, J. (2021). The Need to Accurately Define and Measure the Properties of Particles. Standards, 1(1), 19-38. https://doi.org/10.3390/standards1010004


