
Sarcopenia in Patients with Chronic Thromboembolic Pulmonary Hypertension

 , ,
, ,  ,
,
Abstract
:
1. Introduction
2. Methods
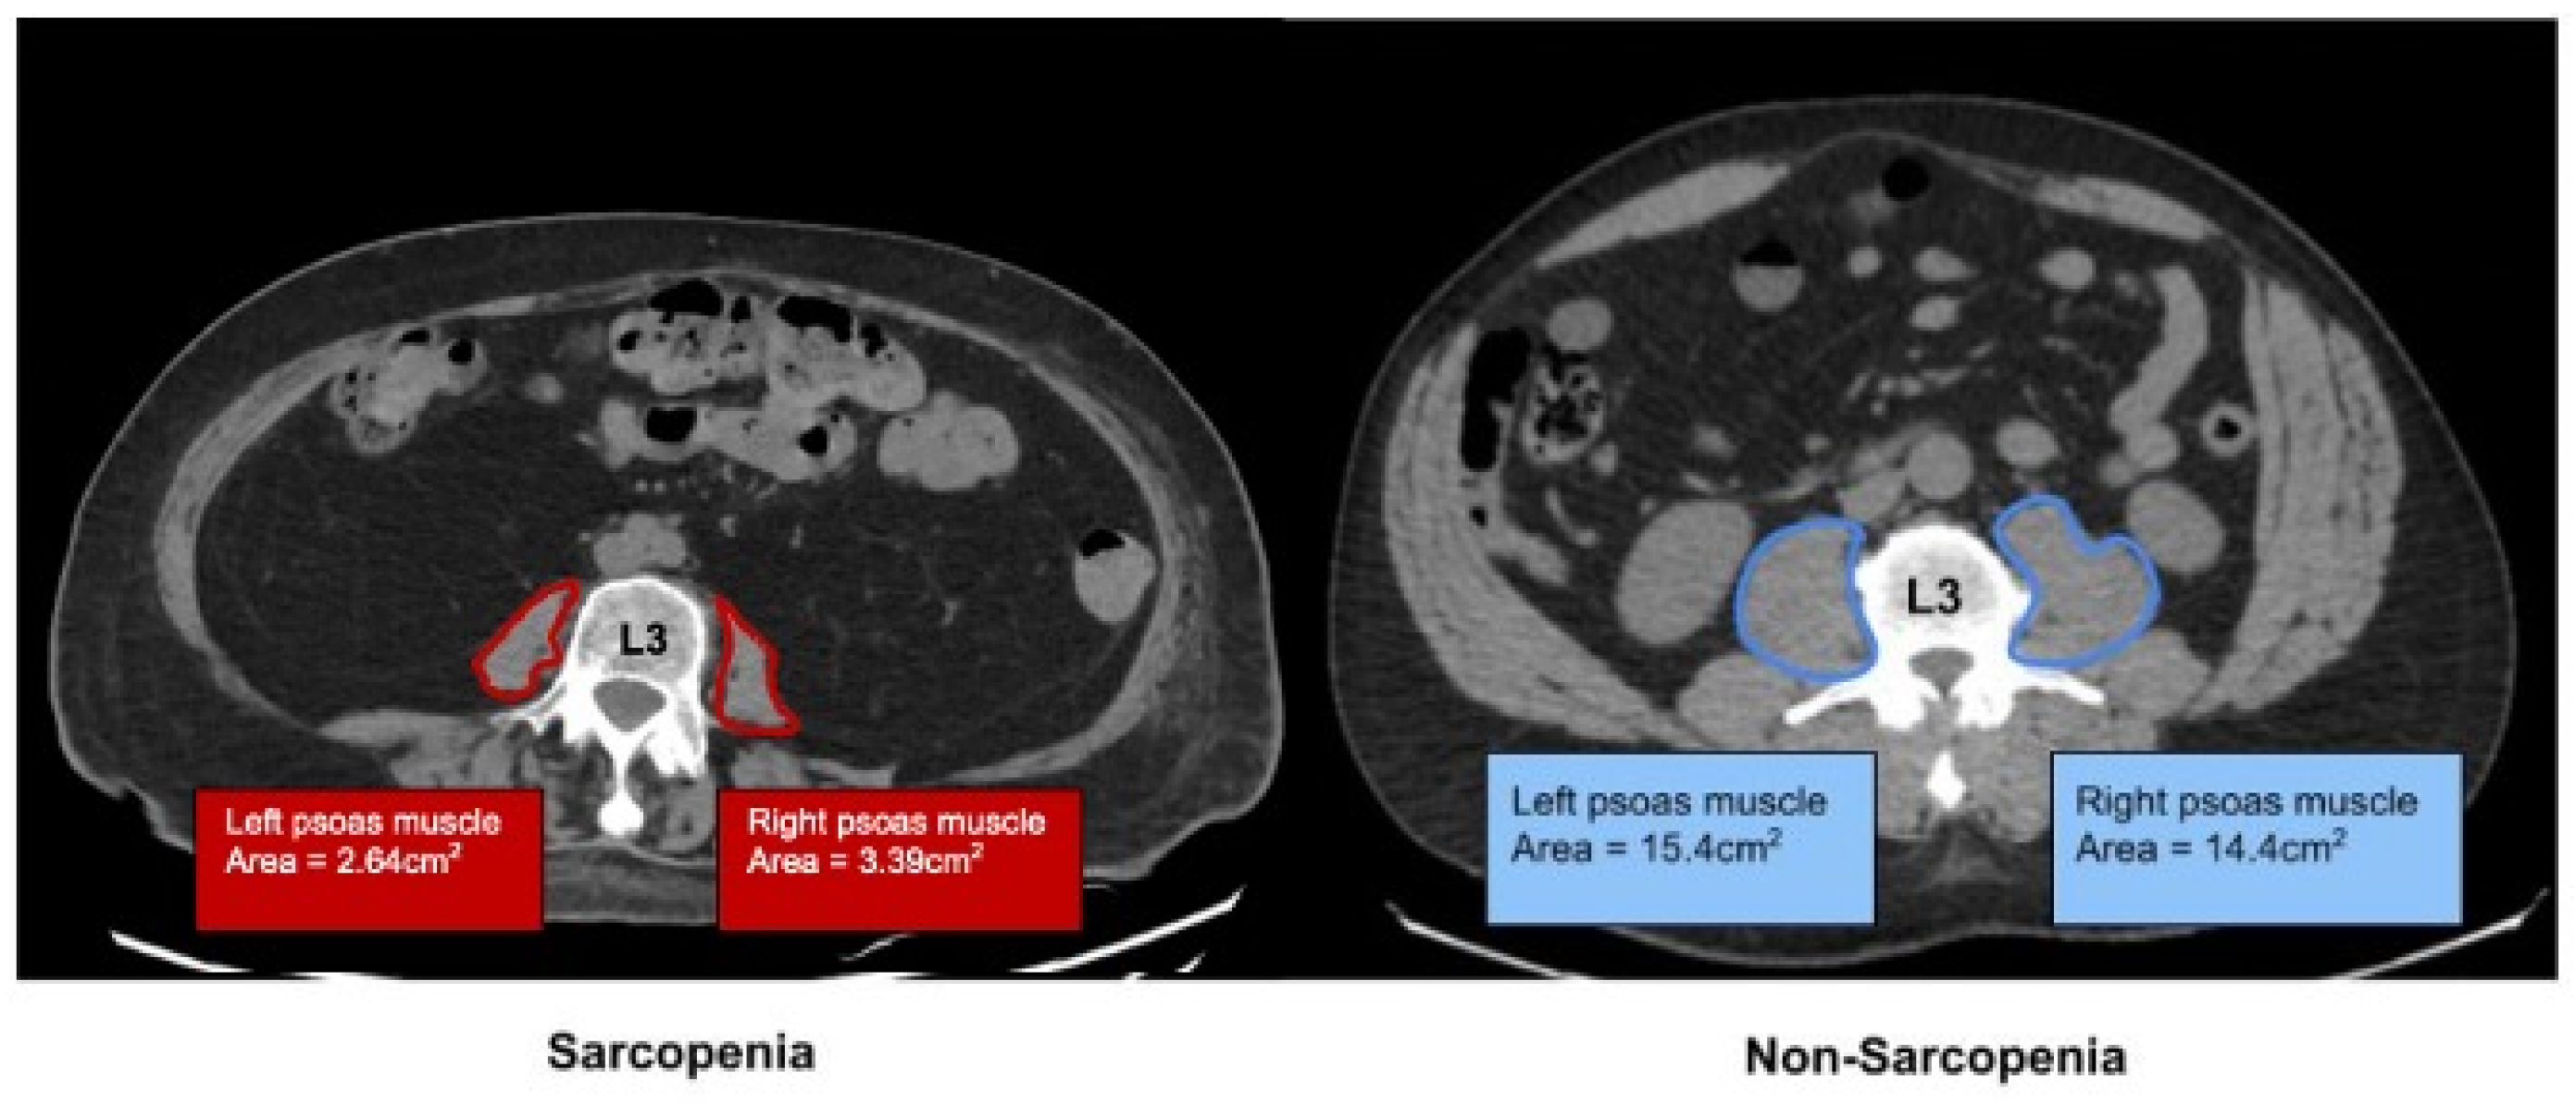
2.1. Determination of Sarcopenia by Imaging
2.2. Statistical Analysis
3. Results
3.1. Cohort Demographics
3.2. Post-Intervention
3.3. Clinical Course, Biomarkers, 6MWD, and Post-PTE Specific Outcomes
4. Discussion
5. Conclusions
Supplementary Materials
Author Contributions
Funding
Institutional Review Board Statement
Informed Consent Statement
Data Availability Statement
Conflicts of Interest
Abbreviations
| Abbreviation | Definition |
| BMI | Body Mass Index |
| BPA | Balloon Pulmonary Angioplasty |
| CI | Confidence Interval |
| CO | Cardiac Output |
| CTAP | Computed Tomography Abdomen/Pelvis |
| CTEPH | Chronic Thromboembolic Pulmonary Hypertension |
| DOAC | Direct Oral Anticoagulant |
| DVT | Deep Vein Thrombosis |
| FC | Functional Class |
| FFP | Fractional Pulse Pressure |
| HGS | Hand Grip Strength |
| ICU | Intensive Care Unit |
| IRB | Institutional Review Board |
| LE DVT | Lower-Extremity Deep Vein Thrombosis |
| LOS | Length of Stay |
| mPA | Mean Pulmonary Artery Pressure |
| MTS | May–Thurner Syndrome |
| NYHA | New York Heart Association |
| OR | Odds Ratio |
| PCWP | Pulmonary Capillary Wedge Pressure |
| PE | Pulmonary Embolism |
| PH | Pulmonary Hypertension |
| PMI | Psoas Muscle Index |
| PTE | Pulmonary Thromboendarterectomy |
| PVR | Pulmonary Vascular Resistance |
| REDCap | Research Electronic Data Capture |
| ROS | Reactive Oxygen Species |
| SP | Sarcopenic Patient |
| TPR | Total Pulmonary Resistance |
| UE DVT | Upper-Extremity Deep Vein Thrombosis |
| WHO | World Health Organization |
References
- Cruz-Jentoft, A.J.; Bahat, G.; Bauer, J.; Boirie, Y.; Bruyere, O.; Cederholm, T.; Cooper, C.; Landi, F.; Rolland, Y.; Sayer, A.A.; et al. Sarcopenia: Revised European consensus on definition and diagnosis. Age Ageing 2019, 48, 601. [Google Scholar] [CrossRef] [PubMed]
- Damluji, A.A.; Alfaraidhy, M.; AlHajri, N.; Rohant, N.N.; Kumar, M.; Al Malouf, C.; Bahrainy, S.; Ji Kwak, M.; Batchelor, W.B.; Forman, D.E.; et al. Sarcopenia and Cardiovascular Diseases. Circulation 2023, 147, 1534–1553. [Google Scholar] [CrossRef] [PubMed]
- Zhang, Y.; Zhang, J.; Ni, W.; Yuan, X.; Zhang, H.; Li, P.; Xu, J.; Zhao, Z. Sarcopenia in heart failure: A systematic review and meta-analysis. ESC Heart Fail. 2021, 8, 1007–1017. [Google Scholar] [CrossRef]
- Nakayama, M.; Konishi, M.; Sugano, T.; Okamura, M.; Gohbara, M.; Iwata, K.; Nakayama, N.; Akiyama, E.; Komura, N.; Nitta, M.; et al. Association between sarcopenia and exercise capacity in patients with pulmonary hypertension without left heart disease. Int. J. Cardiol. 2023, 387, 131115. [Google Scholar] [CrossRef]
- Saito, H.; Matsue, Y.; Kamiya, K.; Kagiyama, N.; Maeda, D.; Endo, Y.; Ueno, H.; Yoshioka, K.; Mizukami, A.; Saito, K.; et al. Sarcopenic obesity is associated with impaired physical function and mortality in older patients with heart failure: Insight from FRAGILE-HF. BMC Geriatr. 2022, 22, 556. [Google Scholar] [CrossRef]
- Kono, Y.; Izawa, H.; Aoyagi, Y.; Ishikawa, A.; Sugiura, T.; Mori, E.; Ueda, S.; Fujiwara, W.; Hayashi, M.; Saitoh, E. The difference in determinant factor of six-minute walking distance between sarcopenic and non-sarcopenic elderly patients with heart failure. J. Cardiol. 2020, 75, 42–46. [Google Scholar] [CrossRef]
- Martinez-Luna, N.; Orea-Tejeda, A.; Gonzalez-Islas, D.; Flores-Cisneros, L.; Keirns-Davis, C.; Sanchez-Santillan, R.; Perez-Garcia, I.; Gastelum-Ayala, Y.; Martinez-Vazquez, V.; Martinez-Reyna, O. Association between body composition, sarcopenia and pulmonary function in chronic obstructive pulmonary disease. BMC Pulm. Med. 2022, 22, 106. [Google Scholar] [CrossRef]
- Tsekoura, M.; Tsepis, E.; Billis, E.; Gliatis, J. Sarcopenia in patients with chronic obstructive pulmonary disease: A study of prevalence and associated factors in Western Greek population. Lung India 2020, 37, 479–484. [Google Scholar] [CrossRef]
- Klepetko, W.; Mayer, E.; Sandoval, J.; Trulock, E.P.; Vachiery, J.-L.; Dartevelle, P.; Pepke-Zaba, J.; Jamieson, S.W.; Lang, I.; Corris, P. Interventional and surgical modalities of treatment for pulmonary arterial hypertension. J. Am. Coll. Cardiol. 2004, 43 (Suppl. S12), 73S–80S. [Google Scholar] [CrossRef]
- Hoeper, M.M.; Mayer, E.; Simonneau, G.; Rubin, L.J. Chronic thromboembolic pulmonary hypertension. Circulation 2006, 113, 2011–2020. [Google Scholar] [CrossRef]
- Scholzel, B.E.; Post, M.C.; Plokker, H.W.T.; Snijder, R.J. Clinical worsening during long-term follow-up in inoperable chronic thromboembolic pulmonary hypertension. Lung 2012, 190, 161–167. [Google Scholar] [CrossRef] [PubMed]
- Schmidt, C.; Monteiro, M.; Furtado, I.; Carvalho, L.; Goncalves, F.; Reis, A.; Santos, M. Physical activity and its clinical correlates in chronic thromboembolic pulmonary hypertension. Pulm. Circ. 2022, 12, e12048. [Google Scholar] [CrossRef] [PubMed]
- Balki, I.; de Perrot, M.; Bavaghar-Zaeimi, F.; Nourouzpour, S.; Granton, J.T.; Thenganatt, J.; McInnis, M.; McRae, K.; Donahoe, L.; Rozenberg, D. Clinical Implications of Body Composition and Exercise Capacity Following Pulmonary Endarterectomy. Ann. Thorac. Surg. 2022, 113, 444–451. [Google Scholar] [CrossRef] [PubMed]
- Pacifico, J.; Geerlings, M.A.J.; Reijnierse, E.M.; Phassouliotis, C.; Lim, W.K.; Maier, A.B. Prevalence of sarcopenia as a comorbid disease: A systematic review and meta-analysis. Exp. Gerontol. 2020, 131, 110801. [Google Scholar] [CrossRef]
- Bahat, G.; Turkmen, B.O.; Aliyev, S.; Catikkas, N.M.; Bakir, B.; Karan, M.A. Cut-off values of skeletal muscle index and psoas muscle index at L3 vertebra level by computerized tomography to assess low muscle mass. Clin. Nutr. 2021, 40, 4360–4365. [Google Scholar] [CrossRef]
- Peng, P.; Hyder, O.; Firoozmand, A.; Kneuertz, P.; Schulick, R.D.; Huang, D.; Makary, M.; Hirose, K.; Edil, B.; Choti, M.A.; et al. Impact of sarcopenia on outcomes following resection of pancreatic adenocarcinoma. J. Gastrointest. Surg. 2012, 16, 1478–1486. [Google Scholar] [CrossRef]
- Amini, N.; Spolverato, G.; Gupta, R.; Margonis, G.A.; Kim, Y.; Wagner, D.; Rezaee, N.; Weiss, M.J.; Wolfgang, C.L.; Makary, M.M.; et al. Impact Total Psoas Volume on Short- and Long-Term Outcomes in Patients Undergoing Curative Resection for Pancreatic Adenocarcinoma: A New Tool to Assess Sarcopenia. J. Gastrointest. Surg. 2015, 19, 1593–1602. [Google Scholar] [CrossRef]
- Okamura, H.; Kimura, N.; Mieno, M.; Yuri, K.; Yamaguchi, A. Preoperative sarcopenia is associated with late mortality after off-pump coronary artery bypass grafting. Eur. J. Cardio-Thoracic Surg. 2020, 58, 121–129. [Google Scholar] [CrossRef]
- Hawkins, R.B.; Mehaffey, J.H.; Charles, E.J.; Kern, J.A.; Lim, D.S.; Teman, N.R.; Ailawadi, G. Psoas Muscle Size Predicts Risk-Adjusted Outcomes After Surgical Aortic Valve Replacement. Ann. Thorac. Surg. 2018, 106, 39–45. [Google Scholar] [CrossRef]
- Keeratichananont, W.; Thanadetsuntorn, C.; Keeratichananont, S. Value of preoperative 6-minute walk test for predicting postoperative pulmonary complications. Ther. Adv. Respir. Dis. 2016, 10, 18–25. [Google Scholar] [CrossRef]
- Demir, R.; Kucukoglu, M.S. Six-minute walk test in pulmonary arterial hypertension. Anatol. J. Cardiol. 2015, 15, 249–254. [Google Scholar] [CrossRef] [PubMed]
- van der Plas, M.N.; Surie, S.; Reesink, H.J.; van Steenwijk, R.P.; Kloek, J.J.; Bresser, P. Longitudinal follow-up of six-minute walk distance after pulmonary endarterectomy. Ann. Thorac. Surg. 2011, 91, 1094–1099. [Google Scholar] [CrossRef] [PubMed]
- Alsadany, M.A.; Sanad, H.T.; Elbanouby, M.H.; Ali, S. Detecting a valid screening method for sarcopenia in acute care setting. J. Frailty Sarcopenia Falls 2021, 6, 111–118. [Google Scholar] [CrossRef]
- Chianca, V.; Albano, D.; Messina, C.; Gitto, S.; Ruffo, G.; Guarino, S.; Del Grande, F.; Sconfienza, L.M. Sarcopenia: Imaging assessment and clinical application. Abdom. Radiol. 2022, 47, 3205–3216. [Google Scholar] [CrossRef]
- Mitsiopoulos, N.; Baumgartner, R.N.; Heymsfield, S.B.; Lyons, W.; Gallagher, D.; Ross, R. Cadaver validation of skeletal muscle measurement by magnetic resonance imaging and computerized tomography. J. Appl. Physiol. 1998, 85, 115–122. [Google Scholar] [CrossRef]
- Derstine, B.A.; Holcombe, S.A.; Ross, B.E.; Wang, N.C.; Su, G.L.; Wang, S.C. Skeletal muscle cutoff values for sarcopenia diagnosis using T10 to L5 measurements in a healthy US population. Sci. Rep. 2018, 8, 11369. [Google Scholar] [CrossRef]
- Baracos, V.E. Psoas as a sentinel muscle for sarcopenia: A flawed premise. J. Cachexia Sarcopenia Muscle 2017, 8, 527–528. [Google Scholar] [CrossRef]
- Kim, E.Y.; Kim, Y.S.; Kim, K.W.; Jeon, J.Y.; Kim, K.G. Prognostic significance of radiodensity-based skeletal muscle quantification using preoperative CT in resected non-small cell lung cancer. J. Thorac. Dis. 2021, 13, 754–761. [Google Scholar] [CrossRef]
- Nakayama, T.; Furuya, S.; Kawaguchi, Y.; Shoda, K.; Akaike, H.; Hosomura, N.; Amemiya, H.; Kawaida, H.; Sudoh, M.; Kono, H.; et al. Prognostic value of preoperative psoas muscle index as a measure of nutritional status in patients with esophageal cancer receiving neoadjuvant therapy. Nutrition 2021, 90, 111232. [Google Scholar] [CrossRef]
- Kasahara, R.; Kawahara, T.; Ohtake, S.; Saitoh, Y.; Tsutsumi, S.; Teranishi, J.-I.; Miyoshi, Y.; Nakaigawa, N.; Yao, M.; Kobayashi, K.; et al. A Low Psoas Muscle Index before Treatment Can Predict a Poorer Prognosis in Advanced Bladder Cancer Patients Who Receive Gemcitabine and Nedaplatin Therapy. BioMed Res. Int. 2017, 2017, 7981549. [Google Scholar] [CrossRef]
- Matsumura, K.; Teranaka, W.; Matsumoto, H.; Fujii, K.; Tsujimoto, S.; Otagaki, M.; Morishita, S.; Hashimoto, K.; Shibutani, H.; Yamamoto, Y.; et al. Loss of skeletal muscle mass predicts cardiac death in heart failure with a preserved ejection fraction but not heart failure with a reduced ejection fraction. ESC Heart Fail. 2020, 7, 4100–4107. [Google Scholar] [CrossRef] [PubMed]
- Balsam, L.B. Psoas muscle area: A new standard for frailty assessment in cardiac surgery? J. Thorac. Dis. 2018, 10 (Suppl. 33), S3846–S3849. [Google Scholar] [CrossRef] [PubMed]
- Balki, I.; Perrot, M.D.; Zaeimi, F.; Granton, J.T.; Thenganatt, J.; McInnis, M.; Donahoe, L.; Rozenberg, D. Clinical Implications of Sarcopenia in Patients Undergoing Pulmonary Endarterectomy for Chronic Thromboembolic Pulmonary Hypertention. J. Heart Lung Transplant. 2020, 39 (Suppl. 4), S33–S34. [Google Scholar] [CrossRef]


| All (N = 97) Mean (±SD) or N (%) | Sarcopenic (N = 26) Mean (±SD) or N (%) | Non-Sarcopenic (N = 71) Mean (±SD) or N (%) | OR 95% CI | p Value | |
|---|---|---|---|---|---|
| Age (years) | 61.3 (±14.9) | 63.5 (±13.9) | 60 (±15.8) | 0.52 | |
| BMI (mg/kg2) | 31.7 (±29.5) | 28.9 (±9.4) | 32.7 (±8.6) | 0.057 | |
| Sex (male) | 42 (43.3%) | 11 (42%) | 31 (43.7%) | 0.95 (0.38–2.34) | 0.9 |
| Race/Ethnicity: | |||||
| White | 51 (52.6%) | 18 (69.2%) | 33 (46.5%) | ||
| Black | 38 (39.2%) | 7 (26.9%) | 31 (43.7%) | ||
| Hispanic/Latinx | 7 (7.2%) | 1 (3.8%) | 6 (8.5%) | ||
| Asian | 1 (1%) | 0 (0%) | 1 (1.4%) | 0.2 | |
| Baseline WHO/NYHA FC | |||||
| I | 9 (9.3%) | 0 (0%) | 9 (12.7%) | ||
| II | 24 (24.7%) | 3 (11.5%) | 21 (29.6%) | ||
| III | 42 (43.3%) | 11 (42.3%) | 31 (43.7%) | ||
| IV | 22 (22.7%) | 12 (42.6%) | 10 (14.1%) | 0.002 | |
| Comorbidities | |||||
| Use of PH Medications | 42 (43.3%) | 16 (61.5%) | 26 (36.6%) | 2.7 (1.09–6.99) | 0.028 |
| 12 (12.4%) | 7 (28.0%) | 5 (6.9%) | 0.006 | |
| 21 (21.6%) | 8 (32.0%) | 13 (18.0%) | 0.145 | |
| 6 (6.2%) | 2 (8.0%) | 4 (5.6%) | 0.662 | |
| Atrial Fibrillation | 18 (18.6%) | 5 (19.2%) | 13 (18.3%) | 1.06 (0.34- 3.34) | 0.91 |
| Cancer History | 10 (10.3%) | 1 (3.8%) | 9 (12.7%) | 0.28 (0.03–2.29) | 0.21 |
| Coagulopathy | 15 (15.5%) | 3 (11.5%) | 12 (16.9%) | 0.64 (0.17–2.48) | 0.51 |
| DM | 17 (17.5%) | 4 (15.4%) | 13 (18.3%) | 0.81 (0.24–2.76) | 0.74 |
| Family History of Thromboembolic disease | 4 (4.1%) | 1 (3.8%) | 3 (4.2%) | 0.91 (0.09–9.13) | 0.93 |
| Hemoglobinopathy | 2 (2.1%) | 1 (3.8%) | 1 (1.4%) | 2.8 (0.17–46.46) | 0.45 |
| History of Acute PE | 78 (80.4%) | 21 (80.8%) | 57 (80.3%) | 1.03 (0.33–3.22) | 0.96 |
| History of LE DVT | 56 (57.7%) | 14 (53.8%) | 42 (59.2%) | 0.81 (0.34–1.99) | 0.64 |
| History of UE DVT | 2 (2.1%) | 1 (3.8%) | 1 (1.4%) | 2.8 (0.17–46.47) | 0.45 |
| IV Device | 8 (8.2%) | 3 (11.5%) | 5 (7%) | 1.72 (0.38–7.78) | 0.47 |
| MTS | 8 (8.2%) | 2 (7.7%) | 6 (8.5%) | 0.90 (0.17–4.78) | 0.94 |
| Splenectomy | 2 (2.1%) | 1 (3.8%) | 1 (1.4%) | 2.8 (0.17–46.46) | 0.45 |
| Sleep apnea | 18 (18.6%) | 7 (26.9%) | 11 (15.5%) | 2.01 (0.68–5.91) | 0.20 |
| Thyroid disease | 13 (13.4%) | 5 (11.3%) | 8 (19.2%) | 1.88 (0.55–6.36) | 0.31 |
| Tobacco use | 38 (39.2%) | 7 (26.9%) | 31 (43.7%) | 0.47 (0.18–1.27) | 0.14 |
| Psoas Muscle Index (PMI) | 5.22 (±2.87) | 3.24 (±0.75) | 6.11 (±1.18) | <0.001 | |
| Baseline 6MWD (meters) | 332.3 (±134.6) | 289.3 (±102.2) | 343.8 (±140.5) | 0.4 (−0.16–0.98) | 0.19 |
| Hemodynamics | All N = 97 Mean (±SD) | Sarcopenic N = 26 | Non-Sarcopenic N = 71 | p Value |
|---|---|---|---|---|
| Heart Rate (bpm) | 78 (±13.1) | 78.4 (±10.5) | 78.3 (±14.2) | 0.97 |
| Right atrial pressure (mmHg) | 9.9 (±5.2) | 9.8 (±5) | 9.9 (±5.3) | 0.93 |
| Systolic PA Pressure (mmHg) | 72.3 (±23.2) | 83.5 (±19.6) | 68.1 (±23.2) | 0.003 |
| Diastolic PA Pressure (mmHg) | 25.1 (±8.9) | 28.4 (±7.6) | 23.9 (±9.1) | 0.02 |
| Mean PA (mmHg) | 42.2 (±12.5) | 48.5 (±11.3) | 39.8 (±12.2) | 0.002 |
| PCWP (mmHg) | 12.1 (±4.8) | 11.6 (±4.4) | 12.2 (±4.9) | 0.58 |
| CO (L/min) | 4.41 (±1.25) | 4.08 (±1.25) | 4.53 (±1.23) | 0.11 |
| CI (L/min/m2) | 2.18 (±0.57) | 2.04 (±0.57) | 2.24 (±0.56) | 0.12 |
| PVR (WU) | 7.76 (±4.61) | 9.79 (±4.45) | 6.98 (±4.46) | 0.009 |
| TPR (WU) | 10.67 (±5.26) | 13.26 (±5.53) | 9.67 (±4.83) | 0.003 |
| Hemodynamics | All N = 97 (±SD) | Sarcopenic N = 26 | Non-Sarcopenic N = 71 | p Value |
|---|---|---|---|---|
| Systolic PA Pressure (mmHg) | 43.1 (±15.5) | 49.1 (±18.1) | 44.4 (±15.3) | 0.99 |
| Diastolic PA Pressure (mmHg) | 17.7 (±6.6) | 20.1 (±6.1) | 18.7 (±6.3) | 0.90 |
| Mean PA pressure (mmHg) | 28.6 (±8.9) | 30.4 (±9.7) | 27.2 (±8.6) | 0.84 |
| CO (L/min) | 5.56 (±1.29) | 5.5 (±1.95) | 5.4 (±1.25) | 0.09 |
| CI (L/min/m2) | 2.67 (±0.52) | 2.56 (±0.54) | 2.7 (±0.53) | 0.06 |
| TPR (WU) | 5.61 (±2.25) | 6.25 (±2.77) | 5.45 (±2.13) | 0.27 |
| Variables | All N = 97 | Sarcopenic N = 26 | Non-Sarcopenic N = 71 | p Value |
|---|---|---|---|---|
| 6MWD (meters) Pre-Intervention | Mean (SD) 332.3 (±134.6) | Mean (SD) 289.3 (±102.2) | Mean (SD) 343.8 (±140.5) | 0.22 |
| Post-Intervention | 362.2 (±118.3) | 365.2 (±140.8) | 361.4 (±113) | 0.69 |
| Brain natriuretic peptide (pg/mL) Pre-Intervention | Median (IQR) 138.5 (IQR 54–428) | Median (IQR) 190 (IQR 104–1008) | Median (IQR) 129 (IQR 37–353) | 0.03 |
| Post Intervention | 71 (IQR 36–144) | 96 (IQR 41–242) | 66 (IQR 35–117) | 0.22 |
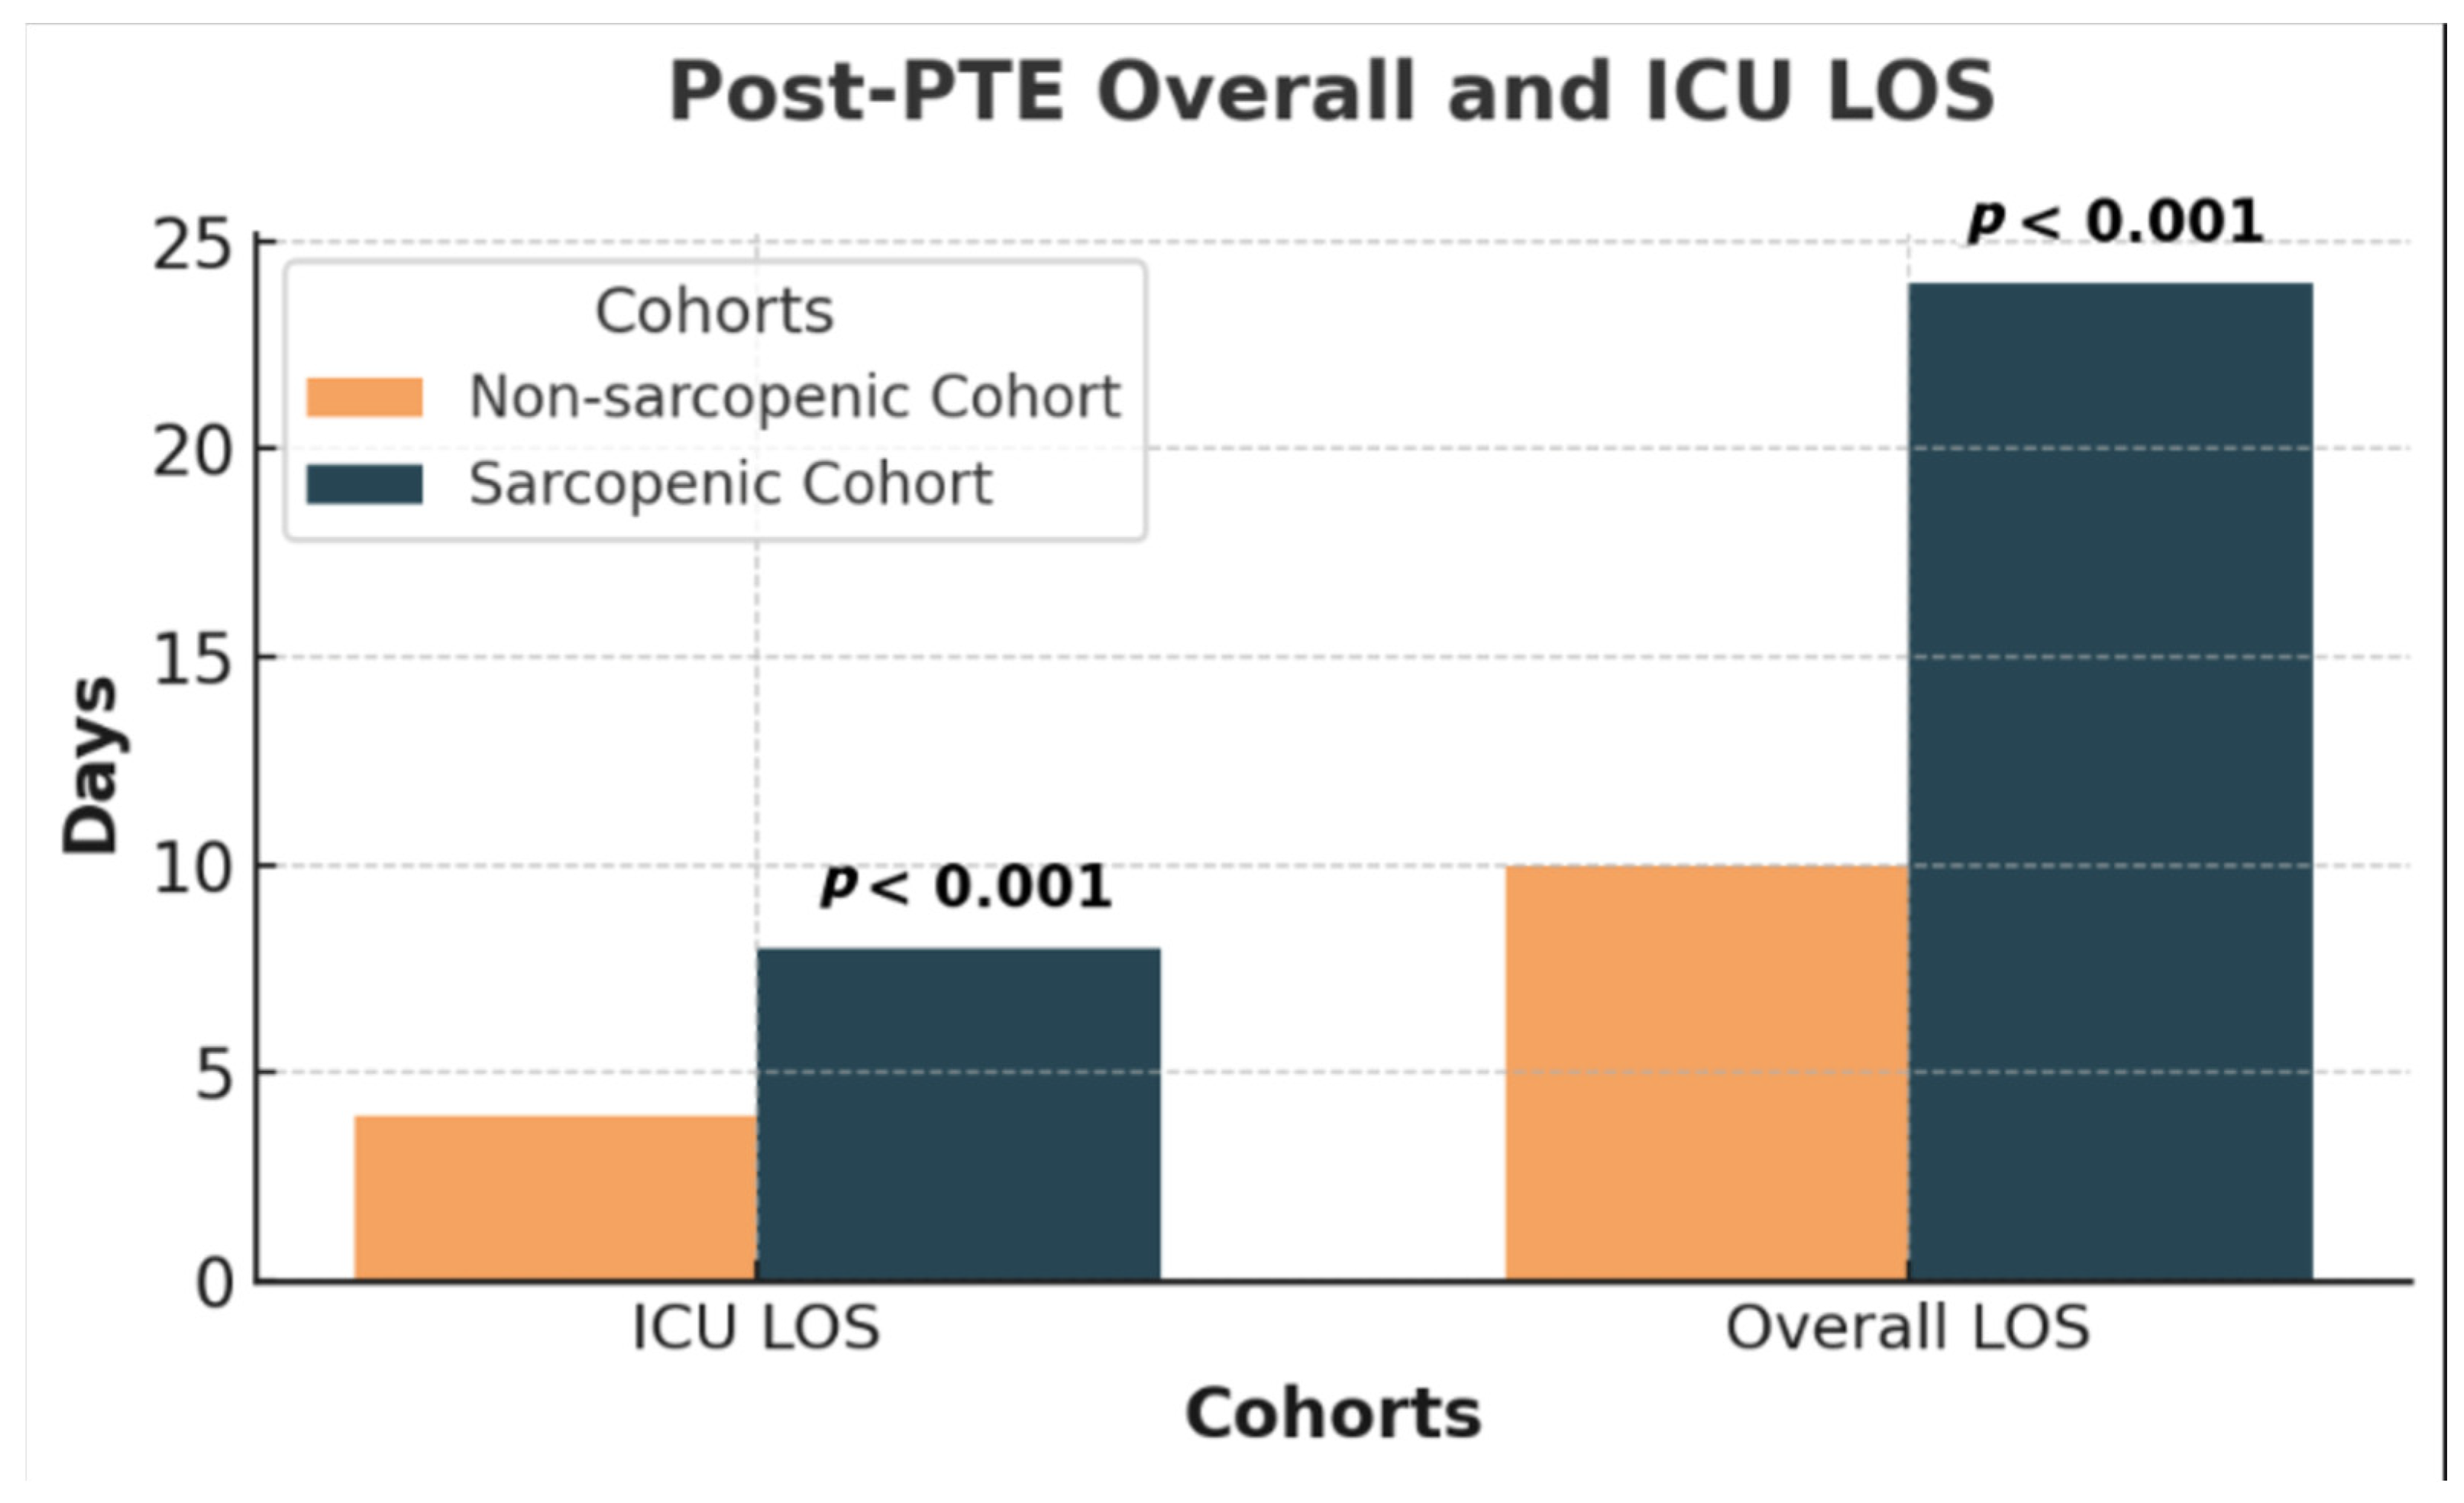
| Post-PTE ICU LOS (days) | 4 (p25 = 3, p75 = 10) | 9 (p25 = 5, p75 = 34) | 4 (p25 = 2, p75 = 7) | <0.001 |
| Post-PTE Overall LOS (days) | 14 (p25 = 7, p75 = 24) | 24 (p25 = 12, p75 = 41) | 11 (p25 = 7, p75 = 17) | <0.001 |
| Mortality | 0 | 0 | 0 |
Disclaimer/Publisher’s Note: The statements, opinions and data contained in all publications are solely those of the individual author(s) and contributor(s) and not of MDPI and/or the editor(s). MDPI and/or the editor(s) disclaim responsibility for any injury to people or property resulting from any ideas, methods, instructions or products referred to in the content. |
© 2025 by the authors. Licensee MDPI, Basel, Switzerland. This article is an open access article distributed under the terms and conditions of the Creative Commons Attribution (CC BY) license (https://creativecommons.org/licenses/by/4.0/).
Share and Cite
Hopkins, S.; Hall, J.; Saunders, H.; Bashir, R.; Lakhter, V.; Vaidya, A.; Sadek, A.; Forfia, P.; Oliveros, E. Sarcopenia in Patients with Chronic Thromboembolic Pulmonary Hypertension. J. Cardiovasc. Dev. Dis. 2025, 12, 162. https://doi.org/10.3390/jcdd12050162
Hopkins S, Hall J, Saunders H, Bashir R, Lakhter V, Vaidya A, Sadek A, Forfia P, Oliveros E. Sarcopenia in Patients with Chronic Thromboembolic Pulmonary Hypertension. Journal of Cardiovascular Development and Disease. 2025; 12(5):162. https://doi.org/10.3390/jcdd12050162
Chicago/Turabian StyleHopkins, Steven, Jillian Hall, Hollie Saunders, Riyaz Bashir, Vladimir Lakhter, Anjali Vaidya, Ahmed Sadek, Paul Forfia, and Estefania Oliveros. 2025. "Sarcopenia in Patients with Chronic Thromboembolic Pulmonary Hypertension" Journal of Cardiovascular Development and Disease 12, no. 5: 162. https://doi.org/10.3390/jcdd12050162
APA StyleHopkins, S., Hall, J., Saunders, H., Bashir, R., Lakhter, V., Vaidya, A., Sadek, A., Forfia, P., & Oliveros, E. (2025). Sarcopenia in Patients with Chronic Thromboembolic Pulmonary Hypertension. Journal of Cardiovascular Development and Disease, 12(5), 162. https://doi.org/10.3390/jcdd12050162