Abstract
The aim of this study was to identify the potential influence of obesity and body mass components on exercise tolerance assessed in cardiopulmonary exercise testing (CPET), biochemical and echocardiographic parameters and factors correlated with oxygen absorption at the anaerobic threshold in hypertensive women with low levels of physical activity in the perimenopausal period. The study comprised 188 hypertensive women divided, based on body mass index (BMI), into an obesity group and a non-obesity group. Women with BMI ≥ 30 kg/m2 had significantly higher parameters of left ventricular diastolic dysfunction in echocardiography, lower total body water (TBC) in percentage assessed by bioimpedance and significantly worse exercise capacity assessed by CPET. In the study group, VO2 AT (mL/kg/min) correlated positively with TBW (r = 0.4, p < 0.0001) and with the ratio of extracellular water to total body water (ECW/TBW) (r = 0.4, p < 0.00001) and negatively with fat (% and kg) (r = −0.4, p < 0.0001 for both). Obesity negatively affects parameters of diastolic left ventricular function, as well as exercise tolerance in CPET in hypertensive females during the perimenopausal period. The oxygen uptake at anaerobic threshold correlates positively with total body water and ECW/TBW and negatively with body fat; this connection is more pronounced in women without obesity. ClinicalTrials.gov Identifier: NCT04802369.
1. Introduction
The preponderance of obesity is predicted to reach 21% in women and 18% in men by 2025 [1]. Age is a relevant factor for obesity development. The burden of this condition is highest in those aged 40–64 years [2]. Obesity is one of the principal causes of hypertension, diabetes, dyslipidemia, heart failure, coronary heart disease (CHD) and stroke. Epidemiological and longitudinal studies have documented a strong relationship between obesity and hypertension. Obesity and hypertension are both affiliated with elevated cardiovascular mortality, and they often occur together [3]. In women, hypertension is usually noted after menopause. The main factor is decreased estradiol concentration, which causes deteriorated endothelial function [4]. Hypertension susceptibility in women increases during perimenopause, the transition period before menopause characterized by extended hormone cycles and unstable estrogen fluctuation. Additionally, physiological, social, psychological and affective changes are observed. During this period, female body prepares for menopause from fertile life. [5]. Multiple mechanisms activate the renin–angiotensin–aldosterone system (RAAS) in obesity, including compression of the kidneys and increased sympathetic nervous system (SNS) activation [6]. The adipose tissue excretes adipokines, such as adiponectin, leptin, resistin and interleukin 6. Some studies also suggest the role and the relationship of adipokines in hypertension. In patients with hypertension, higher levels of leptin and lower levels of adiponectin are observed [7,8,9]. Obesity is associated with numerous consequences. Excess visceral fat could lead to increased secretion of proinflammatory adipokines, which may promote insulin resistance (IR). IR stimulates muscle catabolism and mitochondrial dysfunction [10]. Furthermore, it has been suggested that muscle fat infiltration causes IR in obese individuals [11]. Additionally, obese people are prone to the loss of muscle mass and strength due to a tendency to be less physically active [12]. The relationship between obesity and left ventricular dysfunction was first noted in the mid-20th century [13]. Clinical and necropsy studies on morbid obesity confirmed the entity of obese cardiomyopathy, regularly leading to congestive heart failure. An overabundance of fat can lead to growth in preload and afterload as a result of hyperdynamic circulation and volume overload [14]. Additionally, obesity may stimulate the effect of blood pressure on left ventricular (LV) mass growth [15]. Therefore, LV dilation and increased LV mass are common in patients with overweight, with both eccentric and concentric LV geometric patterns. In healthy people, peak oxygen uptake (pVO2) declines at a rate of 3 to 8% per decade after the age of 30 years, but adaptation for muscle mass considerably mitigates this decline [16]. An inactive lifestyle in the middle-aged females was affiliated with serious menopausal symptoms and obesity [17]. Patients with metabolic syndrome and overweight/obesity who reported adhering to physical activity recommendations achieved higher maximal oxygen uptake (VO2 max) in cardiopulmonary exercise testing (CPET), which confirmed the connection of physical performance with the level of activity [18].
The aim of the present study was to identify the potential influence of obesity and body mass components on exercise tolerance assessed in CPET, biochemical and echocardiographic parameters and factors correlated with oxygen absorption at the anaerobic threshold in hypertensive woman during the perimenopausal period and with low levels of physical activity.
2. Materials and Methods
2.1. Basic Characteristics
A total of 188 female patients in the perimenopausal period with primary hypertension and low levels of physical activity were enrolled in this study. Hypertension was treated in accordance with current ESC/ESH guidelines. There were no significant differences between compared groups with respect to treatment. In our group, a sedentary lifestyle was defined as fewer than three weekly 30 min periods of physical activity. All participants were adults hospitalized in the Department of Preventive Cardiology and Lipidology and the Department of Cardiology and Congenital Heart Diseases between 2018 and 2021. This group was divided into a group of women with an average age of 53 (±8) with a body mass index (BMI) ≥ 30 kg/m2 (median, 33.3; IQR: 31.8–35.1) and a group of women with an average age of 52 (±8) with a BMI < 30 kg/m2 (median, 25; IQR: 22.9–27.6). The most common method to measure obesity is body mass index, which based on a person’s weight in kilograms and height in meters. A BMI of 18.5 to 24.9 kg/m2 is considered a normal weight. Overweight is defined as a BMI of 25 to 29.9 kg/m2, and a BMI of 30 kg/m2 or greater is considered obese (class 1: 30–34.9 kg/m2; class 2: 35–39.9 kg/m2; class 3: ≥40 kg/m2) [19]. All subjects gave written informed consent to participate in the study. After the informed consent was signed, clinical data of patients participating in the study were collected. The patients underwent a physical examination based on the standard internal medicine protocol. We paid particular attention to inclusion and exclusion criteria during enrolment in the trial. The study was conducted in accordance with the Declaration of Helsinki and was approved by the Polish Mother’s Memorial Hospital Research Institute Bioethics Commission (PMMHRI-BCO.71/2020).
Exclusion criteria:
- (a)
- Diagnosis of heart failure—left ventricular ejection fraction (LVEF) ≤ 50% and signs and symptoms of heart failure or LVEF ≥ 50% with signs and symptoms and raised natriuretic peptides;
- (b)
- Uncontrollable arterial hypertension—systolic blood pressure ≥150 mmHg and/or diastolic blood pressure ≥100 mmHg;
- (c)
- Diagnosis of cardiomyopathy in medical history;
- (d)
- Intracerebral hemorrhage, stroke, transient ischemic attack in medical history;
- (e)
- Past myocardial infarction;
- (f)
- Active systemic infection;
- (g)
- Pregnancy and lactation;
- (h)
- Registered hyperandrogenism, hyperestrogenism, insulin resistance, premature ovarian failure or polycystic ovary syndrome;
- (i)
- Critical hypo- or hyperthyroidism;
- (j)
- Lysosomal storage diseases;
- (k)
- Active autoimmune disorder;
- (l)
- Documented neoplastic process;
- (m)
- Chronic kidney disease (stage IV and V according to the National Kidney Foundation);
- (n)
- Treatment with antiretroviral and cytostatic drugs, glucocorticosteroids or immunosuppressants;
- (o)
- Registered treatment with blood products within the last 6 months, bone marrow transplant or other organ transplant;
- (p)
- Human immunodeficiency virus (HIV), hepatitis B virus (HBV) or hepatitis C virus (HCV) carrier or positive for hepatitis B surface antigen (HBsAg) or antibodies to HCV;
- (q)
- Alcohol and drug abuse;
- (r)
- Surgery or severe trauma within the last month;
- (s)
- Inability of the patient to collaborate and/or provide informed consent to participate in the study;
- (t)
- Patients who did not express their informed consent to participate in the research.
2.2. Echocardiography
Quantitative measures were performed in compliance with current guidelines [20]. Comprehensive echocardiography was evaluated using commercially available ultrasound systems (Vivid E95—GE Healthcare, Chicago, IL, USA). The two-dimensional biplane-modified Simpson method from a 4- and 2-chamber view was used to obtain left ventricular volume (LV) and ejection fraction (EF). This method was also necessary to measure maximal left atrial volume (LAV) based on the apical 2- and 4-chamber views at end systole without foreshortening, excluding the LA appendage and pulmonary vein confluences [21]. Each LAV was indexed by body surface area (LAVi). Transmitral velocities, the peak early (E) and peak late (A) mitral velocities, the ratio between the peak E and A velocities (E/A), deceleration time and isovolumic relaxation time were assessed using pulse Doppler echocardiography. Doppler tissue imaging was used to measure early diastolic (E′) velocity and late diastolic (A′) velocity. The ratio of early transmitral peak velocity to early diastolic peak annular velocity (E/E′) was calculated as an index of LV filling pressure. Tricuspid annular plane systolic excursion (TAPSE) measurement was obtained from the conventional measure from the apical four-chamber view [22].
2.3. Laboratory Tests
Blood samples were collected into polyethylene–terephthalate tubes containing EDTA. The collected blood samples were mixed well, stored at 4 °C and centrifuged within 6 h. The resulting plasma samples were immediately frozen and stored at −80 °C until measurements were conducted. Laboratory tests were performed in the hospital laboratory following a minimum 12 h period after the last meal. Routine laboratory tests included liver function parameters (aspartate transaminase (ASP) and alanine aminotransferase (ALT)), renal function parameters (creatinine, glomerular filtration rate (GFR) estimated by modification of diet in renal disease (MDRD)) inflammatory cytokine (C-reactive protein (CRP)), glucose level, lipoprotein profile: total cholesterol (TC), low-density lipoprotein (LDL), high-density lipoprotein (HDL) triglycerides (TG), hematology and hypersensitive cardiac troponin T (hsTnT). Serum N-terminal pro-B-type natriuretic peptide (NT-pro-BNP) concentrations were determined using the electrochemiluminescence method.
2.4. Spiroergometry
CPET ensures an overall evaluation of the exercise response involving the cardiovascular, pulmonary and skeletal muscle systems. Parameters were measured using the MetaSoft® Studio application (software of CORTEX systems, Leipzig, Germany). Prior to exercise, basic spirometry was performed. We recorded forced vital capacity (FVC) and forced expiratory volume in one second (FEV1). Additionally, the FEV1/FVC ratio (Tiffeneau index) was obtained [23]. Exercise testing in CPET was performed using a stationary cycle ergometer. Heart rate, rhythm, ECG, blood pressure and oxygen saturation were monitored during exercise. The ensuant parameters are relevant to analysis of CPET. The difference between the volume of O2 in the inhaled and exhaled air during exercise per unit of time is defined as oxygen uptake (VO2). In steady state, VO2 is equivalent to metabolic O2 consumption. VO2 peak represents the highest attainable VO2 for a subject. The difference between the volume of CO2 in the inhaled and exhaled air during exercise per unit of time is called carbon dioxide output (VCO2). The respiratory exchange ratio (RER) corresponds to the gas exchange ratio. We also measured anaerobic threshold (AT) and the minute ventilation/carbon dioxide production slope (VE/VCO2 slope) [24].
2.5. Sphygmocor
A SphygmoCor 9.0 tonometer (AtCor Medical, Sydney, Australia) enables non-invasive evaluation of central aortic pressure waveforms [25]. This diagnostic method provides measurement of aortic systolic pressure (SP aortic), aortic diastolic pressure (DP aortic) and aortic pulse pressure (PP aortic) [26]. The following parameters of arterial stiffness were also obtained. Augmentation pressure (AP) is the difference in pressure between the two peaks during heart ejection. Pulse wave velocity (PWV) is carotid femoral pulse wave velocity in meters/second (m/s), measured as the distance divided by the pulse transit time. An indication of arterial wave reflection due to arterial system elasticity is defined as the augmentation index (AIx) [27].
2.6. Body Mass Analysis
A segmental body composition analyzer (Tanita Pro, Tokyo, Japan) is a device used for non-invasive body mass analysis. This tool measures body mass compartments using the DXA method and bioelectrical impedance analysis (BIA method). A constant current source with a high-frequency current (50 kHz, 90 µA) is used with this device. Electrodes placed on the tips of the toes of both feet supply electric current, which flows into the body parts to be measured. We obtained total and regional fat mass (FM) and fat-free mass (FFM). Total body water (TBW), intracellular water (ICW) and extracellular water were measured. We also examined the relationship between ECW and TBW, defined as the ECW/TBW % ratio [28].
2.7. Statistical Analysis
Statistical analysis was carried out using the STATISTICA 13.1 software package (StatSoft, Kraków, Poland). The concordance of normal distribution of all variables was calculated with the Shapiro–Wilk test. To compare 2 groups, the Student’s t-test for continuous variables with normal distribution and the Mann–Whitney U test for non-normally distributed variables were used. The correlations between the analyzed parameters were determined by Spearman’s test. For analyses, a p-value < 0.05 was considered statistically significant. The factors that significantly differ between obese and non-obese patients were introduced to the backward step logistic regression model to identify the parameters that best characterize the obese population. The results of logistic regression analysis are presented as odds ratio (OR) and 95% confidence interval (Cl), as well as p-value.
3. Results
3.1. Evaluation of Basic Characteristics
A total of 188 female patients were included in the study. Figure 1 shows patient enrolment in the study. The group was divided into two groups: 60 obese women with an average age of 53 (±8) and a body mass index (BMI) ≥ 30 kg/m2 (median, 33.3; IQR: 31.8–35.1) and 128 slim women with an average age of 52 (±8) and a BMI < 30 kg/m2 (median, 25; IQR: 22.9–27.6). In the obesity group, the blood levels of glucose, triglycerides, ALT, AST, CRP and hsTnT were significantly higher than in the controls group (median, 94 mg/dL; IQR: 89–99 vs. median, 91 mg/dL; IQR: 86–97; p = 0.01) (median, 149 mg/dL; IQR: 102–178 vs. median, 111 mg/dL; IQR: 75–146; p = 0.002) (median, 23 U/L; IQR: 18–32 vs. median, 17 U/L; IQR: 14.25; p < 0.0001) (median, 24 U/L; IQR: 21–30 vs. median, 22 U/L; IQR: 19–25; p = 0.02) (median, 0.6 mg/L; IQR: 0.5–0.9 vs. median, 0.5 mg/L; IQR: 0.5–0.5; p = 0.004) (median, 4.6 ng/L; IQR: 3–5.9 vs. median, 3.5 ng/L; IQR: 3–4.6; p = 0.02), respectively (Table 1). High-density lipoprotein (HDL) cholesterol was lower than in the control group (median, 45 mg/dL; IQR: 38–49 vs. median, 54.5 mg/dL; IQR: 42–66; p < 0.0001). There was no important difference in terms of concentration of low-density lipoprotein (LDL) cholesterol, total cholesterol, hemoglobin, glomerular filtration rate (GFR) and N-terminal prohormone of brain natriuretic peptide (NT-proBNP) between women with and without obesity (p = 0.3; p = 0.9; p = 0.2; p = 0.2; p = 0.2, respectively). Results are shown in Table 1.
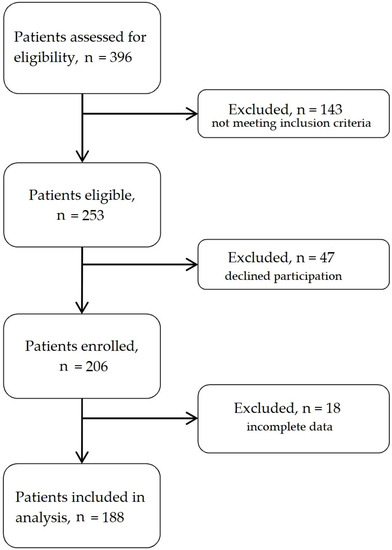
Figure 1.
Flow chart of patient enrolment.

Table 1.
Basic characteristics and biochemical parameters of study groups.
3.2. Evaluation of Echocardiographic and Hemodynamic Parameters
Left atrial volume (LA volume), left atrial volume index (LAVi), late diastolic filling velocity (A), left atrial volume index over late diastolic mitral annulus velocity (LAVi/A′), and the ratio of peak velocity of early diastolic transmitral flow to peak velocity of early diastolic mitral annular motion (E/E′) were significantly higher (median 66.3 (IQR: 56–82.5) vs. 51 (45.5–62), p < 0.0001; median 34 (IQR: 28.8–40.8) vs. 29.6 (IQR: 26.9–34.8), p = 0.0005; median 83.5 (IQR: 74.5–93.5) vs. 78 (IQR: 69–90), p = 0.03; median 3.4 (IQR: 2.6–4.2) vs. 2.9 (IQR: 2.4–3.4), p = 0.005; median 8.5 (IQR: 7.3–10.3) vs. 7.7 (IQR: 6.4–8.6), p = 0.004, respectively) in patients with BMI ≥ 30 kg/m2 compared to women without obesity. Early diastolic mitral annular velocity (E′) was minor (median 9 (IQR: 8–10.5) vs. 10 (IQR: 8–12), p = 0.03) in the study group relative to controls. Groupwise comparisons between ejection fraction (EF), early diastolic filling velocity (E), ratio of early-to-late diastolic transmitral flow velocity (E/A), late diastolic mitral annulus velocity (A′), tricuspid annular plane systolic excursion (TAPSE) and tissue Doppler echocardiography (TDE) were not statistically important. There was no significant difference in pulse wave velocity (PWV), aortic systolic pressure (aortic SP), aortic pulse pressure (aortic PP), augmentation pressure (AP), augmentation index (AIx) or adjusted augmentation index at a heart rate of 75/min (AIx@HR75). Results are presented in Table 2.
Table 2.
Evaluation of selected echocardiographic and hemodynamic parameters.
3.3. Evaluation of Spiroergometry
In basic spirometry, only forced vital capacity (FVC) was statistically lower (median 3.2 (IQR: 2.6–3.5) vs. 3.3 (3–3.6), p = 0.04) in the obesity group in comparison to the controls. There was no difference in the remaining parameters: forced expiratory volume in one second (FEV1), the ratio of forced expiratory volume in one second to forced vital capacity (FEV1/FVC), forced expiratory flow over the middle one half of the FVC (FEF 25–75) (p = 0.1; p = 0.1; p = 0.8, respectively). During exercise, maximal peripheral systolic blood pressure (SBP) was greater (median 180 (IQR: 170–200) vs. 160 (160–180), p < 0.0001) in patients with BMI ≥ 30 kg/m2 than in women without obesity. Differences between maximal peripheral diastolic blood pressure (DBP) were not observed (median 80 (IQR: 80–90), p = 0.04). Maximal heart rate was lower (136.3 (±20.4) vs. 136.3 (±20.4), p = 0.0006) in obesity patients. Additionally, the respiratory exchange ratio (RER), maximal oxygen consumption measured during incremental exercise indexed per kilogram (VO2 max) and oxygen uptake at anaerobic threshold per kilogram (VO2 AT) (median 1.1 (IQR: 1–1.1) vs. 1.1 (1.1–1.2); p = 0.002; median 18 (IQR: 15–19) vs. 20 (18–23), p < 0.0001; median 12 (IQR: 10–13) vs. 13 (11–15), p = 0.006m respectively) were lower than in comparison to patients with BMI < 30 kg/m2. The highest respiratory oxygen uptake (VO2) achieved by the subject during the maximal exercise (peak VO2) was greater (median 1.6 (IQR: 1.3–1.7) vs. 1.4 (1.2–1.7), p < 0.0001) in the obesity group. However, the minute ventilation/carbon dioxide production slope (VE/VCO2 slope) was not much lower (28 (±4.2) vs. 28.6 (±3.9), p = 0.4) in patients with BMI ≥ 30 kg/m2 compared to controls (Table 3).
Table 3.
Evaluation of spiroergometric parameters.
3.4. Evaluation of Body Mass Analysis
Important differences were observed in all measurements. The level of fat, fat-free body mass (FFM), total body water (TBW), extracellular water (ECW), intracellular water (ICW) and metabolic age were significantly higher (p < 0.0001) in patients in the obesity group. Additionally, the ratio of extracellular water to total body water (ECW/TBW%) was greater (p < 0.0001) in patients with BMI ≥ 30 kg/m2 compared to lower body mass group (Table 4).
Table 4.
Evaluation of body composition parameters.
3.5. Obese Patients and Clinical Parameters: Results of Logistic Regression Analysis
The results of logistic regression analysis indicate a strong relationship between BMI ≥ 30 kg/m2 and the following parameters: fat (%), HDL cholesterol (mg/dL), peak VO2 max (L) and VO2 max (mL/min/kg) (Table 5).
Table 5.
Results of logistic regression analysis.
3.6. Significant Correlations with VO2 AT
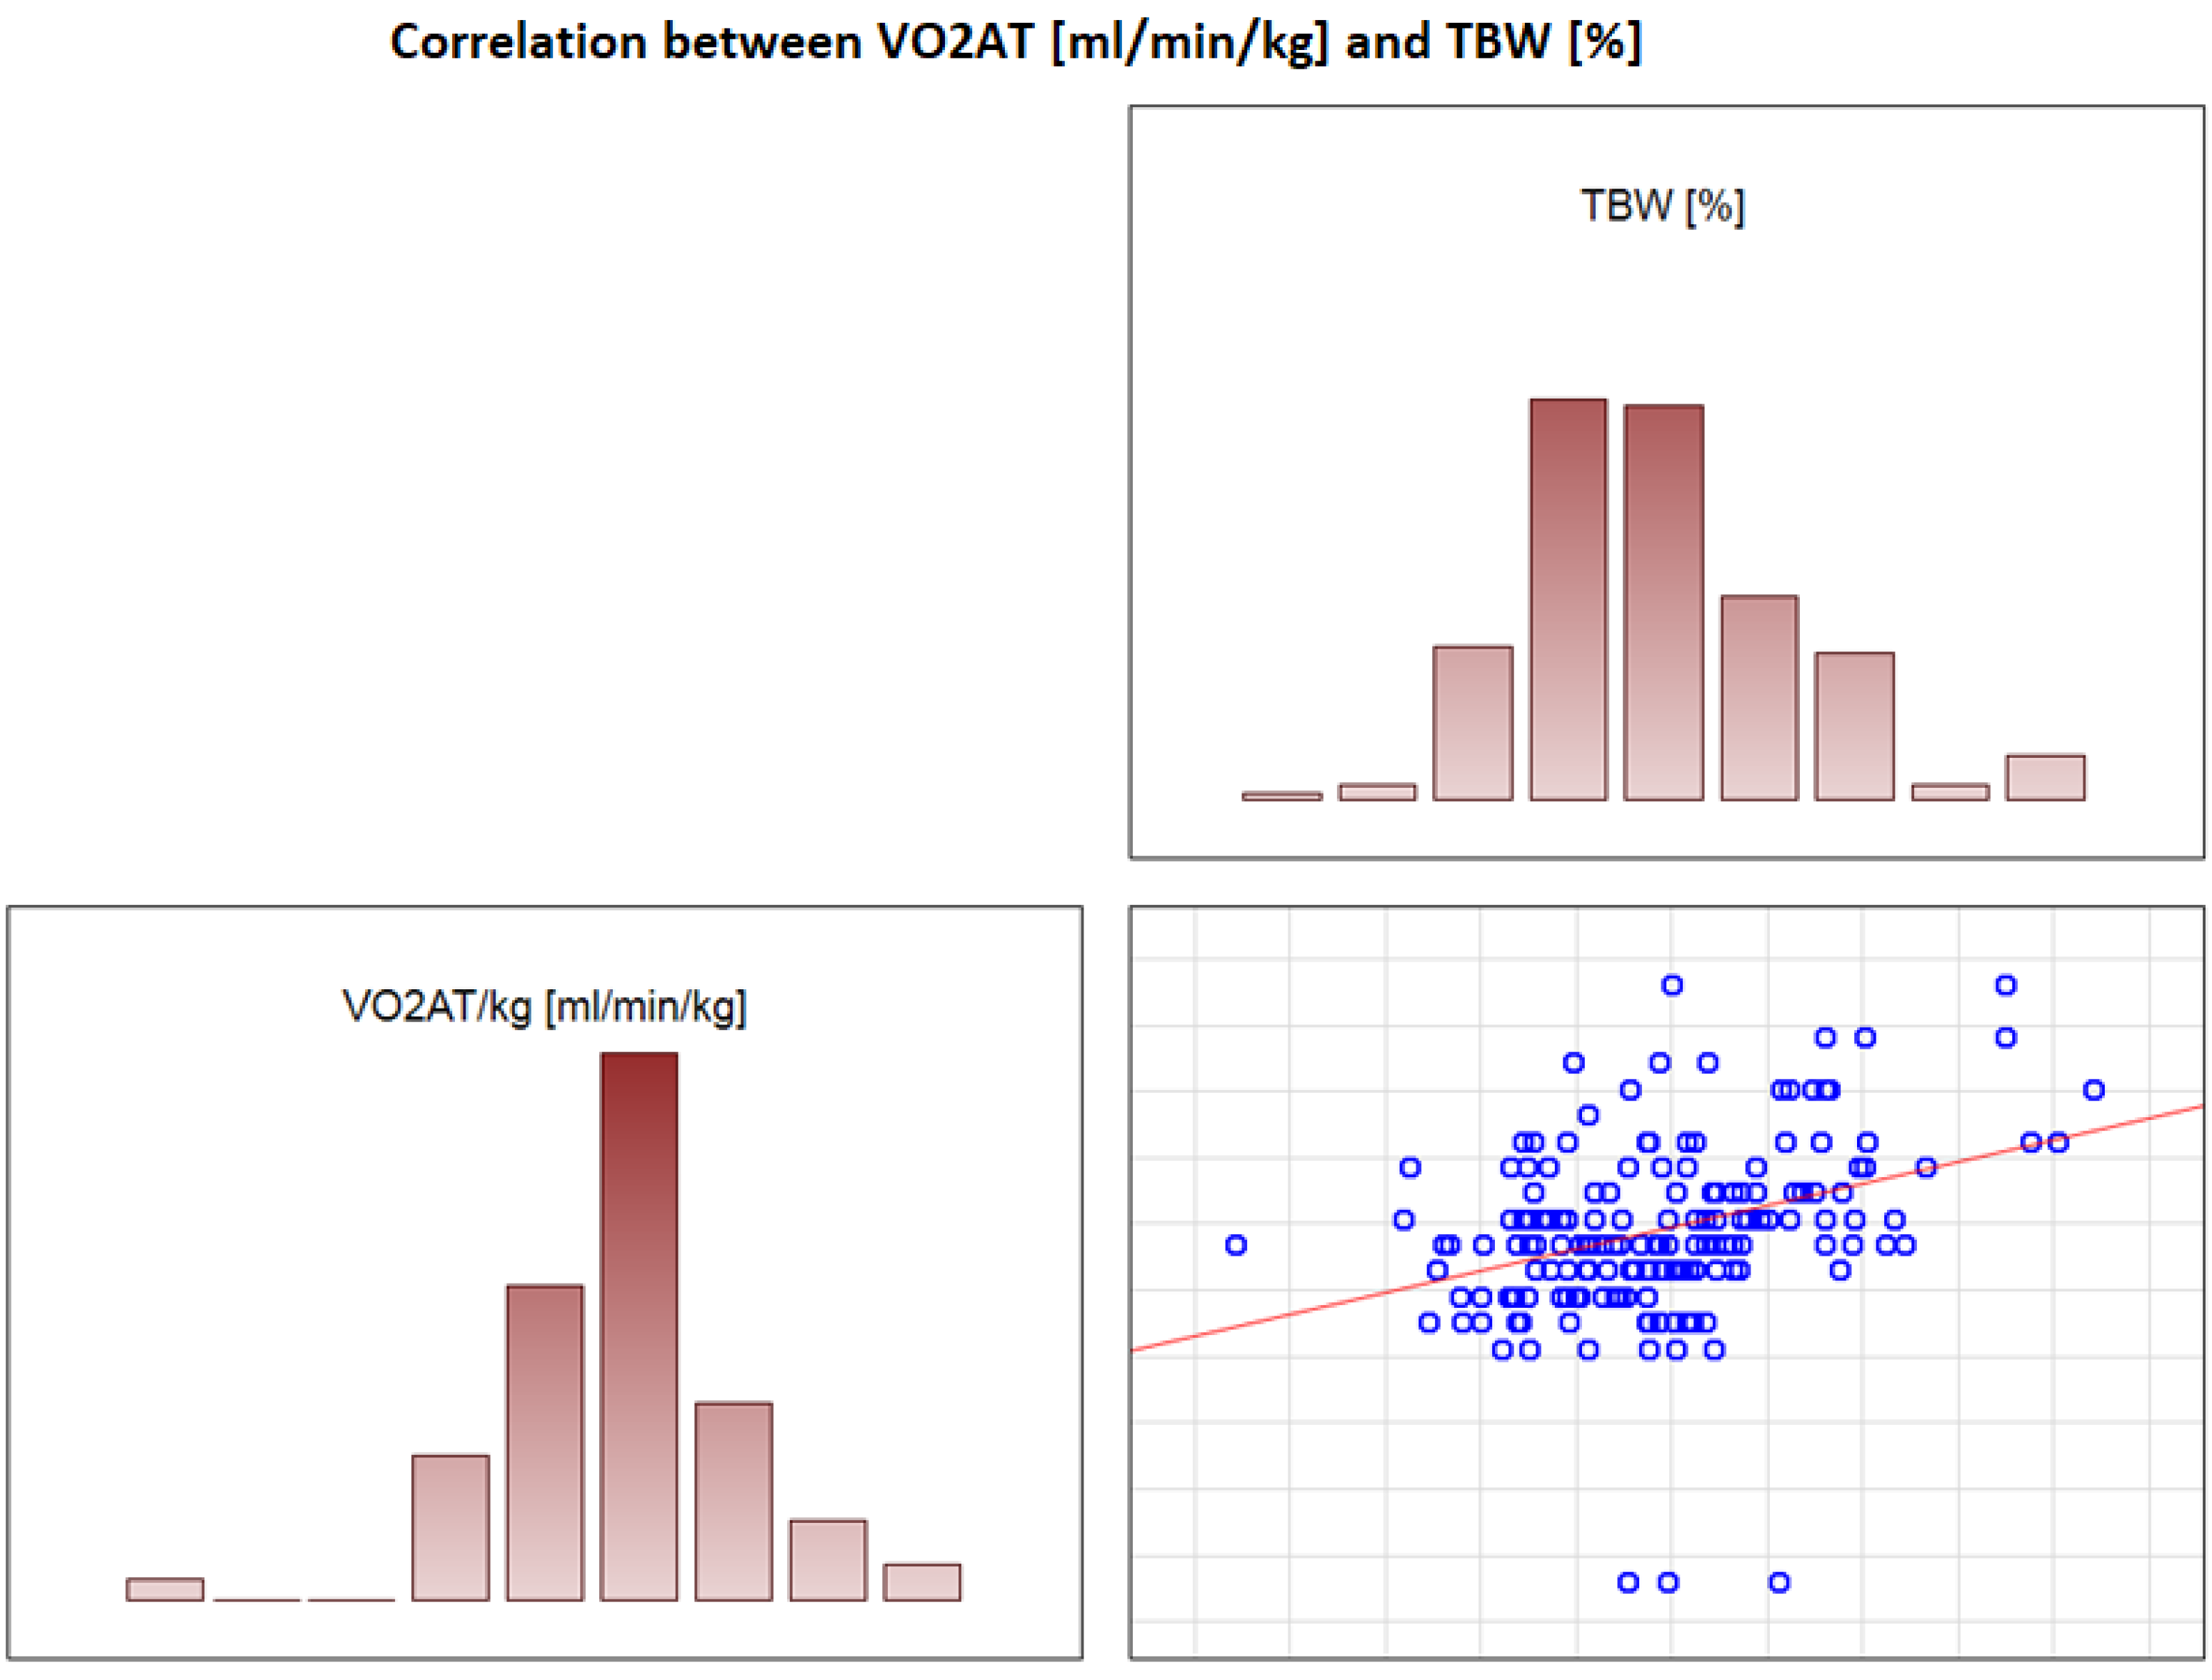
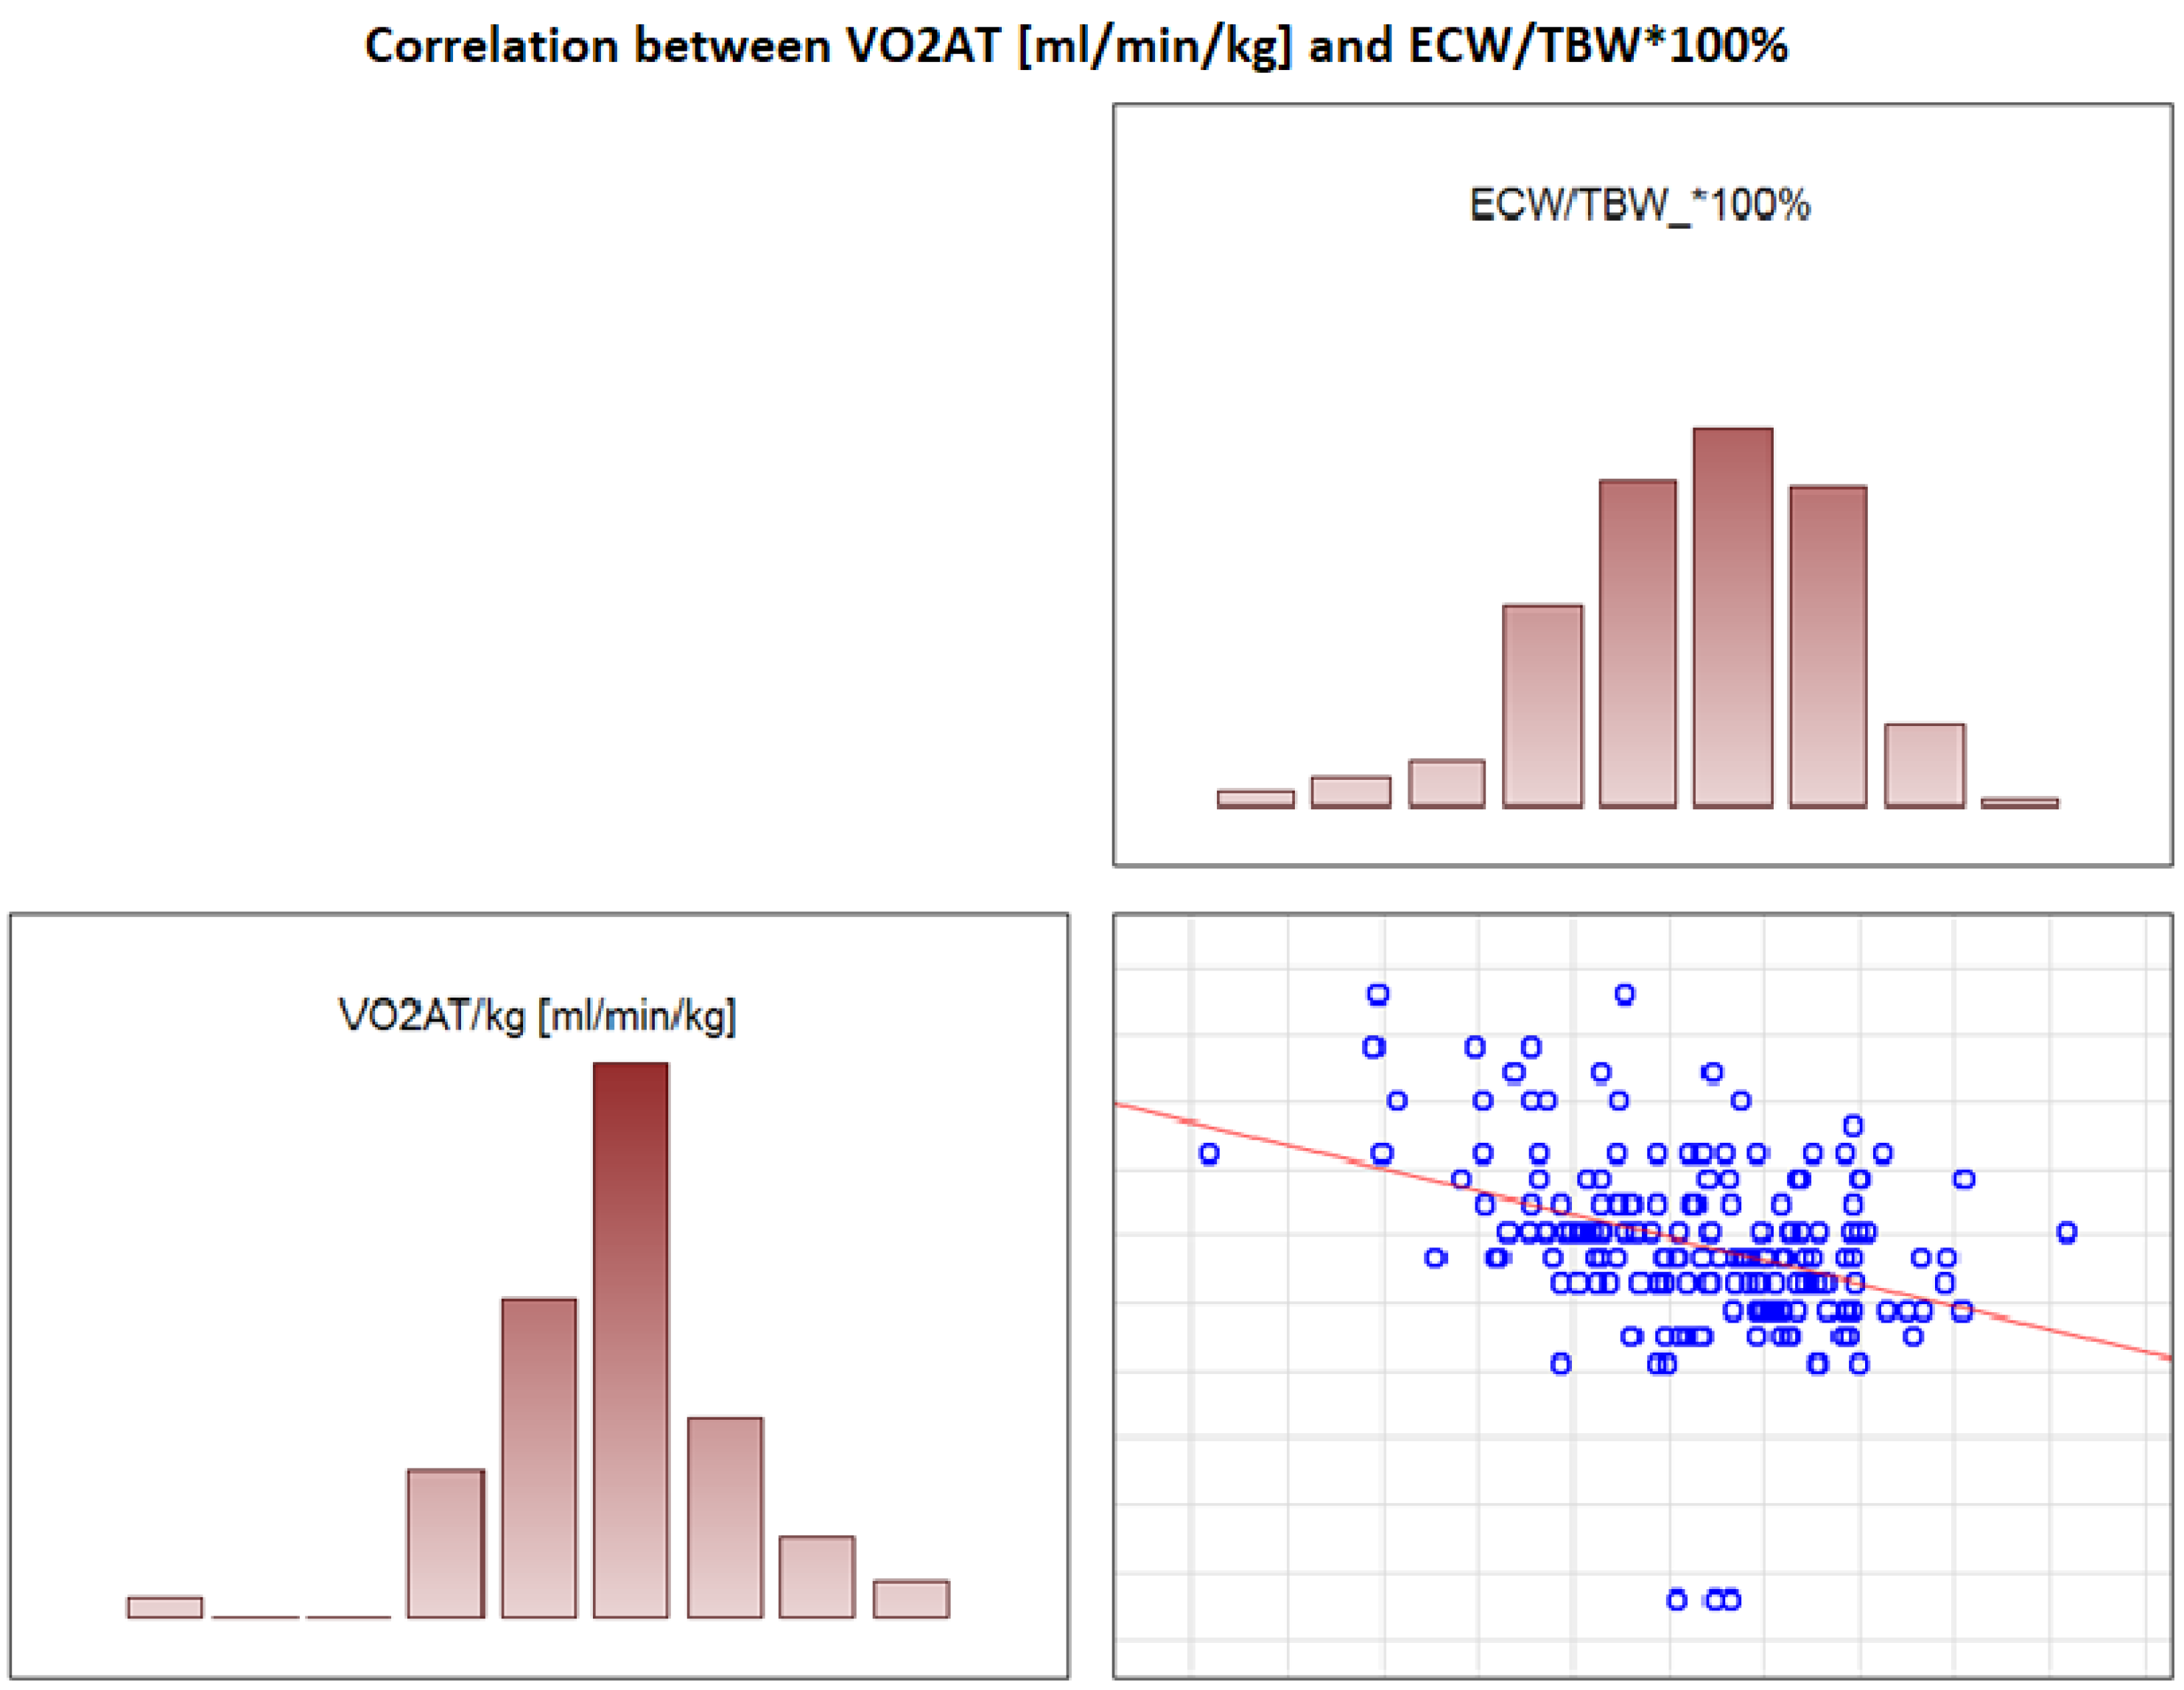
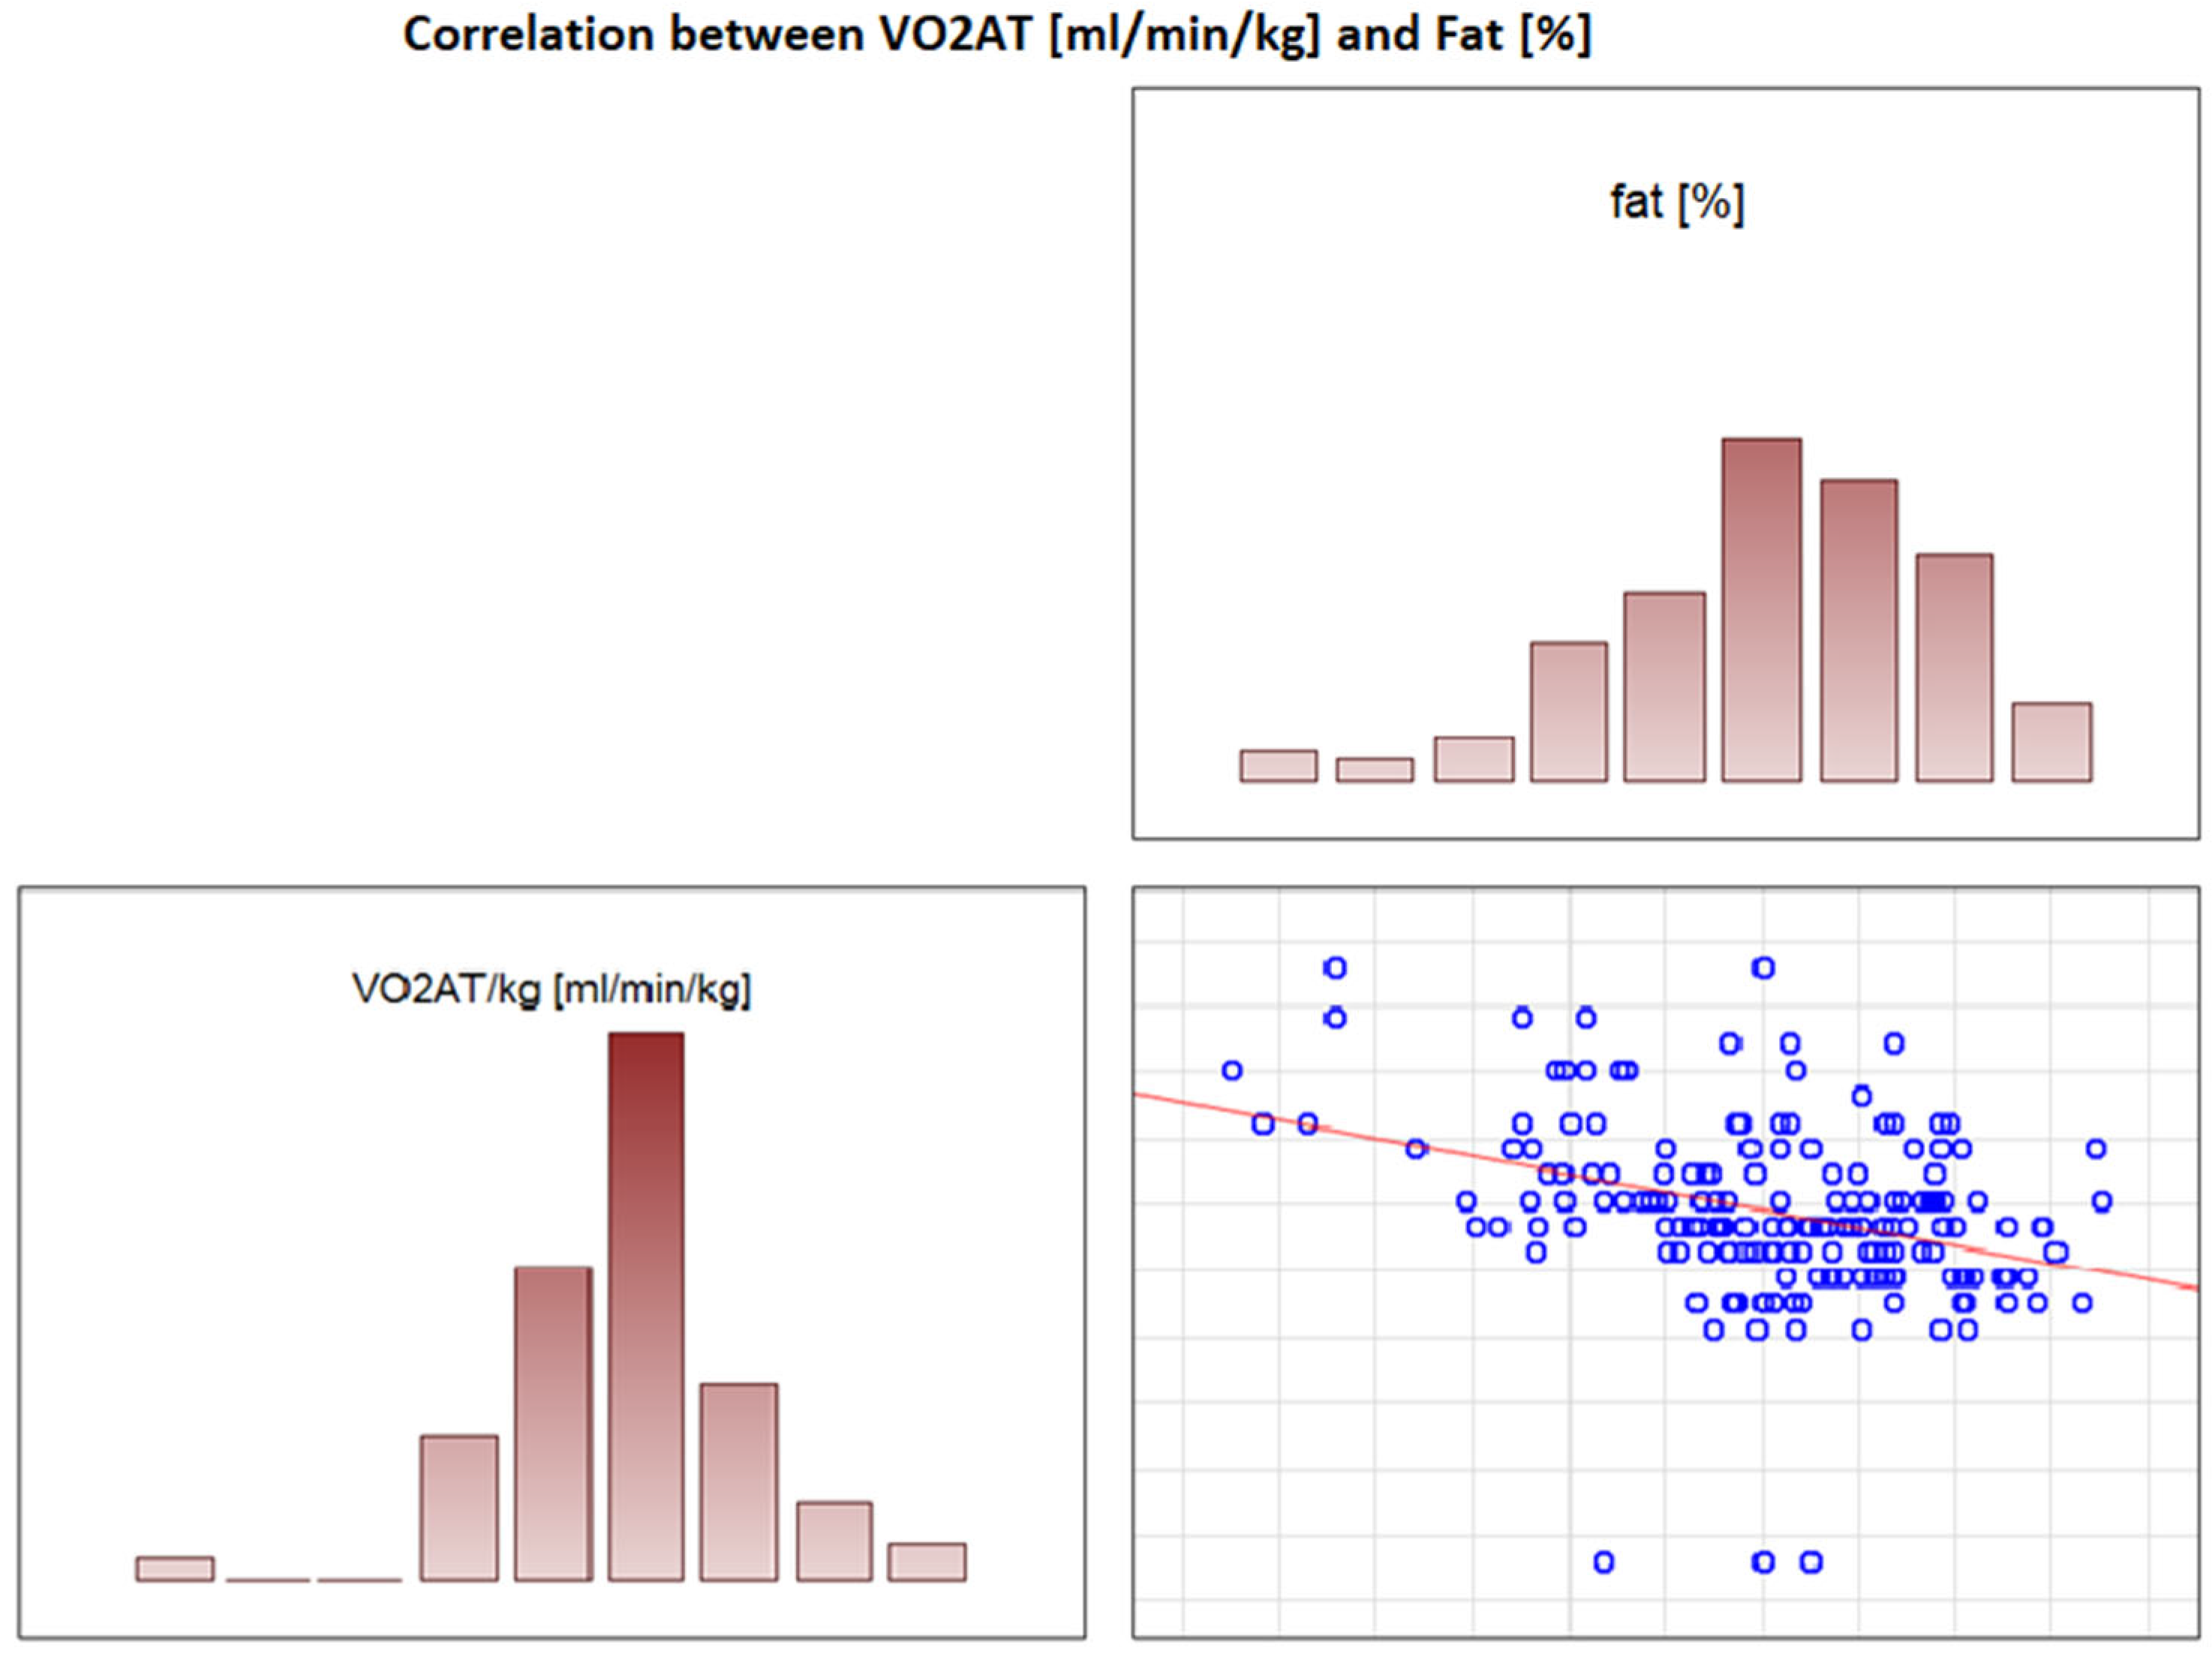
In the overall study population, VO2 AT (mL/kg/min) correlated positively with TBW (r = 0.4, p < 0.0001) (Figure 2) and ECW/TBW (r = 0.4, p < 0.00001) (Figure 3) and negatively with fat both in % and kg (r = −0.4, p < 0.0001 for both) (Figure 4 and Figure 5).
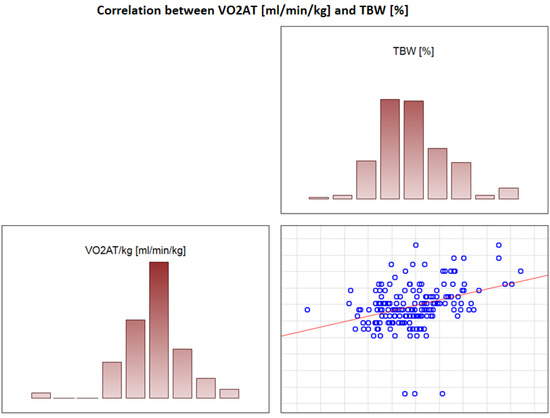
Figure 2.
Correlation between VO2 AT (mL/min/kg) and TBW (%).
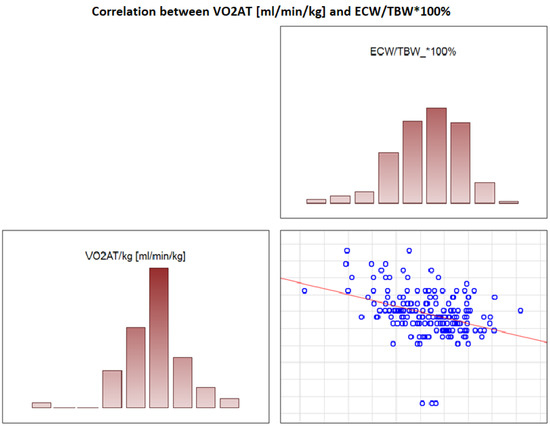
Figure 3.
Correlation between VO2 AT (mL/min/kg) and ECW/TBW*100%.

Figure 4.
Correlation between VO2 AT (mL/min/kg) and fat (%).
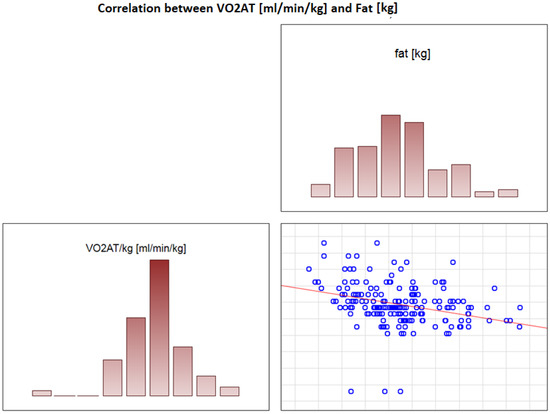
Figure 5.
Correlation between VO2 AT (mL/min/kg) and fat (kg).
In the obesity group, exercise time, peak VO2 and VO2 max correlated positively with VO2 AT (r = 0.55, p < 0.0001; r = 0.57, p < 0.0001 and r = 0.69; p < 0.0001, respectively). Results are shown in Table 6. In the group with BMI < 30 kg/m2, the same parameters (exercise time, peak VO2 and VO2 max) correlated positively with VO2 AT (r = 0.41, p < 0.0001; r = 0.43, p < 0.0001 and r = 0.72; p < 0.0001, respectively). Additionally TBW (%) and VO2 AT (r = 0.41, p < 0.0001) were positively correlated with VO2 AT (r = −0.4, p < 0.0001; r = −0.41, p < 0.0001), whereas fat (kg), fat (%) and ECW/TBW % were negatively correlated with VO2 AT (r = −0.44; p < 0.0001) in women without obesity (Table 7).
Table 6.
Correlations with VO2 AT/kg in patients with BMI ≥ 30 kg/m2.
Table 7.
Correlations with VO2 AT/kg in patients with BMI < 30 kg/m2.
4. Discussion
To the best of our knowledge, the presented study is the first analysis of hypertensive women considering the relations between hydration status and VO2 AT. In all study groups and women with BMI < 30 kg/m2, VO2 AT was correlated positively with total body water (in %) and ECW/TBW ratio and negatively correlated with fat (in % and kg). In obese women, total body water content (in % and kg) was significantly lower, and metabolic age was increased compared to counterparts. The ECW/TBW ratio is managed as an index of the extracellular volume status [29]. The ECW/TBW ratio has been identified in various studies as an indirect measure of overhydration. The relationship between body mass components and respiratory parameters in CPET was investigated in a study by Gruchała-Niedoszytko et al. The authors compared CPET and BIA results in two groups: obese and non-obese subjects. Obese patients achieved lower CPET results for the following factors: VO2 peak (p < 0.0001), respiratory exchange ratio (p < 0.014), oxygen uptake-to-work rate slope (VO2 WR) (p < 0.0004), anaerobic threshold heart rate (p < 0.0003) and VO2 AT (p < 0.0002). Significant differences were also observed in fat mass (p = 0.01), fat-free mass (p = 0.007), resting metabolic rate (RMR) (p = 0.007), total body water (p = 0.01) and extracellular water (p = 0.004) between the groups [30]. In another study, the influence of ECW/TBW and cardiovascular mortality and the connection with cardiac biomarkers in hemodialysis patients was explored [31]. The study included 60 participants, 28 of whom died during the study period. The main cause of death was cardiovascular events (43%). These patients had an increased post-dialysis ECW/TBW ratio (p = 0.006) compared to the survivors, whereas for cardiovascular mortality, the only important difference was an increased pre-dialysis ECW/TBW. The ability of post-dialysis ECW/TBW ratio to predict mortality had an area under the ROC curve (AUC) of 0.71 (95% CI, 0.57–0.81; p = 0.002).
A study by Zuo et al. indicated that among 95 patients who suffered from end-stage chronic kidney disease on peritoneal dialysis, the strongest correlation was noted between ECW/ICW and reduced exercise capacity (r = −0.63; p < 0.001) [32]. In another study, fluid volumes were observed to be higher in obese women, with increased expansion for the extracellular component [33].
Our next finding is that obese females had higher levels of high-sensitivity troponin. Laboratory studies indicate that myocardial injury related to the inflammatory effects of fatty tissue may be one path by which obesity leads to myocardial dysfunction and subsequent heart failure. In a study by Ndumele et al., the authors explored the relationship between obesity and cardiac troponin T measured with a new high-sensitivity assay (hs-cTnT) in 9507 participants. Investigators observed that high BMI is positively correlated with high hs-cTnT with an odds ratio of 2.20 (95% CI: 1.59–3.06) for high hs-cTnT after adjustment [34].
Obesity is independently affiliated with abnormal cardiac remodeling, as well as abnormalities in myocardial contractile function and relaxation. An increased level of epicardial adipose tissue can lead to abnormalities in heart structures (left ventricular enlargement, myocardial fibrosis and atrial inflammation), as well as hemodynamic disturbances [35].
The association between high BMI and decreased LV diastolic function was also described in the research of Russo et al. Their study included 950 subjects. In overweight participants, the risk of diastolic dysfunction was significantly higher (adjusted odds ratio: 1.52, 95% confidence interval: 1.04 to 2.22) in comparison to the control group. Analogous results were observed in obese patients compared to lean subjects (adjusted odds ratio: 1.60, 95% confidence interval: 1.06 to 2.41) [36].
In a study by Pascual et al., the authors explored the effect of isolated obesity on cardiac function in 48 obese and 25 lean women with no other disorders. Subclinical diastolic dysfunction was more frequent among obese participants (p = 0.002). Subclinical left ventricular diastolic dysfunction was present in isolated obesity an correlated with BMI [37].
Exercise capacity is a variable parameter that can be influenced by current health status, food and medications but mostly by physical training. Physical effort that uses the full power of aerobic changes (work with VO2 max) may take up to 5–8 min. Longer effort requires limitation of intensity in order to extend the work. Efforts that last longer (more than 30 min) are characterized by intensity below the anaerobic threshold level. Therefore, VO2 at the anaerobic threshold (VO2 AT) best represents actual performance.
Hulens et al. explored differences in exercise capacity between obese and lean women [38]. A total of 225 healthy obese and 81 normal-weight females were included. CPET was performed. In obese participants, VO2, achieved load, VE, RER, heart rate and perceived exertion at peak effort were significantly lower in comparison to the non-obese group (p = 0.0001). In another study by Gonze et al., the authors analyzed CPETs of 755 obese and 839 non-obese participants. Obese patients achieved the worst results in terms of most of the variables evaluated [39].
The results of multivariable analysis indicate a significant relationship between high body mass index, i.e., ≥30 kg/m2, and the following clinical parameters: fat (%) (OR: 1.49; 95% CI: 1.16–1.90; p = 0.002), HDL cholesterol (mg/dL) (OR: 0.94; 95% CI: 0.88–0.99; p = 0.045), peak VO2 max (L) (OR: 9266.68; 95% CI: 76.22–126,642.67; p < 0.001) and VO2 max (mL/min/kg) (OR: 0.51; 95% CI: 0.33–0.80; p = 0.003), which indicates the negative influence of obesity on exercise tolerance.
The findings of this study should be interpreted in light of some limitations, including the small study population (188 women). The cross-sectional design of this study precludes the opportunity to derive direct cause-and-effect risk associations. We only evaluated patients with mild or moderate arterial hypertension. The results should be carefully elucidated when applied to different populations with HA. The study design was limited with respect to evaluation of the effect of medications. Additionally, the study focused on patients who were capable of performing CPET. Moreover, an echocardiogram was assessed only at rest. These data should be interpreted with caution. Future studies in a larger HA population are therefore recommended.
5. Conclusions
Obesity negatively affects parameters of diastolic left ventricular function, as well as exercise tolerance in CPET. Oxygen uptake at anaerobic threshold correlates positively with total body water and ECW/TBW and correlates negatively with body fat; this connection is more pronounced in women without obesity.
Author Contributions
Conceptualization, A.B.-D. and K.G.; methodology, A.B.-D., K.J. and M.R.; software, A.S.; validation, A.B.-D. and K.G.; formal analysis, A.S.; investigation, K.J. and K.G.; resources, K.G.; data curation, A.B.-D., K.J., K.G. and M.R.; writing—original draft preparation, K.G.; writing—review and editing, A.B.-D.; visualization, M.B. and M.R.; supervision, M.B.; project administration, A.B.-D.; funding acquisition, A.B.-D. All authors have read and agreed to the published version of the manuscript.
Funding
This research was funded by Polish Mother’s Memorial Hospital Research Institute, grant number: PMMHRI-BCO.71/2020.
Institutional Review Board Statement
The study was conducted in accordance with the guidelines of the Declaration of Helsinki and was approved by the Ethics Committee of Polish Mother’s Memorial Hospital Research Institute (PMMHRI-BCO.71/2020).
Informed Consent Statement
Informed consent was obtained from all subjects involved in the study. Written informed consent was obtained from the patient(s) to publish this paper.
Data Availability Statement
Individual participant data that underlie the results reported in this article after deidentification (text, tables, figures and appendices), as well as study protocol, will be available for researchers who provide a methodologically sound proposal. Proposals may be submitted after 9 months and up to 36 months following article publication.
Conflicts of Interest
The authors declare no conflict of interest.
References
- NCD Risk Factor Collaboration. Trends in adult body-mass index in 200 countries from 1975 to 2014: A pooled analysis of 1698 population-based measurement studies with 19·2 million participants. Lancet 2016, 387, 1377–1396. [Google Scholar] [CrossRef] [Green Version]
- An, R. Health care expenses in relation to obesity and smoking among U.S. adults by gender, race/ethnicity, and age group: 1998–2011. Public Health 2015, 129, 29–36. [Google Scholar] [CrossRef] [PubMed]
- Chuda, A.; Banach, M.; Maciejewski, M.; Bielecka-Dabrowa, A. Role of confirmed and potential predictors of an unfavorable outcome in heart failure in everyday clinical practice. Ir. J. Med. Sci. 2022, 191, 213–227. [Google Scholar] [CrossRef] [PubMed]
- Paduszyńska, A.; Banach, M.; Maciejewski, M.; Dąbrowa, M.; Bielecka-Dąbrowa, A. The outcomes of hypertension treatment depending on gender in patients over 40 years of age. Prz. Menopauzalny 2020, 19, 174–178. [Google Scholar] [CrossRef]
- Milner, T.A.; Contoreggi, N.H.; Yu, F.; Johnson, M.A.; Wang, G.; Woods, C.; Mazid, S.; Van Kempen, T.A.; Waters, E.M.; McEwen, B.S.; et al. Estrogen Receptor β Contributes to Both Hypertension and Hypothalamic Plasticity in a Mouse Model of Peri-Menopause. J. Neurosci. 2021, 41, 5190–5205. [Google Scholar] [CrossRef] [PubMed]
- Marcus, Y.; Shefer, G.; Stern, N. Adipose tissue renin-angiotensin-aldosterone system (RAAS) and progression of insulin resistance. Mol. Cell. Endocrinol. 2013, 378, 1–14. [Google Scholar] [CrossRef] [PubMed]
- Bielecka-Dabrowa, A.; Bartlomiejczyk, M.A.; Sakowicz, A.; Maciejewski, M.; Banach, M. The Role of Adipokines in the Development of Arterial Stiffness and Hypertension. Angiology 2020, 71, 754–761. [Google Scholar] [CrossRef]
- Paduszyńska, A.; Sakowicz, A.; Banach, M.; Maciejewski, M.; Dąbrowa, M.; Bielecka-Dąbrowa, A. Cardioprotective properties of leptin in patients with excessive body mass. Ir. J. Med. Sci. 2020, 189, 1259–1265. [Google Scholar] [CrossRef] [PubMed] [Green Version]
- Rodriguez, A.; Becerril, S.; Ezquerro, S.; Mendez-Gimenez, L.; Fruhbeck, G. Cross-Talk between Adipokines and Myokines in Fat Browning. Acta Physiol. 2017, 219, 362–381. [Google Scholar] [CrossRef]
- Manna, P.; Jain, S.K. Obesity, Oxidative Stress, Adipose Tissue Dysfunction, and the Associated Health Risks: Causes and Therapeutic Strategies. Metab. Syndr. Relat. Disord. 2015, 13, 423–444. [Google Scholar] [CrossRef] [PubMed] [Green Version]
- Caprio, S.; Pierpont, B.; Kursawe, R. The “adipose tissue expandability” hypothesis: A potential mechanism for insulin resistance in obese youth. Horm. Mol. Biol. Clin. Investig. 2018, 33. [Google Scholar] [CrossRef] [PubMed]
- Tomlinson, D.J.; Erskine, R.M.; Morse, C.I.; Winwood, K.; Onambélé-Pearson, G. The impact of obesity on skeletal muscle strength and structure through adolescence to old age. Biogerontology 2016, 17, 467–483. [Google Scholar] [CrossRef] [PubMed] [Green Version]
- Smith, H.L.; Willius, F.A. Adiposity of the heart. Arch. Intern. Med. 1933, 52, 929–931. [Google Scholar] [CrossRef]
- Alpert, M.A. Obesity cardiomyopathy: Pathophysiology and evolution of the clinical syndrome. Am. J. Med. Sci. 2001, 321, 225. [Google Scholar] [CrossRef] [PubMed]
- Norton, G.R.; Majane, O.H.; Libhaber, E.; Maseko, M.J.; Makaula, S.; Libhaber, C.; Woodiwiss, A.J. The relationship between blood pressure and left ventricular mass index depends on an excess adiposity. J. Hypertens. 2009, 27, 1873. [Google Scholar] [CrossRef] [PubMed]
- Kim, C.H.; Wheatley, C.M.; Behnia, M.; Johnson, B.D. The Effect of Aging on Relationships between Lean Body Mass and VO2max in Rowers. PLoS ONE 2016, 11, e0160275. [Google Scholar] [CrossRef] [PubMed] [Green Version]
- Blümel, J.E.; Fica, J.; Chedraui, P.; Mezones-Holguin, E.; Zuñiga, M.C.; Witis, S.; Vallejo, M.S.; Tserotas, K.; Sánchez, H.; Onatra, W.; et al. Sedentary lifestyle in middle-aged women is associated with severe menopausal symptoms and obesity. Menopause 2016, 23, 488–493. [Google Scholar] [CrossRef]
- Tojal, L.; Alonso-Gómez, A.; Alberich, S.; Wärnberg, J.; Sorto, C.; Portillo, M.P.; Schröder, H.; Salas-Salvadó, J.; Arós, F. Association between maximal oxygen consumption and physical activity and sedentary lifestyle in metabolic syndrome. Usefulness of questionnaires. Rev. Esp. Cardiol. 2020, 73, 145–152. [Google Scholar] [CrossRef] [PubMed]
- WHO. Consultation on Obesity: Preventing and Managing the Global Epidemic; WHO Technical Report Series 894; World Health organization: Geneva, Switzerland, 2000. [Google Scholar]
- Saric, M.; Armour, A.C.; Arnaout, M.S.; Chaudhry, F.A.; Grimm, R.A.; Kronzon, I.; Landeck, B.F.; Maganti, K.; Michelena, H.I.; Tolstrup, K. Guidelines for the use of echocardiography in the evaluation of a cardiac source of embolism. J. Am. Soc. Echocardiogr. 2016, 29, 1–42. [Google Scholar] [CrossRef] [PubMed] [Green Version]
- Iwataki, M.; Takeuchi, M.; Otani, K.; Kuwaki, H.; Haruki, N.; Yoshitani, H.; Tamura, M.; Abe, H.; Otsuji, Y. Measurement of left atrial volume from transthoracic three-dimensional echocardiographic datasets using the biplane Simpson’s technique. J. Am. Soc. Echocardiogr. 2012, 25, 1319–1326. [Google Scholar] [CrossRef]
- Dhawan, I.; Makhija, N.; Choudhury, M.; Choudhury, A. Modified Tricuspid Annular Plane Systolic Excursion for Assessment of Right Ventricular Systolic Function. J. Cardiovasc. Imaging 2019, 27, 24–33. [Google Scholar] [CrossRef] [PubMed]
- Graham, B.L.; Steenbruggen, I.; Miller, M.R.; Barjaktarevic, I.Z.; Cooper, B.G.; Hall, G.L.; Hallstrand, T.S.; Kaminsky, D.A.; McCarthy, K.; McCormack, M.C.; et al. Standardization of Spirometry 2019 Update. An Official American Thoracic Society and European Respiratory Society Technical Statement. Am. J. Respir. Crit. Care Med. 2019, 200, 70–88. [Google Scholar] [CrossRef] [PubMed]
- Malhotra, R.; Bakken, K.; D’Elia, E.; Lewis, G.D. Cardiopulmonary Exercise Testing in Heart Failure. JACC Heart Fail. 2016, 4, 607–616. [Google Scholar] [CrossRef] [PubMed]
- Martin, J.S.; Borges, A.R.; Christy, J.B. Considerations for SphygmoCor radial artery pulse wave analysis: Side selection and peripheral arterial blood pressure calibration. Hypertens. Res. 2015, 38, 75–83. [Google Scholar] [CrossRef] [PubMed]
- Pichler, G.; Martinez, F.; Vicente, A.; Solaz, E.; Calaforra, O.; Redon, J. Pulse pressure amplification and its determinants. Blood Press. 2016, 25, 21–27. [Google Scholar] [CrossRef]
- Rajzer, M.W.; Wojciechowska, W.; Klocek, M.; Palka, I.; Brzozowska-Kiszka, M.; Kawecka-Jaszcz, K. Comparison of aortic pulse wave velocity measured by three techniques: Complior, SphygmoCor and Arteriograph. J. Hypertens. 2008, 26, 2001–2007. [Google Scholar] [CrossRef] [PubMed]
- Marra, M.; Sammarco, R.; De Lorenzo, A.; Iellamo, F.; Siervo, M.; Pietrobelli, A.; Donini, L.M.; Santarpia, L.; Cataldi, M.; Pasanisi, F.; et al. Assessment of Body Composition in Health and Disease Using Bioelectrical Impedance Analysis (BIA) and Dual Energy X-ray Absorptiometry (DXA): A Critical Overview. Contrast Media Mol. Imaging 2019, 2019, 3548284. [Google Scholar] [CrossRef] [PubMed]
- Park, I.; Lee, J.H.; Jang, D.H.; Kim, J.; Hwang, B.R.; Kim, S.; Lee, J.E.; Jo, Y.H. Assessment of body water distribution in patients with sepsis during fluid resuscitation using multi-frequency direct segmental bioelectrical impedance analysis. Clin. Nutr. 2020, 39, 1826–1831. [Google Scholar] [CrossRef] [PubMed]
- Gruchała-Niedoszytko, M.; Niedoszytko, P.; Kaczkan, M.; Pieszko, M.; Gierat-Haponiuk, K.; Śliwińska, A.; Skotnicka, M.; Szalewska, D.; Małgorzewicz, S. Cardiopulmonary exercise test and bioimpedance as prediction tools to predict the outcomes of obesity treatment. Pol. Arch. Intern. Med. 2019, 129, 225–233. [Google Scholar] [CrossRef]
- Pérez-Morales, R.; Donate-Correa, J.; Martín-Núñez, E.; Pérez-Delgado, N.; Ferri, C.; López-Montes, A.; Jiménez-Sosa, A.; Navarro-González, J.F. Extracellular water/total body water ratio as predictor of mortality in hemodialysis patients. Ren. Fail. 2021, 43, 821–829. [Google Scholar] [CrossRef]
- Zuo, M.L.; Yue, W.S.; Yip, T.; Ng, F.; Lam, K.F.; Yiu, K.H.; Lui, S.L.; Tse, H.F.; Siu, C.W.; Lo, W.K. Prevalence of and associations with reduced exercise capacity in peritoneal dialysis patients. Am. J. Kidney Dis. 2013, 62, 939–946. [Google Scholar] [CrossRef] [PubMed]
- Waki, M.; Kral, J.G.; Mazariegos, M.; Wang, J.; Pierson, R.N., Jr.; Heymsfield, S.B. Relative expansion of extracellular fluid in obese vs. nonobese women. Am. J. Physiol. 1991, 261 Pt 1, 199–203. [Google Scholar] [CrossRef] [PubMed]
- Ndumele, C.E.; Coresh, J.; Lazo, M.; Hoogeveen, R.; Blumenthal, R.S.; Folsom, A.R.; Selvin, E.; Ballantyne, C.M.; Nambi, V. Obesity, subclinical myocardial injury, and incident heart failure. JACC Heart Fail. 2014, 2, 600–607. [Google Scholar] [CrossRef] [PubMed]
- Deng, H.; Shantsila, A.; Guo, P.; Potpara, T.S.; Zhan, X.; Fang, X.; Liao, H.; Liu, Y.; Wei, W.; Fu, L.; et al. A U-shaped relationship of body mass index on atrial fibrillation recurrence post ablation: A report from the Guangzhou atrial fibrillation ablation registry. eBioMedicine 2018, 35, 40–45. [Google Scholar] [CrossRef] [Green Version]
- Russo, C.; Jin, Z.; Homma, S.; Rundek, T.; Elkind, M.S.; Sacco, R.L.; Di Tullio, M.R. Effect of obesity and overweight on left ventricular diastolic function: A community-based study in an elderly cohort. J. Am. Coll. Cardiol. 2011, 57, 1368–1374. [Google Scholar] [CrossRef] [PubMed] [Green Version]
- Pascual, M.; Pascual, D.A.; Soria, F.; Vicente, T.; Hernández, A.M.; Tébar, F.J.; Valdés, M. Effects of isolated obesity on systolic and diastolic left ventricular function. Heart 2003, 89, 1152–1156. [Google Scholar] [CrossRef] [PubMed] [Green Version]
- Hulens, M.; Vansant, G.; Lysens, R.; Claessens, A.L.; Muls, E. Exercise capacity in lean versus obese women. Scand. J. Med. Sci. Sports 2001, 11, 305–309. [Google Scholar] [CrossRef] [PubMed]
- Gonze, B.B.; Ostolin, T.L.V.D.P.; Barbosa, A.C.B.; Matheus, A.C.; Sperandio, E.F.; Gagliardi, A.R.T.; Arantes, R.L.; Romiti, M.; Dourado, V.Z. Dynamic physiological responses in obese and non-obese adults submitted to cardiopulmonary exercise test. PLoS ONE 2021, 16, e0255724. [Google Scholar] [CrossRef]


Publisher’s Note: MDPI stays neutral with regard to jurisdictional claims in published maps and institutional affiliations. |
© 2022 by the authors. Licensee MDPI, Basel, Switzerland. This article is an open access article distributed under the terms and conditions of the Creative Commons Attribution (CC BY) license (https://creativecommons.org/licenses/by/4.0/).