
Photocatalytic and Antibacterial Properties of Doped TiO2 Nanopowders Synthesized by Sol−Gel Method
 , , , ,
Abstract
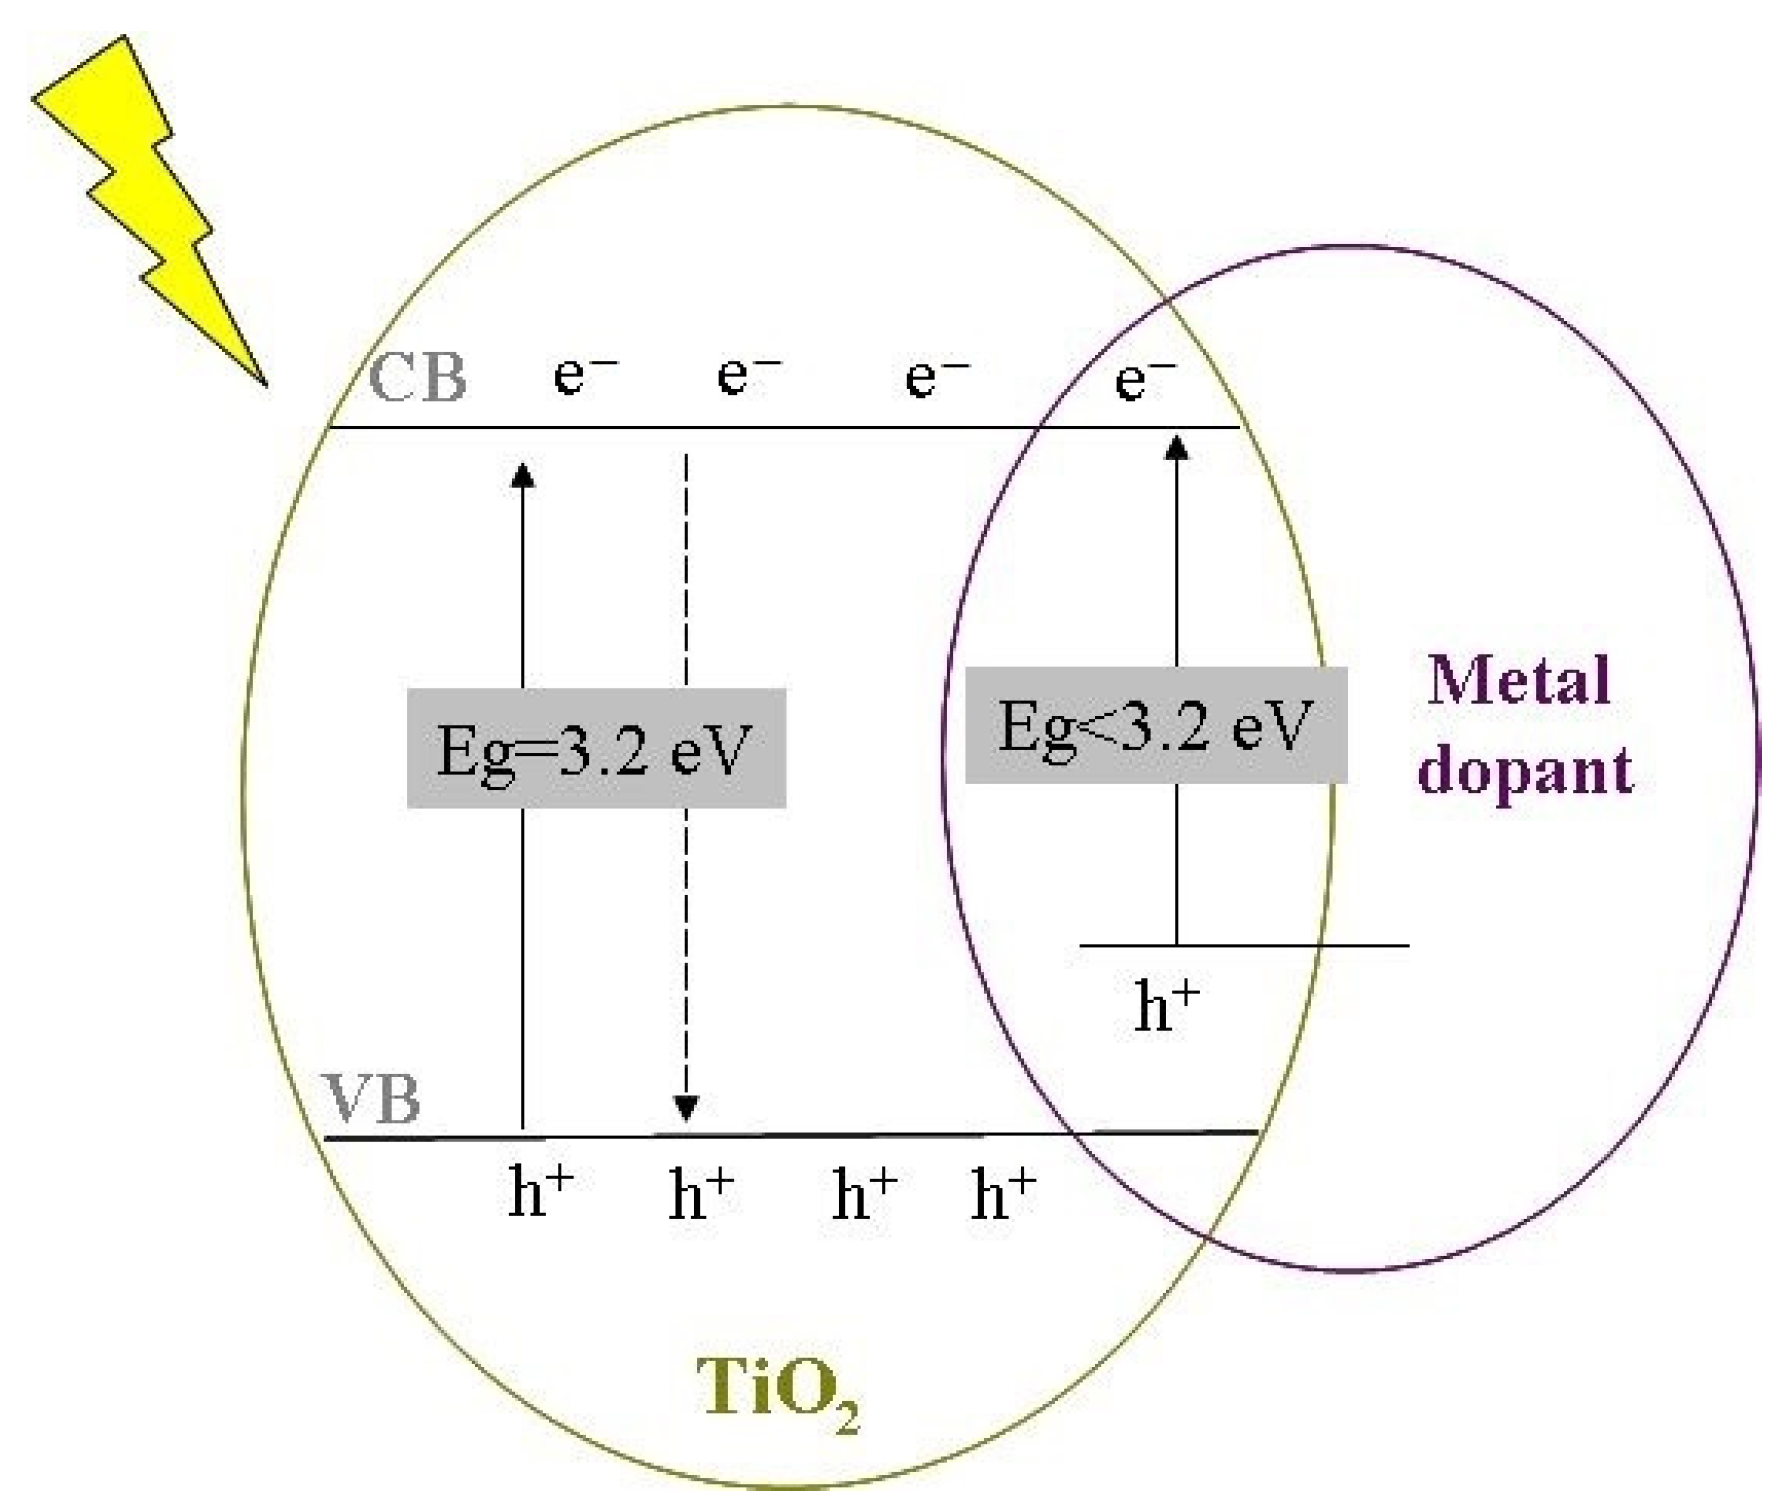
:1. Introduction
2. Results and Discussion
2.1. As Prepared Samples
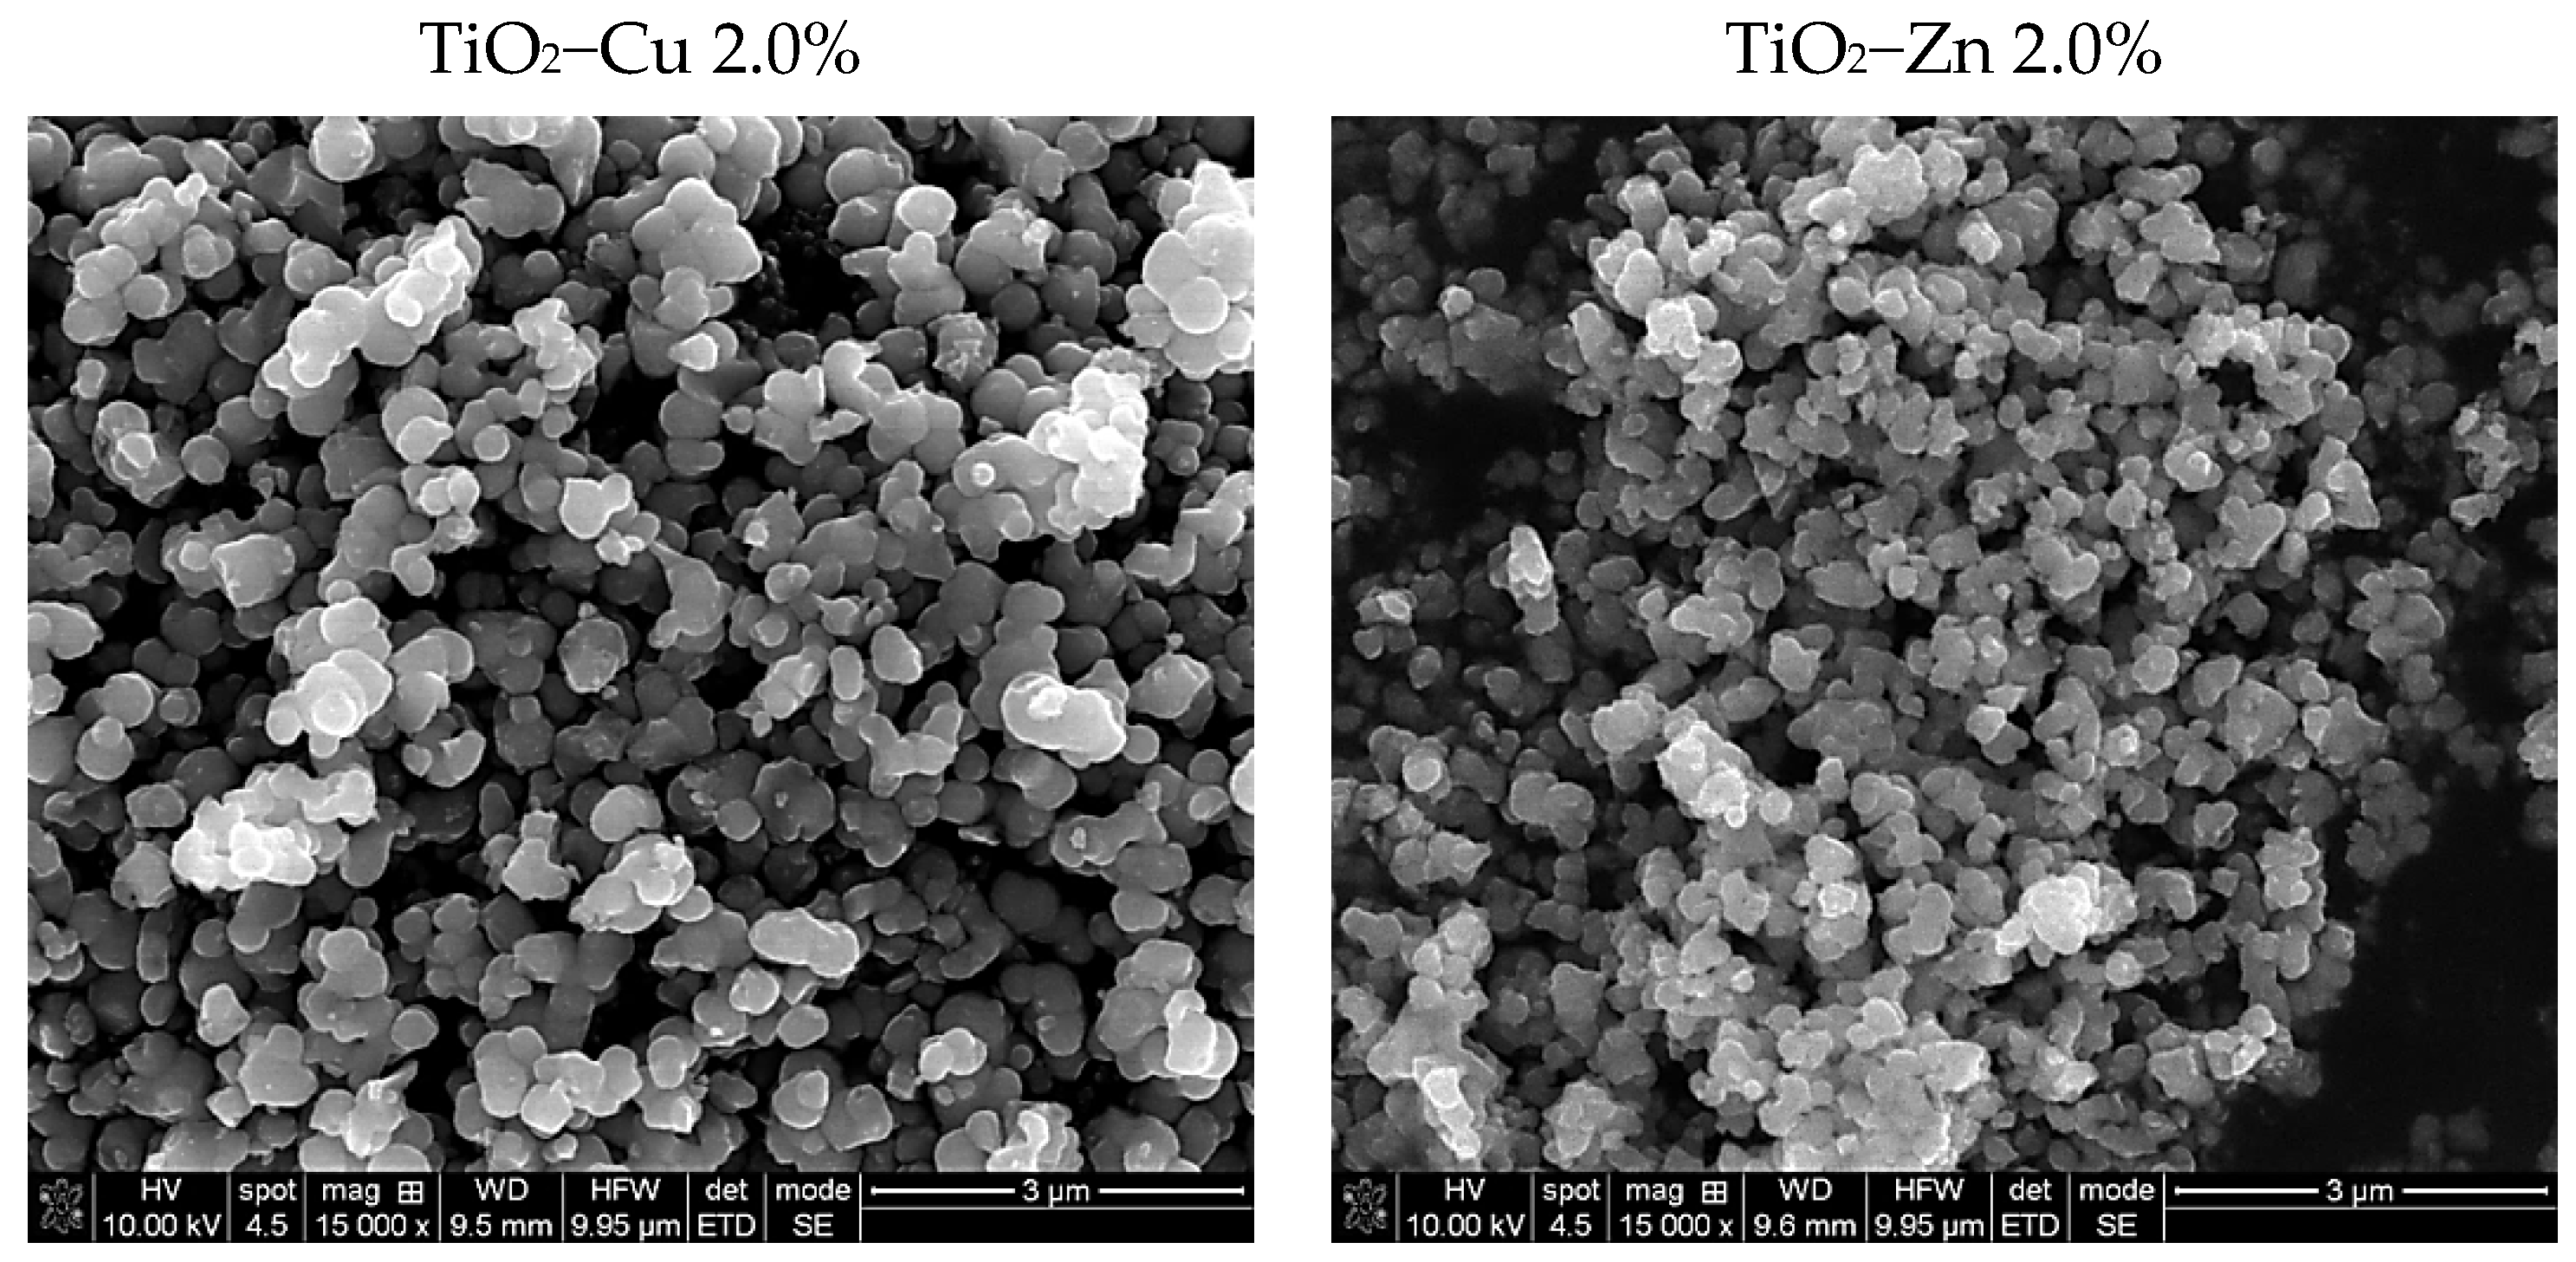
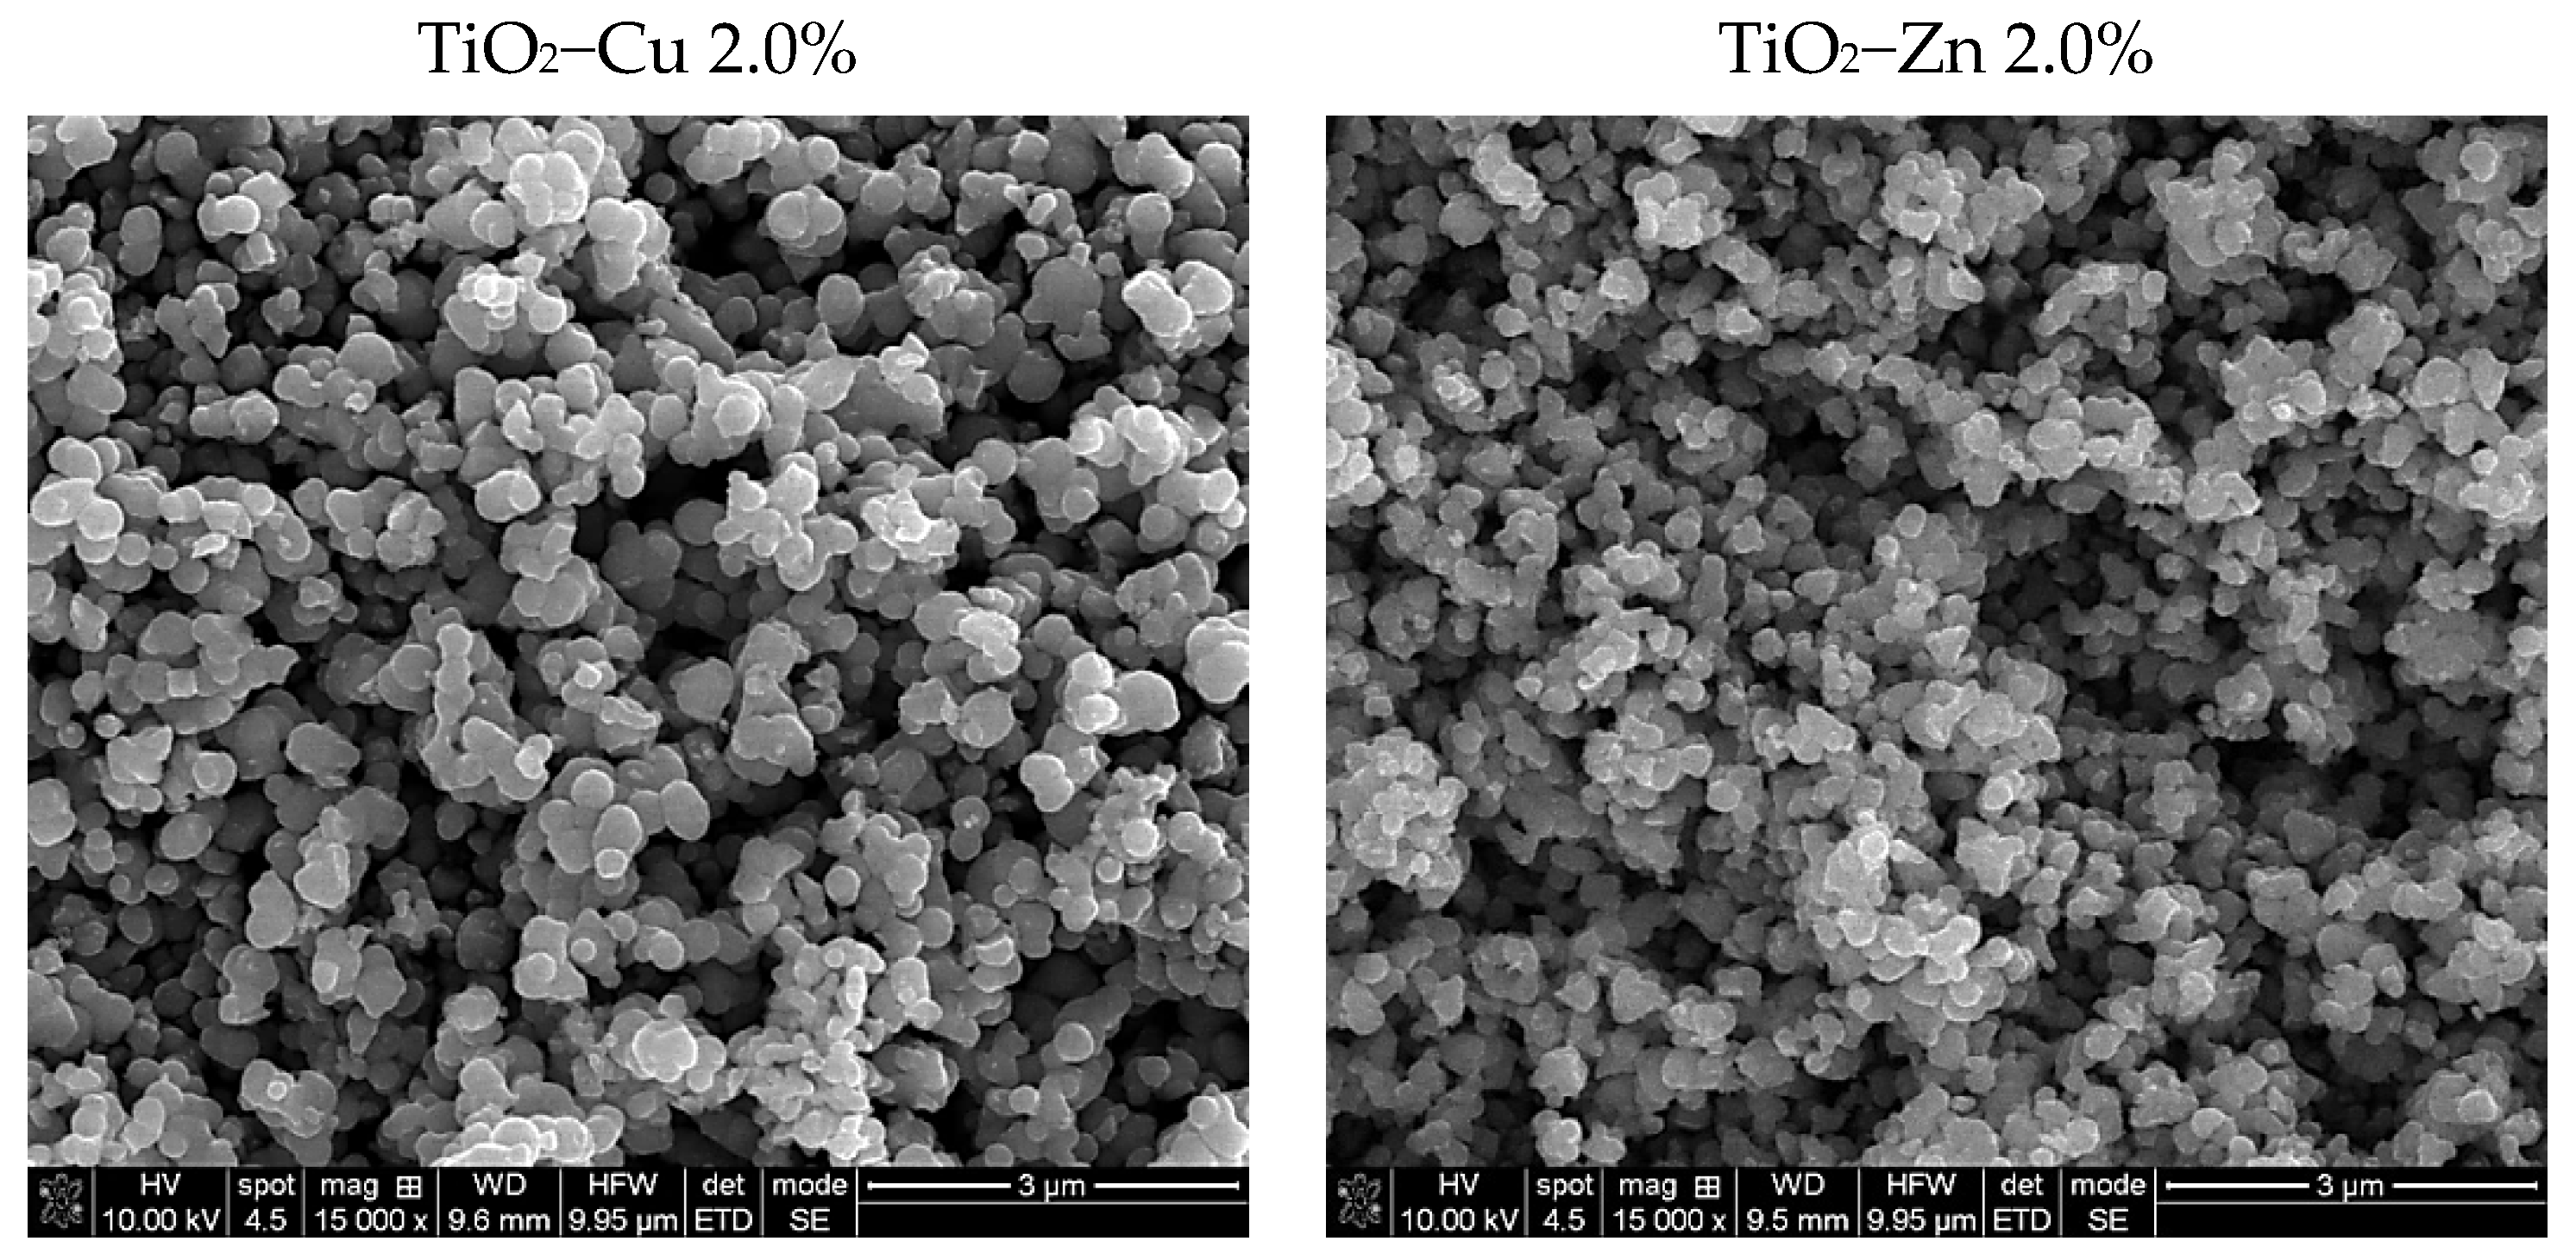
2.1.1. SEM Results
2.1.2. Thermal Behaviour
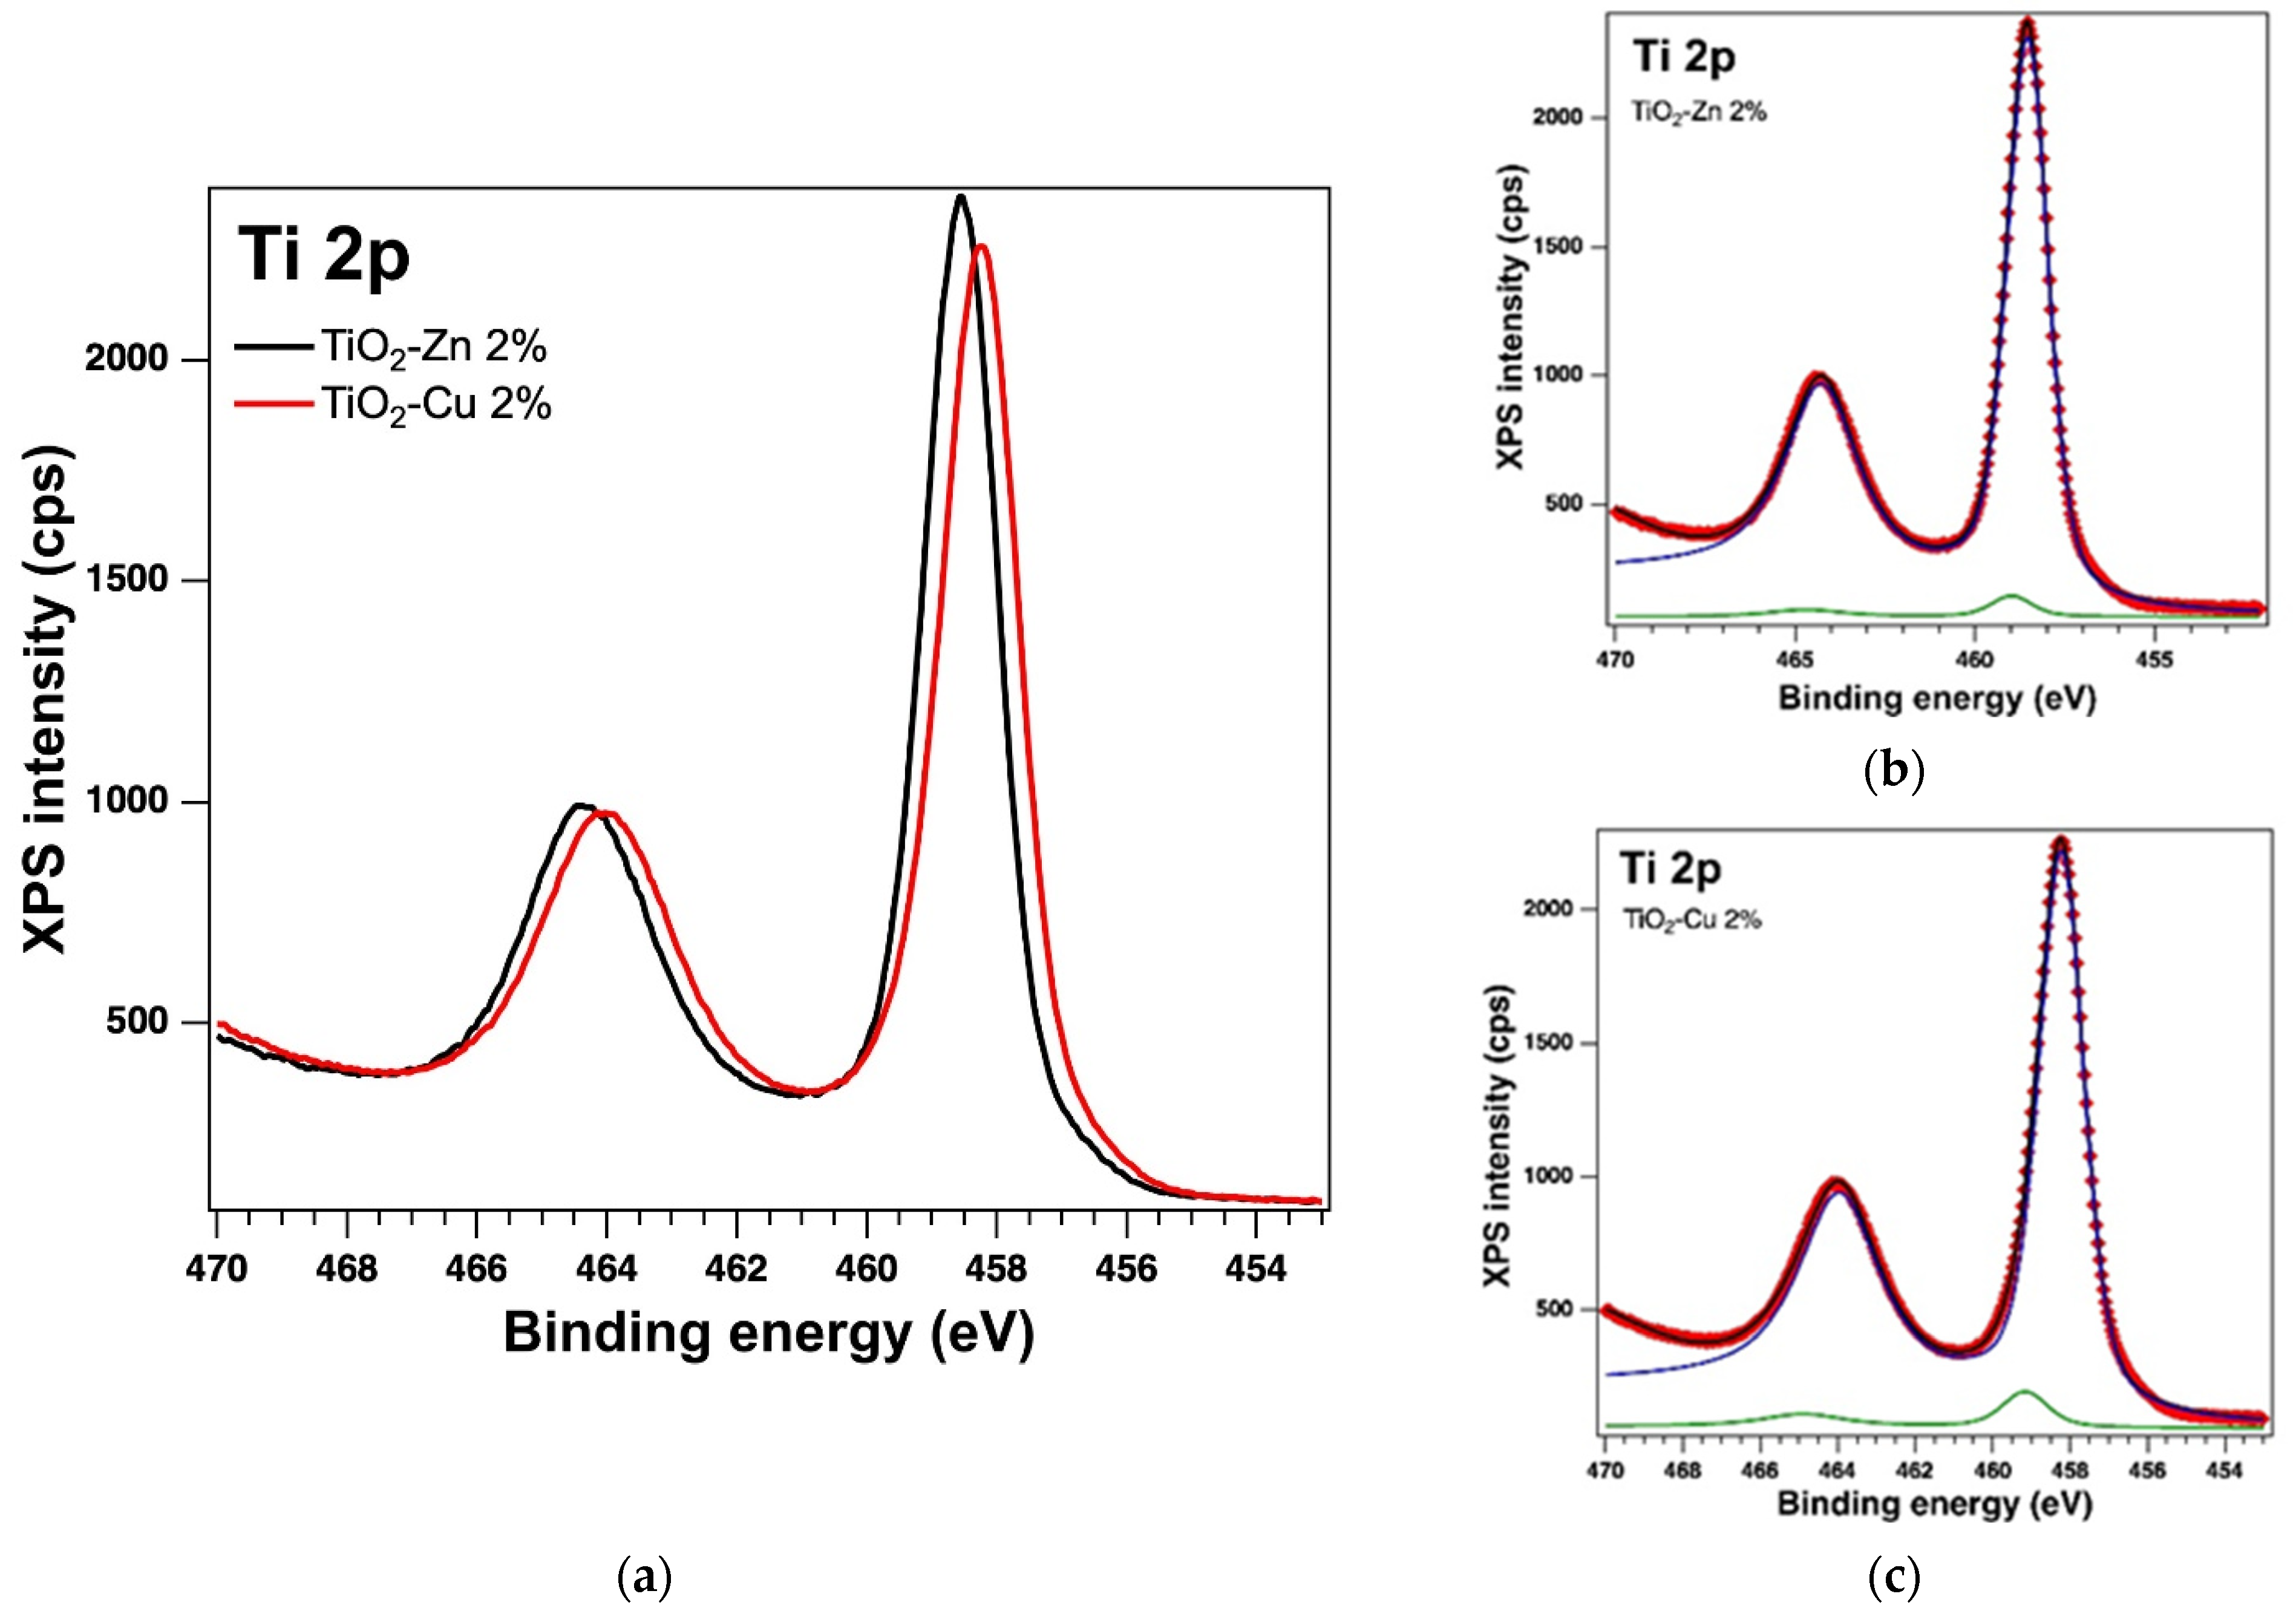
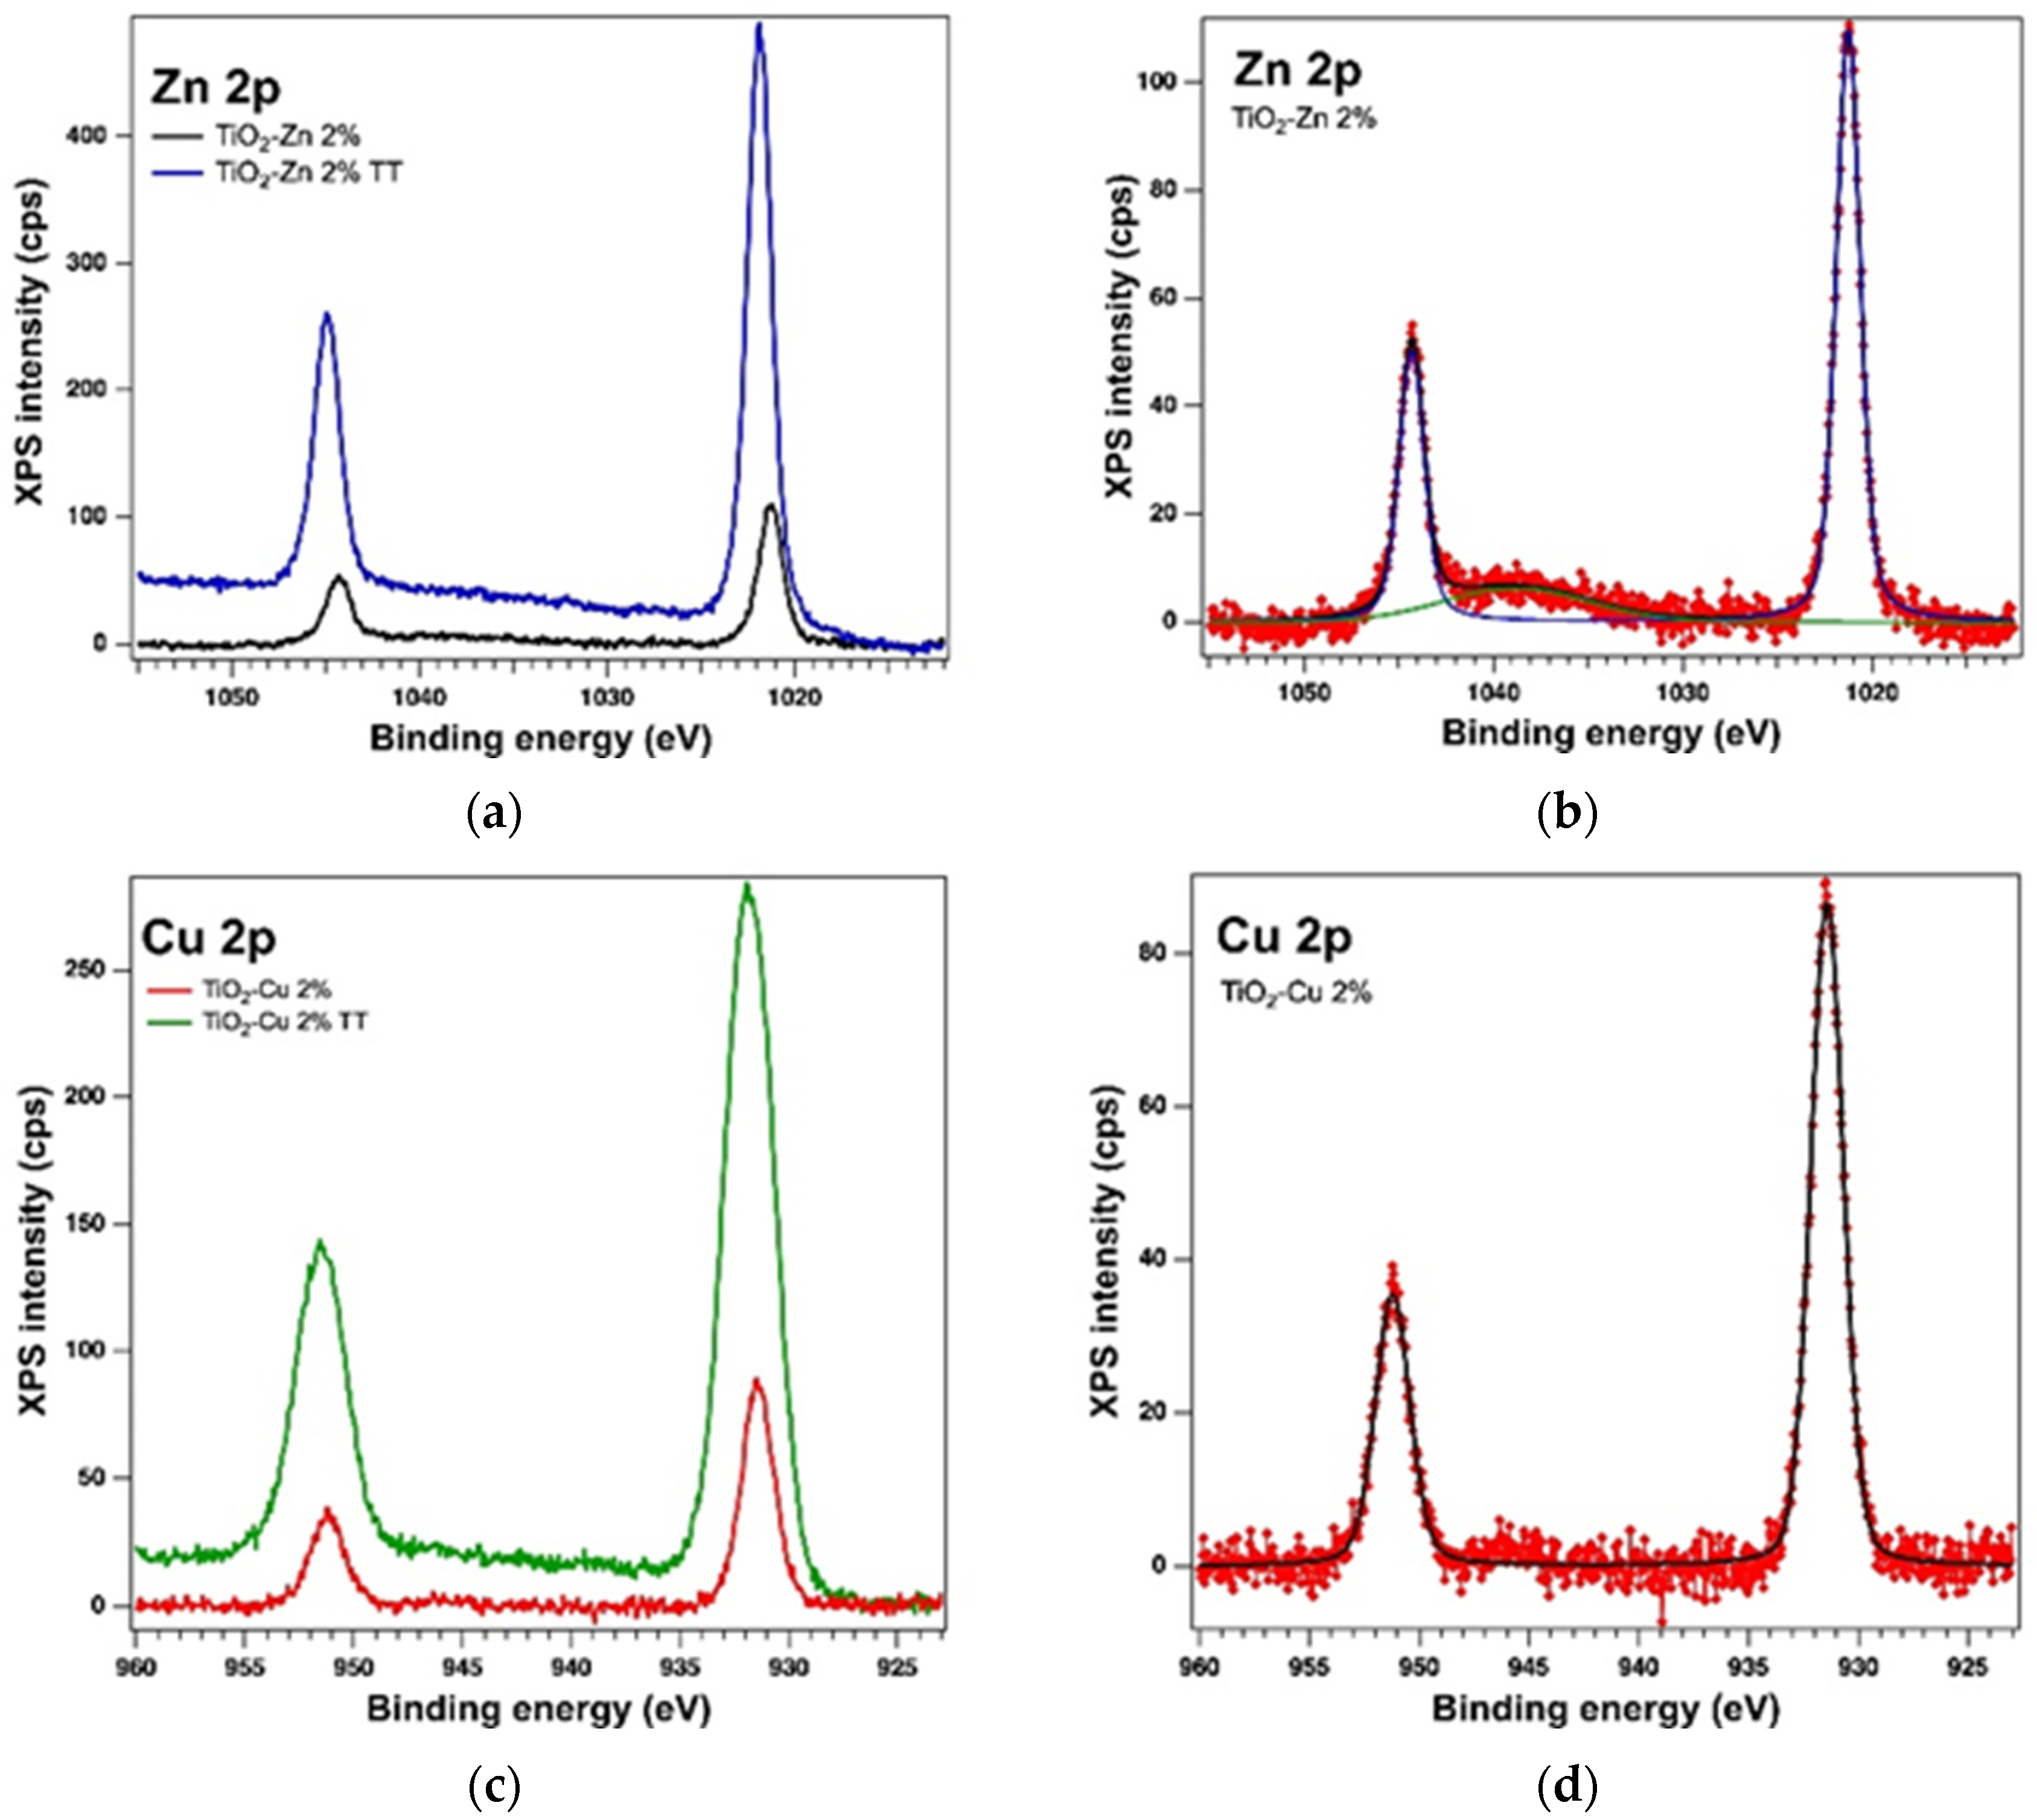
2.1.3. XPS on the As-Prepared Samples
2.2. Thermally Treated Samples (Powders)
2.2.1. SEM Results
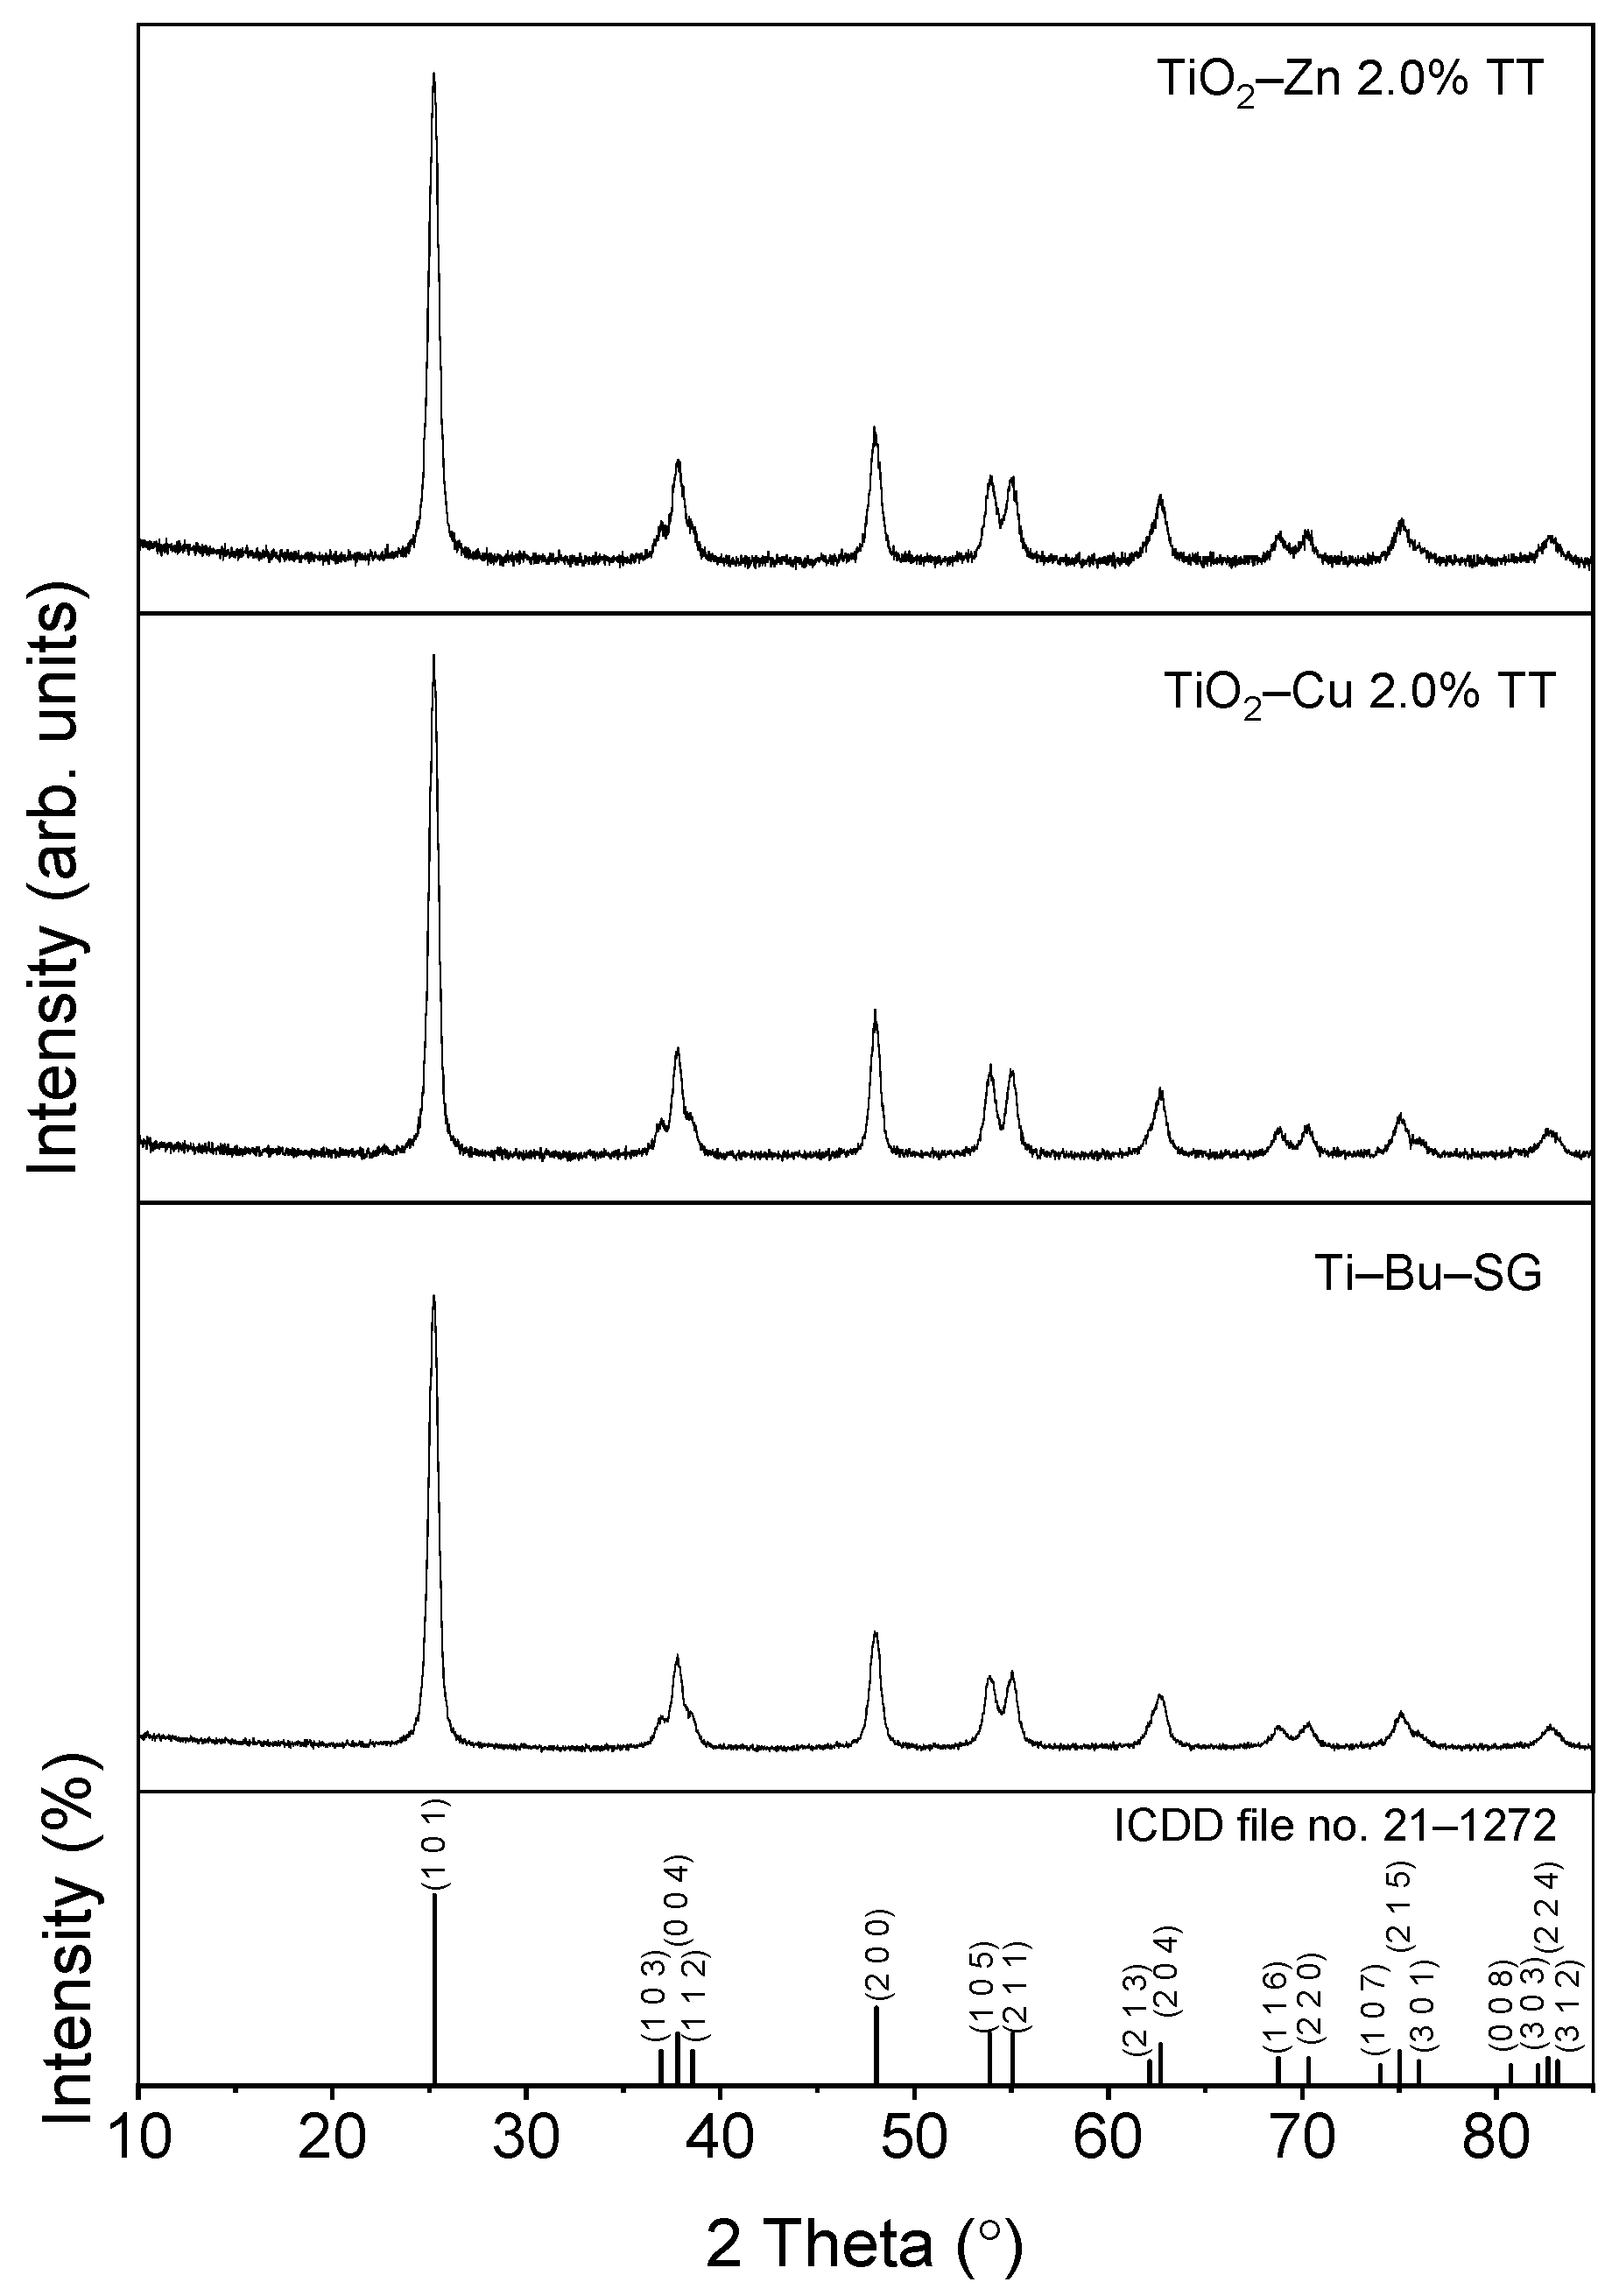
2.2.2. X−ray Diffraction (XRD)
2.2.3. X−ray Fluorescence (XRF)
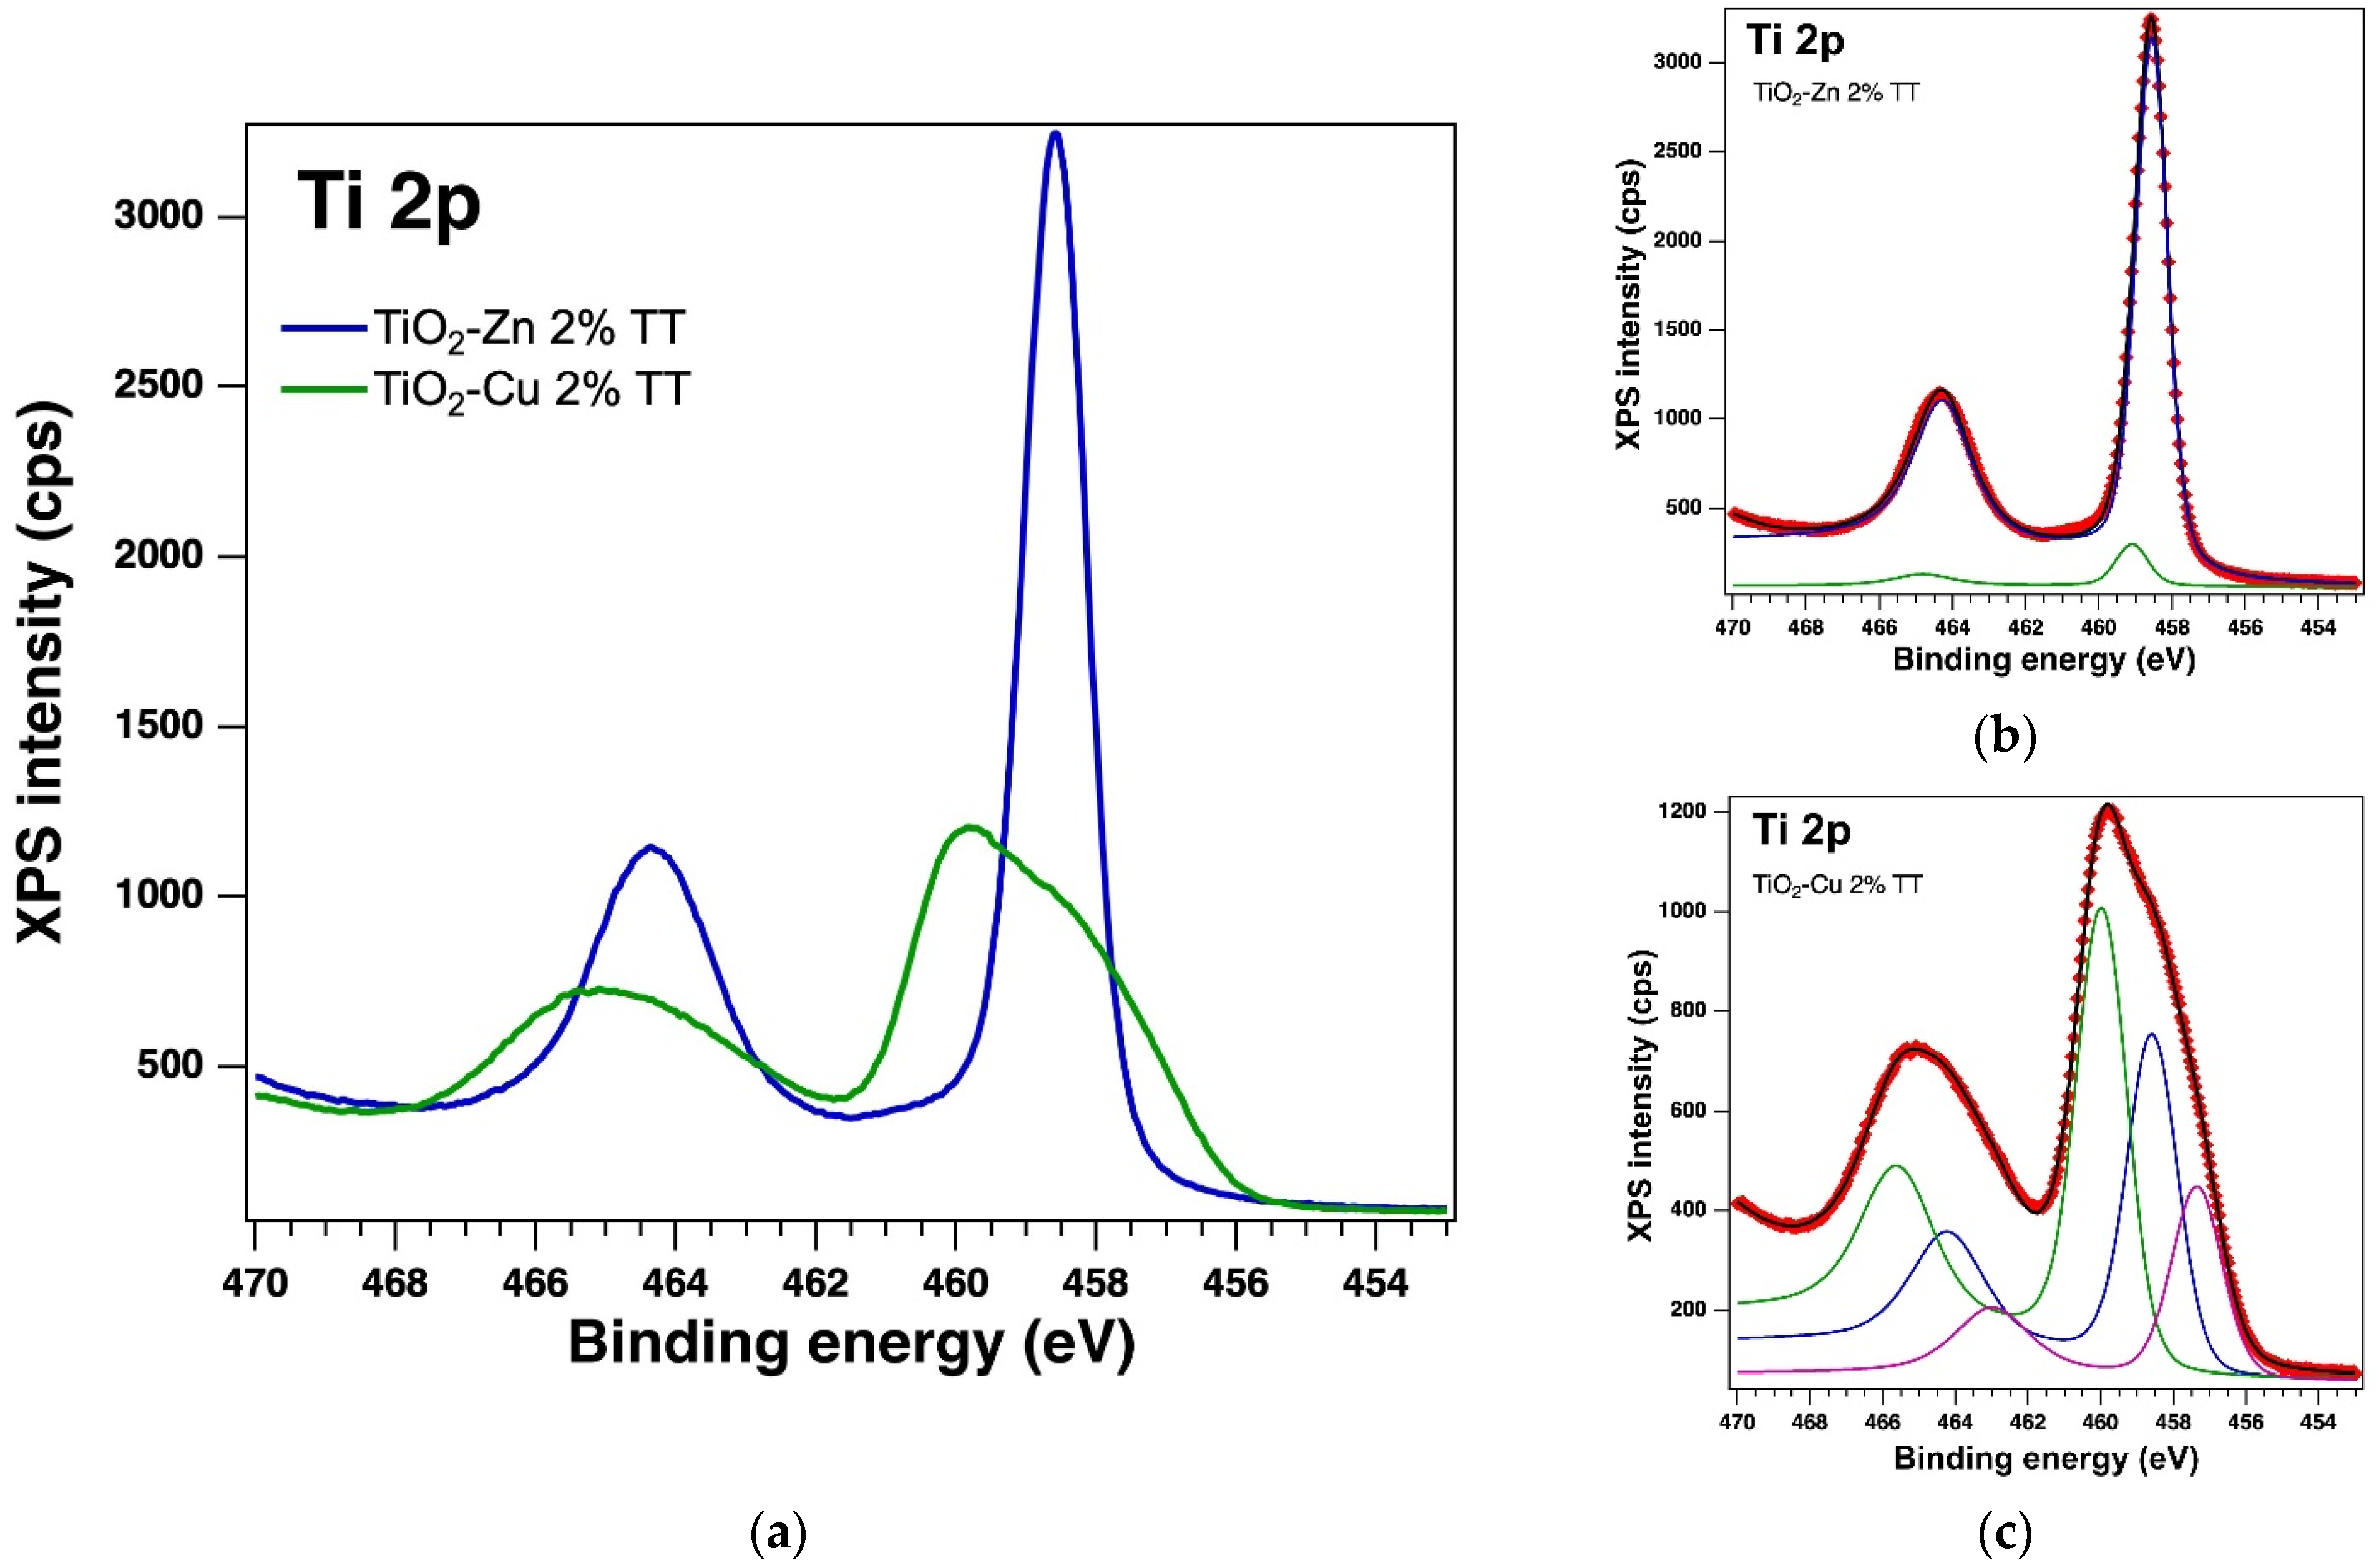
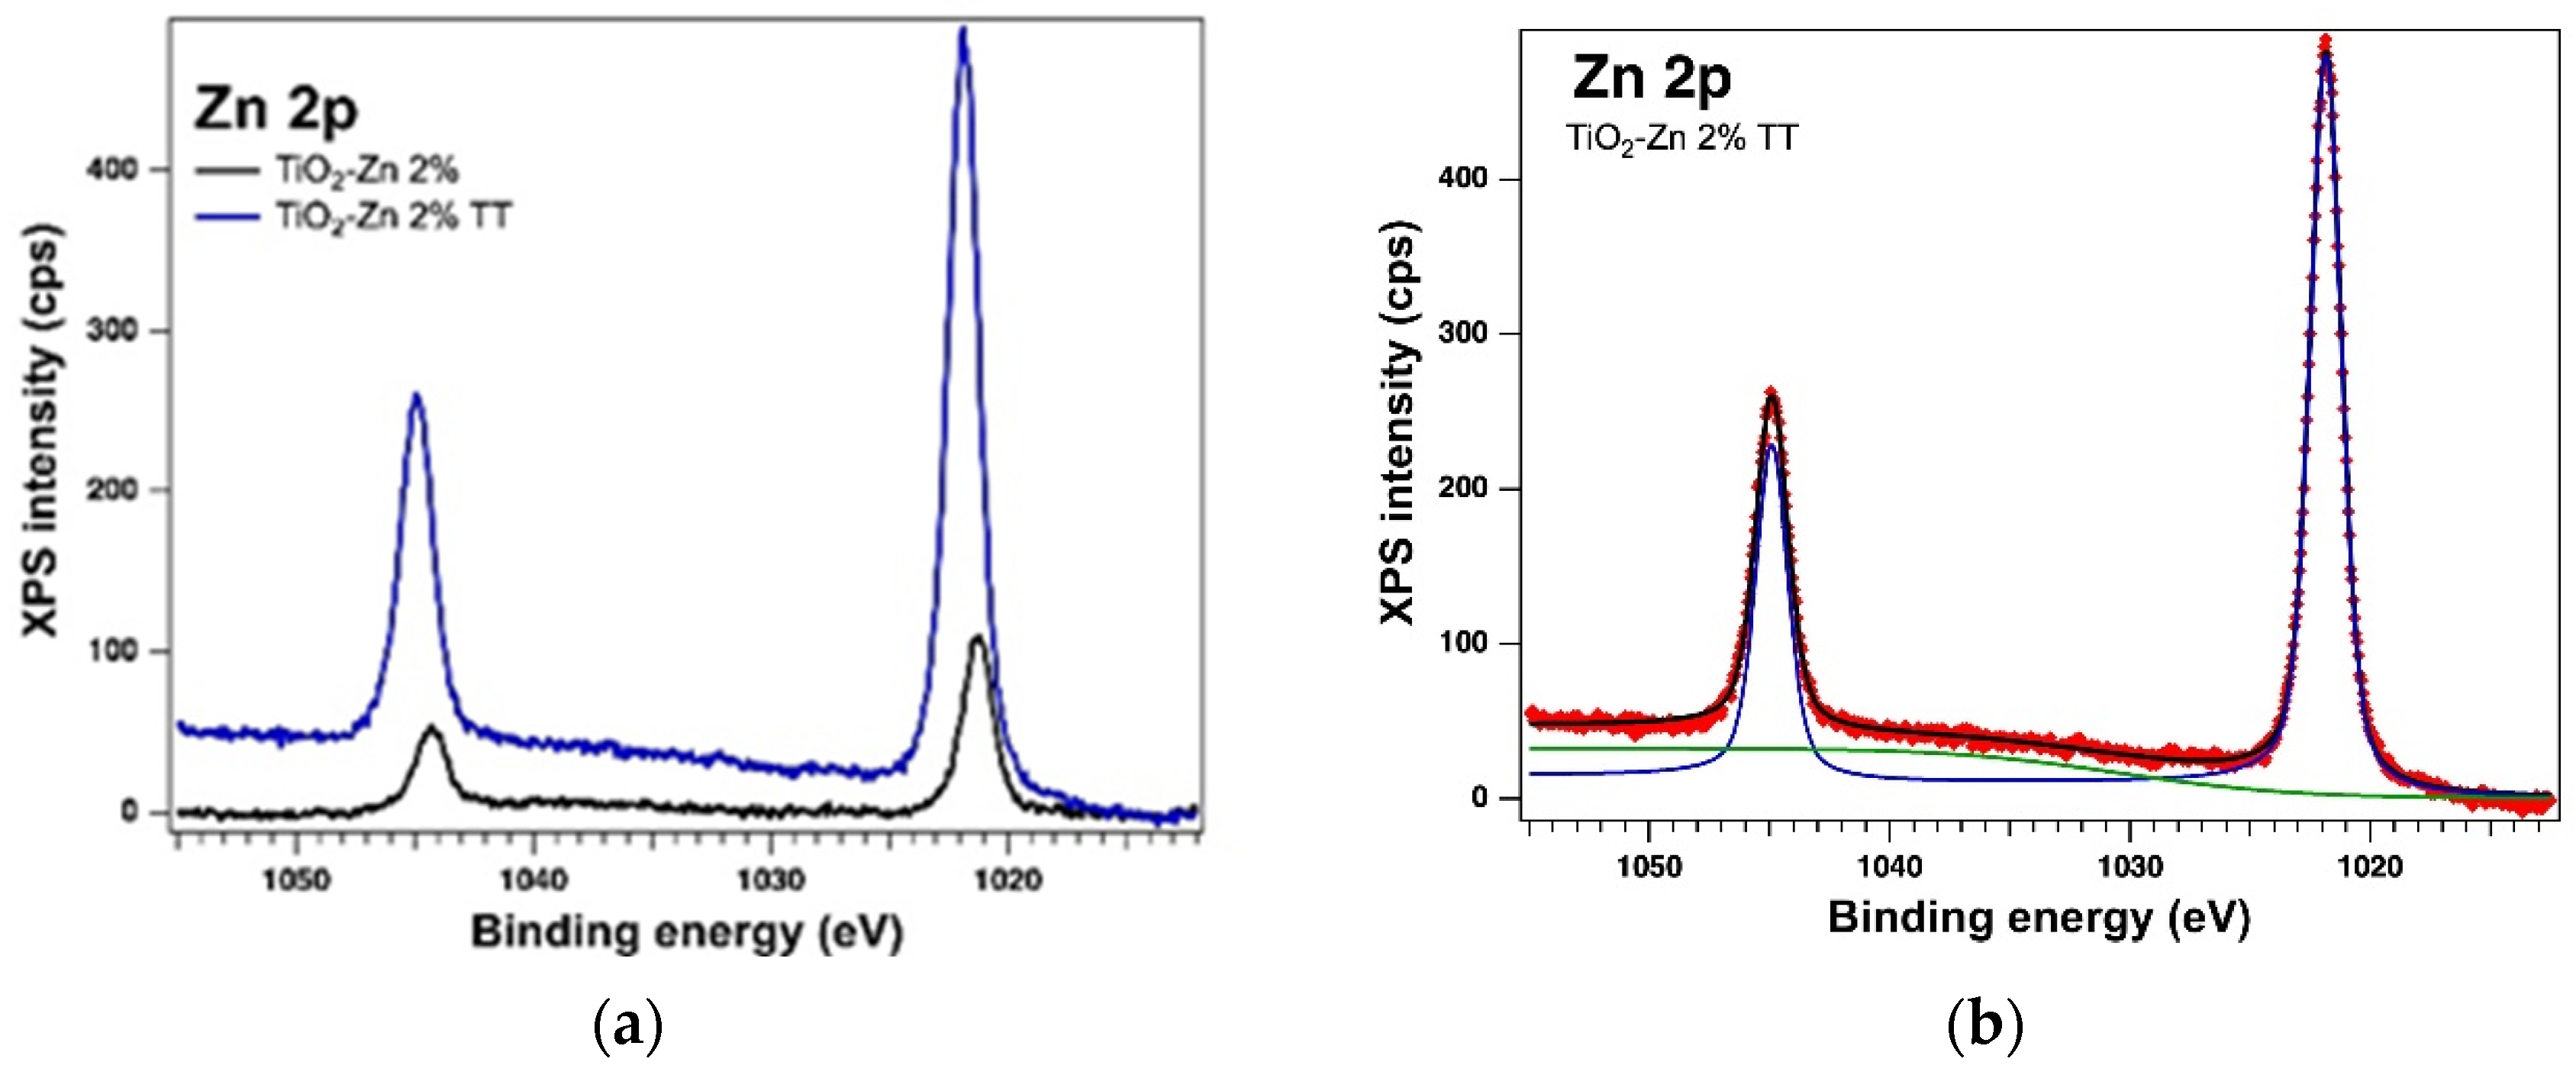
2.2.4. XPS on the Thermally Treated Samples
2.2.5. Antibacterial Activity
2.2.6. Textural Characterization
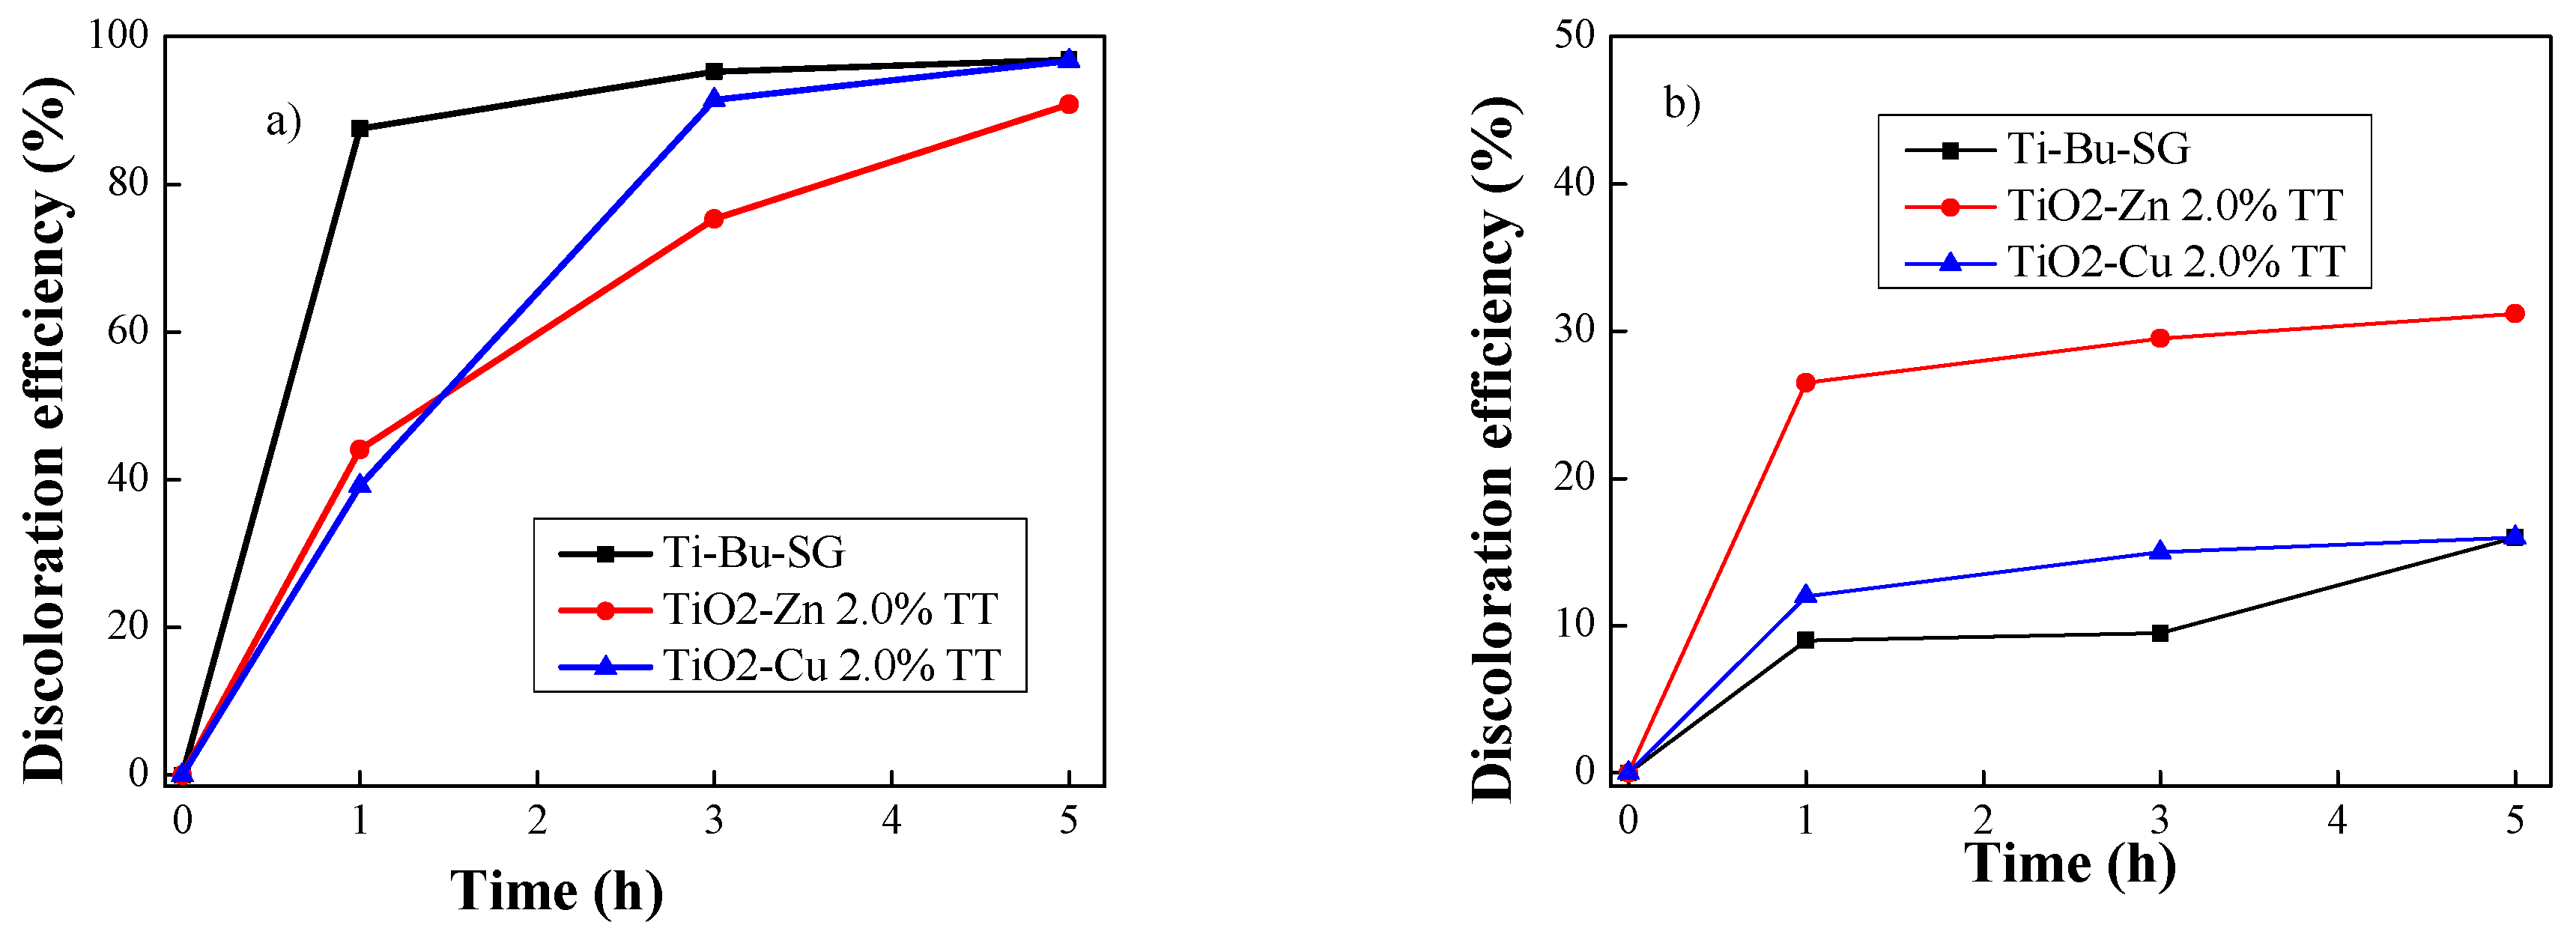
2.2.7. Photocatalysis Investigation
3. Conclusions
4. Materials and Methods
4.1. Sample Preparation
4.2. Methods of Characterization
Author Contributions
Funding
Institutional Review Board Statement
Informed Consent Statement
Acknowledgments
Conflicts of Interest
References
- Cao, G. Nanostructures and Nanomaterials: Synthesis, Properties and Applications; Imperial College Press: London, UK, 2004. [Google Scholar] [CrossRef]
- Alagarasi, A. Chapter 1—Introduction to nanomaterials. In Nanomaterials; Viswanathan, B., Ed.; Narosa Publishing House: Mumbay, India, 2009; pp. 2–25. [Google Scholar]
- Canas-Carrell, J.E.; Li, S.; Parra, A.M.; Shrestha, B. Chapter 10—Metal oxide nanomaterials: Health and environmental effects. In Health and Environmental Safety of Nanomaterials; Njuguna, J., Pielichowski, K., Zhu, H., Eds.; Woodhead Publishing: Kidlington, Oxford, UK, 2014; pp. 200–221. [Google Scholar] [CrossRef]
- Athar, T. Chapter 14—Metal oxide nanopowder. In Micro and Nano Technologies, Emerging Nanotechnologies for Manufacturing, 2nd ed.; Ahmed, W., Jackson, M.J., Eds.; William Andrew Publishing: San Diego, CA, USA, 2015; pp. 343–401. [Google Scholar] [CrossRef]
- Athar, T. Chapter 17—Smart precursors for smart nanoparticles. In Micro and Nano Technologies, Emerging Nanotechnologies for Manufacturing, 2nd ed.; Ahmed, W., Jackson, M.J., Eds.; William Andrew Publishing: San Diego, CA, USA, 2015; pp. 444–538. [Google Scholar] [CrossRef]
- Banerjee, A.N. The design, fabrication, and photocatalytic utility of nanostructured semiconductors: Focus on TiO2-based nanostructures. Nanotechnol. Sci. Appl. 2011, 4, 35–65. [Google Scholar] [CrossRef] [PubMed] [Green Version]
- Huang, F.; Yan, A.; Zhao, H. Chapter 2—Influences of Doping on Photocatalytic Properties of TiO2 Photocatalyst. In Semiconductor Photocatalysis—Materials, Mechanisms and Applications; Cao, W., Ed.; IntechOpen: London, UK, 2016; pp. 31–80. [Google Scholar]
- Pandele-Cușu, J.; Atkinson, I.; Rusu, A.; Apostol, N.; Teodorescu, V.; Predoană, L.; Szilágyi, I.M.; Pokol, G.; Zaharescu, M. Thermal behavior of Cu-doped TiO2 gels synthesized by the sol-gel method. Rev. Roum. Chim. 2021, 66, 221–229. [Google Scholar] [CrossRef]
- Stanciu, I.; Predoană, L.; Pandele-Cușu, J.; Preda, S.; Anastasescu, M.; Vojisavljević, K.; Malič, B.; Zaharescu, M. Thermal behaviour of the TiO2 based gels obtained by microwaves assisted sol-gel method. J. Therm. Anal. Calorim. 2017, 130, 639–651. [Google Scholar] [CrossRef]
- Gomez-Polo, C.; Larumbe, S.; Gil, A.; Muñoz, D.; Fernández, L.R.; Barquín, L.F.; García-Prieto, A.; Fdez-Gubieda, M.L.; Muela, A. Improved photocatalytic and antibacterial performance of Cr doped TiO2 nanoparticles. Surf. Interfaces 2021, 22, 100867. [Google Scholar] [CrossRef]
- Shen, J.-H.; Chuang, H.-Y.; Jiang, Z.-W.; Liu, X.-Z.; Horng, J.-J. Novel quantification of formation trend and reaction efficiency of hydroxyl radicals for investigating photocatalytic mechanism of Fe-doped TiO2 during UV and visible light-induced degradation of acid orange. Chemosphere 2020, 251, 126380. [Google Scholar] [CrossRef]
- Matias, M.L.; Pimentel, A.; Reis-Machado, A.S.; Rodrigues, J.; Deuermeier, J.; Fortunato, E.; Martins, R.; Nunes, D. Enhanced Fe-TiO2 Solar Photocatalysts on Porous Platforms for Water Purification. Nanomaterials 2022, 12, 1005. [Google Scholar] [CrossRef]
- Zhou, Y.; Zhang, Q.; Shi, X.; Song, Q.; Zhou, C.; Jiang, D. Photocatalytic reduction of CO2 into CH4 over Ru-doped TiO2: Synergy of Ru and oxygen vacancies. J. Colloid Interf. Sci. 2022, 608, 2809–2819. [Google Scholar] [CrossRef]
- Mancuso, A.; Morante, N.; De Carluccio, M.; Sacco, O.; Rizzo, L.; Fontana, M.; Esposito, S.; Vaiano, V.; Sannino, D. Solar driven photocatalysis using iron and chromium doped TiO2 coupled to moving bed biofilm process for olive mill wastewater treatment. Chem. Eng. J. 2022, 45015, 138107. [Google Scholar] [CrossRef]
- Piątkowska, A.; Janus, M.; Szymański, K.; Mozia, S. C-,N- and S-Doped TiO2 Photocatalysts: A Review. Catalysts 2021, 11, 144. [Google Scholar] [CrossRef]
- Li, X.; Wen, J.; Low, J.; Fang, Y.; Yu, J. Design and fabrication of semiconductor photocatalyst for photocatalytic reduction of CO2 to solar fuel. Sci. China Mater. 2014, 57, 70–100. [Google Scholar] [CrossRef] [Green Version]
- Ran, J.; Jaroniec, M.; Qiao, S.-Z. Cocatalysts in Semiconductor-based Photocatalytic CO2 Reduction: Achievements, Challenges, and Opportunities. Adv. Mater. 2018, 30, 1704649. [Google Scholar] [CrossRef] [PubMed]
- Qin, Q.; Wang, J.; Xia, Y.; Yang, D.; Zhou, Q.; Zhu, X.; Feng, W. Synthesis and Characterization of Sn/Ni Single Doped and Co–Doped Anatase/Rutile Mixed–Crystal Nanomaterials and Their Photocatalytic Performance under UV–Visible Light. Catalysts 2021, 11, 1341. [Google Scholar] [CrossRef]
- Bachvarova-Nedelcheva, A.; Yordanov, S.; Iordanova, R.; Stambolova, I.; Stoyanova, A.; Georgieva, N.; Nemska, V. The Influence of Nd and Sm on the Structure and Properties of Sol-Gel-Derived TiO2 Powders. Molecules 2021, 26, 3824. [Google Scholar] [CrossRef] [PubMed]
- Tahmasebizad, N.; Hamedani, M.T.; Shaban Ghazani, M.; Pazhuhanfar, Y. Photocatalytic activity and antibacterial behavior of TiO2 coatings co-doped with copper and nitrogen via sol–gel method. J. Sol-Gel. Sci. Technol. 2020, 93, 570–578. [Google Scholar] [CrossRef]
- Nakamura, M.; Ono, A.; Bae, E.; Murakami, N.; Ohno, N. Improvement of visible light responsivity of rutile TiO2 nanorods by site-selective modification of iron (III) ion on newly exposed faces formed by chemical etching treatment. Appl. Catal. B 2013, 130, 264–269. [Google Scholar] [CrossRef]
- Savio, A.K.P.D.; Fletcher, J.; Hernandez, F.R. Sonosynthesis of nanostructured TiO2 doped with transition metals having variable bandgap. Ceram. Int. 2013, 39, 2753–2765. [Google Scholar] [CrossRef]
- Suzuki, K.; Yokoi, T.; Iwatsu, M.; Furuya, M.; Yokota, K.; Mokudai, T.; Kanetaka, H.; Kawashita, M. Antibacterial properties of Cu-doped TiO2 prepared by chemical and heat treatment of Ti metal. J. Asian Ceram. Soc. 2021, 9, 1448–1456. [Google Scholar] [CrossRef]
- Wang, Y.; Yang, H.; Xue, X. Synergistic antibacterial activity of TiO2 co-doped with zinc and yttrium. Vacuum 2014, 107, 28–32. [Google Scholar] [CrossRef]
- Shaikh, S.; Nazam, N.; Mohd, S.; Rizvi, D.; Ahmad, K.; Baig, M.H.; Lee, E.J.; Choi, I. Mechanistic Insights into the Antimicrobial Actions of Metallic Nanoparticles and Their Implications for Multidrug Resistance. Int. J. Mol. Sci. 2019, 20, 2468. [Google Scholar] [CrossRef] [Green Version]
- Kumar, S.G.; Rao, K.S.R.K. Polymorphic phase transition among the titania crystal structures in solution based approach: From precursor chemistry to nucleation process. Nanoscale 2014, 6, 11574–11632. [Google Scholar] [CrossRef]
- Lu, C.W.; Cao, Y.; Li, H.; Webb, C.; Pan, W.P. Synthesis of TiO2 based on hydrothermal methods using elevated pressures and microwave conditions. J. Therm. Anal. Calorim. 2014, 116, 1241–1248. [Google Scholar] [CrossRef]
- Bregadiolli, B.A.; Fernandes, S.L.; Graef, C.F.O. Easy and Fast Preparation of TiO2—Based Nanostructures Using Microwave Assisted Hydrothermal Synthesis. Mater. Res. 2017, 20, 912–919. [Google Scholar] [CrossRef] [Green Version]
- Falk, G.S.; Borlaf, M.; López-Muñoz, M.J.; Farinas, J.C.; Rodrigues Neto, J.B.; Moreno, R. Microwave-assisted synthesis of TiO2 nanoparticles: Photocatalytic activity of powders and thin films. J. Nanopart. Res. 2018, 20, 23. [Google Scholar] [CrossRef]
- Kéri, O.; Kocsis, E.; Karajz, D.A.; Nagy, Z.K.; Parditka, B.; Erdélyi, Z.; Szabó, A.; Hernádi, K.; Szilágyi, I.M. Photocatalytic Crystalline and Amorphous TiO2 Nanotubes Prepared by Electrospinning and Atomic Layer Deposition. Molecules 2021, 26, 5917. [Google Scholar] [CrossRef] [PubMed]
- Vinogradov, A.V.; Vinogradov, V.V. Low-temperature sol–gel synthesis of crystalline materials. RSC Adv. 2014, 4, 45903–45919. [Google Scholar] [CrossRef]
- Nachit, W.; Ait Ahsaine, H.; Ramzi, Z.; Touhtouh, S.; Goncharova, I.; Benkhouja, K. Photocatalytic activity of anatase-brookite TiO2 nanoparticles synthesized by sol gel method at low temperature. Opt. Mater. 2022, 129, 112256. [Google Scholar] [CrossRef]
- Sadek, O.; Touhtouh, S.; Rkhis, M.; Anoua, R.; El Jouad, M.; Belhora, F.; Hajjaji, A. Synthesis by sol-gel method and characterization of nano-TiO2 powders. Mater. Today Proc. 2022, 66, 456–458. [Google Scholar]
- Szołdra, P.; Frąc, M.; Pichór, W. Effect of sol composition on the properties of TiO2 powders obtained by the sol–gel method. Powder Technol. 2021, 387, 261–269. [Google Scholar] [CrossRef]
- Keshari, A.K.; Choudhary, P.; Shukla, V.K. Precursor induced evolution in single anatase phase synthesis of TiO2 nanoparticles for water treatment and dye-sensitized solar cell. Phys. B Condens. Matter 2022, 631, 413716. [Google Scholar] [CrossRef]
- Rathore, N.; Kulshreshtha, A.; Shukla, R.K.; Sharma, D. Study on morphological, structural and dielectric properties of sol–gel derived TiO2 nanocrystals annealed at different temperatures. Phys. B Condens. Matter 2020, 582, 411969. [Google Scholar] [CrossRef]
- Schmidt, H. Chemistry of material preparation by the sol–gel process. J. Non-Cryst. Solids 1998, 100, 51–64. [Google Scholar] [CrossRef] [Green Version]
- Sakka, S.; Kamya, K. The Sol–Gel Transition in the Hydrolysis of Metal Alkoxides in Relation to Formation of Glass Fibers and Films. J. Non-Cryst. Solids 1982, 48, 31–46. [Google Scholar] [CrossRef]
- ThermoFisher Scientific XPS Database. Available online: https://www.thermofisher.com/ro/en/home/materials-science/learning-center/periodic-table/transition-metal/titanium.html (accessed on 26 September 2022).
- NIST X-ray Photoelectron Spectroscopy Database, NIST Standard Reference Database Number 20; Version 4.1, Last Update to Data Content: 2012, (retrieved 26 September 2022), 20899; National Institute of Standards and Technology: Gaithersburg, MD, USA, 2000. [CrossRef]
- ThermoFisher Scientific XPS Database. Available online: https://www.thermofisher.com/ro/en/home/materials-science/learning-center/periodic-table/transition-metal/copper.html (accessed on 26 September 2022).
- Wagner, C.D.; Davis, L.E.; Zeller, M.V.; Taylor, J.A.; Raymond, R.M.; Gale, L.H. Empirical atomic sensitivity factors for quantitative analysis by electron spectroscopy for chemical analysis. Surf. Interface Anal. 1981, 3, 211–225. [Google Scholar] [CrossRef]
- Pandele-Cușu, J.; Petrescu, S.; Preda, S.; Petcu, G.; Ciobanu, M.; Predoană, L. Comparative study of the TiO2 nanopowders prepared from diferent precursors and chemical methods for heterogeneous photocatalysis application. J. Therm. Anal. Calorim. 2022. [Google Scholar] [CrossRef]
- Teodorescu, C.M.; Esteva, J.M.; Karnatak, R.C.; El Afif, A. An approximation of the Voigt I profile for the fitting of experimental X-ray absorption data. Nucl. Instrum. Meth. Phys. Res. A 1994, 345, 141–147. [Google Scholar] [CrossRef]
- Fruth, V.; Todan, L.; Codrea, C.I.; Poenaru, I.; Petrescu, S.; Aricov, L.; Ciobanu, M.; Jecu, L.; Ion, R.M.; Predoana, L. Multifunctional Composite Coatings Based on Photoactive Metal-Oxide Nanopowders (MgO/TiO2) in Hydrophobic Polymer Matrix for Stone Heritage Conservation. Nanomaterials 2021, 11, 2586. [Google Scholar] [CrossRef] [PubMed]
- Khashan, K.S.; Sulaiman, G.M.; Abdulameer, F.A.; Albukhaty, S.; Ibrahem, M.A.; Al-Muhimeed, T.; AlObaid, A.A. Antibacterial Activity of TiO2 Nanoparticles Prepared by One-Step Laser Ablation in Liquid. Appl. Sci. 2021, 11, 4623. [Google Scholar] [CrossRef]
- Azizi-Lalabadi, M.; Ehsani, A.; Divband, B.; Alizadeh-Sani, M. Antimicrobial activity of Titanium dioxide and Zinc oxide nanoparticles supported in 4A zeolite and evaluation the morphological characteristic. Sci. Rep. 2019, 9, 17439. [Google Scholar] [CrossRef] [Green Version]
- Sing, K.S.W. Reporting Physisorption Data for Gas/Solid Systems with Special Reference to the Determination of Surface Area and Porosity (Recommendations 1984). Pure Appl. Chem. 1985, 57, 603–619. [Google Scholar] [CrossRef]
- Fageria, P.; Gangopadhyay, S.; Pande, S. Synthesis of ZnO/Au and ZnO/Ag nanoparticles and their photocatalytic application using UV and visible light. RSC Adv. 2014, 4, 24962–24972. [Google Scholar] [CrossRef]
- Colon, G.; Maicu, M.; Hidalgo, M.C.; Navıo, J.A. Cu-doped TiO2 systems with improved photocatalytic activity. Appl. Catal. B Environ. 2006, 67, 41–51. [Google Scholar] [CrossRef]
- Augilar, T.; Novas, J.; Alcantara, R. A route for the synthesis of Cu-doped TiO2 nanoparticles with a very low band gap. Chem. Phys. Lett. 2013, 571, 49–53. [Google Scholar] [CrossRef]
- Perkgoz, N.K.; Toru, R.S.; Unal, E.; Sefunc, M.A.; Tek, S.; Mutlugun, E.; Soganci, I.M.; Celiker, H.; Celiker, G.; Demir, H.V. Photocatalytic Hybrid Nanocomposites of Metal Oxide Nanoparticles Enhanced Towards the Visible Spectral Range. Appl. Catal. B 2011, 105, 77–85. [Google Scholar] [CrossRef] [Green Version]
- Navas, J.; Sánchez-Coronilla, A.; Aguilar, T.; Hernández, N.C.; de los Santos, D.M.; Sánchez-Márquez, J.; Zorrilla, D.; Fernández-Lorenzo, C.; Alcántara, R.; Martín-Calleja, J. Experimental and theoretical study of the electronic properties of Cu-doped anatase TiO2. Phys. Chem. Chem. Phys. 2014, 16, 3835–3845. [Google Scholar] [CrossRef] [PubMed]
- Mahdy, S.A.; Raheed, Q.J.; Kalaichelvan, P. Antimicrobial activity of zero-valent iron nanoparticles. IJMER 2012, 2, 578–581. [Google Scholar]
- Gingașu, D.; Mîndru, I.; Culiță, D.C.; Predoană, L.; Petcu, G.; Ciobanu, M.; Preda, S.; Pandele-Cușu, J.; Petrescu, S. MgO obtained by chemical and green synthesis methods and applied in photocatalytic degradation of methyl orange. Rev. Roum. Chim. 2021, 66, 463–473. [Google Scholar] [CrossRef]


| Sample | Core Levels | BE (eV) | at. % | Interpretation | |
|---|---|---|---|---|---|
| TiO2−Zn 2.0% | Ti 2p | C1 | 458.53 | 42.40 | Ti(IV) vol. |
| C2 | 459.00 | 1.60 | Ti(IV) surf. | ||
| O 1s | C1 | 530.02 | 35.61 | Ti(IV) (vol + surf) | |
| C2 | 531.02 | 19.89 | Ti(IV) + Zn(II) + cont | ||
| Zn 2p | C1 | 1021.26 | 0.50 | Zn(II) | |
| TiO2−Cu 2.0% | Ti 2p | C1 | 458.23 | 42.35 | Ti(IV) vol. |
| C2 | 459.10 | 2.71 | Ti(IV) surf. | ||
| O 1s | C1 | 529.74 | 29.93 | Ti(IV) | |
| C2 | 530.54 | 24.52 | Ti(IV) + Zn(II) + cont | ||
| Cu 2p | C1 | 931.44 | 0.48 | Cu(I) | |
| Sample | a = b (Å) | c (Å) | Dm (nm) |
|---|---|---|---|
| Ti−Bu−SG [43] | 3.7837 (6) | 9.4969 (15) | 14 |
| TiO2−Cu 2.0% TT | 3.7892 (2) | 9.5145 (6) | 14 |
| TiO2−Zn 2.0% TT | 3.7854 (10) | 9.496 (3) | 13 |
| Anatase, syn ICDD 21−1272 | 3.7850 | 9.5140 | - |
| Sample | Composition | Values | U.M. | Line |
|---|---|---|---|---|
| TiO2−Zn 2.0% | Ti | 58.0482 | mass% | Ti−KA |
| Zn | 1.6157 | mass% | Zn−KA | |
| O | 39.2373 | mass% | O−KA | |
| C, S, Si (traces) | 1.0989 | mass% | ||
| TiO2 | 94.1104 | mass% | Ti−KA | |
| ZnO | 1.9373 | mass% | Zn−KA | |
| C, S, Si oxides (traces) | 3.9524 | mass% | ||
| Ti | 58.7187 | mass% | Ti−KA | |
| TiO2−Cu 2.0% | Cu | 1.9474 | mass% | Cu−KA |
| O | 38.3098 | mass% | O−KA | |
| C, Si, S (traces) | 1.0241 | mass% | ||
| TiO2 | 94.0071 | mass% | Ti−KA | |
| CuO | 2.3092 | mass% | Cu−KA | |
| C, S, Si oxides (traces) | 3.6837 | mass% |
| Sample | Core Levels | BE (eV) | at. (%) | Interpretation | |
|---|---|---|---|---|---|
| TiO2−Zn 2.0% TT | Ti 2p | C1 | 458.58 | 0.78 | Ti(IV) vol. |
| C2 | 459.78 | 39.04 | Ti(IV) surf. | ||
| O 1s | C1 | 529.85 | 48.77 | Ti(IV) (vol + surf) | |
| C2 | 531.22 | 9.21 | Ti(IV) + Zn(II) + cont | ||
| Zn 2p | C1 | 1021.85 | 2.2 | Zn(II) | |
| TiO2−Cu 2.0% TT | Ti 2p | C1 | 457.29 | 6.8 | Ti(II) |
| C2 | 458.56 | 12.42 | Ti(IV) vol. | ||
| C3 | 459.97 | 18.12 | Ti(IV) surf. | ||
| O 1s | C1 | 529.43 | 29.96 | Ti(IV) (vol + surf) | |
| C2 | 531.13 | 30.19 | Cu(I) + cont | ||
| Cu 2p | C1 | 930.95 | 0.32 | Cu(0) | |
| C2 | 931.91 | 2.19 | Cu(I) | ||
| Sample | Concentration | OD of Sample with S. aureus | Inhibition Rate % |
|---|---|---|---|
| Ti−Bu−SG | 200 µg mL−1 | 0.060 | 96.29 |
| TiO2−Zn 2.0% TT | 200 µg mL−1 | 0.235 | 85.47 |
| TiO2−Cu 2.0% TT | 200 µg mL−1 | 0.245 | 84.85 |
| Biological positive control of S. aureus | 3 × 10⁵ CFU mL−1 | 1.618 | - |
| Sample | SBET (m2g−1) | Vtotal (cm3g−1) | dBJH (nm) | Band Gap (eV) |
|---|---|---|---|---|
| Ti−Bu−SG | 52.3 | 0.089 | 4.4 | 3.15 |
| TiO2−Cu 2.0% TT | 31.3 | 0.080 | 6.2 | 1.5 |
| TiO2−Zn 2.0% TT | 41.5 | 0.099 | 6.1 | 2.85 |
| Sample | Precursors | Molar Ratio | pH Sol | Experimental Conditions | |||
|---|---|---|---|---|---|---|---|
| T (°C) | t (h) | ||||||
| TiO2−Cu 2.0% | Ti(OC4H10)4 + Cu(NO3)2·3H2O | 36.5 | 3 | 0.003 | 10 | 25 | 60 |
| TiO2−Zn 2.0% | Ti(OC4H10)4 + Zn(NO3)2·6H2O | 36.5 | 3 | 0.003 | 10 | 25 | 60 |
Publisher’s Note: MDPI stays neutral with regard to jurisdictional claims in published maps and institutional affiliations. |
© 2022 by the authors. Licensee MDPI, Basel, Switzerland. This article is an open access article distributed under the terms and conditions of the Creative Commons Attribution (CC BY) license (https://creativecommons.org/licenses/by/4.0/).
Share and Cite
Preda, S.; Pandele-Cușu, J.; Petrescu, S.V.; Ciobanu, E.M.; Petcu, G.; Culiță, D.C.; Apostol, N.G.; Costescu, R.M.; Raut, I.; Constantin, M.; et al. Photocatalytic and Antibacterial Properties of Doped TiO2 Nanopowders Synthesized by Sol−Gel Method. Gels 2022, 8, 673. https://doi.org/10.3390/gels8100673
Preda S, Pandele-Cușu J, Petrescu SV, Ciobanu EM, Petcu G, Culiță DC, Apostol NG, Costescu RM, Raut I, Constantin M, et al. Photocatalytic and Antibacterial Properties of Doped TiO2 Nanopowders Synthesized by Sol−Gel Method. Gels. 2022; 8(10):673. https://doi.org/10.3390/gels8100673
Chicago/Turabian StylePreda, Silviu, Jeanina Pandele-Cușu, Simona Viorica Petrescu, Elena Mădălina Ciobanu, Gabriela Petcu, Daniela C. Culiță, Nicoleta G. Apostol, Ruxandra M. Costescu, Iuliana Raut, Mariana Constantin, and et al. 2022. "Photocatalytic and Antibacterial Properties of Doped TiO2 Nanopowders Synthesized by Sol−Gel Method" Gels 8, no. 10: 673. https://doi.org/10.3390/gels8100673