Article

Study of the Interfacial Transition Zone Characteristics of Geopolymer and Conventional Concretes

Department of Civil and Environmental Engineering, College of Engineering, Majmaah University, AL-Majmaah 11952, Saudi Arabia
Gels 2022, 8(2), 105; https://doi.org/10.3390/gels8020105
Submission received: 19 December 2021 / Revised: 22 January 2022 / Accepted: 29 January 2022 / Published: 9 February 2022
(This article belongs to the Special Issue Geopolymer Gels for Next-Generation Construction)

Abstract

:
The properties and performance of geopolymer at different length scales have been intensively studied, but only limited studies on geopolymer have investigated the zone located between paste and aggregates, which is called the interfacial transition zone (ITZ). The microstructure of ITZ and its nanomechanical properties in geopolymer concrete are examined in this study. Fly ash-based geopolymer has great potential to be an alternative to traditional concrete. To this end, scanning electron microscopy (SEM) and nanoindentation tests were performed to investigate the microstructural characteristics and nanomechanical properties of the ITZ, and the results were compared with the ITZ of traditional concrete. Results show that traditional concrete demonstrated a weak ITZ with pores and microcracks, while the geopolymer concrete microstructure did not present weak ITZs in the vicinity of aggregates. More pores and crack were observed in the ITZ in traditional concrete. Further, a considerable amount of fly ash particles, that appear to be unreacted or partially reacted in the matrix phase, was observed. Based on the nanoindentation results, 58% of the microstructure is composed of unreacted or partially reacted fly ash particles. The results of nano- and microscale tests will enhance the understanding of how concrete behaves and performs at large scales.

1. Introduction

The macroscale properties of a composite is greatly influenced by its interfaces. The interfacial transition zone (ITZ), which is known as the most important interface in concrete, is located between cement paste and aggregate in traditional concrete [1,2]. In the vicinity of each aggregate, the formation of ITZ takes place with a thickness of up to 50 μm [3]. In this zone, a higher amount of calcium hydroxide (CH) and ettringite can be found [4]. The ITZs have higher porosity compared to the matrix [4,5]. More micro cracks are also generated in the ITZs due to the fluctuation in strength between ITZs and aggregate and paste [6,7]. In addition, aggressive agents can penetrate into the concrete body via porous ITZs, which could lead to a large reduction in the mechanical properties and durability of concrete [1,8]. Thus, the ITZ is the weakest zone in the concrete, which makes it important, because the overall composite performance greatly depends on this zone [5,9].
Many studies have been conducted to characterize the microstructure of the ITZ in concrete using different tools such as scanning electron microscopy (SEM) and energy dispersive X-ray (EDX) [10,11]. These tools have been widely applied to identify the microstructural gradients through the ITZ in concrete [12,13]. However, the aforementioned techniques are limited because the local mechanical properties across the ITZ cannot be quantified using the SEM and EDX. Micro-indentation was developed to characterize the mechanical properties of different microstructural gradients at the ITZ in concrete [14,15], but the size of the nano-indent in comparison with the thickness of ITZ limits its applications for concrete. Nanoindentation, which has been widely used to study the local mechanical properties of other materials [16], has been increasingly adopted in cementitious materials [17,18,19]. One substantial advantage of nanoindentation over micro-indentation is its nano-indent size, and this advantage allows the intrinsic properties of microstructural gradients across the ITZ to be characterized. Studies such as [20,21] were the first that implemented nanoindentation for ITZ characterization. The procedure for sample preparation for the nanoindentation test was developed in [20], and the interface between fiber–matrix–aggregate was investigated. The nanoindentation was coupled with SEM-EDX and laser scanning to explore the weakest zone in concrete [21].
It is well known that the most commonly used binding agent in construction is Portland cement (PC), but its production releases a large amount of CO2 [22,23]. On the other hand, the use of geopolymer concrete has recently attracted interesting attention as an alternative to traditional concrete. Geopolymer emits less CO2 compared to traditional concrete [24,25]. Geopolymer is produced by mixing byproduct materials such as fly ash with an alkaline solution. Fly ash is the best candidate to make geopolymer, since it required less alkaline solution to be activated when compared to metakaolin [26]. Its worldwide availability is also one of the main reasons that make it the most appropriate material to produce geopolymer [27]. The reaction (geo-polymerization) in geopolymer starts with the dissolution of reactants in an alkaline solution, with resulting polymeric Si–O–Al–O bonds in the amorphous form [24,28]. The mechanical properties and durability of geopolymer concrete have been reported by many researchers to be comparable with those of traditional concrete [29,30,31,32]. The compressive strength of geopolymer was 30 MPa, while that of OPC concrete was around 27 MPa [29]. The compressive strength of geopolymer and geopolymer concrete decreased by 35% and 63%, respectively, after one year of immersion in sulfuric acid solution [29]. After exposing geopolymer and OPC specimens in 10% sulfuric acid and 10% magnesium sulphate solutions, the geopolymer presented a better resistance compared to OPC specimens [30]. Geopolymer specimens with reinforced rebars were tested under accelerated corrosion test [31]. The results showed that geopolymer specimens had good resistance to chloride attack, with a longer time before corrosion cracking compared to OPC specimens [31]. The aforementioned statement leads to the conclusion that the mechanical properties and durability of geopolymer can make it better a construction material than OPC, but there is not enough information regarding the ITZ in concrete and its properties in geopolymer concrete.
Despite the great attention given to using geopolymer concrete as an alternative to traditional concrete, only limited studies have explored the ITZ in geopolymer concrete [33,34]. With developments in technology, advanced techniques such as nanoindentation and SEM can be coupled to figure out the ITZs in geopolymer and compare this to the ITZs formed in PC concrete. Nanoindentation can be applied to quantitatively assess the nanomechanical properties of the different phases [21,33,35], while the microstructure of ITZs’ phases can be characterized by SEM [5,21,33]. In geopolymers, the main reaction product is called sodium aluminosilicate hydrate (N–A–S–H) gel, and the indentation modulus is around the indentation modulus of the main hydration of PC paste product (low-density C–S–H) [36,37,38].
The main aim of this research is to study the microstructures and nanomechanical properties of the ITZ in a geopolymer concrete mixture. Toward this end, SEM and nanoindentation tests were utilized to investigate the properties of the ITZ in geopolymer concrete at the microscale, and the results were compared with ITZ in conventional concrete.

2. Results and Discussion

2.1. Microstructure Analysis

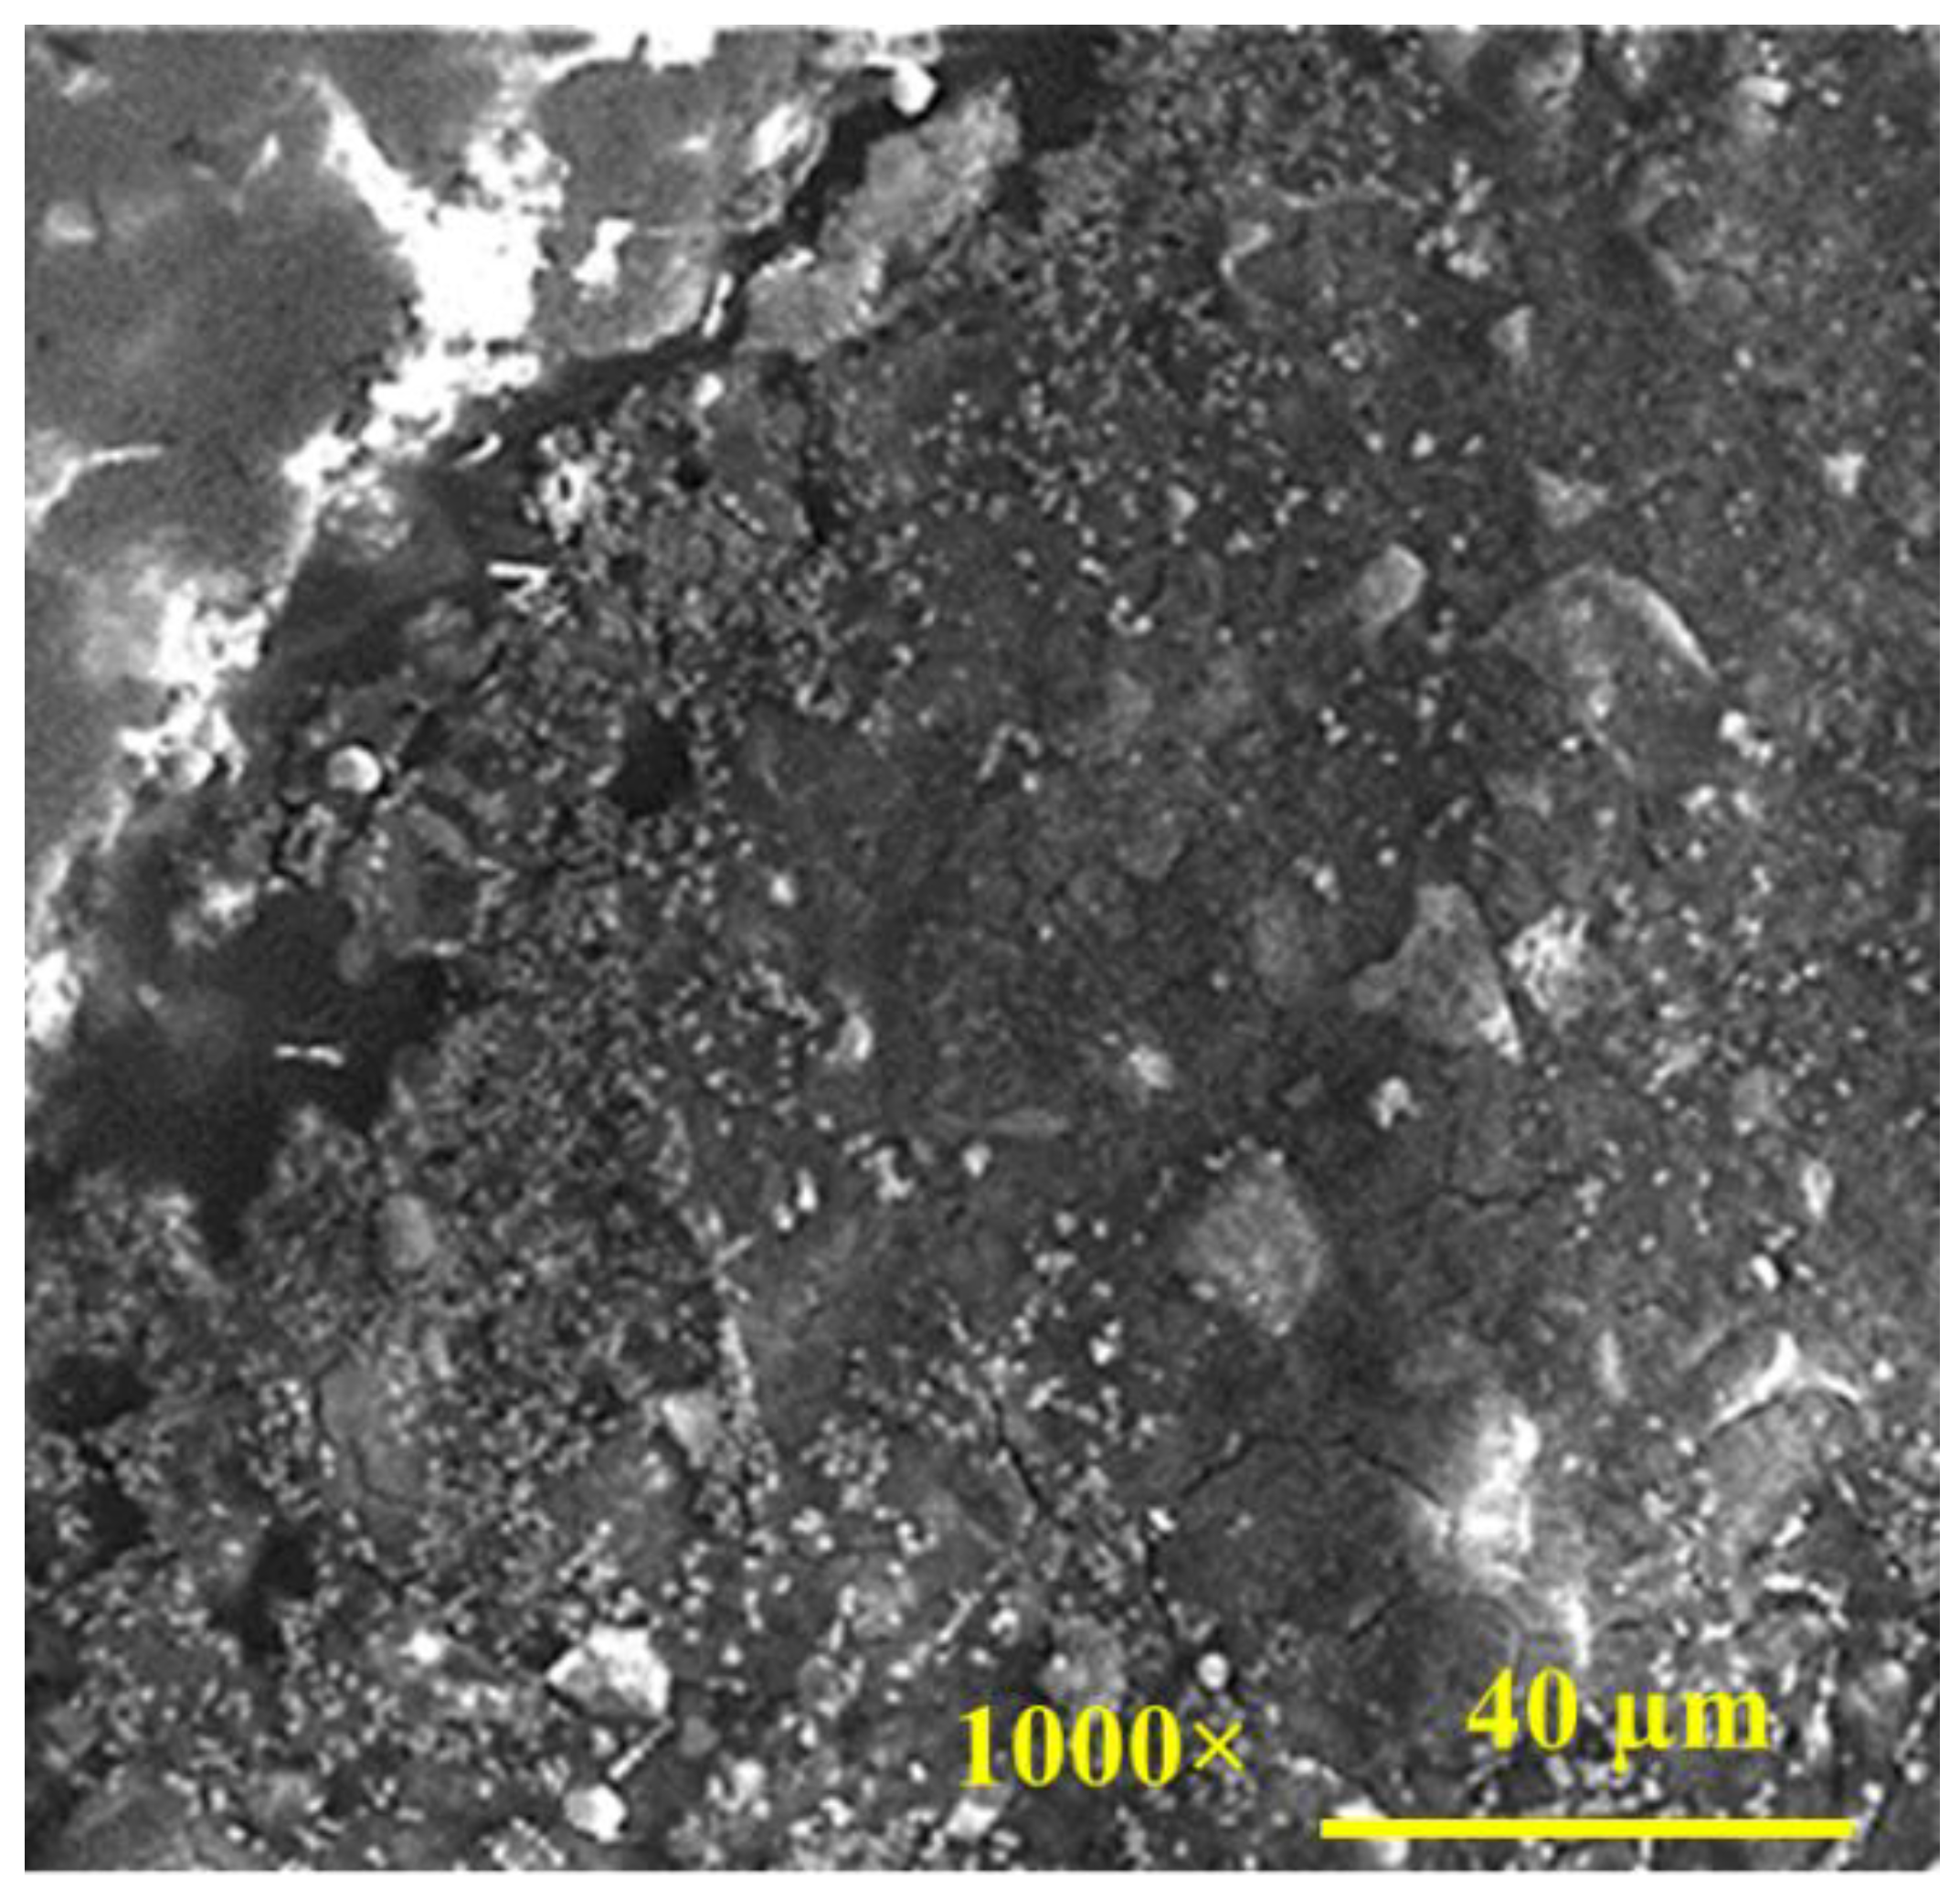
The SEM microstructure image of the geopolymer concrete mixture is shown in Figure 1. The geopolymer mixture image clearly shows a complicated matrix microstructure with multiple phases. Thus, it is expected that the individual properties of those phases and the interactions between the phases play a significant role in the overall physical–mechanical properties of geopolymer concrete. This role is discussed in more detail later. Regarding the geometric characteristics of the ITZ formed, the microstructures in the vicinity of large aggregate (limestone) did not present clear differences from the matrix phase microstructure, without showing any obvious voids around the limestone particle. The zoomed-in images presented in Figure 2 further demonstrate the bonding that occurs at the ITZ between aggregates and the geopolymer matrix. The microcracks shown in the images, although this is not certain at this stage, may have been caused by extra stress during the polishing (surface smoothing) process or the cementitious shrinkage during the curing process. On the contrary, the SEM microstructure image of the OPC mixture shows large voids/pores around the ITZ, as seen in Figure 3. This observation agrees well with similar studies [21,39]. Low-density ITZ would compromise OPC mixture properties by weakening the entire mixture. The weak ITZ in OPC mixtures is typically related to calcium hydroxide crystals and pores concentrated at the ITZ due to rich water at the aggregate surface [40]. Such crystals were not found in geopolymer paste or ITZ.

2.2. Nanomechanical Properties

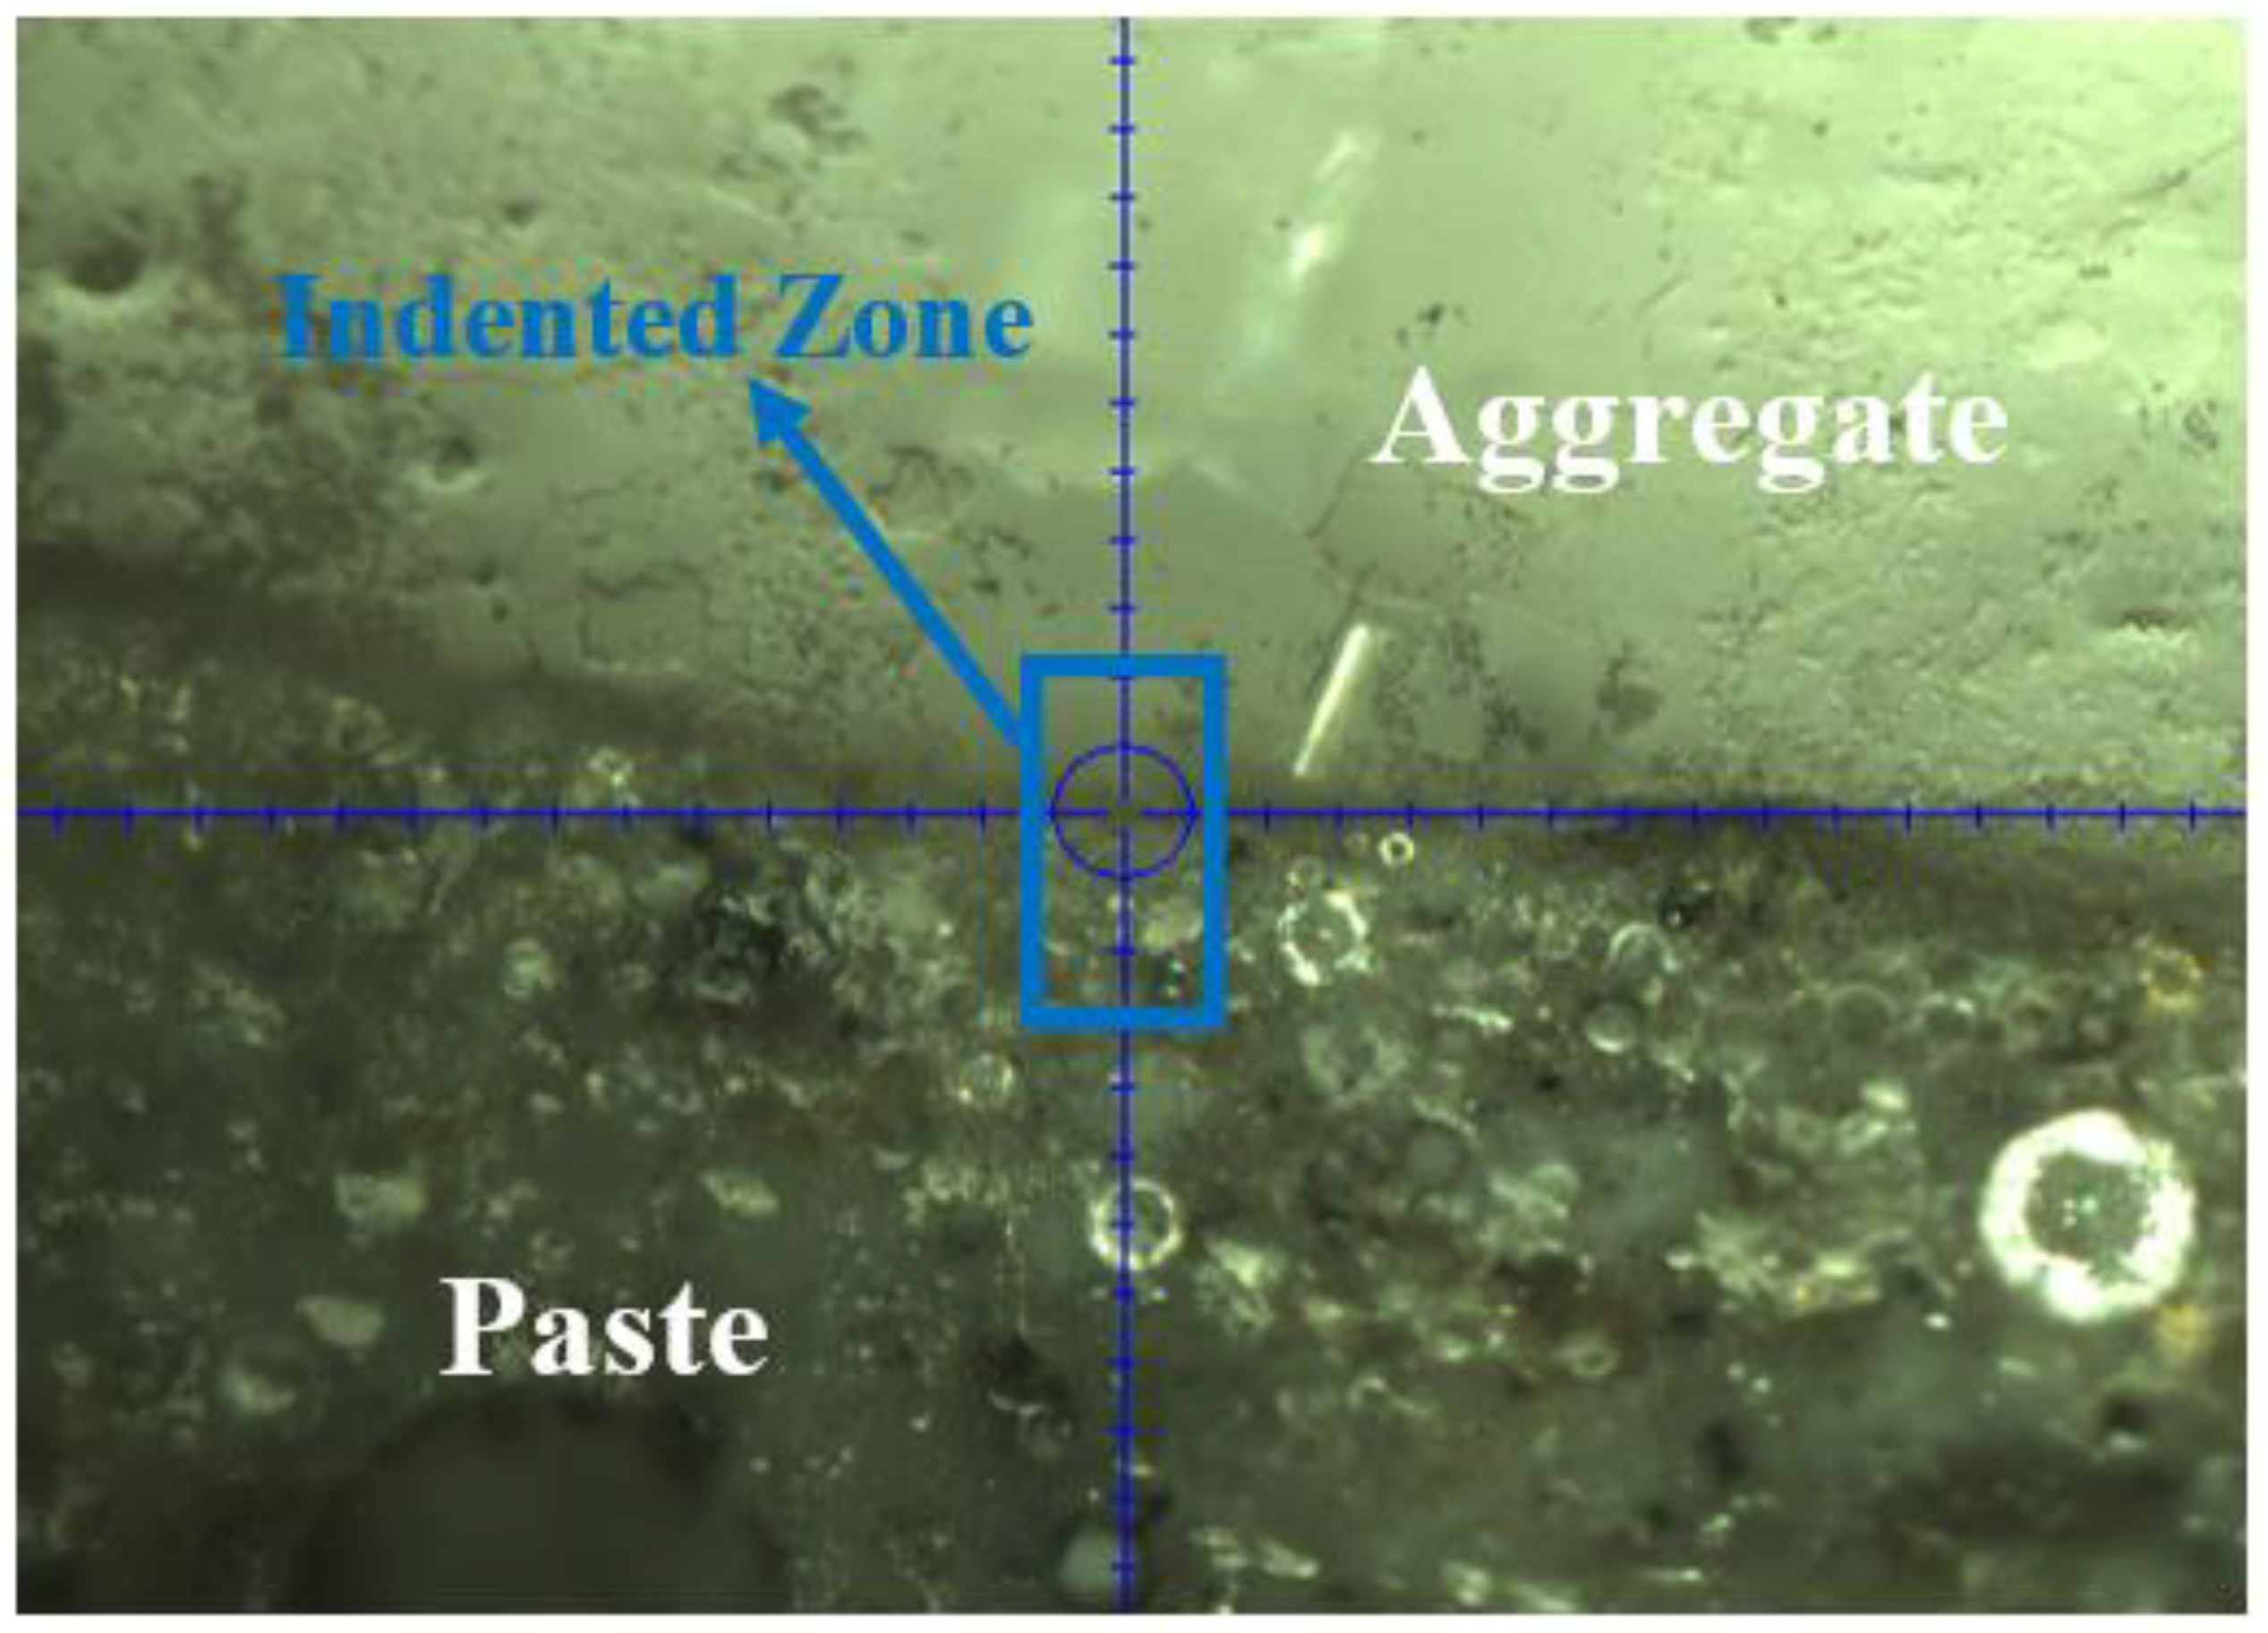
Nanoindentation tests were conducted to measure the elastic properties in the microstructures, including the ITZ region in geopolymer concrete and OPC concrete. A total distance of approximately 140 μm crossing multiple phases (from the aggregate to cementitious matrix) in the microstructures was inspected. One example is shown in Figure 4. The figure shows the testing zone across the interface for the geopolymer specimen. The distance between each nano-indent was 3 μm to avoid any interactive issues between nano-indents [41].
The elastic modulus distributions of the geopolymer mixture are shown in Figure 5. The figure shows that each region, when dominated by different phases, can be recognized by the variation in the indentation modulus. Roughly, two zones were observed: the first zone, which is approximately 40–50 μm, where indentation modulus are less scattered and the second zone with indentation modulus highly scattered. The first zone is for aggregate. The zone limitation is the significant change in the indentation modulus around the aggregate surface or far from the aggregate in the matrix, which can be considered as a limitation of the zones. There was no obvious transition between the two regions. Considering the direction of the indentation pathway, test results indicate that elastic stiffness is generally consistent within the aggregate particle and becomes more scattered in the matrix phase. There is no clear weak zone identified around the aggregate with lower modulus, such as the ITZ typically observed from OPC mixtures [39,42]. This outcome can be attributed to the high bond strength of the geopolymer matrix, as presented in a recent study [43], and as the SEM images shown in Figure 2 demonstrate. Based on the SEM image shown in Figure 1, the highly scattered stiffness values within the matrix phase seem strongly related to the different compositions such as N-A-S-H gel, partially reacted fly ash particles, unreacted fly ash particles, and pores [35,37,38]. For comparison purposes on a large scale between geopolymer and OPC concrete, the compressive strengths of geopolymer and OPC were 36.2 MPa and 38.6 MPa, respectively.
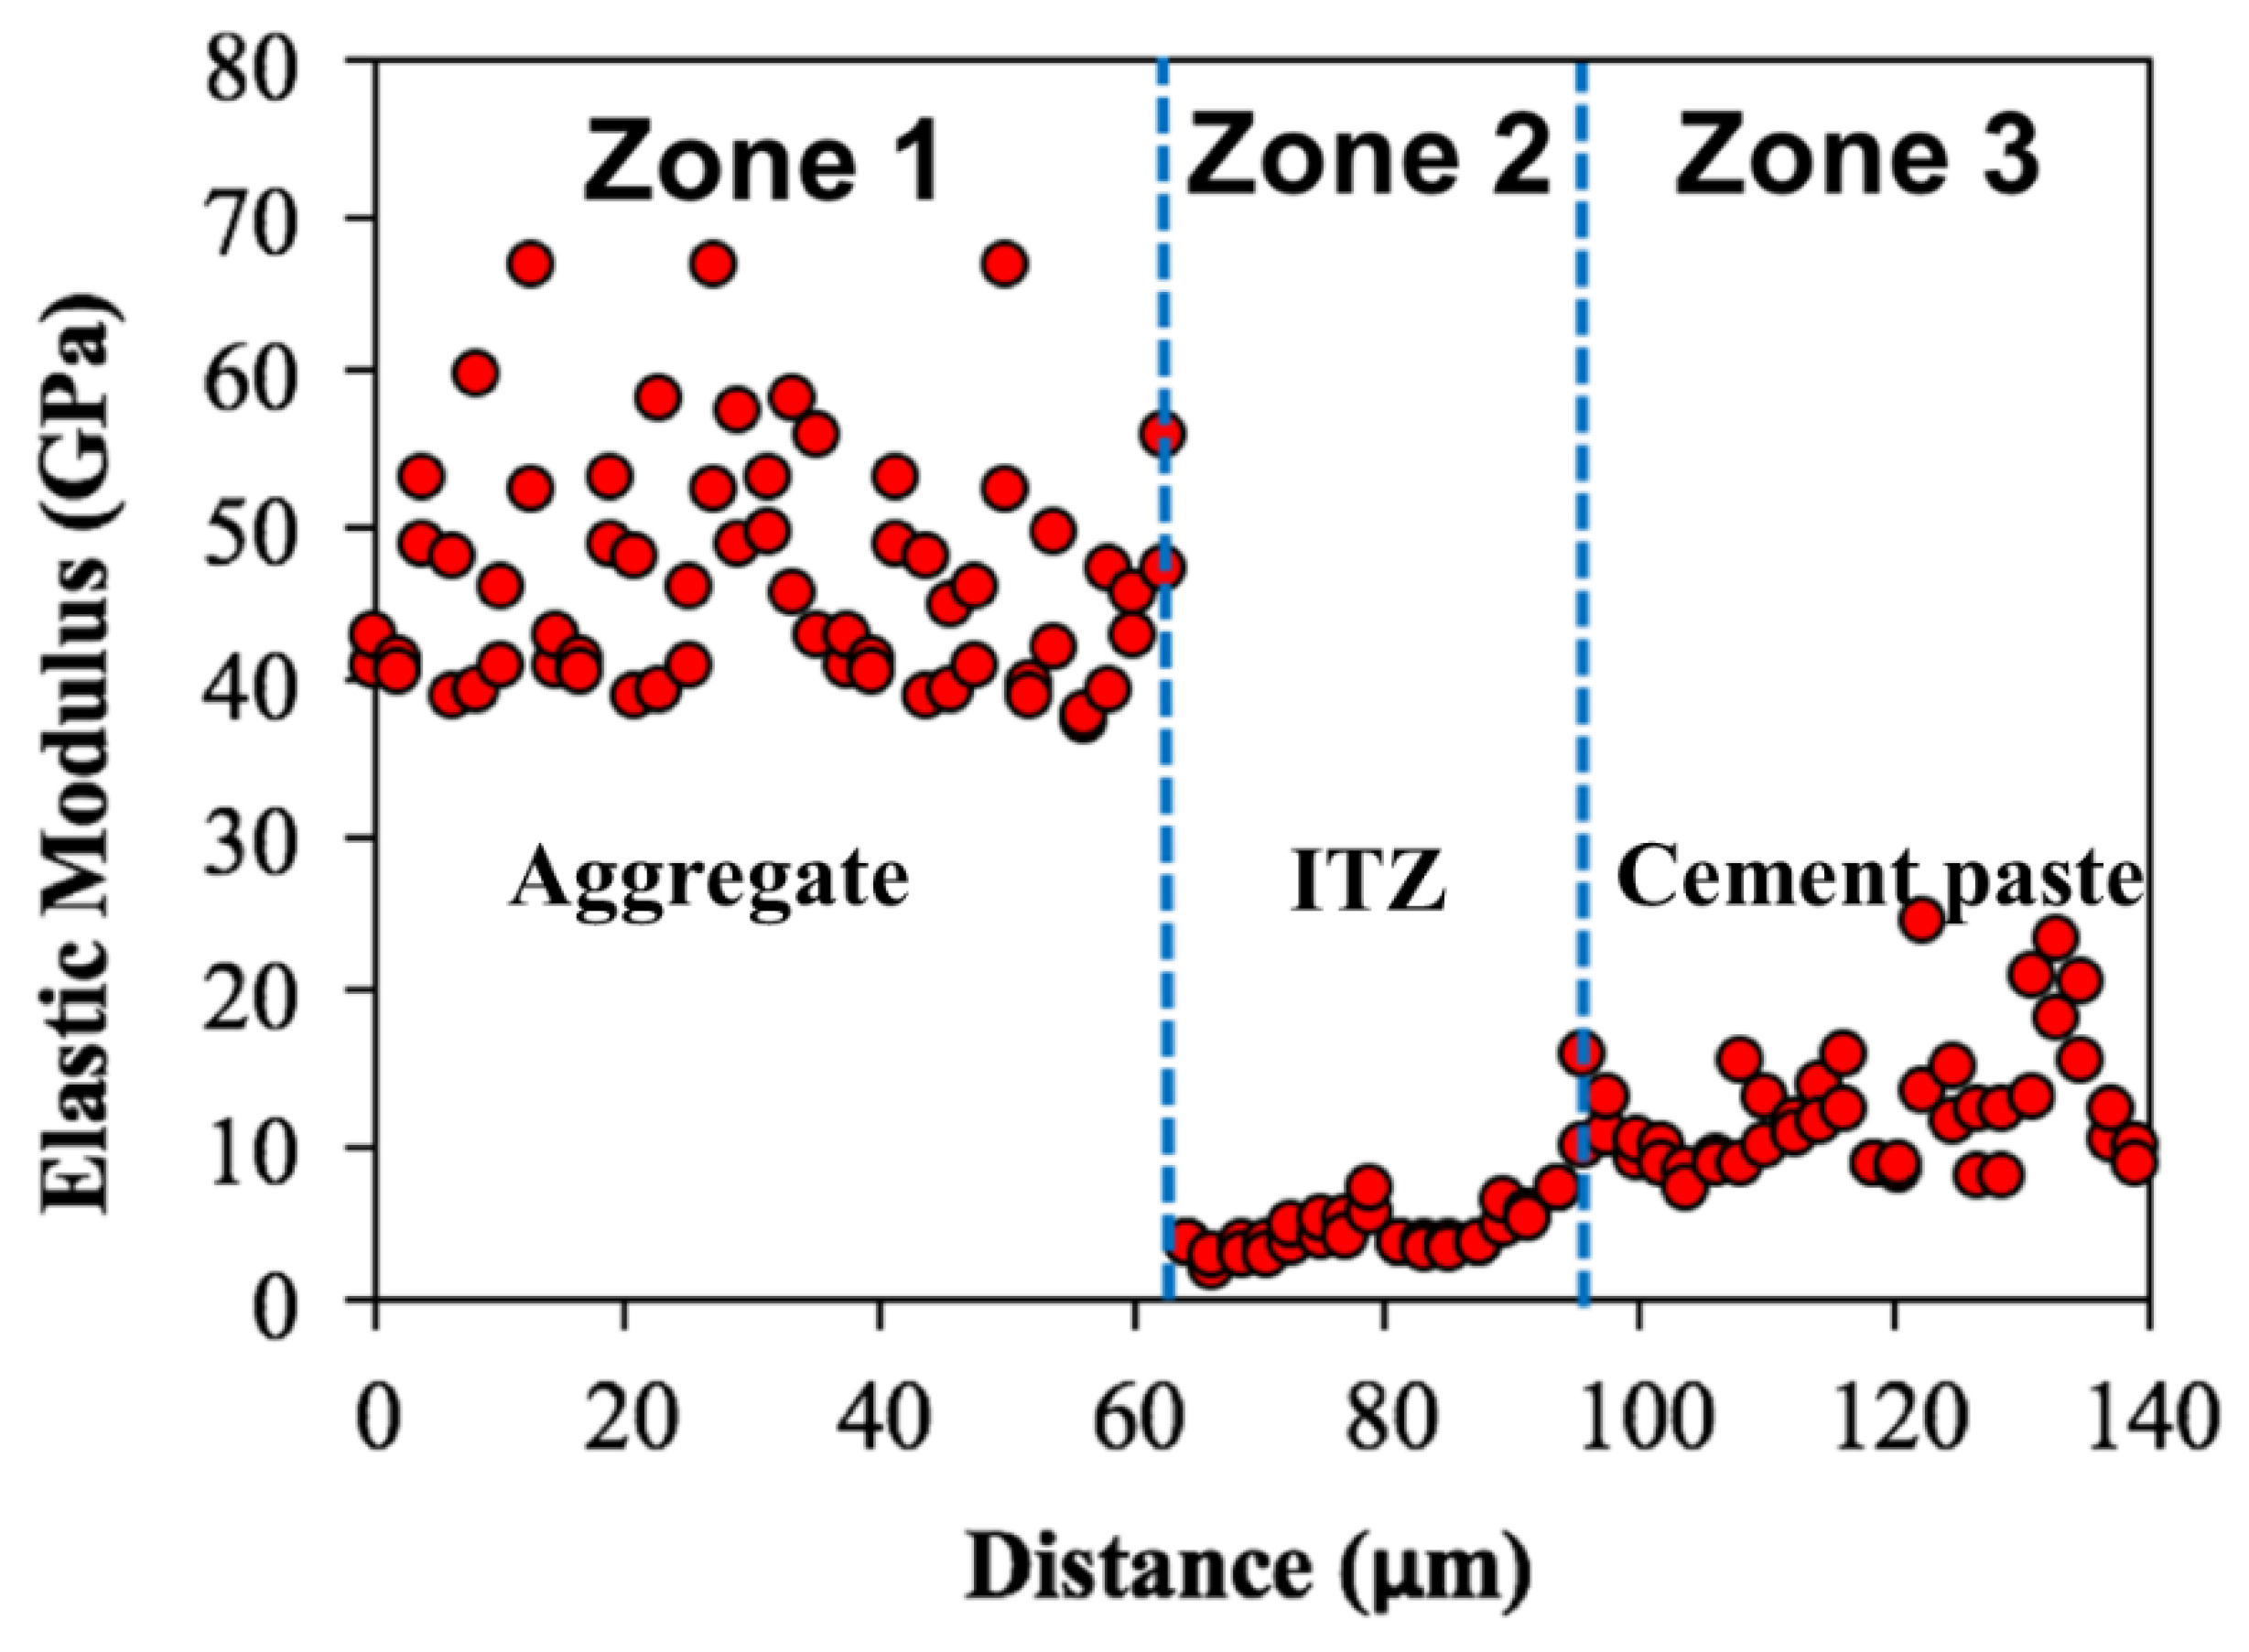
The elastic modulus distributions of the OPC mixture are shown in Figure 6. Comparing these to the results from the geopolymer case, it can be seen that the nanoindentation test results shown in the figure are quite different. Based on the findings from the nanoindentation results, three zones were generally observed, with an intermediate zone where indentation modulus is lower than in the other two zones. The first zone, which is approximately 60 μm, is seen as an aggregate particle by considering the indentation direction and the elastic modulus values obtained (i.e., average 49 GPa). The modulus dropped sharply, then increased gradually. It is implied that the intermediate region, with a width of approximately 30 μm, is the ITZ where lower density entities such as voids/pores exist as shown in Figure 3. After the ITZ zone, the distribution of indentation modulus in the cementitious matrix ranges between 10 to 30 GPa with much less scatter than the geopolymer cases. The indentation modulus of the low-density C–S–H is between 15–31 GPa [44]. This means that the microstructure of the cement paste is mostly composed of C–S–H. On the other hand, around 50% of the microstructure of geopolymer paste is composed of unreacted and partially reacted fly ash particles [33], which is in line with the findings in this study. The average indentation modulus of partially reacted and unreacted particles is 40 GPa and 70 GPa, respectively [33]. Nanoindentation results shown in Figure 4 and Figure 5 are well aligned with the SEM visual observations, which indicates that weak ITZ is not clearly detected in geopolymer concrete, whereas the weak ITZ around aggregates can be an issue in OPC mixtures. The weak ITZ in OPC has been reported in many other studies [41,42,45], and this study confirms their findings.
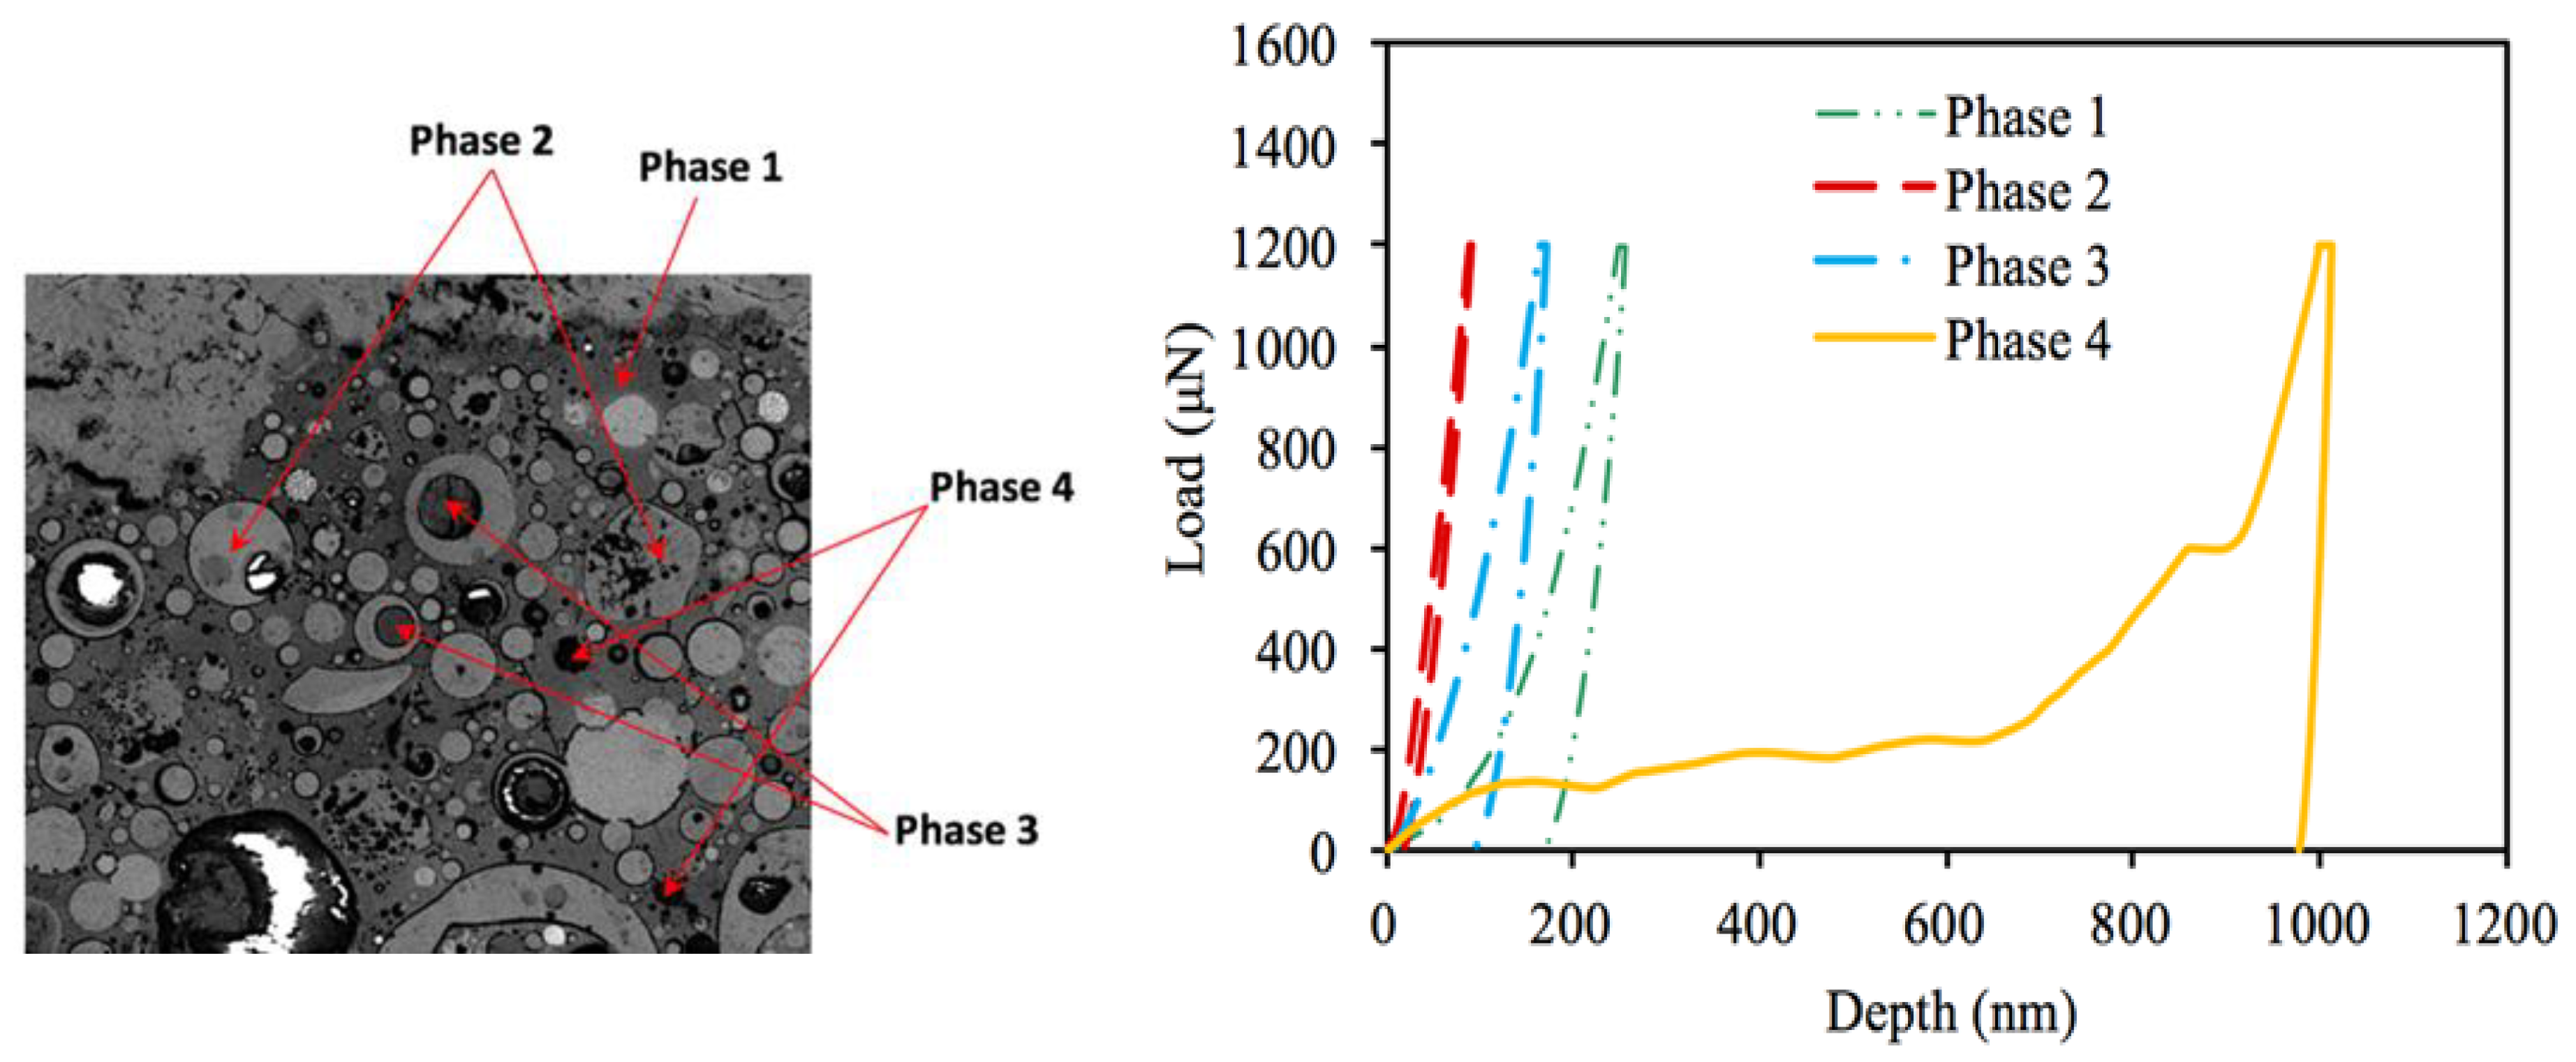
In addition to the sequential indentations made along the longitudinal direction across the three zones (aggregate–interphase–matrix) to investigate property changes with a particular interest in the interphase zone, the nanoindentation test was also conducted to further examine properties of individual phases observed in the geopolymer matrix. Based on the SEM images, the indentation moduli measured within the cementitious matrix can be categorized into four different major phases, as marked in Figure 7. Identification of individual phases can be better investigated by the resulting nanoindentation tests (i.e., load–depth curves and the resulting mechanical properties such as hardness and elastic modulus). Figure 7 also shows representative loading–unloading indentation curves for individual phases. As shown, the circular phase in lighter gray (Phase 2) experiences very small indentation depth resulting in the highest elastic modulus, while the small black dots (Phase 4) caused considerable indentation depth (around 1000 nm), which resulted in very low stiffness. The circular phase in darker gray (Phase 3) produced a larger indentation depth than the circular phase in lighter gray (Phase 2). The surrounding continuous phase (Phase 1) had larger indentation depths than the two circular gray phases, which resulted in lower stiffness than the two heterogeneities. Although it is not conclusive at this stage, by integrating the visual observation with nanomechanical behavior, the continuous phase is regarded as a geo-polymerization product, N–A–S–H gel, and the circular gray phases are fly ash particles that are partially reacted at different levels (more reacted is represented in darker gray). The black dots are regarded as small pores considering their large indentation depth. The pores in geopolymer paste appear in uniform spherical shapes, whereas the shape of pores in OPC paste is irregular [46,47].

3. Conclusions

This study examined microstructures and nanomechanical properties of geopolymer concrete mixtures where Class F fly ash is considered an alkali-activated binder. Two primary laboratory tests, SEM analysis and nanoindentation were conducted for geopolymer mixtures and an OPC concrete mixture as a counterpart of the geopolymer mixture. Based on test and analyses results, the main conclusions are drawn below:
  • SEM test results show that traditional concrete developed a weak ITZ with voids and cracks, while the geopolymer concrete microstructure did not present weak ITZs in the vicinity of aggregates.
  • Nanoindentation results showed that, in geopolymer mixtures, there is no clear weak zone identified around the aggregate with lower modulus such as the ITZ typically observed from OPC mixtures. This observation can be attributed to the high bond strength of the geopolymer matrix.
  • Geopolymer matrix presented multiple phases in different geometries (SEM results) and mechanical properties (nanoindentation results). Highly scattered stiffness values within the matrix phase were observed and seem strongly related to the formation of different compositions such as N-A-S-H gel, partially reacted fly ash particles and pores.
  • The investigation of geopolymer matrix performed in this study will provide a better understanding on performance at large scales, which could lead to enlarge the filed application of geopolymer.
  • For future study, it is recommended to investigate the effect of aggregate surface texture on the bond properties between the aggregate and binding agents.

4. Materials and Methods

4.1. Materials

The binding agent used to produce geopolymer is class F fly ash with a specific gravity of 2.37. The chemical composition of fly ash is SiO2 = 51.80%, Al2O3 = 23.06%, Fe2O3 = 13.03%, CaO = 2.81%, MgO = 0.85%, SO3 = 1.23%, Na2O = 0.71%, and K2O = 2.52%. Sodium hydroxide with a molar concentration of 12 is mixed with sodium silicate to prepare the alkaline solutions used to activate the fly ash. As reported in previous studies [48], combining sodium hydroxide solution with sodium silicate solution would lead to higher geo-polymerization. The mass ratio of SiO2 to Na2O in sodium silicate solution is 3.1, and 63% of sodium silicate solution is water.

4.2. Samples Preparation

The preparation of geopolymer concrete specimens begins with dry mixing the fly ash with limestone for three minutes. Then, the alkaline solution is added gradually and mixed for five minutes. The ratio of sodium silicate solution to sodium hydroxide solution used in this study is 2.5. Immediately after mixing, the mixtures were cast in (100 × 200 mm cylindrical molds). The geopolymer specimens were placed in an oven at 60 °C for 24 h. After 24 h of curing in the oven, the specimens were taken out and demolded, then left for 28 days in the lab. The alkaline solution for fly ash was 0.4. OPC (Type I) concrete was also prepared with a design strength of 35 MPa in order to investigate the ITZ formation in OPC concrete and compare the results with those of geopolymer concrete. The size distribution and quantity of coarse aggregates were the same for all mixtures to ensure an effective comparison. The aggregates that were used to prepare concrete specimens were coarse aggregates that were retained on sieves of 4.75 to 12.5 mm. Fine aggregate was excluded to focus the study on the ITZs. The mix proportions are summarized in Table 1.
To prepare the specimens for nanoindentation and SEM tests from the cylinder sample (100 × 200 mm cylindrical molds), small thin sections measuring approximately 10 mm by 10 mm by 5 mm were cut with a low-speed precise diamond saw. Since the nanoindentation tests were conducted at small scales, the roughness of the specimen surfaces has a huge impact on the accuracy of the results. In order to obtain a smooth surface that is crucial for micro- and nano-level experiments, each sample cut was grounded and polished to achieve a final level of smoothness of less than 100 nm. An optical microscope was used to examine the effectiveness of the grinding and polishing procedures. Finally, specimens were cleaned in an ultrasonic bath and then kept in airtight containers.

4.3. Test Methods

In order to investigate the microstructure in geopolymer and OPC concrete mixtures, SEM was used on the polished surface to acquire microscale images. SEM provides images that contain significant details about the microstructure. One of the powerful SEM imaging techniques is Backscattered Electron mode. By using this technique, different phases of the sample can be identified depending on their atomic numbers, which appear at different grey levels. Differences in atomic numbers indicate the different chemical compositions of each phase.
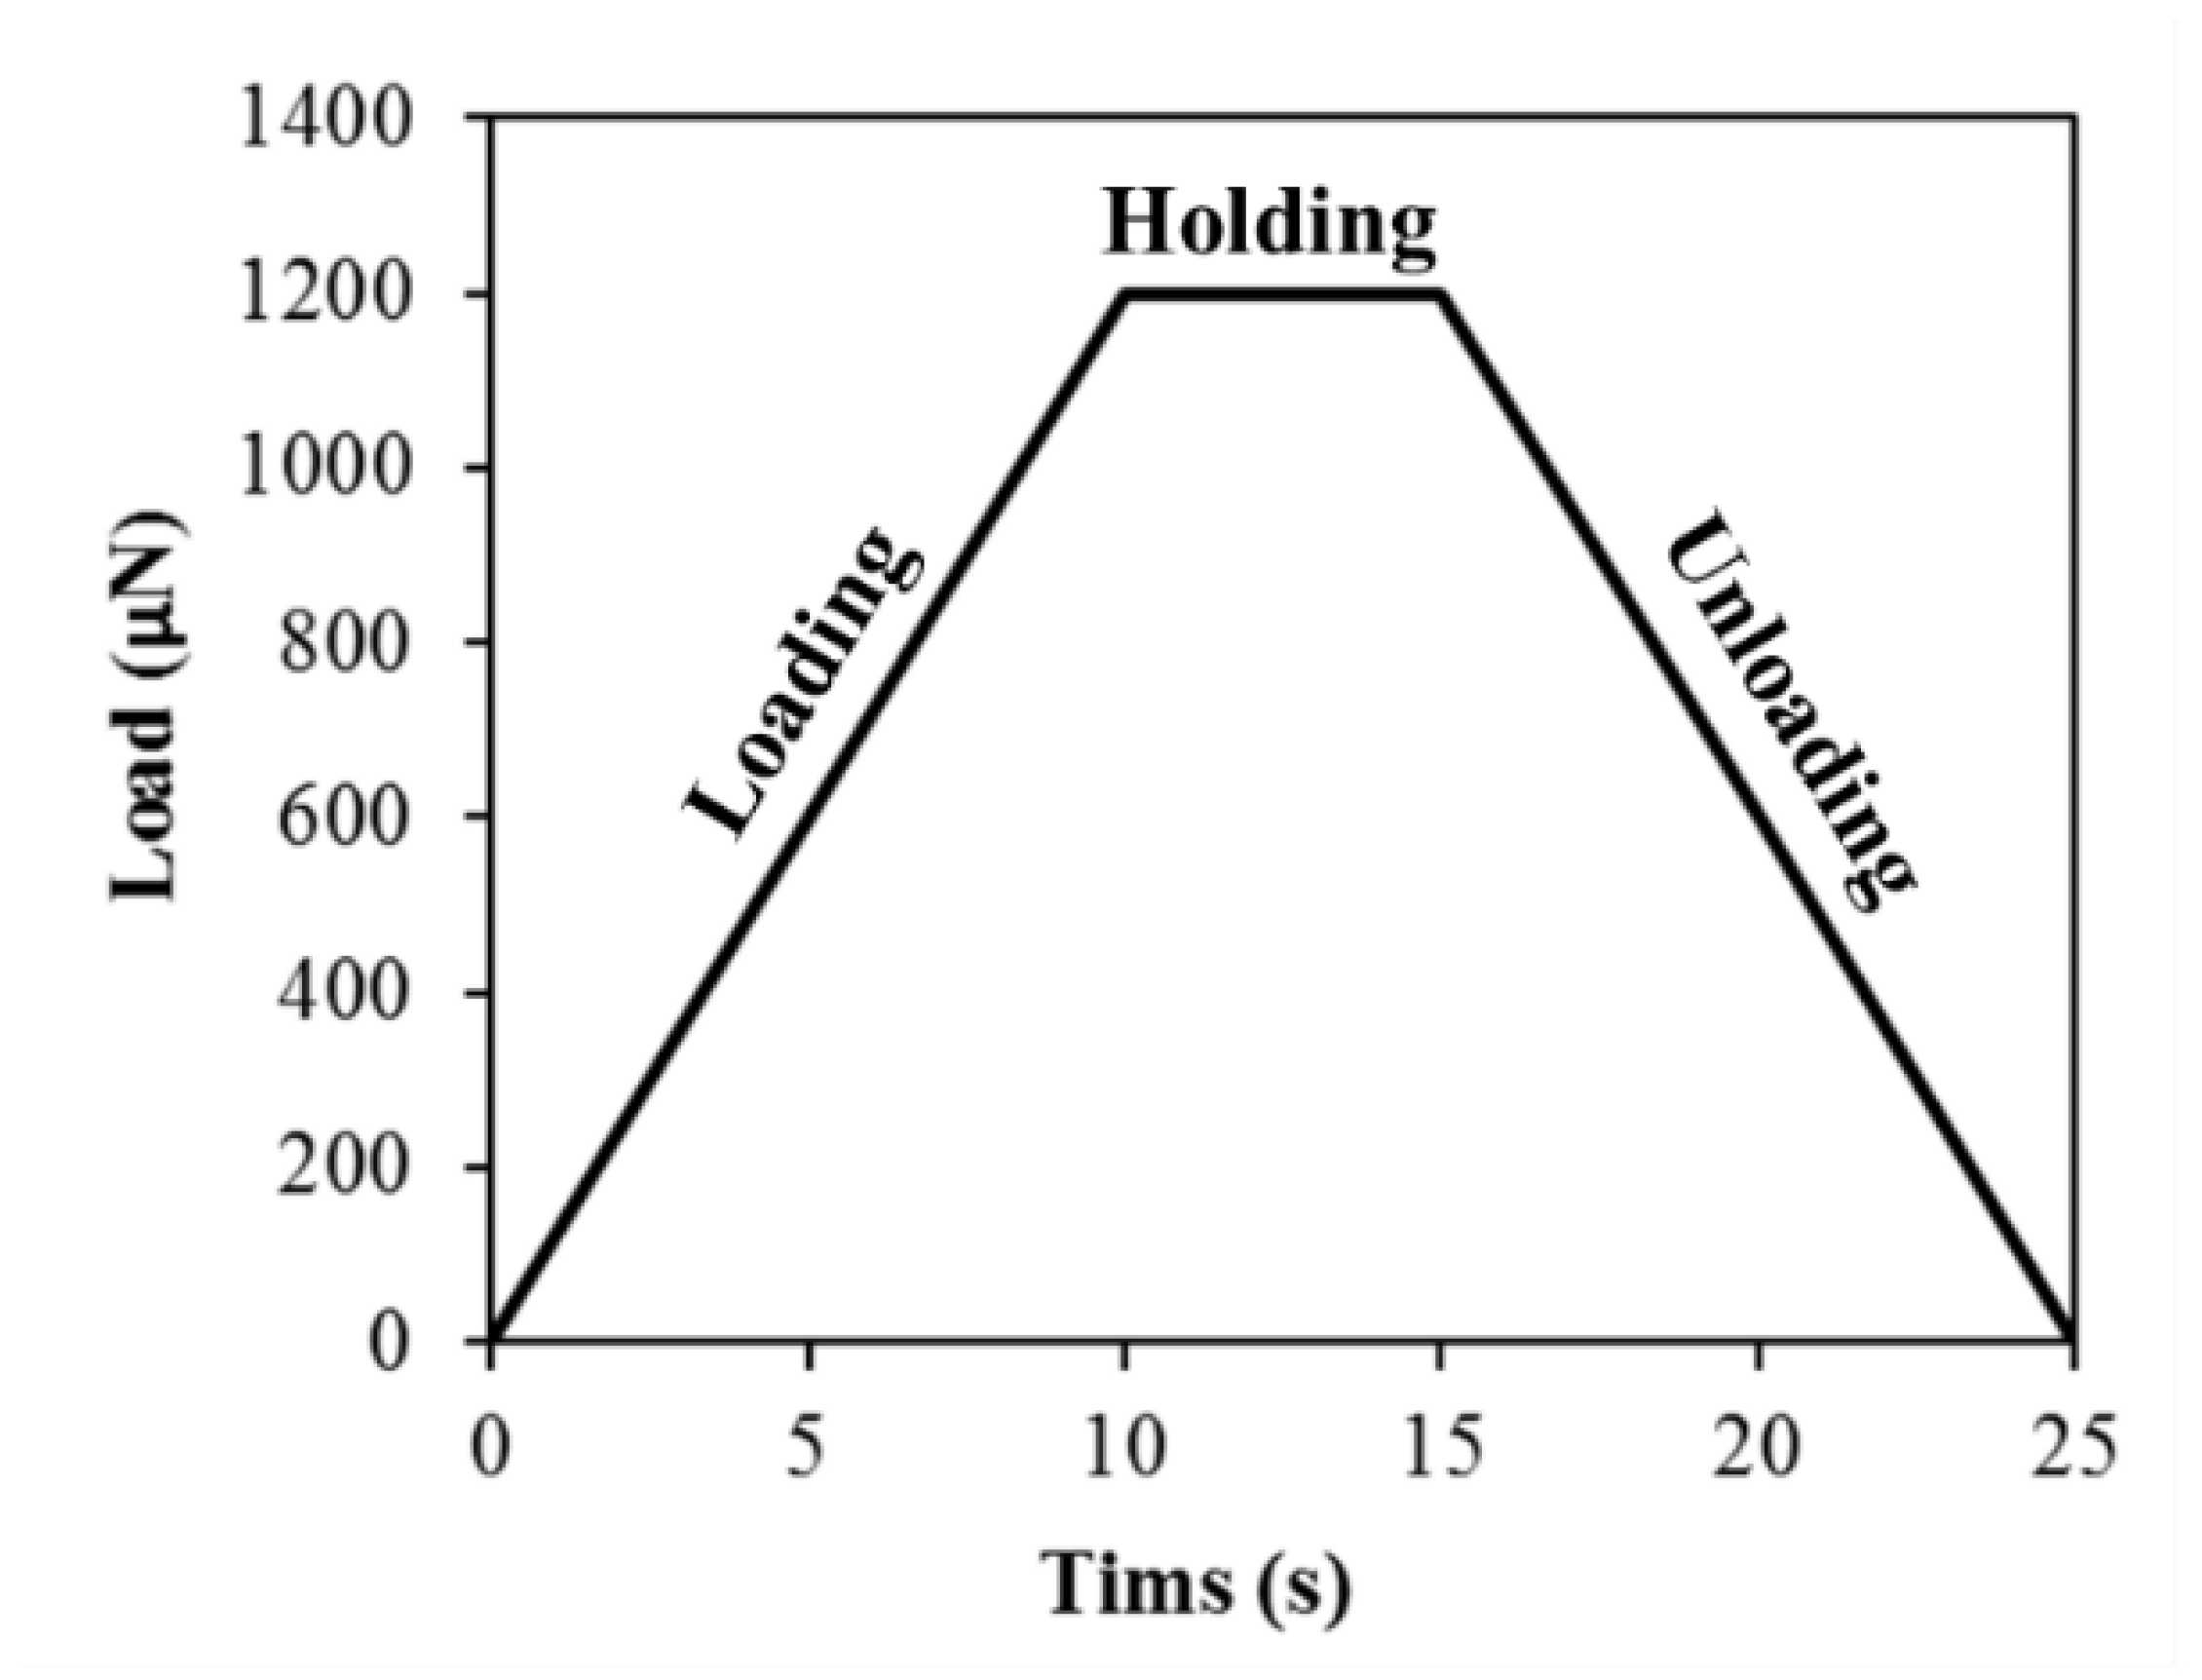
To determine the nanomechanical properties of each specimen with a focus on the ITZ, a Hysitron Triboindentor equipped with a pyramidal-shaped diamond Berkovich tip was utilized to conduct the nanoindentation tests. Similar to these studies [49,50], the loading function was applied under load-control mode with a maximum load of 1200 µN, achieved in 10 s with a loading rate of 120 µN/s followed by five seconds holding and unloading at the same rate as shown in Figure 8. The holding for five seconds is necessary to eliminate any creep effects.

Funding

This research was funded by the Deanship of Scientific Research at Majmaah University, grant number R-2022-37.

Institutional Review Board Statement

Not applicable.

Informed Consent Statement

Not applicable.

Data Availability Statement

The data presented in this study are available on request from the corresponding author.

Acknowledgments

The author would like to thank the Deanship of Scientific Research at Majmaah University for supporting this work under project number No. R-2022-37.

Conflicts of Interest

The author declares no conflict of interest.

References

  1. Shane, J.D.; Mason, T.O.; Jennings, H.M.; Garboczi, E.J.; Bentz, D.P. Effect of the interfacial transition zone on the conductivity of Portland cement mortars. J. Am. Ceram. Soc. 2000, 83, 1137–1144. [Google Scholar] [CrossRef]
  2. Scrivener, K.L.; Crumbie, A.K.; Laugesen, P. The interfacial transition zone (ITZ) between cement paste and aggregate in concrete. Interface Sci. 2004, 12, 411–421. [Google Scholar] [CrossRef]
  3. Xiao, J.; Li, W.; Corr, D.J.; Shah, S.P. Effects of interfacial transition zones on the stress–strain behavior of modeled recycled aggregate concrete. Cem. Concr. Res. 2013, 52, 82–99. [Google Scholar] [CrossRef]
  4. Mondal, P. Nanomechanical Properties of Cementitious Materials. Ph.D. Thesis, Northwestern University, Evanston, IL, USA, 2008. [Google Scholar]
  5. Gao, Y.; De Schutter, G.; Ye, G.; Tan, Z.; Wu, K. The ITZ microstructure, thickness and porosity in blended cementitious composite: Effects of curing age, water to binder ratio and aggregate content. Compos. Part. B Eng. 2014, 60, 1–13. [Google Scholar] [CrossRef]
  6. Akçaoğlu, T.; Tokyay, M.; Çelik, T. Assessing the ITZ microcracking via scanning electron microscope and its effect on the failure behavior of concrete. Cem. Concr. Res. 2005, 35, 358–363. [Google Scholar] [CrossRef]
  7. Erdem, S.; Dawson, A.R.; Thom, N.H. Influence of the micro-and nanoscale local mechanical properties of the interfacial transition zone on impact behavior of concrete made with different aggregates. Cem. Concr. Res. 2012, 42, 447–458. [Google Scholar] [CrossRef]
  8. Cwirzen, A.; Penttala, V. Aggregate–cement paste transition zone properties affecting the salt–frost damage of high-performance concretes. Cem. Concr. Res. 2005, 35, 671–679. [Google Scholar] [CrossRef]
  9. Simeonov, P.; Ahmad, S. Effect of transition zone on the elastic behavior of cement-based composites. Cem. Concr. Res. 1995, 25, 165–176. [Google Scholar] [CrossRef]
  10. Shi, Y.; Lv, X.; Zhou, S.; Liu, Z.A.; Yang, M.; Liu, C.; Lu, C. Mechanical properties, durability, and ITZ characteristics of full-grade dam concrete prepared by aggregates with surface rust stains. Constr. Build. Mater. 2021, 305, 124798. [Google Scholar] [CrossRef]
  11. Diamond, S.; Huang, J. The ITZ in concrete–A different view based on image analysis and SEM observations. Cem. Concr. Compos. 2001, 23, 179–188. [Google Scholar] [CrossRef]
  12. Scrivener, K.L. Backscattered electron imaging of cementitious microstructures: Understanding and quantification. Cem. Concr. Compos. 2004, 26, 935–945. [Google Scholar] [CrossRef]
  13. Bao, H.; Xu, G.; Yu, M.; Wang, Q.; Li, R.; Saafi, M.; Ye, J. Evolution of ITZ and its effect on the carbonation depth of concrete under supercritical CO2 condition. Cem. Concr. Compos. 2021, 126, 104336. [Google Scholar] [CrossRef]
  14. Zhu, W.; Bartos, P.J.M. Assessment of interfacial microstructure and bond properties in aged GRC using a novel microindentation method. Cem. Concr. Res. 1997, 27, 1701–1711. [Google Scholar] [CrossRef]
  15. Trtik, P.; Bartos, P.J. Micromechanical properties of cementitious composites. Mater. Struct. 1999, 32, 388–393. [Google Scholar] [CrossRef]
  16. Oliver, W.C.; Pharr, G.M. An improved technique for determining hardness and elastic modulus using load and displacement sensing indentation experiments. J. Mater. Res. 1992, 7, 1564–1583. [Google Scholar] [CrossRef]
  17. Constantinides, G.; Ulm, F.J. The effect of two types of CSH on the elasticity of cement-based materials: Results from nanoindentation and micromechanical modeling. Cem. Concr. Res. 2004, 34, 67–80. [Google Scholar] [CrossRef]
  18. Jennings, H.M.; Thomas, J.J.; Gevrenov, J.S.; Constantinides, G.; Ulm, F.J. A multi-technique investigation of the nanoporosity of cement paste. Cem. Concr. Res. 2007, 37, 329–336. [Google Scholar] [CrossRef] [Green Version]
  19. Mondal, P.; Shah, S.P.; Marks, L. A reliable technique to determine the local mechanical properties at the nanoscale for cementitious materials. Cem. Concr. Res. 2007, 37, 1440–1444. [Google Scholar] [CrossRef]
  20. Wang, X.H.; Jacobsen, S.; He, J.Y.; Zhang, Z.L.; Lee, S.F.; Lein, H.L. Application of nanoindentation testing to study of the interfacial transition zone in steel fiber reinforced mortar. Cem. Concr. Res. 2009, 39, 701–715. [Google Scholar] [CrossRef]
  21. Khedmati, M.; Kim, Y.R.; Turner, J.A.; Alanazi, H.; Nguyen, C. An integrated microstructural-nanomechanical-chemical approach to examine material-specific characteristics of cementitious interphase regions. Mater. Charact. 2018, 138, 154–164. [Google Scholar] [CrossRef] [Green Version]
  22. Turner, L.K.; Collins, F.G. Carbon dioxide equivalent (CO2-e) emissions: A comparison between geopolymer and OPC cement concrete. Constr. Build. Mater. 2013, 43, 125–130. [Google Scholar] [CrossRef]
  23. Mohammed, A.A.; Ahmed, H.U.; Mosavi, A. Survey of Mechanical Properties of Geopolymer Concrete: A Comprehensive Review and Data Analysis. Materials 2021, 14, 4690. [Google Scholar] [CrossRef] [PubMed]
  24. Davidovits, J. Geopolymer, Green Chemistry and Sustainable Development Solutions: Proceedings of the World Congress Geopolymer 2005; Geopolymer Institute: Saint-Quentin, France, 2005. [Google Scholar]
  25. Huseien, G.F.; Mirza, J.; Ismail, M.; Ghoshal, S.K.; Hussein, A.A. Geopolymer mortars as sustainable repair material: A comprehensive review. Renew. Sustain. Energ. Rev. 2017, 80, 54–74. [Google Scholar]
  26. Duan, P.; Yan, C.; Zhou, W. Influence of partial replacement of fly ash by metakaolin on mechanical properties and microstructure of fly ash geopolymer paste exposed to sulfate attack. Ceram. Int. 2016, 42, 3504–3517. [Google Scholar] [CrossRef]
  27. Nath, P.; Sarker, P.K. Use of OPC to improve setting and early strength properties of low calcium fly ash geopolymer concrete cured at room temperature. Cem. Concr. Compos. 2015, 55, 205–214. [Google Scholar] [CrossRef]
  28. Ahmed, H.U.; Mohammed, A.A.; Rafiq, S.; Mohammed, A.S.; Mosavi, A.; Sor, N.H.; Qaidi, S. Compressive Strength of Sustainable Geopolymer Concrete Composites: A State-of-the-Art Review. Sustainability 2021, 13, 13502. [Google Scholar] [CrossRef]
  29. Ariffin, M.A.M.; Bhutta, M.A.R.; Hussin, M.W.; Mohd Tahir, M.; Aziah, N. Sulfuric acid resistance of blended ash geopolymer concrete. Constr. Build. Mater. 2013, 43, 80–86. [Google Scholar] [CrossRef]
  30. Sanni, S.H.; Khadiranaikar, R.B. Performance of geopolymer concrete under severe environmental conditions. Int. J. Civ. Eng. Struct. Eng. 2012, 3, 396–407. [Google Scholar]
  31. Reddy, D.V.; Edouard, J.B.; Sobhan, K. Durability of Fly Ash–Based Geopolymer Structural Concrete in the Marine Environment. J. Mater. Civ. Eng. 2012, 25, 781–787. [Google Scholar] [CrossRef]
  32. Sharif, H.H. Fresh and Mechanical Characteristics of Eco-efficient Geopolymer Concrete Incorporating Nano-silica: An Overview. Kurd. J. App. Res. 2021, 64–74. [Google Scholar] [CrossRef]
  33. Khedmati, M.; Alanazi, H.; Kim, Y.R.; Nsengiyumva, G.; Moussavi, S. Effects of Na2O/SiO2 molar ratio on properties of aggregate-paste interphase in fly ash-based geopolymer mixtures through multiscale measurements. Constr. Build. Mater. 2018, 191, 564–574. [Google Scholar] [CrossRef]
  34. Škvára, F.; Kopecký, L.; Nemecek, J.; Bittnar, Z. Microstructure of geopolymer materials based on fly ash. Ceram Silik. 2006, 50, 208–215. [Google Scholar]
  35. Li, W.; Xiao, J.; Kawashima, S.; Shekhawat, G.S.; Shah, S.P. Experimental Investigation on Quantitative Nanomechanical Properties of Cement Paste. ACI Mater. J. 2015, 112, 229–238. [Google Scholar] [CrossRef]
  36. Němeček, J.; Šmilauer, V.; Kopecký, L. Nanoindentation characteristics of alkali-activated aluminosilicate materials. Cem. Concr. Compos. 2011, 33, 163–170. [Google Scholar] [CrossRef]
  37. Šmilauer, V.; Škvára, F.; Němeček, J.; Kopecký, L.; Hlaváček, P. Application of Micromechanics on Alkali-activated Materials. Adv. Sci. Technol. 2010, 69, 75–85. [Google Scholar]
  38. Garcia-Lodeiro, I.; Palomo, A.; Fernández-Jiménez, A.; Macphee, D.E. Compatibility studies between N-A-S-H and C-A-S-H gels. Study in the ternary diagram Na2O-CaO-Al2O3-SiO2-H2O. Cem. Concr. Res. 2011, 41, 923–931. [Google Scholar] [CrossRef]
  39. Mondal, P.; Shah, S.; Marks, L. Nanomechanical properties of interfacial transition zone in concrete. In Nanotechnology in Construction 3; Springer: Berlin, Germany, 2009; pp. 315–320. [Google Scholar]
  40. Zhang, J.; Sun, H.; Wan, J.; Yi, Z. Study on microstructure and mechanical property of interfacial transition zone between limestone aggregate and Sialite paste. Constr. Build. Mater. 2009, 23, 3393–3397. [Google Scholar] [CrossRef]
  41. Vandamme, M. The Nanogranular Origin of Concrete Creep: A Nanoindentation Investigation of Microstructure and Fundamental Properties of Calcium-Silicate-Hydrates. Ph.D. Thesis, Massachusetts Institute of Technology, Boston, MA, USA, 2008. [Google Scholar]
  42. Zhu, W.; Sonebi, M.; Bartos, P.J.M. Bond and interfacial properties of reinforcement in self-compacting concrete. Mater. Struct. 2004, 37, 442. [Google Scholar] [CrossRef]
  43. Alanazi, H.; Yang, M.; Zhang, D.; Gao, Z.J. Bond strength of PCC pavement repairs using metakaolin-based geopolymer mortar. Cem. Concr. Compos. 2016, 65, 75–82. [Google Scholar] [CrossRef]
  44. Wei, Y.; Gao, X.; Liang, S. Nanoindentation-based study of the micro-mechanical properties, structure, and hydration degree of slag-blended cementitious materials. J. Mater. Sci. 2016, 51, 3349–3361. [Google Scholar] [CrossRef]
  45. Mitsui, K.; Li, Z.; Lange, D.A.; Shah, S.P. Relationship between microstructure and mechanical properties of paste-aggregate interface. ACI Mater. J. 1994, 91, 30–39. [Google Scholar]
  46. Lloyd, R.R.; Provis, J.L.; van Deventer, J.S. Microscopy and microanalysis of inorganic polymer cements. 2: The gel binder. J. Mater. Sci. 2009, 44, 620–631. [Google Scholar] [CrossRef]
  47. Aligizaki, K.K. Pore Structure of Cement-Based Materials—Testing, Interpretation and Requirement; Taylor & Francis: New York, NY, USA, 2006. [Google Scholar]
  48. Morsy, M.S.; Alsayed, S.H.; Al-Salloum, Y.; Almusallam, T. Effect of sodium silicate to sodium hydroxide ratios on strength and microstructure of fly ash geopolymer binder. Arab. J. Sci. Eng. 2014, 39, 4333–4339. [Google Scholar] [CrossRef]
  49. Pradhan, S.; Kumar, S.; Barai, S.V. Multi-scale characterisation of recycled aggregate concrete and prediction of its performance. Cem. Concr. Compos. 2020, 106, 103480. [Google Scholar] [CrossRef]
  50. Li, W.; Kawashima, S.; Xiao, J.; Corr, D.J.; Shi, C.; Shah, S.P. Comparative investigation on nanomechanical properties of hardened cement paste. Mater. Struct. 2016, 49, 1591–1604. [Google Scholar] [CrossRef]
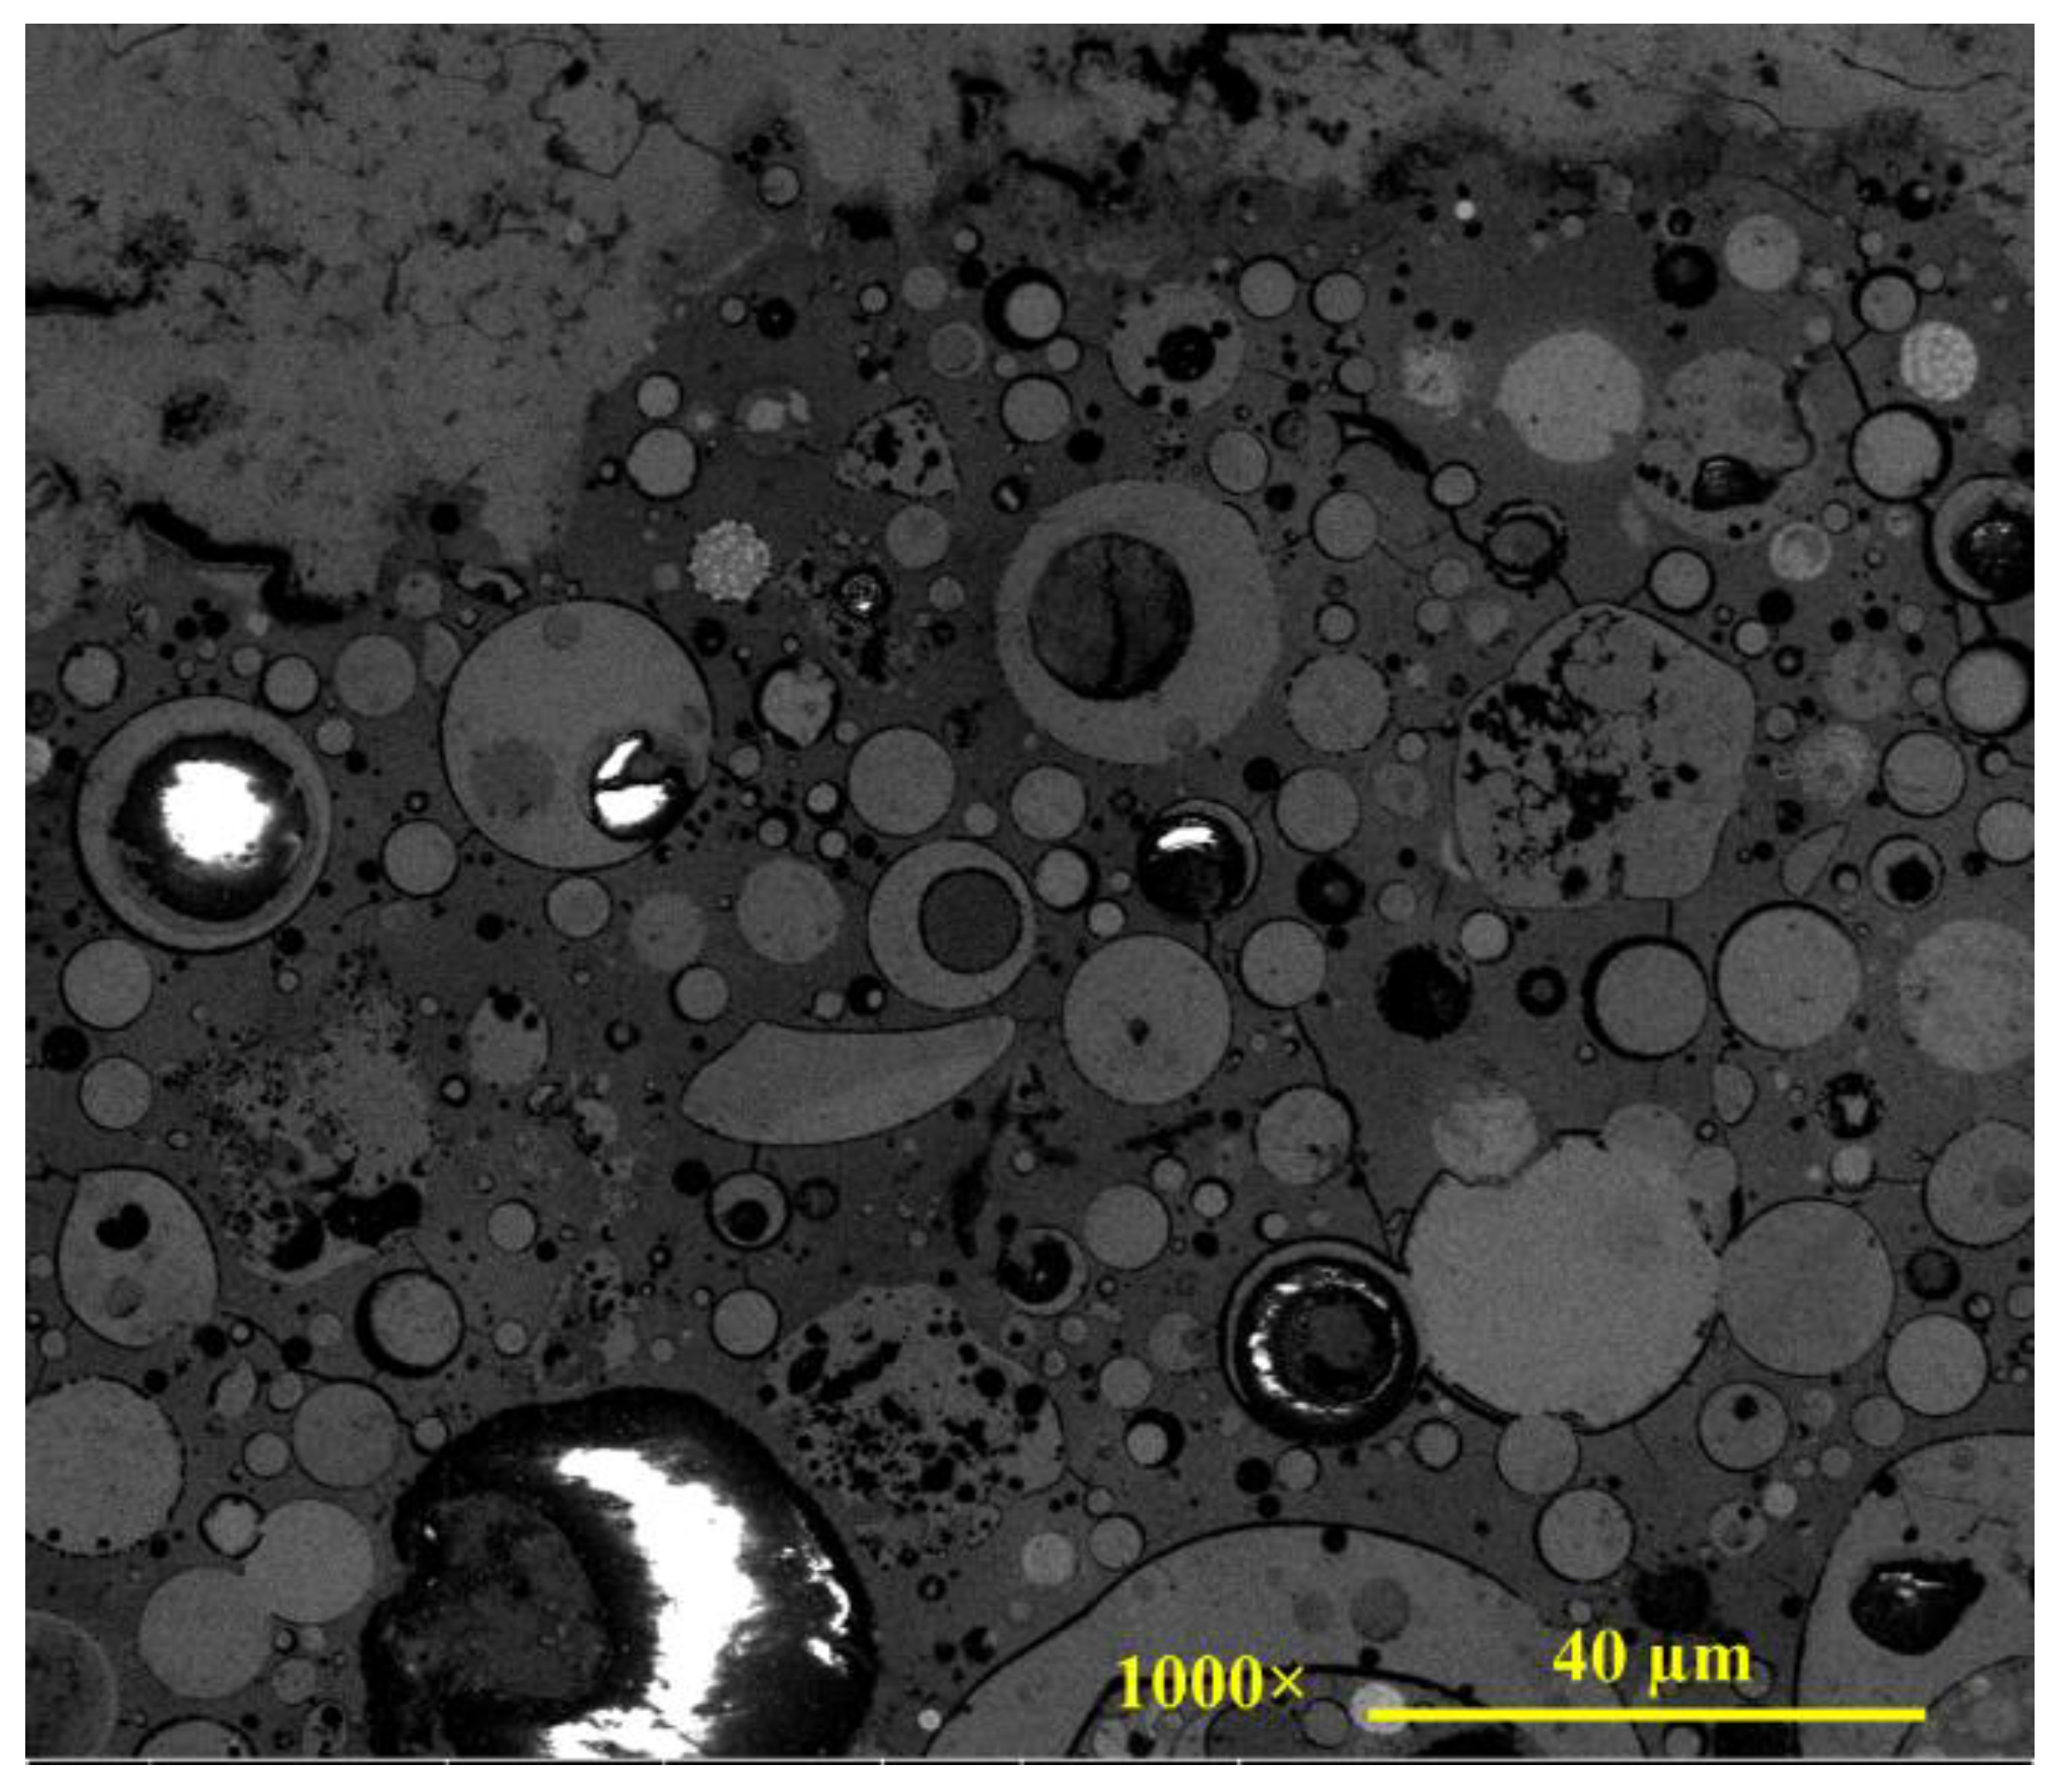
Figure 1. SEM image of geopolymer microstructure.
Gels 08 00105 g001
Figure 2. Consecutive zoomed SEM images of geopolymer mixture.
Gels 08 00105 g002
Figure 3. SEM image of OPC concrete microstructure.
Gels 08 00105 g003
Figure 4. A geopolymer microstructure (780 µm by 585 µm) with multiple phases and indentation zone.
Gels 08 00105 g004
Figure 5. Indentation modulus over the aggregate and geopolymer paste of the geopolymer concrete.
Gels 08 00105 g005
Figure 6. Indentation modulus over the aggregate and cement paste of the OPC concrete.
Gels 08 00105 g006
Figure 7. Typical nanoindentation test results of different phases in geopolymer matrix.
Gels 08 00105 g007
Figure 8. Loading diagram of the indention test.
Gels 08 00105 g008
Table 1. Details of mix proportions.
MixPortland Cement, gFly Ash, gCoarse Aggregate Fraction (mm), gWater, mLSodium Silicate Solution, mLSodium Hydroxide Solution, mL
19–12.512.5–9.59.5–4.75
Geopolymer010006805674530286114
OPC1000068056745340000
Publisher’s Note: MDPI stays neutral with regard to jurisdictional claims in published maps and institutional affiliations.