
Preparation and Hydrogelling Performances of a New Drilling Fluid Filtrate Reducer from Plant Press Slag

 , ,
, ,
Abstract
:
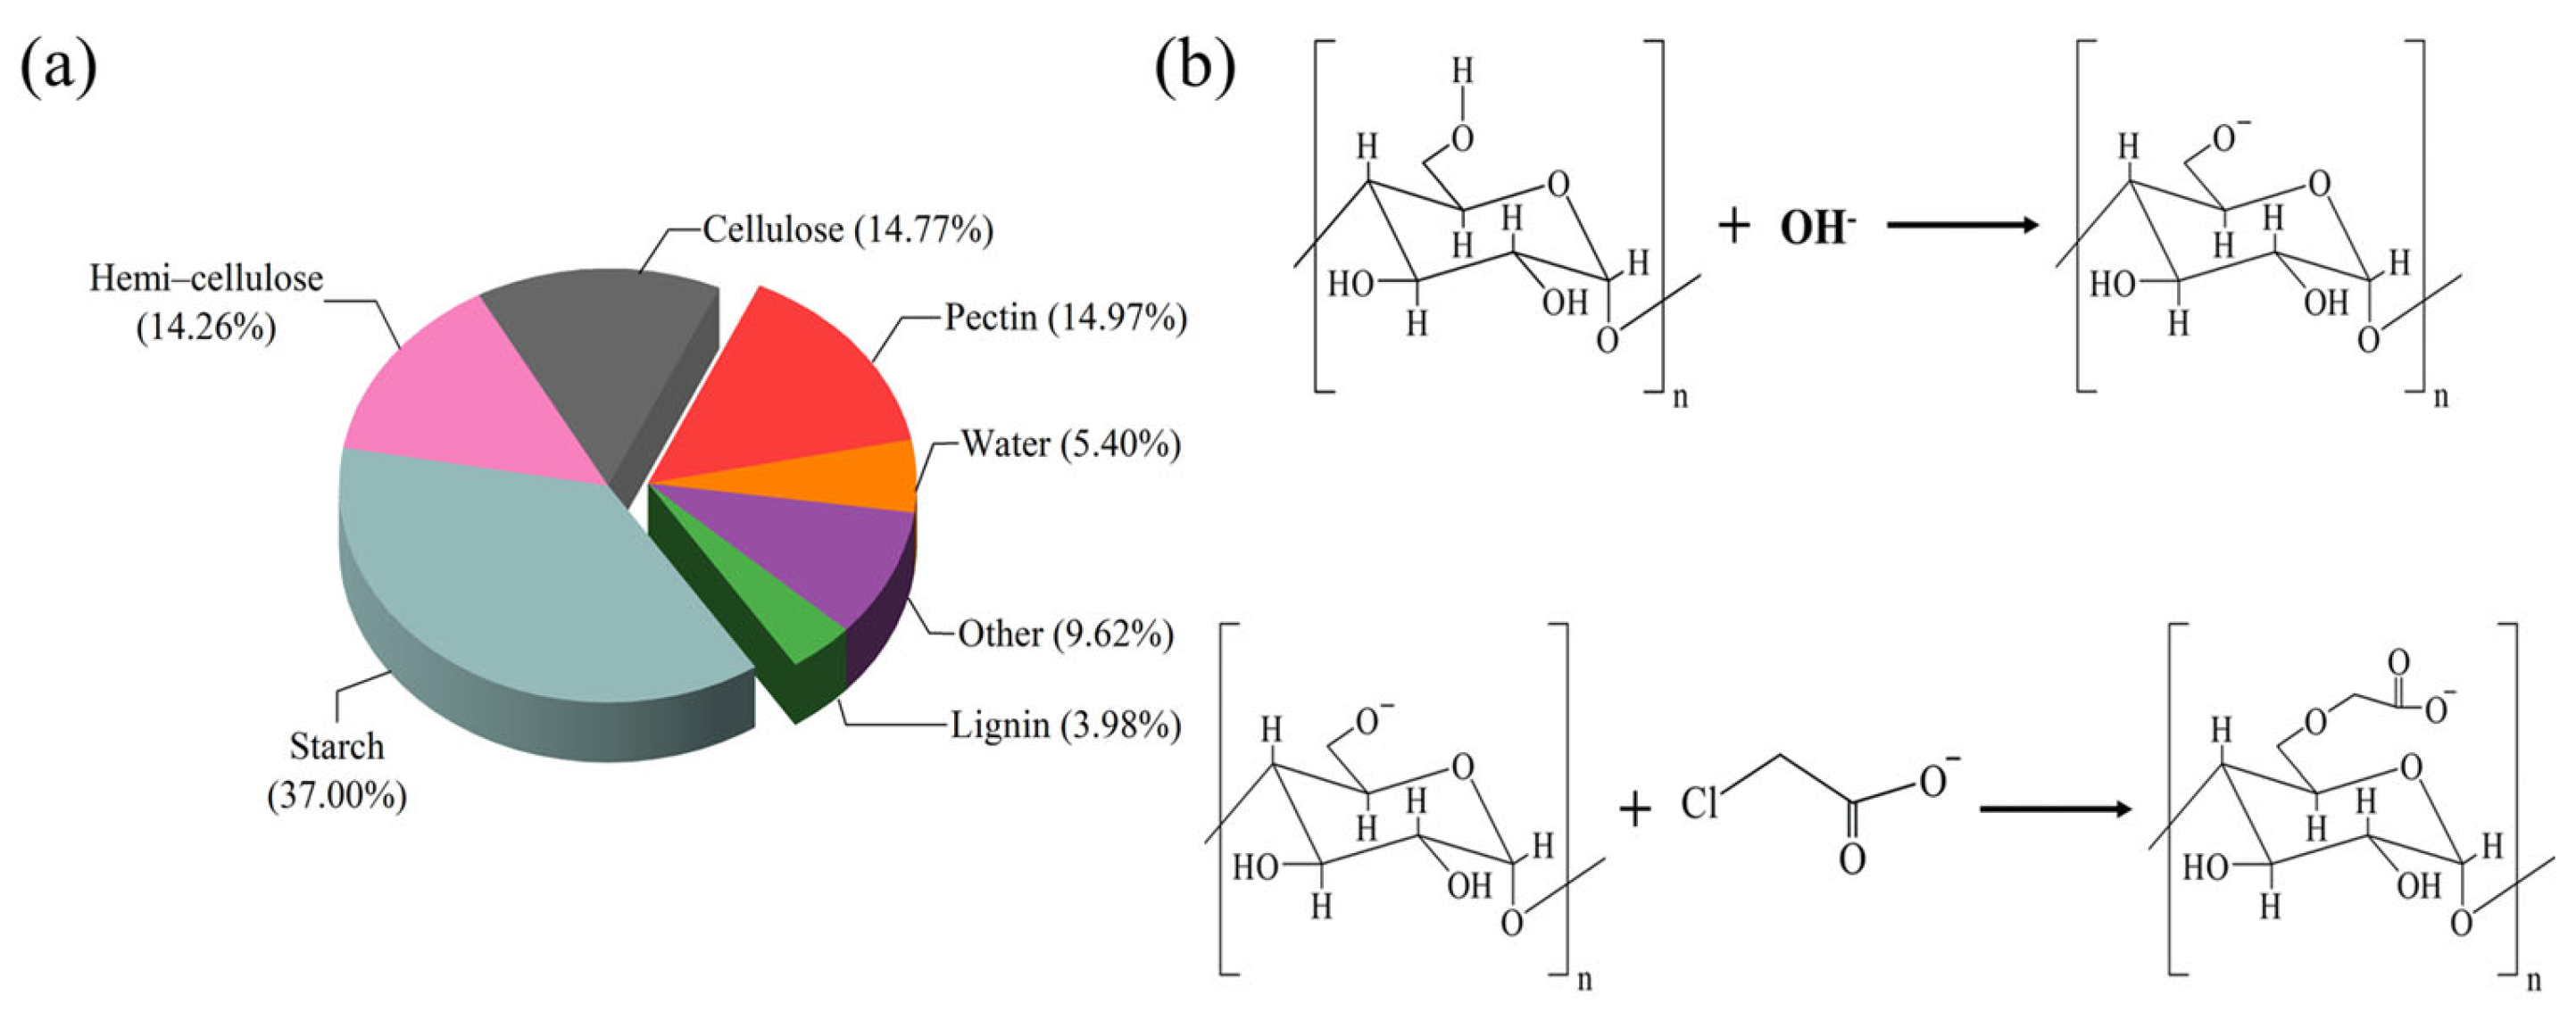
1. Introduction
2. Results and Discussion
2.1. Structural Characterizations
2.1.1. Elemental Analysis (EA)
2.1.2. XRD Characterization
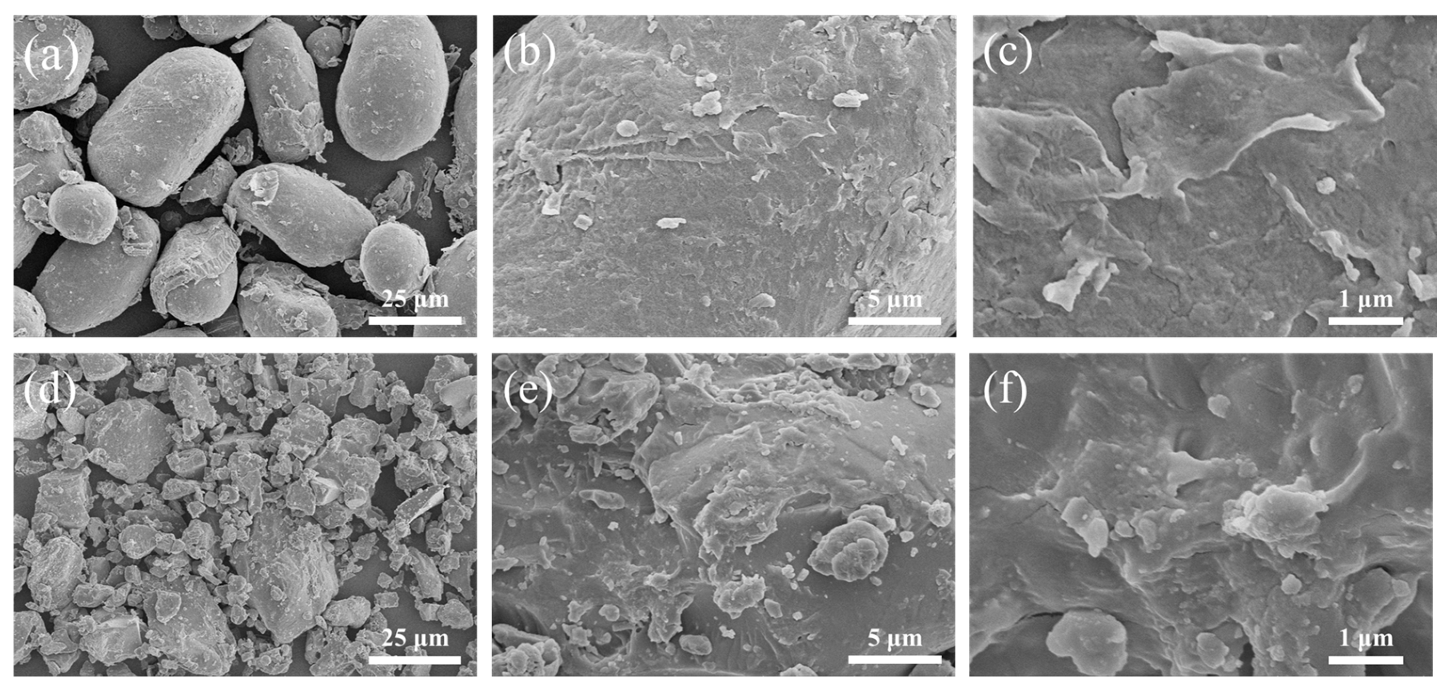
2.1.3. SEM Characterization
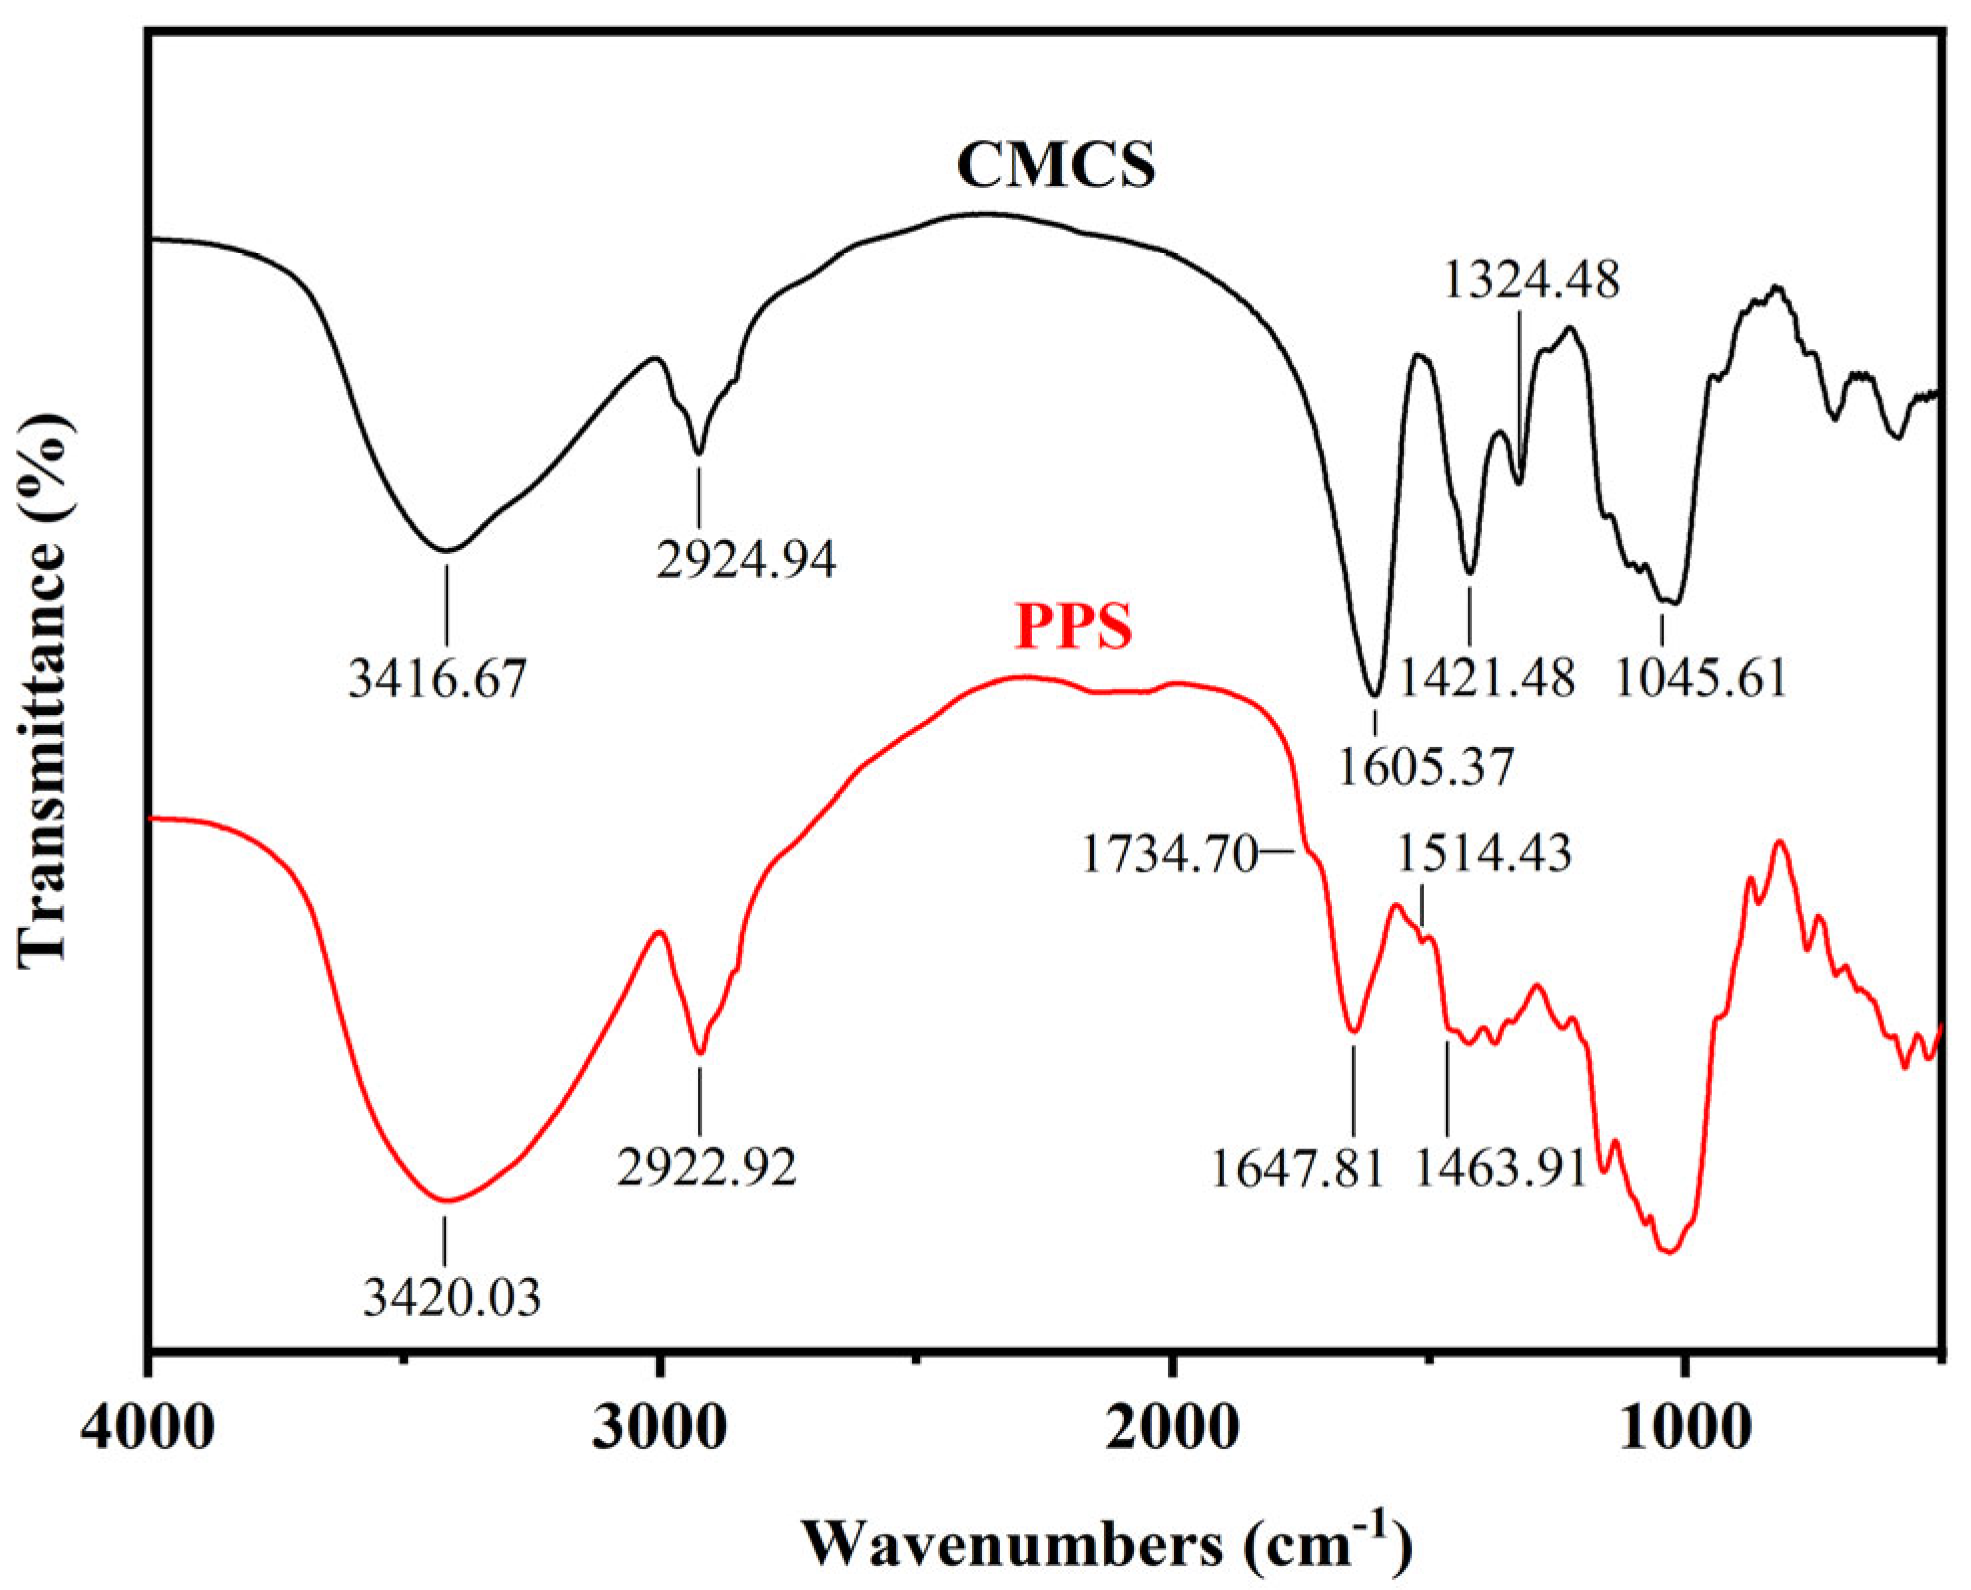
2.1.4. Infrared Spectroscopy Characterization
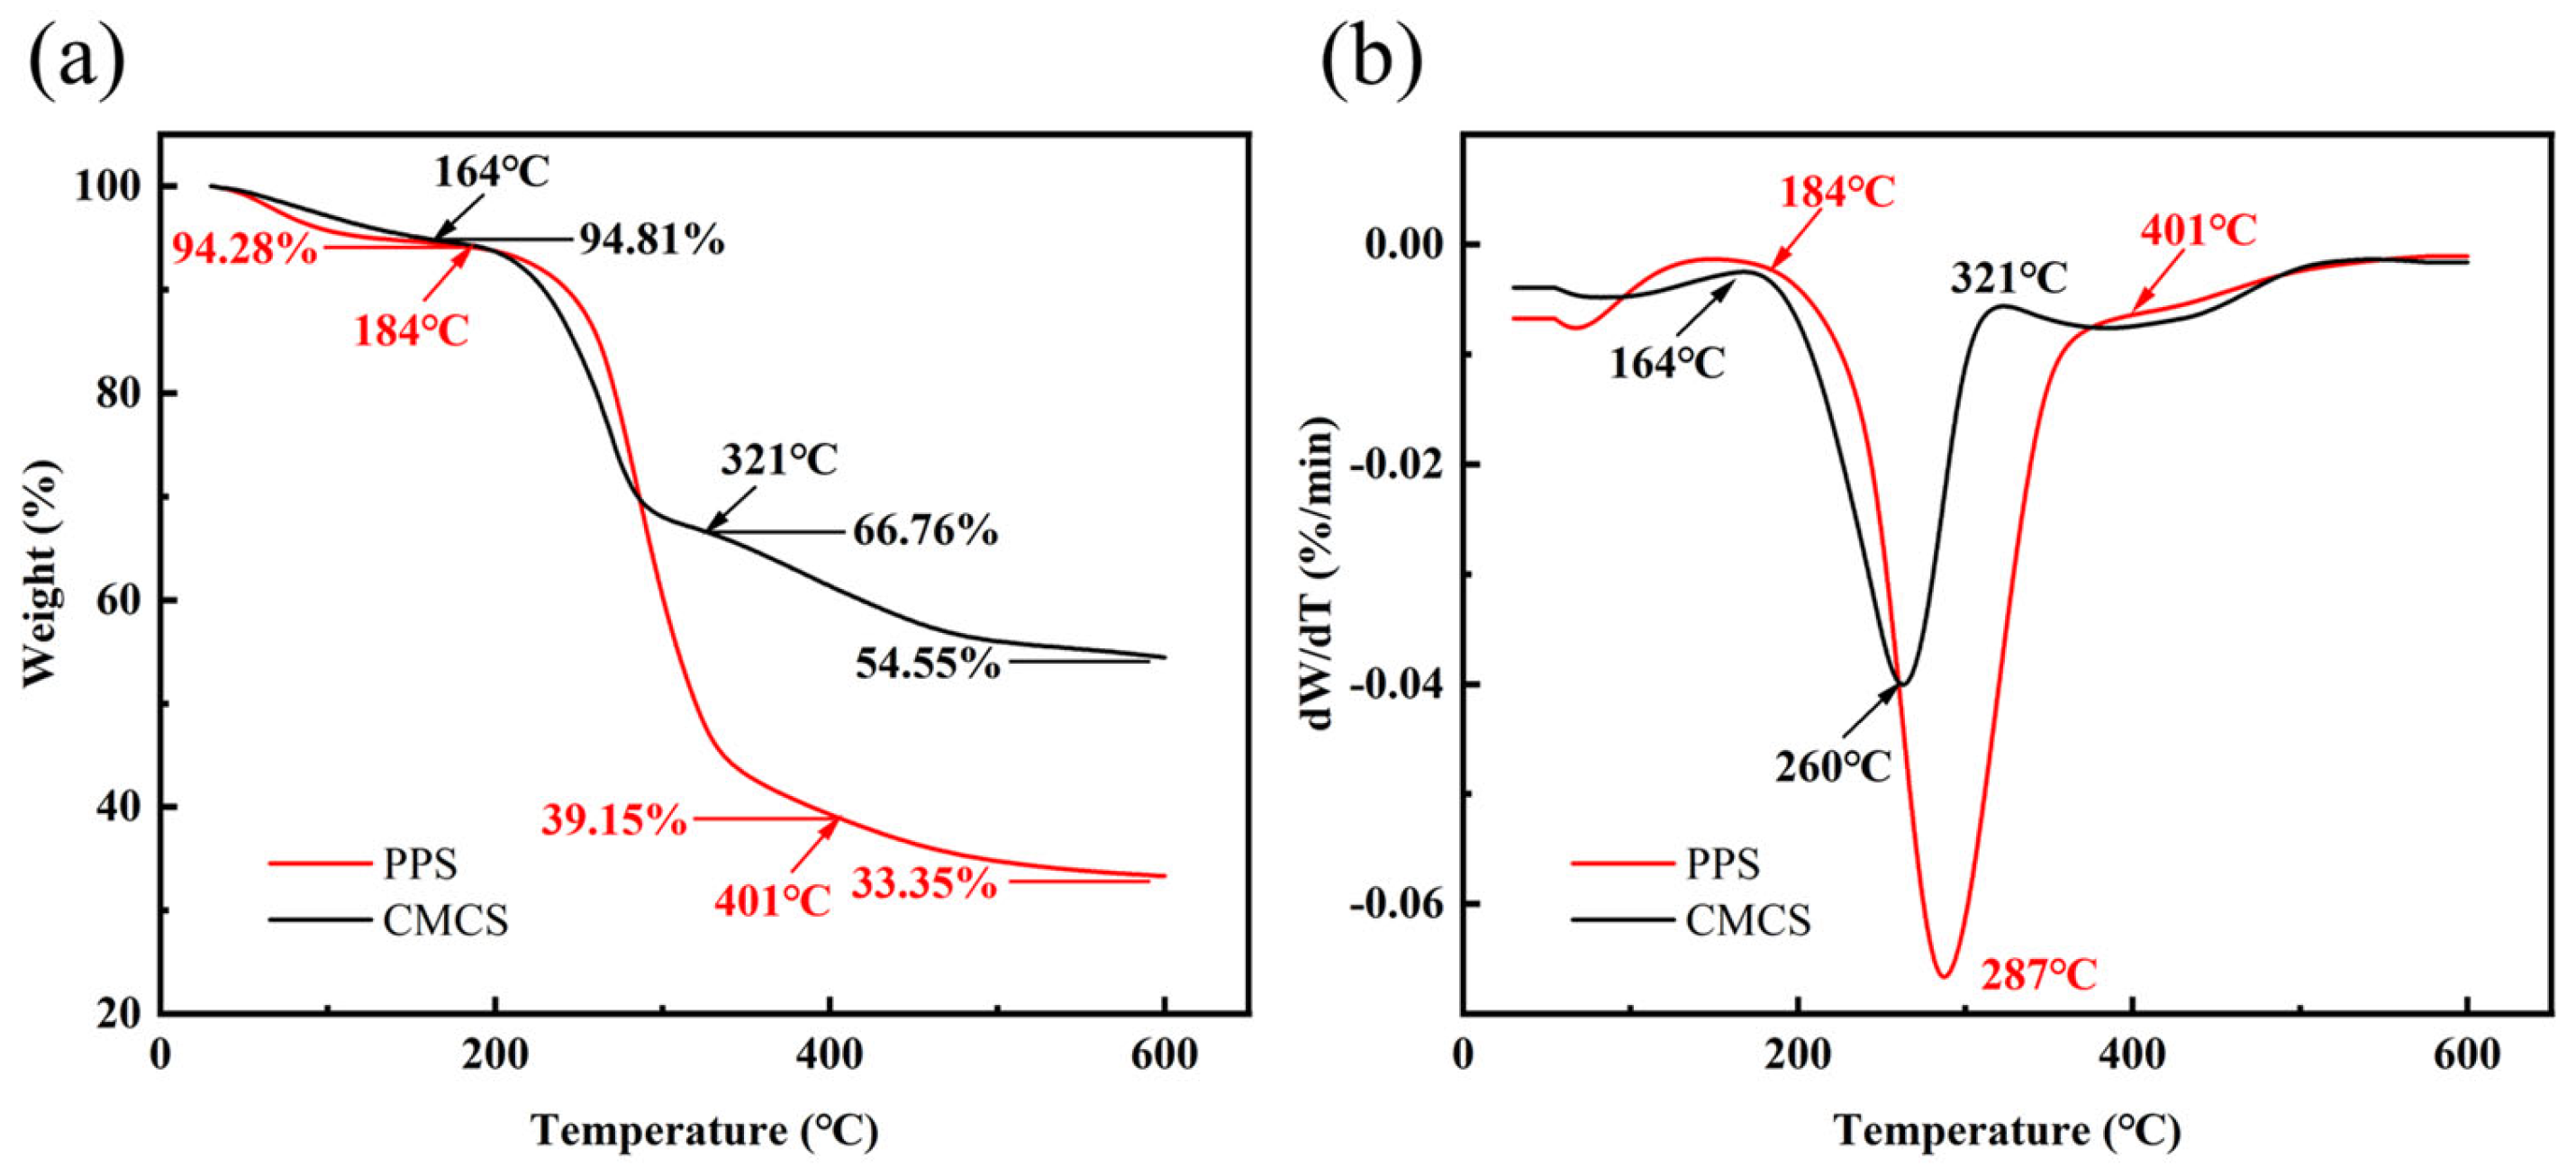
2.1.5. Thermogravimetric Characterization
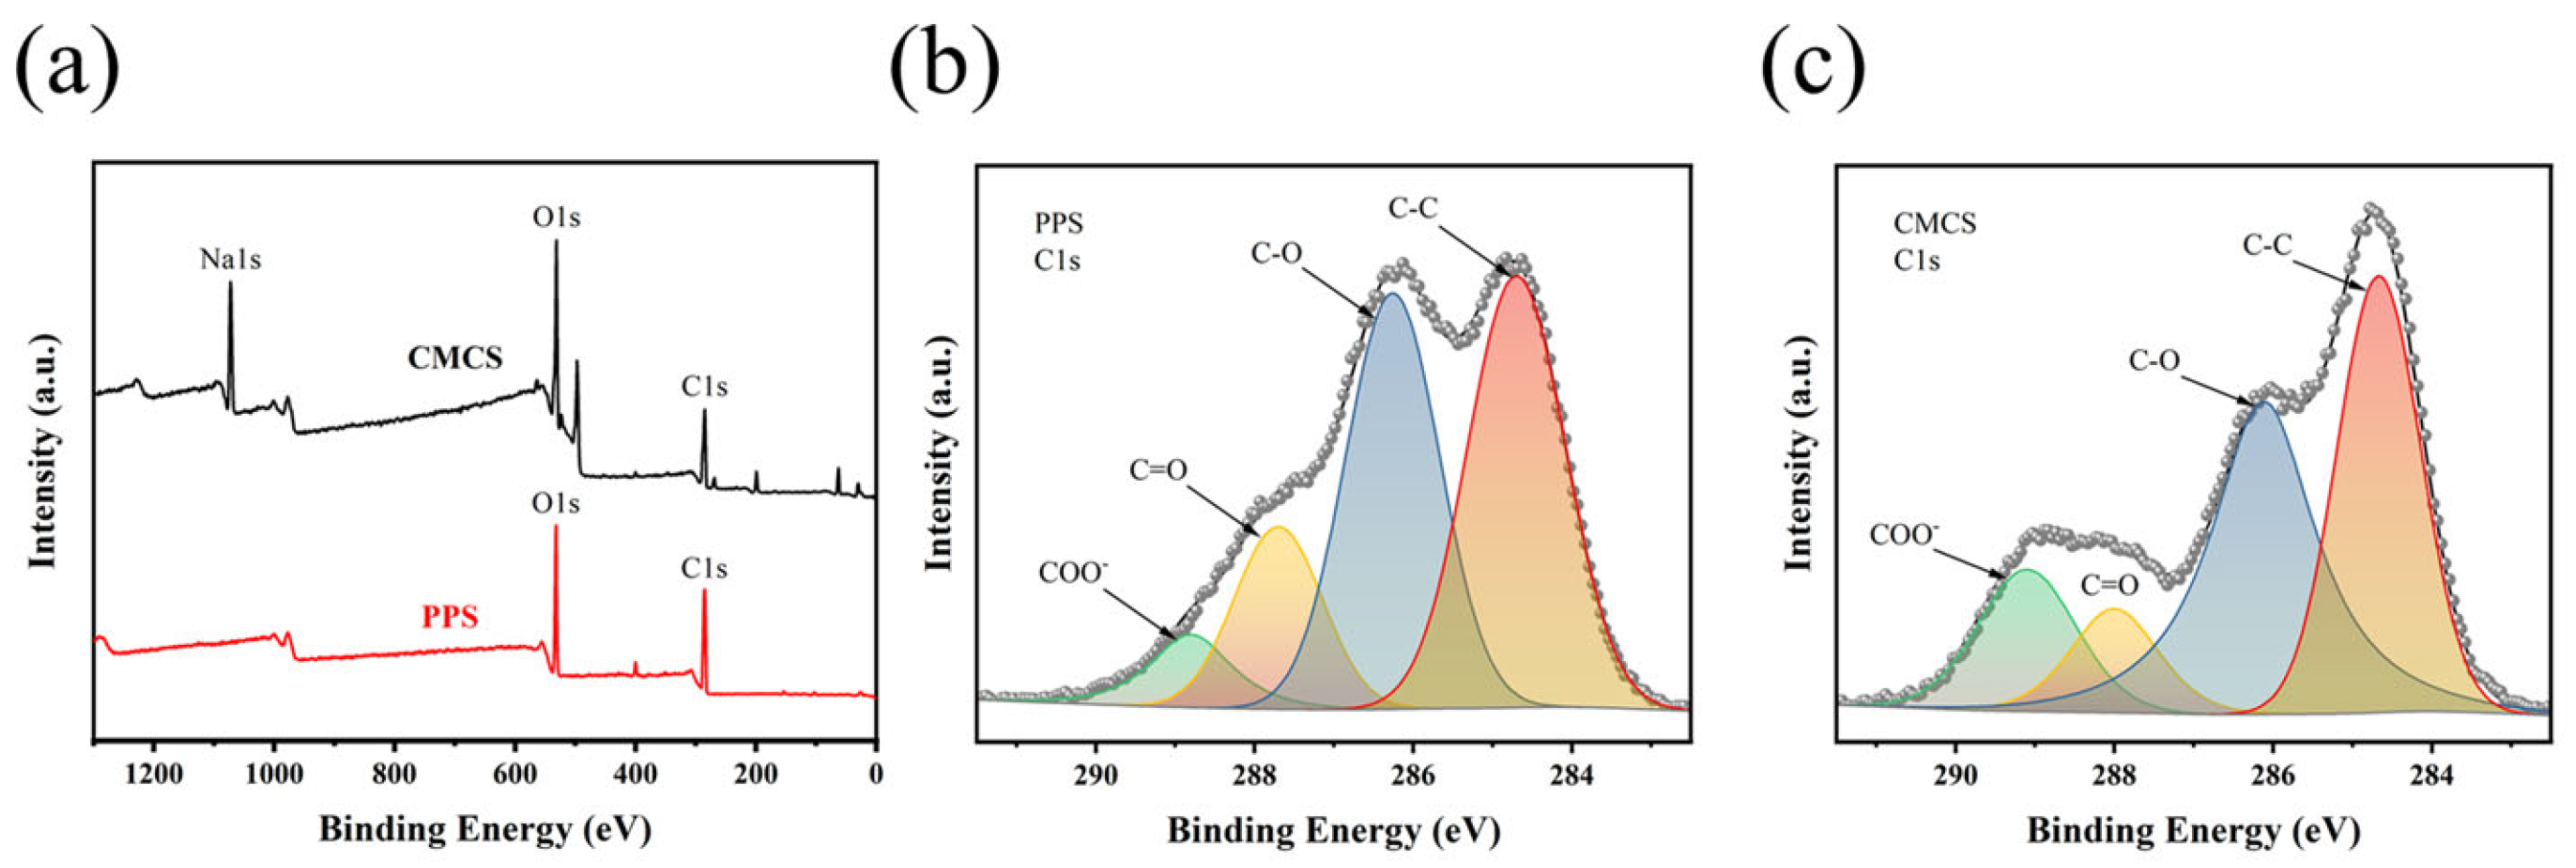
2.1.6. XPS Analysis
2.2. Optimization of Experimental Parameters for Carboxymethylation
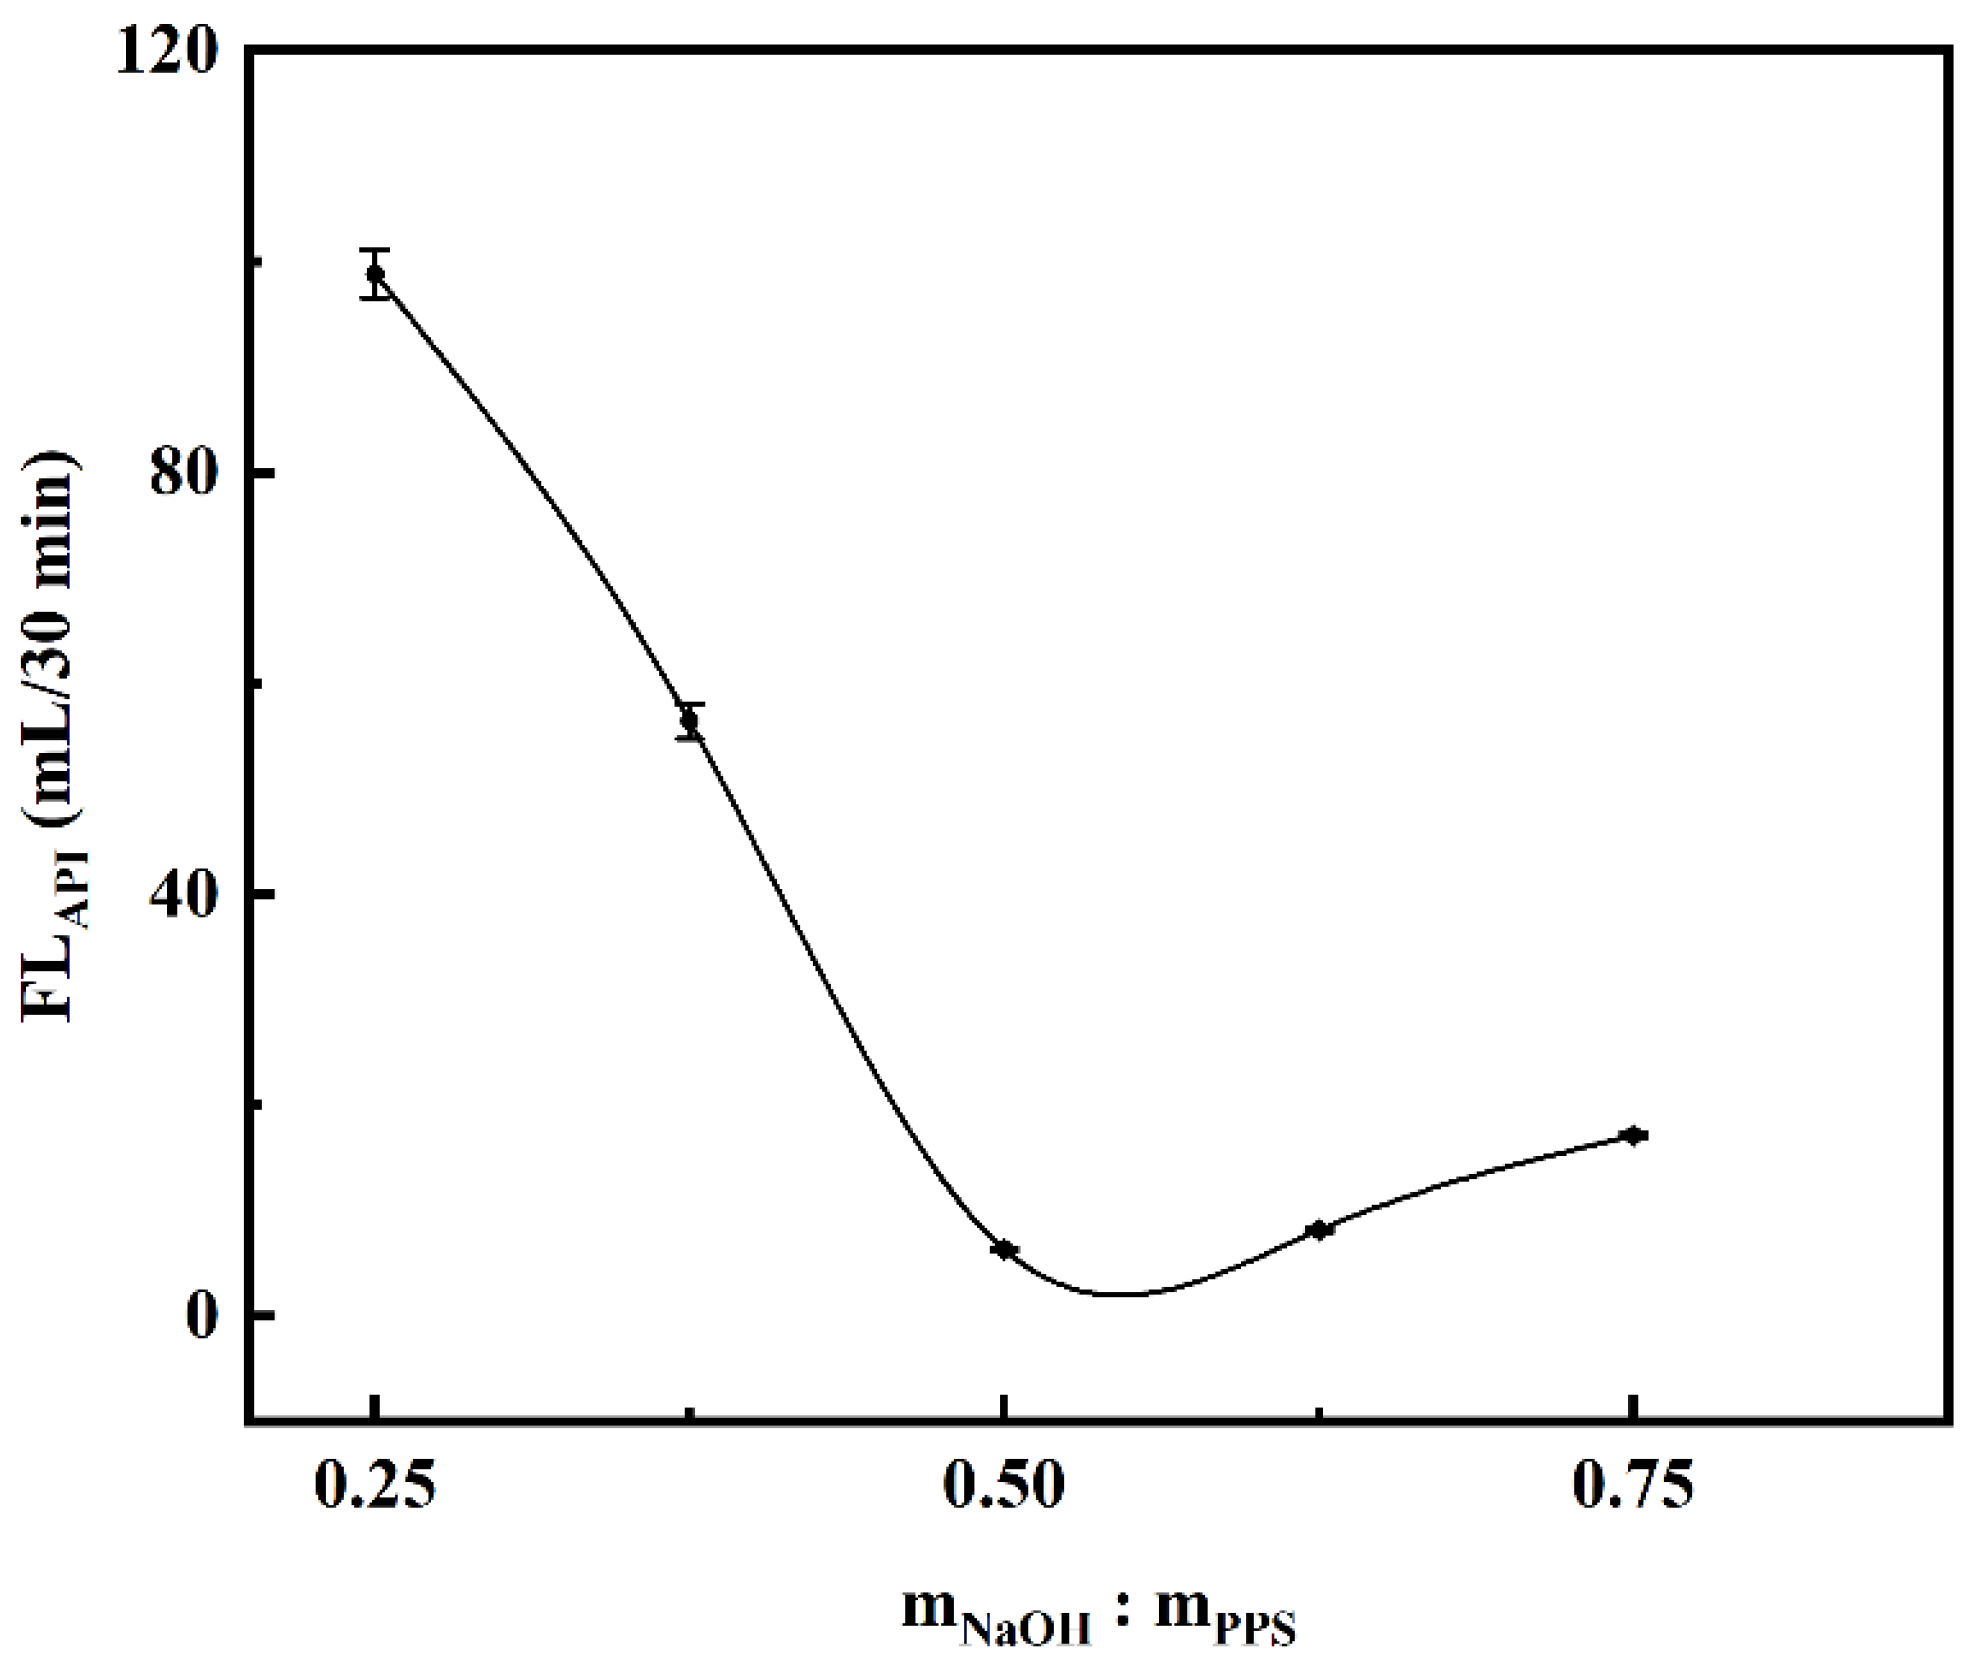
2.2.1. Effect of NaOH Dosage on Filtration Loss Performance of CMCS
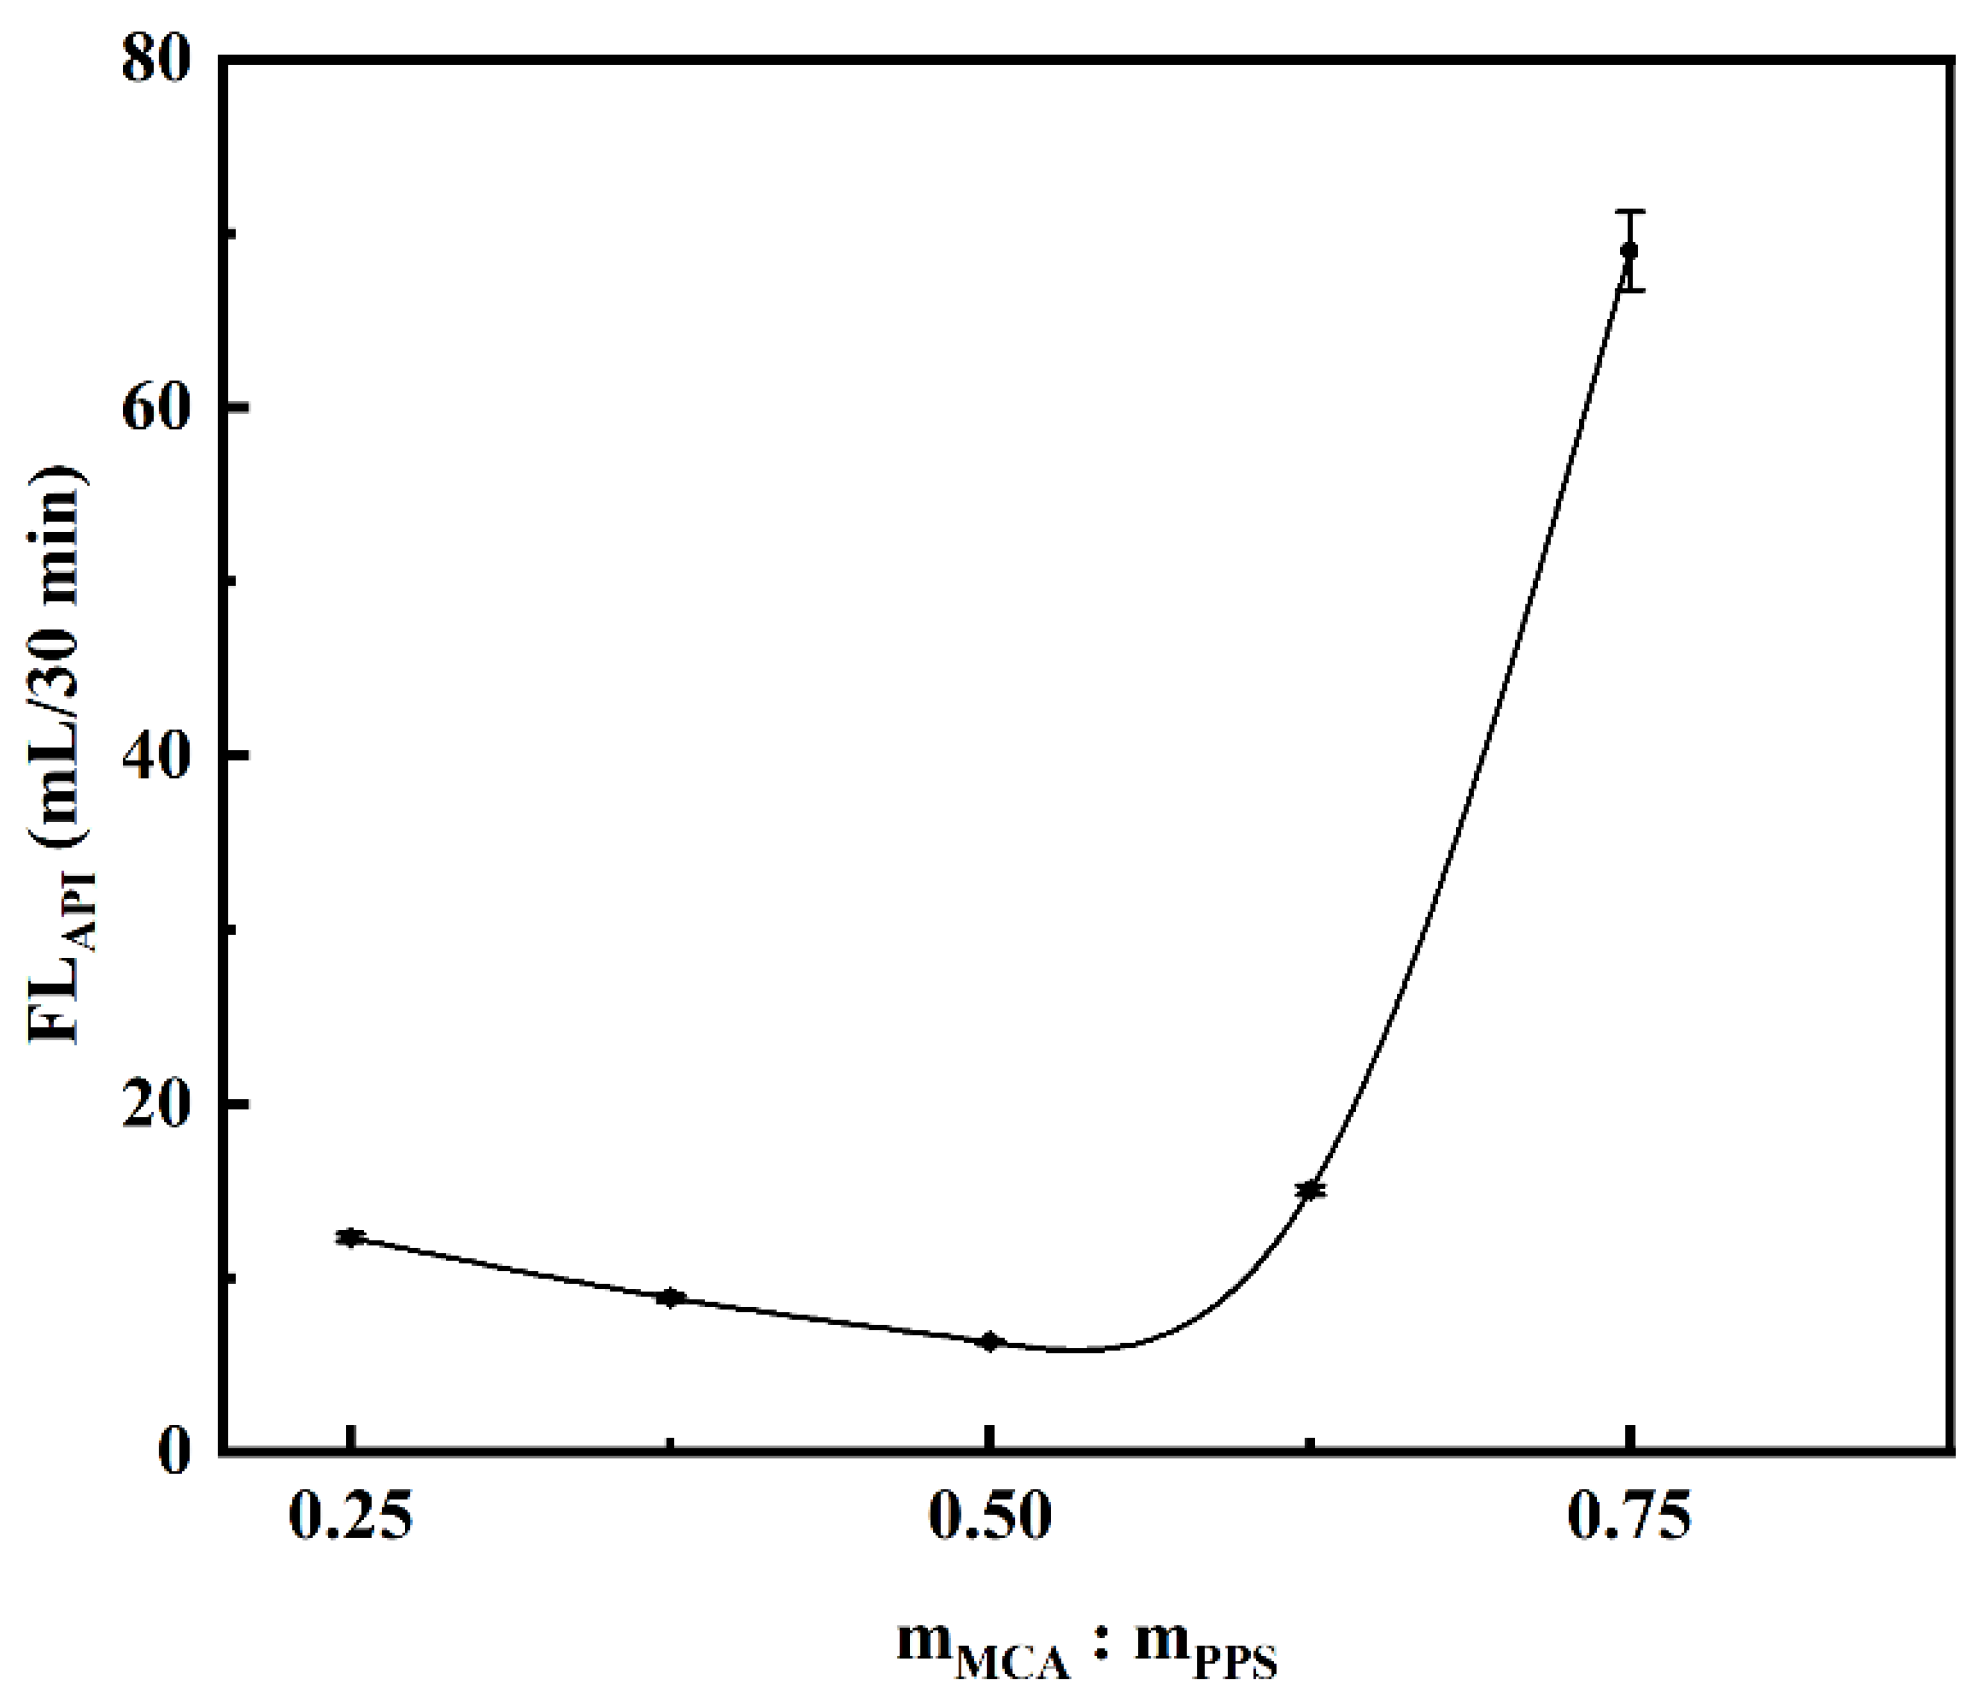
2.2.2. Effect of Etherifying Agent Dosage on Filtration Loss Performance of CMCS
2.2.3. Effect of Etherification Temperature on Filtration Loss Performance of CMCS
2.3. Comparison between CMCS and Other Fluid Loss Additives
2.4. Rheological Properties of the Drilling Fluid
2.5. Lubricity Performance of CMCS
2.6. Biodegradability Performance of CMCS
2.6.1. Determination of BOD5 of CMCS
2.6.2. Determination of CODcr of CMCS
2.7. Biotoxicity of CMCS
3. Conclusions
4. Materials and Methods
4.1. Materials
4.2. Methods
4.2.1. Synthesis of CMCS
4.2.2. Elemental Analysis (EA)
4.2.3. X-ray Diffraction (XRD)
4.2.4. Scanning Electron Microscope (SEM)
4.2.5. Fourier Transform Infrared Spectra (FT-IR)
4.2.6. Thermogravimetric (TG)
4.2.7. X-ray Photoelectron Spectroscopy (XPS)
4.2.8. Performance Tests of the Drilling Fluids
Preparation of Base Slurry
Determination of API Filtration Loss
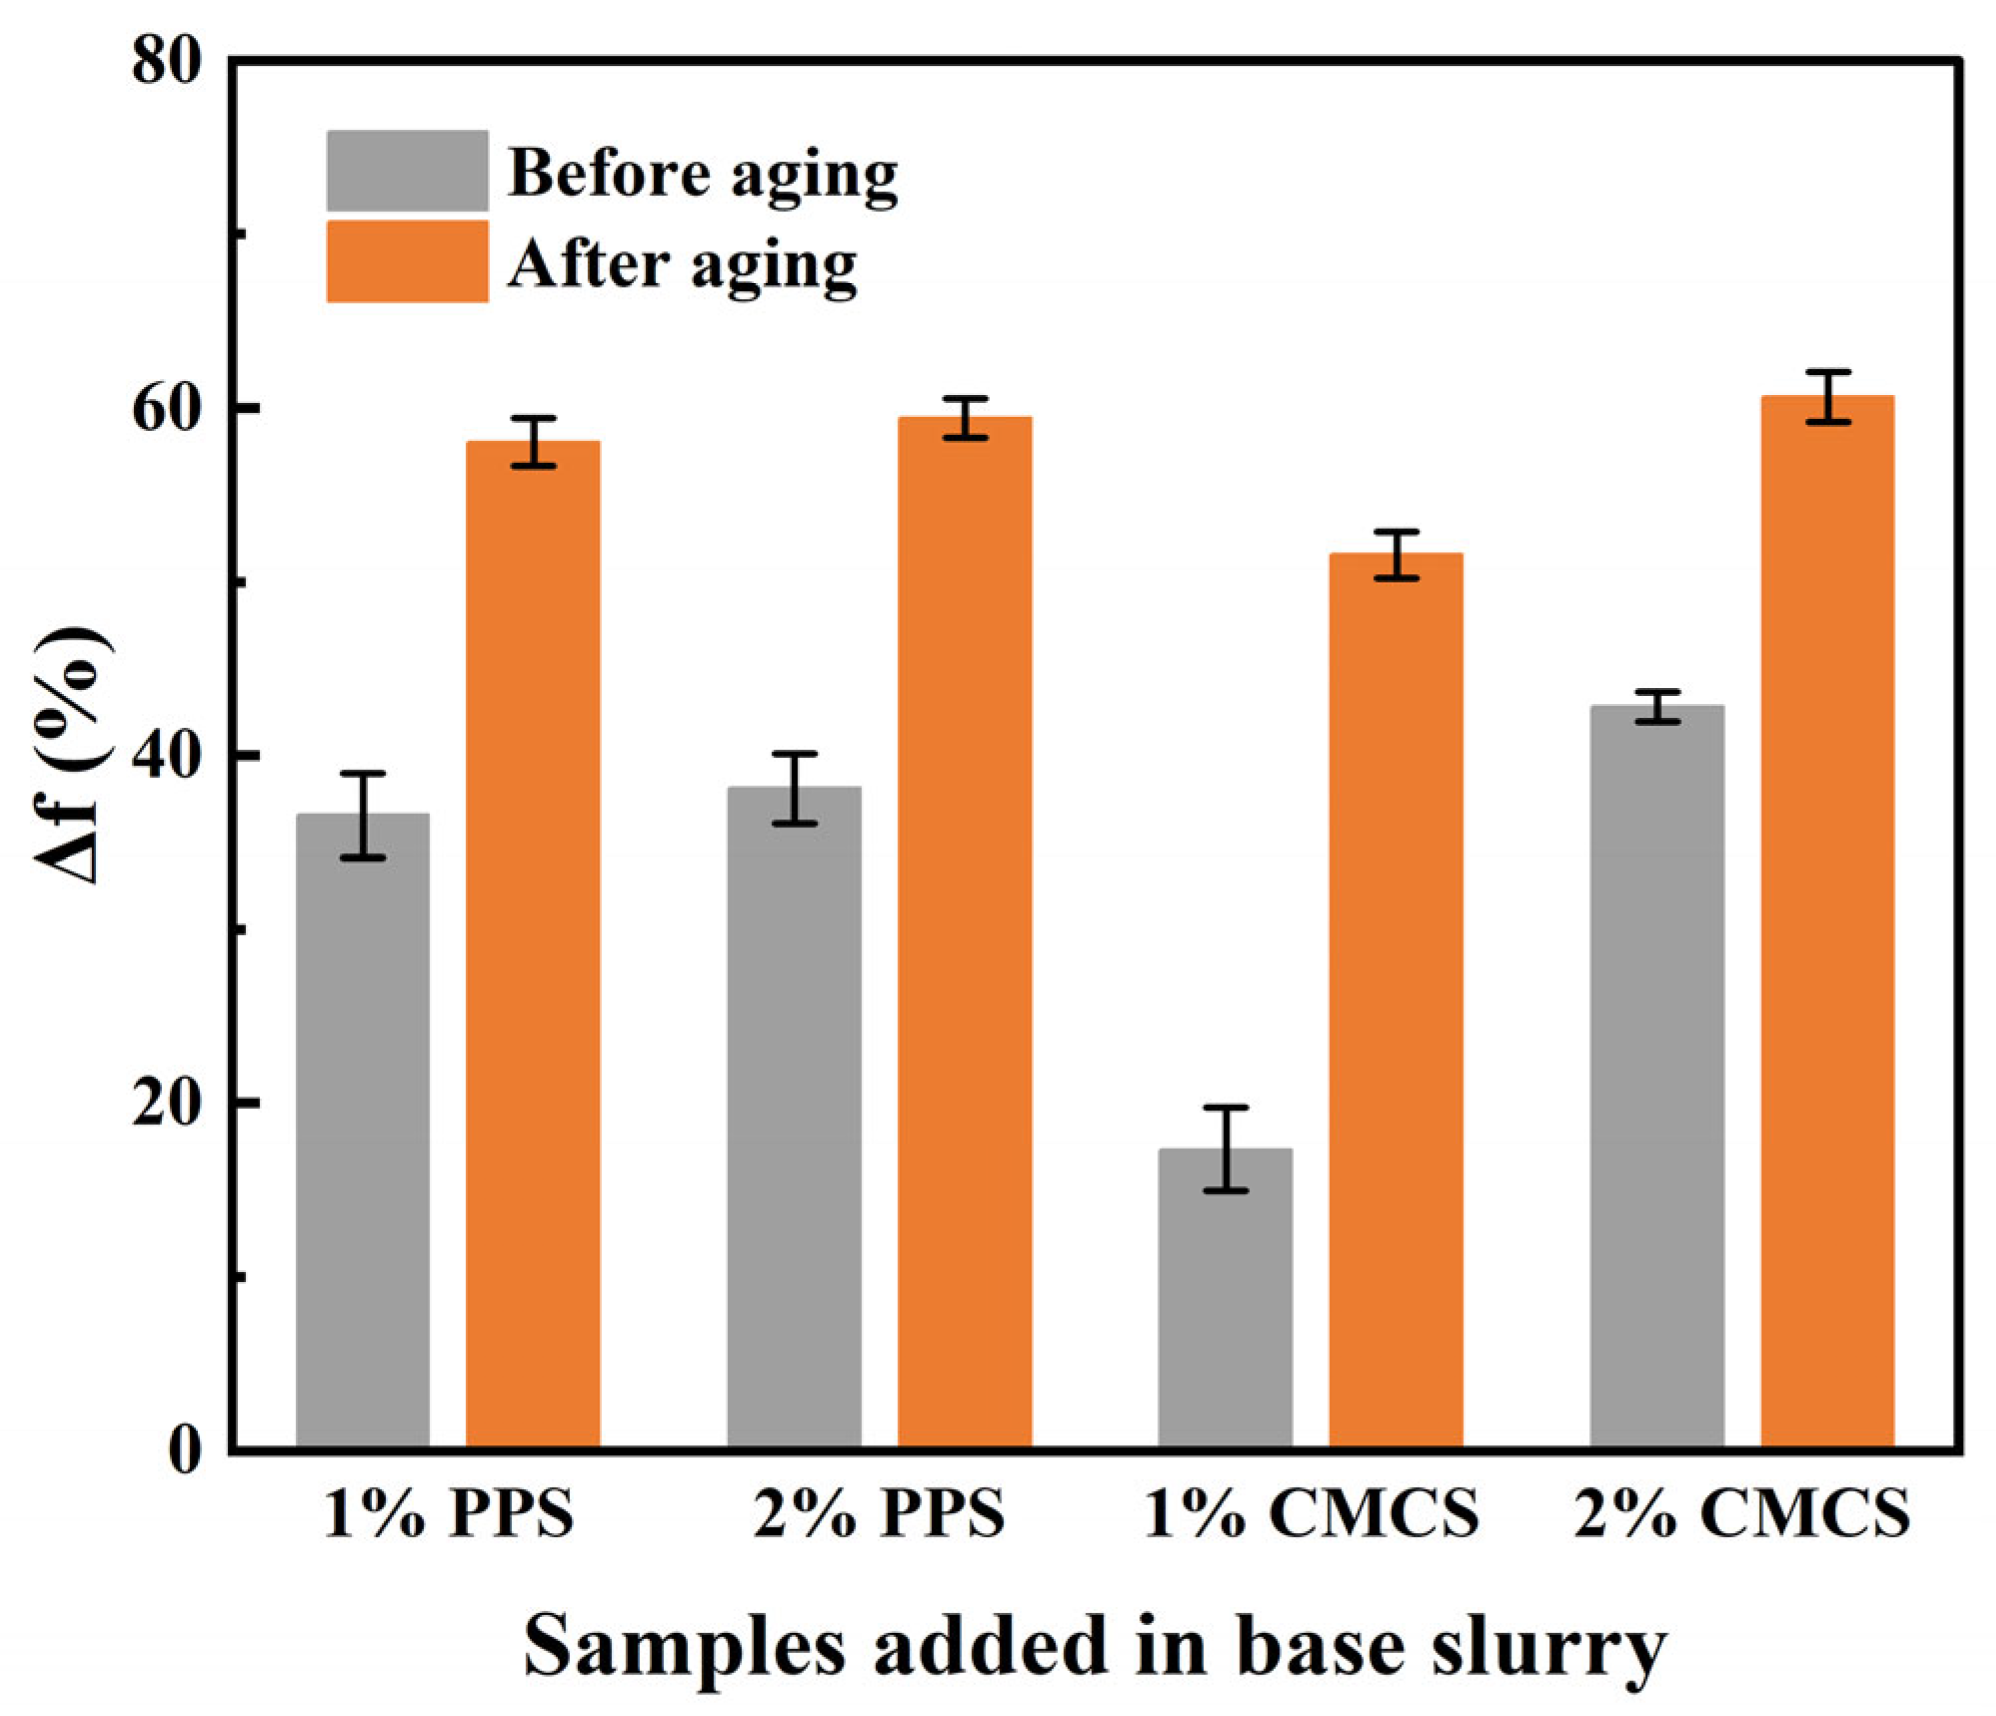
Determination of Temperature Tolerance
Determination of Rheological Property
Determination of Lubricity Performance
4.2.9. Biodegradability Test
Determination of BOD5
DDetermination of CODcr
4.2.10. Biological Toxicity Test
Author Contributions
Funding
Institutional Review Board Statement
Informed Consent Statement
Data Availability Statement
Conflicts of Interest
References
- Junpen, A.; Pansuk, J.; Kamnoet, O.; Cheewaphongphan, P.; Garivait, S. Emission of Air Pollutants from Rice Residue Open Burning in Thailand, 2018. Atmosphere 2018, 9, 449. [Google Scholar] [CrossRef] [Green Version]
- Zhang, H.; Hu, D.; Chen, J.; Ye, X.; Wang, S.; Hao, J.; Wang, L.; Zhang, R.; An, Z. Particle size distribution and polycyclic aromatic hydrocarbons emissions from agricultural crop residue burning. Environ. Sci. Technol. 2011, 45, 5477–5482. [Google Scholar] [CrossRef] [PubMed]
- Jin, H.; Reed, D.W.; Thompson, V.S.; Fujita, Y.; Jiao, Y.; Crain-Zamora, M.; Fisher, J.; Scalzone, K.; Griffel, M.; Hartley, D.; et al. Sustainable Bioleaching of Rare Earth Elements from Industrial Waste Materials Using Agricultural Wastes. ACS Sustain. Chem. Eng. 2019, 7, 15311–15319. [Google Scholar] [CrossRef]
- Hsu, E. Cost-benefit analysis for recycling of agricultural wastes in Taiwan. Waste Manag. 2021, 120, 424–432. [Google Scholar] [CrossRef] [PubMed]
- Zhang, L.; Wang, Y.; Liu, W.; Ni, Y.; Hou, Q. Corncob residues as carbon quantum dots sources and their application in detection of metal ions. Ind. Crops Prod. 2019, 133, 18–25. [Google Scholar] [CrossRef]
- Jiang, K.; Tang, B.; Wang, Q.; Xu, Z.; Sun, L.; Ma, J.; Li, S.; Xu, H.; Lei, P. The bio-processing of soybean dregs by solid state fermentation using a poly gamma-glutamic acid producing strain and its effect as feed additive. Bioresour. Technol. 2019, 291, 121841. [Google Scholar] [CrossRef]
- Zhou, R.; Ren, Z.; Ye, J.; Fan, Y.; Liu, X.; Yang, J.; Deng, Z.; Li, J. Fermented Soybean Dregs by Neurospora crassa: A Traditional Prebiotic Food. Appl. Biochem. Biotechnol. 2019, 189, 608–625. [Google Scholar] [CrossRef]
- Mo, W.; Man, Y.; Wong, M. Soybean dreg pre-digested by enzymes can effectively replace part of the fishmeal included in feed pellets for rearing gold-lined seabream. Sci. Total Environ. 2020, 704, 135266. [Google Scholar] [CrossRef]
- Zhao, C.; Zou, Z.; Li, J.; Jia, H.; Liesche, J.; Chen, S.; Fang, H. Efficient bioethanol production from sodium hydroxide pretreated corn stover and rice straw in the context of on-site cellulase production. Renew. Energy 2018, 118, 14–24. [Google Scholar] [CrossRef]
- Agwu, O.E.; Akpabio, J.U. Using agro-waste materials as possible filter loss control agents in drilling muds: A review. J. Pet. Sci. Eng. 2018, 163, 185–198. [Google Scholar] [CrossRef]
- Zoveidavianpoor, M.; Samsuri, A. The use of nano-sized Tapioca starch as a natural water-soluble polymer for filtration control in water-based drilling muds. J. Nat. Gas Sci. Eng. 2016, 34, 832–840. [Google Scholar] [CrossRef]
- Amanullah, M.; Ramasamy, J.; Al-Arfaj, M.K.; Aramco, S. Application of an indigenous eco-friendly raw material as fluid loss additive. J. Pet. Sci. Eng. 2016, 139, 191–197. [Google Scholar] [CrossRef]
- Igwilo, K.C.; Anawe, P.A.L.; Okolie, S.T.A.; Uzorchukwu, I.; Charles, O. Evaluation of the Fluid Loss Property of Annona muricata and Carica papaya. Open J. Yangtze Oil Gas 2017, 2, 144–150. [Google Scholar] [CrossRef] [Green Version]
- Hossain, M.E.; Wajheeuddin, M. The use of grass as an environmentally friendly additive in water-based drilling fluids. Pet. Sci. 2016, 13, 292–303. [Google Scholar] [CrossRef] [Green Version]
- Al-Hameedi, A.T.T.; Alkinani, H.H.; Dunn-Norman, S.; Al-Alwani, M.A.; Al-Bazzaz, W.H.; Alshammari, A.F.; Albazzaz, H.W.; Mutar, R.A. Experimental investigation of bio-enhancer drilling fluid additive: Can palm tree leaves be utilized as a supportive eco-friendly additive in water-based drilling fluid system? J. Pet. Explor. Prod. Technol. 2019, 10, 595–603. [Google Scholar] [CrossRef] [Green Version]
- Haleem, N.; Arshad, M.; Shahid, M.; Tahir, M.A. Synthesis of carboxymethyl cellulose from waste of cotton ginning industry. Carbohydr Polym. 2014, 113, 249–255. [Google Scholar] [CrossRef]
- Long, W.; Luo, H.; Yan, Z.; Zhang, C.; Hao, W.; Wei, Z.; Zhu, X.; Zhou, F.; Cha, R. Synthesis of filtrate reducer from biogas residue and its application in drilling fluid. Tappi J. 2020, 19, 151–158. [Google Scholar] [CrossRef]
- Huang, H. The Principles and Technology of Drilling Fluids; Petroleum Industry Press: Beijing, China, 2016. [Google Scholar]
- Darley, H.C.H.; Gray, G.R. Composition and Properties of Drilling and Completion Fluids, 6th ed.; Gulf Professional Publishing: Houston, TX, USA, 2011. [Google Scholar]
- Wang, Z. Present Situation and Development Direction of Modified Natural Material Additives for Drilling Fluid in China. Sino-Glob. Energy 2018, 23, 28–35. (In Chinese) [Google Scholar]
- Al-Hameedi, A.T.T.; Alkinani, H.H.; Dunn-Norman, S.; Al-Alwani, M.A.; Alshammari, A.F.; Alkhamis, M.M.; Mutar, R.A.; Al-Bazzaz, W.H. Experimental investigation of environmentally friendly drilling fluid additives (mandarin peels powder) to substitute the conventional chemicals used in water-based drilling fluid. J. Pet. Explor. Prod. Technol. 2020, 10, 407–417. [Google Scholar] [CrossRef] [Green Version]
- Al-Hameedi, A.T.T.; Alkinani, H.H.; Alkhamis, M.M.; Dunn-Norman, S. Utilizing a new eco-friendly drilling mud additive generated from wastes to minimize the use of the conventional chemical additives. J. Pet. Explor. Prod. Technol. 2020, 10, 3467–3481. [Google Scholar] [CrossRef]
- Mohamadian, N.; Ghorbani, H.; Wood, D.A.; Khoshmardan, M.A. A hybrid nanocomposite of poly(styrene-methyl methacrylate- acrylic acid)/clay as a novel rheology-improvement additive for drilling fluids. J. Polym. Res. 2019, 26, 33. [Google Scholar] [CrossRef]
- Mohamadian, N.; Ghorbani, H.; Wood, D.; Hormozi, H.K. Rheological and filtration characteristics of drilling fluids enhanced by nanoparticles with selected additives: An experimental study. Adv. Geo-Energy Res. 2018, 2, 228–236. [Google Scholar] [CrossRef] [Green Version]
- Aftab, A.; Ali, M.; Sahito, M.F.; Mohanty, U.S.; Jha, N.K.; Akhondzadeh, H.; Azhar, M.R.; Ismail, A.R.; Keshavarz, A.; Iglauer, S. Environmental Friendliness and High Performance of Multifunctional Tween 80/ZnO-Nanoparticles-Added Water-Based Drilling Fluid: An Experimental Approach. ACS Sustain. Chem. Eng. 2020, 8, 11224–11243. [Google Scholar] [CrossRef]
- Ghanbari, S.; Kazemzadeh, E.; Soleymani, M.; Naderifar, A. A facile method for synthesis and dispersion of silica nanoparticles in water-based drilling fluid. Colloid Polym. Sci. 2016, 294, 381–388. [Google Scholar] [CrossRef]
- Yang, X.; Yue, Y.; Cai, J.; Liu, Y.; Wu, X. Experimental Study and Stabilization Mechanisms of Silica Nanoparticles Based Brine Mud with High Temperature Resistance for Horizontal Shale Gas Wells. J. Nanomater. 2015, 2015, 745312. [Google Scholar] [CrossRef]
- Xu, J.; Hu, Y.; Chen, Q.; Chen, D.; Lin, J.; Bai, X. Preparation of hydrophobic carboxymethyl starches and analysis of their properties as fluid loss additives in drilling fluids. Starch-Stärke 2017, 69, 1600153. [Google Scholar] [CrossRef]
- Jiang, G.; Hou, X.; Zeng, X.; Zhang, C.; Wu, H.; Shen, G.; Li, S.; Luo, Q.; Li, M.; Liu, X.; et al. Preparation and characterization of indicator films from carboxymethyl-cellulose/starch and purple sweet potato (Ipomoea batatas (L.) lam) anthocyanins for monitoring fish freshness. Int. J. Biol. Macromol. 2020, 143, 359–372. [Google Scholar] [CrossRef]
- Pooresmaeil, M.; Javanbakht, S.; Behzadi Nia, S.; Namazi, H. Carboxymethyl cellulose/mesoporous magnetic graphene oxide as a safe and sustained ibuprofen delivery bio-system: Synthesis, characterization, and study of drug release kinetic. Colloids Surf. A Physicochem. Eng. Asp. 2020, 594, 124662. [Google Scholar] [CrossRef]
- Nordin, N.A.; Rahman, N.A.; Talip, N.; Yacob, N. Citric Acid Cross-Linking of Carboxymethyl Sago Starch Based Hydrogel for Controlled Release Application. Macromol. Symp. 2018, 382, 1800086. [Google Scholar] [CrossRef]
- Uva, M.; Mencuccini, L.; Atrei, A.; Innocenti, C.; Fantechi, E.; Sangregorio, C.; Maglio, M.; Fini, M.; Barbucci, R. On the Mechanism of Drug Release from Polysaccharide Hydrogels Cross-Linked with Magnetite Nanoparticles by Applying Alternating Magnetic Fields: The Case of DOXO Delivery. Gels 2015, 1, 24–43. [Google Scholar] [CrossRef]
- Tiwari, N.; Nawale, L.; Sarkar, D.; Badiger, M.V. Carboxymethyl Cellulose-Grafted Mesoporous Silica Hybrid Nanogels for Enhanced Cellular Uptake and Release of Curcumin. Gels 2017, 3, 8. [Google Scholar] [CrossRef] [PubMed] [Green Version]
- Camponeschi, F.; Atrei, A.; Rocchigiani, G.; Mencuccini, L.; Uva, M.; Barbucci, R. New Formulations of Polysaccharide-Based Hydrogels for Drug Release and Tissue Engineering. Gels 2015, 1, 3–23. [Google Scholar] [CrossRef] [Green Version]
- Tavares, K.M.; Campos, A.d.; Mitsuyuki, M.C.; Luchesi, B.R.; Marconcini, J.M. Corn and cassava starch with carboxymethyl cellulose films and its mechanical and hydrophobic properties. Carbohydr. Polym. 2019, 223, 115055. [Google Scholar] [CrossRef]
- Tuan Mohamood, N.F.A.; Zainuddin, N.; Ahmad Ayob, M.; Tan, S.W. Preparation, optimization and swelling study of carboxymethyl sago starch (CMSS)-acid hydrogel. Chem. Cent. J. 2018, 12, 133. [Google Scholar] [CrossRef] [PubMed]
- Tiwari, R.; Kumar, S.; Husein, M.M.; Rane, P.M.; Kumar, N. Environmentally benign invert emulsion mud with optimized performance for shale drilling. J. Pet. Sci. Eng. 2020, 186, 106791. [Google Scholar] [CrossRef]
- Li, F.; Jiang, G.; Wang, Z.; Cui, M. Drilling Fluid from Natural Vegetable Gum. Pet. Sci. Technol. 2014, 32, 738–744. [Google Scholar] [CrossRef]
- Wei, M.; Wu, C.; Zhou, Y. Study on Wellbore Temperature and Pressure Distribution in Process of Gas Hydrate Mined by Polymer Additive CO2 Jet. Adv. Polym. Technol. 2020, 2020, 2914375. [Google Scholar] [CrossRef]
- Chen, J.; Li, H.; Fang, C.; Cheng, Y.; Tan, T.; Han, H. Synthesis and structure of carboxymethylcellulose with a high degree of substitution derived from waste disposable paper cups. Carbohydr. Polym. 2020, 237, 116040. [Google Scholar] [CrossRef]
- Gao, S.; Liu, Y.; Wang, C.; Chu, F.; Xu, F.; Zhang, D. Structures, Properties and Potential Applications of Corncob Residue Modified by Carboxymethylation. Polymers 2020, 12, 638. [Google Scholar] [CrossRef] [Green Version]
- Yun, T.; Pang, B.; Lu, J.; Lv, Y.; Cheng, Y.; Wang, H. Study on the derivation of cassava residue and its application in surface sizing. Int. J. Biol. Macromol. 2019, 128, 80–84. [Google Scholar] [CrossRef]
- Joshi, G.; Naithani, S.; Varshney, V.K.; Bisht, S.S.; Rana, V.; Gupta, P.K. Synthesis and characterization of carboxymethyl cellulose from office waste paper: A greener approach towards waste management. Waste Manag. 2015, 38, 33–40. [Google Scholar] [CrossRef] [PubMed]
- Shi, H.; Yin, Y.; Jiao, S. Preparation and characterization of carboxymethyl starch under ultrasound-microwave synergistic interaction. J. Appl. Polym. Sci. 2014, 131, 40906. [Google Scholar] [CrossRef]
- Muthukumarana, C.; Kanmani, B.R.; Sharmila, G.; Kumar, N.M. Carboxymethylation of pectin: Optimization, characterization and in-vitro drug release studies. Carbohydr. Polym. 2018, 194, 311–318. [Google Scholar] [CrossRef]
- Santos, M.B.; Dos Santos, C.H.C.; de Carvalho, M.G.; de Carvalho, C.W.P.; Garcia-Rojas, E.E. Physicochemical, thermal and rheological properties of synthesized carboxymethyl tara gum (Caesalpinia spinosa). Int. J. Biol. Macromol. 2019, 134, 595–603. [Google Scholar] [CrossRef]
- Li, H.; Zhang, H.; Xiong, L.; Chen, X.; Wang, C.; Huang, C.; Chen, X. Isolation of Cellulose from Wheat Straw and Its Utilization for the Preparation of Carboxymethyl Cellulose. Fibers Polym. 2019, 20, 975–981. [Google Scholar] [CrossRef]
- He, T.; Jiang, Z.; Wu, P.; Yi, J.; Li, J.; Hu, C. Fractionation for further conversion: From raw corn stover to lactic acid. Sci. Rep. 2016, 6, 38623. [Google Scholar] [CrossRef] [Green Version]
- Yang, H.; Zhang, Y.; Kato, R.; Rowan, S.J. Preparation of cellulose nanofibers from Miscanthus x. Giganteus by ammonium persulfate oxidation. Carbohydr. Polym. 2019, 212, 30–39. [Google Scholar] [CrossRef]
- Mondal, M.I.H.; Ahmed, F. Cellulosic fibres modified by chitosan and synthesized ecofriendly carboxymethyl chitosan from prawn shell waste. J. Text. Inst. 2019, 111, 49–59. [Google Scholar] [CrossRef]
- Mohamad Haafiz, M.K.; Eichhorn, S.J.; Hassan, A.; Jawaid, M. Isolation and characterization of microcrystalline cellulose from oil palm biomass residue. Carbohydr. Polym. 2013, 93, 628–634. [Google Scholar] [CrossRef]
- Moussa, I.; Khiari, R.; Moussa, A.; Belgacem, M.N.; Mhenni, M.F. Preparation and Characterization of Carboxymethyl Cellulose with a High Degree of Substitution from Agricultural Wastes. Fibers Polym. 2019, 20, 933–943. [Google Scholar] [CrossRef]
- Abdullah, C.I.; Azzahari, A.D.; Rahman, N.M.M.A.; Hassan, A.; Yahya, R. Optimizing Treatment of Oil Palm-Empty Fruit Bunch (OP-EFB) Fiber: Chemical, Thermal and Physical Properties of Alkalized Fibers. Fibers Polym. 2019, 20, 527–537. [Google Scholar] [CrossRef]
- Naknaen, P. Physicochemical, Thermal, Pasting and Microstructure Properties of Hydroxypropylated Jackfruit Seed Starch Prepared by Etherification with Propylene Oxide. Recent Adv. Food Sci. 2014, 9, 249–259. [Google Scholar] [CrossRef]
- Peng, X.; Su, S.; Xia, M.; Lou, K.; Yang, F.; Peng, S.; Cai, Y. Fabrication of carboxymethyl-functionalized porous ramie microspheres as effective adsorbents for the removal of cadmium ions. Cellulose 2018, 25, 1921–1938. [Google Scholar] [CrossRef]
- Wu, L.; Lin, X.; Du, X.; Luo, X. Biosorption of uranium(VI) from aqueous solution using microsphere adsorbents of carboxymethyl cellulose loaded with aluminum(III). J. Radioanal. Nucl. Chem. 2016, 310, 611–622. [Google Scholar] [CrossRef]
- Zhou, Z.; Liu, X.; Hu, B.; Wang, J.; Xin, D.; Wang, Z.; Qiu, Y. Hydrophobic surface modification of ramie fibers with ethanol pretreatment and atmospheric pressure plasma treatment. Surf. Coat. Technol. 2011, 205, 4205–4210. [Google Scholar] [CrossRef]
- Zong, Y.; Zhang, Y.; Lin, X.; Ye, D.; Luo, X.; Wang, J. Preparation of a novel microsphere adsorbent of prussian blue capsulated in carboxymethyl cellulose sodium for Cs(I) removal from contaminated water. J. Radioanal. Nucl. Chem. 2017, 311, 1577–1591. [Google Scholar] [CrossRef]
- American Petroleum Institute. Specification for Drilling Fluids Materials, 18th ed.; API Specification 13A: Washington, DC, USA, 2009. [Google Scholar]
- Wu, Z.; Zhou, P.; Yang, J.; Li, J. Determination of the optimal reaction conditions for the preparation of highly substituted carboxymethyl Cassia tora gum. Carbohydr. Polym. 2017, 157, 527–532. [Google Scholar] [CrossRef]
- Vamadevan, V.; Bertoft, E. Structure-function relationships of starch components. Starch-Stärke 2015, 67, 55–68. [Google Scholar] [CrossRef]
- Hou, C.; Zhao, X.; Tian, M.; Zhou, Y.; Yang, R.; Gu, Z.; Wang, P. Impact of water extractable arabinoxylan with different molecular weight on the gelatinization and retrogradation behavior of wheat starch. Food Chem. 2020, 318, 126477. [Google Scholar] [CrossRef]
- GB/T 5005-2010; Chinese National Standard. Specification of Drilling Fluid Materials. National Standards of the People’s Republic of China: Beijing, China, 2010. (In Chinese)
- Liu, J.; Zhou, F.; Deng, F.; Zhao, H.; Wei, Z.; Long, W.; Evelina, L.M.A.; Ma, C.; Chen, S.; Ma, L. Improving the rheological properties of water-based calcium bentonite drilling fluids using water-soluble polymers in high temperature applications. J. Polym. Eng. 2021, 42, 129–139. [Google Scholar] [CrossRef]
- Liu, J.; Cheng, Y.; Zhou, F.; Evelina, L.M.A.; Long, W.; Chen, S.; He, L.; Yi, X.; Yang, X. Evaluation method of thermal stability of bentonite for water-based drilling fluids. J. Pet. Sci. Eng. 2022, 208, 109239. [Google Scholar] [CrossRef]
- Yan, J. Drilling Fluids Technology, 1st ed.; China University of Petroleum Press: Shandong, China, 2006. [Google Scholar]
- Q/SH1020 1879-2016; Sinopec Enterprise Standard. Solid Lubricant Technology Requirements for Drilling Fluid. Sinopec Shengli Petroleum Administration Bureau: Shandong, China, 2016. (In Chinese)
- HJ 557-2010; Chinese Enterprise Standard. ‘Solid Waste-Extraction Procedure for Leaching Toxicity-Horizontal Vibration Method. Ministry of Ecology and Environment of the People’s Republic of China: Beijing, China, 2010. (In Chinese)
- GB/11914-89; Chinese National Standard. Water Quality-Determination of the Chemical Oxygen Demand-Dichromate Method. The State Bureau of Quality and Technical Supervision of China: Beijing, China, 1990. (In Chinese)
- Q/SY 111-2007; CNPC Enterprise Standard. Grading and Determination of Biotoxicity of Chemicals and Drilling Fluids-Luminescent Bacteria Test. China National Petroleum Corporation: Beijing, China, 2007. (In Chinese)


| Sample | Weight/mg | C/% | H/% | O/% | C/H | C/O |
|---|---|---|---|---|---|---|
| PPS | 2.075 | 38.560 | 5.667 | 48.062 | 6.804 | 0.802 |
| CMCS | 2.139 | 32.170 | 4.691 | 54.241 | 6.858 | 0.593 |
| Filtrate Reducer | FLAPI in Saturated Brine Base Slurry (mL/30 min) | Market Price (CNY/t) | |
|---|---|---|---|
| Before Aging | After Aging | ||
| LV-CMC | 6.0 | 16.0 | 11,500 |
| CMS | 4.0 | 34.0 | 9000 |
| CMCS | 6.4 | 7.0 | 7000 |
| Standards | ≤10.00 | - | - |
| Index | LV-CMC | CMS | CMCS |
|---|---|---|---|
| Thickening | ΔΔΔ | ΔΔ | ΔΔ |
| Filtrate loss | ΔΔΔ | ΔΔΔ | ΔΔΔ |
| Salt tolerance | ΔΔΔ | Δ | ΔΔΔ |
| Temperature resistance | ΔΔ | Δ | ΔΔ |
| Environmental friendliness | ΔΔΔ | ΔΔΔ | ΔΔΔ |
| Value for money | Δ | ΔΔ | ΔΔΔ |
| T/℃ | Index | 4% NaCl Slurry | Saturated NaCl Slurry | ||
|---|---|---|---|---|---|
| with PPS | with CMCS | with PPS | with CMCS | ||
| 25 | AV/mPa·s | 4 | 8 | 5 | 7 |
| PV/mPa·s | 3 | 6 | 3 | 5 | |
| RYP/(Pa/mPa·s) | 0.3407 | 0.3407 | 0.6813 | 0.4088 | |
| n/Dimensionless | 0.6781 | 0.6781 | 0.5146 | 0.6374 | |
| K/Pa·sn | 0.0372 | 0.0744 | 0.1445 | 0.0864 | |
| 120 | AV/mPa·s | 7 | 7.5 | 4.5 | 6 |
| PV/mPa·s | 6 | 5 | 3 | 5 | |
| RYP/(Pa/mPa·s) | 0.1703 | 0.5110 | 0.5110 | 0.2044 | |
| n/Dimensionless | 0.8074 | 0.5850 | 0.5850 | 0.7776 | |
| K/Pa·sn | 0.0266 | 0.1330 | 0.0789 | 0.0280 | |
| Dilution Rate | Test 1 | Test 2 | Test 3 | Average Value | |
|---|---|---|---|---|---|
| V1/mL | 50 | 19.50 | 19.20 | 19.10 | 19.27 |
| V2/mL | 50 | 18.50 | 18.40 | 18.50 | 18.47 |
Publisher’s Note: MDPI stays neutral with regard to jurisdictional claims in published maps and institutional affiliations. |
© 2022 by the authors. Licensee MDPI, Basel, Switzerland. This article is an open access article distributed under the terms and conditions of the Creative Commons Attribution (CC BY) license (https://creativecommons.org/licenses/by/4.0/).
Share and Cite
Long, W.; Zhu, X.; Zhou, F.; Yan, Z.; Evelina, A.; Liu, J.; Wei, Z.; Ma, L. Preparation and Hydrogelling Performances of a New Drilling Fluid Filtrate Reducer from Plant Press Slag. Gels 2022, 8, 201. https://doi.org/10.3390/gels8040201
Long W, Zhu X, Zhou F, Yan Z, Evelina A, Liu J, Wei Z, Ma L. Preparation and Hydrogelling Performances of a New Drilling Fluid Filtrate Reducer from Plant Press Slag. Gels. 2022; 8(4):201. https://doi.org/10.3390/gels8040201
Chicago/Turabian StyleLong, Wenjun, Xialei Zhu, Fengshan Zhou, Zhen Yan, Amutenya Evelina, Jinliang Liu, Zhongjin Wei, and Liang Ma. 2022. "Preparation and Hydrogelling Performances of a New Drilling Fluid Filtrate Reducer from Plant Press Slag" Gels 8, no. 4: 201. https://doi.org/10.3390/gels8040201
APA StyleLong, W., Zhu, X., Zhou, F., Yan, Z., Evelina, A., Liu, J., Wei, Z., & Ma, L. (2022). Preparation and Hydrogelling Performances of a New Drilling Fluid Filtrate Reducer from Plant Press Slag. Gels, 8(4), 201. https://doi.org/10.3390/gels8040201