1. Introduction
The molecular probe Thioflavin T (ThT) has been extensively investigated regarding its interaction with macromolecular hosts like cyclodextrins [
1] and cucurbiturils [
2], with ionic and non-ionic micellar systems [
3,
4], and with biological targets like polypeptides/proteins [
5,
6] and DNA [
7]. This is due to the extraordinary sensitivity of its spectral signatures to microenvironmental properties (polarity and viscosity) that originates in its behaviour as a molecular rotor [
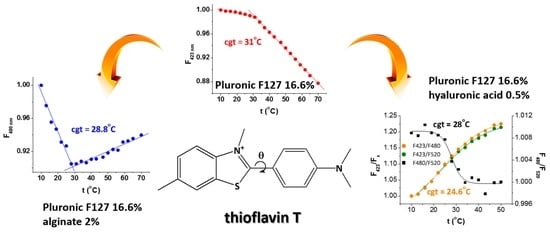
8]. Briefly, ThT consists of a benzothiazole ring and a dimethylaniline ring connected through a σ(C–C) bond allowing intramolecular rotation (dihedral angle θ,
Scheme 1). Other key structural features are the positive charge in the benzothiazole ring (at pH < 10) and the tertiary dimethylamino group in the benzyl ring. Since charge transfer occurs from the HOMO molecular orbital localized on the dimethylaniline ring to the LUMO localized on benzothiazole [
9], it is evident that the value of θ largely determines the spectral properties of ThT. Its photophysical behaviour in nonviscous media is governed by the stabilization of either the emissive locally excited (LE) state (θ ~ 37 deg) or the weakly emissive twisted intramolecular charge transfer (TICT) excited state (θ ~ 90 deg). In viscous media, or by binding to a substrate in a “locked” conformation, the nonradiative (torsional relaxation) deactivation channel of ThT is suppressed, leading to fluorescence enhancement [
10,
11].
Despite early interest in its photophysics, presently ThT is employed mostly as staining dye in amyloid assays [
12], aiming for early diagnosis and disease-specific therapy of amyloidosis. Applications of ThT to gel systems are scarce [
13,
14], but a recent study by Mata et al. [
15] has shown that the induced circular dichroism signal of ThT can be used to evidence the formation of a self-assembled hydrogel between a peptide amphiphile and a sugar-based low-molecular-weight gelator (dibenzylidene-D-sorbitol). These results prompted us to conduct an investigation on the fluorescence response of ThT during the gelation of some Pluronic F127/polysaccharide (alginate—ALG and hyaluronic acid—HA) model systems. The chemical structures of ThT along with those of the system constituents are depicted in
Scheme 1.
The selection of these gelling systems has been made considering the previous work conducted in our laboratory [
16,
17,
18,
19] that provides us with the essential reference information on temperature-induced micellization and gelation processes in Pluronic F127 alone and in the presence of a modulator of its encapsulation properties (2-hydroxypropyl-β-cyclodextrin). Alginate (ALG) and hyaluronic acid (HA), the two polysaccharides selected for this study, are negatively charged at the working pH and can thus promote interaction with oppositely charged ThT. Such Pluronic/polysaccharide systems are becoming key components in today’s pharmaceuticals due to their application as in situ gel-forming delivery vehicles [
20,
21,
22]. Data in the literature indicate that polysaccharide addition represents a convenient means of ensuring the stability of the gel against dissolution and of increasing the gel strength and self-healing ability [
23,
24].
The difference in hydration between PEO blocks (more hydrophilic) and PPO blocks (more hydrophobic) lies at the core of the temperature-sensitive processes occurring in Pluronic F127 systems [
25]. As the temperature increases, progressive dehydration of PPO chains leads to the formation of the micellar core at the critical micellization temperature (cmt). Further temperature increase determines the progressive dehydration of PEO chains from the micelle corona, causing chain entanglement between adjacent micelles and culminating in the micelle-to-gel transition occurring at the critical gelation temperature (cgt). This phase transition is influenced by the presence of other system constituents that reside at the interface between Pluronic F127 micelles and water [
26]. They may cause significant microstructural changes in the sample that we believe ThT to be responsive to.
To our knowledge, this is the first investigation exploring the potential of ThT as a fluorescent reporter of gelation. Our study also aims to gather insight into the nanoscopic changes in polarity/viscosity associated with the molecular reorganization processes accompanying the micelle-to-gel transition in Pluronic/polysaccharide systems. Two fluorescence methods, steady-state and synchronous, are investigated in order to assess their capabilities, and second-derivative synchronous fluorescence is used to reveal additional spectral features related to the micellization process. The latter process is also followed by a complementary method, differential scanning microcalorimetry (μDSC). Our results indicate that the fluorescence response of ThT represents a suitable method for accurately determining the temperature corresponding to the transition from micelle to gel, that is, the critical gelation temperature (cgt), in Pluronic/polysaccharide systems.
2. Results and Discussion
2.1. Solvatochromic Study of ThT
The complexity of ThT photophysics, along with the observation that some anionic compounds may promote the electrostatic self-assembly of ThT into dimers/higher aggregates, leading to large bathochromic shifts in the fluorescence spectra [
27,
28], determined us to begin our investigation with a preliminary solvatochromic study. As such, the emission and excitation spectra of ThT at concentrations in the range 10
−6–10
−4 M have been recorded in three solvents varying in polarity and viscosity: methanol (ε = 32.70, η = 0.5 cP at 25 °C), diethylene glycol (ε = 31.70, η = 35.7 cP) and glycerol (ε = 46.5, η = 934 cP) [
29]. This is necessary in order to select the optimal ThT concentration to be used in the gelation studies, and the λ
ex and Δλ parameters to be used in the steady-state and synchronous experiments (vide infra). This study also provides insight into the degree to which the polarity and viscosity of the microenvironment hinder torsional relaxation and stabilize the emissive species. We note that the highly viscous glycerol is a good indicator of ThT photophysics in Pluronic F127 solutions.
Selected steady-state fluorescence and excitation spectra of ThT in glycerol, at different ThT concentrations, are shown in
Figures S1 and S2 in the Supplementary Material, respectively. At the lowest concentration, 10
−6 M, two main emissions are observed: a short wavelength fluorescence band with a maximum at λ
f = 420 nm (λ
ex = 360 nm) and a long wavelength fluorescence band with two maxima at λ
f = 480 and 520 nm (λ
ex = 420 nm). The atypical short wavelength emission arises from a subset of ThT conformers with a broken π-electron conjugated system, due to a low energy barrier between the conformations with θ = 37 deg (ground state energy minimum) and θ = 90 deg [
30,
31]. For the conformers twisted at ~90 deg, the dimethylaniline and benzothiazole rings behave as independent chromophores, leading to hypsochromically shifted excitation and emission spectra.
The position of the long wavelength emission does not vary significantly with ThT concentration or solvent polarity. At λex = 420 nm, which corresponds to the absorption maximum, λa, of ThT in Pluronic F127 (vide infra), the long wavelength fluorescence is maximal at a ThT concentration of 10−5 M, followed by self-quenching in more concentrated solutions. For this reason, the 10−5 M concentration was selected to be used in the gelation studies. The emissions at 480 and 520 nm are favoured to the same extent by the increase in ThT concentration (F480 nm/F520 nm ~ 1.5 at [ThT] = 10−6 M and 10−4 M) on the expense of the short wavelength emission. The presence of dimers was not observed at the ThT concentrations employed.
The broad feature of the two ThT emissions is due to the presence of a wide distribution of conformers [
10,
31] that is determined by the ThT concentration and by the polarity and viscosity of the microenvironment. The latter dependence becomes evident when comparing the spectra of ThT in glycerol (
Figure S1) to those in diethylene glycol and methanol (
Figures S3 and S4). At [ThT] = 10
−6 M in diethylene glycol, an intermediary solvent in terms of viscosity between glycerol and methanol, the spectral signature of ThT is similar to that in glycerol regarding the relative intensities of the short and long wavelength emissions. Nevertheless, at this concentration, the short wavelength emission is observed at 440 nm as opposed to 420 nm in glycerol. Starting from [ThT] = 5 × 10
−5 M, the long wavelength emission becomes dominant. In methanol, which has similar polarity to diethylene glycol but is nonviscous, the spectral signature of ThT is strikingly different, with an extremely weak long wavelength emission, irrespective of ThT concentration. In this solvent, intramolecular rotation occurs freely, and the fluorescence properties solely depend on the stabilization of the TICT (θ ~ 90 deg) state by the solvent.
Since the width of the steady-state fluorescence bands is directly related to the population of conformers, we decided to inspect the features of the synchronous fluorescence of ThT in these solvents, in an attempt to obtain narrower bands associated to a subset of conformations with uniform emissive properties. The synchronous technique is commonly employed when such band overlapping prevents the use of the traditional steady-state method [
32]. The excitation and emission wavelengths are scanned simultaneously at a constant Δλ = λ
f − λ
ex, which offers the advantages of spectral simplification and bandwidth reduction if Δλ is set to the Stokes shift of one of the spectral constituents [
33]. Selected synchronous emissions of ThT in glycerol, at Δλ = 60 nm and 100 nm, which have been identified as the optimal values affording the best separation of the short and long wavelength emissions, are shown in
Figure S5.
2.2. Gelation Behaviour of Pluronic F127/Polysaccharide Systems
The first step of the gelation study is to record the room temperature absorption, excitation and emission spectra of ThT in the three systems to be investigated: Pluronic F127 16.6% (P16.6%), Pluronic F127 16.6% in the presence of alginate 2% (P16.6%ALG2%) and Pluronic F127 16.6% in the presence of hyaluronic acid 0.5% (P16.6%HA0.5%). Then, the spectral behaviour of ThT upon heating in the temperature range 10–70 °C is analysed.
2.2.1. Gelation of Pluronic F127
We firstly discuss the results obtained for the Pluronic F127 sample in the absence of polysaccharides. This is our reference sample with known gelation behaviour [
16,
17]. The absorption, excitation and emission spectra of ThT in P16.6% are shown in
Figure 1. We can observe the presence of a single absorption band with a maximum at 418 nm. Excitation at this wavelength (~420 nm) results in the long wavelength emission with maxima at 480 and 520 nm (
Figure 1A). The corresponding excitation spectra, obtained at either λ
f = 480 nm or 520 nm, are identical, with a lower intensity in the case of the latter. In the excitation spectra, a band at 360 nm can be easily observed alongside the band at 420 nm. As expected, based on the results of our solvatochromic study, excitation at 360 nm results in intense short wavelength emission at 423 nm (
Figure 1B). Several Δλ values in the range 50–100 nm have been scanned, and the optimal values selected for the synchronous measurements, ensuring the maximal separation of emission bands, are Δλ = 50 nm (for the subset of conformers with λ
ex = 420 nm and λ
f = 480 nm), Δλ = 65 nm (for the conformers with λ
ex = 360 nm and λ
f = 423 nm) and Δλ = 100 nm (for the conformers with λ
ex = 420 nm and λ
f = 520 nm).
The spectral behaviour of ThT in the P16.6% sample, upon heating in the temperature range 10–70 °C, is depicted in
Figure 2 and
Figure S6. A decrease in both short and long wavelength emissions is observed with increasing temperature. This is due to the nonradiative deactivation pathways of the excited state that become favoured at higher temperatures [
34]. The steeper decrease in the short wavelength steady-state emission at 423 nm (
Figure 2A) as compared to the long wavelength emission (
Figure 2B) correlates to the steeper decrease exhibited by the synchronous fluorescence intensity at 423 nm (
Figure S6B) and is indicative of the fact that the population of ThT conformers changes with temperature.
Figure 2C and
Figure S7A include plots of the normalized steady-state and synchronous fluorescence intensities as a function of temperature. No apparent change associated to the micellization of P16.6% is observed in these plots. According to our μDSC results (vide infra), the critical micelle temperature (cmt) of P16.6% is 13.0 °C. Nevertheless, the plots of the fluorescence intensity (either steady-state or synchronous) at 423 nm as a function of temperature present an evident change of slope associated to the micelle-to-gel transition. This break in the typical linear behaviour can be used to estimate the value of the critical gelation temperature (cgt) of P16.6%. Hence, the cgt is determined as the intersection point of two straight lines obtained by linearly fitting the data on the temperature domains corresponding to the micellar (lower temperatures) and gel (higher temperatures) phases. This method was applied successfully in previous studies [
16,
17] to estimate the cgt of P16.6% in the absence and in the presence of 2-hydroxypropyl-β-cyclodextrin from steady-state fluorescence and EPR data provided by dual molecular probes; the cgt value obtained with spectroscopic and rheological measurements was 31 °C. This value coincides to the cgt determined in this study, demonstrating that the ThT fluorescence method proposed here constitutes a suitable means for accurately determining the gelation temperature of Pluronic F127. The steady-state and synchronous techniques are consistent, yielding the same result.
We also paid attention to the temperature dependence of the ratios of fluorescence intensities at 423/480, 423/520 and 480/520 nm, which correlate to changes in the population of conformers during heating and gelation. From the plots shown in
Figure 2D, we observe that the ratios involving the steady-state emission at 423 nm are indeed responsive to gelation, yielding a cgt value of ~31 °C. The synchronous data, due to very small changes in band intensities, show more noise and cannot be accurately used to estimate cgt in this case (
Figure S7B).
Finally, we tested the utility of using the second derivative of the steady-state and synchronous fluorescence of ThT to extract
supplementary information on the system. Applying the differentiation process to the steady-state fluorescence emissions at 480 and 520 nm results in a monotonous increase in the second-derivative fluorescence intensity, without any inflection point, rendering impossible the determination of cgt. Differently, in the case of the steady-state fluorescence at 423 nm (
Figure 3A, corresponding minimum at 410 nm in the second-derivative spectrum), the plot of d
2SF
410nm/dλ
2 as a function of temperature shows distinct features around 15 °C and 30 °C that can be associated to the micellization process and to the micelle-to-gel transition of P16.6%, respectively (inset of
Figure 3A). The inflection points become most evident in the second derivative of the synchronous fluorescence at 423 nm (
Figure 3B, corresponding minimum at 416 nm). Fitting this data to sigmoid functions in the temperature domains 10–22 °C, corresponding to micellization, and 25–37 °C, corresponding to gelation, allows us to successfully extract the values of the cmt = 14.5 °C and cgt = 31 °C of P16.6% (inset of
Figure 3B).
In the following, we present our results on the gelation behaviour of Pluronic F127/polysaccharide systems and comment on the suitability of ThT as a fluorescent probe for these gelling systems.
2.2.2. Gelation of Pluronic F127/Alginate
The first polysaccharide selected in this study is alginate. The absorption, excitation and steady-state fluorescence spectra of ThT in the P16.6%ALG2% sample are shown in
Figure S8. They are similar to those displayed for ThT in P16.6%, with the exception of an ~20 nm bathochromic shift to 440 nm of the short wavelength emission. Differently from the case of P16.6%, a steeper decrease is now observed for the long wavelength steady-state emission at 480 and 520 nm (
Figure 4). Moreover, the initial fluorescence decrease is followed by a stationary response at temperatures between 28 and 34 °C, then by a fluorescence increase. An increase in the fluorescence intensity of ThT, overcoming the quenching effect exerted by the temperature increase, could be rationalized in terms of an enhancement in the rigidity of the microenvironment [
14] due to the formation of a stronger gel network in the presence of alginate. Indeed, rheological measurements evidenced significant increase in gel strength by combining Pluronic F127 with alginate [
35], due to water molecules acting as “crosslinkers” to form hydrogen bonds between the ether groups of Pluronic F127 and the carboxyl groups of the alginate.
Plotting the intensities of the steady-state fluorescence bands as a function of temperature, we observe in the case of the long wavelength emission at 480 nm and 520 nm the existence of two linear domains between 10–28 °C and 28–70 °C (
Figure 4C). The intersection of the corresponding linear fits yields, in both cases, a cgt value of 28.8 °C, which is lower than the cgt value of P16.6%. Interestingly, in the presence of alginate, the short wavelength emission of ThT is only weakly responsive to temperature changes and cannot be used to estimate the cgt. For the P16.6%ALG2% system, the ThT conformers with planar and quasi-planar geometry, responsible for the long wavelength emission, serve as reporters of gelation, and this might be due to their easier insertion within the more tightly packed gel network.
For synchronous experiments, we used Δλ = 50 nm (for the subset of conformers with λ
ex = 420 nm and λ
f = 480 nm) and Δλ = 80 nm (for conformers with λ
ex = 360 nm and λ
f = 440 nm and with λ
ex = 420 nm and λ
f = 520 nm) (
Figure S9). A similar trend to that observed via the steady-state technique emerges from the synchronous data, with an estimated cgt value of ~29 °C (
Figure S10A).
When using the temperature dependence of the ratios of fluorescence intensities at 440/480, 440/520 and 480/520 nm (
Figure 4D and
Figure S10B), only the ratios involving the long wavelength emission at either 480 or 520 nm are responsive to gelation, as expected. The estimated cgt values from steady-state and synchronous data coincide and are slightly larger (29.4 °C).
No effect of gelation on the second derivative of the steady-state fluorescence bands at 440, 480 and 520 nm was observed. In the case of the second derivative of the synchronous fluorescence at 440 nm, the plot d
2SF
440 nm/dλ
2 (
Figure S11) shows marginal changes corresponding to micellization (10–13 °C) and gelation (25–28 °C). Micellization occurs at lower temperatures as compared to P16.6%, a trend that is confirmed by the μDSC results (cmt = 11.6 °C, vide infra). Gelation also occurs at lower temperatures, as revealed in the results presented above.
2.2.3. Gelation of Pluronic F127/Hyaluronic Acid
The second polysaccharide selected for our study is hyaluronic acid. Although the spectral features of ThT in the P16.6%HA0.5% sample (
Figure S12) closely resemble those of ThT in P16.6%, the spectral behaviour of ThT during heating is markedly different from that in P16.6% or in P16.6%ALG2%, pointing to different interactions occurring in the P16.6%HA0.5% system. As can be seen from
Figure 5, ThT displays the most notable fluorescence decrease in both the short wavelength and the long wavelength emissions. The synchronous spectra acquired at Δλ = 50 nm (for the subset of conformers with λ
ex = 420 nm and λ
f = 480 nm), at Δλ = 65 nm (for the conformers with λ
ex = 360 nm and λ
em = 423 nm) and at Δλ = 90 nm (for the conformers with λ
ex = 420 nm and λ
em = 520 nm) display a significant intensity decrease as well (
Figure S13).
Surprisingly, the plots of the steady-state fluorescence (
Figure 5C) and synchronous fluorescence (
Figure S14A) intensities as a function of temperature do not reveal the same striking change in slope around the gelation temperature as seen in the case of P16% and P16%ALG2%. A break in the monotonous variation is observed at ~50 °C, and it has yet to be explained. As the μDSC scans display no transition at this temperature, a local change sensed via the ThT probe rather than a strong, global one could cause the break observed at 50 °C.
When analysing the temperature dependence of the ratios of fluorescence intensities at 423/480, 423/520 and 480/520 nm (
Figure 5D and
Figure S14B), we observe that the data in the temperature domain 10–50 °C show a gradual variation that can be fitted to a sigmoidal function, allowing estimation of the cgt (
Figure 6). This method yields quite different cgt values, in the range 22.7–29.3 °C, depending on the band ratio considered and the technique used (steady-state vs. synchronous). Lower cgt values are obtained when the short wavelength emission is considered, while higher cgt values are determined when considering the long wavelength emission. We believe that these differences might be due to the stabilization of different ThT conformers in different regions of the gelling systems, each reporting from their respective microenvironment. A decrease in the gelation temperature in the presence of high molecular weight hyaluronic acid has been explained in the literature by the insertion of hyaluronic chains in the interstitial spaces between closely packed Pluronic F127 micelles. In this way, the interaction between Pluronic chains and water molecules is hampered, which hastens the assembly of micelles into gel [
36].
In the case of the P16.6%HA0.5% system, the second-derivative steady-state or synchronous spectra do not provide additional information on micellization or gelation. The cmt value obtained from μDSC measurements is 12.6 °C (vide infra).
The results discussed above point to the presence of several ThT conformers, with temperature-dependent populations, which become entrapped in different regions of the Pluronic F127/polysaccharide systems. Their spectral response is dictated by their localization, either within the F127 micellar cores or coronae, near the negatively-charged polysaccharide chains or in the solvent pools (please refer to
Figure 7 for a schematic representation of the Pluronic F127/polysaccharide systems, in accordance to the interaction mechanisms proposed in the literature for these hydrogels [
20,
36]). It would be interesting to explore further the versatility of ThT as a fluorescent reporter in other gelling systems that involve different types of supramolecular interactions. Spectroscopic methods like the one proposed here are essential for a thorough characterization at the molecular level of heterogeneous systems involving continuous molecular reorganization and gradual changes in the hydrophobic/hydrophilic balance. These methods rely on the adequate selection of molecular probes, and we believe ThT is a good candidate.
2.3. Differential Scanning Microcalorimetry (μDSC) Analysis
In the following section, the effect of the two polysaccharides, alginate and hyaluronic acid, on the micellization process of Pluronic P16.6% is evaluated at macroscopic level using μDSC measurements. Gelation, which is a weak endothermic transition involving micelle growth and aggregation, is not noticed with μDSC [
21].
It is known that, at low temperatures, Pluronic F127 exists in a disordered state as individual coils (unimers). Above the critical micelle concentration (cmc) and the cmt [
37], this block copolymer self-assembles into spherical micelles with the hydrophobic PPO blocks as the core [
38] and the hydrophilic PEO blocks as the corona [
39]. The μDSC scans (
Figure 8) present endothermic signals corresponding to the micellization of Pluronic F127 caused by the aggregation of Pluronic F127 unimers into micellar structures [
40].
The cooling μDSC scans (
Figure S15) display exothermic peaks assigned to the micelle melting process, which occurs with the temperature decrease. Analyzing heating and cooling scans of P16.6% in the absence and in the presence of HA0.5% or ALG2%, it can be observed that the endothermic and exothermic peaks are symmetric, displaying the thermal equilibrium of micelle formation, as previously reported [
41].
The incorporation of drugs or additives to aqueous Pluronic dispersions influences the cmc, cmt and the structure of the micelles [
42,
43]. The thermodynamic parameters of micellization, and the effects of HA0.5% and of ALG2% on the P16.6% micellization process are presented in
Figure 9.
The values of the micellization temperatures and enthalpy for P16.6% are in good agreement with data reported in the literature [
44].
Figure 9 shows that the onset of the endothermic peak (T
onset considered as cmt), T
peak and T
offset shift to lower temperatures in the presence of HA0.5% and ALG2%, indicating a favorable effect on the Pluronic F127 micellization process. Previous studies reported lower values for cmt of Pluronic F127 in interaction with cellulose derivatives, as result of hydrogen bonding between cellulose derivatives and PEO blocks of F127 that decreased the effective block length of PEO, thereby facilitating micellization [
45]. Also, the addition of poly (acrylic acid) to Pluronic F127 decreases the cmt of F127 due to association between the ether oxygens of PEO in F127 and the carboxylic groups of poly(acrylic acid) via hydrogen bonding [
46]. Some P16.6% chains may be associated with HA0.5% and ALG2%, leading to the formation of aggregates at a lower temperature. Moreover, the increase in the micellization enthalpy (ΔH) observed in the presence of HA0.5% and ALG2% is the result of the aggregation of a larger number of Pluronic molecules [
47], suggesting that both polysaccharides exhibit micellization-promoting behaviour. As a result of the interaction between Pluronic micelles and polysaccharides, the presence of HA0.5% and ALG2% further influences the gelation process of P16.6% [
48,
49], modifying the cgt value, as demonstrated by the fluorescence spectroscopy results discussed above.
3. Conclusions
This investigation has shown that the fluorescence response of the ThT probe is a suitable method for determining critical gelation temperatures, based on temperature-induced changes in the steady-state and synchronous emissions of ThT.
For Pluronic F127 and the Pluronic F127/polysaccharide systems under investigation, the determination of the cgt value can be made either via steady-state or synchronous fluorescence. The data obtained are in line with reports in the literature, evidencing a decrease in the temperature of the micelle-to-gel phase transition in the presence of polysaccharides. Namely, the cgt value decreases from 31 °C (in P16.6%) to 28.8–29.4 °C (in P16.6%ALG2%) and to 22.7–29.3 °C (in P16.6%HA0.5%). These variation intervals can be explained by the heterogeneity of the Pluronic F127/polysaccharide systems favouring the presence of several ThT conformers, from planar/quasi-planar conformers to twisted conformers with a broken π-electron system. Heating produces changes in the conformer populations as they become entrapped in different regions of the gelling systems, from which they act as reporters of the respective microenvironment.
Differentiation of the emission spectra is not necessary for the estimation of the cgt values, but the second derivative of the fluorescence or synchronous fluorescence spectra can provide additional insight regarding the micellization domain, as confirmed by correlating with μDSC data. While the fluorimetric method has allowed us to explore the micelle-to-gel phase transition in Pluronic/polysaccharide systems at the molecular level, the μDSC measurements have provided complementary macroscopic insights into the micellization process, e.g., the thermodynamic parameters of micellization and the effect of HA0.5% and of ALG2% on the P16.6% micellization process. The presence of polysaccharides promotes the micellization of Pluronic F127. The Tonset (cmt) value slightly decreases from 13.0 °C to 12.6 °C in the presence of HA0.5%, while ALG2% induces a more pronounced decrease in the cmt value to 11.6 °C. The same effect was observed for the Tpeak and Toffset values. The Tpeak value of P16.6% (16.5 °C) shifts to lower temperatures in the presence of HA0.5% (15.5 °C) and ALG2% (15.1 °C), while the Toffset value decreases from 23.5 °C for P16.6% to 22.8 °C in the presence of HA0.5% and 23.1 °C in the presence of ALG2%
We consider that the ThT-based fluorimetric method proposed here could be extended to other types of gelling systems. As such, this study can be of interest to researchers working in the fields of spectroscopy and supramolecular gels.
4. Materials and Methods
Thioflavin T, Pluronic F127 (molecular weight 12.6 kDa, PEO:PPO ~ 4.1:1), glycerol diethylene glycol and methanol were obtained from Sigma Aldrich (St. Louis, MO, USA). Low viscosity alginic acid sodium salt was purchased from Alfa Aesar (Ward Hill, MA, USA). Hyaluronic acid sodium salt (95%, molecular weight 1500–2200 kDa) was from Acros Organics (Geel, Belgium).
Samples were prepared at room temperature by dissolving Pluronic F127 (16.6% wt.) in distilled water, in the absence (sample P16.6%) or in the presence of 2% wt. alginate (sample P16.6%ALG2%) or 0.5% wt. hyaluronic acid (sample P16.6%HA0.5%). The Pluronic F127 and polysaccharide concentrations for the model systems were selected by surveying the literature data regarding their optimal concentrations for pharmaceutical applications [
22,
35]. The 16.6% concentration of Pluronic F127 is close to the lowest concentration at which the micelle-to-gel transition can be observed [
50]. All samples were kept overnight at 8 °C, then subjected to thermal treatment in the temperature range 10–60 °C. The concentration of Thioflavin T in the samples was 10
−5 M. Two blank samples containing only alginate 2% wt. and only hyaluronic acid 0.5% wt. were subjected to the same thermal treatment (
Figure S16) in order to discard any interference from the polysaccharide component on the variation of the ThT emission in the Pluronic F127/polysaccharide systems.
Electronic absorption spectra were recorded on a V-560 JASCO UV−Vis spectrophotometer (JASCO Co., Ltd., Kyoto, Japan) at 25 °C.
Steady-state fluorescence, synchronous fluorescence and excitation spectra were recorded on a JASCO FP-6500 spectrofluorometer (JASCO Co., Ltd., Kyoto, Japan). The temperature was varied in the range 10–70 °C with a step of 3 °C. Each sample was kept for 20 min at each temperature to ensure equilibration prior to recording the spectrum.
The effect of HA0.5% and ALG2% on the micellization process of Pluronic P16.6% was evaluated by μDSC measurements using an μDSC7evo instrument (Setaram, Caluire, France) in the temperature range 1–70 °C, with 1 °C min
−1 scan rate. The reversibility of micellization was checked by cooling down the samples to 1 °C. Data acquisition and processing were performed using Calisto v.1077, the software supplied by the instrument manufacturer, with a linear baseline. The T
onset, T
peak, T
offset and the micellization enthalpy (ΔH) of P16.6% in the absence and in the presence of HA0.5% and ALG2% were determined. T
onset corresponds to the cmt as the temperature where micelles start to form, while T
offset corresponds to the temperature where the micellization is complete. T
peak represents the temperature of the maximum heat flow. ΔH was determined from the area by integrating the endothermic peak [
51,
52].
Supplementary Materials
The following supporting information can be downloaded at:
https://www.mdpi.com/article/10.3390/gels9120939/s1, Figure S1: Steady-state fluorescence spectra of ThT in glycerol at increasing concentrations in the range of 10
−6–10
−4 M. The excitation/emission wavelengths are marked on the spectra. All spectra are recorded in the same conditions; Figure S2: Excitation spectra of ThT in glycerol at different concentrations. The excitation/emission wavelengths are marked on the spectra; Figure S3: Steady-state fluorescence spectra of ThT in diethylene glycol and methanol at different concentrations. The excitation/emission wavelengths are marked on the spectra. All spectra are recorded in the same conditions; Figure S4: Excitation spectra of ThT in diethylene glycol and methanol at different concentrations. The excitation/emission wavelengths are marked on the spectra; Figure S5: Synchronous fluorescence spectra of ThT in glycerol at increasing concentrations in the range of 10
−6–10
−4 M. The excitation/emission pairs are marked on the spectra; Figure S6: Temperature dependence of the synchronous fluorescence spectra of ThT in P16.6% obtained at Δλ = 50 nm (A), 65 nm (B) and 100 nm (C); Figure S7: Estimation of the critical gelation temperature (cgt) of P16.6% using synchronous fluorescence data; Figure S8: Absorption spectrum, excitation spectra recorded at λ
em = 440, 480 and 520 nm and steady-state fluorescence spectra recorded at λ
ex = 360 and 420 nm for ThT in P16.6%ALG2%; Figure S9: Temperature dependence of the synchronous fluorescence spectra of ThT in P16.6%ALG2%: (A) Δλ = 50 nm, (B) Δλ = 80 nm; Figure S10: Estimation of the critical gelation temperature (cgt) of P16.6%ALG2% using the synchronous fluorescence emission (A) and the ratio of ThT synchronous fluorescence emissions (B); Figure S11: Second-derivative synchronous fluorescence (Δλ = 80 nm) spectra of ThT in P16.6%ALG2%. Inset: Plot of the second-derivative fluorescence intensity (normalized) at 440 nm as a function of temperature; Figure S12: Absorption spectrum, excitation spectra recorded at λ
em = 423, 480 and 520 nm and steady-state fluorescence spectra recorded at λ
ex = 360 and 420 nm for ThT in P16.6%HA0.5%; Figure S13: Temperature dependence of the synchronous fluorescence spectra of ThT in P16.6%HA0.5%: (A) Δλ = 50 nm, (B) Δλ = 65 nm and (C) Δλ = 90 nm; Figure S14: Plots of the synchronous fluorescence emission (A) and of the ratio of ThT synchronous fluorescence emissions (B) of ThT in P16.6%HA0.5% as a function of temperature; Figure S15: Heating and cooling μDSC scans of P16.6% in the absence and in the presence of HA0.5% or ALG2%; Figure S16: Reference plots for alginate (A—steady-state fluorescence intensities and B—ratio of steady-state fluorescence intensities) and hyaluronic acid (C—ratio of steady-state fluorescence intensities) showing no discontinuity at the gelation temperature.
Author Contributions
Conceptualization, I.M.; methodology, G.-A.B., A.P. and I.M.; investigation, G.-A.B., A.P. and I.M.; writing—original draft preparation, I.M. and A.P.; writing—review and editing, I.M. and A.P. All authors have read and agreed to the published version of the manuscript.
Funding
This research received no external funding.
Institutional Review Board Statement
Not applicable.
Informed Consent Statement
Not applicable.
Data Availability Statement
Acknowledgments
This research was carried out within the research direction “Non-covalent interactions investigated by using dual molecular probes” of the “Ilie Murgulescu” Institute of Physical Chemistry at the Romanian Academy.
Conflicts of Interest
The authors declare no conflict of interest.
References
- Mudliar, N.H.; Singh, P.K. Fluorescent H-aggregates hosted by a charged cyclodextrin cavity. Chem. Eur. J. 2016, 22, 7394–7398. [Google Scholar] [CrossRef] [PubMed]
- Bhasikuttan, A.C.; Choudhury, S.D.; Pal, H.; Mohanty, J. Supramolecular assemblies of Thioflavin T with cucurbiturils: Prospects of cooperative and competitive metal ion binding. Isr. J. Chem. 2011, 51, 634–645. [Google Scholar] [CrossRef]
- Kumar, S.; Singh, A.K.; Krishnamoorthy, G.; Swaminathan, R. Thioflavin T displays enhanced fluorescence selectively inside anionic micelles and mammalian cells. J. Fluoresc. 2008, 18, 1199–1205. [Google Scholar] [CrossRef] [PubMed]
- Singh, P.K.; Nath, S. Ultrafast torsional dynamics in nanoconfined water pool: Comparison between neutral and charged reverse micelles. J. Photochem. Photobiol. A Chem. 2012, 248, 42–49. [Google Scholar] [CrossRef]
- Babenko, V.; Dzwolak, W. Thioflavin T forms a non-fluorescent complex with α-helical poly-L-glutamic acid. Chem. Commun. 2011, 47, 10686–10688. [Google Scholar] [CrossRef] [PubMed]
- Rovnyagina, N.R.; Sluchanko, N.N.; Tikhonova, T.N.; Fadeev, V.V.; Litskevich, A.Y.; Maskevich, A.A.; Shirshin, E.A. Binding of thioflavin T by albumins: An underestimated role of protein oligomeric heterogeneity. Int. J. Biol. Macromol. 2018, 108, 284–290. [Google Scholar] [CrossRef] [PubMed]
- Hanczyc, P.; Rajchel-Mieldzioć, P.; Feng, B.; Fita, P. Identification of Thioflavin T binding modes to DNA: A structure-specific molecular probe for lasing applications. J. Phys. Chem. Lett. 2021, 12, 5436–5442. [Google Scholar] [CrossRef] [PubMed]
- Amdursky, N.; Erez, Y.; Huppert, D. Molecular rotors: What lies behind the high sensitivity of the thioflavin-T fluorescent marker. Acc. Chem. Res. 2012, 45, 1548–1557. [Google Scholar] [CrossRef]
- Stsiapura, V.I.; Maskevich, A.A. Computational study of Thioflavin T torsional relaxation in the excited state. J. Phys. Chem. A 2007, 111, 4829–4835. [Google Scholar] [CrossRef]
- Freire, S.; de Araujo, M.H.; Al-Soufi, W.; Novo, M. Photophysical study of Thioflavin T as fluorescence marker of amyloid fibrils. Dyes Pigm. 2014, 110, 97–105. [Google Scholar] [CrossRef]
- Stsiapura, V.I.; Maskevich, A.A.; Tikhomirov, S.A.; Buganov, O.V. Charge transfer process determines ultrafast excited state deactivation of thioflavin T in low-viscosity solvents. J. Phys. Chem. A 2010, 114, 8345–8350. [Google Scholar] [CrossRef] [PubMed]
- Malmos, K.G.; Blancas-Mejia, L.M.; Weber, B.; Buchner, J.; Ramirez-Alvarado, M.; Naiki, H.; Otzen, D. ThT 101: A primer on the use of thioflavin T to investigate amyloid formation. Amyloid 2017, 24, 1–16. [Google Scholar] [CrossRef]
- Zhang, Y.; Chen, Y.; Li, J.; Lu, L.; Yu, L. Construction and luminescent behavior of supramolecular hydrogel with white-light emission. Acta Chim. Sin. 2018, 76, 622–626. [Google Scholar] [CrossRef]
- Giovannini, G.; Cinelli, P.; Boesel, L.F.; Rossi, R.M. Thioflavin-modified molecularly imprinted hydrogel for fluorescent-based non-enzymatic glucose detection in wound exudate. Mater. Today Bio 2022, 14, 100258. [Google Scholar] [CrossRef] [PubMed]
- Okesola, B.O.; Wu, Y.; Derkus, B.; Gani, S.; Wu, D.; Knani, D.; Smith, D.K.; Adams, D.J.; Mata, A. Supramolecular self-assembly to control structural and biological properties of multicomponent hydrogels. Chem. Mater. 2019, 31, 7883–7897. [Google Scholar] [CrossRef] [PubMed]
- Micutz, M.; Matalon, E.; Staicu, T.; Angelescu, D.; Ariciu, A.M.; Rogozea, A.; Turcu, I.M.; Ionita, G. The influence of hydroxy propyl β-cyclodextrin on the micellar to gel transition in F127 solutions investigated at macro and nanoscale levels. New J. Chem. 2014, 38, 2801–2812. [Google Scholar] [CrossRef]
- Baratoiu, R.; Mocanu, S.; Matei, I.; Bem, M.; Hristea, E.; Tecuceanu, V.; Ionita, G. A comparison of the behavior of monomolecular and dual molecular probes in F127/cyclodextrin systems. Macromol. Chem. Phys. 2019, 220, 1800489. [Google Scholar] [CrossRef]
- Matei, I.; Ariciu, A.M.; Popescu, E.I.; Mocanu, S.; Neculae, A.V.F.; Savonea, F.; Ionita, G. Evaluation of the accessibility of molecules in hydrogels using a scale of spin probes. Gels 2022, 8, 428. [Google Scholar] [CrossRef]
- Neacsu, M.V.; Matei, I.; Micutz, M.; Staicu, T.; Precupas, A.; Popa, V.T.; Salifoglou, A.; Ionita, G. Interaction between albumin and Pluronic F127 block copolymer revealed by global and local physicochemical profiling. J. Phys. Chem. B 2016, 120, 4258–4267. [Google Scholar] [CrossRef]
- Abrami, M.; D’Agostino, I.; Milcovich, G.; Fiorentino, S.; Farra, R.; Asaro, F.; Lapasin, R.; Grassic, G.; Grassi, M. Physical characterization of alginate–Pluronic F127 gel for endoluminal NABDs delivery. Soft Matter 2014, 10, 729–737. [Google Scholar] [CrossRef]
- Milocco, A.; Scuor, N.; Lughi, V.; Lamberti, G.; Barba, A.A.; Divittorio, R.; Grassi, G.; Perkan, A.; Grassi, M.; Abrami, M. Thermal gelation modeling of a pluronic-alginate blend following coronary angioplasty. J. Appl. Polym. Sci. 2020, 137, 48539. [Google Scholar] [CrossRef]
- Nascimento, M.H.M.; Franco, M.K.K.D.; Yokaichyia, F.; de Paula, E.; Lombello, C.B.; de Araujoa, D.R. Hyaluronic acid in Pluronic F-127/F-108 hydrogels for postoperative pain in arthroplasties: Influence on physico-chemical properties and structural requirements for sustained drug-release. Int. J. Biol. Macromol. 2018, 111, 1245–1254. [Google Scholar] [CrossRef]
- Lupu, A.; Gradinaru, L.M.; Rusu, D.; Bercea, M. Self-healing of Pluronic® F127 hydrogels in the presence of various polysaccharides. Gels 2023, 9, 719. [Google Scholar] [CrossRef]
- Kjøniksen, A.-L.; Calejo, M.T.; Zhu, K.; Nyström, B.; Sande, S.A. Stabilization of Pluronic gels in the presence of different polysaccharides. J. Appl. Polym. Sci. 2014, 131, 40465. [Google Scholar] [CrossRef]
- Alexandridis, P.; Hatton, T.A. Poly(ethylene oxide)-poly(propylene oxide )-poly (ethylene oxide) block copolymer surfactants in aqueous solutions and at interfaces: Thermodynamics, structure, dynamics, and modeling. Coll. Surf. A Physicochem. Eng. Asp. 1995, 96, 1–46. [Google Scholar] [CrossRef]
- Hecht, E.; Mortensen, K.; Gradzielski, M.; Hoffmann, H. Interaction of ABA block copolymers with ionic surfactants: Influence on micellization and gelation. J. Phys. Chem. 1995, 99, 4866–4874. [Google Scholar] [CrossRef]
- Lavysh, A.V.; Lugovskii, A.A.; Voropay, E.S.; Sulatskaya, A.I.; Kuznetsova, I.M.; Turoverov, K.K.; Maskevich, A.A. Aggregation of thioflavin T and its new derivative in the presence of anionic polyelectrolyte. Biointerface Res. Appl. Chem. 2016, 6, 1525–1530. [Google Scholar]
- Maskevich, A.A.; Lavysh, A.V.; Kuznetsova, I.M.; Sulatskaya, A.I.; Turoverov, K.K. Spectral manifestations of aggregation of the molecules thioflavin T. J. Appl. Spectrosc. 2015, 82, 37–43. [Google Scholar] [CrossRef]
- Lide, D.R. CRC Handbook of Chemistry and Physics, 85th ed.; CRC Press: Boca Raton, FL, USA, 2004. [Google Scholar]
- Maskevich, A.A.; Stsiapura, V.I.; Kuzmitsky, V.A.; Kuznetsova, I.M.; Povarova, O.I.; Uversky, V.N.; Turoverov, K.K. Spectral properties of Thioflavin T in solvents with different dielectric properties and in a fibril-incorporated form. J. Proteome Res. 2007, 6, 1392–1401. [Google Scholar] [CrossRef]
- Kuznetsova, I.M.; Sulatskaya, A.I.; Maskevich, A.A.; Uversky, V.N.; Turoverov, K.K. High fluorescence anisotropy of Thioflavin T in aqueous solution resulting from its molecular rotor nature. Anal. Chem. 2016, 88, 718–724. [Google Scholar] [CrossRef]
- Matei, I.; Tablet, C.; Ionescu, S.; Hillebrand, M. Close-lying pKa values of kaempferol determined by second-derivative synchronous fluorescence. Rev. Roum. Chim. 2014, 59, 401–405. [Google Scholar]
- Li, Y.Q.; Huang, X.Z.; Xu, J.G. Synchronous fluorescence spectrometric methodology in the wavelength domain. J. Fluoresc. 1999, 9, 173–179. [Google Scholar] [CrossRef]
- Valeur, B. Molecular Fluorescence. Principles and Applications; Wiley-VCH: Weinheim, Germany, 2002; p. 48. [Google Scholar]
- Lin, H.R.; Sung, K.C.; Vong, W.J. In situ gelling of alginate/pluronic solutions for ophthalmic delivery of pilocarpine. Biomacromolecules 2004, 5, 2358–2365. [Google Scholar] [CrossRef] [PubMed]
- Mayol, L.; Biondi, M.; Quaglia, F.; Fusco, S.; Borzacchiello, A.; Ambrosio, L.; La Rotonda, M.I. Injectable thermally responsive mucoadhesive gel for sustained protein delivery. Biomacromolecules 2011, 12, 28–33. [Google Scholar] [CrossRef] [PubMed]
- Bohorquez, M.; Koch, C.; Trygstad, T.; Pandit, N. A study of the temperature-dependent micellization of Pluronic F127. J. Coll. Interf. Sci. 1999, 216, 34–40. [Google Scholar] [CrossRef] [PubMed]
- Pradines, B.; Djabourov, M.; Vauthier, C.; Loiseau, P.M.; Ponchel, G.; Bouchemal, K. Gelation and micellization behaviors of pluronic® F127 hydrogel containing poly(isobutylcyanoacrylate) nanoparticles specifically designed for mucosal application. Coll. Surf. B Biointerfaces 2015, 135, 669–676. [Google Scholar] [CrossRef] [PubMed]
- Prudhomme, R.K.; Wu, G.; Schneider, D.K. Structure and rheology studies of poly(oxyethylene−oxypropylene−oxyethylene) aqueous solution. Langmuir 1996, 12, 4651–4659. [Google Scholar] [CrossRef]
- Wanka, G.; Hoffman, H.; Ulbricht, W. Phase diagrams and aggregation behavior of poly(oxyethylene)-poly(oxypropylene)-poly(oxyethylene) triblock copolymers in aqueous solutions. Macromolecules 1994, 27, 4145–4159. [Google Scholar] [CrossRef]
- Ravani, L.; Esposito, E.; Bories, C.; Lievin-Le Moal, V.; Loiseau, P.M.; Djabourov, M.; Cortesi, R.; Bouchemal, K. Clotrimazole-loaded nanostructured lipid carrier hydrogels: Thermal analysis and in vitro studies. Int. J. Pharm. 2013, 454, 695–702. [Google Scholar] [CrossRef]
- Dey, J.; Kumar, S.; Nath, S.; Ganguly, R.; Aswal, V.K.; Ismail, K. Additive induced core and corona specific dehydration and ensuing growth and interaction of Pluronic F127 micelles. J. Coll. Interface Sci. 2014, 415, 95–102. [Google Scholar] [CrossRef] [PubMed]
- Shah, V.; Bharatiya, B.; Patel, V.; Mishra, M.K.; Shukla, A.D.; Shah, D.O. Interaction of salicylic acid analogues with Pluronic® micelles: Investigations on micellar growth and morphological transition. J. Mol. Liq. 2019, 277, 563–570. [Google Scholar] [CrossRef]
- Shriky, B.; Kelly, A.; Isreb, M.; Babenko, M.; Mahmoudi, N.; Rogers, S.; Shebanova, O.; Snow, T.; Gough, T. Pluronic® F127 thermosensitive injectable smart hydrogels for controlled drug delivery system development. J. Coll. Interface Sci. 2020, 565, 119–130. [Google Scholar] [CrossRef] [PubMed]
- da Silva, J.B.; Dos Santos, R.S.; da Silva, M.B.; Braga, G.; Cook, M.T.; Bruschi, M.L. Interaction between mucoadhesive cellulose derivatives and Pluronic F127: Investigation on the micelle structure and mucoadhesive performance. Mater. Sci. Eng. C Mater. Biol. Appl. 2021, 119, 111643. [Google Scholar] [CrossRef] [PubMed]
- Pragatheeswaran, A.M.; Chen, S.B. The influence of poly(acrylic acid) on micellization and gelation characteristics of aqueous Pluronic F127 copolymer system. Coll. Polym. Sci. 2016, 294, 107–117. [Google Scholar] [CrossRef]
- Branca, C.; Khouzami, K.; Wanderlingh, U.; D’Angelo, G. Effect of intercalated chitosan/clay nanostructures on concentrated Pluronic® F127 solution: A FTIR-ATR, DSC and rheological Study. J. Coll. Interf. Sci. 2018, 517, 221–229. [Google Scholar] [CrossRef] [PubMed]
- Grassi, G.; Farra, R.; Noro, E.; Voinovich, D.; Lapasin, R.; Dapas, B.; Alpar, O.; Zennaro, C.; Carraro, M.; Giansante, G.; et al. Characterization of nucleic acid molecule/liposome complexes and rheological effects of pluronic/alginate matrices. J. Drug Deliv. Sci. Technol. 2007, 17, 325–331. [Google Scholar] [CrossRef]
- Mayol, L.; Borzacchiello, A.; Quaglia, F.; La Rotonda, M.I.; Ambrosio, L. Effect of hyaluronic acid on the self assembling behaviour of PEO-PPO copolymers in aqueous solution. AIP Conf. Proc. 2008, 1027, 570–572. [Google Scholar] [CrossRef]
- Jeon, S.; Granick, S.; Kwon, K.W.; Char, K. Microviscosity in poly(ethylene oxide)-polypropylene oxide-poly(ethylene oxide) block copolymers probed by fluorescence depolarization kinetics. J. Polym. Sci. B Polym. Phys. 2002, 40, 2883–2888. [Google Scholar] [CrossRef]
- Alexandridis, P.; Nivaggioli, T.; Hatton, T.A. Temperature effects on structural properties of Pluronic P104 and F108 PEO-PPO-PEO block copolymer solutions. Langmuir 1995, 11, 1468–1476. [Google Scholar] [CrossRef]
- Armstrong, J.; Chowdhry, B.; Mitchell, J.; Beezer, A.; Leharne, S. Effect of cosolvents and cosolutes upon aggregation transitions in aqueous solutions of the poloxamer F87 (poloxamer P237): A high sensitivity differential scanning calorimetry study. J. Phys. Chem. 1996, 100, 1738–1745. [Google Scholar] [CrossRef]
Scheme 1.
Chemical structures of thioflavin T (ThT), Pluronic F127 (P), alginic acid (ALG) and hyaluronic acid (HA); PEO = poly(ethylene oxide) block and PPO = poly(propylene oxide) block.
Scheme 1.
Chemical structures of thioflavin T (ThT), Pluronic F127 (P), alginic acid (ALG) and hyaluronic acid (HA); PEO = poly(ethylene oxide) block and PPO = poly(propylene oxide) block.
Figure 1.
Absorption spectrum, excitation spectra recorded at λem = 423 nm (A), 480 and 520 nm (B) and steady-state fluorescence spectra recorded at λex = 360 nm (A) and 420 nm (B) for ThT in P16.6%.
Figure 1.
Absorption spectrum, excitation spectra recorded at λem = 423 nm (A), 480 and 520 nm (B) and steady-state fluorescence spectra recorded at λex = 360 nm (A) and 420 nm (B) for ThT in P16.6%.
Figure 2.
Temperature dependence of the steady-state fluorescence spectra of ThT in P16.6% recorded at λex = 360 nm (A) and at λex = 420 nm (B). Estimation of the critical gelation temperature (cgt) of P16.6% using the steady-state fluorescence intensity of ThT (C) and the ratio of ThT steady-state fluorescence intensities (D).
Figure 3.
Second-derivative steady-state fluorescence (A), λex = 360 nm, and second-derivative synchronous fluorescence (B), Δλ = 65 nm, spectra of ThT in P16.6%. Inset of (A): Plot of the second-derivative fluorescence intensity (normalized) at 410 nm as a function of temperature. Inset of (B): Determination of the cmt and cgt values from the plot of the second-derivative synchronous fluorescence intensity (normalized) at 416 nm as a function of temperature. The solid lines represent the best fits of the data to sigmoid functions.
Figure 4.
Temperature dependence of the steady-state fluorescence spectra of ThT in P16.6%ALG2% recorded at λex = 360 nm (A) and at λex = 420 nm (B). Estimation of the critical gelation temperature (cgt) of P16.6%ALG2% using the steady-state fluorescence intensity of ThT (C) and the ratio of ThT steady-state fluorescence intensities (D).
Figure 5.
Temperature dependence of the steady-state fluorescence spectra of ThT in P16.6%HA0.5% recorded at λex = 360 nm (A) and at λex = 420 nm (B). Plots of the steady-state fluorescence intensities of ThT (C) and of the ratios of ThT steady-state fluorescence intensities (D) as a function of temperature.
Figure 6.
Estimation of the critical gelation temperature (cgt) of the P16.6%HA0.5% system from the ratios of steady-state fluorescence (A) and synchronous fluorescence (B) intensities. The solid lines represent the best fits of the data to sigmoid functions.
Figure 6.
Estimation of the critical gelation temperature (cgt) of the P16.6%HA0.5% system from the ratios of steady-state fluorescence (A) and synchronous fluorescence (B) intensities. The solid lines represent the best fits of the data to sigmoid functions.
Figure 7.
Schematic representation of the Pluronic F127/polysaccharide systems. The Pluronic F127 subdomains, containing micelles with interpenetrated coronae, are caged by polysaccharide chains.
Figure 7.
Schematic representation of the Pluronic F127/polysaccharide systems. The Pluronic F127 subdomains, containing micelles with interpenetrated coronae, are caged by polysaccharide chains.
Figure 8.
The μDSC scans of P16.6% micellization, in the absence and in the presence of HA0.5% and ALG2%.
Figure 8.
The μDSC scans of P16.6% micellization, in the absence and in the presence of HA0.5% and ALG2%.
Figure 9.
Thermodynamic parameters of P16.6% micellization, in the absence and in the presence of HA0.5% and ALG2%.
Figure 9.
Thermodynamic parameters of P16.6% micellization, in the absence and in the presence of HA0.5% and ALG2%.
| Disclaimer/Publisher’s Note: The statements, opinions and data contained in all publications are solely those of the individual author(s) and contributor(s) and not of MDPI and/or the editor(s). MDPI and/or the editor(s) disclaim responsibility for any injury to people or property resulting from any ideas, methods, instructions or products referred to in the content. |
© 2023 by the authors. Licensee MDPI, Basel, Switzerland. This article is an open access article distributed under the terms and conditions of the Creative Commons Attribution (CC BY) license (https://creativecommons.org/licenses/by/4.0/).


