1. Introduction
In 2019, global food waste, also referred to as agri-food residues (AFRs), reached approximately 931 million tons along the entire supply chain, originating primarily from household consumption (61%), food service (26%), and retail (13%), leading to significant negative impacts on the environment, economy, and society. In response to this issue, UN’s 2030 Agenda [
1], specifically Sustainable Development Goal 12.3, emphasized the need to halve food waste and reduce food loss by 2030. As awareness of our impact on the planet grows, the food and agricultural industries face challenges related to excessive natural resource consumption, soil degradation, environmental pollution, and depletion of food resources. Consequentially, new policies and efforts toward the design of appropriate management of AFRs have to be put in place to contribute to a sustainable development, respectful of the social and environmental facets [
2]. Within this frame, the exploitation of AFRs presents new opportunities to extract and purify high value-added compounds [
3,
4,
5], including fibers, antioxidant phytochemicals, oligosaccharides, vitamins, pectin, enzymes, pigments, and organic acids inter alia, of particular interest to innovative applications in different fields (i.e., food ingredients, nutraceuticals, cosmeceutical, bioderived fine chemicals, biofuels, etc.) [
6]. By recovering compounds from AFRs, residues can be reduced, and economic profitability can be increased [
7]. Therefore, the partial (or even total) usage of industrial and agricultural waste could be beneficial both environmentally and economically by reducing their environmental burden [
8], and at the same time solving the economic issues [
9].
Among side streams, lignocellulosic biomass derived from forestry, agriculture, agro-industrial activities, and food waste is the most abundant, renewable, and cost-effective biomass on Earth, with an annual production of around 200 billion tons [
10,
11,
12,
13,
14]. Crop residues, particularly straws from cereal plants like barley, oat, rye, and wheat, contribute 74% of this biomass [
15]. These biomasses primarily consist of cellulose (34–40%), hemicellulose (20–25%), lignin (20%), and other minor components [
16]. Cellulose, a renewable organic carbohydrate biopolymer with a unique molecular structure, possesses notable chemical (hydrophilicity, chirality, degradability, and chemical variability) and mechanical (tensile strength and Young’s modulus) properties [
17]. Such promising properties have attracted increasing interest as constitutive elements for developing biomaterials, including nanofillers or additives [
18], adsorption materials [
19], and stabilizers of Pickering emulsions [
20], especially through advanced nanotechnology tools [
21]. Owing to its hierarchical organization in a supramolecular structure and the hydrogen bonds between hydroxyl groups, as well as its semicrystalline nature, cellulose can be efficiently deconstructed to obtain cellulose nanoparticles (nanocellulose, NC) [
22]. NC exhibits desirable physicochemical characteristics, such as high specific surface area and aspect ratio, high crystallinity, purity, excellent mechanical properties, and low thermal expansion and density [
17,
23,
24,
25,
26]. These features create new and innovative prospects for NC applications in biomedical, environmental, and energy fields [
27]. However, due to the wide range of NC applications and its abundance, it is crucial to establish effective and simple comparison methods that assess the suitability of different types of NC for various applications using a single criterion. In this regard, Desmaisons et al. [
28] proposed a new method based on determining the NC quality index through multifactorial analysis. This method enables the assessment of the most critical properties of NC for different fields, facilitates NC production monitoring, links energy consumption, and allows comparative evaluation of various suspensions to guide consumers toward the most suitable suspension for a given application.
One of the innovative applications of NC is in the fabrication of ultralight and highly porous aerogels [
29,
30]. NC-based aerogels exhibit remarkable properties, including high compressive strength (5.2 kPa–16.67 MPa), low specific surface areas (0.05–0.22 g/cm
3), and ultra-high porosity (93–99%) [
31]. Notably, these characteristics are comparable to or even surpass those of synthetic polymer aerogels [
32], activated carbon [
33], and diatomite-silica aerogels [
34], whose application is limited by their poor mechanical [
35] and dust-release properties [
36]. In contrast to traditional and commercially aerogels, for which materials with near-identical structure and properties are produced with different precursors and drying techniques [
37], NC-based aerogels present several advantages: (i) inexhaustible and renewable source, (ii) natural biopolymer with better biodegradability, (iii) the aerogel-making process requires no crosslinking agent due to the abundance of hydroxyl groups, (iv) a stable 3D network structure can be achieved through intramolecular and intermolecular physical crosslinking, and (v) easy chemical modification allows for improvements in mechanical strength and structural characteristics [
38]. NC-based aerogel is being applied, among many, in the field of environmental remediation for dye removal from wastewater due to their natural renewability, abundance, ultra-low density, large surface area, and possibility of surface modification [
39,
40].
Chemicals and dyes are major sources of the environmental contamination of effluent wastewater from various industries [
41]. Synthetic dyes, in particular, raise concerns due to their potential toxicity and negative effects on human life and ecosystems. Approximately 10% to 25% of dyes produced annually are discharged into surface water streams during manufacturing and processing operations, with textile industry accounting for nearly 2% of these dyes [
42]. In particular, methylene blue, a cationic dye commonly used in textile manufacturing processes for dying cotton, wood, and silk, is a toxic and non-degradable dye [
43] that remains stable at elevated temperature, under light exposure, heat, and in the presence of other chemical reactions [
44]. Improper wastewater treatment and discharge without adequate management can lead to pollution and various health issues and wellness problems (e.g., eye burns, breathing difficulties, nausea, vomiting, and methemoglobinemia) [
45,
46,
47,
48]. Detoxifying toxic dyes from wastewater before discharge is therefore crucial and a very important aspect. Over the recent decades, several conventional techniques for the decolorization of water containing residual dyes have been reported, including physical methods like membrane filtration (nano-filtration, reverse osmosis, electrodialysis) [
49], coagulation/flocculation [
50], and irradiation [
51], as well as chemical and biological methods like advanced oxidation processes [
52], electrochemical degradation or ozonation [
53], and decolorization by aerobic or anaerobic degradation [
54]. Amongst these techniques, adsorption is widely employed due to its (i) effectiveness; (ii) versatility in removing different types of dyes [
55,
56]; (iii) eco-friendliness; and (iv) absence of harmful substances [
57] or secondary contaminants [
58]. Natural and synthetic adsorbents, including carbon-based materials, metal oxides, bio-adsorbents, and polymer-based materials, are commonly used for dye removal [
59].
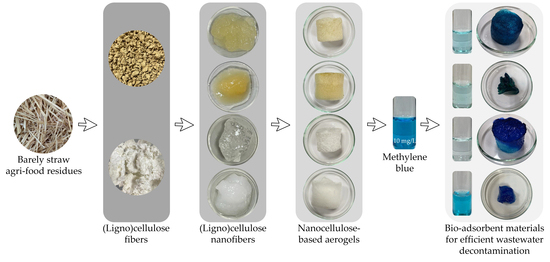
This study aims at exploring the advantages of NC-based aerogels as biomaterials with high affinity for specific dyes molecules from wastewater. Specifically, this study establishes the relationship between the quality index of (L)CNFs isolated from barley straw and their effectiveness as aerogels for wastewater decontamination. To achieve this, (L)CNFs were produced through various chemical and mechanical pre-treatments, and their quality index was carefully evaluated. Subsequently, their unique properties enable an efficient detection and adsorption of dye pollutants, with a special emphasis on the kinetic and isothermal analysis of the adsorption process. The novel insights gained from this research contribute significantly to the field of science and technology of NC-based aerogels for environmentally friendly and efficient dyes removal in sustainable solutions for wastewater treatment applications.
4. Materials and Methods
4.1. Materials
Barley straw (BS), kindly provided by a farmer in Córdoba (Spain), was air-dried at room temperature and stored until usage. The relative humidity was 8.95 ± 0.23%.
The reactants used throughout this study were sodium hydroxide (NaOH, ≥99%, Sigma Aldrich, St. Louis, MO, USA), hydrochloric acid (HCl, 37%, Sigma Aldrich), sodium chlorite (NaClO2, ≥99%, Sigma Aldrich), sodium hypochlorite (NaClO, 10% w/v technical grade, PanReac, Barcelona, Spain), acetic acid (CH3COOH, ACS reagent, Sigma Aldrich), sodium bromide (NaBr, Hoynewell, Muskegon, NC, USA), TEMPO, 2,2,6,6-tetramethyl-piperidin-1-oxyle (C9H18NO, 98%, Sigma Aldrich), ethanol (C2H5OH, Sigma Aldrich), sulphuric acid (H2SO4, 95–98%, labbox, Barcelona, Spain), polymer polydiallyldimethylammonium chloride (BTG Instruments, Säffle, Sweden), Pes-Na (BTG Instruments, Säffle, Sweden), Copper(II) Ethylenediamine reagent (PanReac), and methylene blue (labbox).
4.2. Cellulose Fibers’ Isolation and Characterization
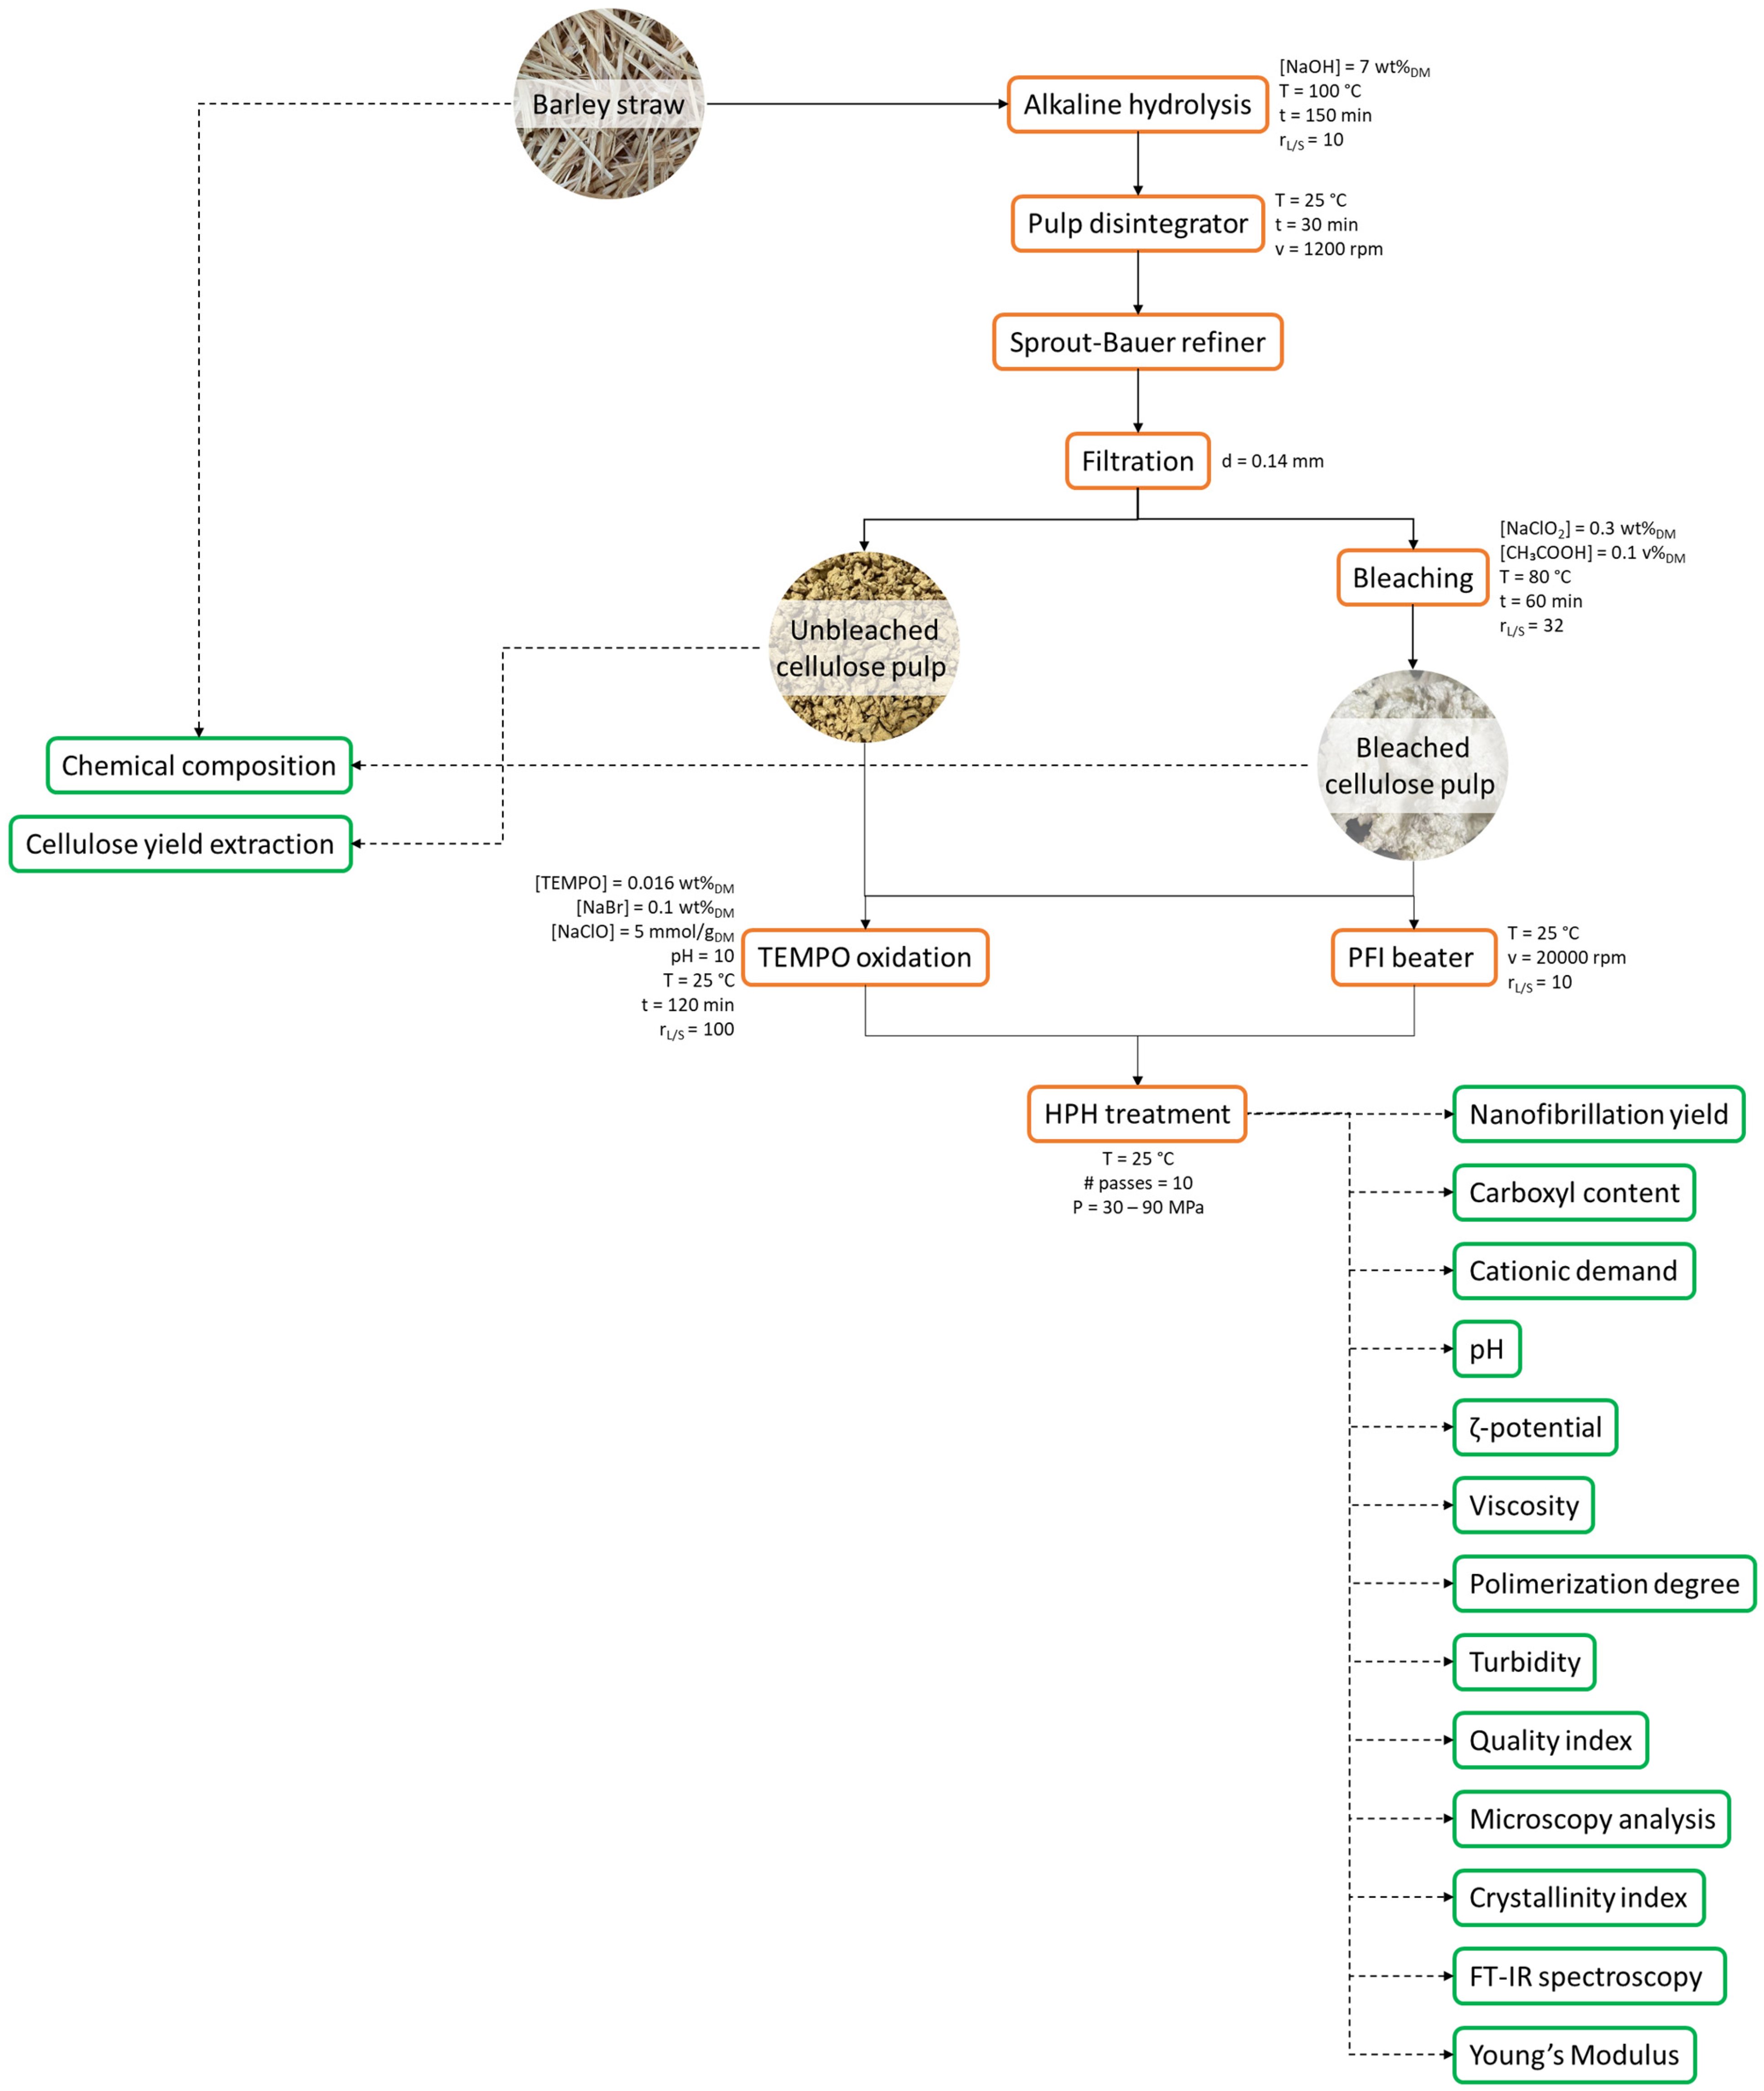
BS was subjected to soda pulping process (7 wt% (on dry basis, DM) NaOH for 150 min at 100 °C with a liquid/solid ratio of 10:1) in a batch reactor equipped with an external vessel to maintain the desired temperature and a motor to ensure the rotation [
40,
60,
83] to isolate unbleached cellulose pulp (BS-UB). Bleached cellulose fibers (BS-B) were obtained by repeating the bleaching process three times (0.3 wt%
DM NaClO
2 in acidified conditions and 3 wt%
DM cellulose suspension for 1 h at 80 °C).
Figure 8 schematically shows the flowchart of the cellulose fibers’ isolation and the characterization of obtained materials.
Cumulative yield of the pulping process and bleached treatment (%) was determined gravimetrically based on the isolated BS-UB and BS-B, respectively, relative to the initial dry mass of BS.
The chemical characterization of the BS, BS-UB, and BS-B was performed to determine the content of extractives (Tappi T-204), ashes (Tappi T-211), lignin (Tappi T-203os61), holocellulose (Tappi T-222), and α-cellulose (Tappi T-9m54) [
84].
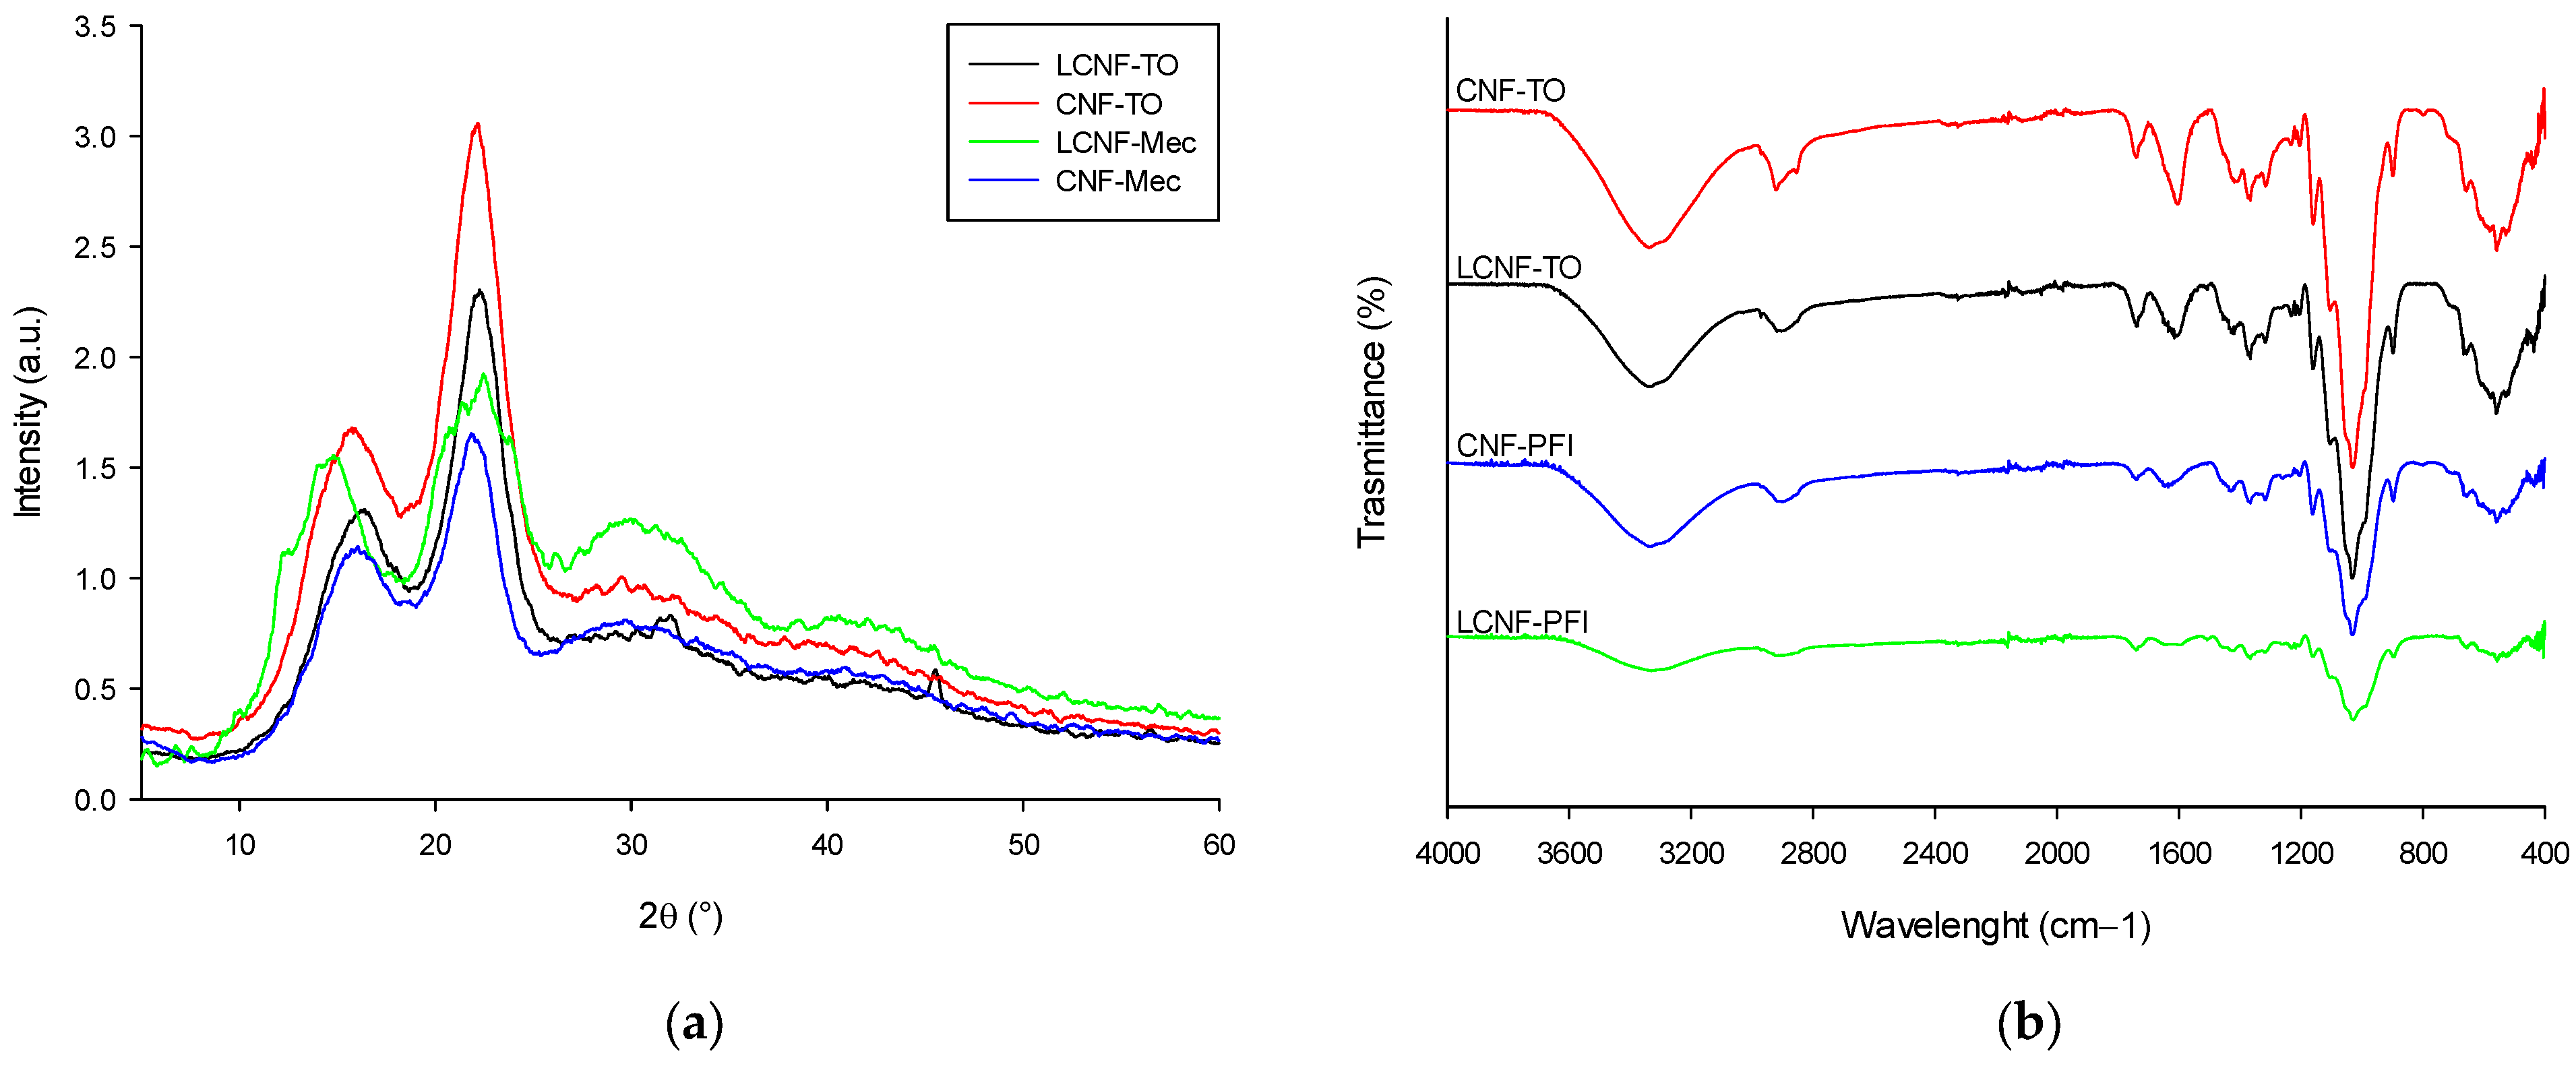
Furthermore, Fourier transform infrared spectroscopy (FT-IR) was carried out (FT-IR Spectrum Two series spectrophotometer, PerkinElmer, Waltham, Massachusetts, United States) to identify the functional groups and chemical structure at room temperature. The spectra were acquired in transmittance, with 40 scans collected over the wavenumber regions of 4000–400 cm−1 with a resolution of 4 cm−1.
The intrinsic viscosity (ɳ) of the cellulose fibers was determined according to the ISO 5351:2010 standard and converted in the degree of polymerization by Equations (3) and (4) [
85] as follows:
The measurements were conducted five times, and the mean value and standard deviation were calculated.
4.3. Cellulose Nanofibers’ Isolation
BS-UB and BS-B were then subjected to nanofibrillation to obtain (ligno)cellulose nanofibers ((L)CNFs), respectively, using two pre-treatments methods according to the ISO 5264-2:2002 [
86]: (i) chemical by TEMPO-mediated oxidation [
71] and (ii) mechanical beating by PFI beater refining. Finally, 1 wt%
DM pre-treated fiber suspension was subjected to HPH treatment (PandaPlus 2000, GEA Niro, Düsseldorf, Germany) following 4 passes at 300 bars, 3 passes at 600 bars, and 3 passes at 900 bars [
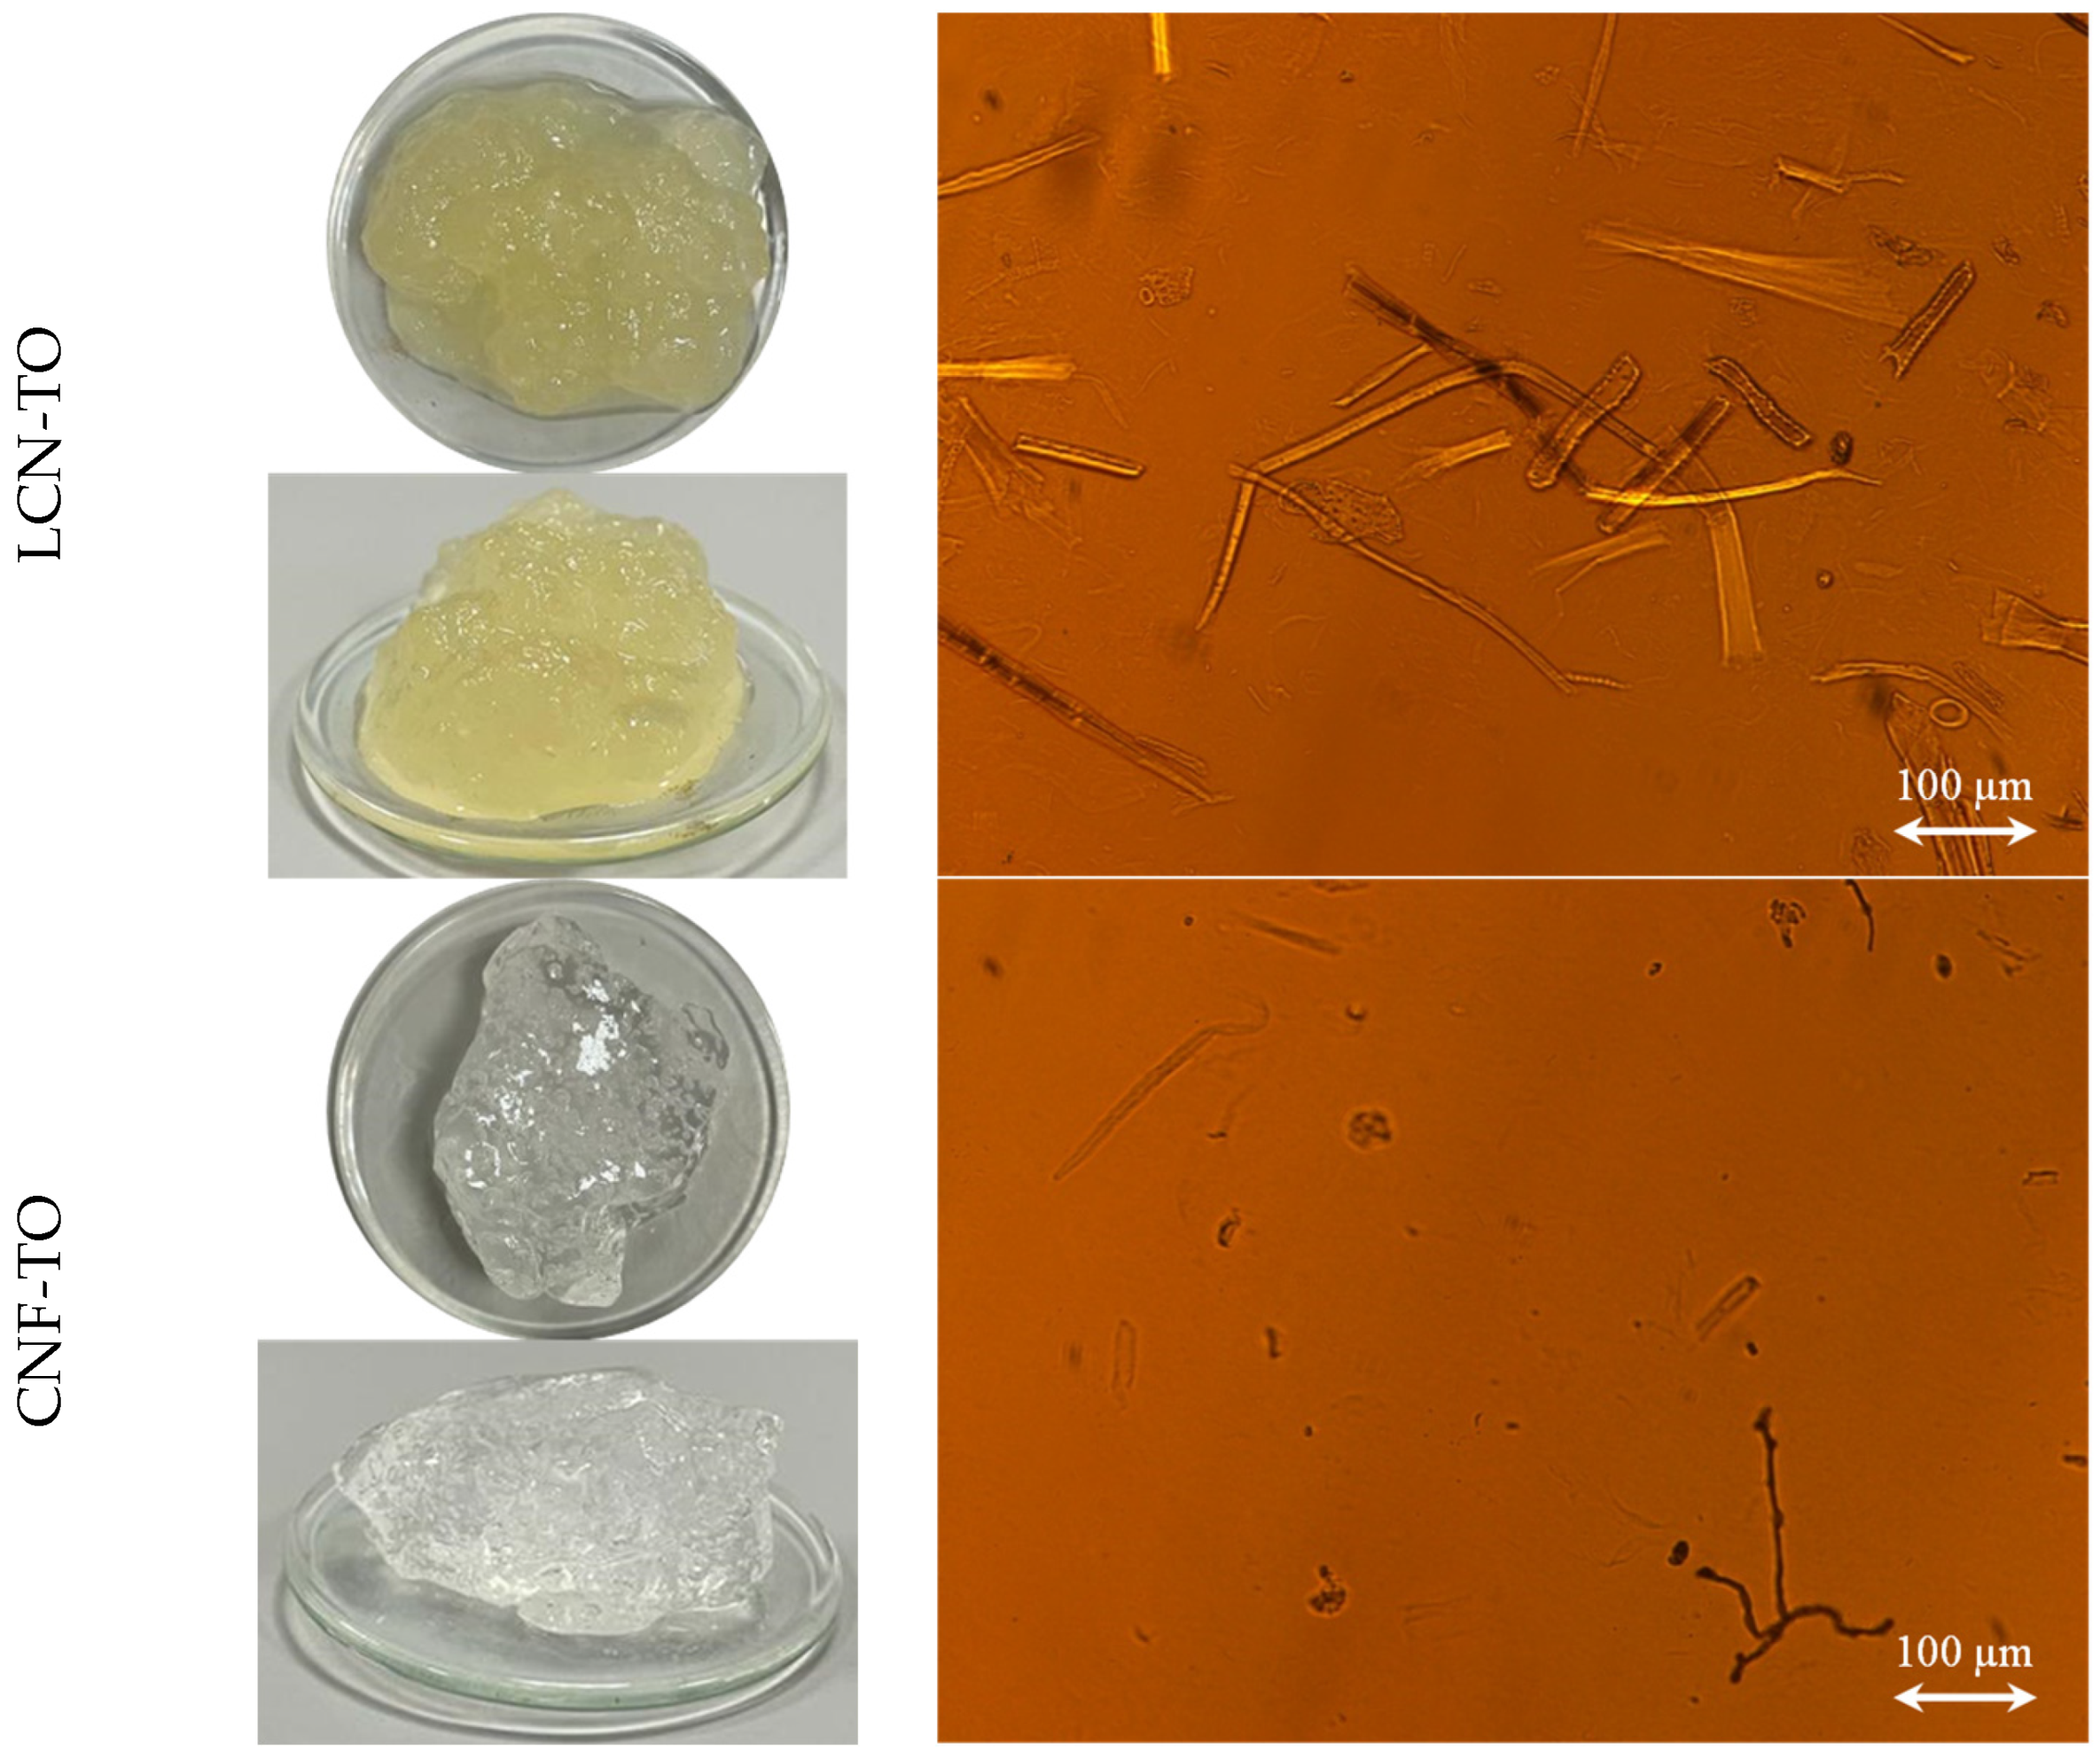
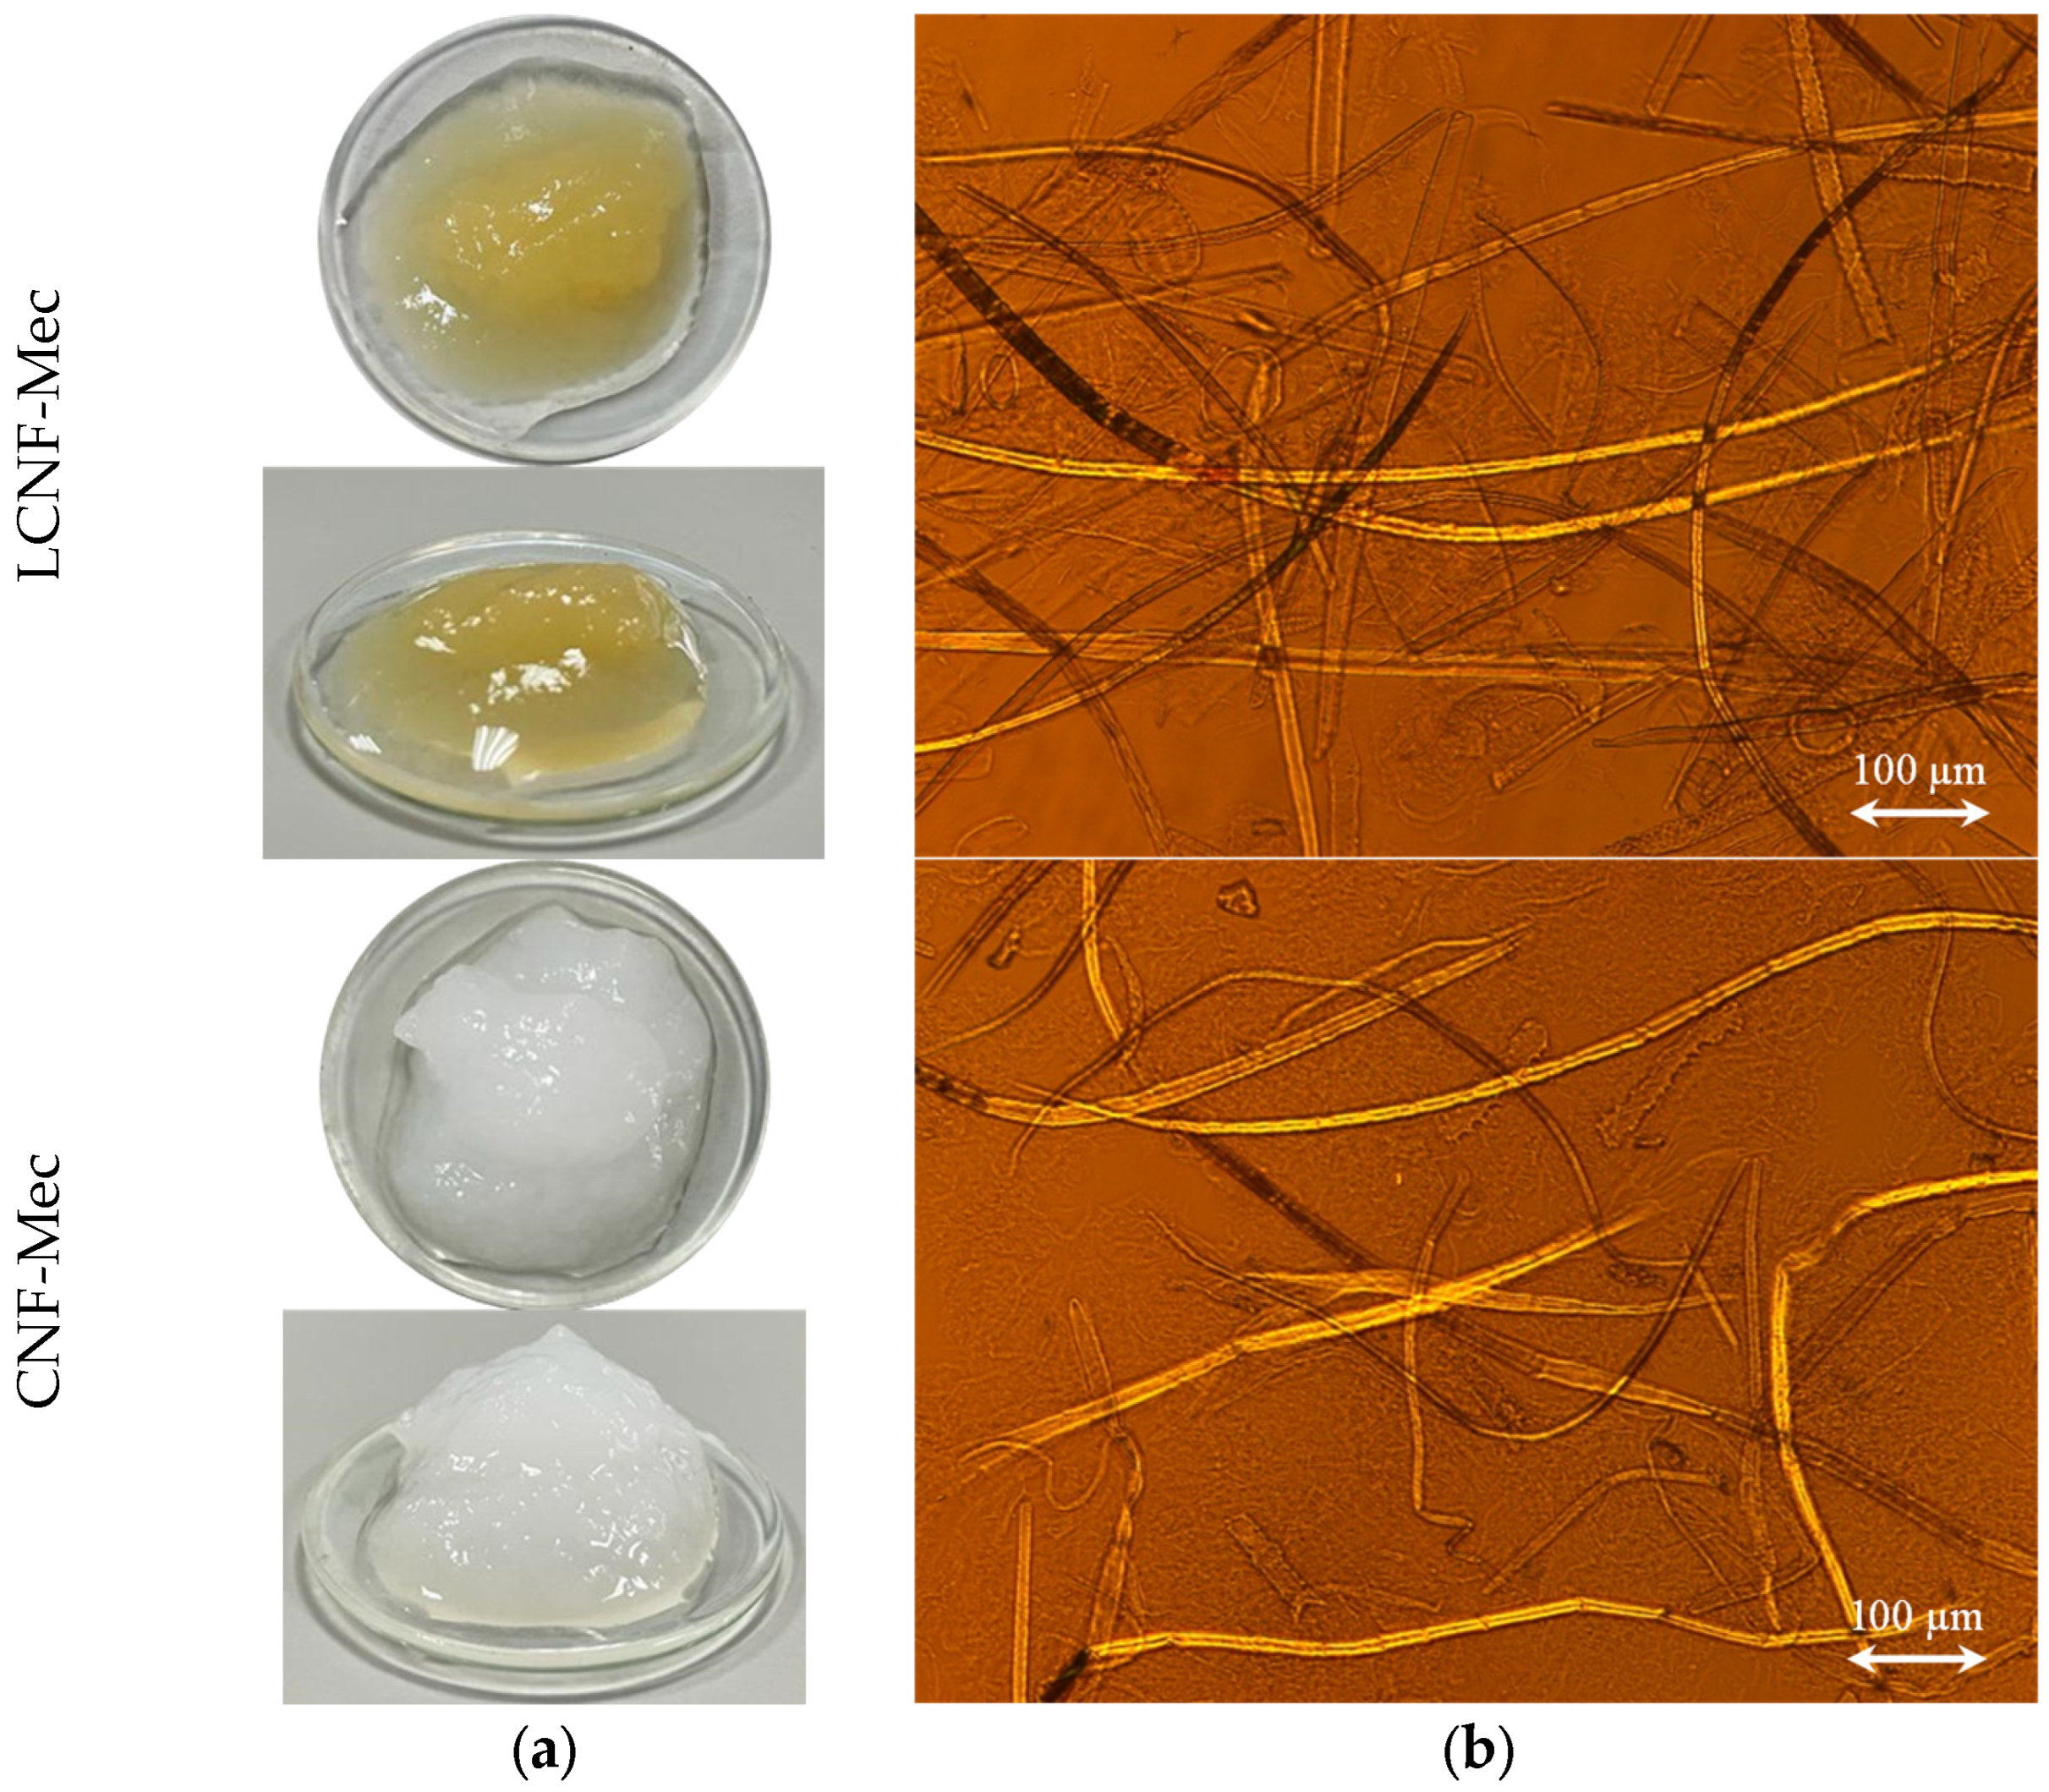
60]. The resulting (L)CNFs were designated as LCNF-TO, CNF-TO, LCNF-Mec, and CNF-Mec, depending on the starting cellulose pulp and pre-treatment method used.
4.4. Quality Index Determination and Cellulose Nanofibers’ Characterization
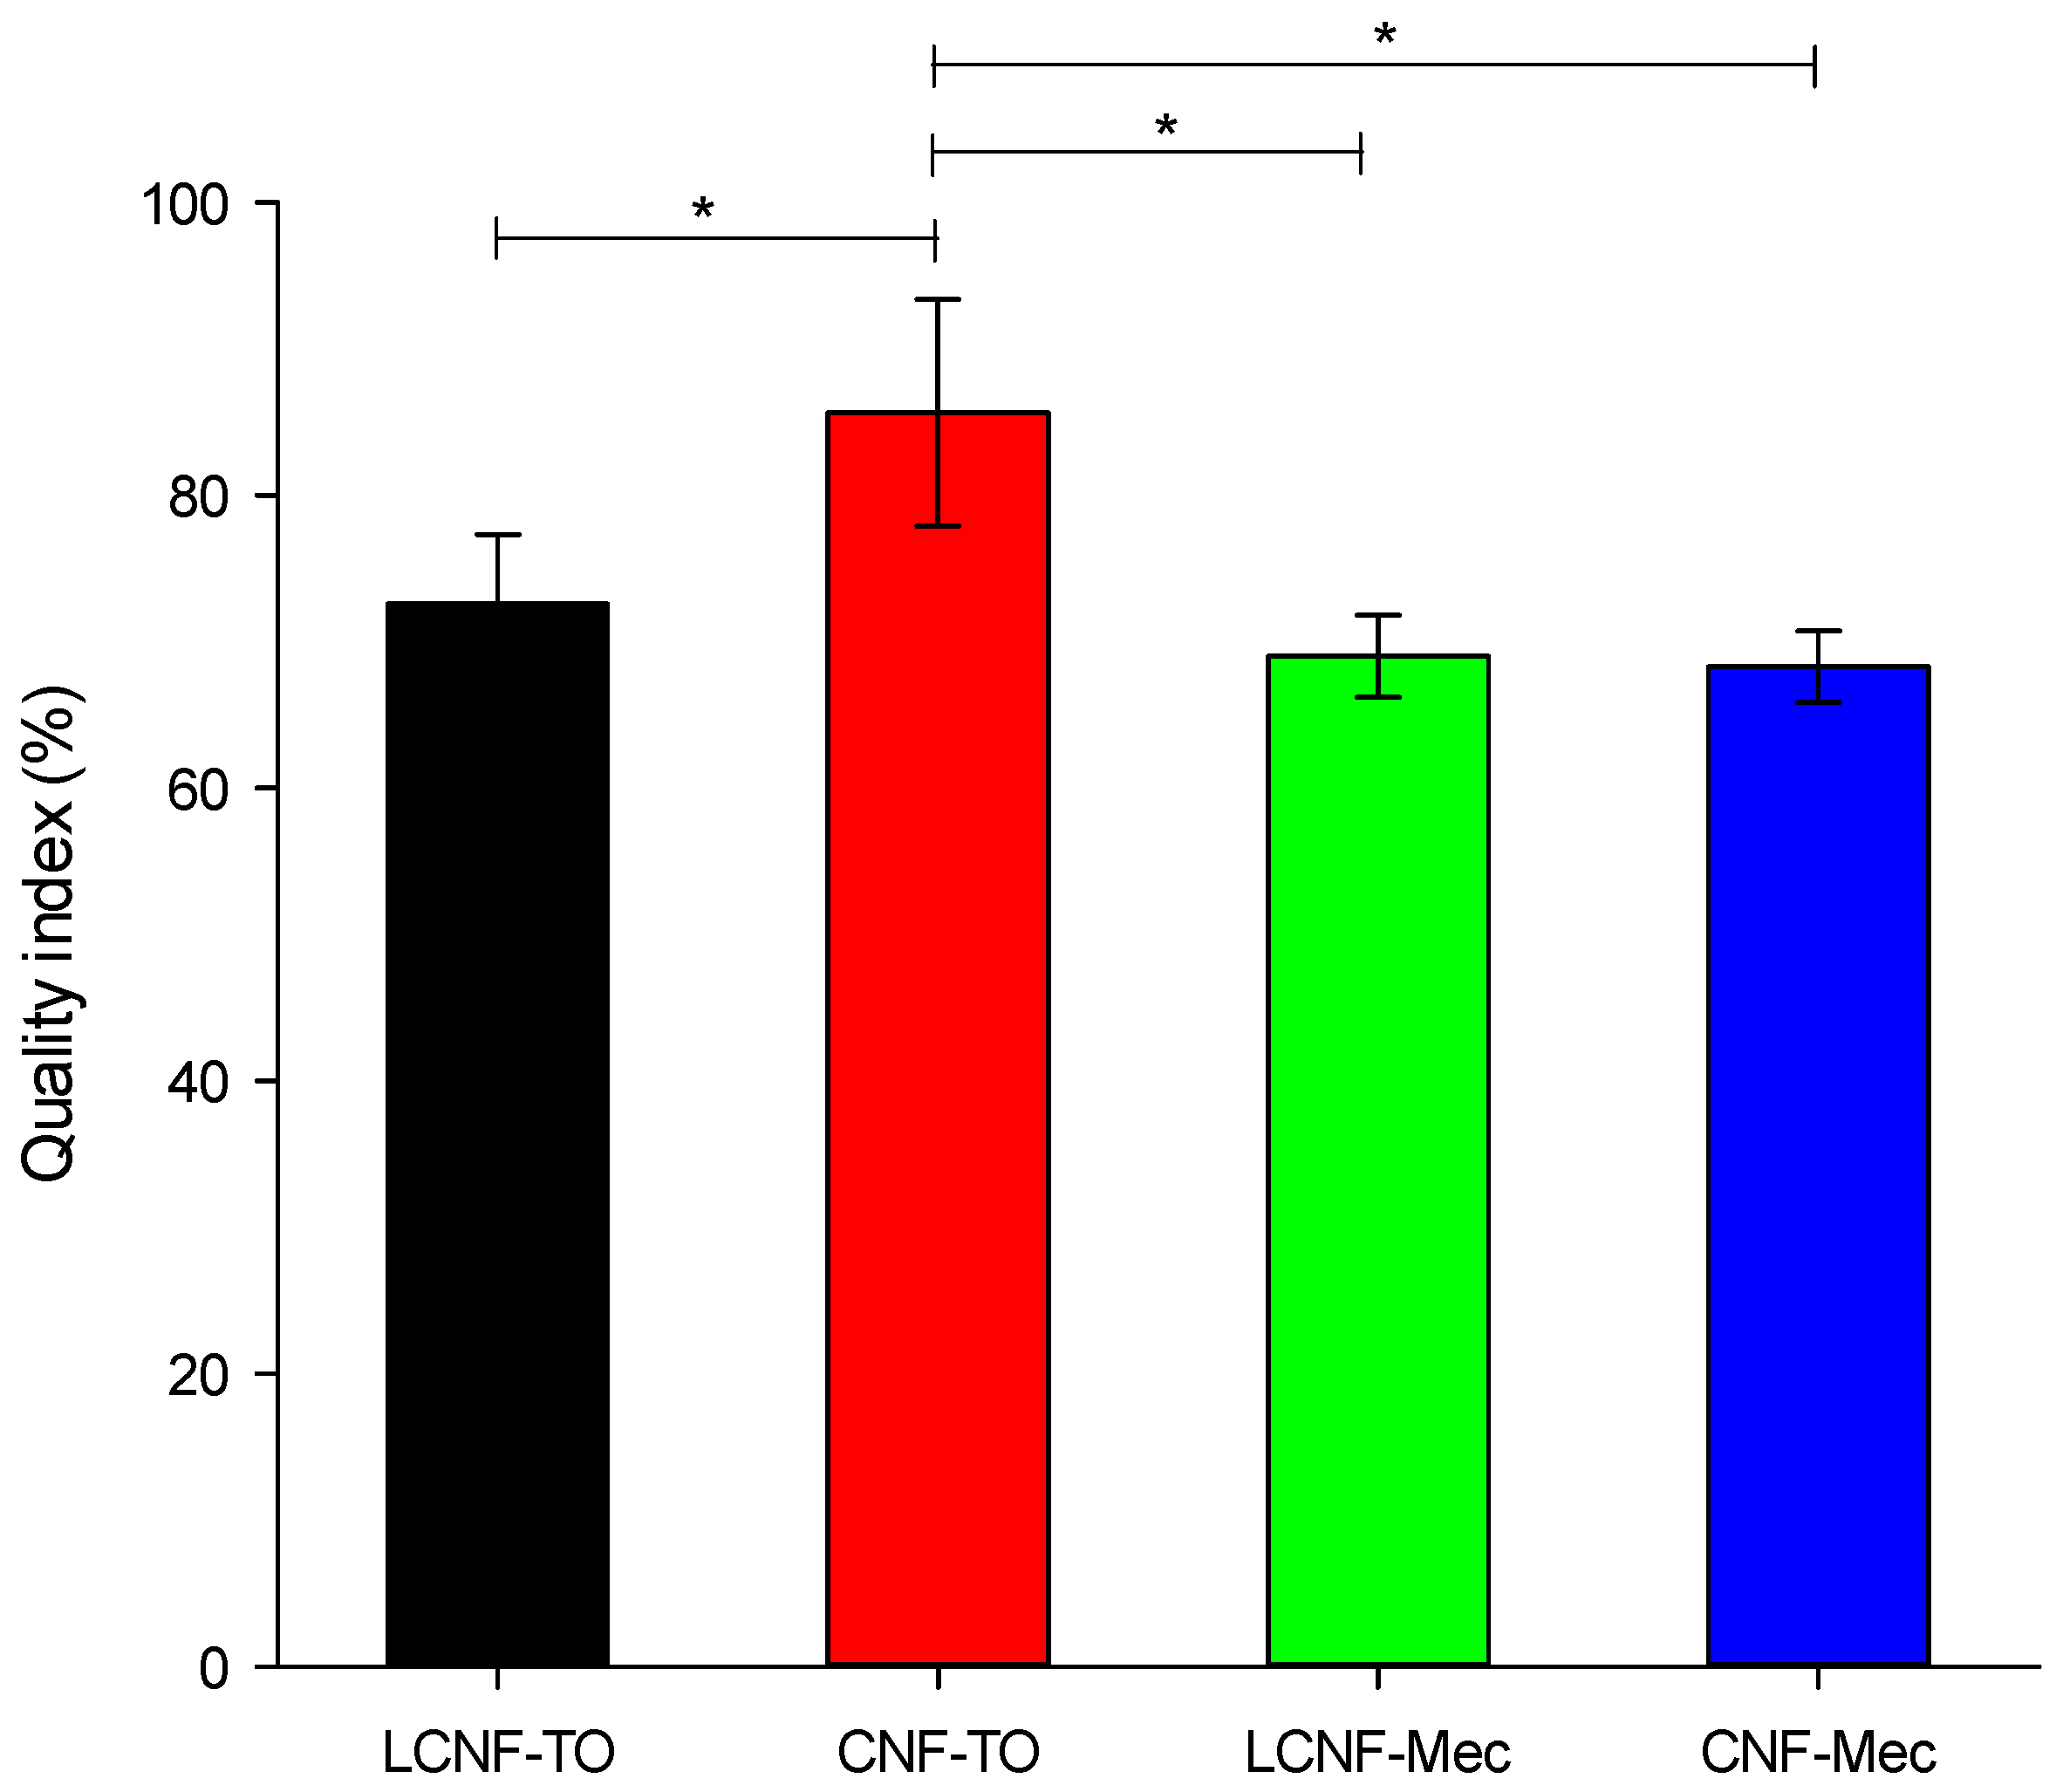
The comparison between the different (L)CNFs was made based on their quality index (QI), as proposed by Desmaisons et al. (2017) [
28], which considers four characterization parameters. Once they are obtained, the calculation of the QI is made according to Equation (5) as follows:
where x
1 is the nano-size fraction (%), x
2 is the turbidity (NTU), x
3 is the Young’s Modulus (GPa), and x
4 is the macro-size (μm
2).
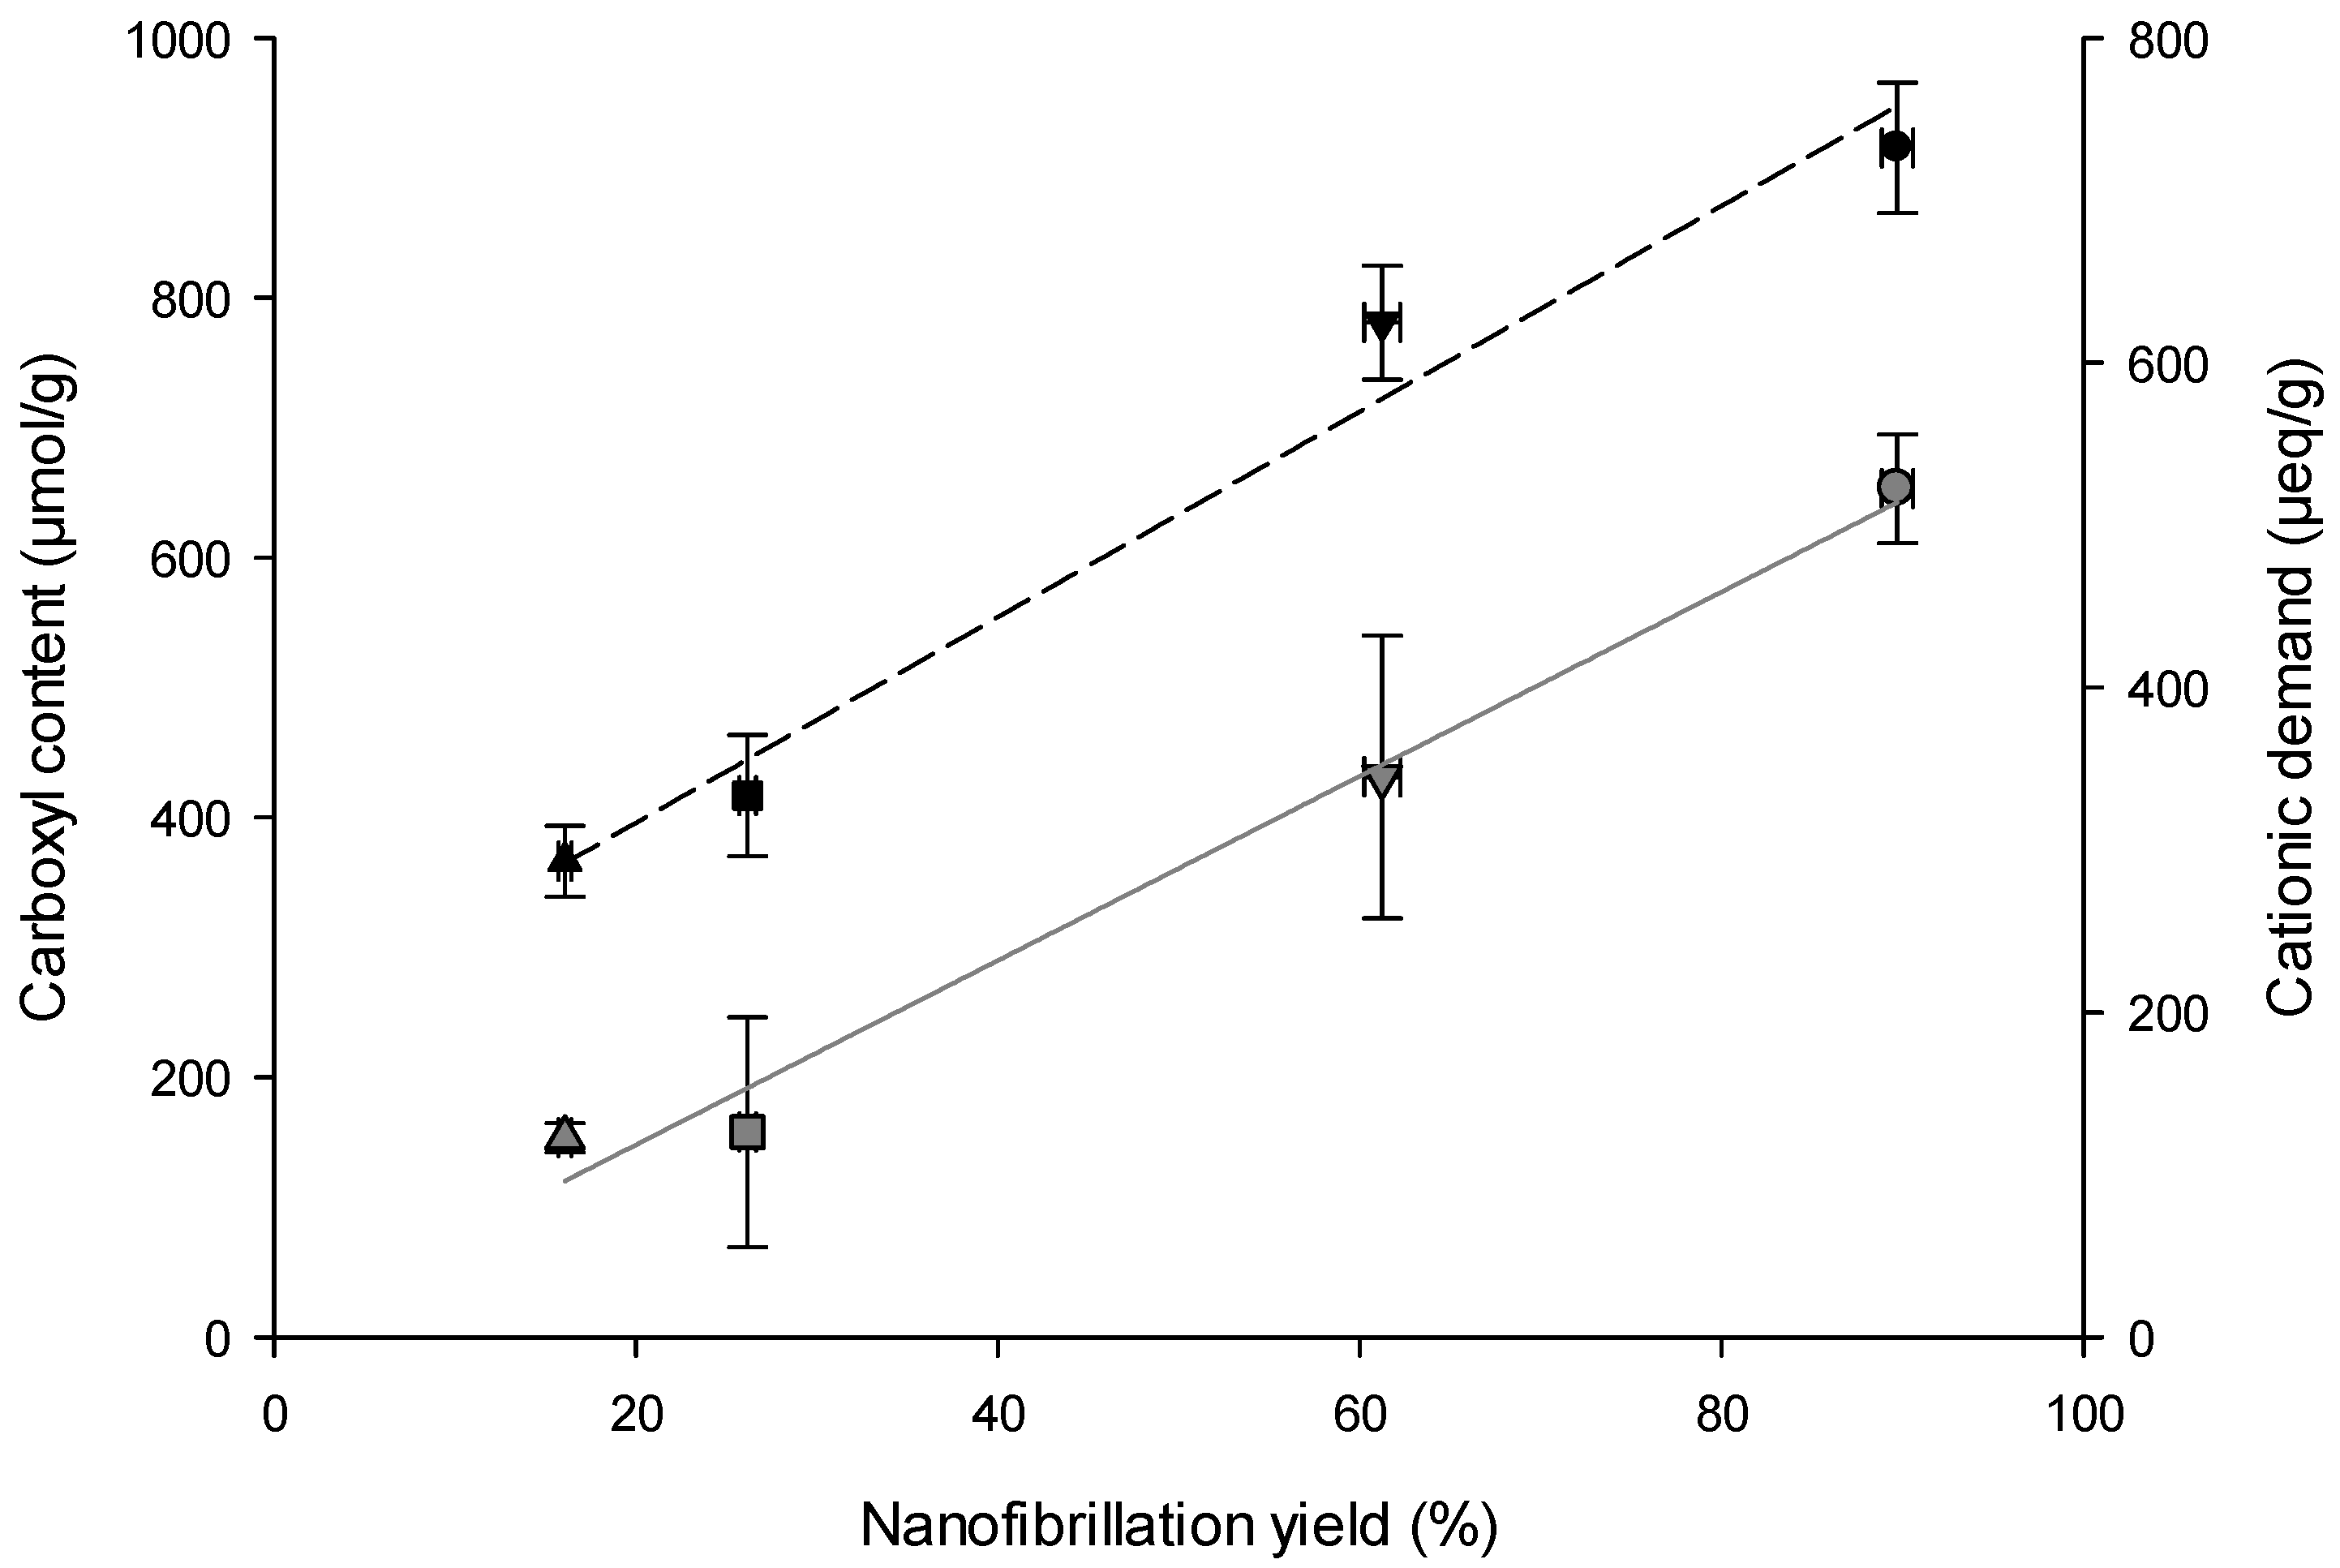
The nanofibrillation yield and nano-sized fraction of (L)CNF suspensions on dry matter consists of the determination of the nanoscale particle fraction in the suspension gravimetrically, according to the protocol described by Besbes et al. [
71] and Naderi et al. [
87].
The turbidity of the (L)CNF suspensions was previously diluted to 0.1 wt%DM and stirred for 10 min with T-25 Ultra Turrax device (IKA® -Werke GmbH & Co. KG, Staufen, Germany) equipped with an S18N-19 G rotor and was measured with a portable turbidimeter (TN/3025 model, LabProcess, Barcelona, Spain). Three measurements were performed for each suspension and the results were expressed as the average with the sum of NTU (nephelometric turbidity units).
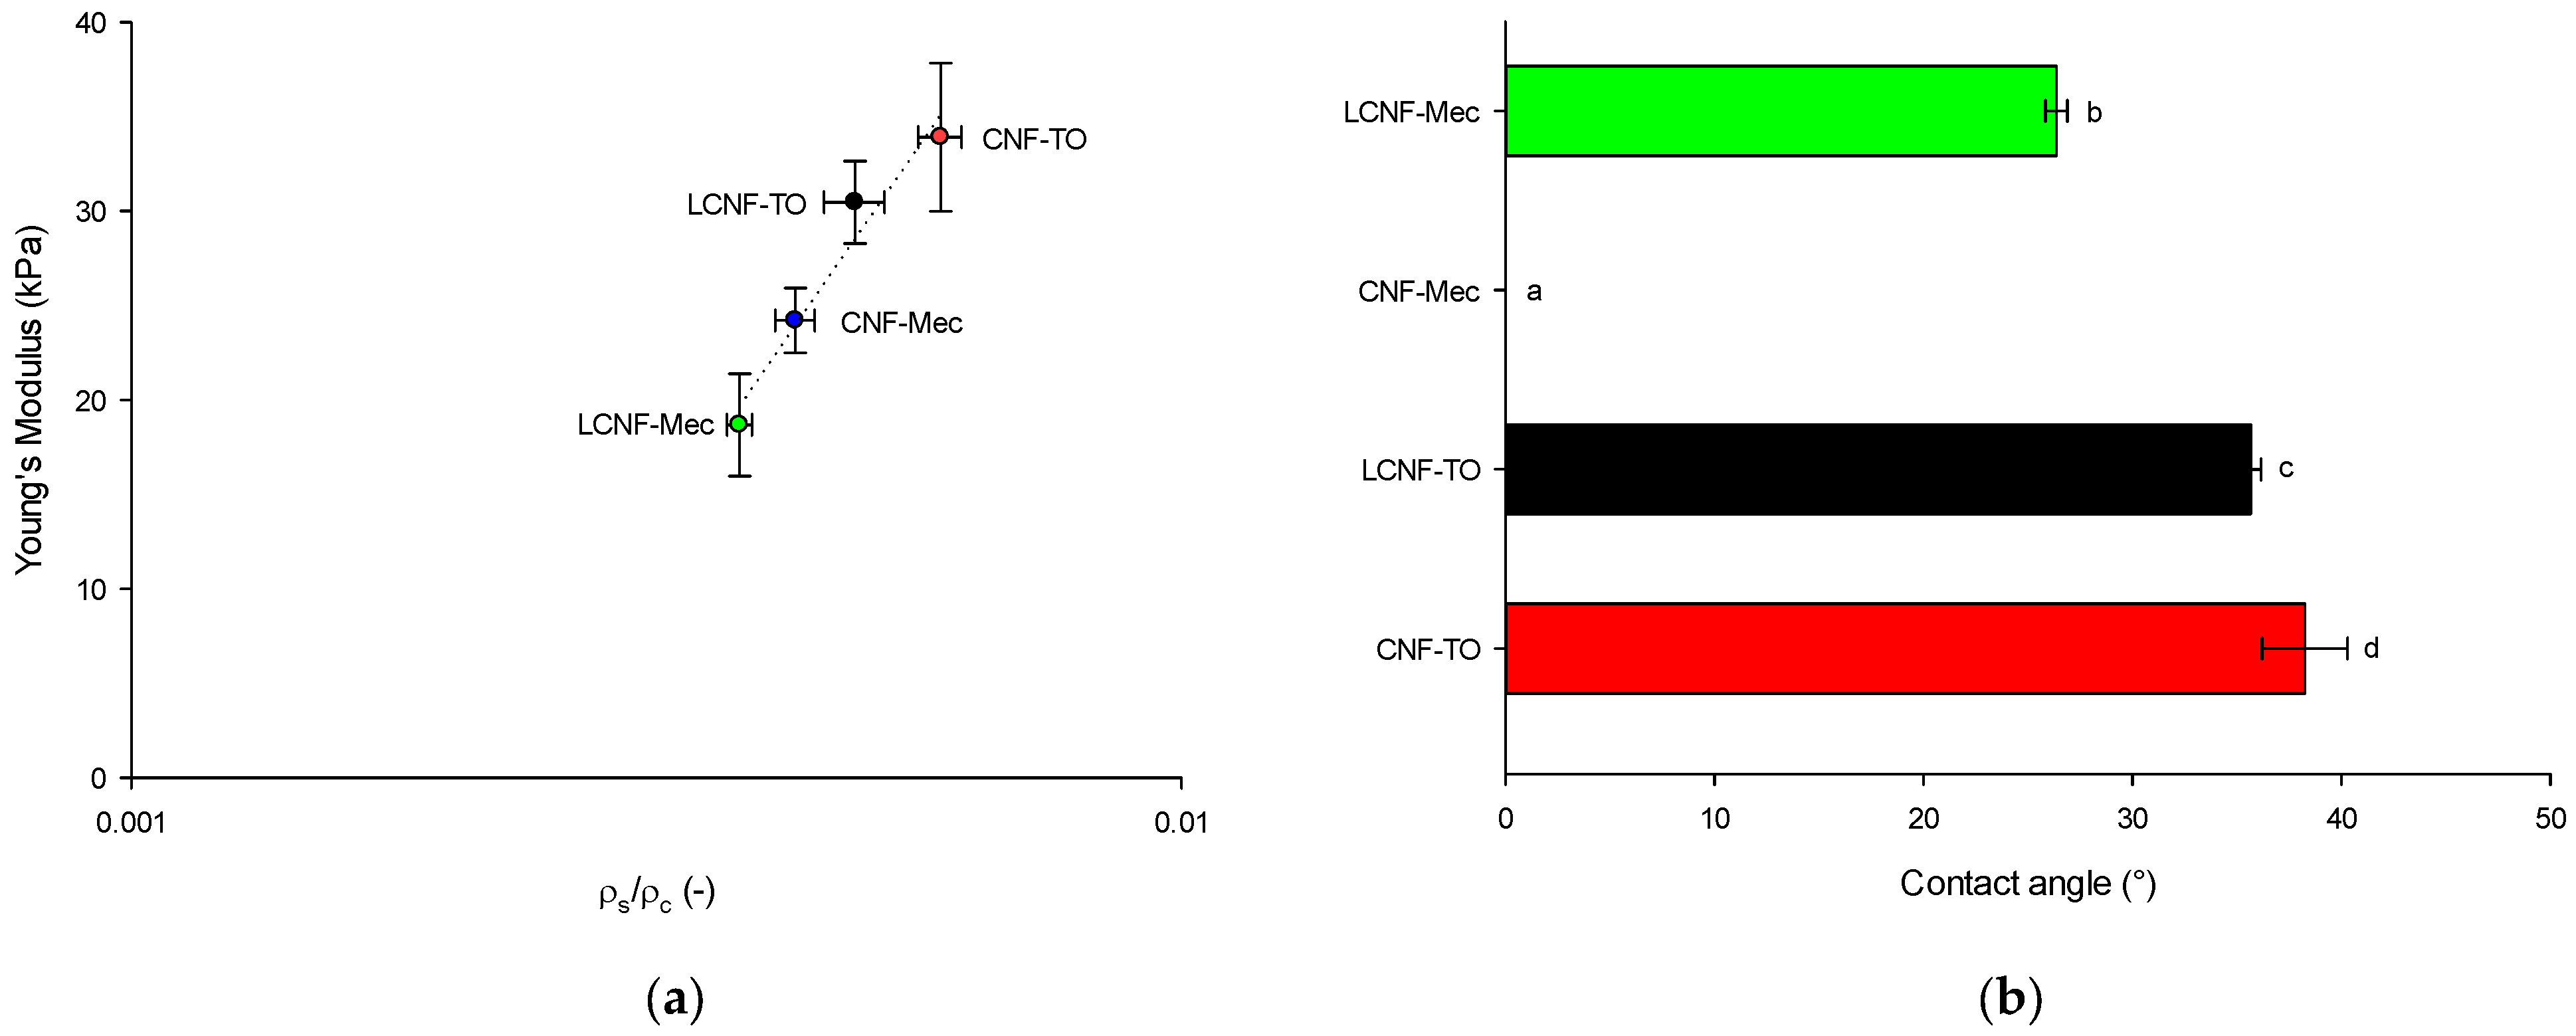
Young’s modulus of (L)CNFs was calculated from the stress–strain curves resulting from tensile tests performed on rectangular nanopapers samples (10 cm length and 15 mm width) using Lloyd LF Plus Tensile Test Machine (Lloyd Instruments Ltd., Bognor Regis, UK) equipped with a 1 kN load cell. The tests were conducted with initial gauge length of 10 cm and crosshead speed of 10 mm/min, following the standard NF Q03-004. All measurements were carried out at room temperature, and the results are presented as the mean value ± standard deviation based on nine repetitions. The nanopapers were prepared using the following procedure. (L)CNFs’ suspension was first dispersed in a pulp disintegrator to achieve a final concentration of 0.5 wt%DM. The suspension was then subjected to vacuum filtration at –600 mbar using a sheet former (Rapid Kothen, ISO 5269-2). Subsequently, the resulting sheet was dried at 85 °C between two nylon sieves and two cardboards (to prevent adherence) until nanopapers were completely dried. All nanopapers were then stored for 48 h in a conditioned room at 24 °C and 50% RH until future characterizations.
Optical images were collected using an optical microscope (Nikon Eclipse TE 2000S, Nikon instruments Europe B.V., Amsterdam, The Netherlands) coupled to a DS Camera Control Unit (DS-5M-L1, Nikon Instruments Europe B.V, Amsterdam, The Netherlands) to acquire and analyze images.
In addition to the QI, some other important parameters during (L)CNFs’ production were determined. The carboxyl content was determined using conductimetric titration [
71,
88]. The pH of (L)CNFs’ suspensions at 0.25 wt%
DM was adjusted at 2.7 using HCl solution (0.1 M) to replace the sodium cations bound to the carboxyl groups by hydrogen ions. The obtained suspension was titrated with 0.1 M NaOH. The presence of a strong and a weak acid in the titration curves corresponds to the excess of HCl and the carboxylate content, respectively. The average amount of –COOH groups was calculated using Equation (6) as follows:
where C
COOH is the mmol of carboxyl content; V
2 and V
1 are the equivalent volumes of added NaOH solution; C
NaOH is the concentration of NaOH solution; g
CNFs is the weight of CNFs on dry basis.
The cationic demand was determined using a particle charge detector Mütek PCD 05 (BTG Instruments, Säffle, Sweden) following the methodology described by Espinosa et al. and Carrasco et al. [
60,
89]. Briefly, 15 mL of CNFs’ suspension at 0.2 wt%
DM was mixed with 25 mL of cationic polymer polydiallyldimethylammonium chloride (polyDADMAC 0.001 N) for 5 min with magnetic stirring. The supernatant recovered after centrifugation for 90 min at 4000 rpm was putted in the Mütek equipment, and anionic polymer (Pes-Na) was then added to the sample dropwise until the equipment reached the value of 0 mV. The volume of anionic polymer consumed was used to calculate the cationic demand using Equation (7) as follows:
where CD is the cationic demand; V
i is the volumes of polymer used; C
i is the concentration of polymer; g
CNFs is the weight of CNFs on dry basis.
The ζ-potential was measured by dynamic light scattering (DLS) and electrophoretic mobility using a Zetasizer (ZSP, Malvern Instruments Ltd., Worcestershire, UK) at 25 °C. The (L)CNFs’ suspensions previously diluted to 0.1 wt%DM with deionized water were stirred for 30 s with T-25 Ultra Turrax device (IKA® -Werke GmbH & Co. KG, Staufen, Germany) equipped with an S18N-19 G rotor. The analysis was realized in triplicate and the average value with standard deviation was calculated.
The effect of the chemical and mechanical treatments used on chemistry structure of (L)CNFs was examined by FT-IR spectra on (L)CNFs previously dried in an air oven at 60 °C for 24 h, following the previously described methodology.
X-ray spectra of (L)CNFs were acquired using a Bruker D8 Discover equipped with a monochromatic Cu Kα1 source over an angular range of 7–50° at a scan speed of 1.56°/min. The crystallinity index (CI) was calculated by using Equation (8) [
90] as follows:
where I
200 is the intensity of the 200 peak (I
200 2θ = 22°) and Iam is the intensity minimum between the peaks at 200 and 110 (I
am 2θ = 15°).
The intrinsic viscosity of 0.2 wt%DM of (L)CNFs’ suspensions was determined according to the ISO 5351:2010 standard and the degree of polymerization is related to the intrinsic viscosity (as reported in the previous section).
4.5. (L)CNF-Based Aerogels Preparation and Characterization
(L)CNFs’ suspensions at 0.5 wt%DM were frozen for 24 h and then freeze dried at –85 °C under 0.5 mBar for 72 h in a Lyoquest -85 lyophilizer (Telstar, Terrassa, Spain).
The porosity, a key property in the formation of aerogels due to its relationship with adsorption capacity [
44], is calculated using the following equation [
40]:
where ρ
S is the apparent density of aerogels and ρ
C is the density of cellulose (considered as 1540 kg/m
3).
The mechanical properties of aerogels (cylinder with 28 mm diameter and 24 mm heigh) were evaluated using Lloyd LF Plus Tensile Test Machine (Lloyd Instruments Ltd., Bognor Regis, UK) equipped with a load cell of 1 kN by compression tests with a strain limit of 80% at a speed of 2 mm/min.
The water contact angle (WCA) was measured in a contact angle goniometer (Ossila Ltd., Sheffield, UK) using the sessile drop method. A 10 µL droplet of deionized water was casted on the surface of the aerogel and the angle was measured from 0 to 10 s. The measurements were replicated 5 times, and the results were expressed as averages ± standard deviation.
4.6. Dye Removal Efficiency of (L)CNF-Based Aerogels
Methylene blue (MB) was employed as typical cationic dye to simulate wastewater. All adsorption tests were performed by immersing the aerogels in 50 mL of 10 mg/L MB aqueous solution. During 24 h of adsorption, the change of dye concentration in the solution was analyzed by UV-vis spectrophotometer (Lambda 25, Perkin Elmer Inc, Waltham, MA, USA) using a calibration curve obtained from the linear fitting (A
664 nm = 0.2075 · C
MB, R
2 = 0.9991) of the measured absorbance (A
664 nm) as a function of MB concentration (ranging from 0 to 10 mg/L). The percentage of dye removal during the adsorption kinetic was calculated using the following relationship:
where C
i and C
t are the initial and after time t concentrations of dye (mg/L), respectively.
The amount of dye adsorbed Q
e (mg/g) onto the aerogel was calculated from the mass balance equation as follows:
where C
e is the equilibrium concentration of dye (mg/L), V is the volume of dye solution (L), and M is the mass of the adsorbent aerogel used (g).
Langmuir isotherm (Equation (12)) is used to describe adsorption equilibrium type and maximum adsorption capacity [
57].
where Q
m is the maximum adsorption capacity (mg/g) and K
L is the Langmuir constant (L/mg).
Furthermore, the separation factor (R
L), calculated as in Equation (13), is used to describe the essential characteristic of Langmuir isotherm: irreversible (R
L = 0); favorable (0 < R
L < 1); linear (R
L = 1); unfavorable (R
L > 1) [
91].
4.7. Statistical Analysis
The experiments were conducted in triplicate, and the results were presented as means ± standard deviation. Significant difference of p < 0.05 was taken in SPSS 20 statistical software (SPSS Inc., Chicago, IL, USA) through a one-way analysis of variance (ANOVA) followed by Tukey’s test.

 ,
, 


