
Effects of Ultrasound-Assisted Extraction on Structure and Rheological Properties of Flaxseed Gum
Abstract
:1. Introduction
2. Results and Discussion
2.1. FG Yield
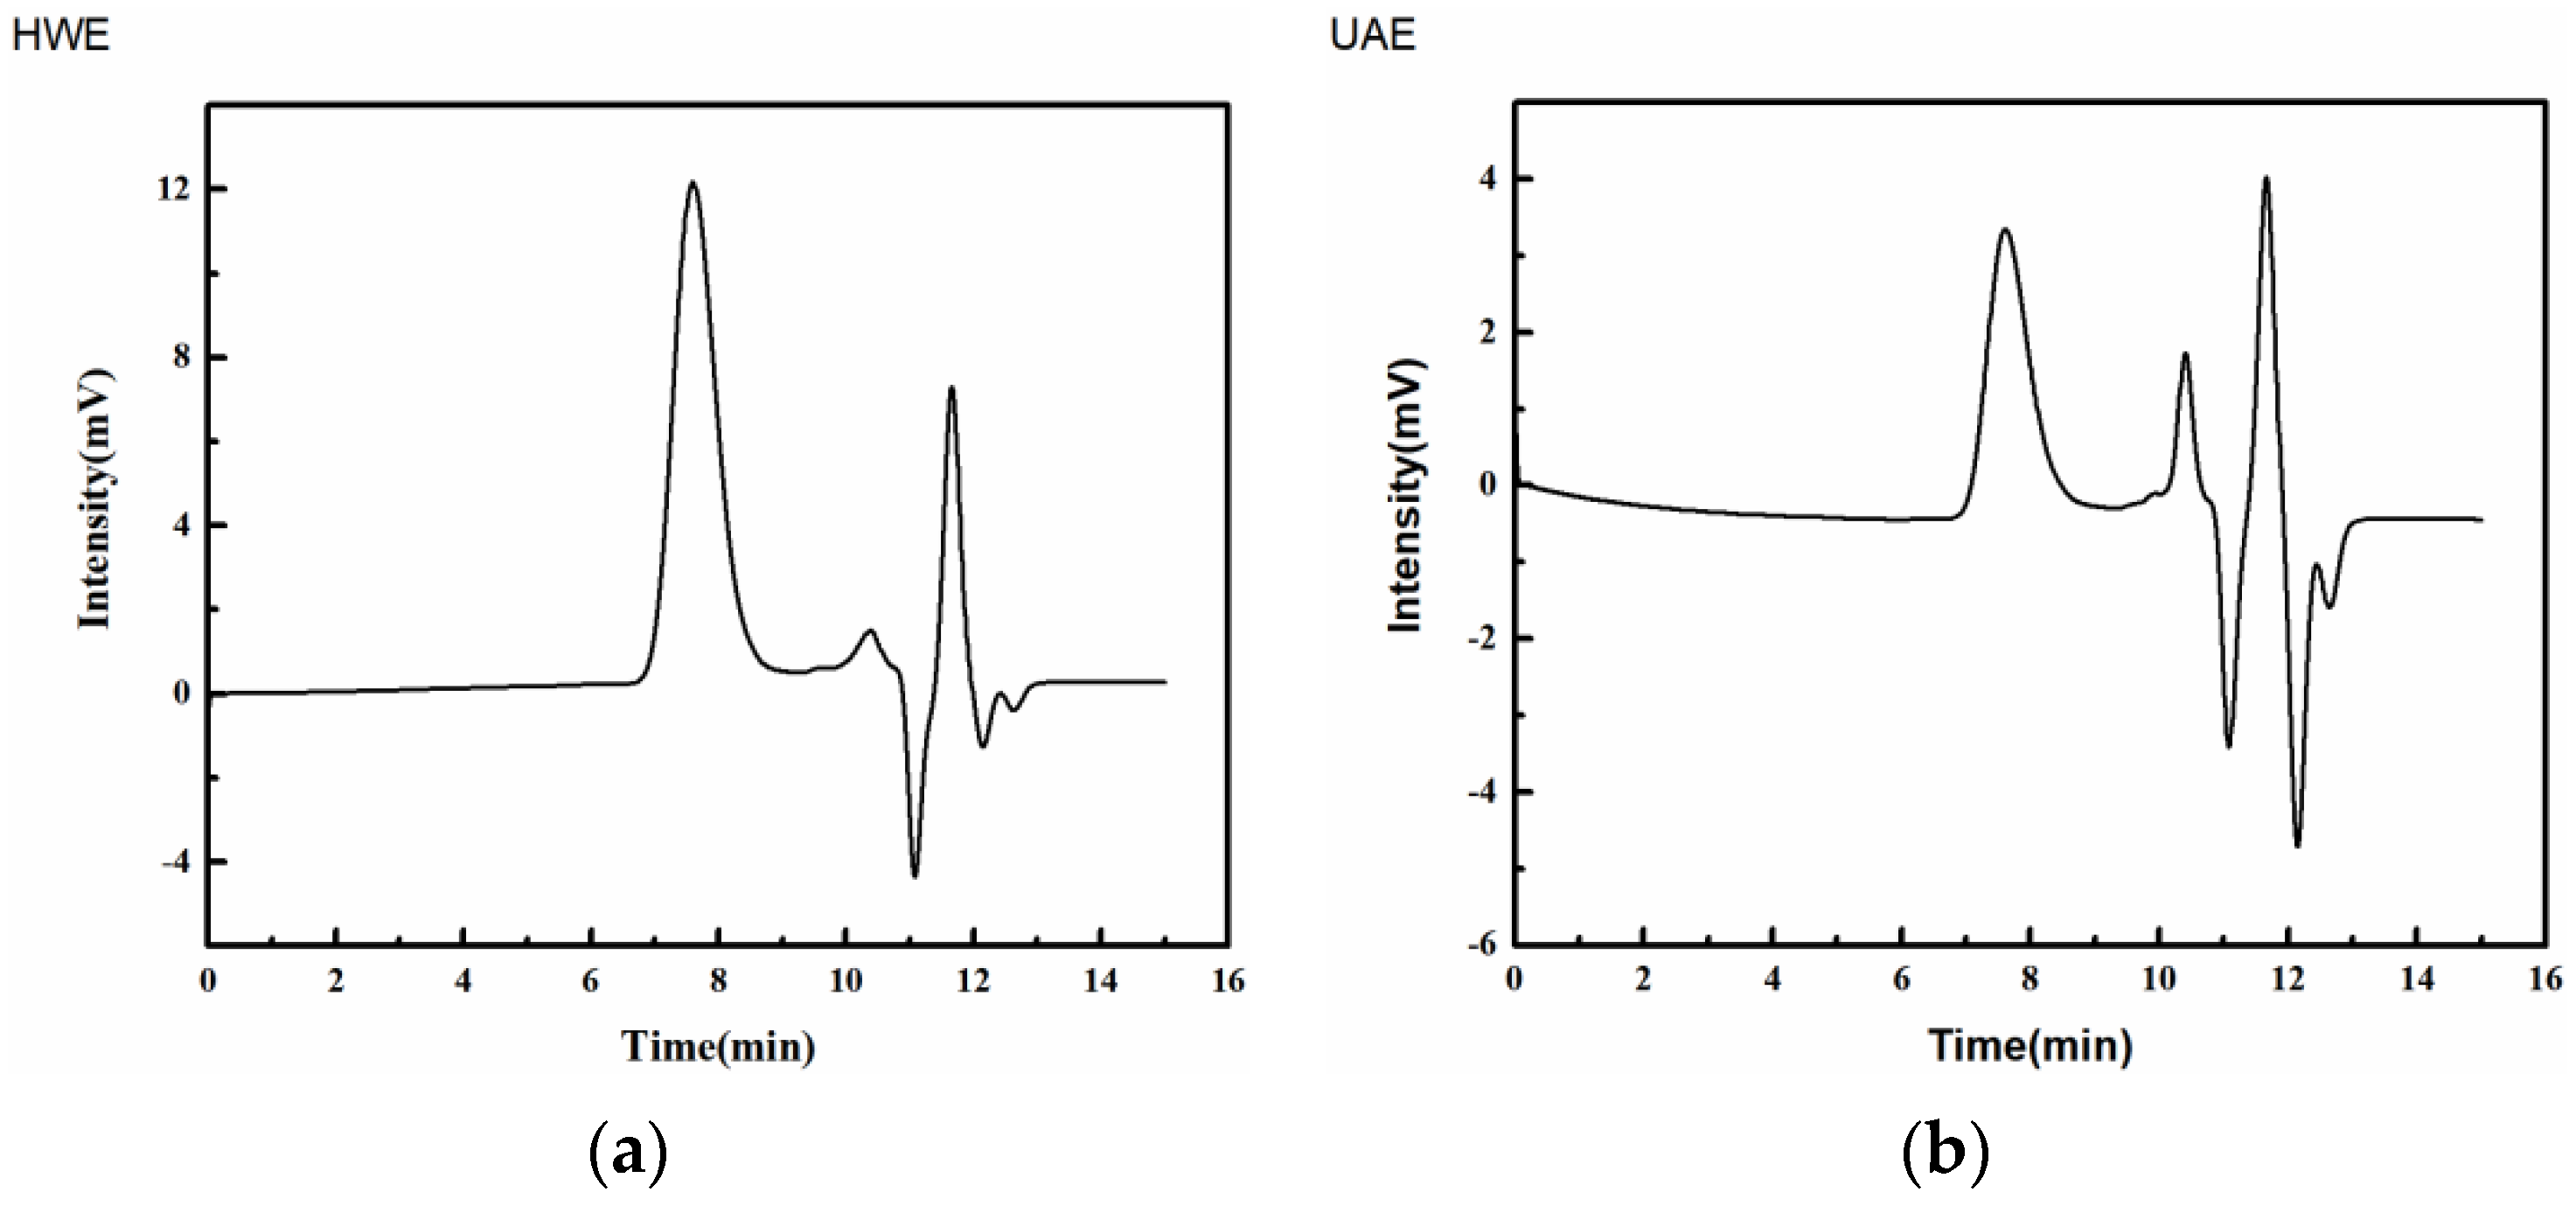
2.2. Molecular Weight Analysis of FG
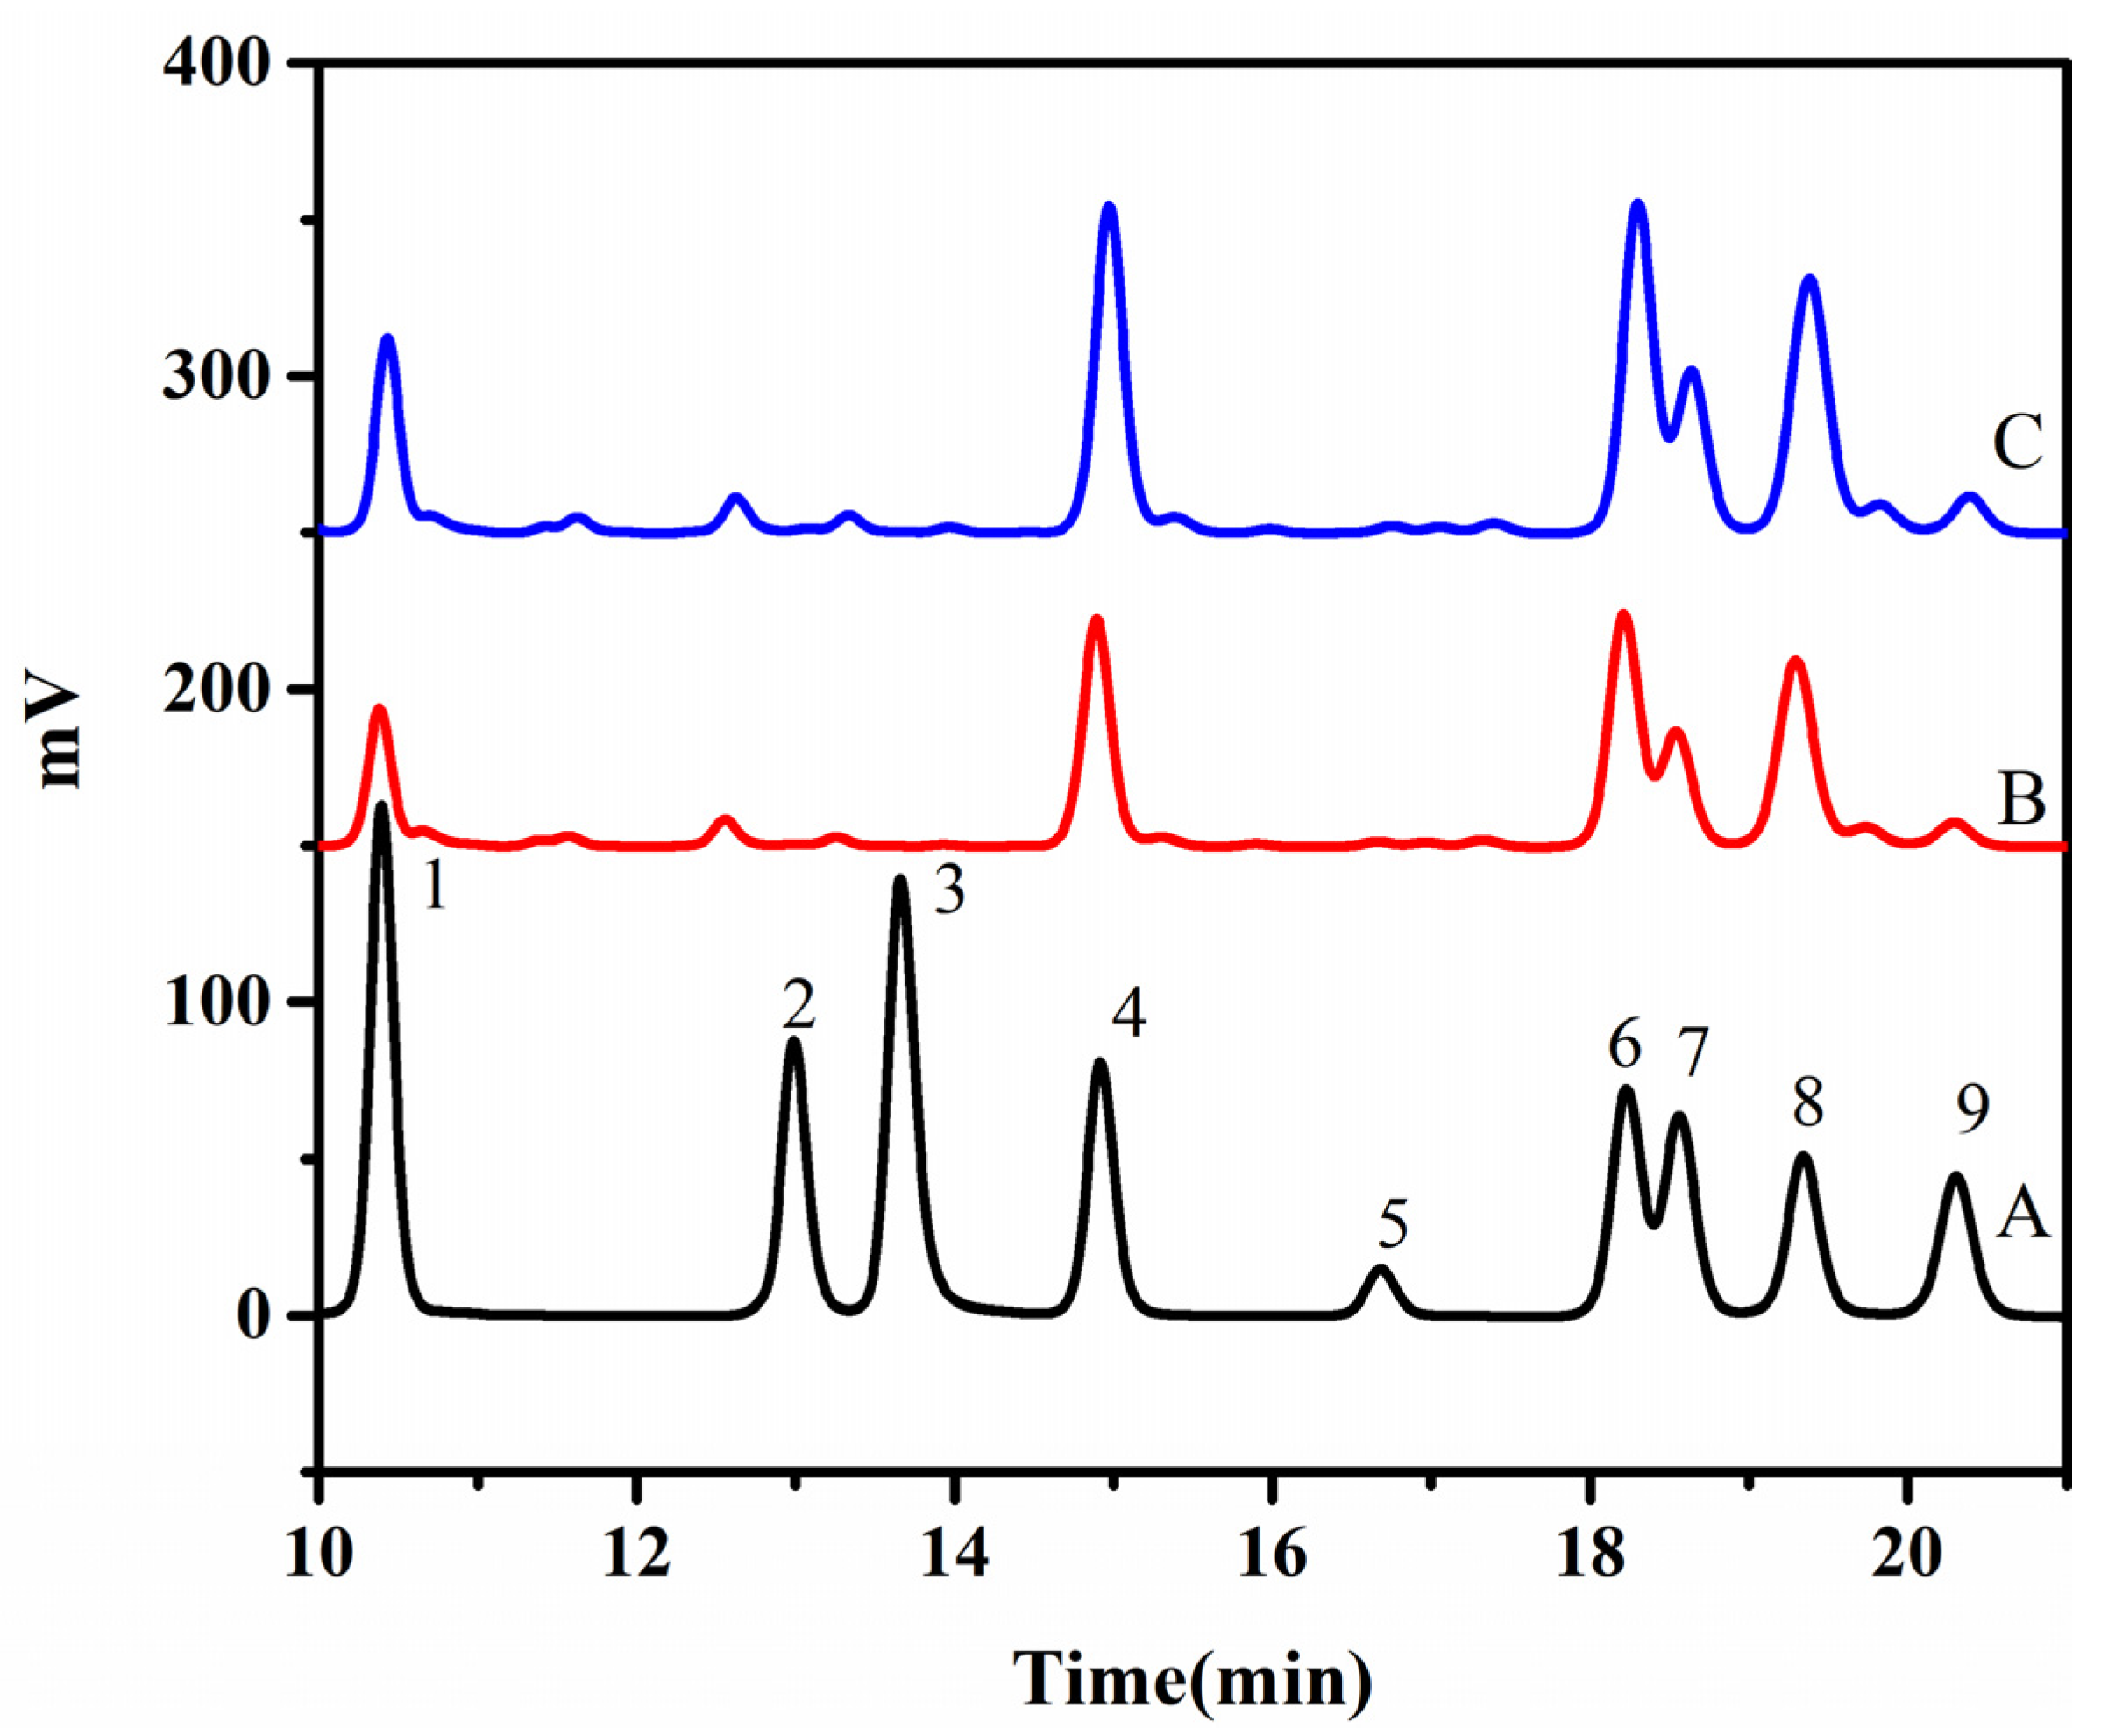
2.3. Analysis of the Monosaccharide Composition
2.4. FT-IR Analysis
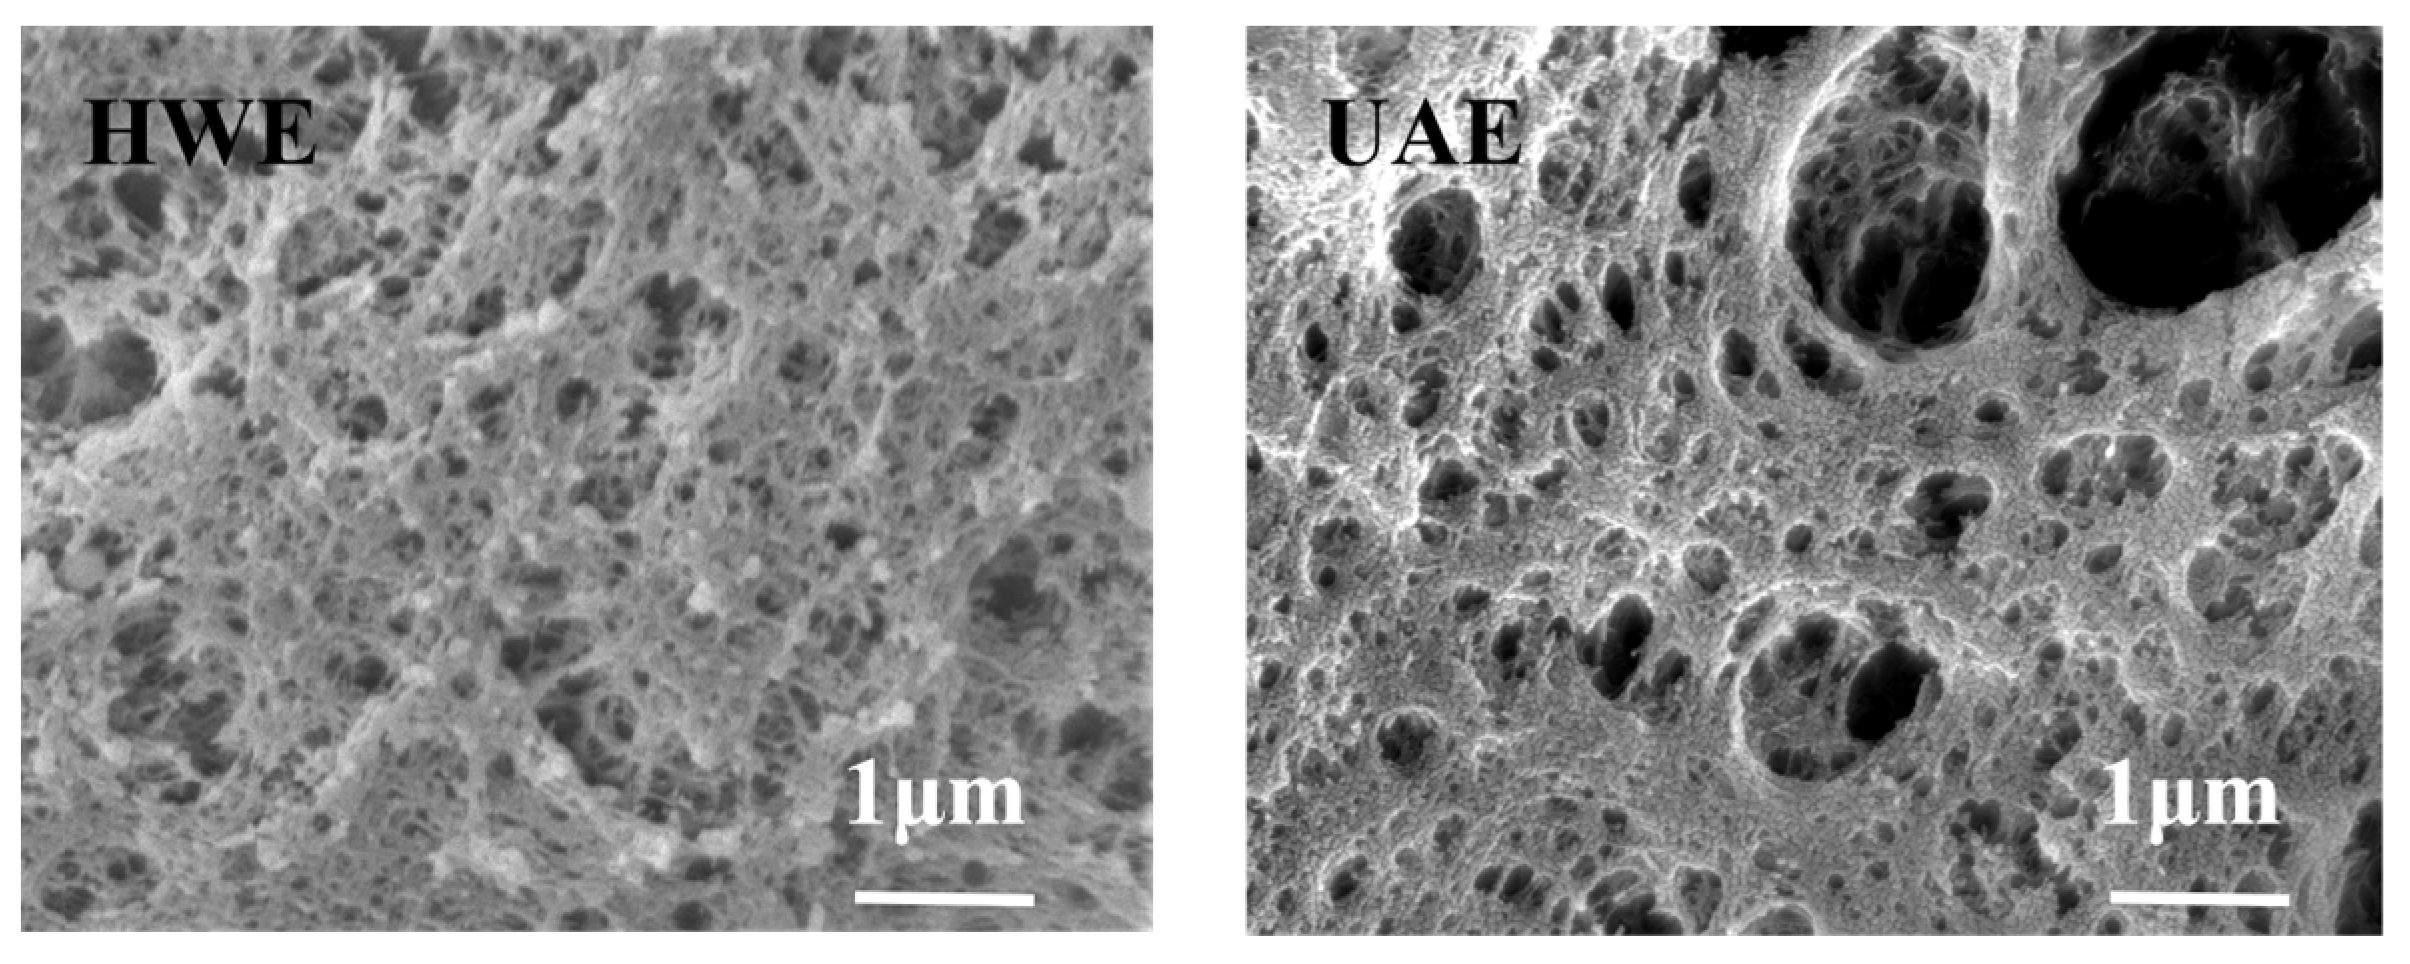
2.5. SEM Analysis
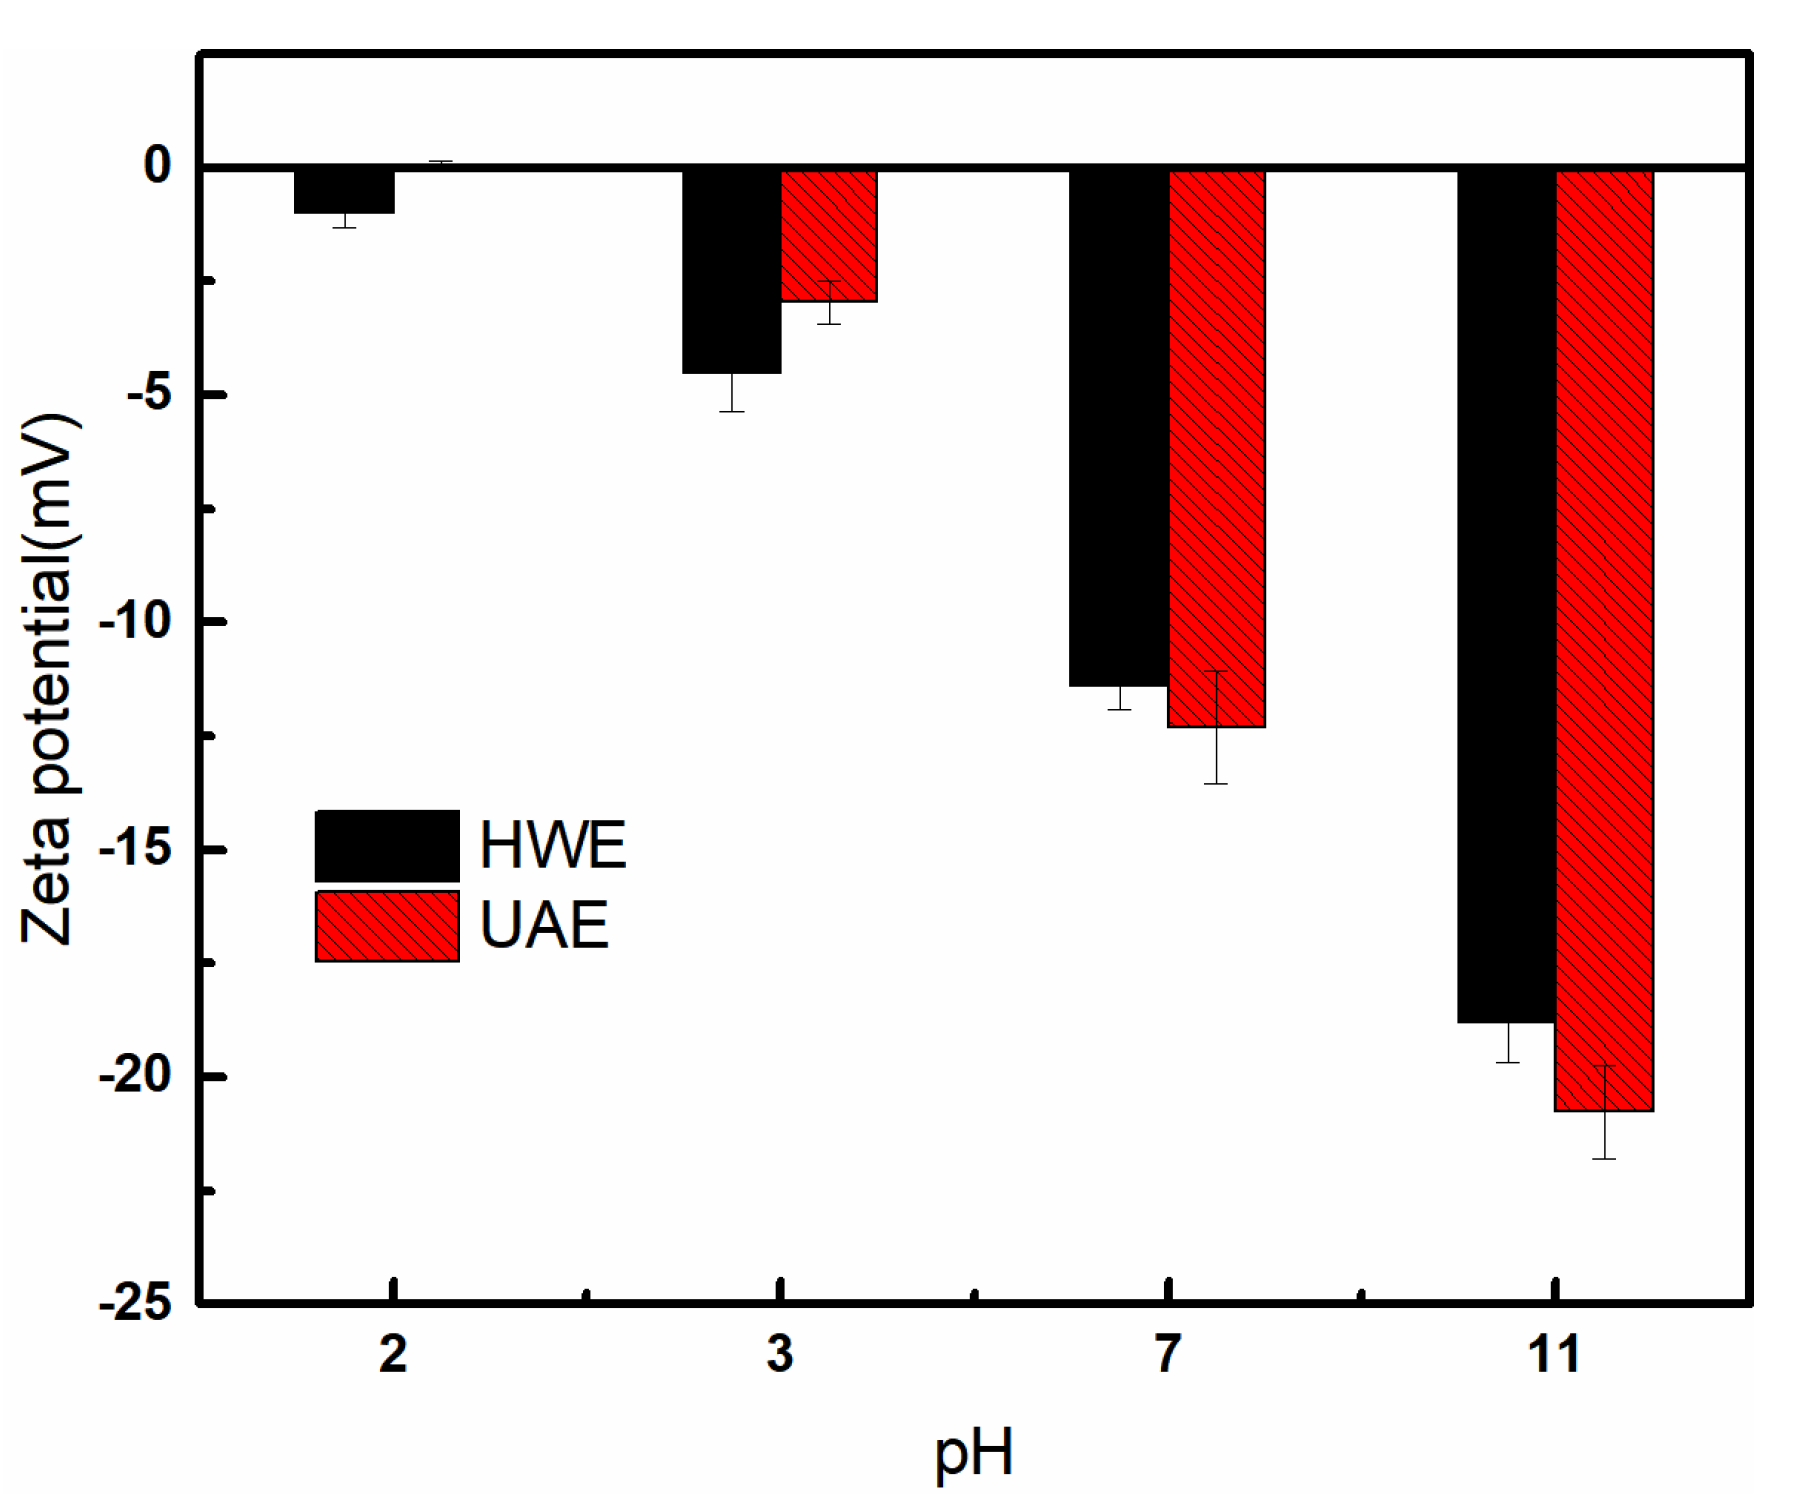
2.6. Zeta Potential Measurements
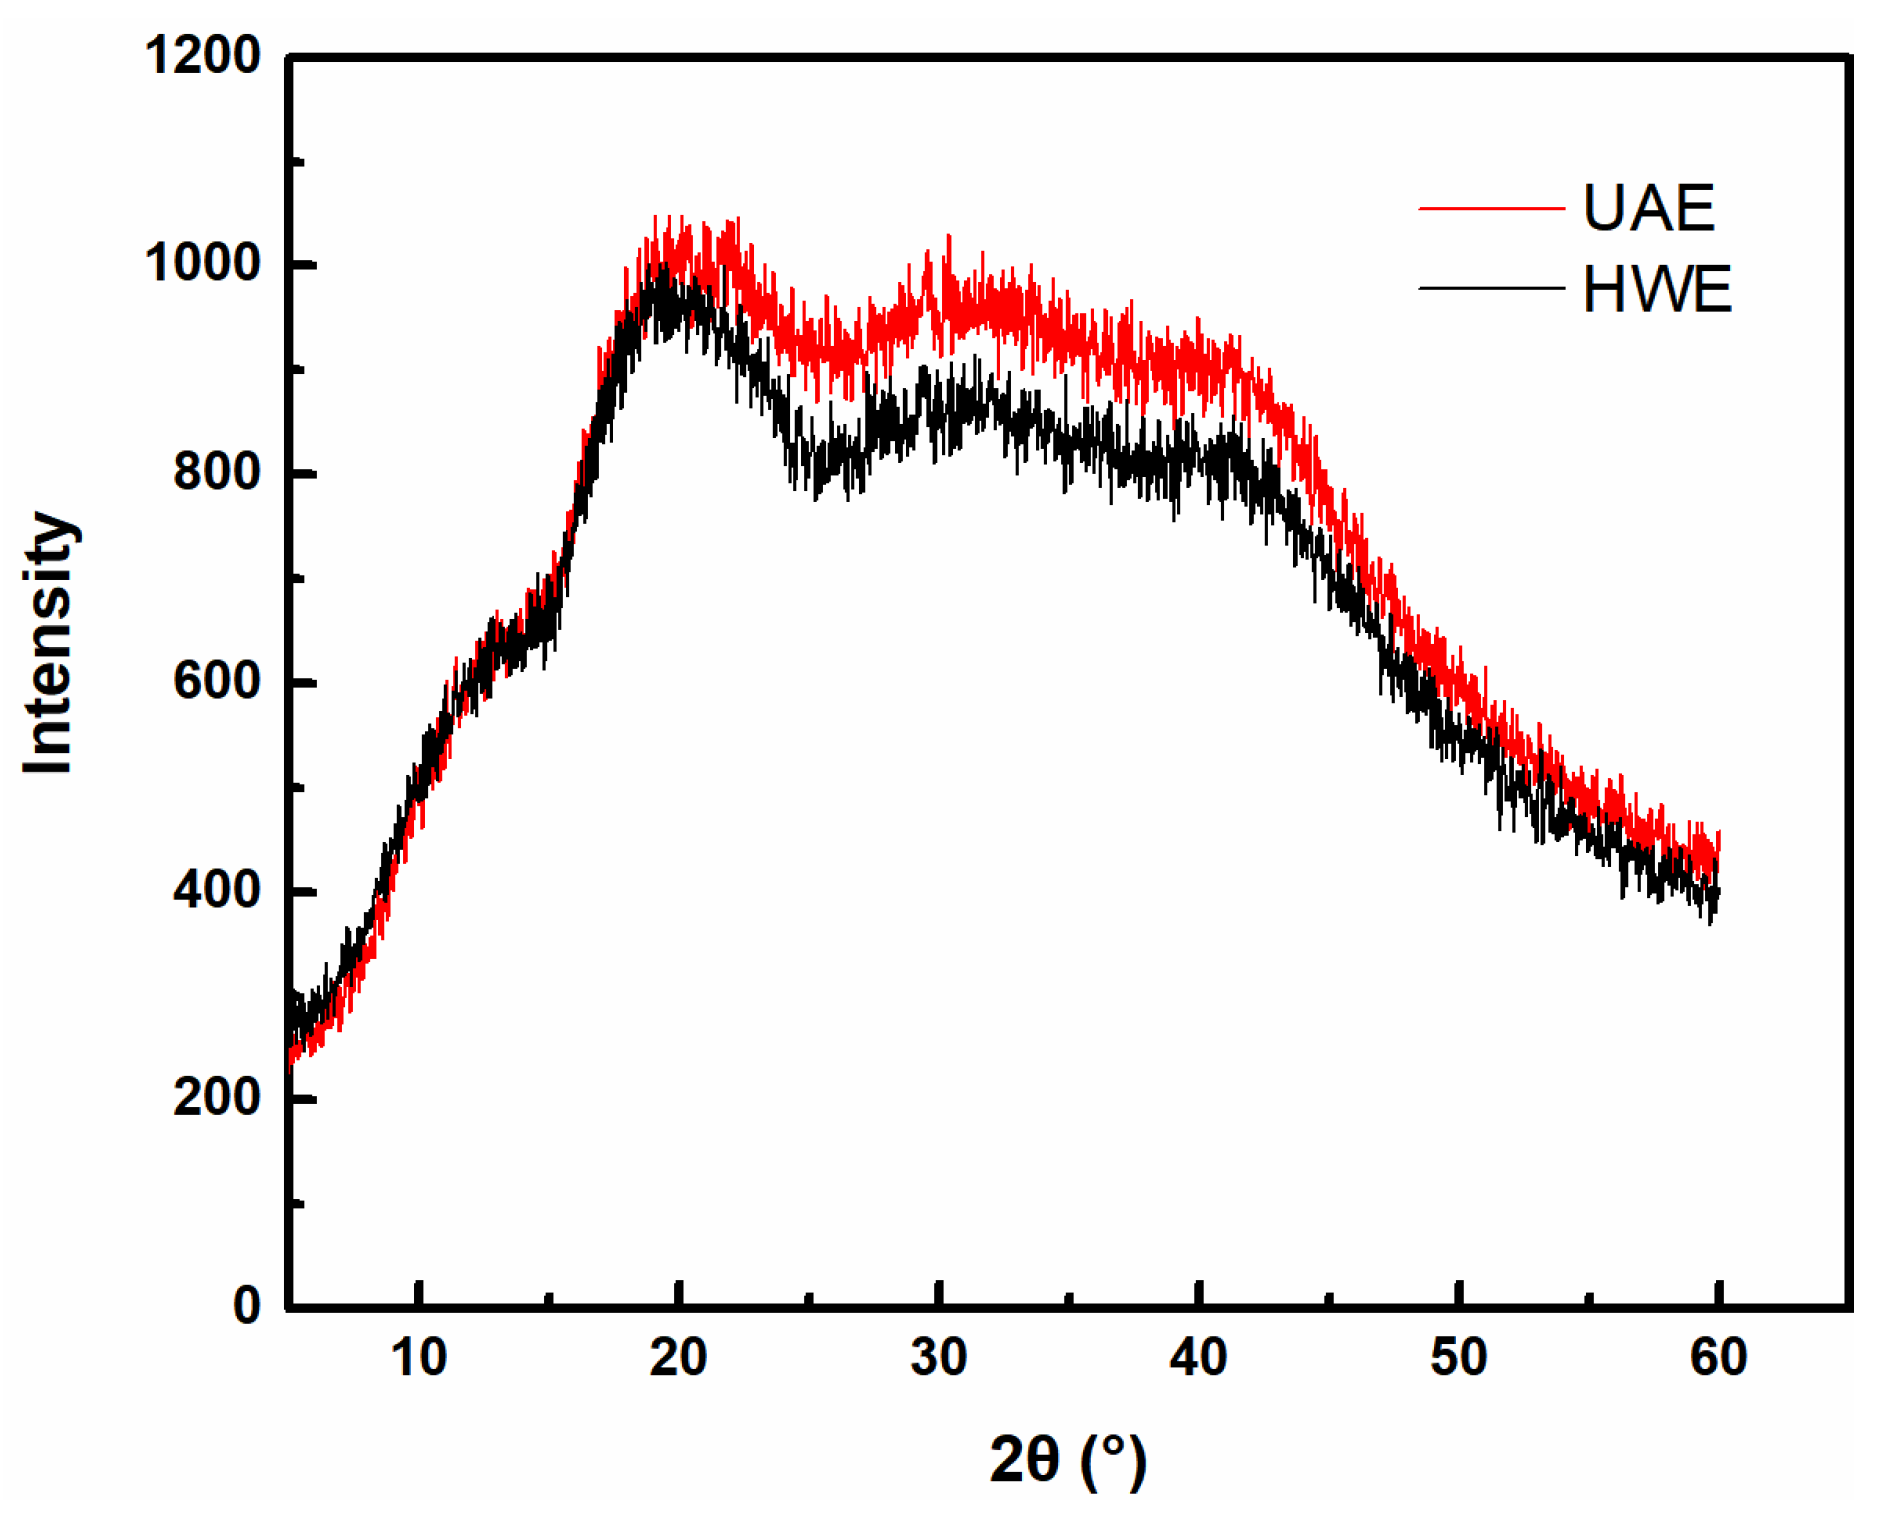
2.7. XRD Analysis
2.8. Analysis of Rheological Properties of FG
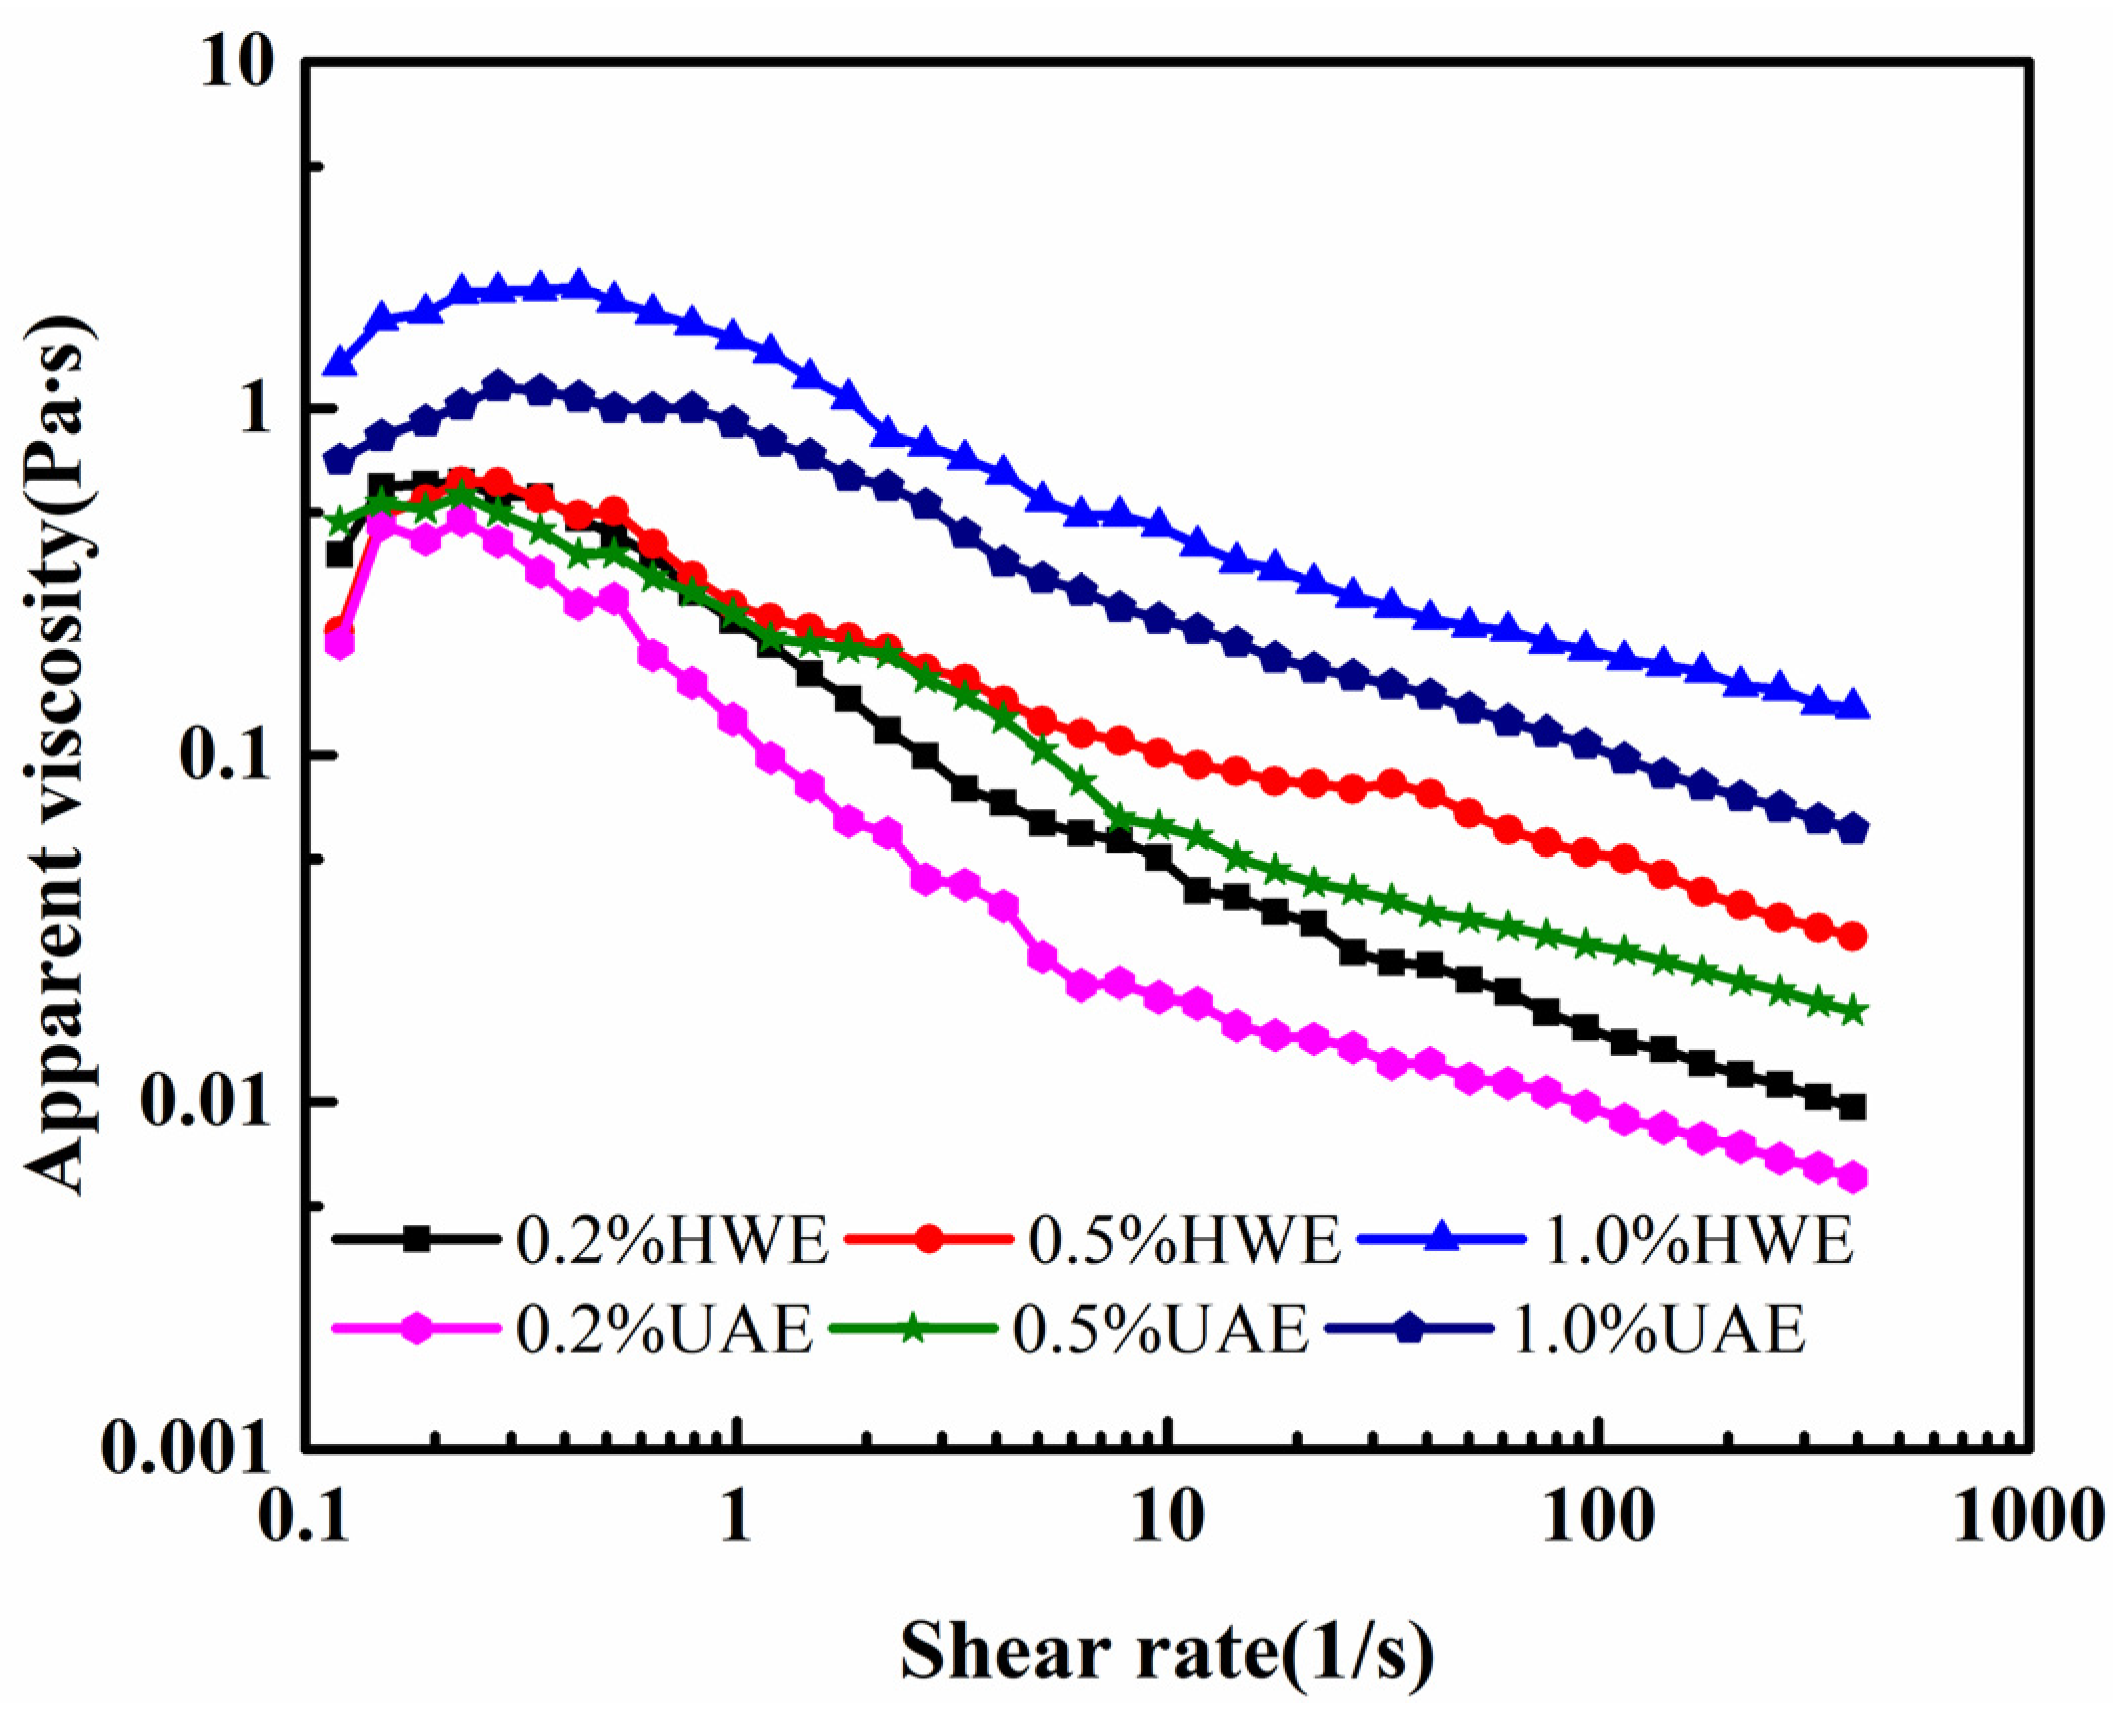
2.8.1. Static Rheological Properties
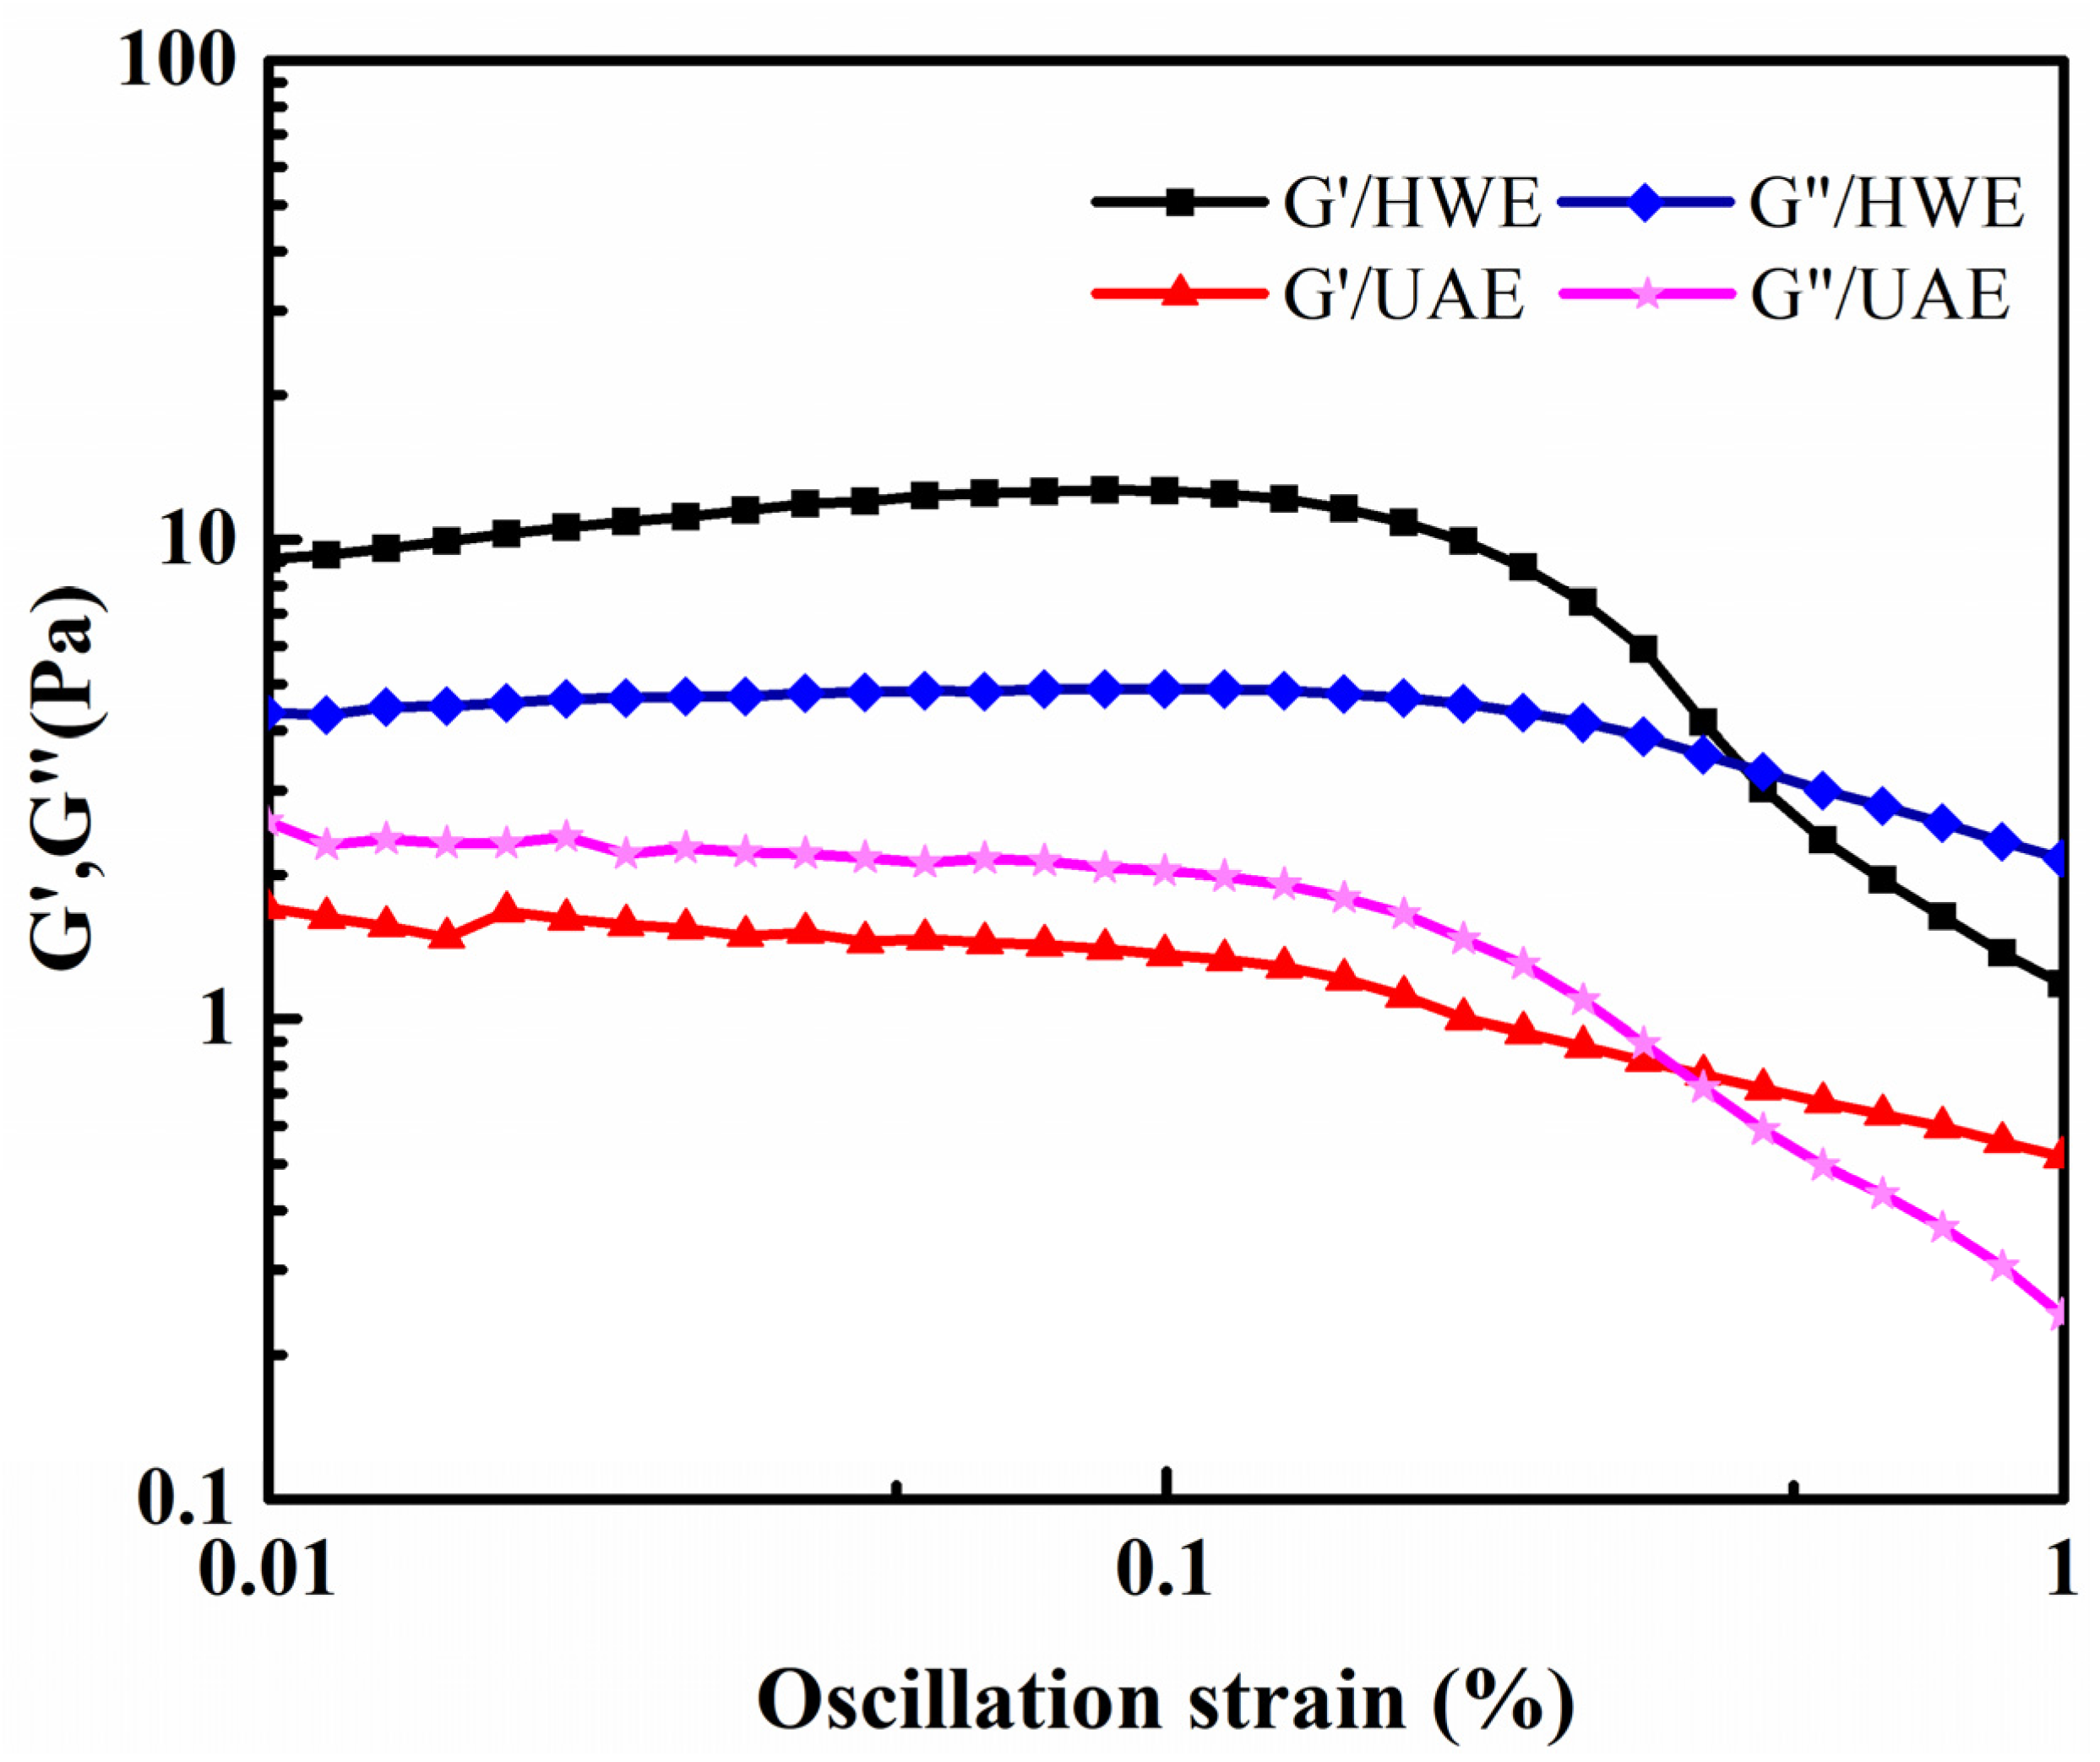
2.8.2. Dynamic Rheological Properties
3. Conclusions
4. Materials and Methods
4.1. Materials
4.2. Preparation of FG Samples
4.3. Determination of FG Yield
4.4. Characterization Tests
4.4.1. Determination of Molecular Weights and Molecular Weight Distributions of FG Samples
4.4.2. Determination of the Monosaccharide Composition
4.4.3. Fourier-Transform Infrared (FT-IR) Spectral Analysis
4.4.4. Scanning Electron Microscopy (SEM) Analysis
4.4.5. Zeta Potential Measurements
4.4.6. X-ray Diffraction (XRD) Analysis
4.4.7. Determination of Rheological Properties
4.5. Statistical Analysis
Author Contributions
Funding
Institutional Review Board Statement
Informed Consent Statement
Data Availability Statement
Conflicts of Interest
References
- Rahimi, G.; Hedayati, S.; Mazloomi, S.M. Studies on functional properties of wheat starch in the presence of Lepidium perfoliatum and Alyssum homolocarpum seed gums. J. Food Sci. 2021, 86, 699–704. [Google Scholar] [CrossRef]
- Beikzadeh, S.; Khezerlou, A.; Jafari, S.M.; Pilevar, Z.; Mortazavian, A.M. Seed mucilages as the functional ingredients for biodegradable films and edible coatings in the food industry. Adv. Colloid Interface Sci. 2020, 280, 102164. [Google Scholar] [CrossRef] [PubMed]
- Thakur, G.; Mitra, A.; Pal, K.; Rousseau, D. Effect of flaxseed gum on reduction of blood glucose and cholesterol in type 2 diabetic patients. Int. J. Food Sci. Nutr. 2009, 60 (Suppl. S6), 126–136. [Google Scholar] [CrossRef] [PubMed]
- Liu, J.; Shim, Y.Y.; Shen, J.; Wang, Y.; Ghosh, S.; Reaney, M.J. Variation of composition and functional properties of gum from six Canadian flaxseed (Linum usitatissimum L.) cultivars. Int. J. Food Sci. Technol. 2016, 51, 2313–2326. [Google Scholar] [CrossRef]
- Chen, H.H.; Xu, S.Y.; Wang, Z. Gelation properties of flaxseed gum. J. Food Eng. 2006, 77, 295–303. [Google Scholar] [CrossRef]
- Safdar, B.; Pang, Z.; Liu, X.; Jatoi, M.A.; Mehmood, A.; Rashid, M.T.; Ali, N.; Naveed, M. Flaxseed gum: Extraction, bioactive composition, structural characterization, and its potential antioxidant activity. J. Food Biochem. 2020, 44, e13134. [Google Scholar] [CrossRef] [Green Version]
- Chen, S.; Wu, M.; Lu, P.; Gao, L.; Yan, S.; Wang, S. Development of pH indicator and antimicrobial cellulose nanofibre packaging film based on purple sweet potato anthocyanin and oregano essential oil. Int. J. Biol. Macromol. 2020, 149, 271–280. [Google Scholar] [CrossRef]
- Thirugnanasambandham, K.; Sivakumar, V.; Maran, J.P. Microwave-assisted extraction of polysaccharides from mulberry leaves. Int. J. Biol. Macromol. 2020, 72, 1–5. [Google Scholar] [CrossRef]
- Maran, J.P.; Manikandan, S.; Thirugnanasambandham, K.; Nivetha, C.V.; Dinesh, R. Box–Behnken design based statistical modeling for ultrasound-assisted extraction of corn silk polysaccharide. Carbohydr. Polym. 2013, 92, 604–611. [Google Scholar] [CrossRef]
- Chen, S.; Chen, H.; Tian, J.; Wang, J.; Wang, Y.; Xing, L. Enzymolysis-ultrasonic assisted extraction, chemical characteristics and bioactivities of polysaccharides from corn silk. Carbohydr. Polym. 2014, 101, 332–341. [Google Scholar] [CrossRef]
- Xu, Y.; Cai, F.; Yu, Z.; Zhang, L.; Li, X.; Yang, Y.; Liu, G. Optimisation of pressurised water extraction of polysaccharides from blackcurrant and its antioxidant activity. Food Chem. 2016, 194, 650–658. [Google Scholar] [CrossRef] [PubMed]
- Abe, M.; Fukaya, Y.; Ohno, H. Extraction of polysaccharides from bran with phosphonate or phosphinate-derived ionic liquids under short mixing time and low temperature. Green Chem. 2010, 12, 1274–1280. [Google Scholar] [CrossRef]
- Bai, Y.; Liu, L.; Zhang, R.; Huang, F.; Deng, Y.; Zhang, M. Ultrahigh pressure-assisted enzymatic extraction maximizes the yield of longan pulp polysaccharides and their acetylcholinesterase inhibitory activity in vitro. Int. J. Biol. Macromol. 2017, 96, 214–222. [Google Scholar] [CrossRef] [PubMed]
- Morales-Tovar, M.E.; Ramos-Ramírez, E.G.; Salazar-Montoya, J.A. Modeling and optimization of the parameters affecting extraction of the chan seed mucilage (Hyptis suaveolens (L.) Poit) by mechanical agitation (MA) and ultrasound-assisted extraction (UAE) in a multiple variables system. Food Bioprod. Process. 2020, 120, 166–178. [Google Scholar] [CrossRef]
- Fabre, J.F.; Lacroux, E.; Valentin, R.; Mouloungui, Z. Ultrasonication as a highly efficient method of flaxseed mucilage extraction. Ind. Crops Prod. 2015, 65, 354–360. [Google Scholar] [CrossRef] [Green Version]
- Kia, A.G.; Ganjloo, A.; Bimakr, M. A short extraction time of polysaccharides from fenugreek (Trigonella foencem graecum) seed using continuous ultrasound acoustic cavitation: Process optimization, characterization and biological activities. Food Bioprocess Technol. 2018, 11, 2204–2216. [Google Scholar] [CrossRef]
- Shi, Y.; Xiong, Q.; Wang, X.; Li, X.; Yu, C.; Wu, J.; Yi, J.; Zhao, X.; Xu, Y.; Cui, H. Characterization of a novel purified polysaccharide from the flesh of Cipangopaludina chinensis. Carbohydr. Polym. 2016, 136, 875–883. [Google Scholar] [CrossRef]
- Hou, Y.; Wang, J.; Jin, W.; Zhang, H.; Zhang, Q. Degradation of laminaria japonica fucoidan by hydrogen peroxide and antioxidant activities of the degradation products of different molecular weights. Carbohydr. Polym. 2012, 87, 153–159. [Google Scholar] [CrossRef]
- Zhang, N.; Chen, H.; Ma, L.; Zhang, Y. Physical modifications of polysaccharide from Inonotus obliquus and the antioxidant properties. Int. J. Biol. Macromol. 2012, 54, 209–215. [Google Scholar] [CrossRef]
- Zhang, D.; Li, S.; Xiong, Q.; Jiang, C.; Lai, X. Extraction, characterization, and biological activities of polysaccharides from Amomum villosum. Carbohydr. Polym. 2013, 95, 114–122. [Google Scholar] [CrossRef]
- Li, X.; Wang, L. Effect of extraction method on structure and antioxidant activity of Hohenbuehelia serotina polysaccharides. Int. J. Biol. Macromol. 2016, 83, 270–276. [Google Scholar] [CrossRef]
- Zhu, Z.-Y.; Pang, W.; Li, Y.-Y.; Ge, X.-R.; Chen, L.-J.; Liu, X.-C.; Lv, Q.; Dong, G.-L.; Liu, A.-J.; Zhang, Y. Effect of ultrasonic treatment on structure and antitumor activity of mycelial polysaccharides from Cordyceps gunnii. Carbohydr. Polym. 2014, 114, 12–20. [Google Scholar] [CrossRef]
- Roulard, R.; Petit, E.; Mesnard, F.; Rhazi, L. Molecular investigations of flaxseed mucilage polysaccharides. Int. J. Biol. Macromol. 2016, 86, 840–847. [Google Scholar] [CrossRef] [PubMed]
- Jia, D.; Zhang, J.; Lan, R.; Yang, H.; Sun, Y. A simple preparative method for isolation and purification of polysaccharides from mulberry (Morus alba L.) leaves. Int. J. Food Sci. Technol. 2013, 48, 1275–1281. [Google Scholar] [CrossRef]
- He, L.; Yan, X.; Liang, J.; Li, S.; He, H.; Xiong, Q.; Lai, X.; Hou, S.; Huang, S. Comparison of different extraction methods for polysaccharides from Dendrobium officinale stem. Carbohydr. Polym. 2018, 198, 101–108. [Google Scholar] [CrossRef] [PubMed]
- Warrand, J.; Michaud, P.; Picton, L.; Muller, G.; Courtois, B.; Ralainirina, R.; Courtois, J. Large-scale purification of water-soluble polysaccharides from flaxseed mucilage, and isolation of a new anionic polymer. Chromatographia 2003, 58, 331–335. [Google Scholar]
- Qian, K.Y.; Cui, S.W.; Wu, Y.; Goff, H.D. Flaxseed gum from flaxseed hulls: Extraction, fractionation, and characterization. Food Hydrocoll. 2012, 28, 275–283. [Google Scholar] [CrossRef]
- Li, S.; Xiong, Q.; Lai, X.; Li, X.; Wan, M.; Zhang, J.; Yan, Y.; Cao, M.; Lu, L.; Guan, J.; et al. Molecular modification of polysaccharides and resulting bioactivities. Compr. Rev. Food Sci. Food Saf. 2016, 15, 237–250. [Google Scholar] [CrossRef] [Green Version]
- Kaur, M.; Kaur, R.; Punia, S. Characterization of mucilages extracted from different flaxseed (Linum usitatissiumum L.) cultivars: A heteropolysaccharide with desirable functional and rheological properties. Int. J. Biol. Macromol. 2018, 117, 919–927. [Google Scholar] [CrossRef] [PubMed]
- Li, H.; Su, L.; Chen, S.; Zhao, L.; Wang, H.; Ding, F.; Chen, H.; Shi, R.; Wang, Y.; Huang, Z. Physicochemical characterization and functional analysis of the polysaccharide from the edible microalga Nostoc sphaeroides. Molecules 2018, 23, 508. [Google Scholar] [CrossRef] [Green Version]
- Skwarek, E.; Goncharuk, O.; Sternik, D.; Janusz, W.; Gdula, K.; Gun’ko, V.M. Synthesis, structural, and adsorption properties and thermal stability of nanohydroxyapatite/polysaccharide composites. Nanoscale Res. Lett. 2017, 12, 155. [Google Scholar] [CrossRef] [Green Version]
- Chen, Z.E.; Wufuer, R.; Ji, J.H.; Li, J.F.; Cheng, Y.F.; Dong, C.X.; Taoerdahong, H. Structural characterization and immunostimulatory activity of polysaccharides from Brassica rapa L. J. Agric. Food Chem. 2017, 65, 9685–9692. [Google Scholar] [CrossRef] [PubMed]
- Razmkhah, S.; Razavi, S.M.A.; Mohammadifar, M.A.; Koocheki, A.; Ale, M.T. Stepwise extraction of Lepidium sativum seed gum: Physicochemical characterization and functional properties. Int. J. Biol. Macromol. 2016, 88, 553–564. [Google Scholar] [CrossRef] [PubMed] [Green Version]
- Sherahi, M.H.; Fathi, M.; Zhandari, F.; Hashemi, S.M.B.; Rashidi, A. Structural characterization and physicochemical properties of Descurainia sophia seed gum. Food Hydrocoll. 2017, 66, 82–89. [Google Scholar] [CrossRef]
- Wang, L.; Chen, C.; Zhang, B.; Huang, Q.; Fu, X.; Li, C. Structural characterization of a novel acidic polysaccharide from Rosa roxburghii Tratt fruit and its α-glucosidase inhibitory activity. Food Funct. 2018, 9, 3974–3985. [Google Scholar] [CrossRef] [PubMed]
- Coimbra, M.A.; Gonçalves, F.; Barros, A.S.; Delgadillo, I. Fourier transform infrared spectroscopy and chemometric analysis of white wine polysaccharide extracts. J. Agric. Food Chem. 2002, 50, 3405–3411. [Google Scholar] [CrossRef]
- Vieira, J.; Mantovani, R.; Raposo, M.; Coimbra, M.; Vicente, A.; Cunha, R. Effect of extraction temperature on rheological behavior and antioxidant capacity of flaxseed gum. Carbohydr. Polym. 2019, 213, 217–227. [Google Scholar] [CrossRef] [Green Version]
- Kaushik, P.; Dowling, K.; McKnight, S.; Barrow, C.J.; Wang, B.; Adhikari, B. Preparation, characterization and functional properties of flax seed protein isolate. Food Chem. 2016, 197, 212–220. [Google Scholar] [CrossRef]
- Devi, R.; Bhatia, M. Thiol functionalization of flaxseed mucilage: Preparation, characterization, and evaluation as mucoadhesive polymer. Int. J. Biol. Macromol. 2019, 126, 101–106. [Google Scholar] [CrossRef]
- Tabarsa, M.; Anvari, M.; Melito, H.S.J.; Behnam, S.; Tabarsa, A. Rheological behavior and antioxidant activity of a highly acidic gum from Althaea officinalis flower. Food Hydrocoll. 2017, 69, 432–439. [Google Scholar] [CrossRef]
- Wang, Y.; Wang, C.; Guo, M. Effects of Ultrasound Treatment on Extraction and Rheological Properties of Polysaccharides from Auricularia Cornea var. Li. Molecules 2019, 24, 939. [Google Scholar] [CrossRef] [PubMed] [Green Version]
- Xiao, J.; Wang, X.; Gonzalez, A.J.P.; Huang, Q. Kafirin nanoparticles-stabilized Pickering emulsions: Microstructure and rheological behavior. Food Hydrocoll. 2016, 54, 30–39. [Google Scholar] [CrossRef]
- Cui, W.; Mazza, G. Physicochemical characteristics of flaxseed gum. Food Res. Int. 1996, 29, 397–402. [Google Scholar] [CrossRef]
- Kaushik, P.; Dowling, K.; Adhikari, R.; Barrow, C.J.; Adhikari, B. Effect of extraction temperature on composition, structure, and functional properties of flaxseed gum. Food Chem. 2017, 215, 333–340. [Google Scholar] [CrossRef] [PubMed]


| Sample | Mn (Da) | Mw (Da) | Mz (Da) | Mz + 1 (Da) | Polydispersity Index (PDI) | Mz/Mw | Mz + 1/Mw |
|---|---|---|---|---|---|---|---|
| HWE | 6.95 × 10⁵ | 7.70 × 10⁵ | 8.21 × 10⁵ | 8.58 × 10⁵ | 1.11 | 1.07 | 1.11 |
| UAE | 6.94 × 10⁵ | 7.67 × 10⁵ | 8.18 × 10⁵ | 8.55 × 10⁵ | 1.11 | 1.07 | 1.15 |
| Monosaccharide Content (mg/mL) | HWE | UAE | |
|---|---|---|---|
| 1 | Rhamnose | 6.18 | 6.20 |
| 2 | Glucuronic acid | - | - |
| 3 | Aminogalactose | - | - |
| 4 | Galacturonic acid | 21.20 | 21.65 |
| 5 | Glucose | 2.95 | 3.07 |
| 6 | Xylopyranose | 23.73 | 23.54 |
| 7 | Galactose | 12.78 | 12.61 |
| 8 | Arabinose | 28.70 | 28.20 |
| 9 | Fucose | 4.07 | 4.20 |
| T (min) | A% | B% |
|---|---|---|
| 0 | 86 | 14 |
| 9 | 83 | 17 |
| 28 | 78 | 22 |
| 29 | 50 | 50 |
| 31 | 50 | 50 |
| 32 | 86 | 14 |
| 36 | 86 | 14 |
Disclaimer/Publisher’s Note: The statements, opinions and data contained in all publications are solely those of the individual author(s) and contributor(s) and not of MDPI and/or the editor(s). MDPI and/or the editor(s) disclaim responsibility for any injury to people or property resulting from any ideas, methods, instructions or products referred to in the content. |
© 2023 by the authors. Licensee MDPI, Basel, Switzerland. This article is an open access article distributed under the terms and conditions of the Creative Commons Attribution (CC BY) license (https://creativecommons.org/licenses/by/4.0/).
Share and Cite
Ren, X.; Meng, X.; Zhang, Z.; Du, H.; Li, T.; Wang, N. Effects of Ultrasound-Assisted Extraction on Structure and Rheological Properties of Flaxseed Gum. Gels 2023, 9, 318. https://doi.org/10.3390/gels9040318
Ren X, Meng X, Zhang Z, Du H, Li T, Wang N. Effects of Ultrasound-Assisted Extraction on Structure and Rheological Properties of Flaxseed Gum. Gels. 2023; 9(4):318. https://doi.org/10.3390/gels9040318
Chicago/Turabian StyleRen, Xuejiao, Xin Meng, Zhen Zhang, Hongyu Du, Tuoping Li, and Na Wang. 2023. "Effects of Ultrasound-Assisted Extraction on Structure and Rheological Properties of Flaxseed Gum" Gels 9, no. 4: 318. https://doi.org/10.3390/gels9040318