Abstract
In this study, in a three-phase reactor with a rectangular cross-section, the effects of liquid circulation rates and solid particle concentration on gas holdup and bubble size distribution (BSD) were investigated. Air, water, and glass beads were used as the gas, liquid, and solid phases, respectively. Different liquid circulation velocities and different solid loads were applied. The results demonstrate that increasing solid content from 0% to 6% can decrease gas holdup by 50% (due to increased slurry phase viscosity and promotion of bubble coalescence). Also, increasing the liquid circulation rate showed a weak effect on gas holdup, although a slight incremental effect was observed due to the promotion of bubble breakup and the extension of bubble residence time. The gas holdup in counter-current slurry bubble columns (CCSBCs) was predicted using a novel correlation that took into account the combined effects of solid concentration and liquid circulation rate. These findings are crucial for the design and optimization of the three-phase reactors used in industries such as mining and wastewater treatment.
1. Introduction
Owing to their great efficiency and straightforward design, three-phase reactors (like slurry bubble columns) are widely utilized in a variety of industries. These reactors are essential to many different processes, including wastewater treatment and petrochemical and chemical reactions. Comprehending their hydrodynamic properties is crucial for optimizing a reactor of this kind. Counter-current slurry bubble column (CCSBC) reactors are one of the most important types of three-phase reactors, where the liquid and solid phases flow downwards, and the gas phase flows upward, lengthening the period that phases come into contact with one another. Compared to batch or co-current modes, a counter-current design can greatly increase mass transfer rates, which makes CCSBCs ideal for processes like hydrogenation and Fischer–Tropsch synthesis [1,2,3]. A comprehensive evaluation of the mechanisms by which the presence of solid particles affects the gas holdup, flow structure, and mass transfer coefficient of three-phase columns was conducted in our recent review [4,5].
One of the key elements that can greatly affect the performance of three-phase reactors is gas holdup, which is the percentage of reactor volume filled by the gas phase. A number of other variables, including solid particle concentration, gas velocity, liquid characteristics, and liquid circulation rates, can also affect gas holdup [5,6,7,8,9]. Another key element affecting the performance of such reactors is bubble size distribution as it can affect gas holdup, mass transfer efficiency, and overall hydrodynamic behavior. This is because smaller bubbles offer a larger surface area for mass transfer between the gas and liquid phases. Numerous factors affecting gas holdup and bubble dynamics in slurry bubble columns have been investigated in earlier research [10,11,12,13]. However, research specifically focusing on the interplay between solid particle concentration and liquid circulation in a large-scaled counter-current slurry bubble column remains limited. The majority of studies have either focused on batch or co-current flow settings, leaving a knowledge gap in understanding the hydrodynamics of such reactors under different counter-current operations.
Analyzing the effects of the addition of solid particles to a gas–liquid system can be conducted via two distinct approaches. The first approach, referred to as the two-phase approach, postulates that a slurry phase is formed by evenly mixing solid particles with the liquid phase. Thus, by substituting the liquid properties with slurry properties, theories and models created for the hydrodynamics of gas–liquid systems can likewise be utilized for three-phase systems. Many studies have used the two-phase approach; however, some have claimed that it is only appropriate in systems where Stokes’ law is still applicable (more precisely, where the particle Reynolds number is less than 0.3) [14,15]. The second approach is actually known as the three-phase approach. This approach entails breaking down the three phases (gas, liquid, and solid) and adding their respective characteristics to models and correlations. Numerous scholars [15,16,17,18] have underscored the significance of the three-phase methodology, noting that even in cases where the apparent viscosity and density of the three-phase system align with those of the two-phase system’s liquid viscosity and density, the flow structure within a gas–slurry system is markedly different from that within a solid-free system [5,15] This deviation hinges on collision efficiency . Collision efficiency quantifies the number of solid particles that collide with the bubbles present in the same spatial domain, based on a certain number of particles in that domain. The three main factors influencing collision efficiency () in bubble columns are inertial forces, bubble surface mobility, and the flow regime surrounding the bubble. According to Dai et al. [19], a fully mobile bubble surface (like those in tap water devoid of surfactants) significantly increases collision efficiency, which can be up to 10 times higher than that of immobile surfaces.
The second parameter which affects collision efficiency is the flow regime around the bubbles, which is dependent on the Reynolds number of bubbles. Based on the magnitude of the bubble Reynolds number, three different flow regimes can be presented: more specifically, a Stokes flow regime (), intermediate flow, and potential flow ().
The third parameter that can affect collision efficiency is the particle inertia force, which is dependent on the Stokes number (). Whether or not particles stray from liquid streamlines to collide with bubbles is determined by their inertia. In actuality, the properties of the flow field and the inertia of the particles determine both the particle trajectories and the quantity of particles that reach the bubble interface. When a particle encounters a bubble, there are three possible scenarios that can be distinguished based on the value of the Stokes number (). The critical Stokes number, defined as the minimum value of the Stokes number for which a solid particle can actually reach the surface of a bubble due to inertial forces, is typically assumed to be . When , particles adhere to the liquid streamlines, hitting the bubble surface only if they are within a critical radial distance equal to the sum of the particle and bubble radii (known as interceptional effect). When , particles deviate from streamlines and cause bubble–particle collisions because each particle has its own settling velocity (known as gravitational effect). For , particles are heavy and coarse enough to follow straight paths, leading to solid–bubble collisions due to inertia (known as inertial effect). Therefore, particle density and size, which directly impact the Stokes number, are vital for determining collision efficiency ().
Determining the proper conditions under which to implement each of the two approaches in a CCSBC is therefore essential. In order to achieve this, a thorough investigation of the combined impact of solid particles with gas velocity and liquid characteristics on the operation of such reactors is required. This work fills the knowledge gap by investigating how the gas holdup in a counter-current slurry bubble column with a rectangular cross-section is impacted by the interaction between solid particle concentration, liquid circulation rates, and their combined effects. Air was employed as the gas phase in the experiments, while the slurry was a combination of water and different concentrations of solid particles. The effects of various liquid circulation rates on gas holdup were investigated. In order to obtain a more profound comprehension of the impact of liquid circulation and solid particle concentration on gas holdup, the photography method was also employed to investigate the bubble size distribution. The Differential Gas Disengagement (DGD) technique was employed to evaluate the parameters impacting particle collision efficiency. Accordingly, the accuracy of two- and three-phase approaches was also examined. These results led to the development of a novel correlation that takes into account both solid loading and liquid circulation in order to predict gas holdup. This correlation provides accurate predictions with a reasonable margin of error, providing valuable insights for optimizing the operation and design of CCSBCs in industrial applications.
2. Experimental Setup and Method
2.1. Experimental Setup
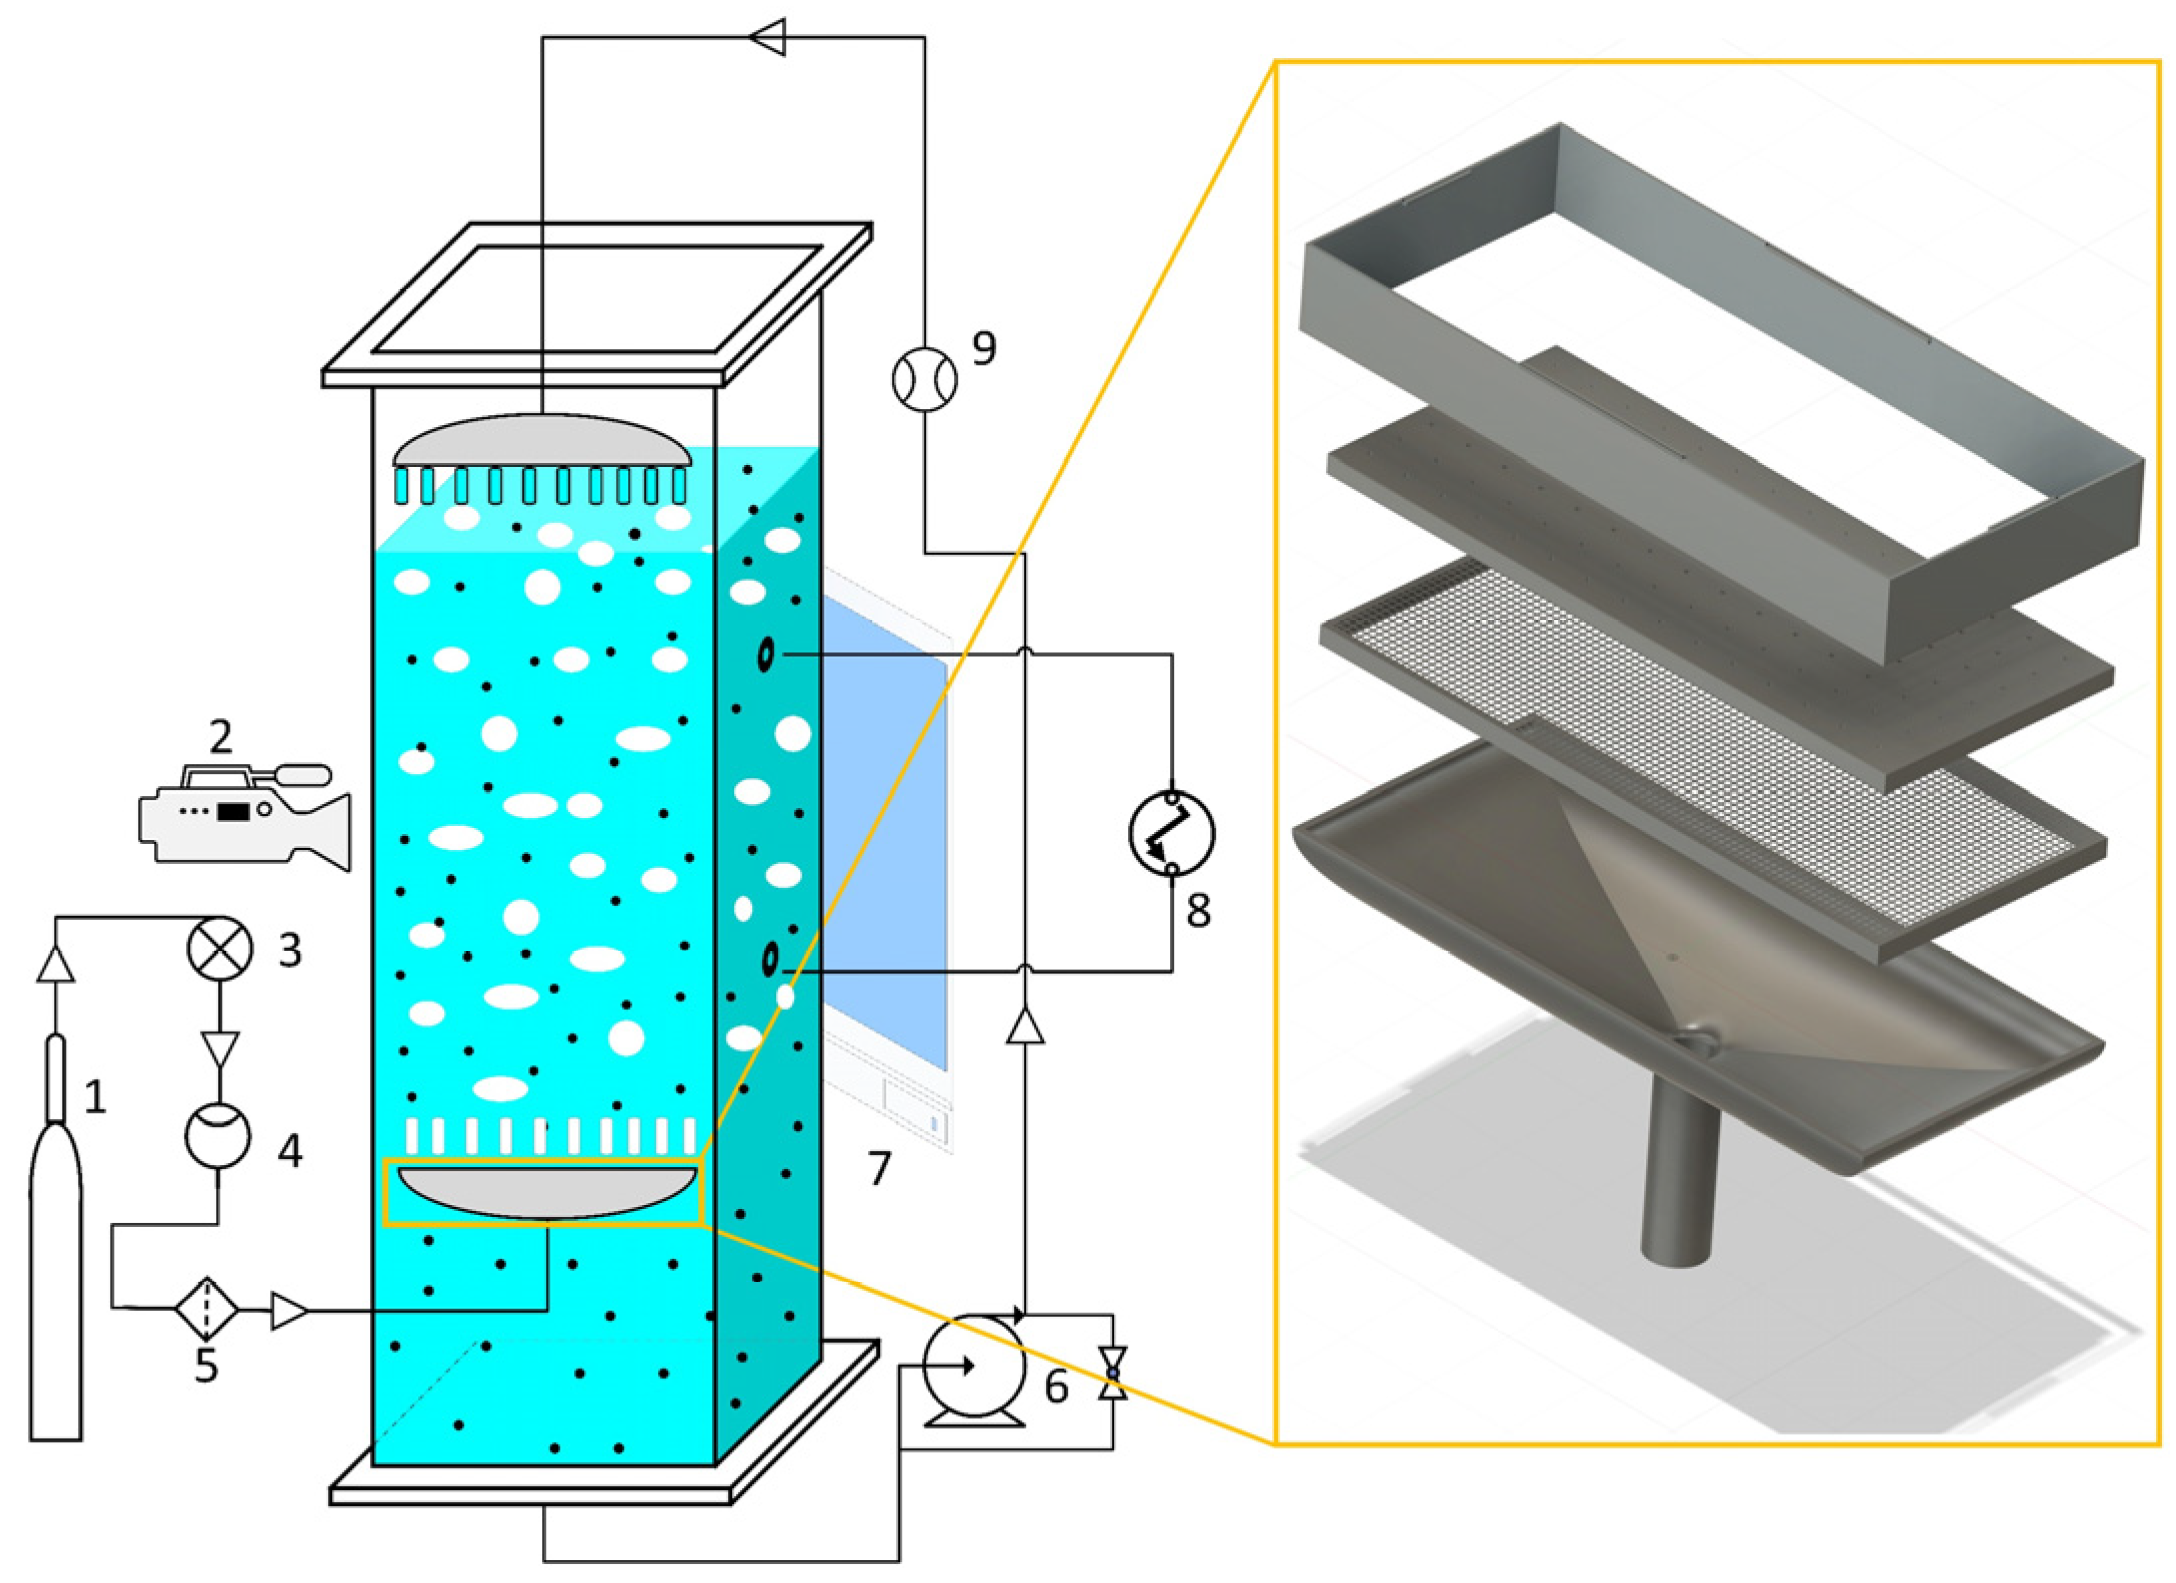
A rectangular cross-sectional bubble column reactor made of Plexiglass ( height, width, depth) was used for this experimental study. At room temperature and ambient pressure, the system ran in a counter-current flow configuration. A gas cylinder provided filtered compressed air, and a needle valve controlled the air flow rate, which was measured using an SLA5800 Series gas flow meter (Brooks Instrument SLA5800 Series; range: ). The air was uniformly distributed into the column through an in-house-designed gas distributor with 60 holes and an average hole diameter of . The outer dimension of the gas distributor was so as to allow the slurry to leave the column through the gap between the column wall and the gas distributor.
To ensure even gas distribution, particularly at low flow rates, two layers of porous plates were added to the gas distributor. The first layer consists of very fine holes, while the second layer has 60 holes with an average diameter of 1 mm. This setup helps maintain uniform bubble formation and consistent hydrodynamic conditions throughout the column. In fact, this design ensures that even at low gas flow rates, gas is evenly distributed through all the holes. This configuration is shown on the right-hand side of Figure 1.
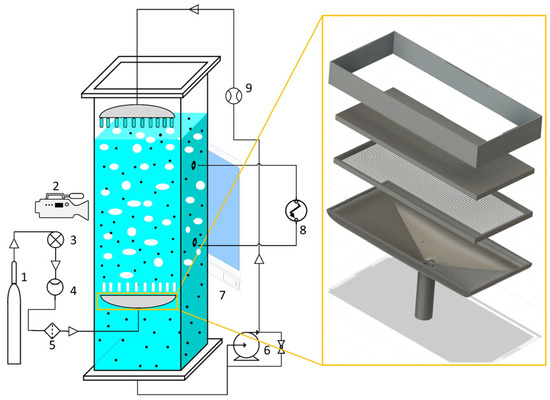
Figure 1.
A schematic diagram of the experimental setup showing the gas supply (1), digital camera (2), needle valve (3), flow meter (4), filter (5), slurry pump (6), light source (7), pressure sensor (8), and liquid flow meter (9), as well as a detailed view of the gas distributor on the left-hand side.
A slurry pump (Grundfos pump CM3-3 A-R-G-E-AQQE C-A-A-N) was used to circulate a slurry mixture of water and glass beads through the system, and an electromagnetic flow meter (Endress+Hauser Proline Promag 10D; range: ; accuracy: ) was installed to control the slurry flow rate. A liquid distributor was employed (at 35 cm above the liquid level before aeration) in the column’s upper part to guarantee the gradual addition of liquid without interfering with the column’s pre-existing flow structure. The liquid distributor had 21 holes, each with an inner diameter of . The outer dimension of the liquid distributor was . The slurry level in the column was kept at during operation. In this study, the superficial gas velocity ranged from 0 to , while the superficial slurry velocity was set at three distinct values: , , and . Tests were conducted with and without solids, employing initial volume fractions of solids of , , and . These concentrations were chosen in order to enable accurate control and the observation of the impact of small changes on the functioning of the column. The glass beads utilized in this study were standard glass beads which are insoluble in water, transparent, and odorless. The density of the utilized glass beads was 2500 kg/m3, and the mean particle diameter was . This setup allowed for the accurate measurement and control of gas and slurry flow rates, ensuring reliable data collection for analyzing the effects of solid particle concentration and liquid circulation on the gas holdup of a CCSBC.
It should be highlighted that the flow regime surrounding bubbles is considered as potential flow in this study, as the average minimum in this study is 56, which is calculated for the 3.8 mm bubble in the presence of 6% solid particles at . Moreover, in this study, the particles and the surrounding bubbles affect each other via the interceptional effect, as the average is 0.003, which is significantly smaller than the critical Stokes number (which is equal to ).
2.2. Experimental Method
2.2.1. Gas Holdup
Gas holdup is a crucial dimensionless number that is vital for understanding the transport phenomena in reactors, especially during the scaling up and designing of SBCRs. This parameter represents the proportion of the reactor volume occupied by gas bubbles. Similarly, the fractions of the reactor filled with solid and liquid phases, respectively, can be represented by solid and liquid holdups. Owing to the importance of these characteristics, a large number of researchers have used techniques like pressure analysis to study them. Li and Prakash [16] state that the following expression can be used to express the static pressure drop over a bed’s height:
In this context, ΔP stands for the static pressure drop along the height of the reactor, while denotes the phases’ holdups. The symbol stands for the height difference between the legs of transducers. With Equation (1) as a starting point and the necessary substitutions made, the gas holdup can be stated as follows:
This method is based on measuring the difference in pressure between two distinct levels in the column that define a zone that needs to be evaluated. In this method, the pressure drop along the column is measured and recorded utilizing a manometer or a transducer. In this investigation, a Differential Pressure Transmitter (DPT) was set up to measure the gas holdup within this designated zone. The transducer’s lower leg was positioned above the distributor, and a space of was considered between the two legs. The column was run for to attain the steady state for each measurement, after which the differential pressure was recorded every 1 s for 30 s. Afterwards, using these thirty entries, the average differential pressure was computed. Each experiment was repeated three times with a new slurry for accuracy’s sake, and the hydrodynamic findings were calculated based on the average of three measured values. The specifications of the utilized sensor is shown in Table 1.

Table 1.
The specifications of the utilized sensor.
2.2.2. Differential Gas Disengagement
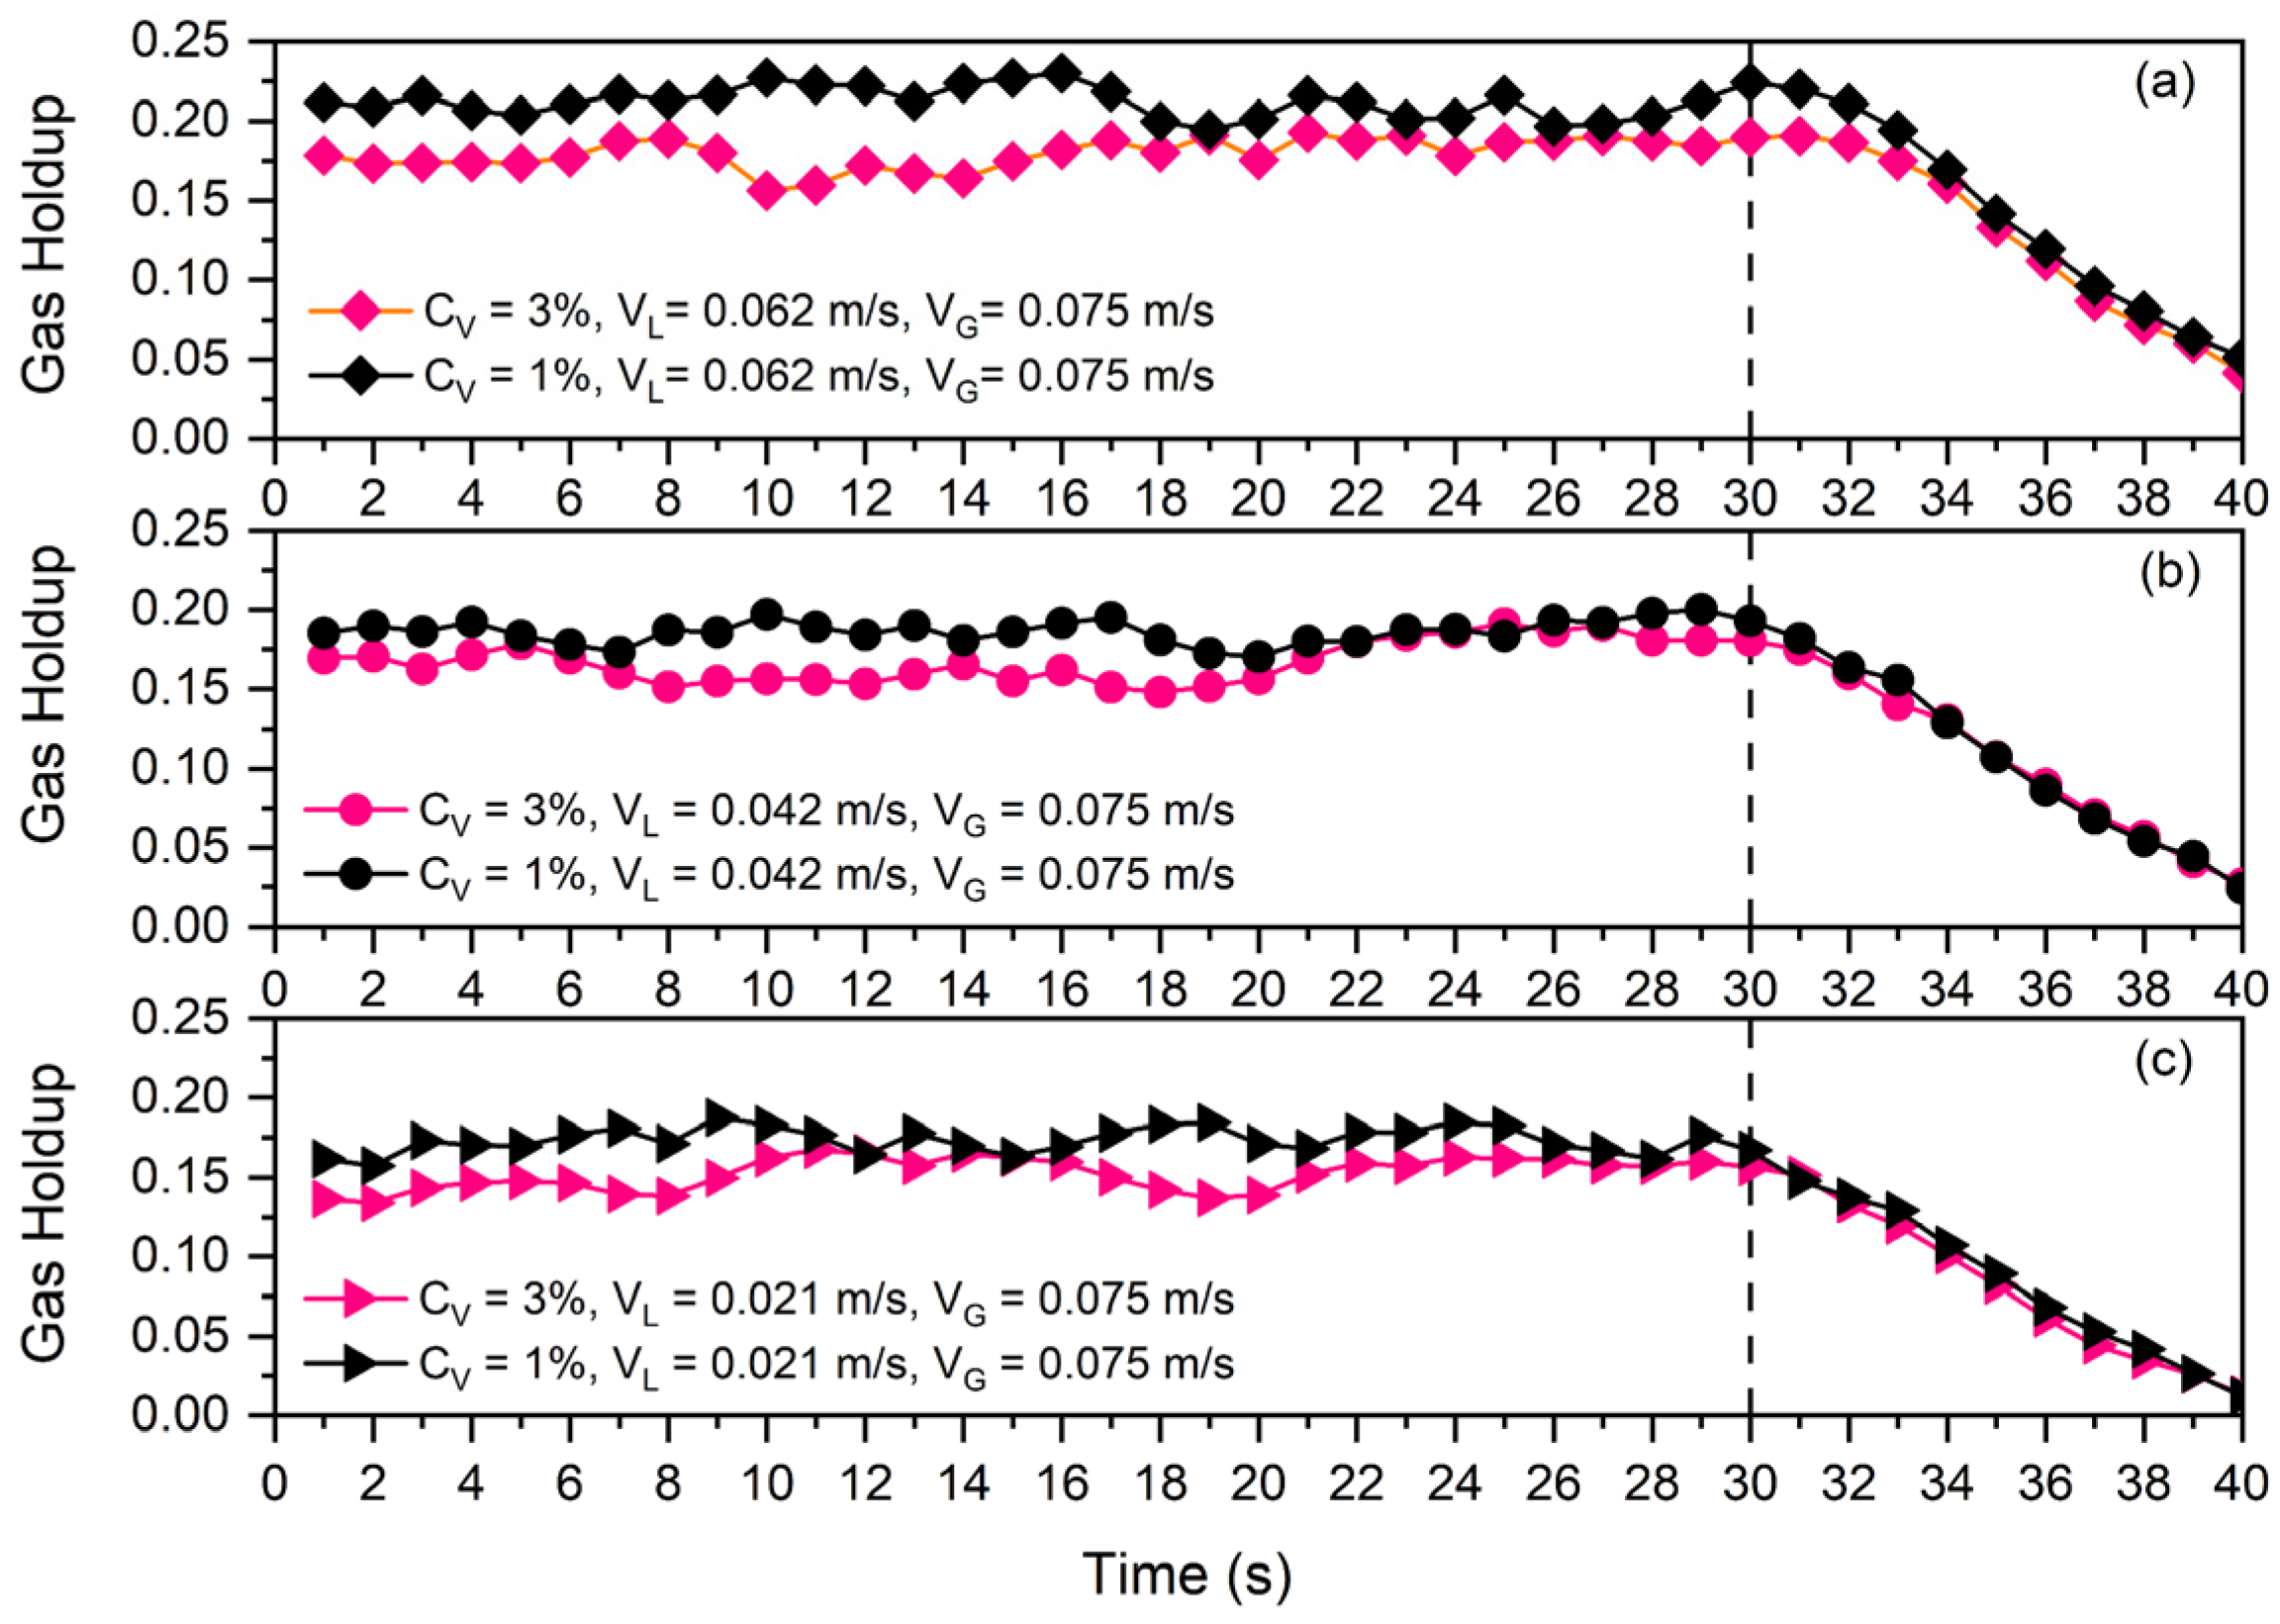
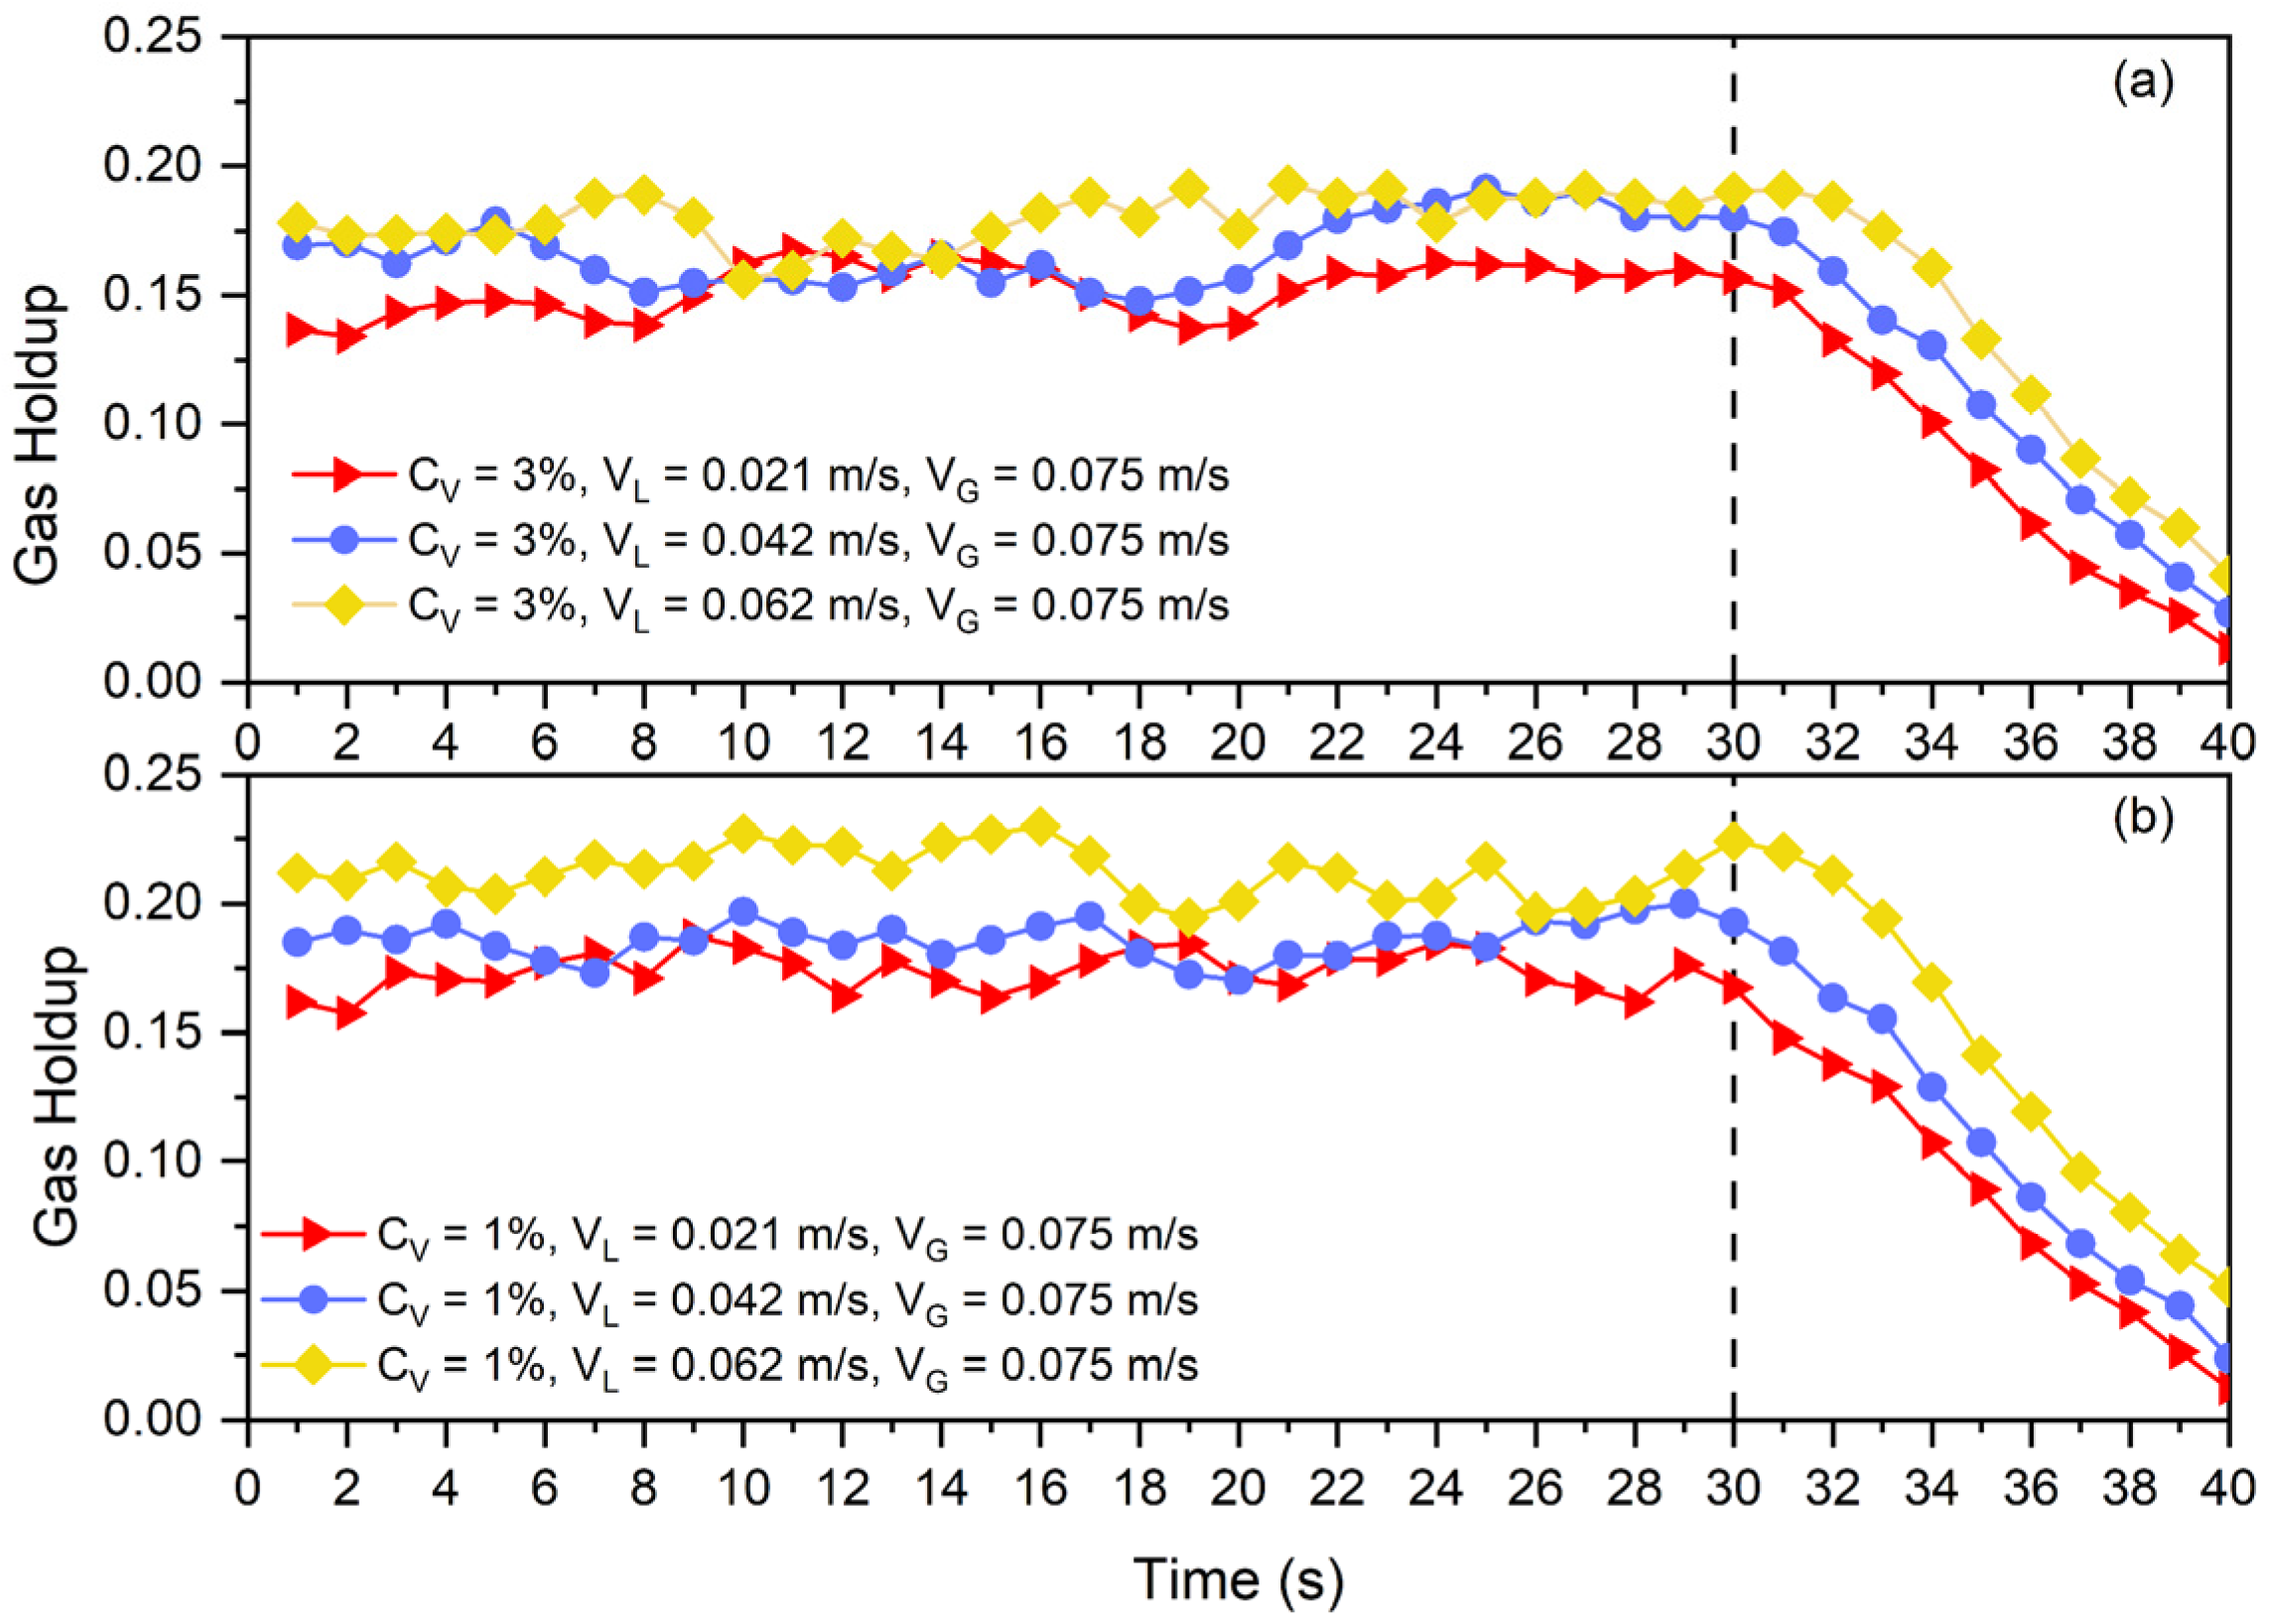
In order to facilitate the Differential Gas Disengagement (DGD) procedure, a quick-closing valve was utilized. The DGD technique works on the principle of analyzing the gas holdup drop as the gas inlet at a specific rate is abruptly stopped [20]. This method’s fundamental premise is that when the gas flow is cut off, larger bubbles with greater rise velocities will disengage first, and smaller bubbles with lower rise speeds will disengage later. More specifically, gas holdup will rapidly decrease as larger, quicker bubbles detach [21]. The apparatus was run for 30 s in our experiment, and then the gas was abruptly turned off at . The same transducer was then used to record the time-dependent differential pressure.
2.2.3. Bubble Diameter
In our current experiment, bubble diameter was measured using the photographic method. A digital high-speed camera (IDT OS8-S2) was installed in front of the slurry bubble column. The camera was equipped with a lens, and the aperture was set to . The shutter speed was adjusted to to capture clear images of fast-moving bubbles, while the frame rate was set to frames per second (fps). The measurement spot was illuminated by three LED lamps (; Neutral white) which were positioned on the back, right, and left sides of the spot. Additionally, to improve contrast and image clarity, a black sheet was placed behind the column. Fifty photographs were taken for every experimental condition, and an image was chosen randomly for further examination, using Fiji image analysis software (https://imagej.net/software/fiji/downloads) [22]. To investigate bubble size, equivalent ellipses were processed to obtain the minor () and major () axes, and finally, the equivalent bubble size () was computed.
3. Modeling
Based on the observations made during the experimental work, eight physical variables () were taken into consideration in order to estimate gas holdup. These variables encompass the operating conditions as well as the properties of both the gas and liquid phases, specifically including and . To predict gas holdup () utilizing these eight identified parameters, Buckingham’s π theorem was applied. This theorem states that a system is governed by variables and fundamental dimensions. The system can be characterized using dimensionless groups. In this study, with variables and fundamental dimensions (mass, length, and time), five () dimensionless groups were needed. The resulting dimensionless groups are as follows:
The dimensionless group represents the inverse Reynolds number, emphasizing the significance of viscous forces in comparison to inertial forces. indicates the density ratio between the gas and liquid phases, which is crucial for examining multiphase flow behavior. , , and correspond to the inverse square of the Froude number, the velocity ratio, and the inverse Weber number, respectively, indicating the roles of gravitational forces, phase interactions, and surface tension impacts. The dimensionless numbers that were created can encompass all the essential parameters required to analyze a CCSBC. Therefore, gas holdup can be estimated with the help of the following correlation:
where A, B, C, D, E, and F are constants which will be determined from experimental data. In order to conduct this, experimentally acquired gas holdup data from a two-phase system will be used in the next section. This dimensionless formulation makes it easier to predict gas holdup, improves its applicability to many systems, and aids in understanding how each physical variable affects the system. In the next section, the coefficients and accuracy of the proposed model will be determined.
4. Results and Discussion
4.1. Gas Holdup in Two- and Three-Phase Systems
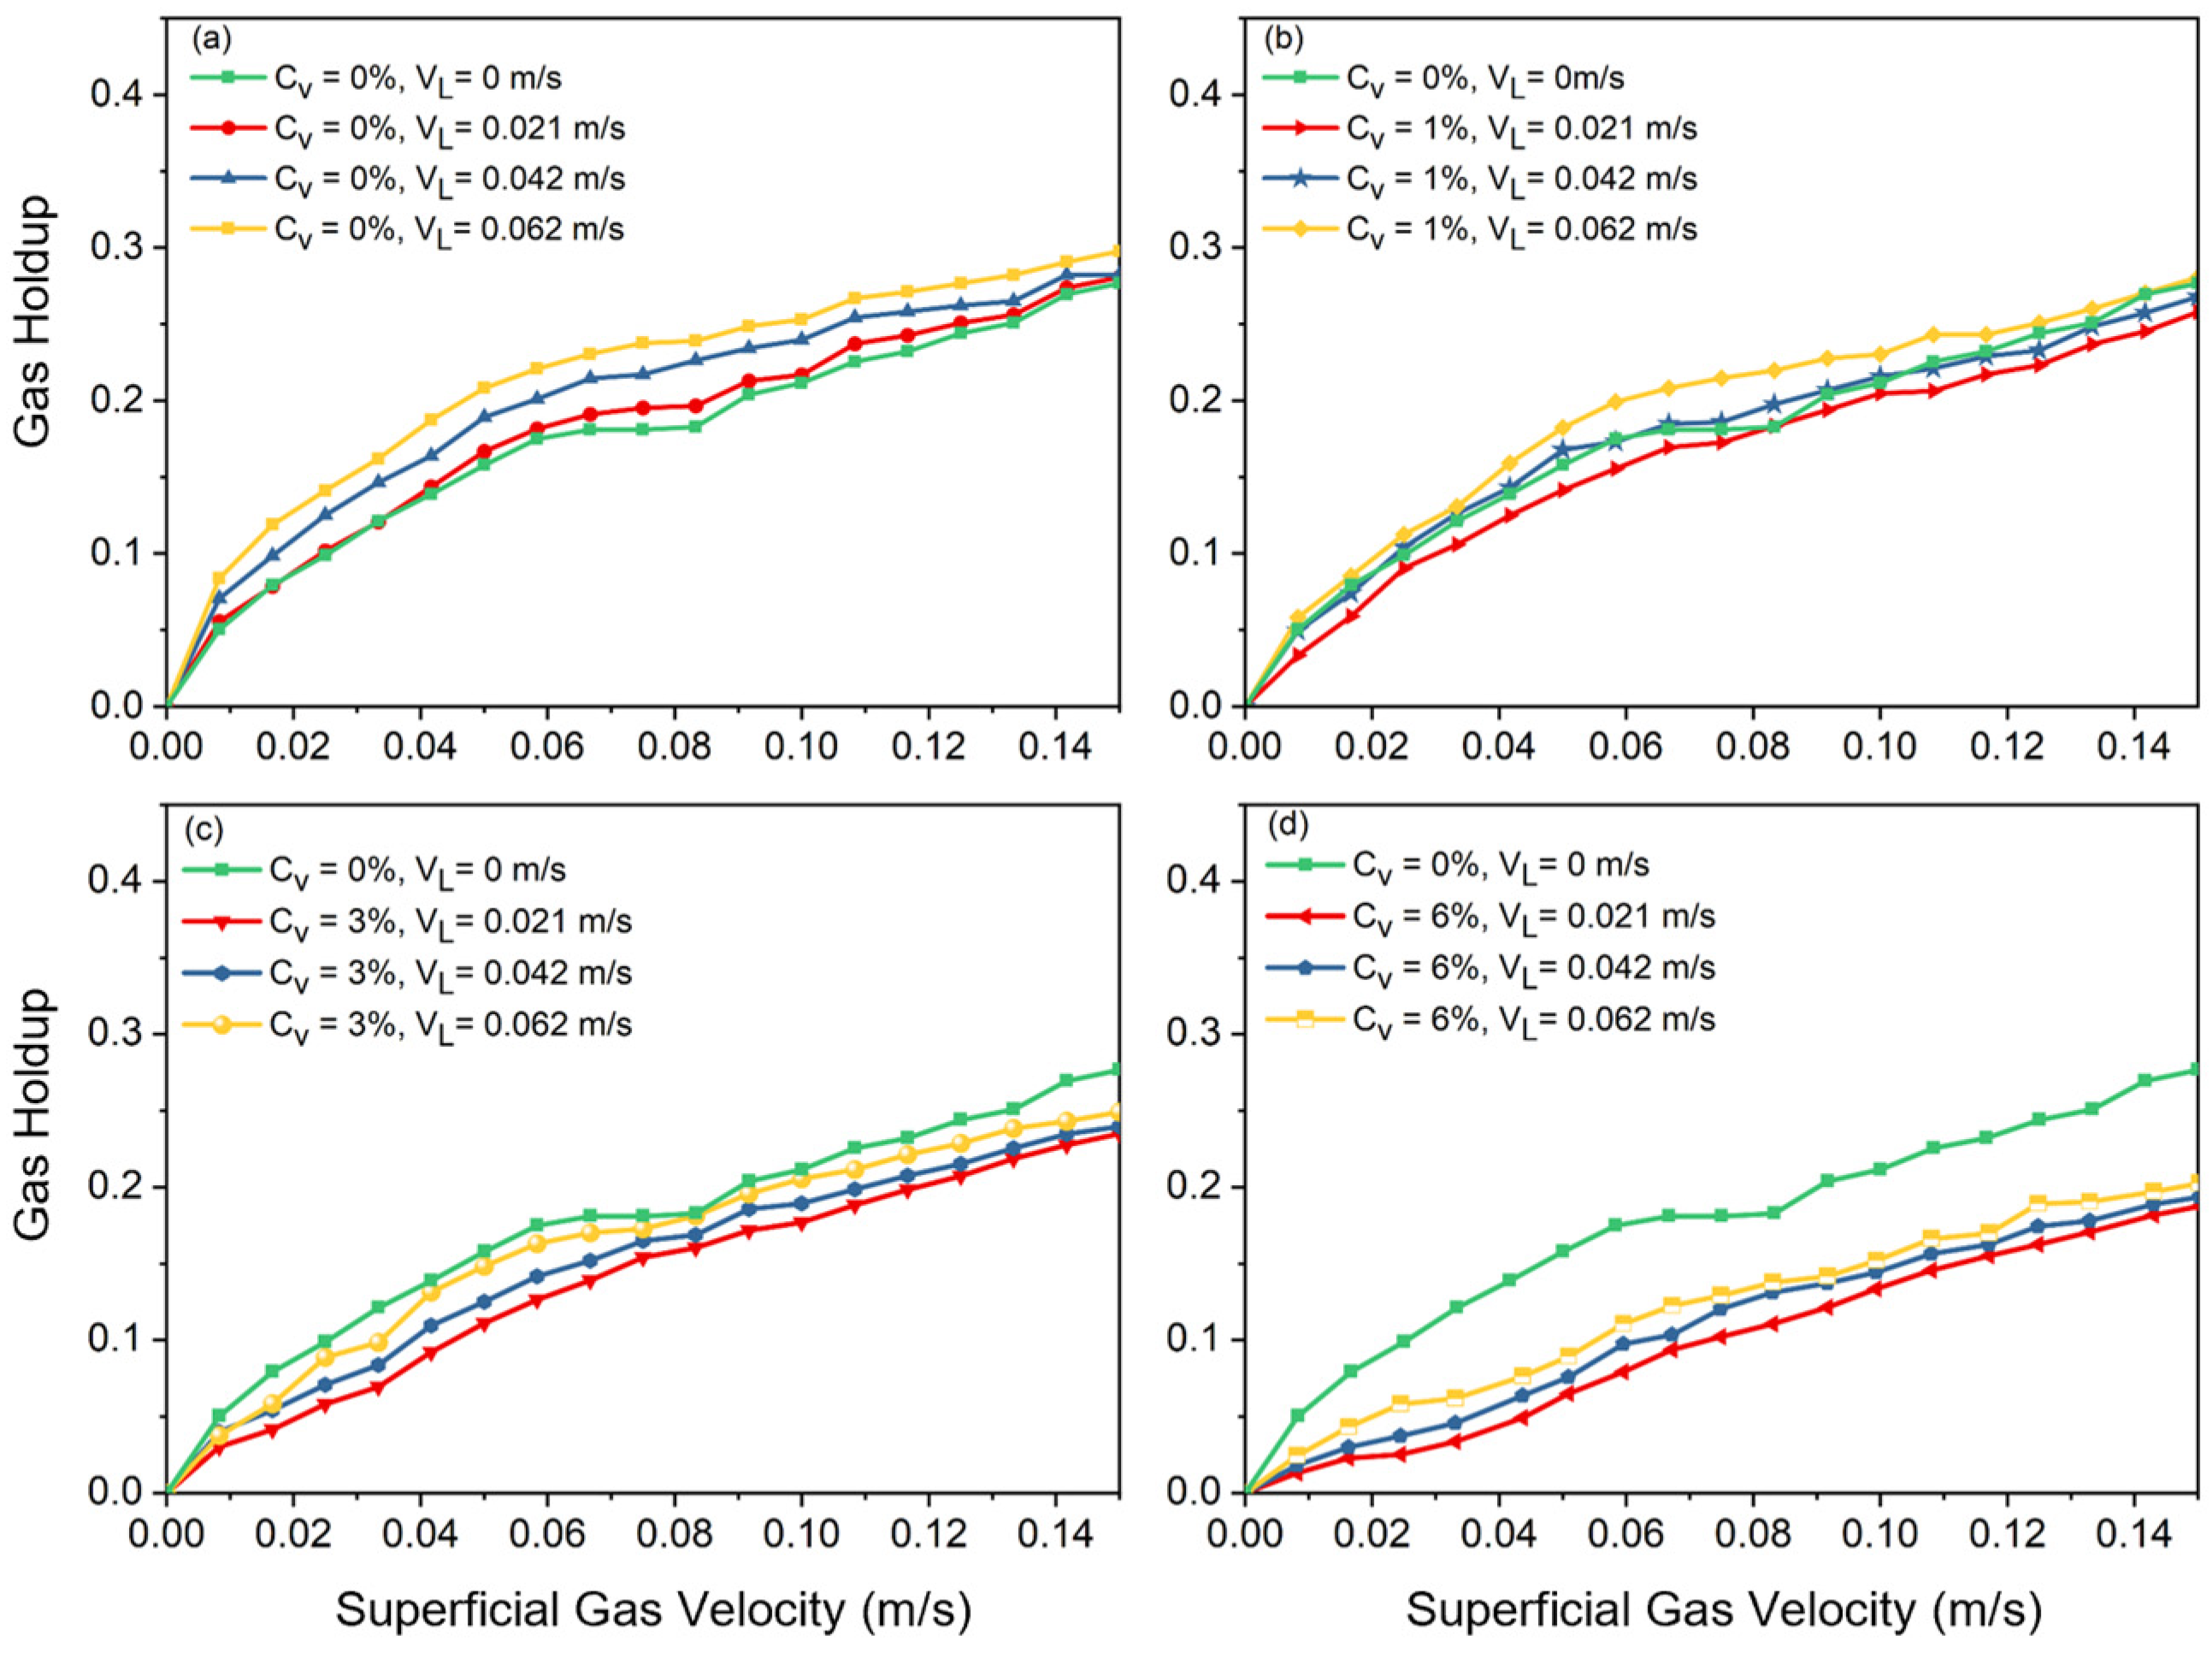
The effects of increasing solid concentration, superficial slurry velocity, and superficial gas velocity on total gas holdup are shown in Figure 2 and Figure 3. Figure 2 illustrates the gas holdup increase with increasing counter-current slurry velocity at all solid concentrations. The observed incremental effect was attributed to the facilitation of larger bubbles breaking up into smaller ones.
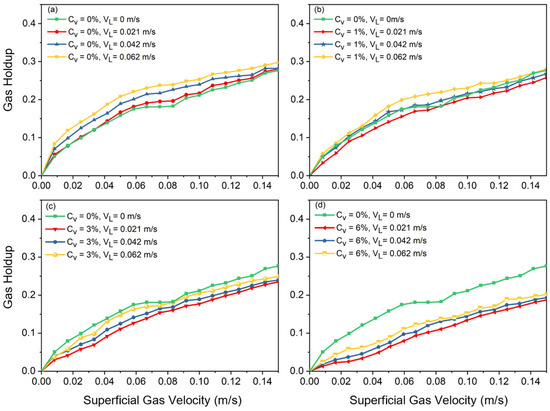
Figure 2.
Effects of slurry velocity on gas holdup at different solid concentrations: (a) , (b) , (c) , (d) .
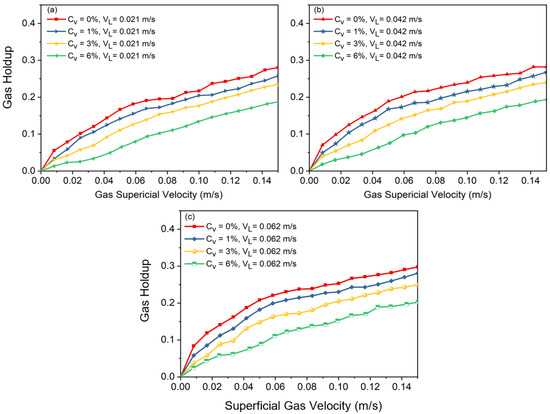
Figure 3.
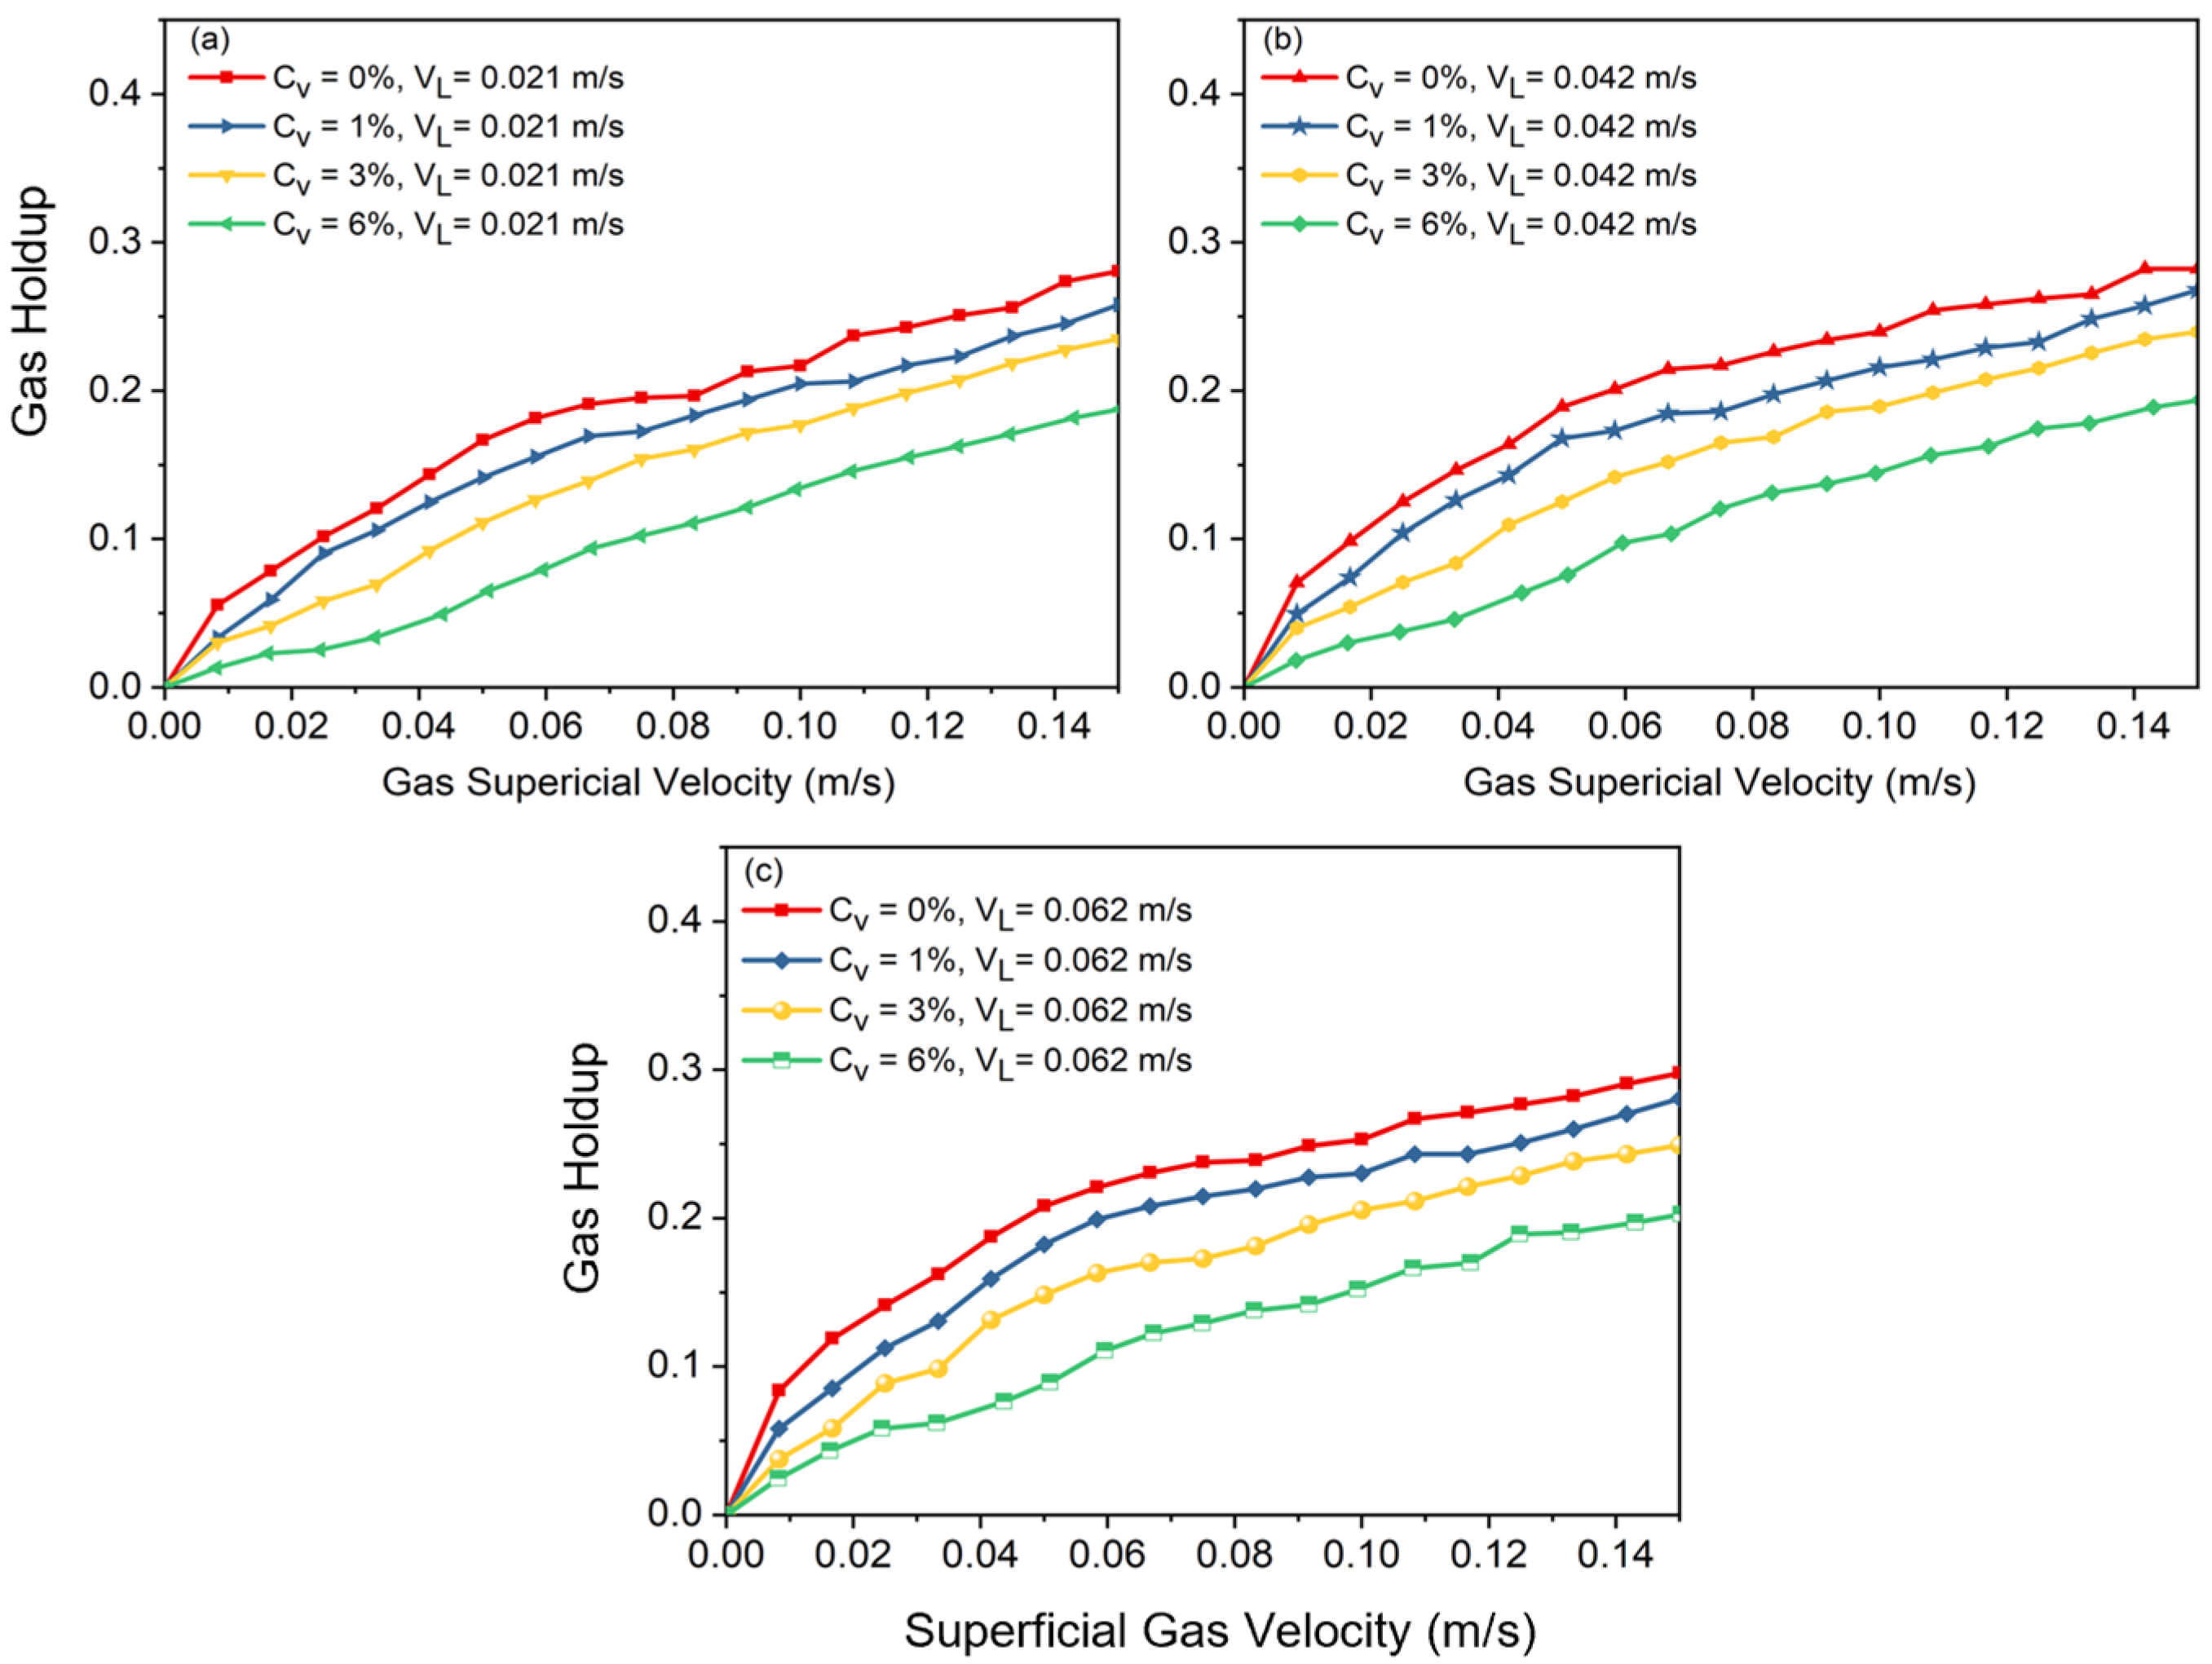
Effects of solid concentration on gas holdup at superficial velocity of liquid: (a) , (b) , (c) .
A shift in slope on the curve indicates the flow regime transition point where gas holdup rises nonlinearly at high velocities and almost linearly at low velocities in a basic air–water system. Large, distorted bubbles, which leave the slurry phase sooner, begin to emerge in the column after transition velocity is reached. These large bubbles, which are formed due to coalescence, cause the slope of holdup versus superficial gas velocity to decrease. It was observed that increasing the superficial liquid velocity led to a more compact arrangement of bubbles, which resulted in an earlier transition of the flow regime. Additionally, it was noted that there should be no impact of slurry circulation on gas holdup when the liquid circulation velocity is significantly lower than the bubble rising velocity. After a certain superficial gas velocity is reached (), the effects of superficial slurry velocity on gas holdup are negligible. This means that, regardless of the solid concentration value (), the gas holdups of all cases, after a certain value is reached, approach each other, which shows the meager effects of slurry velocity on gas holdup in fully turbulent settings.
Figure 3 shows that adding solid particles results in a decrease in gas holdup, independent of the added solid’s concentration or liquid circulation rate. According to the observations in the lab, the addition of solid particles can drastically alter the flow structure in the column. As Figure 3 also indicates, in a two-phase system () without liquid circulation, at , the slope of the curve shifts to a nonlinear slope, and afterwards, heterogeneous flow is observed. In Figure 2, at a higher solid content (i.e., ), there is not a noticeable shift in the curve’s slope. This is consistent with what was observed in the laboratory. In fact, having a high concentration of solid particles in the bubble column causes the column to be operated just under the heterogeneous flow regime. These results highlight how crucial it is to precisely balance solid concentration and slurry velocity in order to maximize gas holdup and improve the efficiency of slurry bubble column operations.
Increasing the liquid circulation rate in a bubble column promotes shear forces and turbulence, which results in smaller bubble sizes (discussed in the next section). However, increasing the liquid circulation rate also promotes earlier transition points between flow regimes. This paradoxical effect occurs due to the increased quantity of bubbles, which leads to higher gas holdup and more frequent bubble–bubble interactions. Increased turbulence and relative motion between the liquid and gas phases causes more chaotic mixing and also homogeneous flow regime instability in the system, which accelerates the shift to churn-turbulent or heterogeneous regimes. Consequently, while higher liquid circulation rates generate smaller bubbles, they simultaneously increase the overall system complexity and instability, driving earlier flow regime transitions.
4.2. Bubble Size Distribution
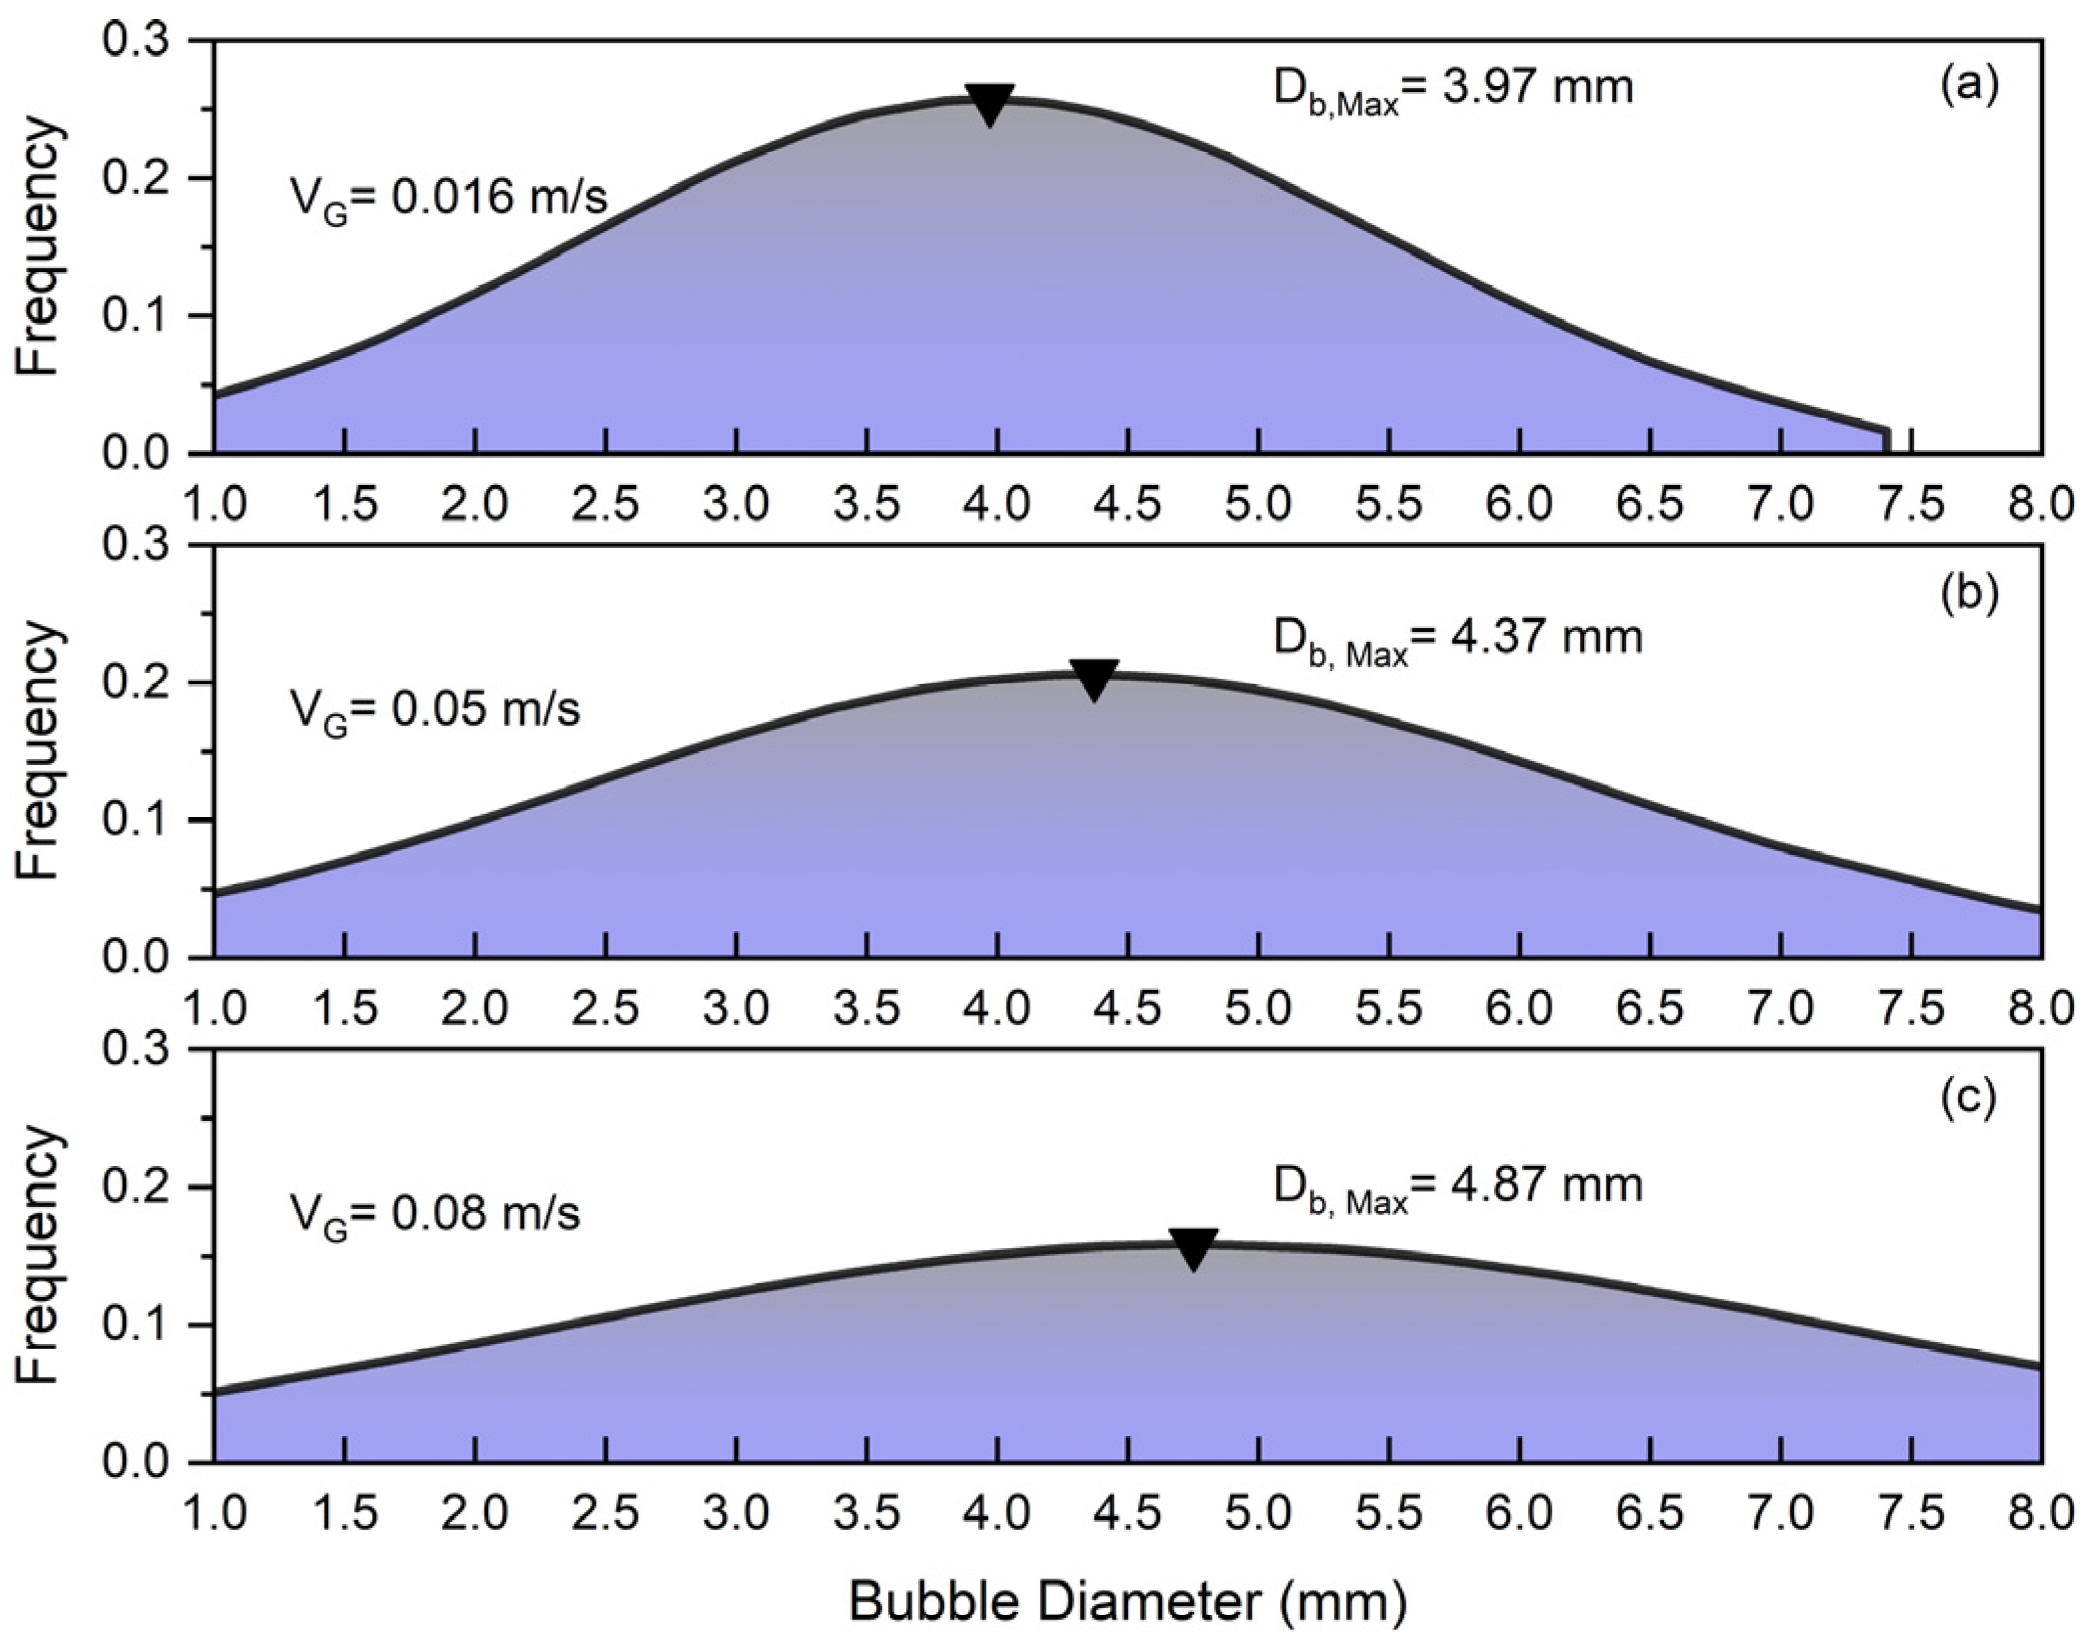
The parameters that can influence bubble size distribution (BSD) are pressure, temperature, gas velocity, liquid velocity, liquid viscosity, surface tension, the presence of surfactants or additives, particle size and concentration in slurry systems, particle wettability, column design, and sparger type. Comprehending these factors is essential to maximize column performance in a range of industrial applications. Figure 4 depicts the bubble size distribution for different superficial gas velocities under the influence of solid and superficial slurry velocity. Figure 4 shows that increasing the superficial gas velocity in a slurry bubble column () significantly affects the bubble size distribution so that the peak of frequency shifts from at to at .
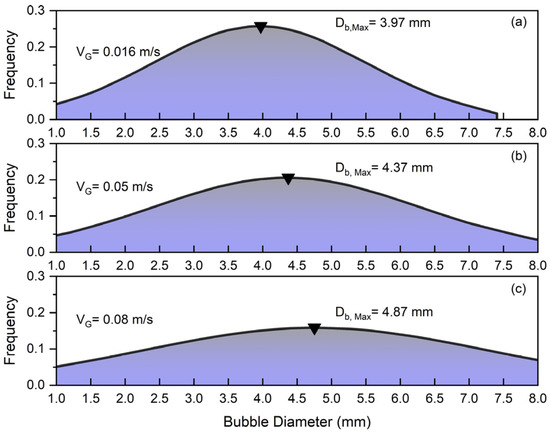
Figure 4.
Effects of superficial gas velocity on bubble size distribution at constant and : (a) , (b) , (c) .
At low gas velocities, the system operates in a homogeneous flow regime characterized by small, uniformly sized bubbles with minimal interaction and coalescence. By increasing the superficial gas velocity (), the flow becomes more turbulent, leading to enhanced bubble coalescence and the formation of larger bubbles. This transition results in a wider distribution of bubble sizes so that in the case of , bubbles in the range of to exist in the column. Additionally, it was noticed that smaller bubbles are more commonly found close to walls, whereas larger bubbles are primarily located in the column’s center. Smaller bubbles are pushed towards the walls of the bubble column by the lift force generated from the liquid’s velocity gradient near the walls. Larger bubbles tend to stay more central in the column and are less impacted by this lateral force because of their higher rise velocities [2,7].
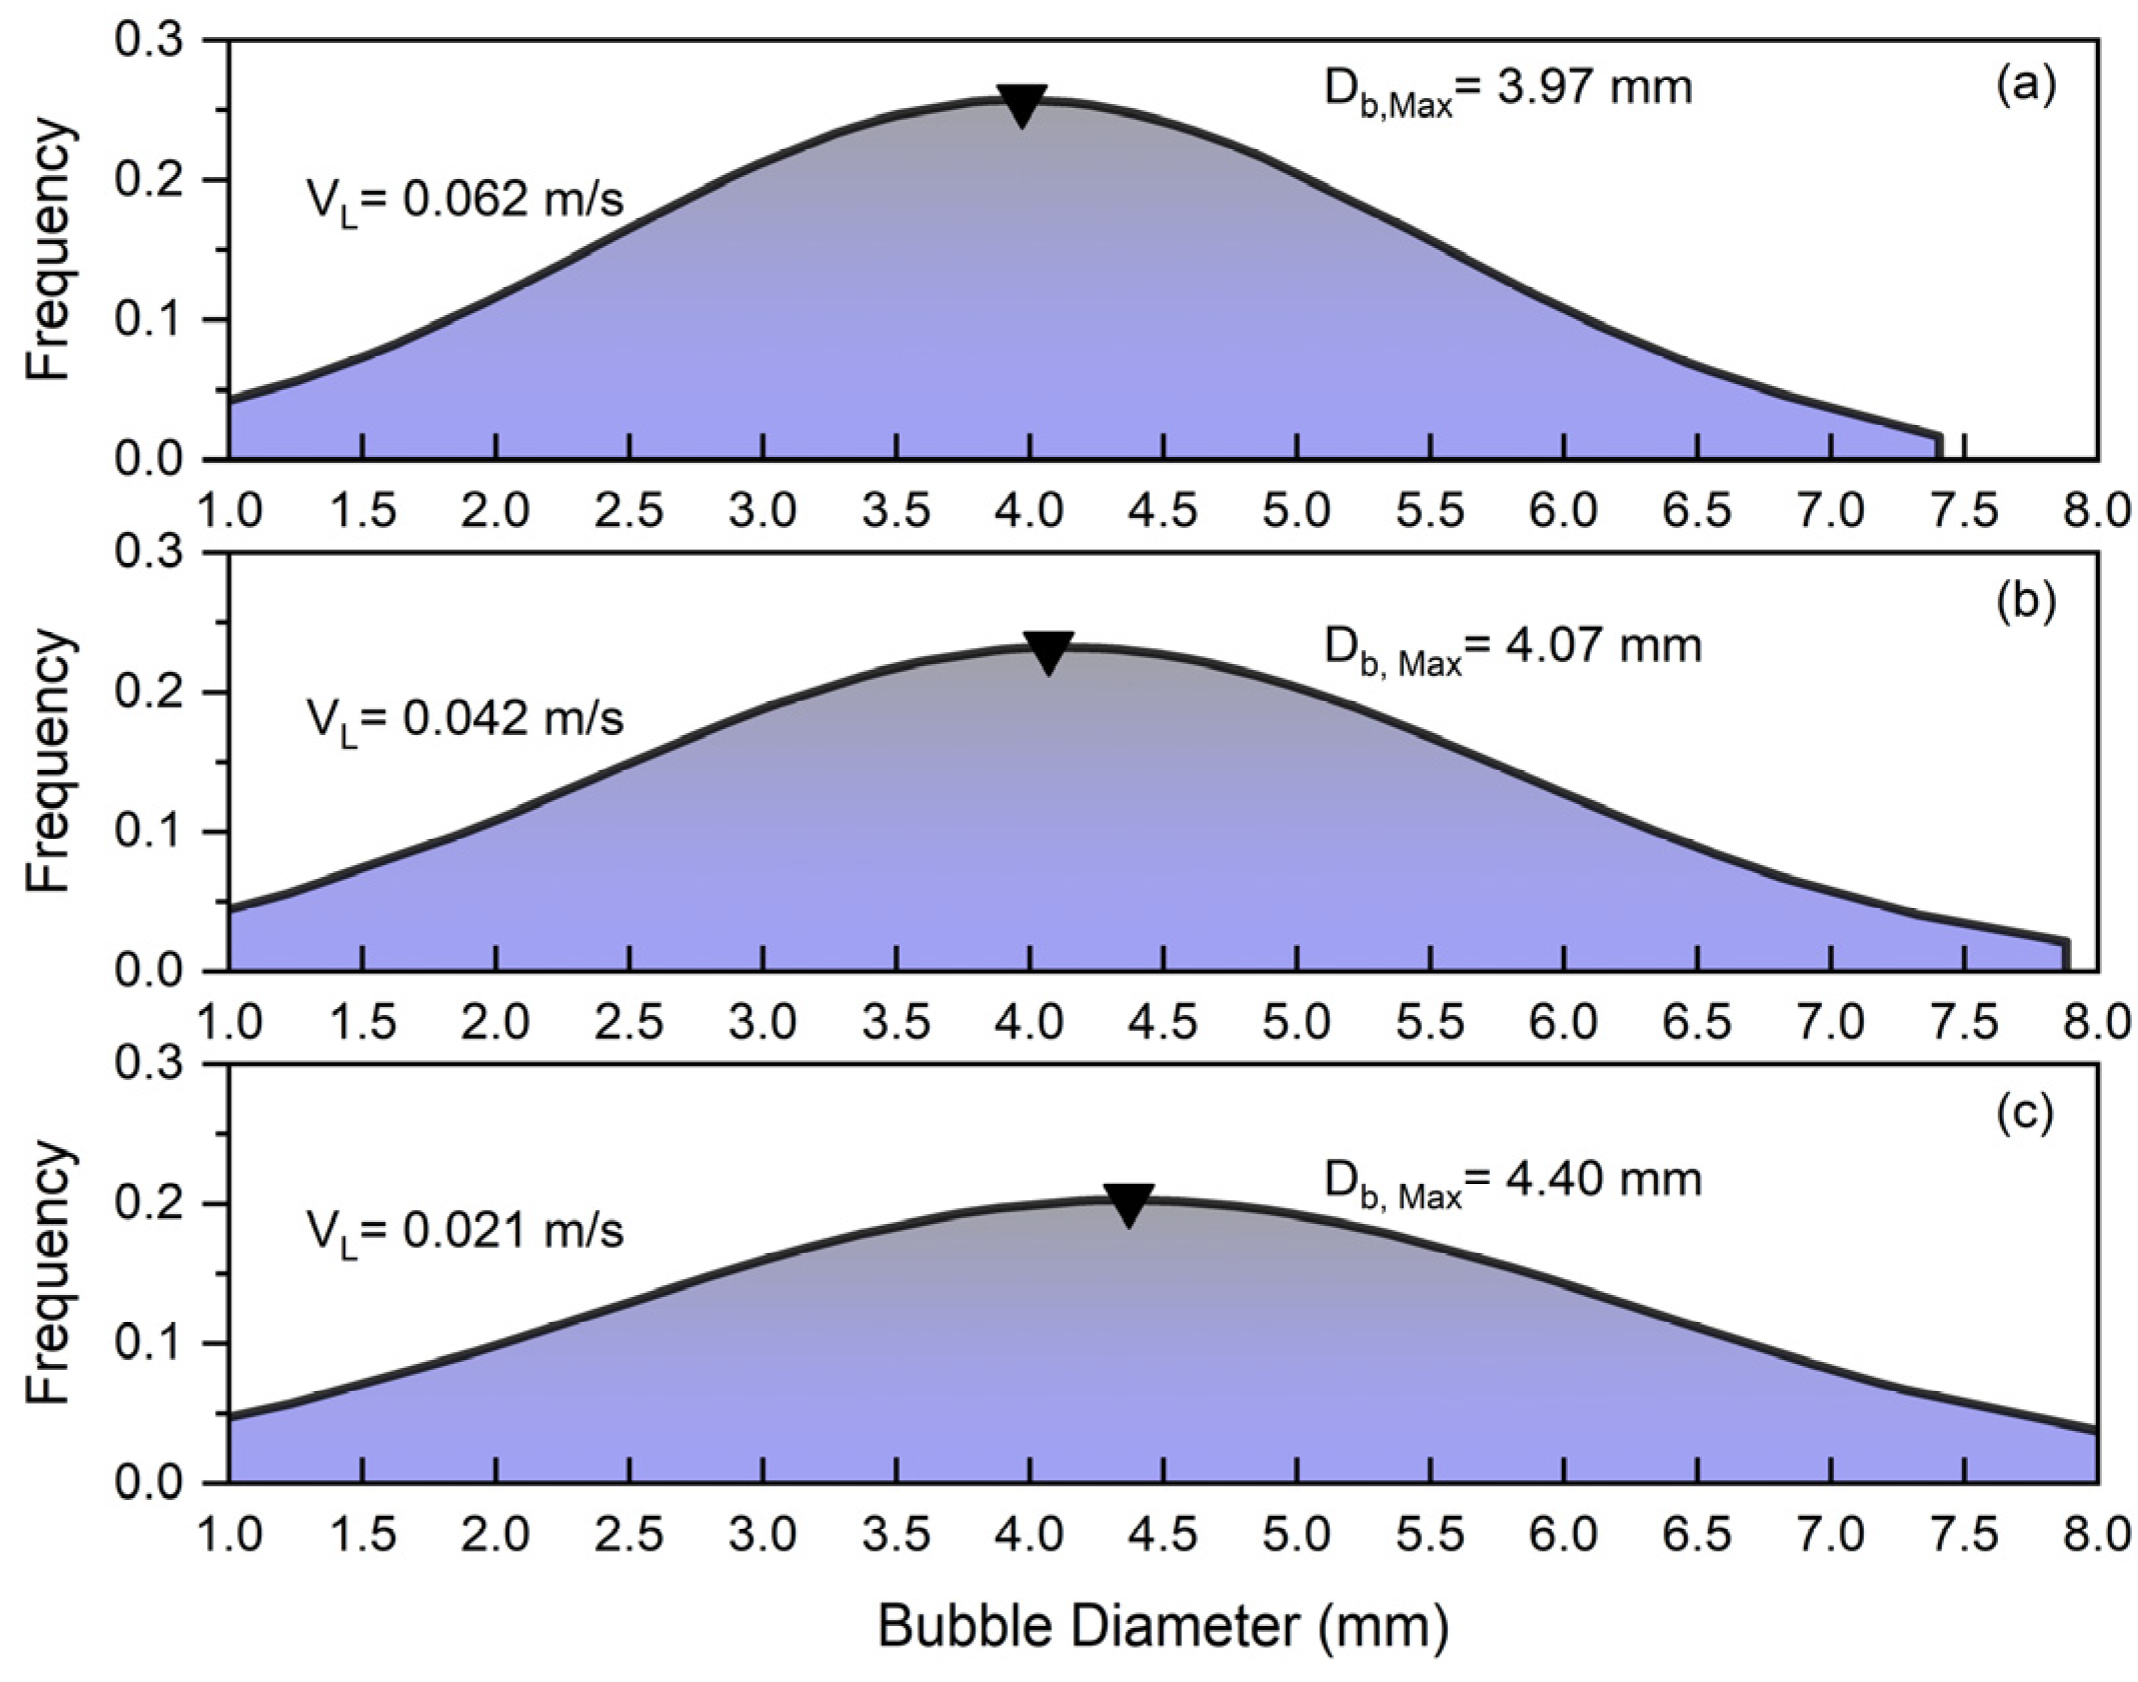
Figure 5 depicts the effects of slurry circulation () on the bubble size distribution in the counter-current slurry bubble column.
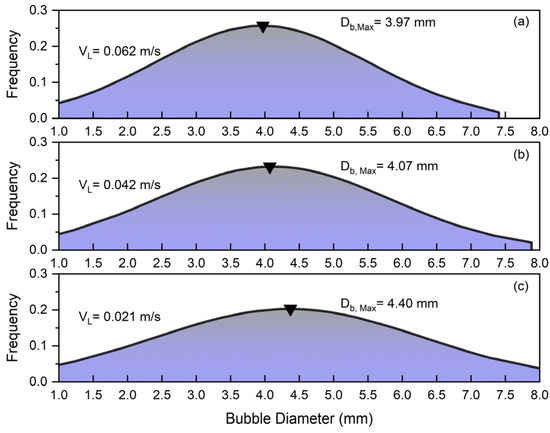
Figure 5.
Effects of slurry circulation on bubble size distribution at constant and : (a) , (b) , (c) .
Since in Figure 5 the solid concentration and superficial gas velocity are constant ( and , the alteration in BSD can be totally attributed to the superficial liquid velocity. This figure indicates that increasing the slurry circulation velocity in the slurry bubble column leads to a decrease in the average bubble size so that the peak of frequency shifts from at to at . Higher superficial slurry velocities increase turbulence within the bubble column, enhancing the shear forces acting on the bubbles. This causes larger bubbles to elongate, encourage bubble breakdown, and lower the mean bubble diameter. Additionally, the drag force exerted by the downward-moving slurry further reduces the rising velocity of the bubbles, which minimizes bubble collisions and coalescence, contributing to a narrower bubble size distribution. Consequently, higher slurry circulation by means of the mentioned mechanisms promotes the formation of smaller bubbles, which results in higher gas holdup.
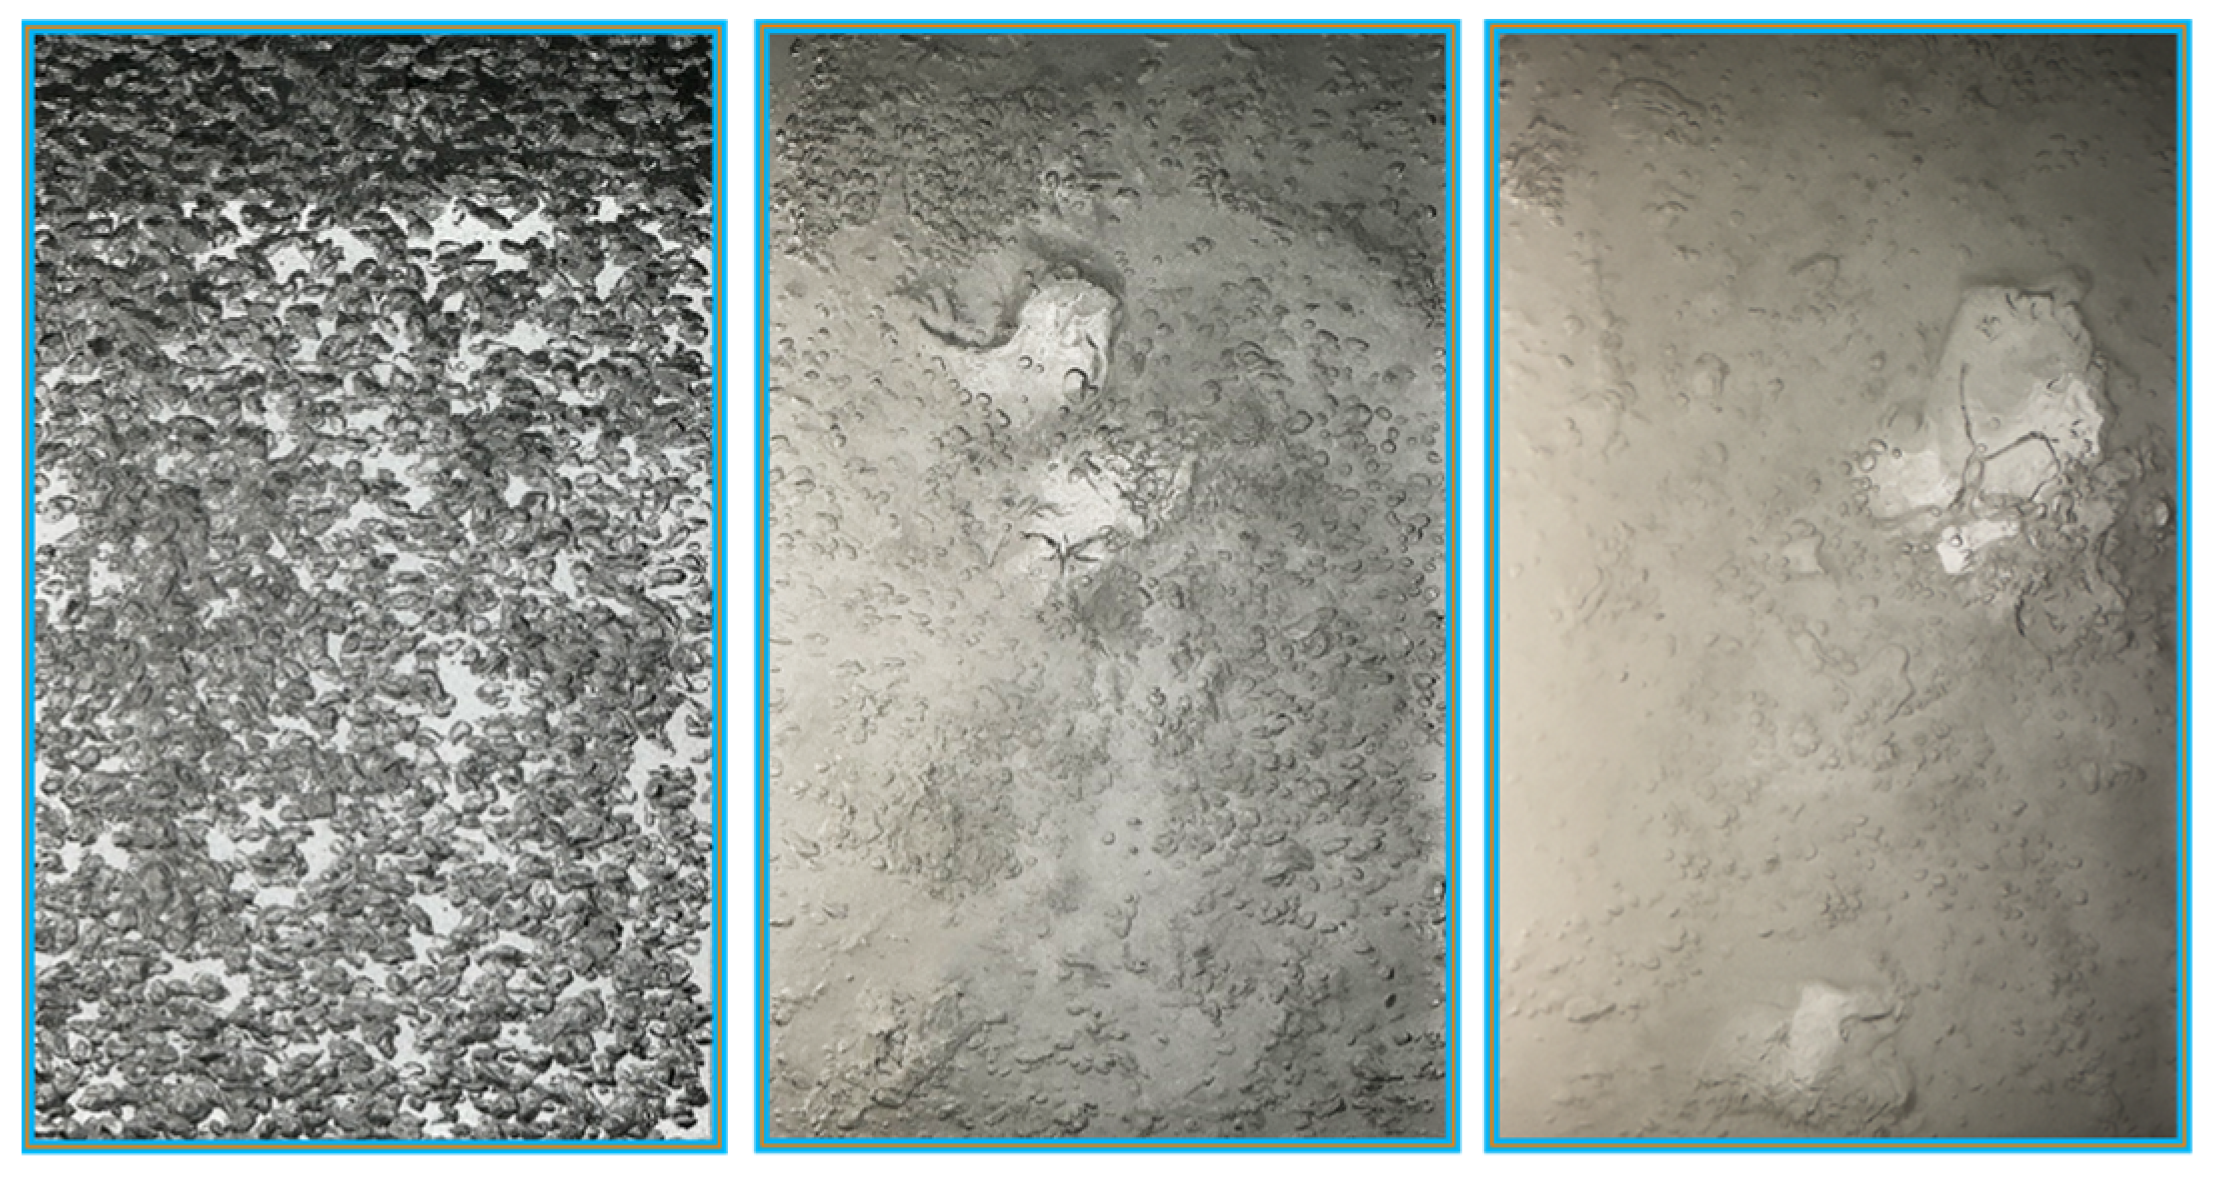
Figure 6 illustrates the impact of solid particles on bubble sizes within the system. The data indicate that the addition of solid particles promotes bubble coalescence, leading to the formation of larger bubbles. This coalescence effect is evident as the bubble size distribution curve becomes broader with the presence of solid particles. Consequently, these larger bubbles tend to escape more quickly from the liquid phase, resulting in a decrease in gas holdup. The broader distribution and increased size of the bubbles highlight the significant role that solid particles play in altering the hydrodynamics of the system, ultimately affecting the efficiency and performance of the reactor.
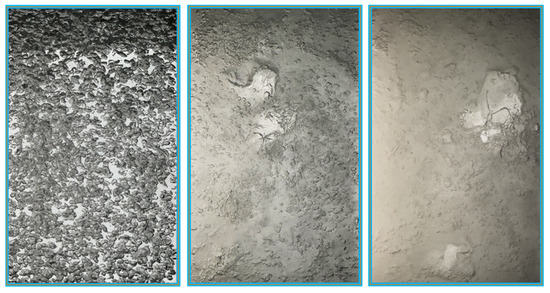
Figure 6.
Effects of solid particles on bubble size. Left: ; middle: ; right: .
4.3. Gas Holdup Prediction
The first step in determining whether the two-phase approach can be used to predict the gas holdup in a three-phase system is to formulate a correlation to predict the total gas holdup in a two-phase system running under identical conditions to our three-phase system. In the previous sections, such a correlation was developed. To determine the correlations’ constants, a two-step procedure involving nonlinear optimization and logarithmic transformation was employed. In the logarithmic transformation, a natural logarithm transformation was adopted to linearize the multiplicative model. The transformed model is as follows:
The relation between the dependent and independent variables is made simpler by this transformation, which enables us to apply linear regression techniques in the transformed space. Then, using nonlinear optimization with the help of the L-BFGS-B (Limited-memory Broyden–Fletcher–Goldfarb–Shanno with Box constraints) algorithm, a quasi-Newton method suitable for large-scale optimization problems with bound constraints, the model parameters were estimated accurately. The optimized constants that resulted from this approach are shown in Table 2.

Table 2.
Optimized parameters of Equation (8).
The following is the final suggested correlation form for gas holdup prediction in a water–air system for the range of , :
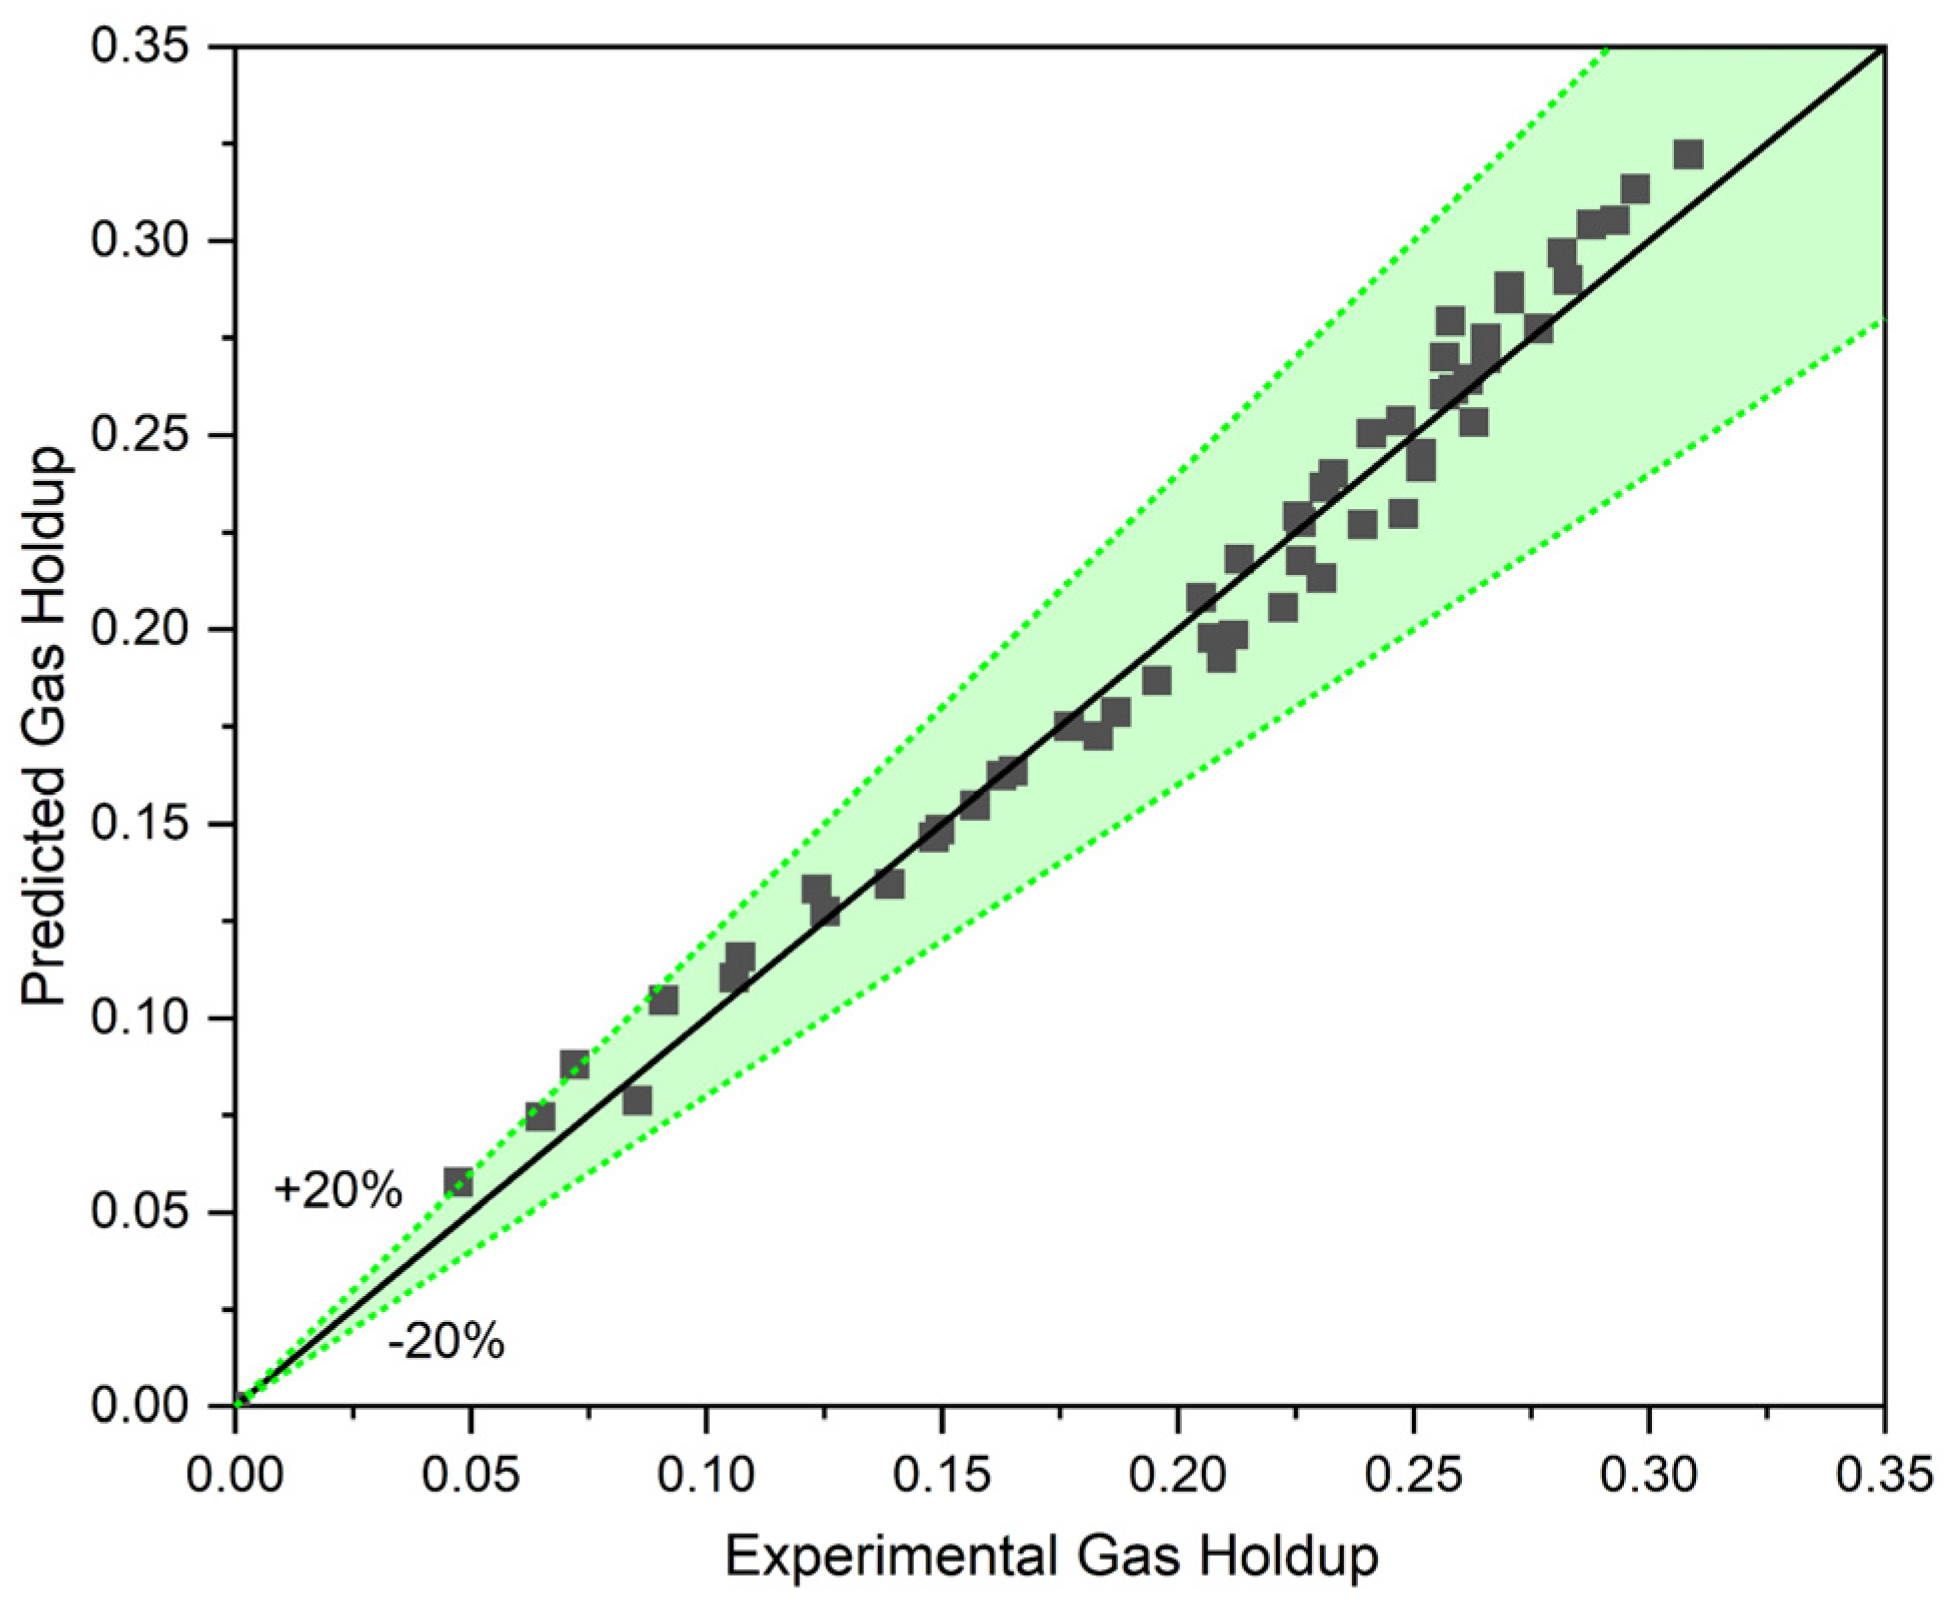
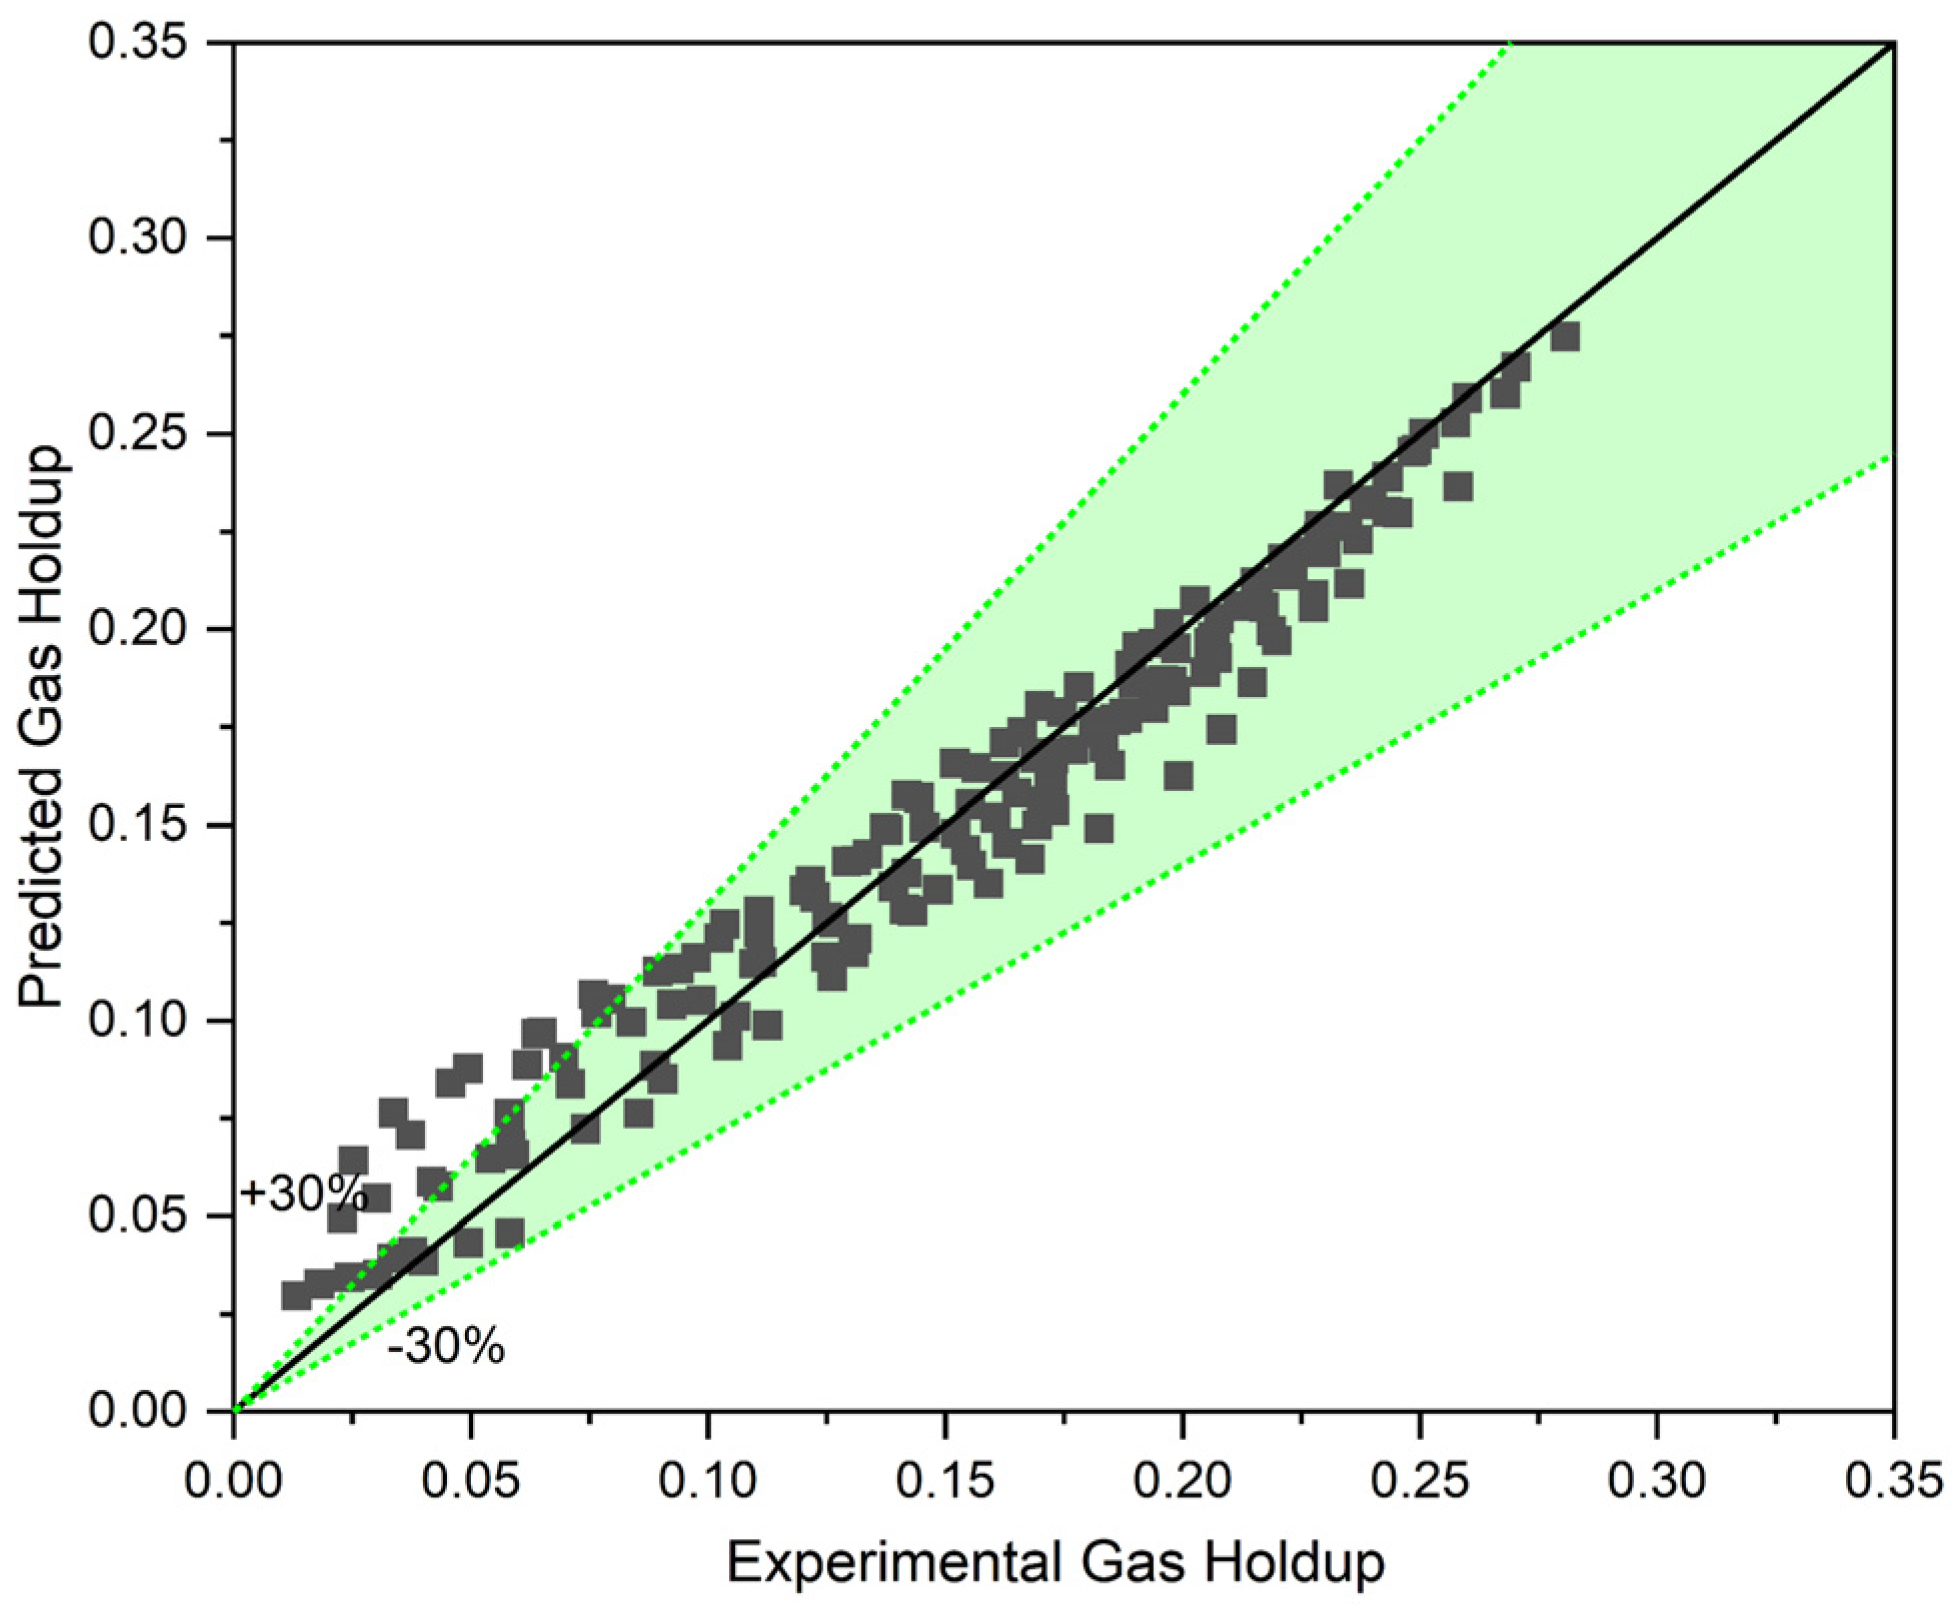
In order to evaluate the accuracy of the proposed correlation, the gas holdup of a two-phase system with liquid circulation (CCBC) was predicted using Equation (10). This evaluation was conducted with a wide range of data ( and ) to ensure its accuracy for the most critical points like transition points. As Figure 7 depicts, the proposed Equation (10) can accurately predict the gas holdup in a two-phase system with circulating liquid. The proposed equation demonstrates high accuracy at the transition point and the ranges with low superficial gas and liquid velocities.
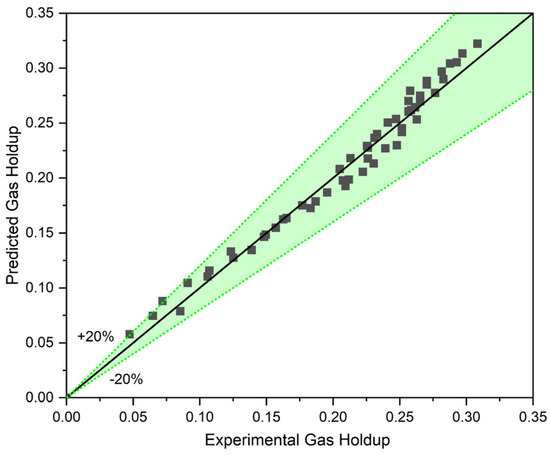
Figure 7.
The accuracy of our model in predicting the gas holdup in a two-phase system.
As mentioned in the previous sections, the two-phase approach’s main goal is to modify the viscosity and density of the continuous phase. In this work, in order to evaluate the two-phase approach’s applicability for a three-phase system, the following equations will be used to calculate the apparent viscosity and density of the three-phase system [23].
Since there is little influence from solid particles on surface tension, it was assumed that the surface tension was the same as the surface tension of a two-phase system [2,7].
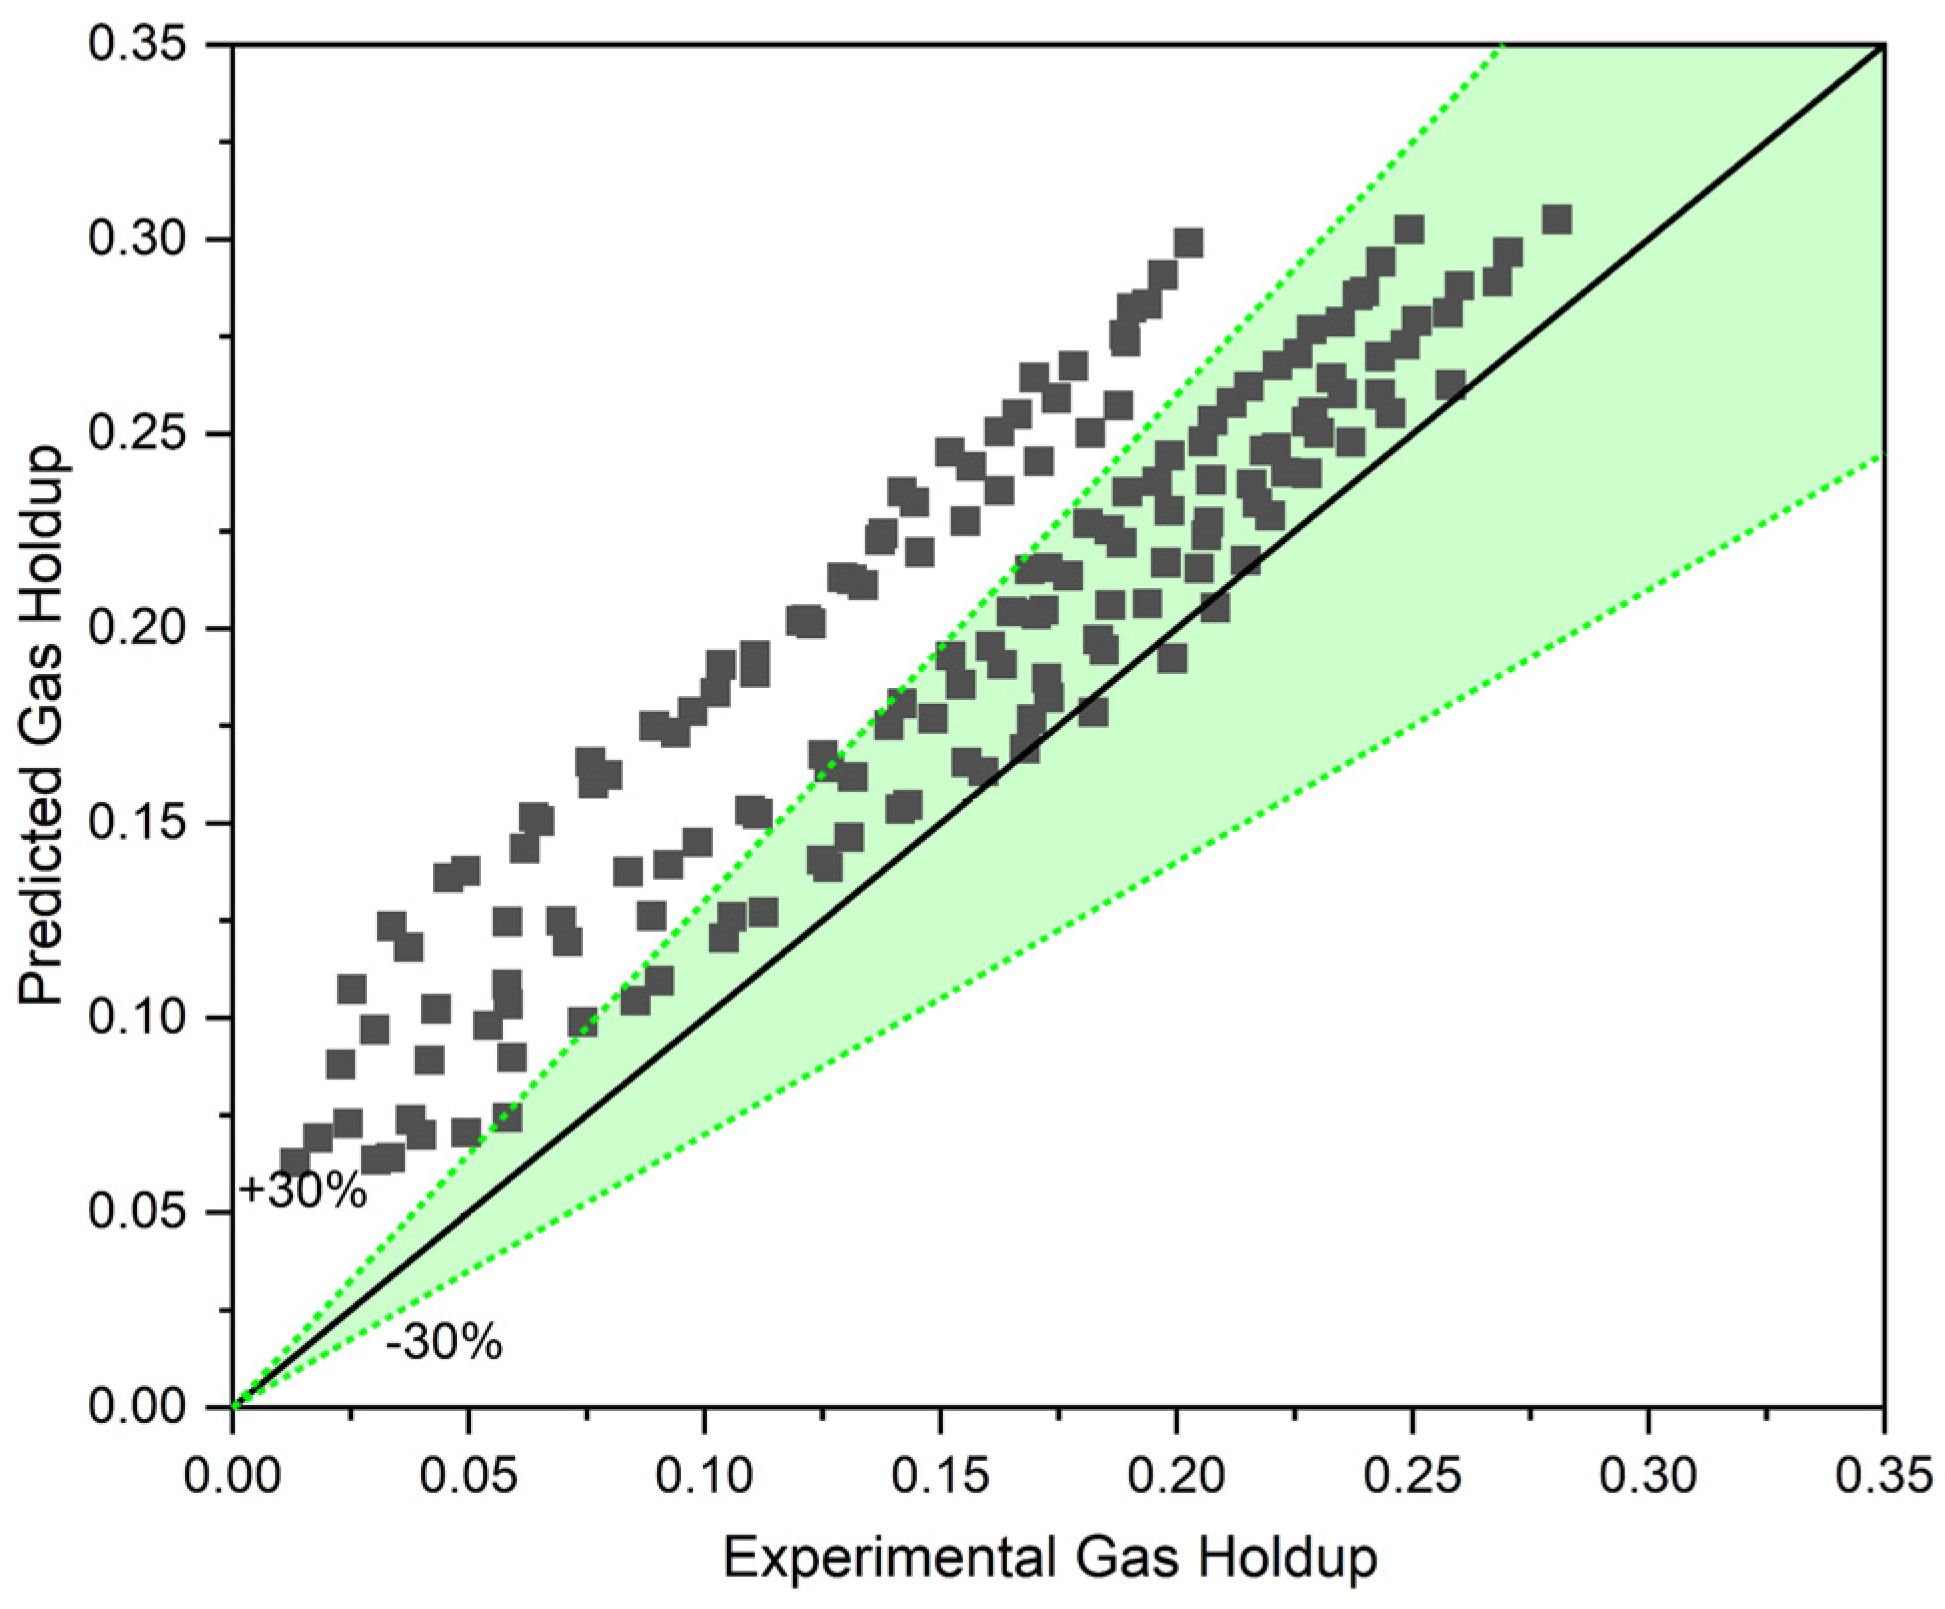
Figure 8 illustrates a comparison between the gas holdup predicted using the two-phase approach (with the help of Equations (10)–(12)) and the gas holdup measured experimentally for three different solid concentrations and three different liquid circulation rates. With an MAPE (mean absolute percentage error) of 30.14%, it is clear that the two-phase approach overestimates gas holdup.
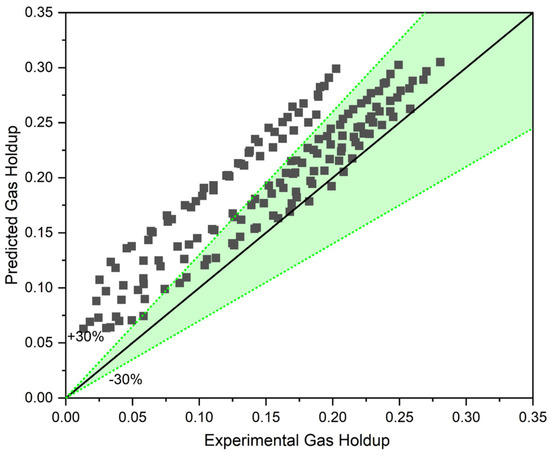
Figure 8.
Two-phase approach including apparent viscosity and density for three-phase systems.
Additionally, the predicted values for higher solid concentrations show a higher deviation compared to the experimental data. Hence, by simply modifying the liquid’s viscosity and density, gas holdup in a slurry bubble column cannot be reliably anticipated. This conclusion is consistent with what was found by [15,24]. These findings demonstrate that solid particles influence the gas–liquid system in two different ways. The first effect is a change in the liquid phase’s characteristics that leads to the creation of a new slurry phase with modified viscosity and density. The second effect, which is more significant, is the alteration in bubble size and bubble interactions which leads to a greater decrement in gas holdup than what the two-phase approach estimates. As the concentration of solid particles rise, the second effect becomes more noticeable. This is why a larger deviation in the predictions for higher solid contents is depicted by Figure 8. Consequently, a new approach like the three-phase approach is needed for the prediction of gas holdup in a three-phase system.
In the previous section, it became clear that the two-phase approach cannot predict the gas holdup in CCSBCs. Thus, the three-phase approach should be used [2,3,7,25,26,27,28]. For this aim, Lakhdissi et al. [24] proposed a new innovative approach, in which the gas holdup of a three-phase system is predicted by the modification of the gas holdup of a two-phase system with the help of collision efficiency . As the collision efficiency quantifies the number of solid particles that collide with the present bubbles based on a certain number of particles in the domain, including in gas holdup models (available for two-phase systems) can help in quantifying the effects of the presence of solid particles on SBCs’ hydrodynamics. In order to use collision efficiency to modify available two-phase models for the prediction of gas holdup in a three-phase system, Lakhdissi et al. [24] proposed
in which , , , and stand for the gas holdup in a three-phase system, the gas holdup in a two-phase system, collision efficiency, and solid concentration. They also proposed the following correlation for the calculation of collision efficiency:
Bo, Fr, and Ga stand for the Bond number, Froude number, and Galilei number, respectively. As Equation (14) shows, collision efficiency is a function of the properties of the gas and liquid phases as well as solid size. The larger size of particles gives them more inertia, which increases the likelihood that they will deviate from liquid streamlines and collide with bubbles. The concentration of solids has no effect on collision efficiency although it does affect gas holdup. In order to consider the effects of solid concentration on gas holdup, a term was added to Equation (13) that is dependent on solid concentration.
In order to evaluate the possible impacts of some of the mentioned parameters on collision efficiency, the Differential Gas Disengagement (DGD) technique was used (see Figure 9 and Figure 10). Figure 9 presents the disengagement curves of bubbles for two different solid concentrations ( and ) and three different superficial liquid velocities (, , and ).
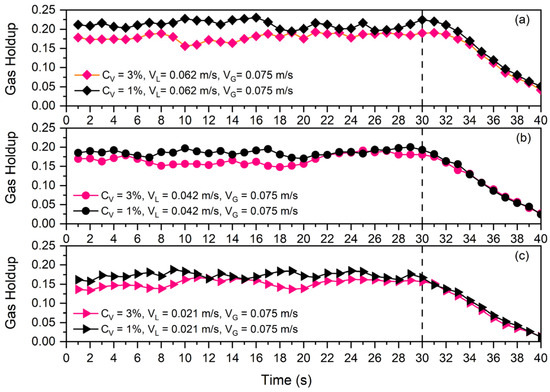
Figure 9.
Disengagement curve at and solid particles and for three different superficial liquid velocities: (a) , (b) , (c) .
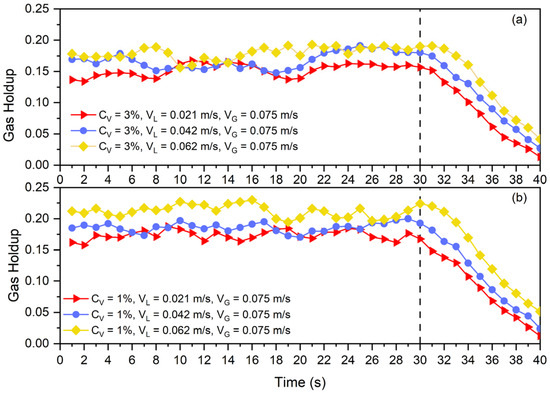
Figure 10.
Disengagement curve at (a) and (b) solid particles and constant for three different superficial liquid velocities.
As all of the curves in Figure 9 were plotted for and the only difference in each one (a, b, and c) is the solid concentration, each subfigure shows the effects of solid concentration on the time needed for bubbles to leave the slurry phase. Since the rate of disengagement is nearly constant across all scenarios, the solid concentration has no impact on collision efficiency. For example, in Figure 9a, the gas holdup of the system at in the presence of of solid particles is higher than that of , while after gas shut off at , the gas holdup decrement rate in both cases is almost the same. This indicates that a greater particle count in the continuous phase was unable to stop the bubbles from escaping the slurry phase.
In the counter-current slurry bubble columns, the liquid circulation rate is one of the main parameters affecting column performance. So as to assess the liquid circulation rate’s effects on collision efficiency, the gas disengagement curve was also replotted in Figure 10. In Figure 10a,b, it is clearly visible that liquid circulation can delay the disengagement of the bubble from the slurry phase. Higher liquid circulation, as was discussed in the previous section, by means of decreasing the average bubble size and suppressing bubble rise, can impact collision efficiency. By the mentioned mechanisms, other parameters like superficial gas velocity, particle size, particle density, and fluid properties can alter collision efficiency. Therefore, these findings are aligned with Equation (14) for the prediction of gas holdup in a three-phase system using the gas holdup of a two-phase system.
To assess the accuracy of Equation (13) for our experimental gas holdup data in a three-phase system, gas holdup was initially predicted using our correlation (Equation (10)). Then, gas holdup was corrected with Equation (13). Figure 11 compares the predicted values and the experimental value of gas holdup in a counter-current three-phase system (for all the data sets).
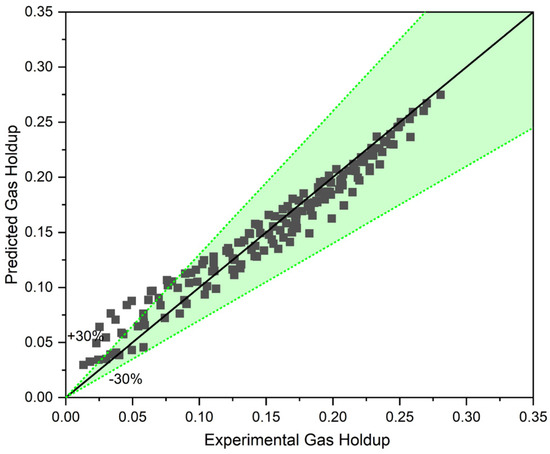
Figure 11.
The three-phase approach with the help of the proposed model for three-phase reactors.
This approach is promising and, as Figure 11 shows, can almost accurately predict the gas holdup of a three-phase system based on a two-phase model. For the superficial gas velocity in the range of , the model exhibits the highest deviation from the experimental values, while for , the model predicts gas holdup with less than margin error. The uneven dispersion of the solid phase within the column, and particularly around the bubbles that are already there, is the cause of this variation. In actuality, the solid concentration surrounding the bubbles is not equal to the that is used in the model at low gas surface velocities. Naturally, the local solid concentration rises at the middle of the column where the sensor legs are positioned by raising the superficial gas velocity, and in the heterogeneous flow regime, this is expected to approach the uniform . Thus, the existence of the local solid distribution function can further increase the model’s accuracy and applicability.
5. Conclusions
Using air, water, and glass beads as the gas, liquid, and solid phases, respectively, this research demonstrates that solid particle concentration significantly impacts gas holdup and the flow regime, whereas the liquid circulation rate has a minor effect. This study’s photographic techniques demonstrate that higher superficial gas velocities shift the bubble size distribution from small, uniformly sized bubbles to a broader range of sizes due to increased turbulence and bubble coalescence. For instance, increasing the superficial gas velocity from 0.016 m/s to 0.08 m/s, at a solid content of 1% and a superficial slurry velocity of 0.062 m/s, shifted the peak bubble size from 3.97 mm to 4.87 mm. Additionally, the results indicate that, regardless of the liquid circulation rate, adding solid particles generally reduces gas holdup. This reduction is attributed to the slurry phase’s increased density and viscosity, which alter the flow structure and encourage bubble coalescence. Even at low superficial gas velocities, higher solid concentrations lead to more bubble–particle collisions, enhancing bubble coalescence and promoting a heterogeneous flow regime. For instance, at a superficial gas velocity of 0.08 m/s and a superficial slurry velocity of 0.062 m/s, increasing the solid content from 0% to 6% resulted in a decrease in gas holdup from 0.23 to 0.13.
Our detailed analysis of single bubbles shows that higher slurry circulation velocities result in smaller average bubble diameters due to elevated turbulence and shear forces, which increase bubble breakup. Additionally, the downward drag force exerted by the slurry phase reduces the rising velocity of bubbles, minimizing collisions and coalescence. Consequently, higher liquid circulation rates lead to smaller average bubble sizes, higher gas holdup through a more compact bubble arrangement, and earlier flow regime transitions due to increased turbulence. For instance, at a solid content of 3% and a superficial gas velocity of 0.05 m/s, increasing the superficial slurry velocity from 0.021 m/s to 0.062 m/s resulted in an increase in gas holdup from 0.11 to 0.16.
To accurately study gas holdup in a three-phase system, this research indicates that existing models cannot adequately describe gas holdup in a CCSBC. Therefore, new models and approaches specific to three-phase systems should be developed. Although Lakhdissi’s method accurately predicts gas holdup in three-phase columns, its precision for CCSBCs can be enhanced by developing collision efficiency models tailored specifically for CCSBCs. The new correlation should account for the turbulence generated by the interaction of circulating liquid and the solid phase and its effects on collision efficiency.
Future studies should focus on how various solid particle characteristics, such as size, shape, and wettability, affect CCSBC hydrodynamics. Research on the effects of different liquid properties, such as viscosity and surface tension, in combination with solid loading and liquid circulation, could deepen our understanding of CCSBCs. Additionally, developing and validating computational fluid dynamic (CFD) models that incorporate these parameters would significantly optimize the performance of large-scale industrial slurry bubble columns.
Author Contributions
Conceptualization, S.M. and M.W.H.; methodology, S.M.; software, S.M.; validation, S.M.; formal analysis, S.M. and M.W.H.; investigation, S.M.; resources, M.W.H.; data curation, S.M.; writing—original draft preparation, S.M.; writing—review and editing, S.M. and M.W.H.; visualization, S.M.; supervision, M.W.H.; project administration, M.W.H.; funding acquisition, M.W.H. All authors have read and agreed to the published version of the manuscript.
Funding
Supported by Johannes Kepler University Open Access Publishing Fund. This research was funded in whole or in part by the Austrian Science Fund (FWF) [P 37055-N].
Data Availability Statement
The original contributions presented in this study are included in the article. Further inquiries can be directed to the corresponding authors.
Conflicts of Interest
The authors declare no conflict of interest.
Nomenclature
| Symbols | |
| Bond number, | |
| Concentration, | |
| Column equivalent diameter, | |
| Bubble equivalent diameter, | |
| Solid particle diameter, | |
| Largest bubble diameter, | |
| Smallest bubble diameter, | |
| Collision efficiency | |
| Froude number, | |
| Galilei number, | |
| Gravitational acceleration, | |
| Pressure, | |
| Reynolds number, | |
| Stokes number, | |
| Superficial liquid velocity, | |
| Superficial slurry velocity, , | |
| Superficial gas velocity, | |
| Bubble rising velocity, | |
| Weber number, | |
| Subscripts | |
| b | Bubble |
| c-GSE | Generalized Sutherland equation |
| c-SU | Sutherland model |
| G | Gas |
| L | Liquid |
| P | Particle |
| S | Solid |
| SL | Slurry |
| Two-phase | |
| Three-phase | |
| Greek symbols | |
| Viscosity, | |
| Density, | |
| Holdup | |
| Surface tension, | |
| Height difference, | |
| Pressure difference, |
References
- Bahrami, M.; Mahmoudi, S.; Hamoule, T.; Aghajani, M. Hydroconversion of n-Heptane over bifunctional Pt–Ti–MSU/Al–Ti–MSU catalysts in a micro reactor. Pet. Chem. 2021, 61, 455–464. [Google Scholar] [CrossRef]
- Besagni, G.; Inzoli, F.; Ziegenhein, T. Two-phase bubble columns: A comprehensive review. ChemEngineering 2018, 2, 13. [Google Scholar] [CrossRef]
- Trivedi, R.; Renganathan, T.; Krishnaiah, K. Hydrodynamics of countercurrent bubble column: Experiments and predictions. Chem. Eng. J. 2018, 338, 636–650. [Google Scholar] [CrossRef]
- An, M.; Gao, J.; Wang, T.; Li, X. Particle effects on the hydrodynamics in slurry bubble column reactors: A review from multiscale mechanisms. Particuology 2024, 91, 176–189. [Google Scholar] [CrossRef]
- Mahmoudi, S.; Hlawitschka, M.W. Effect of solid particles on the slurry bubble columns behavior—A review. ChemBioEng Rev. 2022, 9, 63–92. [Google Scholar] [CrossRef]
- Abdulrahman, M.W. Effect of solid particles on gas holdup in a slurry bubble column. In Proceedings of the 6th World Congress on Mechanical, Chemical, and Material Engineering (MCM 2020), Prague, Czech Republic, 16–18 August 2020; Avestia Publishing: Orléans, ON, Canada, 2020. [Google Scholar]
- Besagni, G.; Di Pasquali, A.; Gallazzini, L.; Gottardi, E.; Colombo, L.P.M.; Inzoli, F. The effect of aspect ratio in counter-current gas-liquid bubble columns: Experimental results and gas holdup correlations. Int. J. Multiph. Flow 2017, 94, 53–78. [Google Scholar] [CrossRef]
- Mahmoudi, S.; Saeedipour, M.; Hlawitschka, M.W. Bubble dynamics under the influence of the Marangoni force induced by a stratified field of contamination. Exp. Comput. Multiph. Flow 2024, 6, 353–364. [Google Scholar] [CrossRef]
- Prakash, R.; Bhattacharyya, A.; Majumder, S.K. Experimental investigation and its analysis of gas holdup in a three-phase counter-current microstructured bubble column. J. Dispers. Sci. Technol. 2022, 43, 243–258. [Google Scholar] [CrossRef]
- Kumar, S.; Kumar, R.A.; Munshi, P.; Khanna, A. Gas hold-up in three phase co-current bubble columns. Procedia Eng. 2012, 42, 782–794. [Google Scholar] [CrossRef]
- Li, W.; Zhou, G.; Sun, J.; Guo, Y.; Wang, R. Impacts of particle properties on gas holdup under four flow regimes in three-phase bubble columns. Chem. Eng. Technol. 2021, 44, 2347–2354. [Google Scholar] [CrossRef]
- Sommerfeld, M. Bubbly Flows: Analysis, Modelling and Calculation; Springer Science & Business Media: Berlin/Heidelberg, Germany, 2012. [Google Scholar]
- Wu, Y.; Liu, Z.; Wang, F.; Li, B.; Gan, Y. Experimental investigation of trajectories, velocities and size distributions of bubbles in a continuous-casting mold. Powder Technol. 2021, 387, 325–335. [Google Scholar] [CrossRef]
- Krishna, R.; Urseanu, M.I.; De Swart, J.W.A.; Ellenberger, J. Gas hold-up in bubble columns: Operation with concentrated slurries versus high viscosity liquid. Can. J. Chem. Eng. 2000, 78, 442–448. [Google Scholar] [CrossRef]
- Rabha, S.; Schubert, M.; Hampel, U. Regime transition in viscous and pseudo viscous systems: A comparative study. AIChE J. 2014, 60, 3079–3090. [Google Scholar] [CrossRef]
- Li, H.; Prakash, A. Influence of slurry concentrations on bubble population and their rise velocities in a three-phase slurry bubble column. Powder Technol. 2000, 113, 158–167. [Google Scholar] [CrossRef]
- Mokhtari, M.; Chaouki, J. Effect of solid loading and particle size on the phase holdup distribution and bubble behaviour in a pilot-scale slurry bubble column. Chem. Eng. Sci. 2021, 243, 116732. [Google Scholar] [CrossRef]
- Rabha, S.; Schubert, M.; Hampel, U. Intrinsic flow behavior in a slurry bubble column: A study on the effect of particle size. Chem. Eng. Sci. 2013, 93, 401–411. [Google Scholar] [CrossRef]
- Dai, Z.; Fornasiero, D.; Ralston, J. Particle-bubble collision models-a review. Adv. Colloid Interface Sci. 2000, 85, 231–256. [Google Scholar] [CrossRef]
- Kantarci, N.; Borak, F.; Ulgen, K.O. Bubble column reactors. Process Biochem. 2005, 40, 2263–2283. [Google Scholar] [CrossRef]
- Behkish, A.; Lemoine, R.; Sehabiague, L.; Oukaci, R.; Morsi, B.I. Gas holdup and bubble size behavior in a large-scale slurry bubble column reactor operating with an organic liquid under elevated pressures and temperatures. Chem. Eng. J. 2007, 128, 69–84. [Google Scholar] [CrossRef]
- Schindelin, J.; Arganda-Carreras, I.; Frise, E.; Kaynig, V.; Longair, M.; Pietzsch, T.; Preibisch, S.; Rueden, C.; Saalfeld, S.; Schmid, B. Fiji: An open-source platform for biological-image analysis. Nat. Methods 2012, 9, 676–682. [Google Scholar] [CrossRef] [PubMed]
- Saxena, S.C.; Chen, Z.D. Hydrodynamics and heat transfer of baffled and unbaffled slurry bubble columns. Rev. Chem. Eng. 1994, 10, 193–400. [Google Scholar]
- Lakhdissi, E.M.; Soleimani, I.; Guy, C.; Chaouki, J. Simultaneous effect of particle size and solid concentration on the hydrodynamics of slurry bubble column reactors. AIChE J. 2020, 66, e16813. [Google Scholar] [CrossRef]
- Jin, H.; Yang, S.; He, G.; Wang, M.; Williams, R.A. The effect of gas-liquid counter-current operation on gas hold-up in bubble columns using electrical resistance tomography. J. Chem. Technol. Biotechnol. 2010, 85, 1278–1283. [Google Scholar] [CrossRef]
- Prakash, R.; Majumder, S.K. Effect of particle size and concentration on bubble size distribution and aspect ratio in a counter-current microstructured bubble column. J. Ind. Eng. Chem. 2020, 90, 105–116. [Google Scholar] [CrossRef]
- Prakash, R.; Majumder, S.K.; Singh, A. Dispersion characteristics in a counter-current microstructured slurry bubble column and its analysis based on the turbulence and circulation. Ind. Eng. Chem. Res. 2020, 59, 8093–8111. [Google Scholar] [CrossRef]
- Shah, M.; Kiss, A.A.; Zondervan, E.; van der Schaaf, J.; de Haan, A.B. Gas Holdup, axial dispersion, and mass transfer studies in bubble columns. Ind. Eng. Chem. Res. 2012, 51, 14268–14278. [Google Scholar] [CrossRef]
Disclaimer/Publisher’s Note: The statements, opinions and data contained in all publications are solely those of the individual author(s) and contributor(s) and not of MDPI and/or the editor(s). MDPI and/or the editor(s) disclaim responsibility for any injury to people or property resulting from any ideas, methods, instructions or products referred to in the content. |
© 2025 by the authors. Licensee MDPI, Basel, Switzerland. This article is an open access article distributed under the terms and conditions of the Creative Commons Attribution (CC BY) license (https://creativecommons.org/licenses/by/4.0/).

