


Vaporization Dynamics of a Volatile Liquid Jet on a Heated Bubbling Fluidized Bed †


Abstract
1. Introduction
2. Experimental
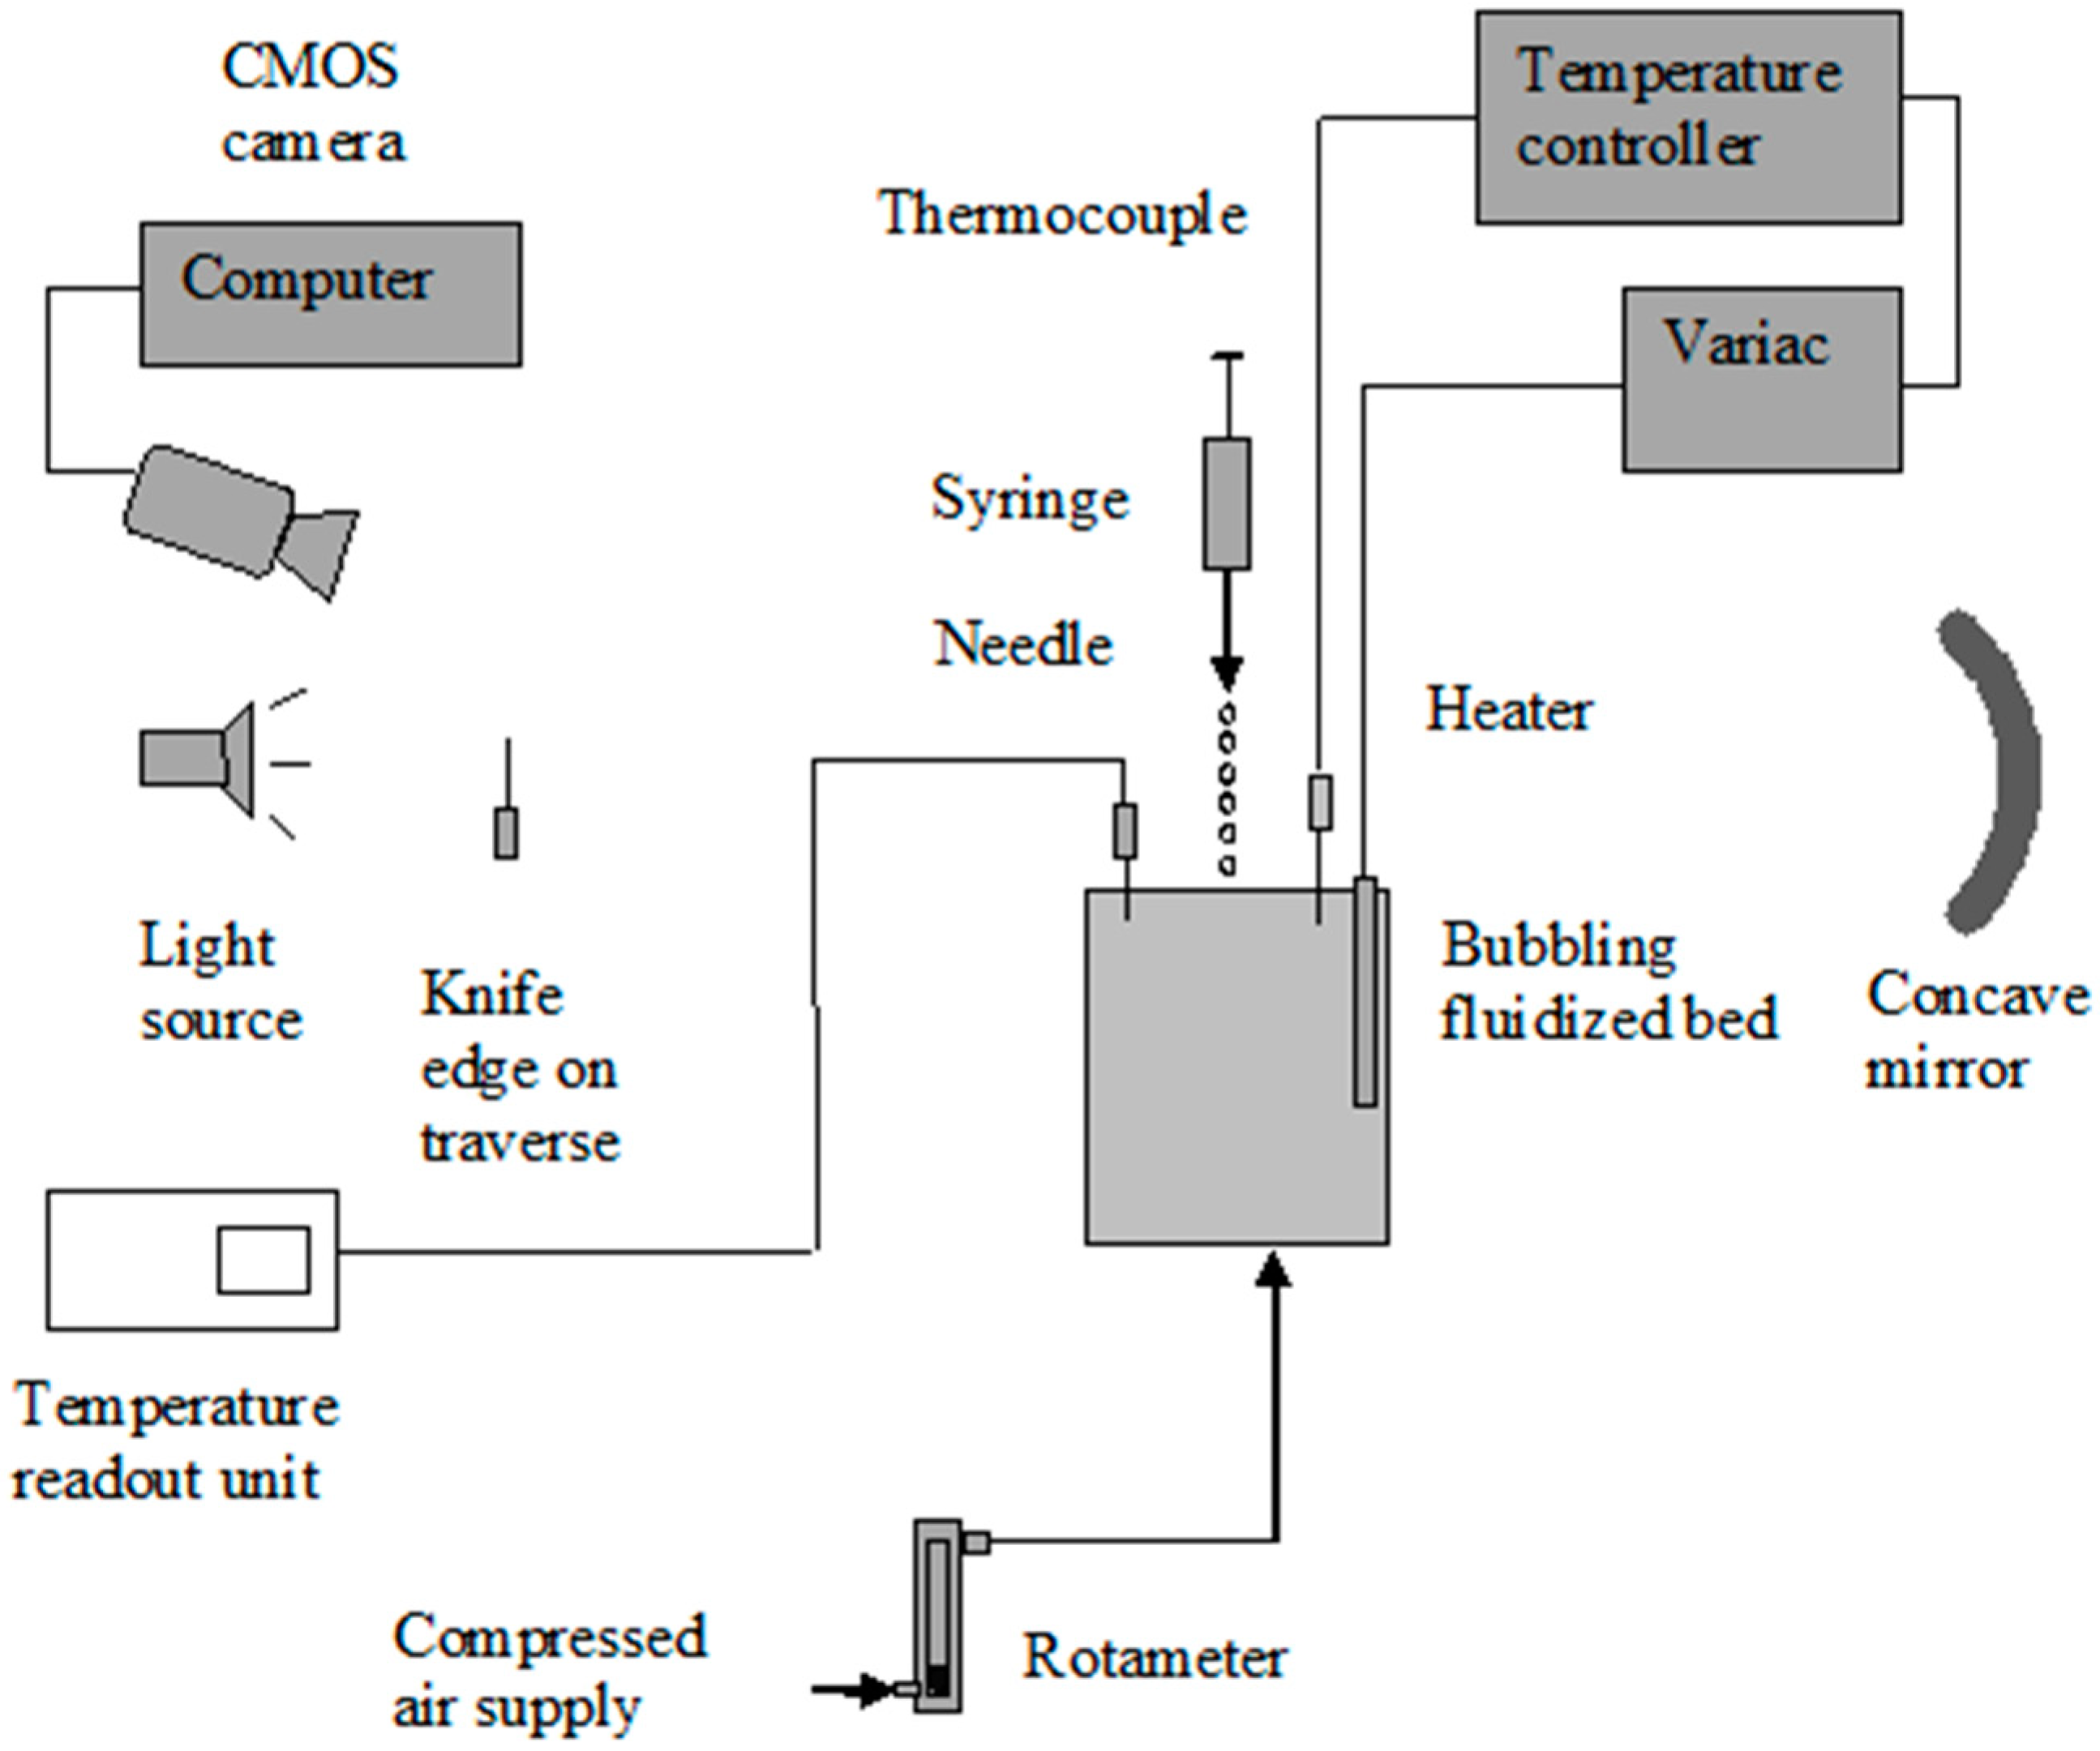
2.1. Apparatus
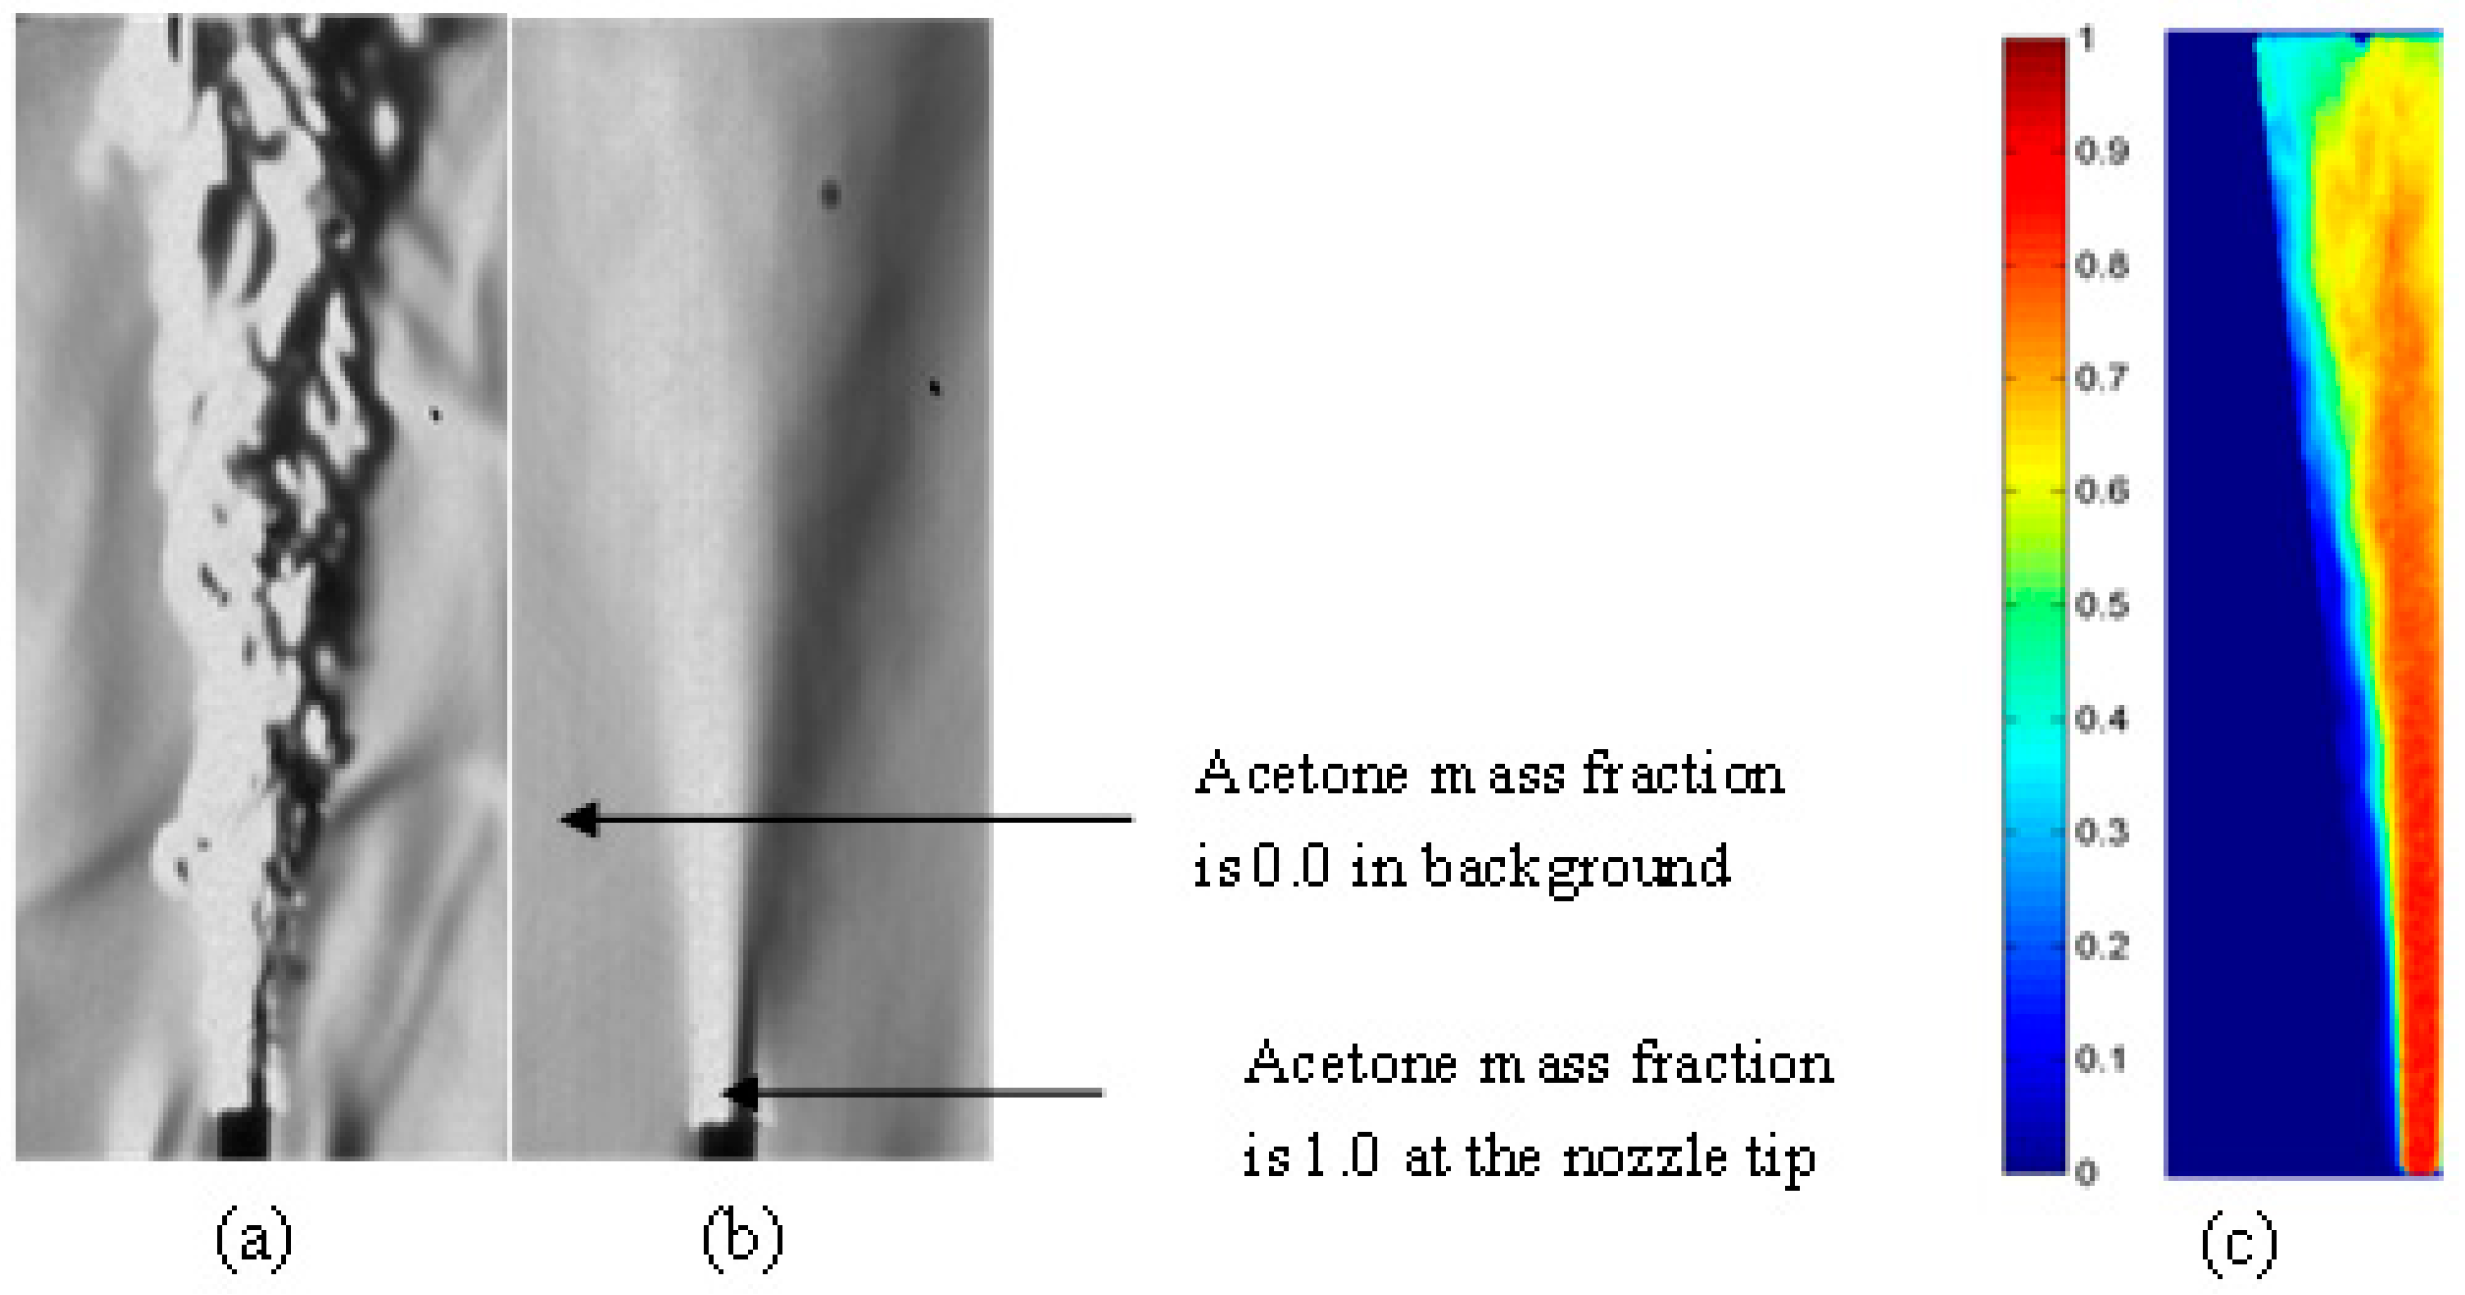
2.2. Image Processing Methodology
3. Computational Model
3.1. Governing Equations
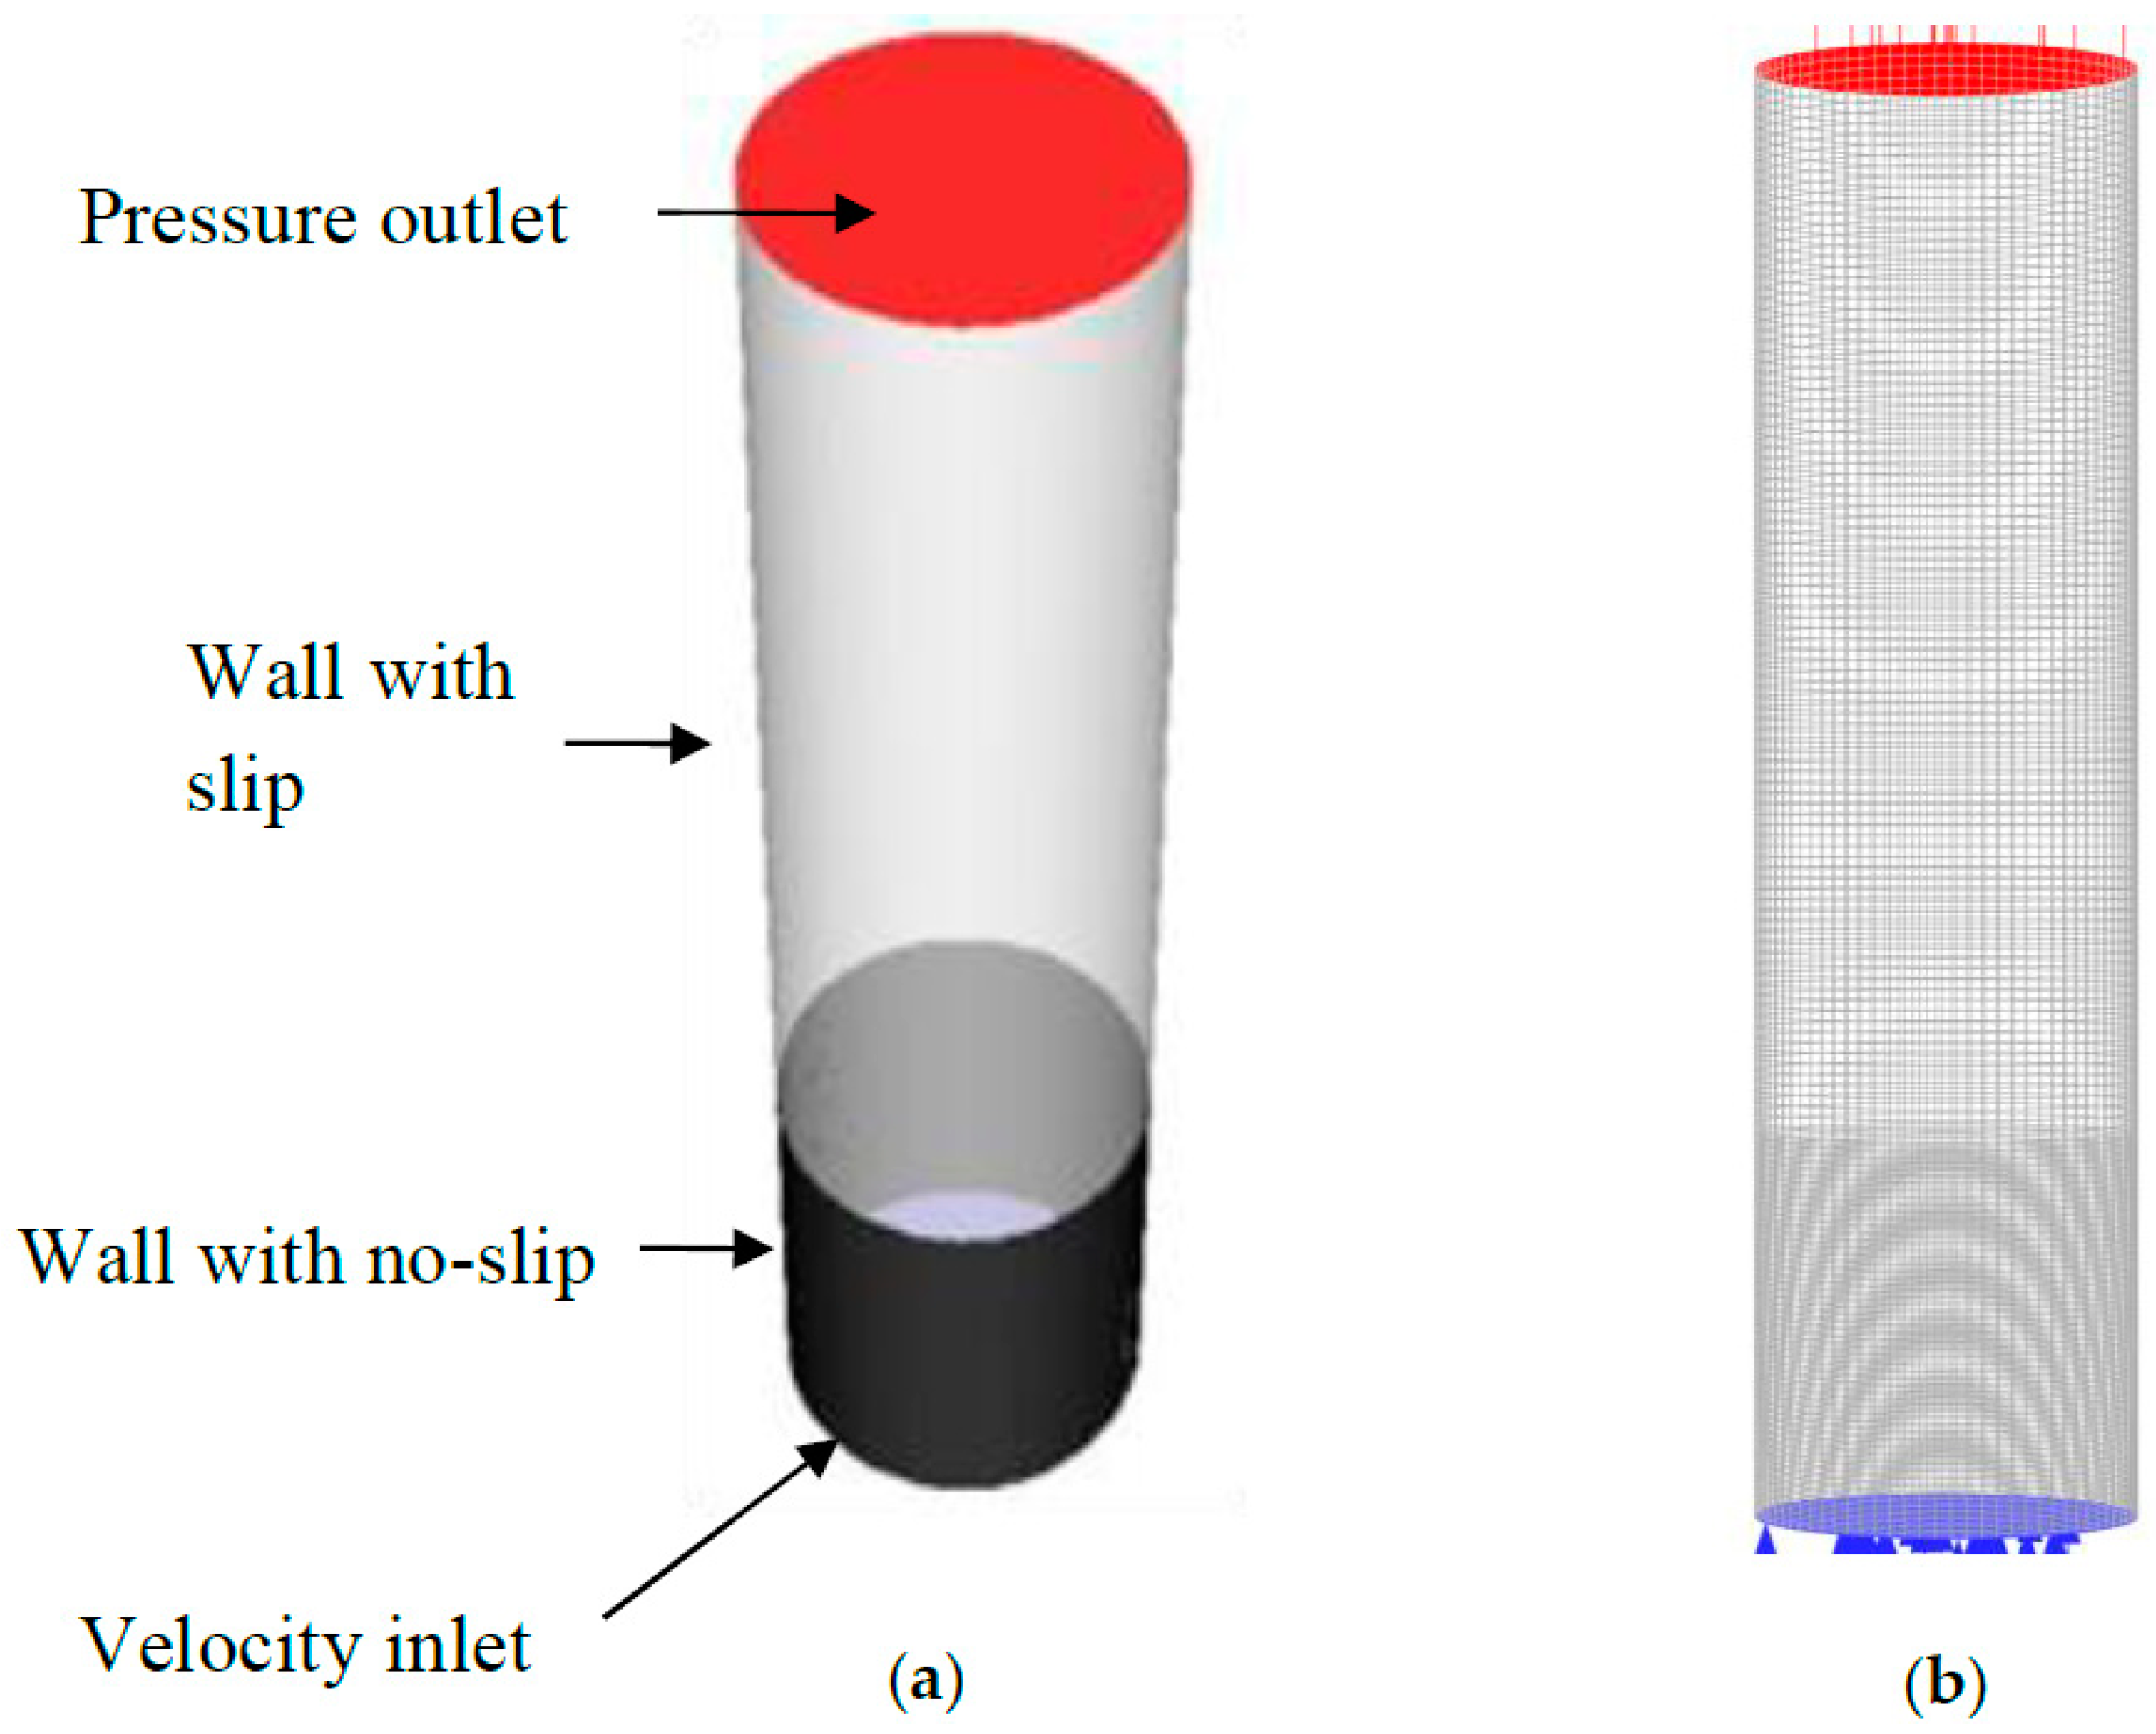
3.2. Mesh and Boundary Conditions
4. Results and Discussion
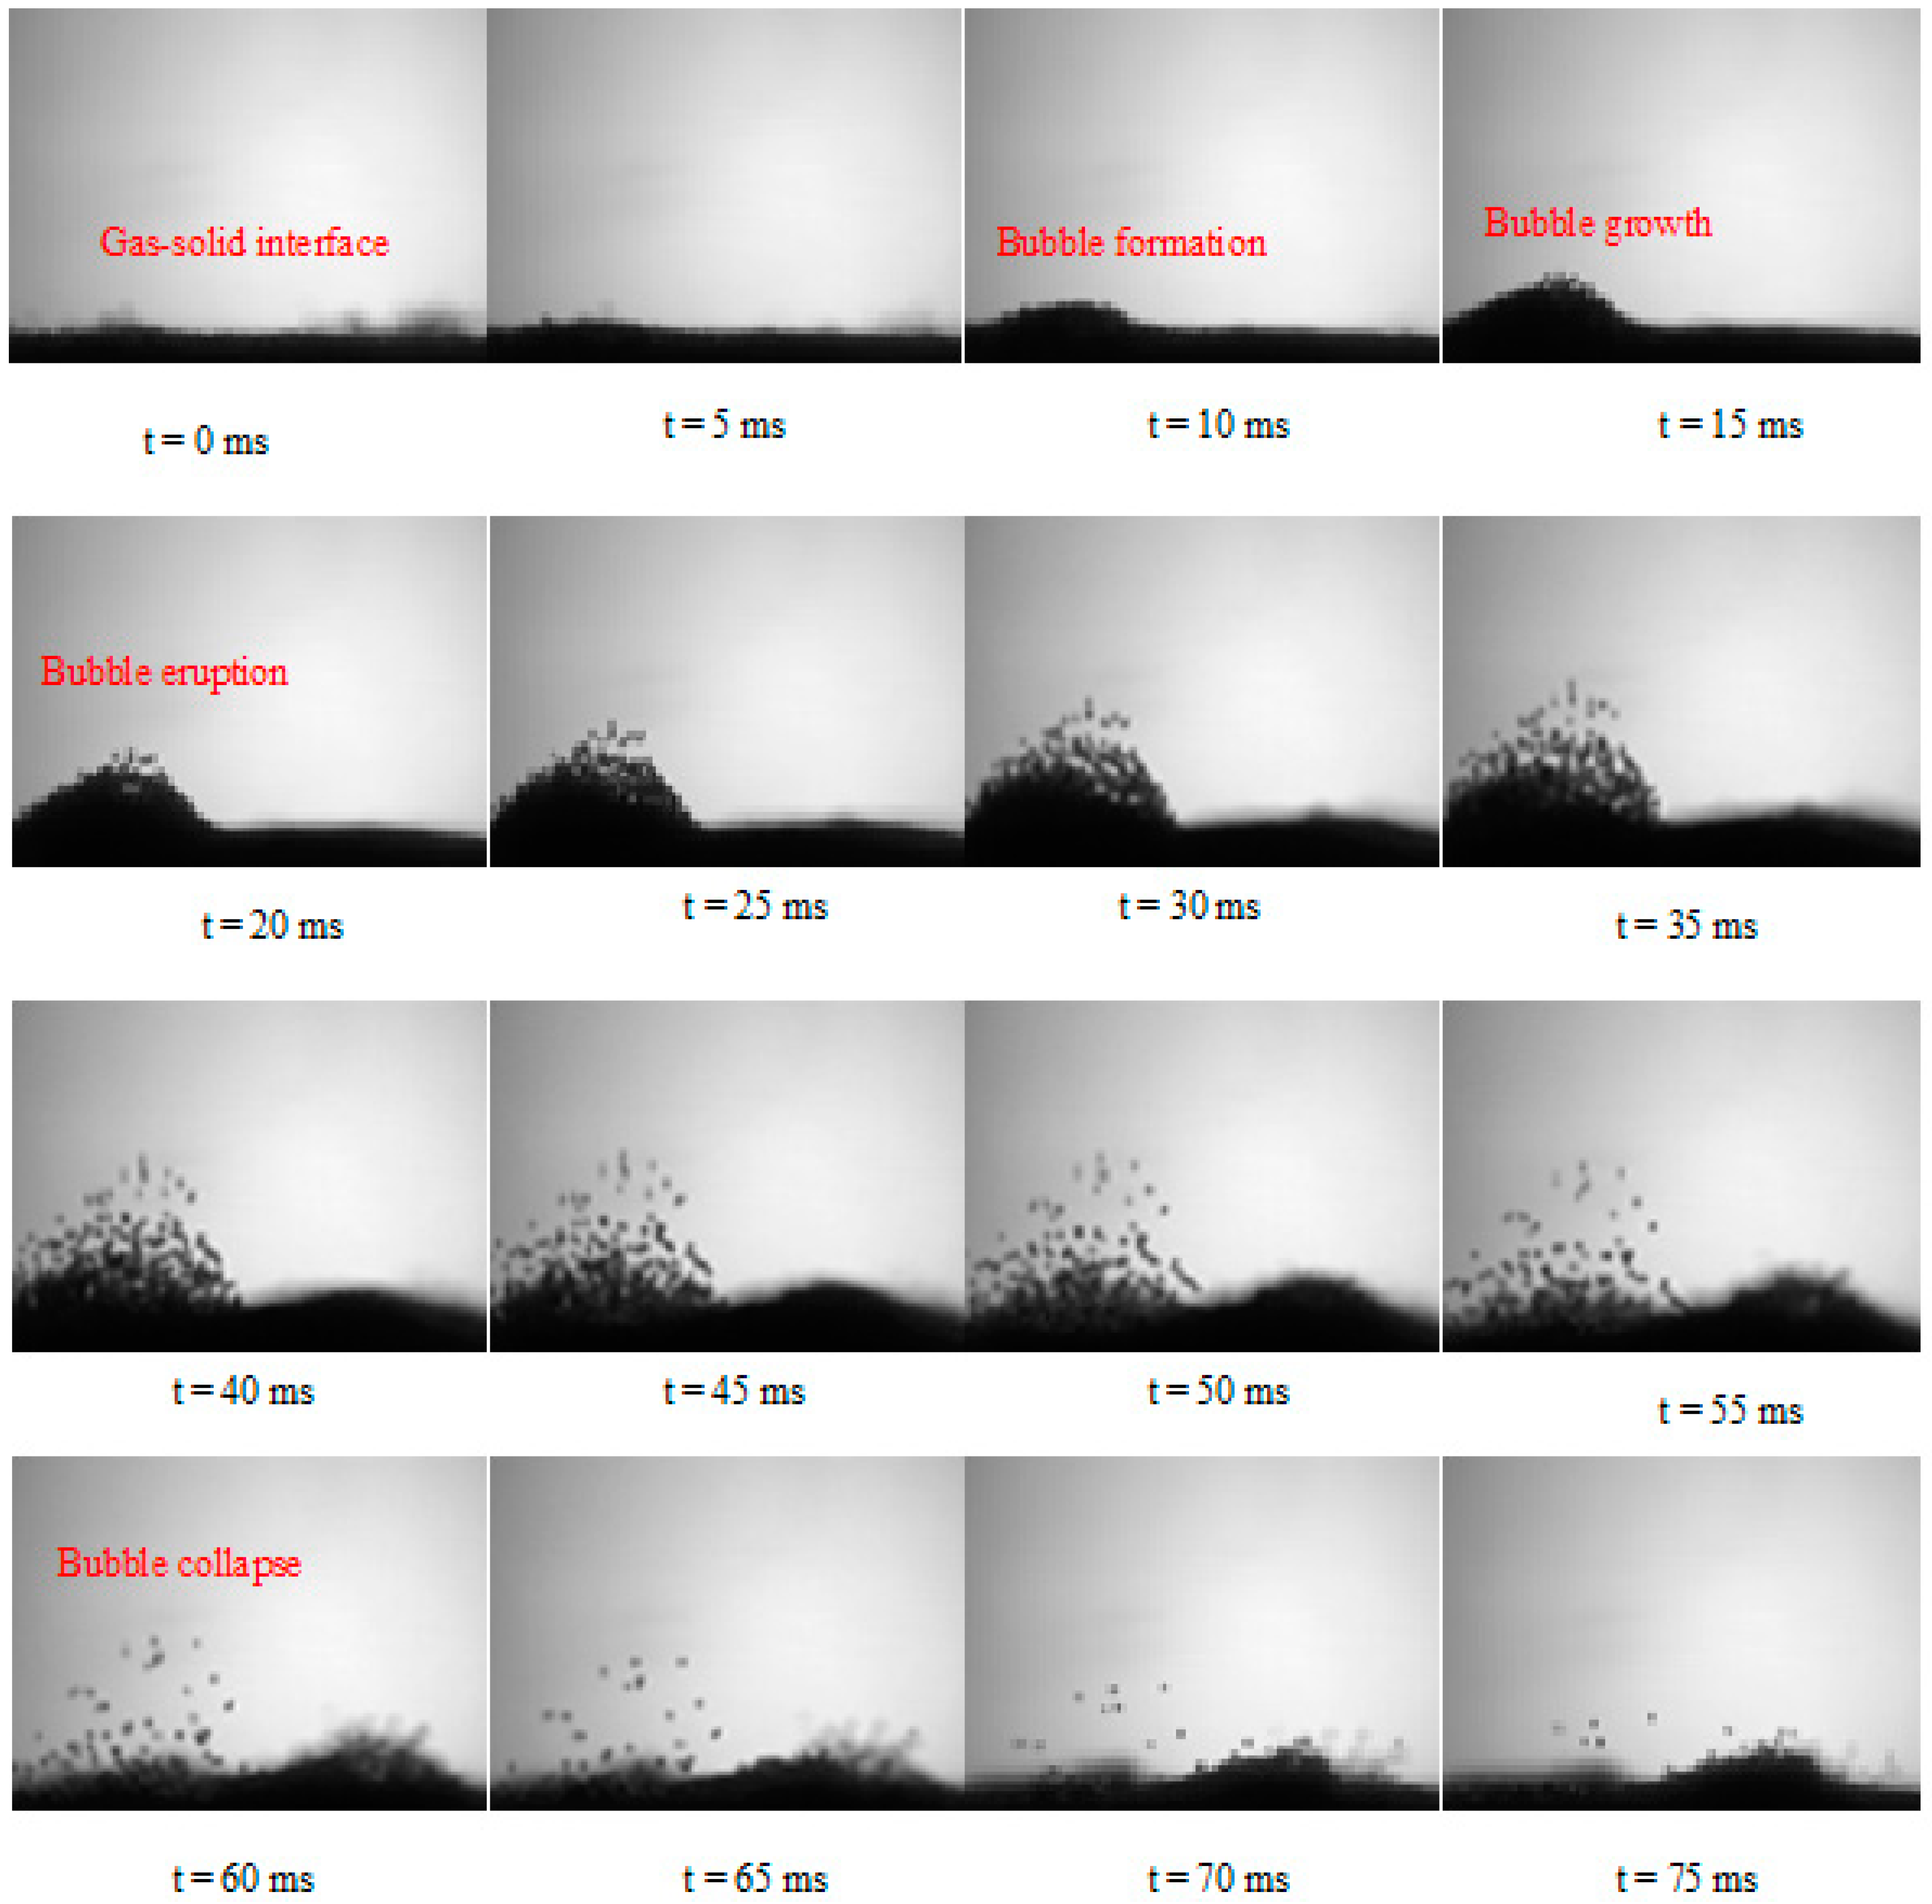
4.1. Minimum Bubbling Fluidization
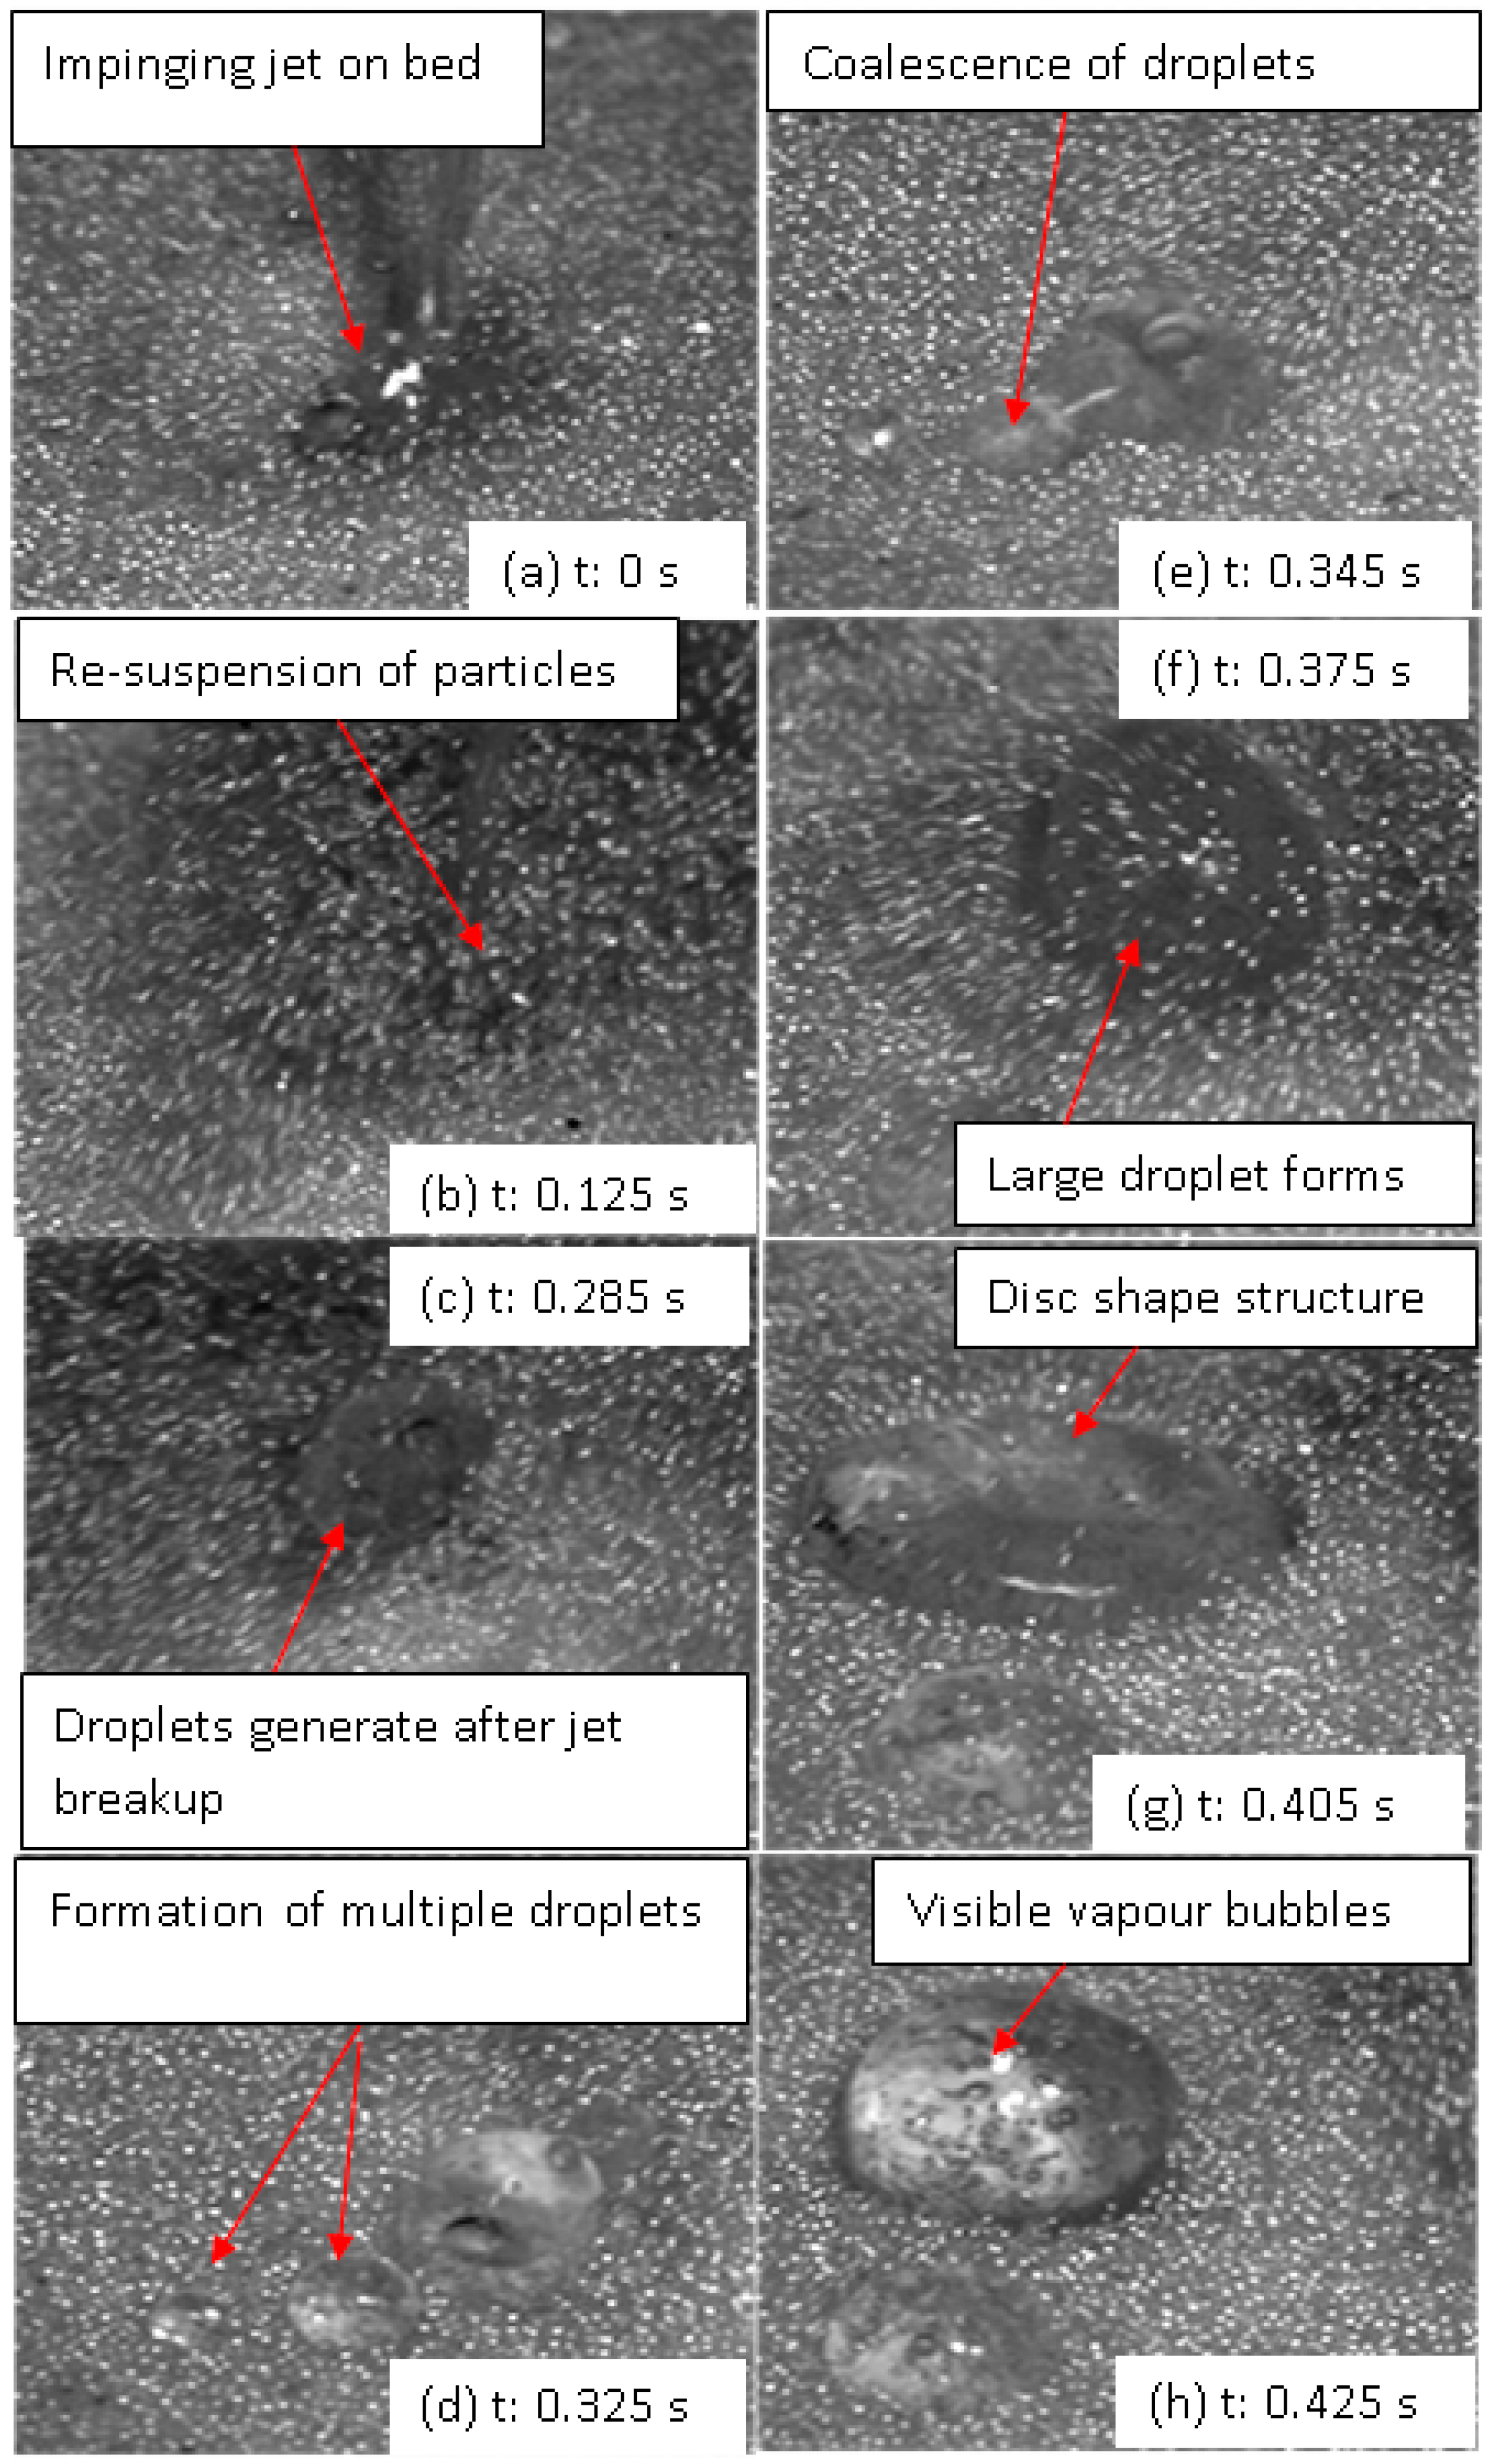
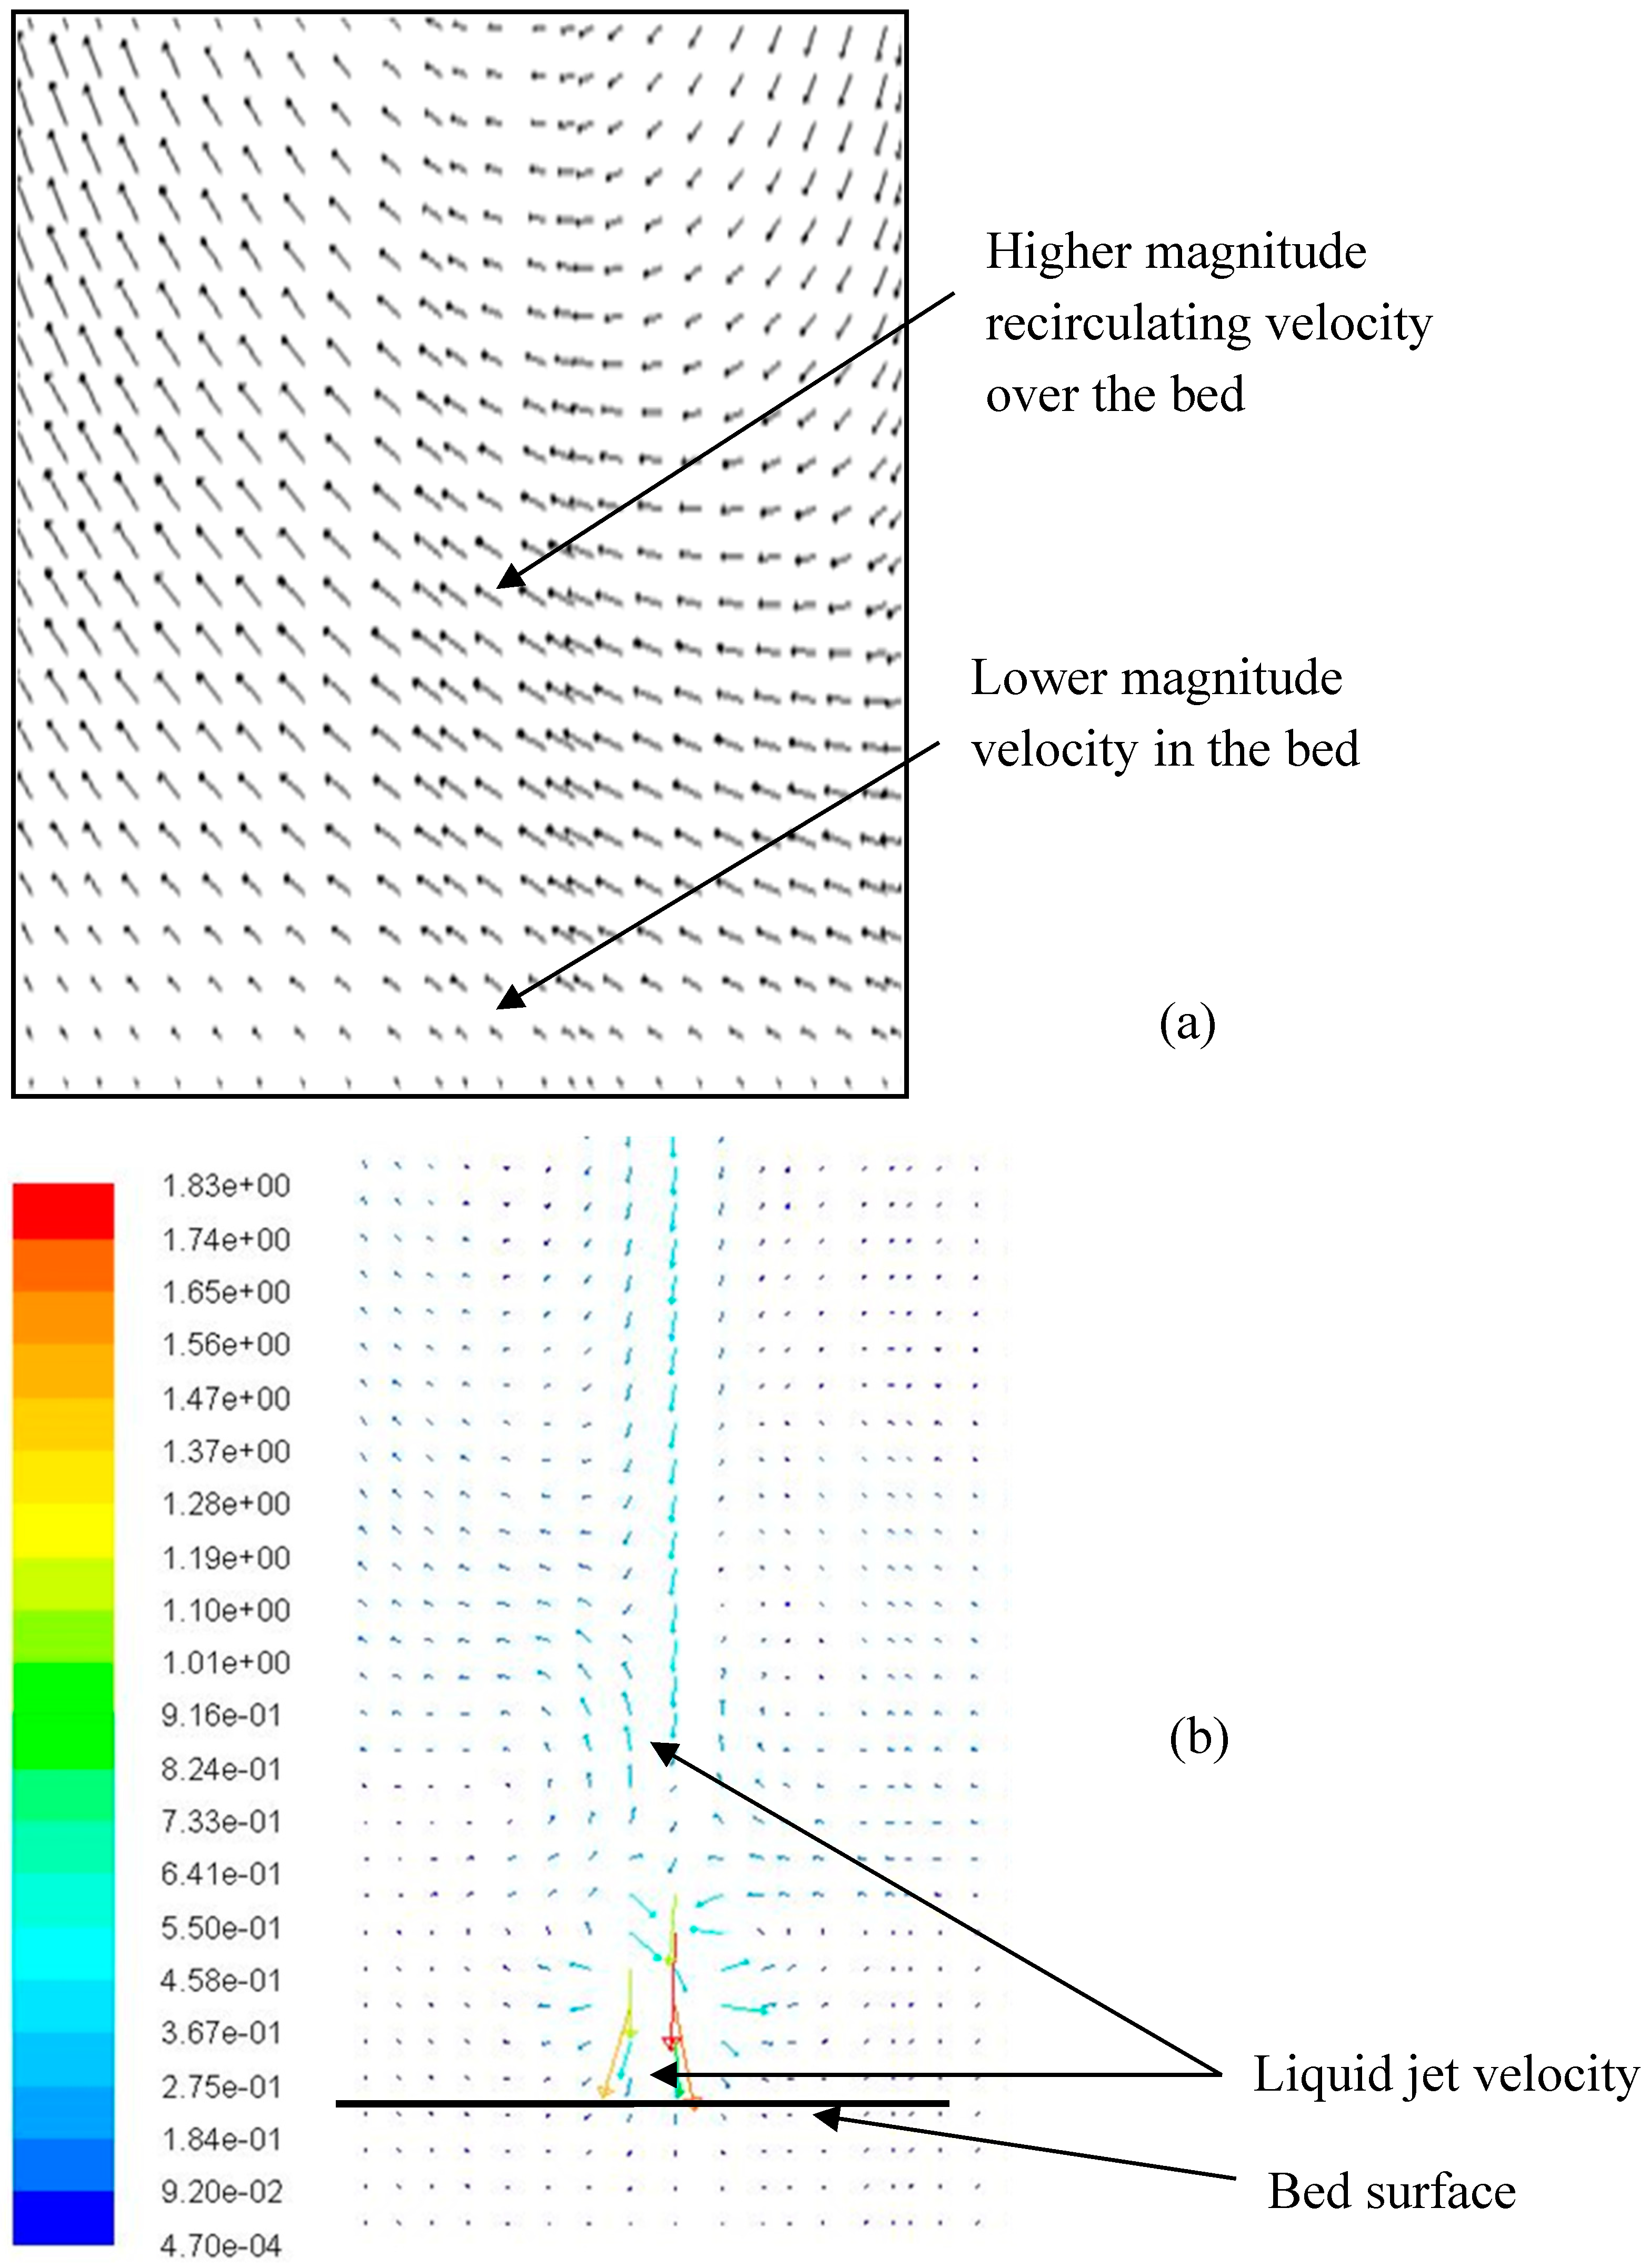
4.2. Droplet–Bed Interaction Mechanisms
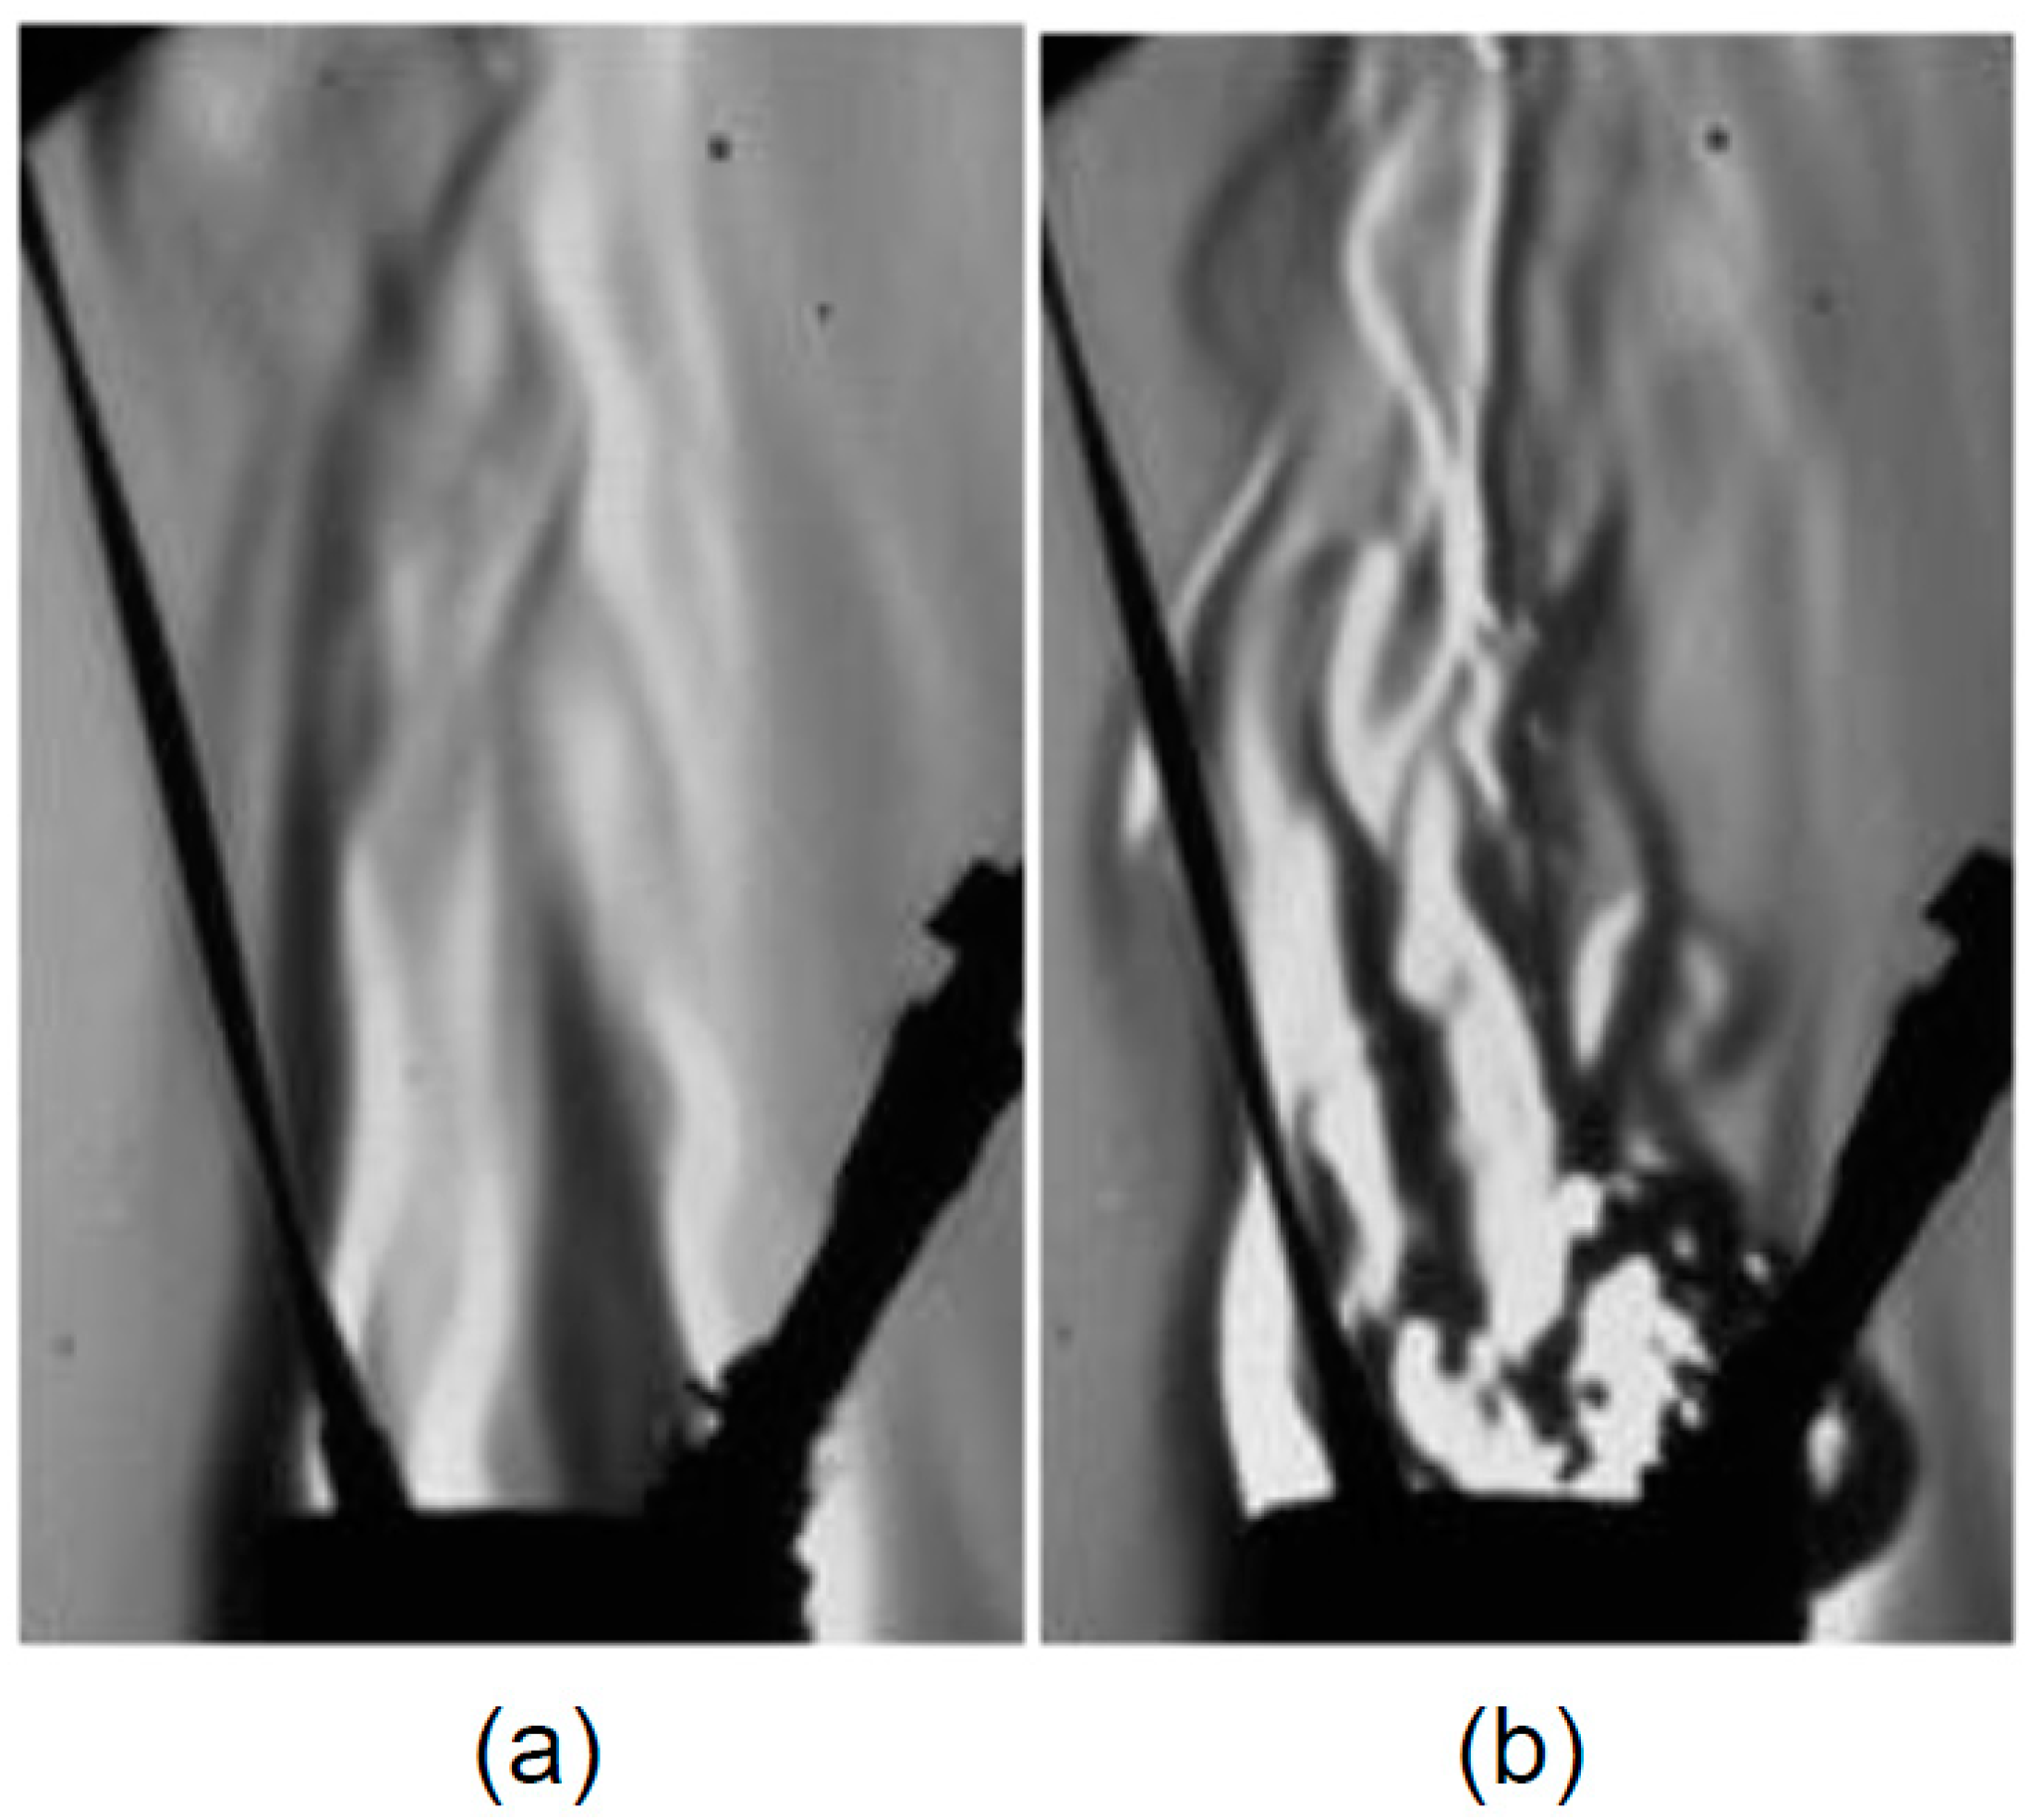
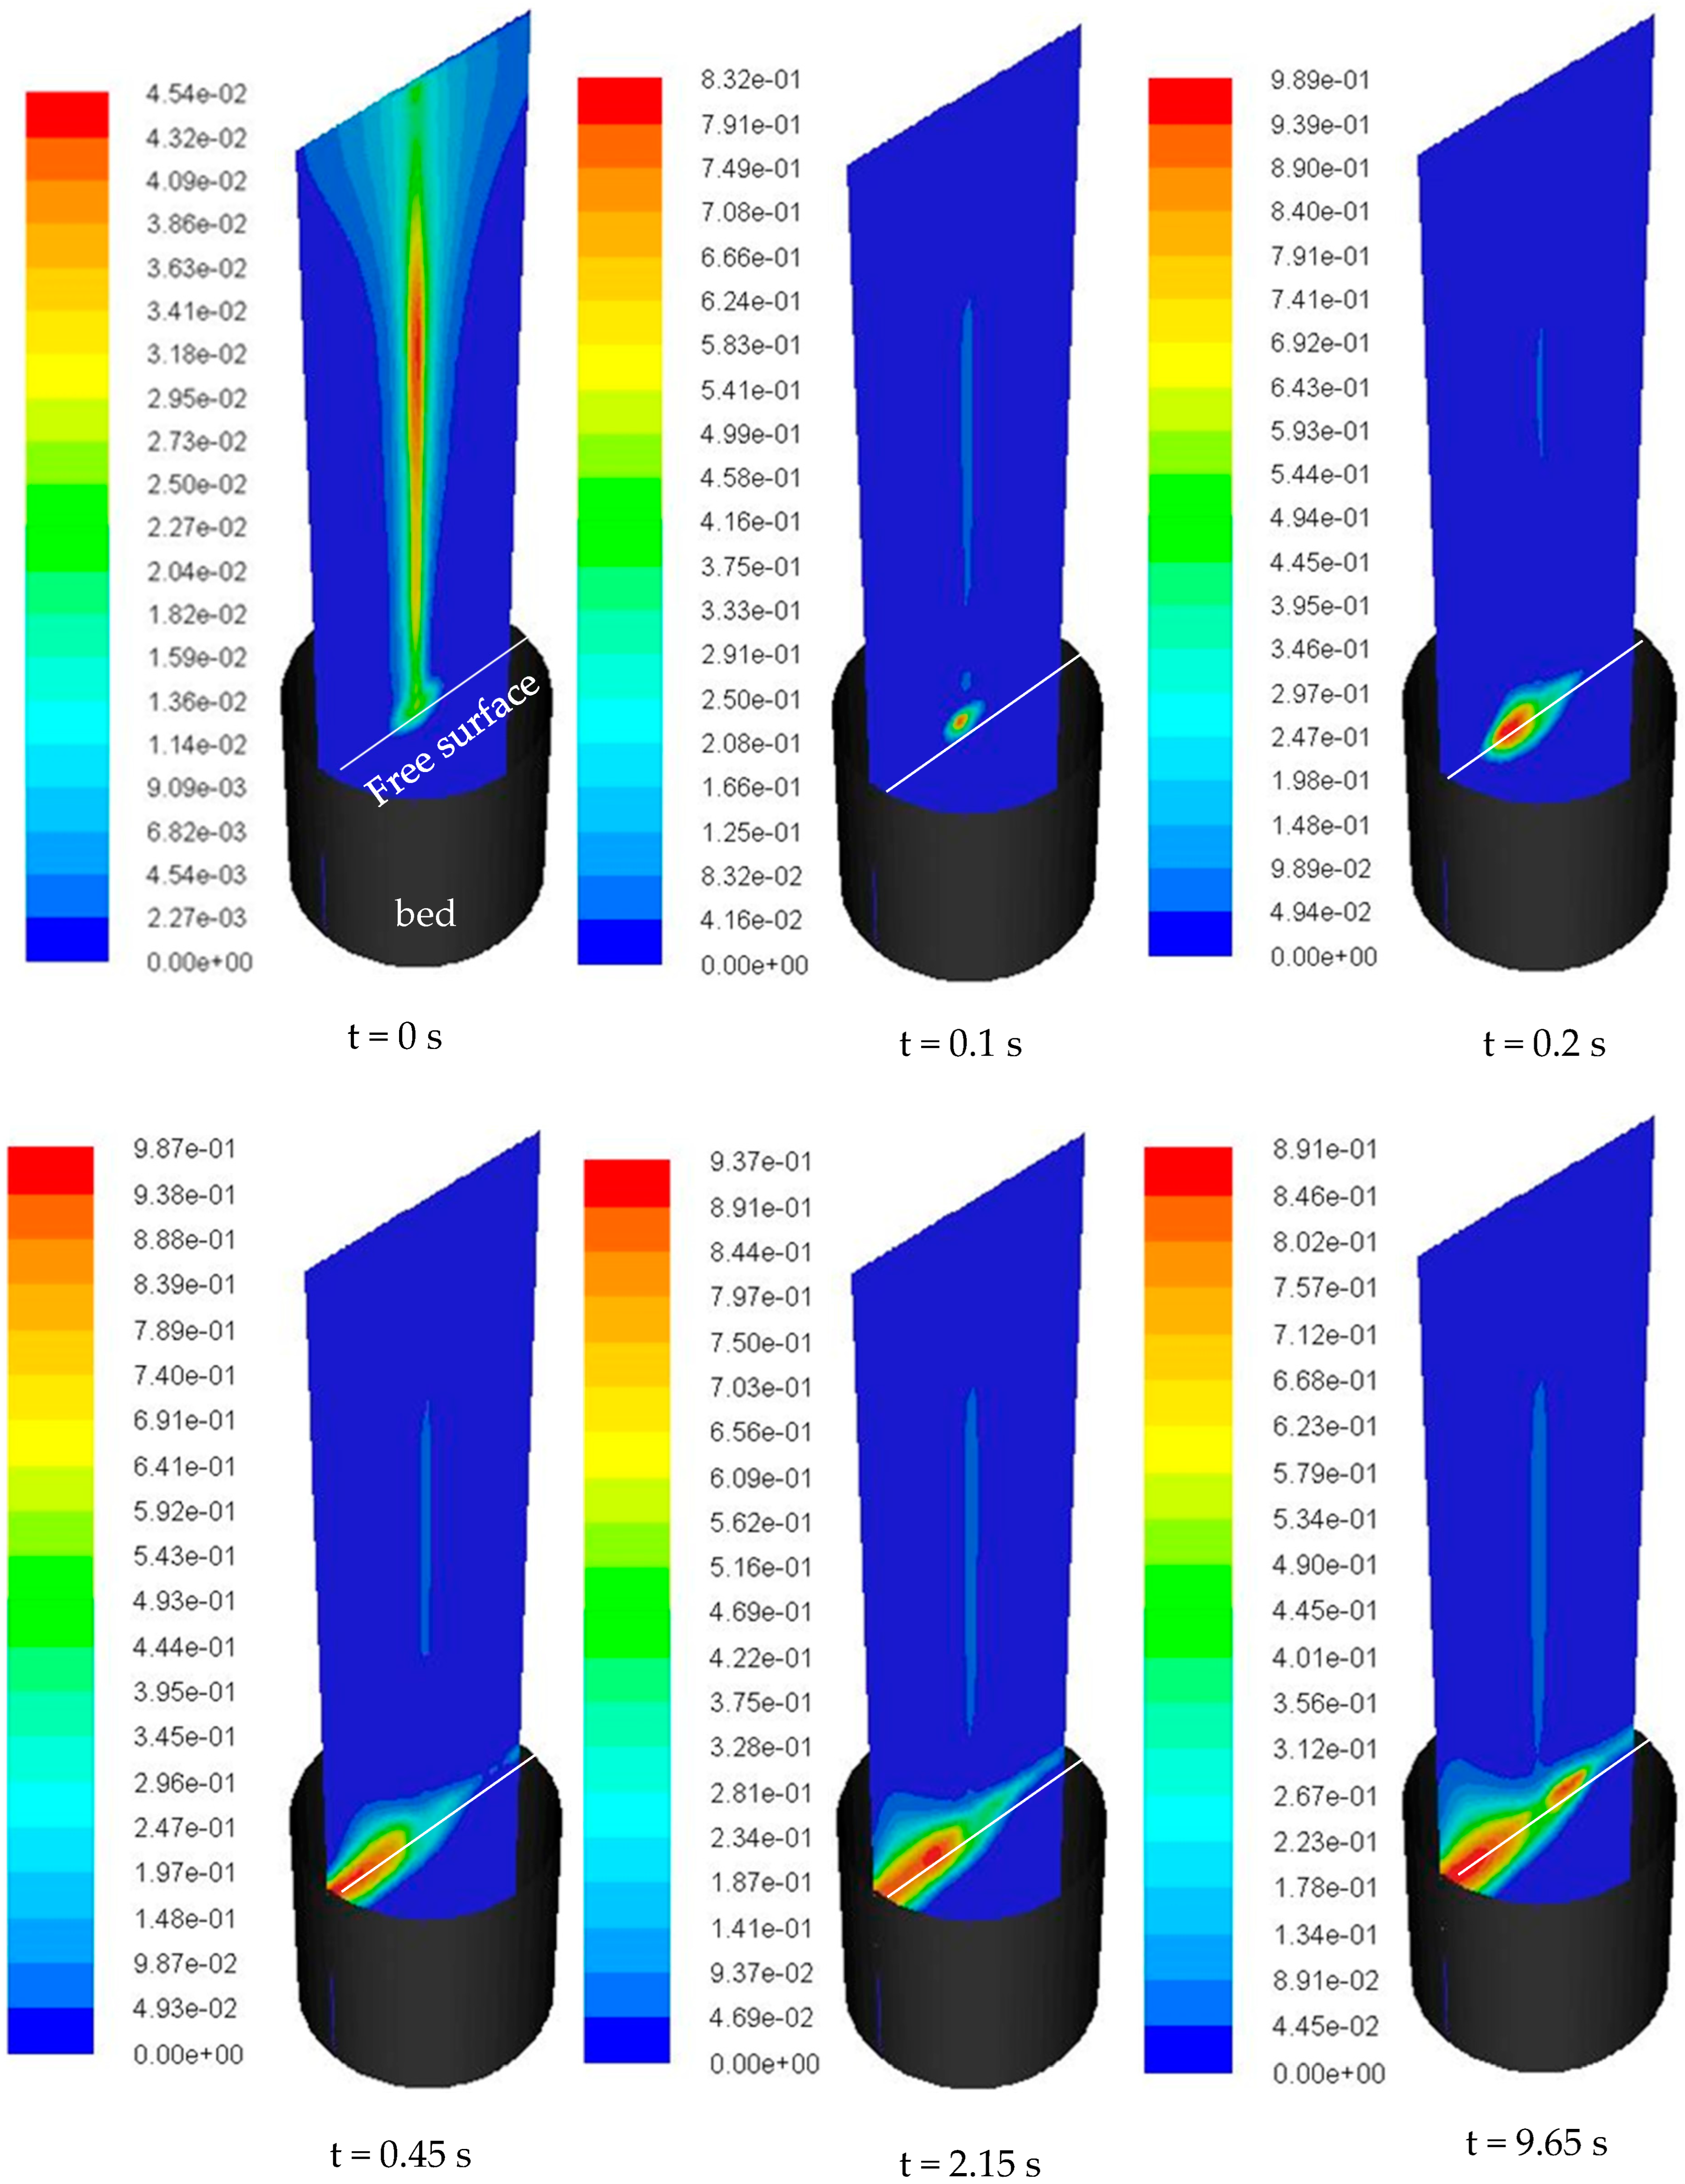
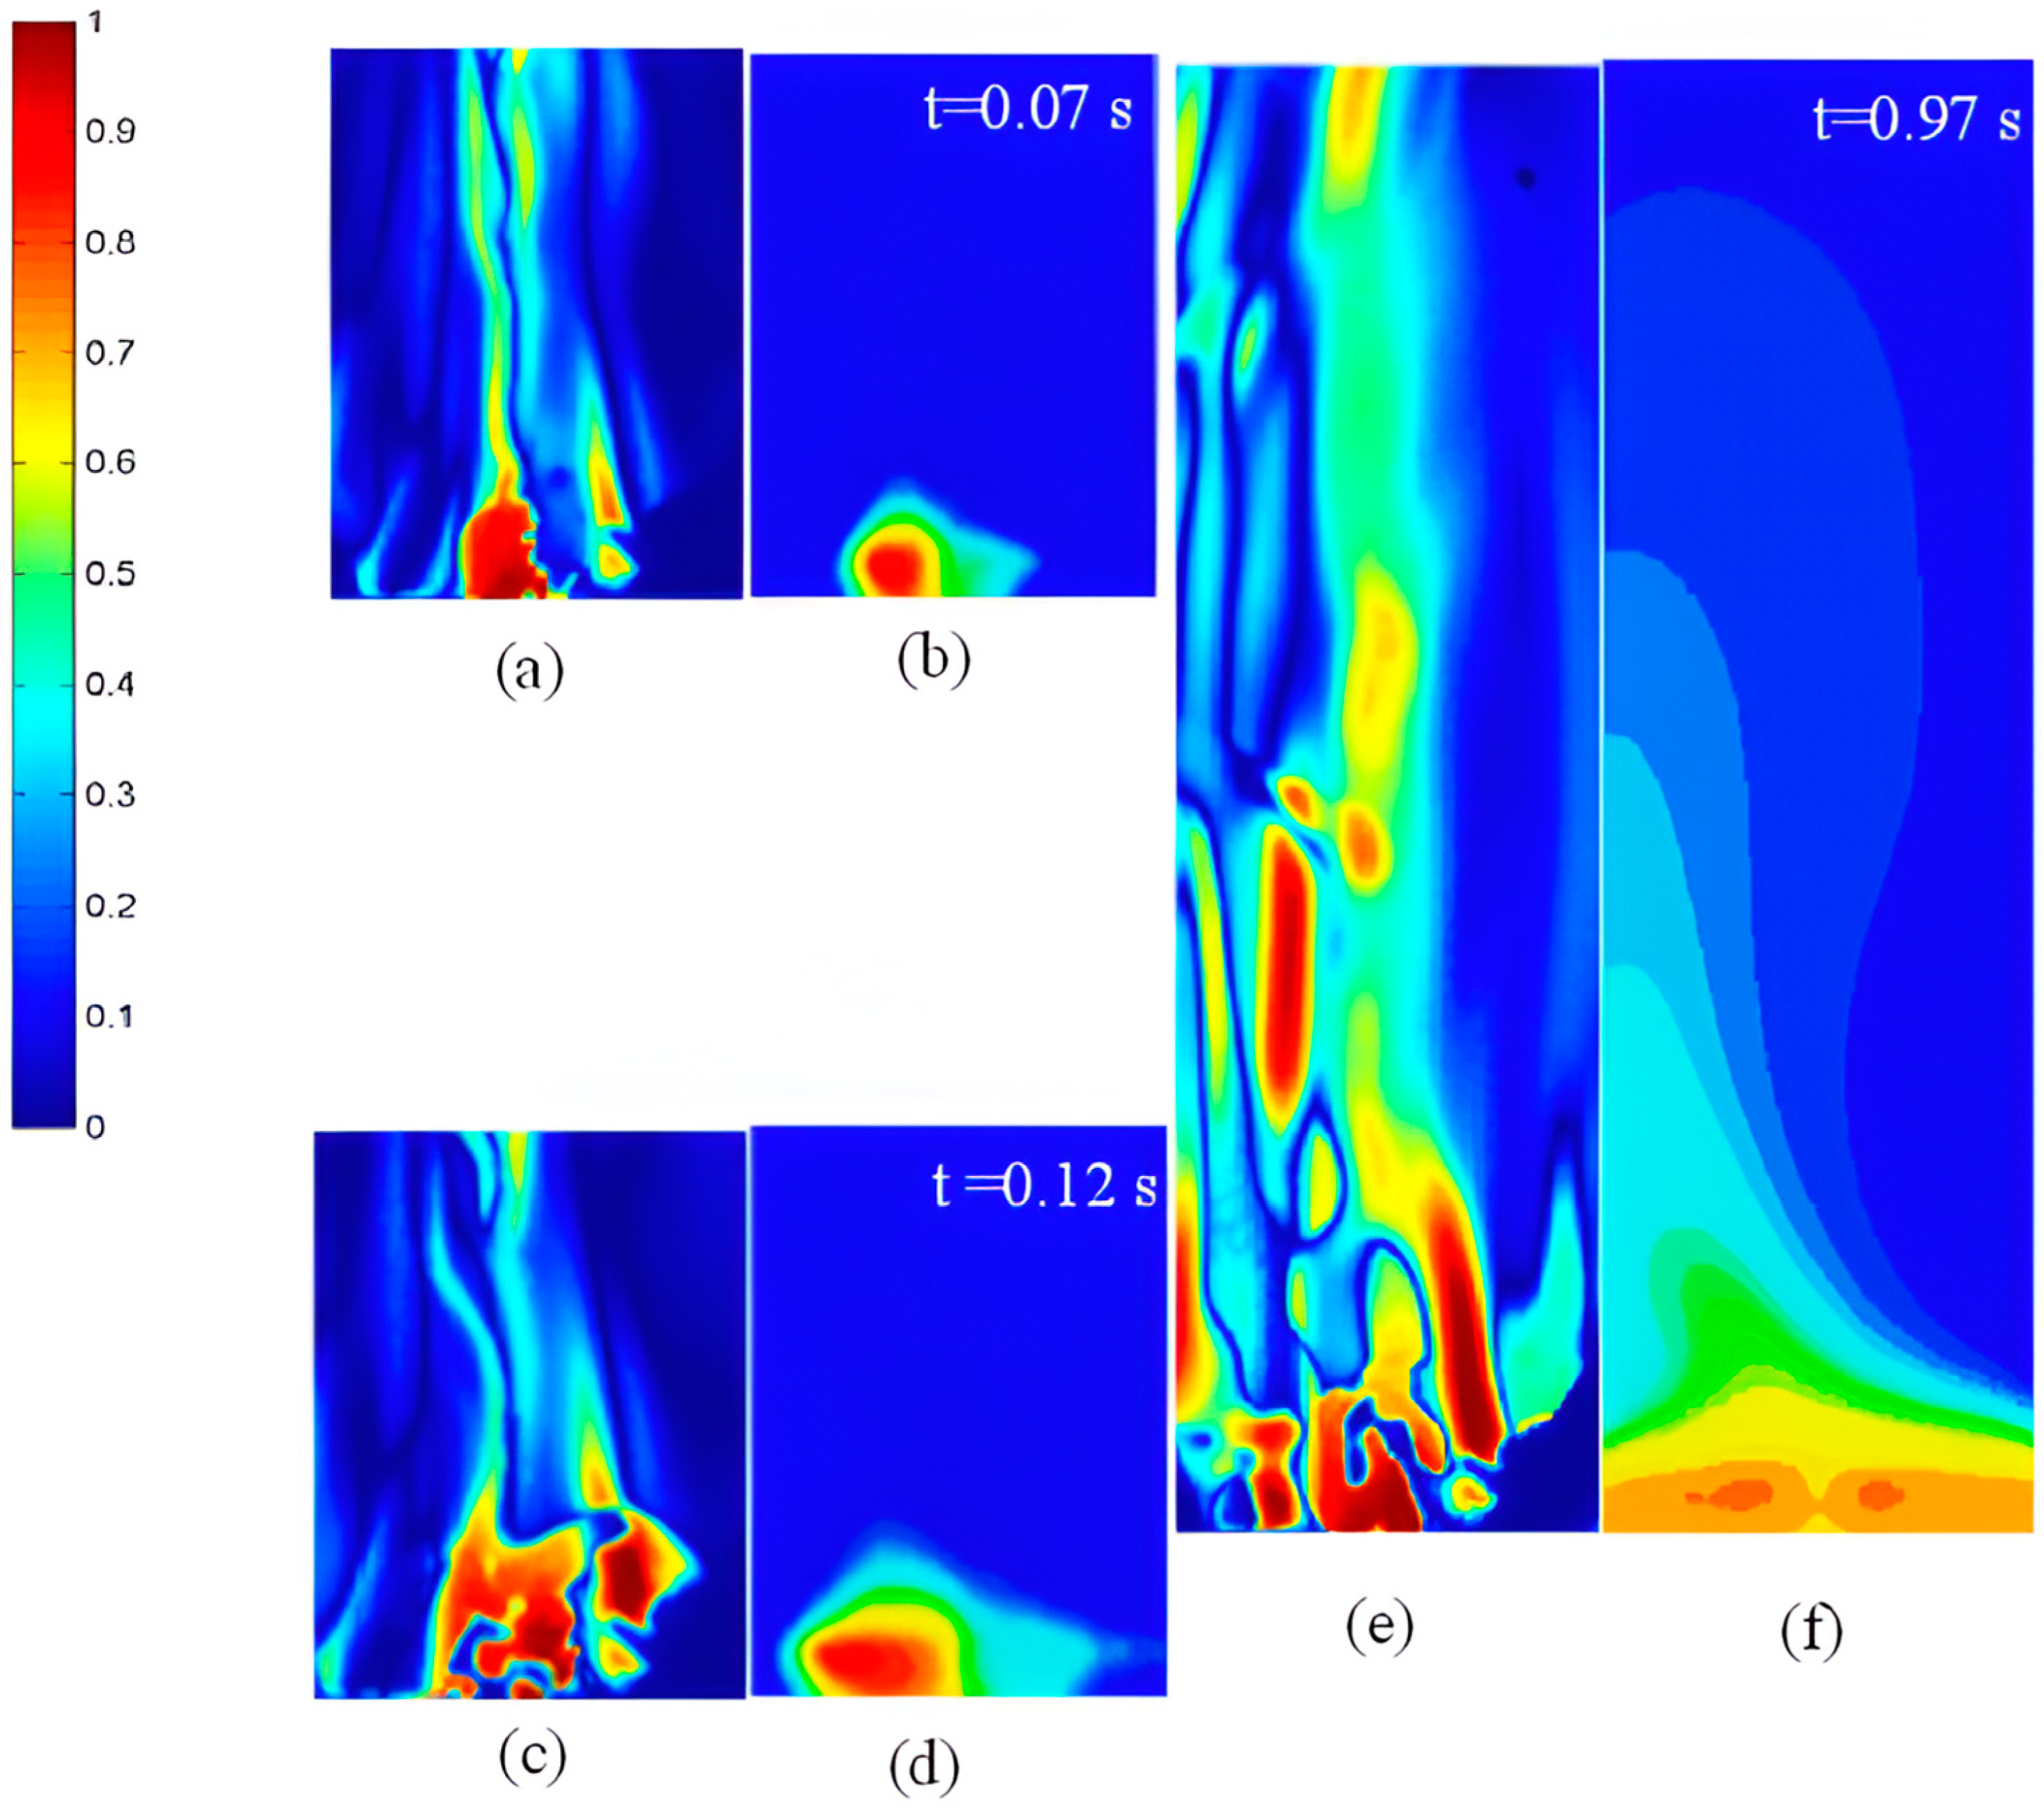
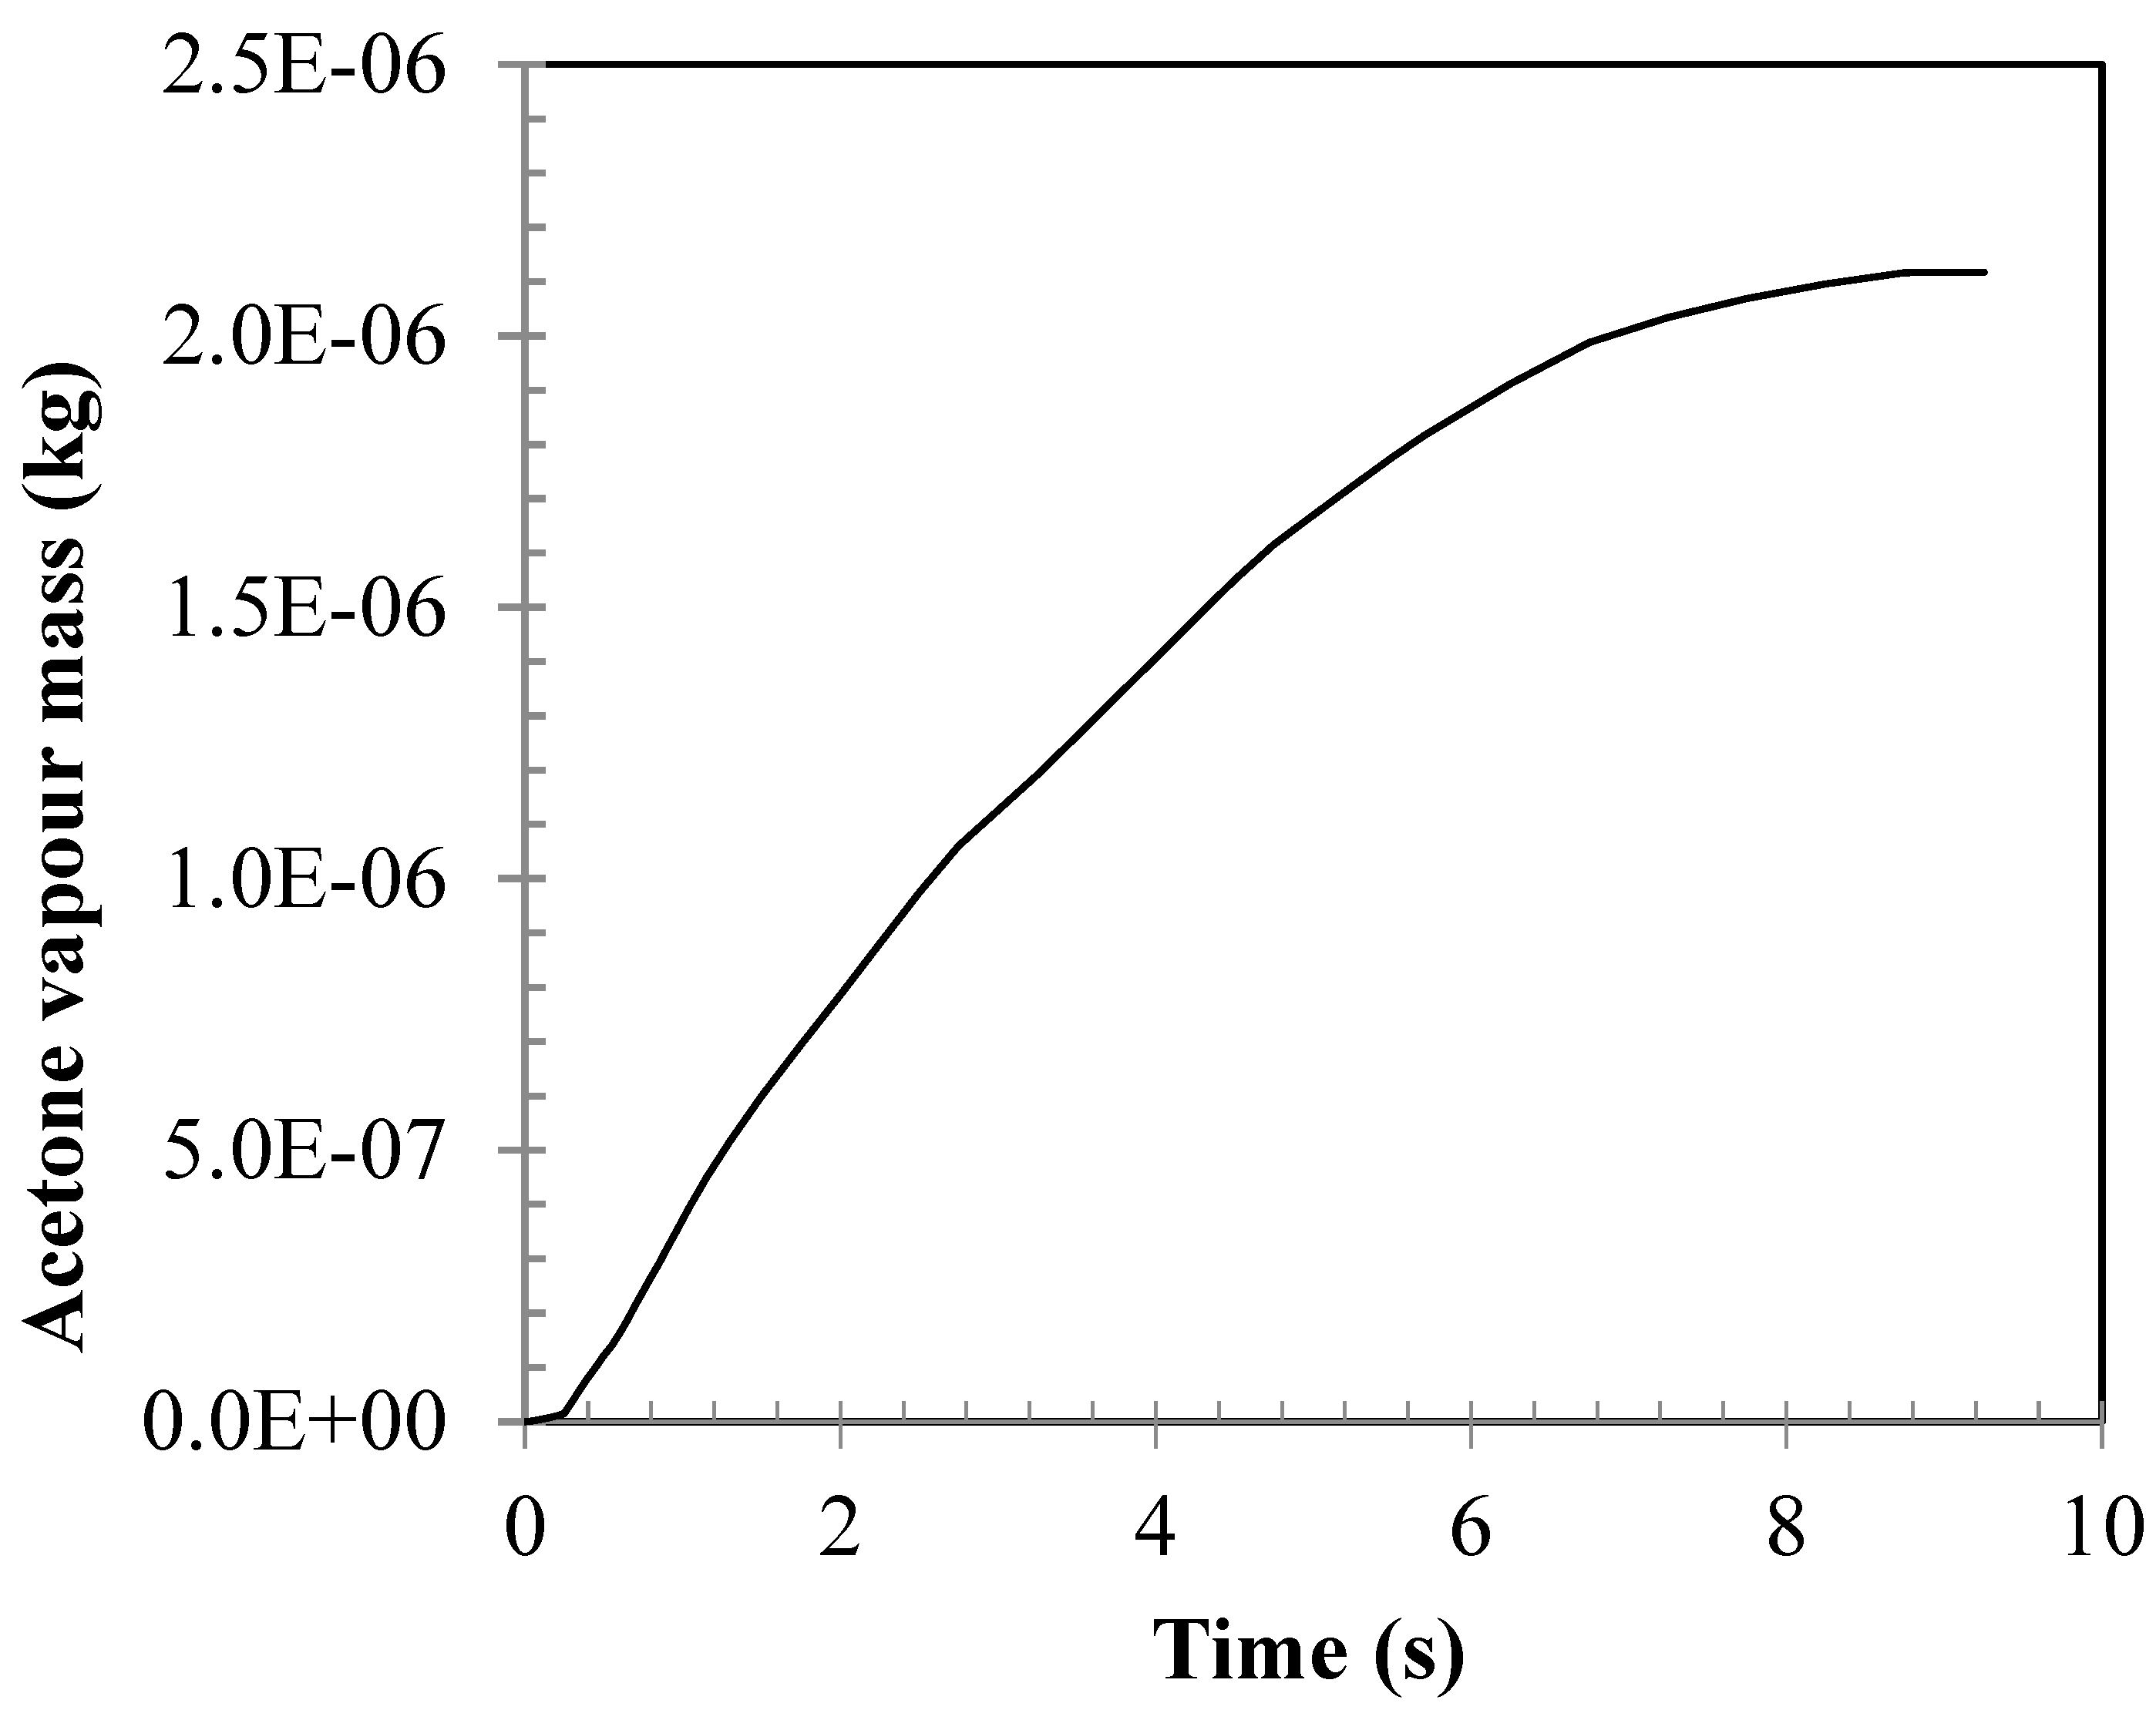
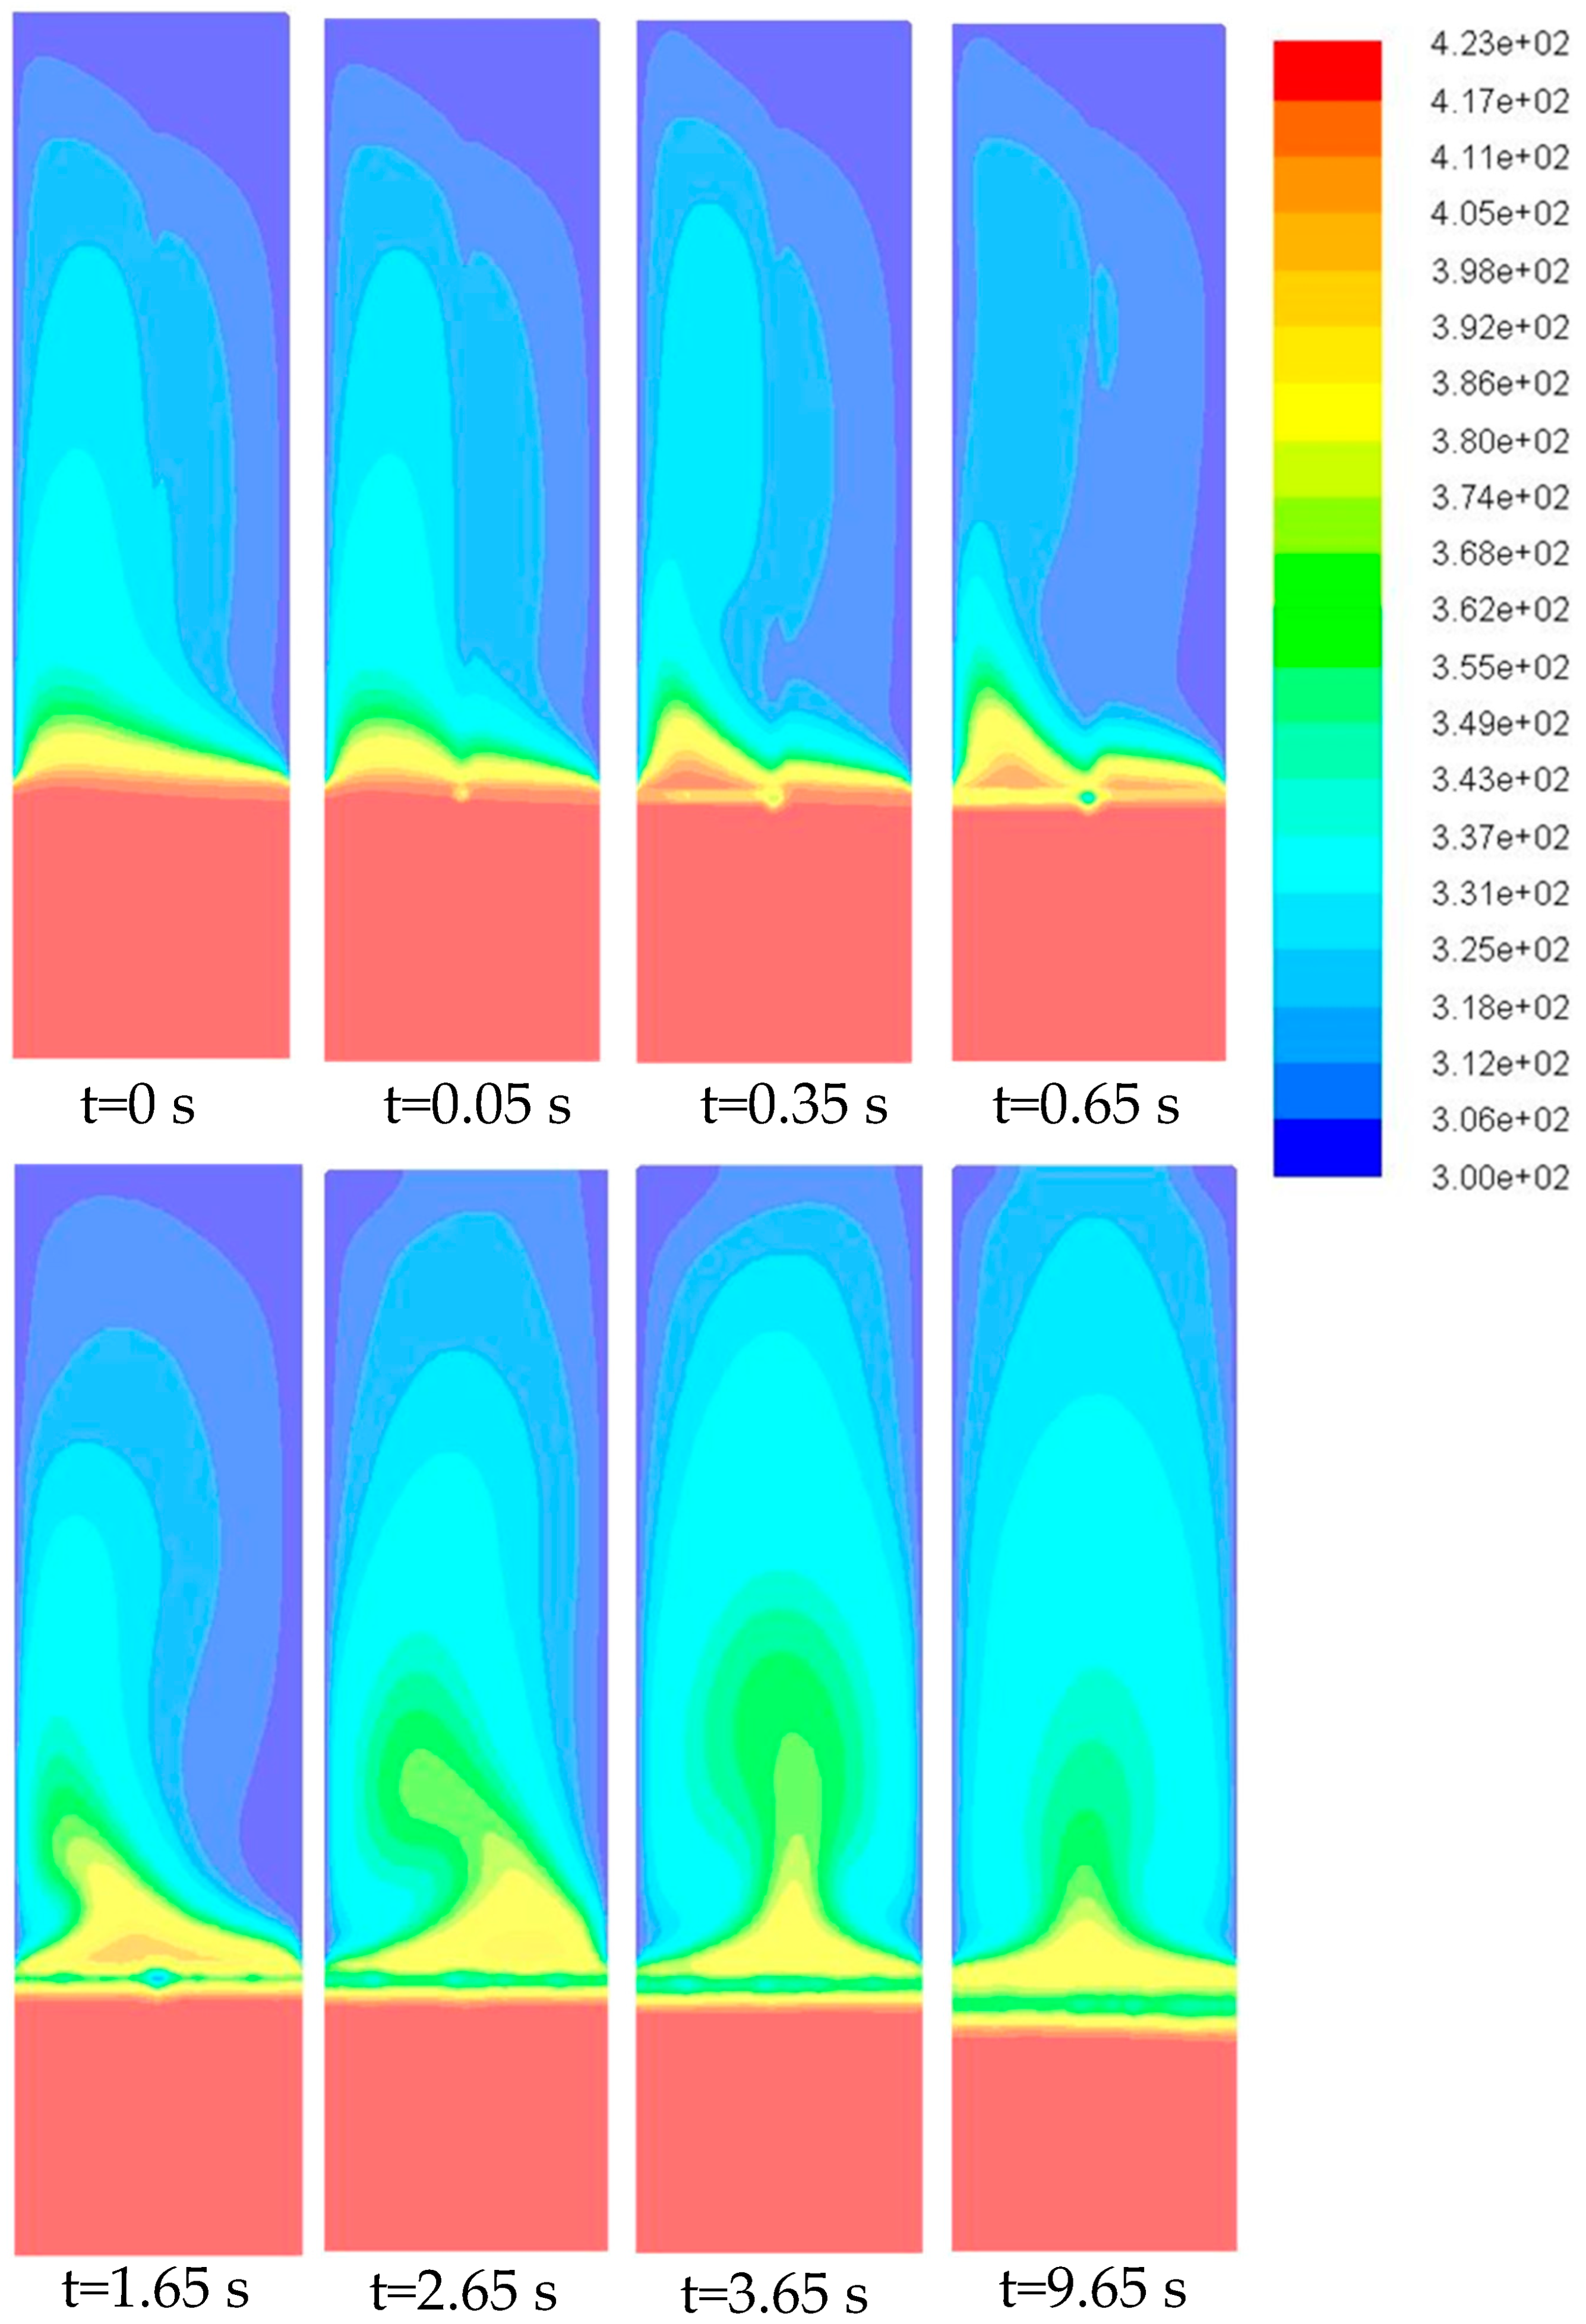
4.3. Vaporization of Acetone Jet in the Fluidized Bed
5. Conclusions
- The heterogeneous vaporization phenomenon involves complex droplet–particle interactions comprising liquid jet breakup to multiple droplets, the coalescence of droplets, intense vaporization followed by the re-suspension of solid particles, the levitation of droplets, the shape deformation of droplets, and the nucleate boiling of droplets.
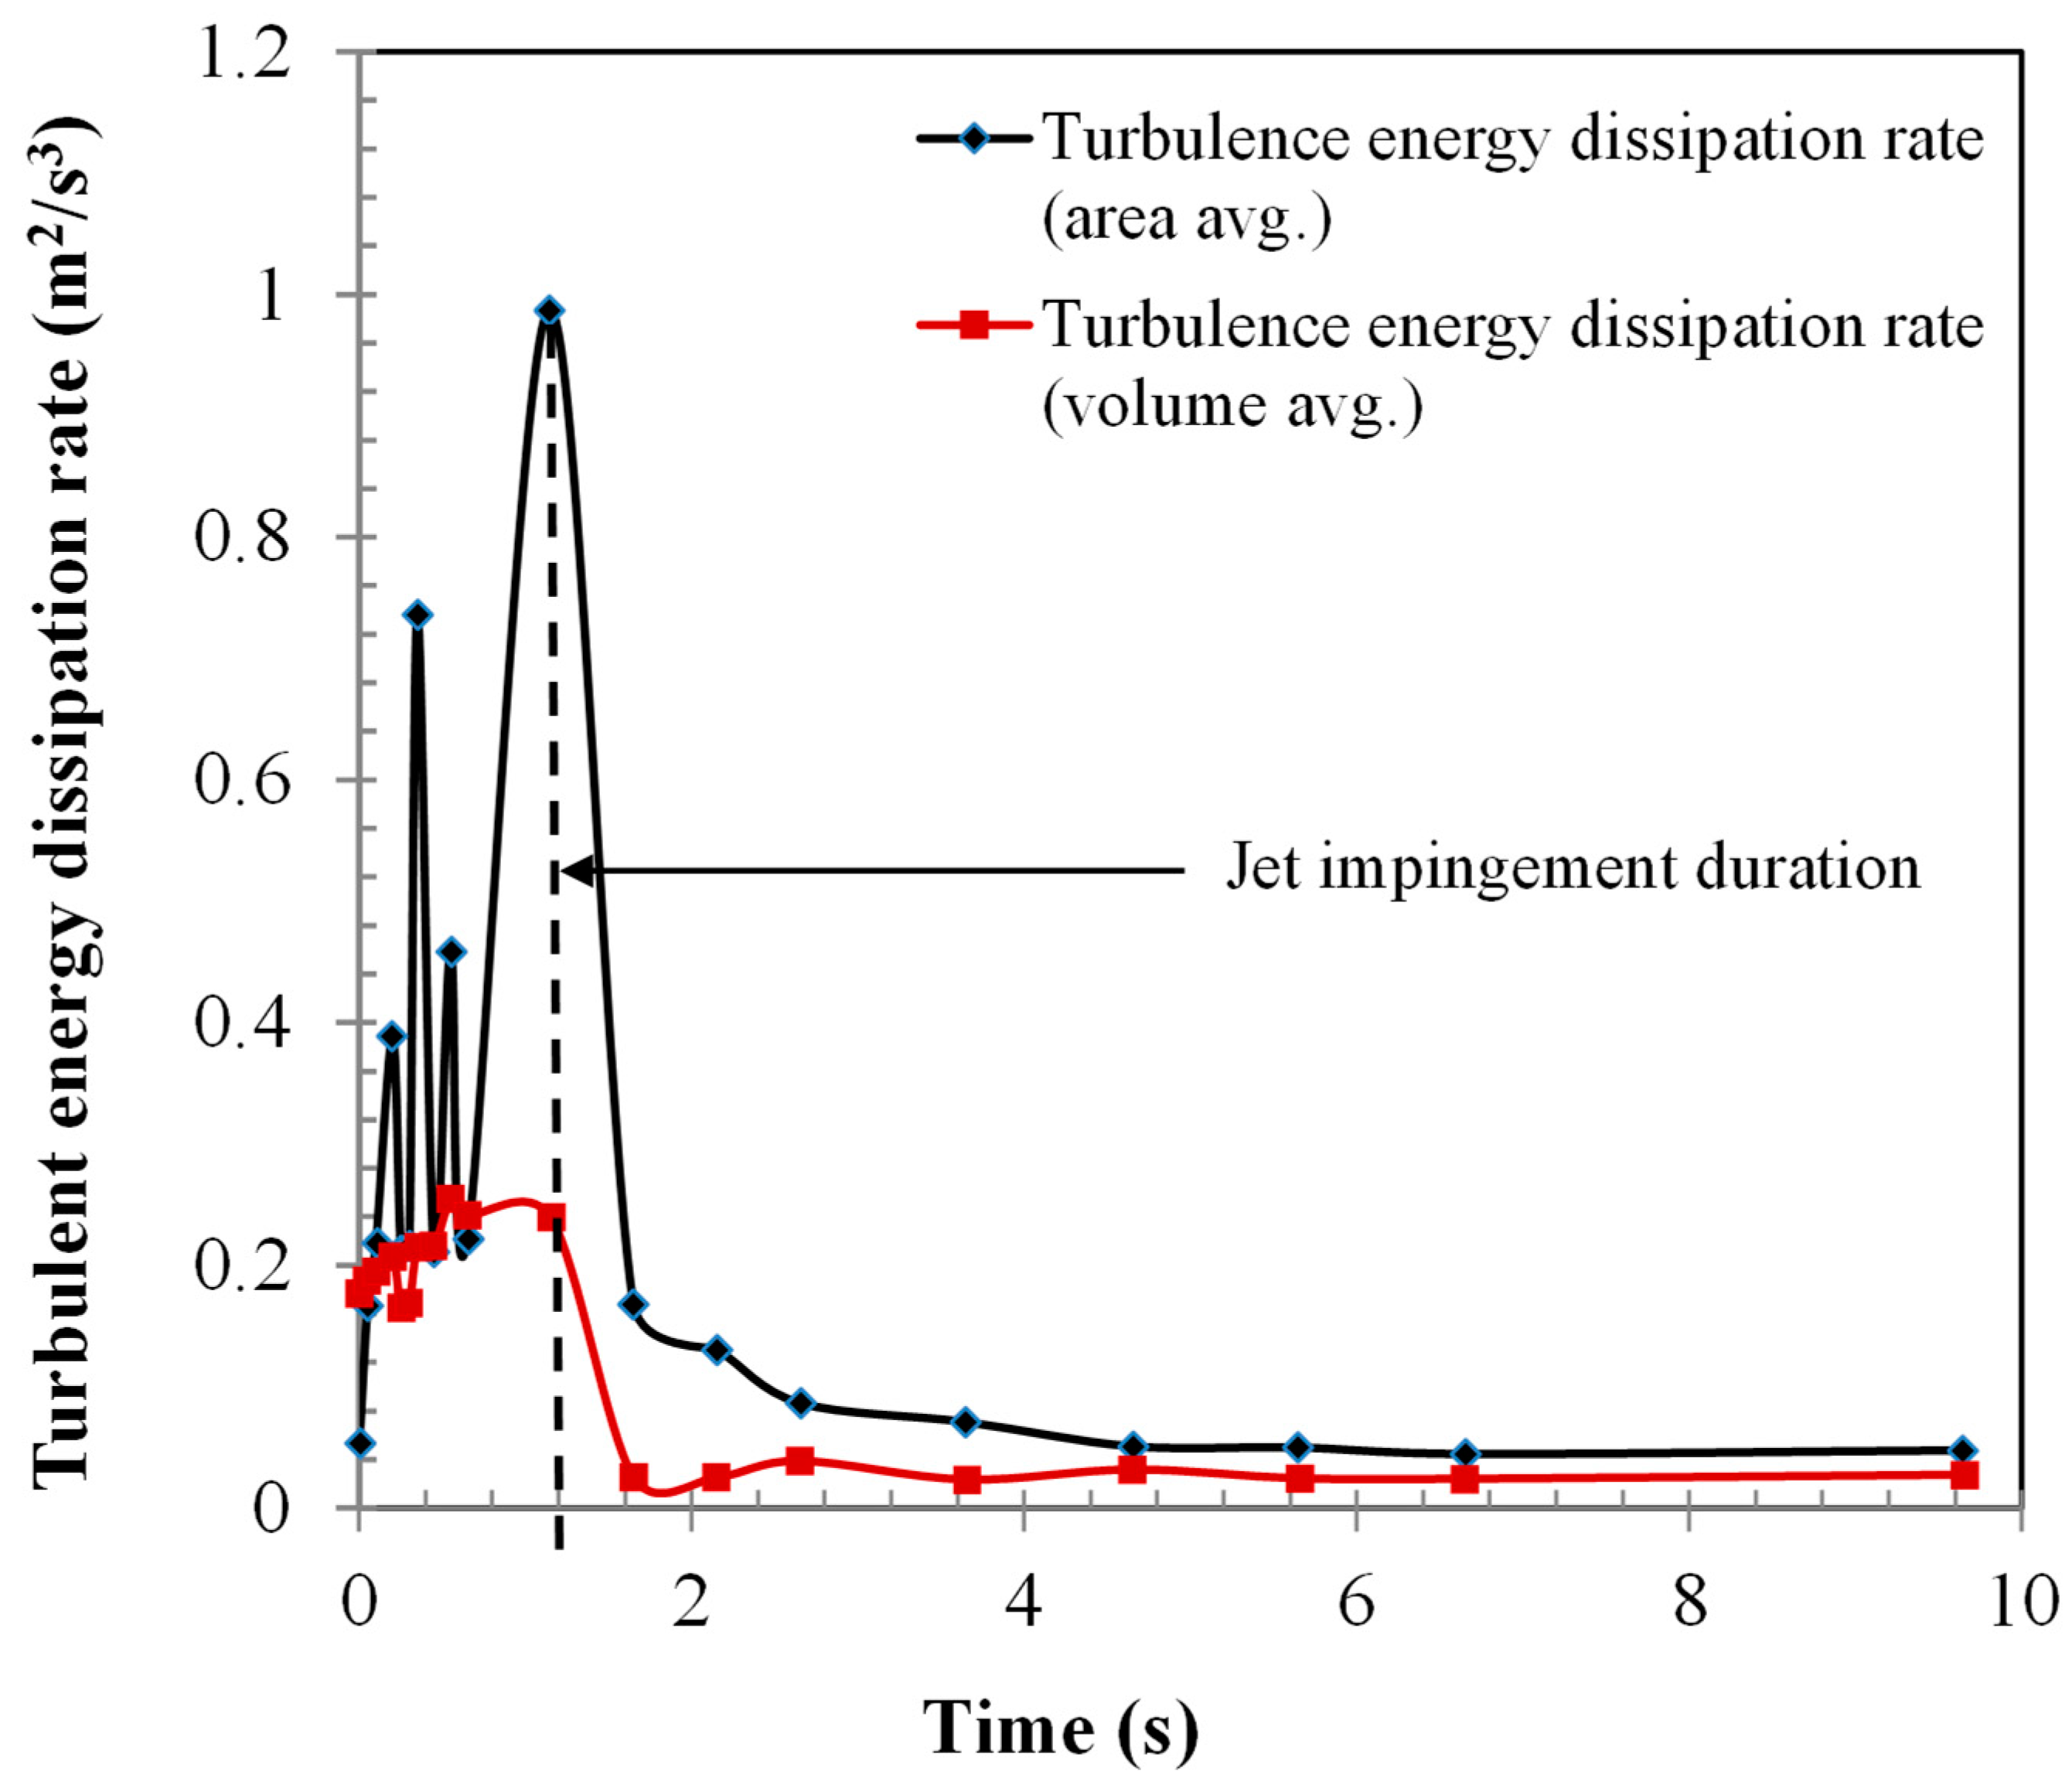
- The jet evaporation behaviour predicted by the CFD model qualitatively agreed with the schlieren imaging which captured the key feature of the emerging vapour plume, showing higher vapour concentration on the bed surface and diminishing concentration in the freeboard region. The same profile was also noted for the turbulence energy dissipation rate.
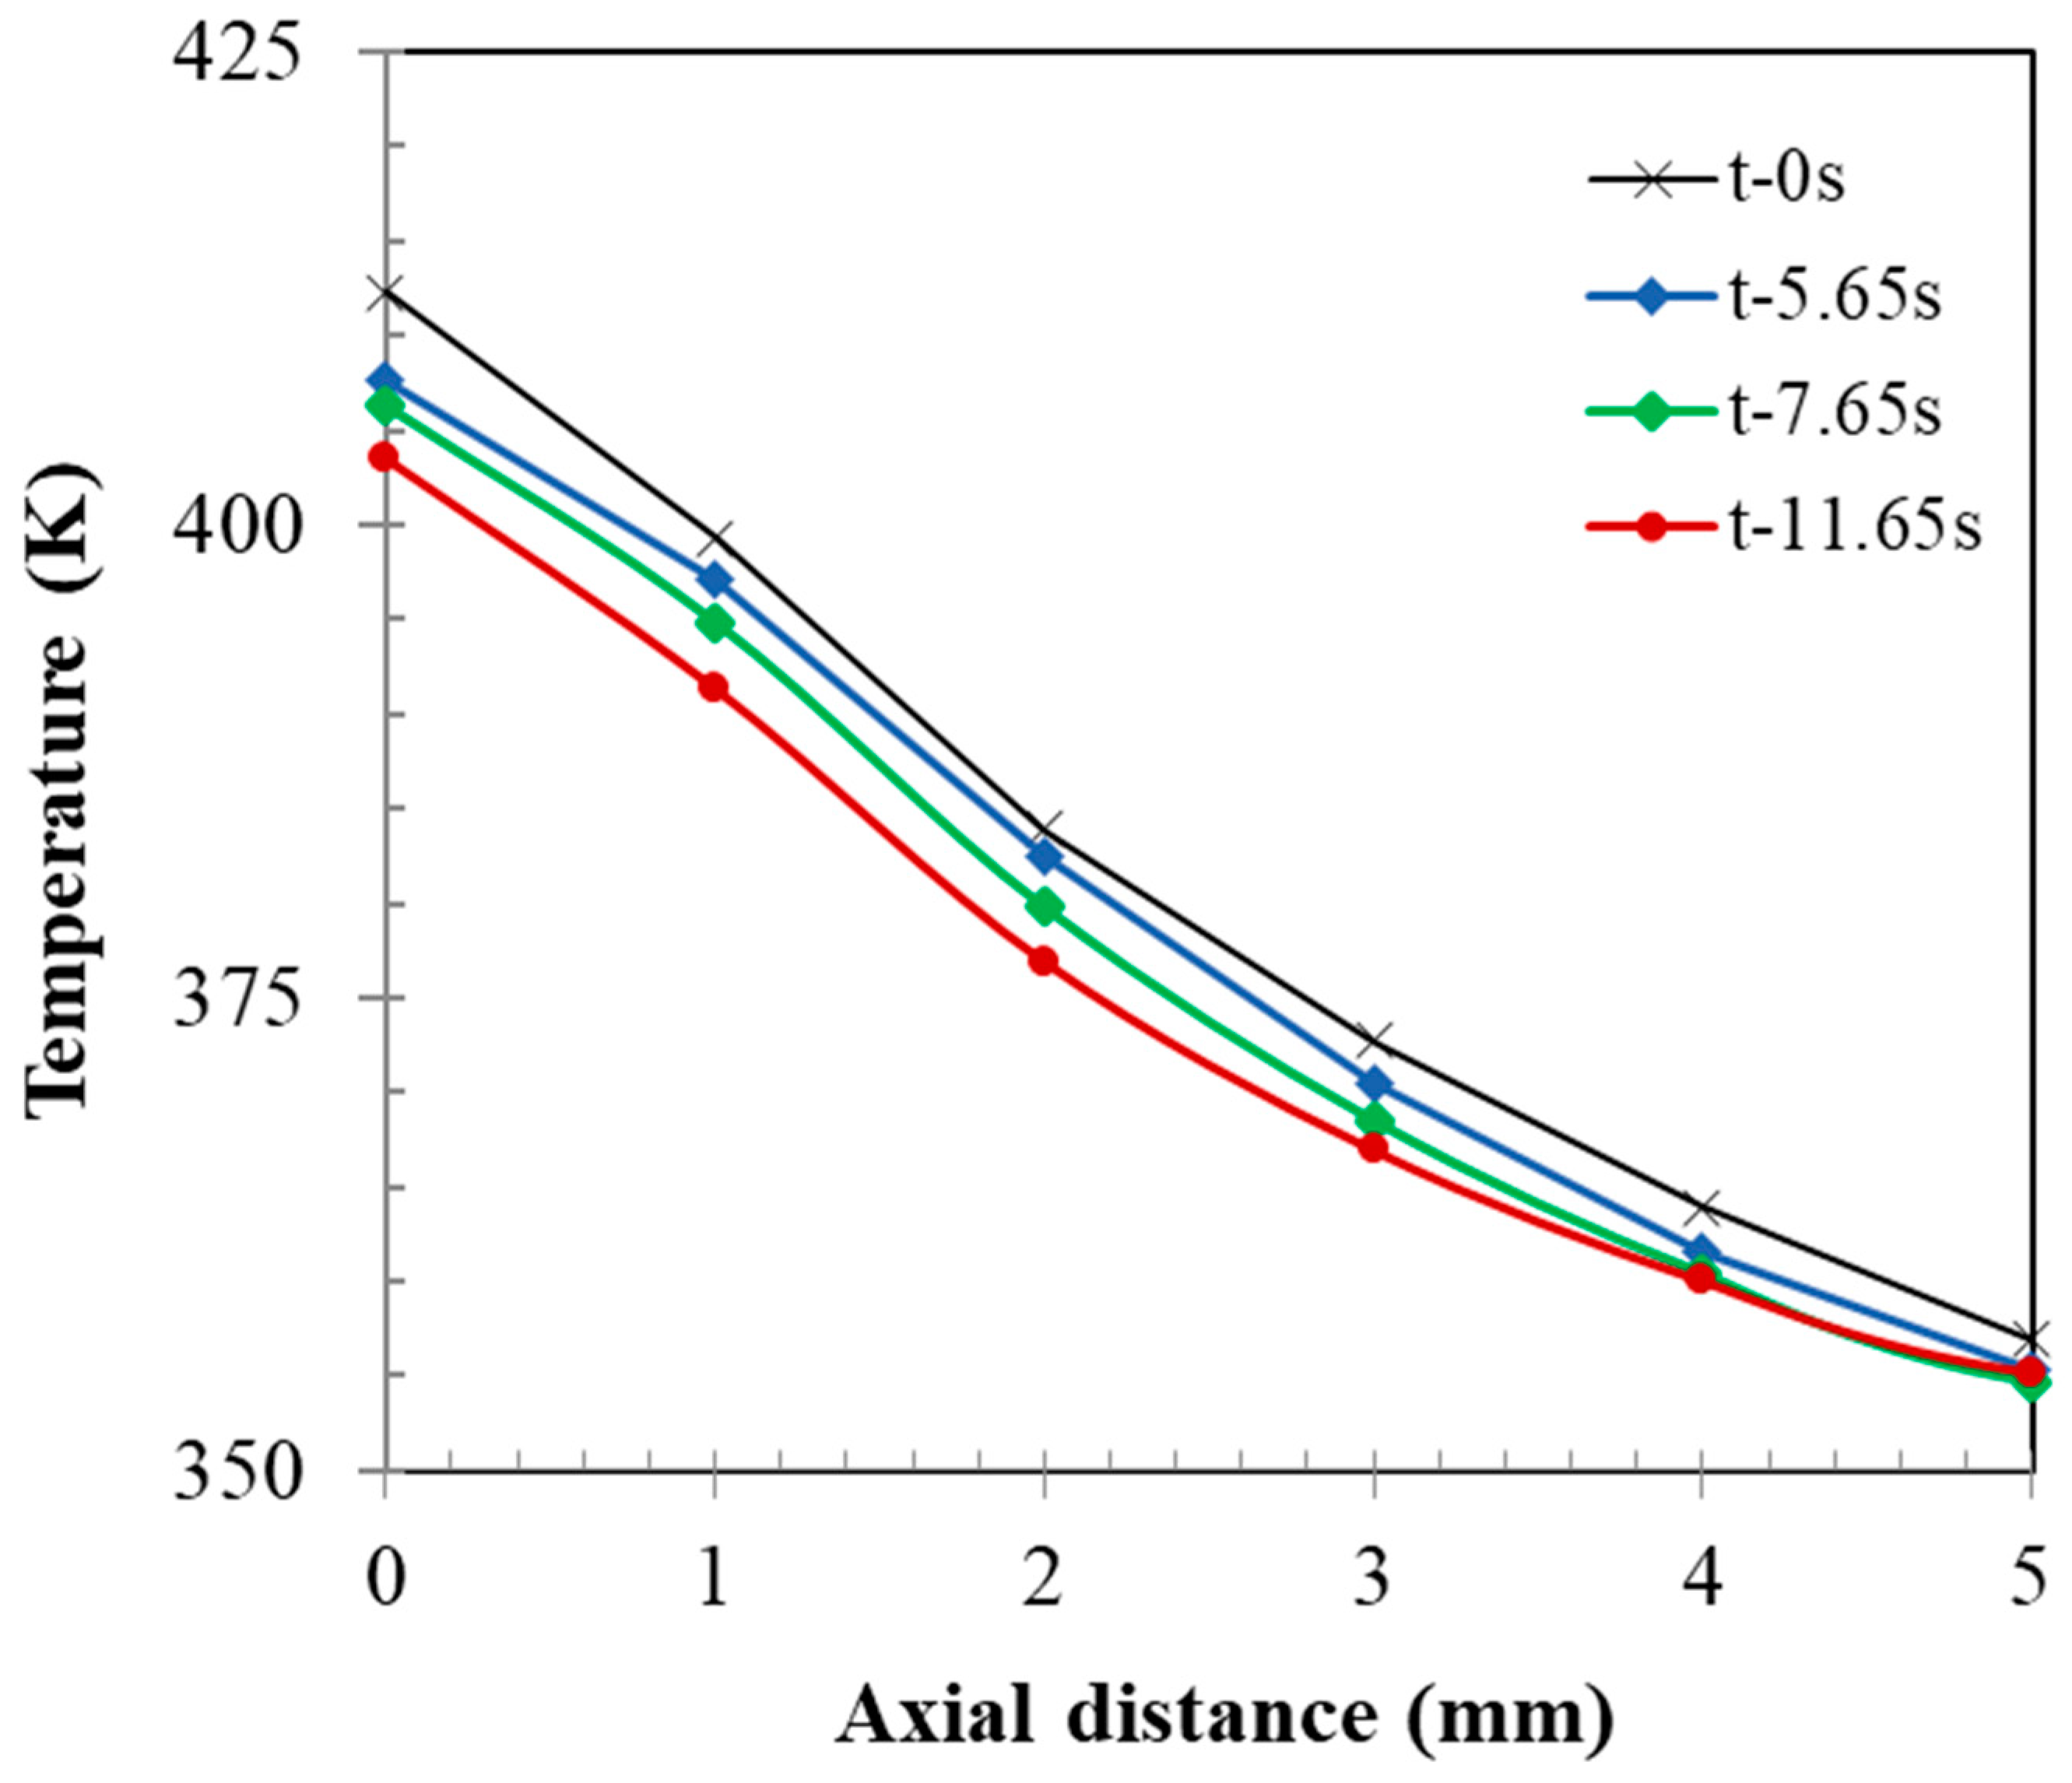
- Although the initial temperature difference between the heated particles and the liquid jet was well above 100 °C, jet impingement caused a significant reduction in the bed temperature locally. This was verified by the CFD model prediction which showed ~60 °C temperature reduction within the first 5 mm of bed depth and explained the formation of granules at the bed surface.
- While the present model does not explicitly capture the intense interactions between the droplets, particles, and vapour plume, which ideally would require a fully coupled CFD-DEM (discrete element method) with an LES sub-model for resolving the eddies, it should be considered in any future study in this area.
Supplementary Materials
Author Contributions
Funding
Data Availability Statement
Acknowledgments
Conflicts of Interest
Nomenclature
| ap | particle surface area |
| Cp | heat capacity |
| dp | particle diameter |
| g | gravitational constant |
| kth | thermal conductivity |
| kth,t | turbulent thermal conductivity |
| L | latent heat of vaporization |
| m | mass of particle |
| Mw | molecular weight |
| P | pressure |
| R | universal gas constant |
| t | time |
| Tp | particle temperature |
| u | velocity |
| y | mole fraction |
| Greek letters: | |
| ρ | density |
| μ | dynamic viscosity |
| ε | bed porosity |
| Φ | particle sphericity |
| λ | latent heat of vaporization |
| σ | surface tension |
| Dimensionless numbers: | |
| Gr | Grashof number |
| Nu | Nusselt number |
| Pr | Prandtl number |
| Re | Reynolds number |
| Sc | Schmidt number |
| Sh | Sherwood number |
| Subscripts: | |
| l | liquid |
| v | vapour |
| s | solid |
| b | bed |
| d | droplet |
References
- Fan, L.-S.; Lau, R.; Zhu, C.; Vuong, K.; Warsito, W.; Wang, X.; Liu, G. Evaporative liquid jets in gas-liquid-solid flow system. Chem. Eng. Sci. 2001, 56, 5871–5891. [Google Scholar] [CrossRef]
- Nayak, S.V.; Joshi, S.L.; Ranade, V.V. Modeling of vaporization and cracking of liquid oil injected in a gas–solid riser. Chem. Eng. Sci. 2005, 60, 6049–6066. [Google Scholar] [CrossRef]
- Ge, Y.; Fan, L.S. Droplet–particle collision mechanics with film-boiling evaporation. J. Fluid Mech. 2007, 573, 311–337. [Google Scholar] [CrossRef]
- Pougatch, K.; Salcudean, M.; McMillan, J. Three-dimensional numerical modelling of interactions between a gas–liquid jet and a fluidized bed. Chem. Eng. Sci. 2012, 68, 258–277. [Google Scholar] [CrossRef]
- Motlagh, A.A.H.; Grace, J.R.; Briens, C.; Berruti, F.; Farkhondehkavaki, M.; Hamidi, M. Experimental analysis of volatile liquid injection into a fluidized bed. Particuology 2017, 34, 39–47. [Google Scholar] [CrossRef]
- Jepsen, P.K.; Juan WLM, D.; Boje, A.; Sarangi, S.; von Corswant, C.; Sasic, S. Wurster fluidised-bed coating: Coarse-graining technique within CFD-DEM in conjunction with heat and mass transfer. Powder Technol. 2024, 443, 119901. [Google Scholar] [CrossRef]
- Cronin, K.; Ortiz, F.J.G. Understanding the evolution of particle size dispersion with time in a fluidised bed granulation process. Powder Technol. 2023, 423, 118502. [Google Scholar] [CrossRef]
- McCann, T.; Marek, E.; Zheng, Y.; Davidson, J.; Hayhurst, A. The combustion of waste, industrial glycerol in a fluidised bed. Fuel 2022, 322, 124169. [Google Scholar] [CrossRef]
- Buchanan, J.S. Analysis of Heating and Vaporization of Feed Droplets in Fluidized Catalytic Cracking Risers. Ind. Eng. Chem. Res. 1994, 33, 3104–3111. [Google Scholar] [CrossRef]
- Mirgain, C.; Briens, C.; Del Pozo, M.; Loutaty, R.; Bergougnou, M. Modeling of Feed Vaporization in Fluid Catalytic Cracking. Ind. Eng. Chem. Res. 2000, 39, 4392–4399. [Google Scholar] [CrossRef]
- Li, T.; Pougatch, K.; Sacluden, M.; Grecov, D. Numerical modelling of an evaporative spray in a riser. Powder Technol. 2010, 201, 213–229. [Google Scholar] [CrossRef]
- Segev, A.; Bankoff, S. The role of adsorption in determining the minimum film boiling temperature. Int. J. Heat Mass Transf. 1980, 23, 637–642. [Google Scholar] [CrossRef]
- Mitra, S.; Sathe, M.J.; Doroodchi, E.; Utikar, R.; Shah, M.K.; Pareek, V.; Joshi, J.B.; Evans, G.M. Droplet impact dynamics on a spherical particle. Chem. Eng. Sci. 2013, 100, 105–119. [Google Scholar] [CrossRef]
- Mitra, S.; Nguyen, T.B.T.; Doroodchi, E.; Pareek, V.; Joshi, J.B.; Evans, G.M. On wetting characteristics of droplet on a spherical particle in film boiling regime. Chem. Eng. Sci. 2016, 149, 181–203. [Google Scholar] [CrossRef]
- Mitra, S.; Evans, G. Dynamic Surface Wetting and Heat Transfer in a Droplet-Particle System of Less Than Unity Size Ratio. Front. Chem. 2018, 6, 259. [Google Scholar] [CrossRef] [PubMed]
- Gehrke, S.; Wirth, K.-E. Interaction phenomena between liquid droplets and hot particles—Captured via high-speed camera. Particuology 2009, 7, 260–263. [Google Scholar] [CrossRef]
- Leclere, K.; Briens, C.; Gauthier, T.; Bayle, J.; Bergougnou, M.; Guigon, P. Liquid vaporization in a fluidized bed. Ind. Eng. Chem. Res. 2001, 40, 5415–5420. [Google Scholar] [CrossRef]
- Leclère, K.; Briens, C.; Gauthier, T.; Bayle, J.; Guigon, P.; Bergougnou, M. Experimental measurement of droplet vaporization kinetics in a fluidized bed. Chem. Eng. Process.—Process. Intensif. 2004, 43, 693–699. [Google Scholar] [CrossRef]
- Milacic, E.; Manzano, M.N.; Madanikashani, S.; Heynderickx, G.; Van Geem, K.; Baltussen, M.; Kuipers, J. Liquid injection in a fluidised bed: Temperature uniformity. Chem. Eng. Sci. 2022, 256, 117622. [Google Scholar] [CrossRef]
- Zafiryadis, F.; Jensen, A.D.; Lin, W.; Hove, E.A.; Larsen, M.B.; Wu, H. CPFD study of volatile liquid injection in a dense gas–solid fluidized bed. Chem. Eng. Sci. 2022, 261, 117967. [Google Scholar] [CrossRef]
- Wang, X.; Zhu, C. Concentric evaporating spray jets in dilute gas–solids pipe flows. Powder Technol. 2004, 140, 56–67. [Google Scholar] [CrossRef]
- Behjat, Y.; Shahhosseini, S.; Marvast, M.A. Simulation study of droplet vaporization effects on gas–solid fluidized bed. J. Taiwan Inst. Chem. Eng. 2011, 42, 419–427. [Google Scholar] [CrossRef]
- Mitra, S.; Sathe, M.J.; Doroodchi, E.; Evans, G.M. Investigation of droplet evaporation in a bubbling fluidized bed. In Proceedings of the Ninth International Conference on CFD in the Minerals and Process Industries, Melbourne, Australia, 10–12 December 2012. [Google Scholar]
- Elsinga, G.E. Density Measurements by Means of Schlieren Methods—Assessment and Application of Calibrated Color Schlieren and Background Oriented Schlieren. Master’s Thesis, Department of Aerospace Engineering, Delft University of Technology, Delft, The Netherlands, 2003. [Google Scholar]
- Kelly-ZION, P.L.; Pursell, C.J.; Booth, R.S.; VanTilburg, A.N. Evaporation rates of pure hydrocarbon liquids under the influence of natural convection and diffusion. Int. J. Heat Mass Transf. 2009, 52, 3305–3313. [Google Scholar] [CrossRef]
- ANSYS FLUENT Theory Guide (2011) Release 14.0. Available online: https://www.afs.enea.it/project/neptunius/docs/fluent/html/th/main_pre.htm (accessed on 15 January 2025).
- Ergun, S. Fluid flow through packed columns. Chem. Eng. Prog. 1952, 48, 9–94. [Google Scholar]
- Ranz, W.E.; Marshall, W.R. Evaporation from drops. Chem. Eng. Prog. 1952, 48, 141–146 (Part I)+173–180 (Part II). [Google Scholar]
- Chandra, S.; Avedisian, C.T. On the collision of a droplet with a solid surface. Proc. R. Soc. Lond. A 1991, 432, 13–41. Available online: https://www.jstor.org/stable/51903 (accessed on 15 January 2025). [CrossRef]
- Bernardin, J.D.; Mudawar, I. The Leidenfrost Point: Experimental Study and Assessment of Existing Models. J. Heat Transf. 1999, 121, 894–903. [Google Scholar] [CrossRef]
- Bernardin, J.D.; Mudawar, I. A Cavity Activation and Bubble Growth Model of the Leidenfrost Point. J. Heat Transf. 2002, 124, 864–874. [Google Scholar] [CrossRef]
- Bernardin, J.D.; Mudawar, I. A Leidenfrost Point Model for Impinging Droplets and Sprays. J. Heat Transf. 2004, 126, 272–278. [Google Scholar] [CrossRef]
- Berenson, P.J. Film-Boiling Heat Transfer from a Horizontal Surface. ASME J. Heat Transf. 1961, 83, 351–356. [Google Scholar] [CrossRef]
- Baumeister, K.J.; Simon, F.F. Leidenfrost temperature—Its correlation for liquid metals, Cryogens, Hydrocarbons, and water. ASME J. Heat Transf. 1973, 95, 166–173. [Google Scholar] [CrossRef]
- Matt, C. An Evaluation of Turbulence Models for the Numerical Study of Forced and Natural Convection Flow in Atria. Master’s Thesis, Queen’s University, Kingston, ON, Canada, 2009. [Google Scholar]
- Zhang, Z.; Zhang, W.; Zhai, Z.J.; Chen, Q.Y. Evaluation of Various Turbulence Models in Predicting Airflow and Turbulence in Enclosed Environments by CFD: Part 2—Comparison with Experimental Data from Literature. HVAC&R Res. 2007, 13, 871–886. [Google Scholar] [CrossRef]


| Physical Properties | Acetone (l) (20 °C) | Acetone (l) (56 °C) | Acetone (v) (56 °C) | Acetone (v) (150 °C) |
|---|---|---|---|---|
| Density (kg/m3) | 785.3 | 744.5 | 2.15 | 1.673 |
| Viscosity (Pa·s) | 0.318 × 10⁻³ | 0.225 × 10⁻³ | 7.01 × 10⁻⁶ | 9.385 × 10⁻⁶ |
| Surface tension (N/m) | 0.02491 | 0.02039 | - | - |
| Heat capacity (kJ/kg/K) | 2.105 | 2.236 | 1.365 | 1.648 |
| Thermal conductivity (w/m/K) | 0.1596 | 0.145 | 0.0143 | 0.02194 |
| Latent heat of evaporation (kJ/kg) | 501.9 |
| Variables | Values |
|---|---|
| Bed void fraction | 0.5 |
| Sauter Mean Diameter of solid particles (D32) | 114 µm |
| Inlet velocity | 0.0157 m/s |
| Inlet temperature | 423 K |
| Outlet pressure | 101,325 Pa |
| Bed wall temperature | 423 K |
| Ambient temperature | 293 K |
| Injection position | (x, y): (0, 0.17 m) |
| Acetone droplet size | 0.002 m |
| Acetone mass flow rate | 2.145 × 10⁻⁴ kg/s |
| Inlet temperature | 293 K |
Disclaimer/Publisher’s Note: The statements, opinions and data contained in all publications are solely those of the individual author(s) and contributor(s) and not of MDPI and/or the editor(s). MDPI and/or the editor(s) disclaim responsibility for any injury to people or property resulting from any ideas, methods, instructions or products referred to in the content. |
© 2025 by the authors. Licensee MDPI, Basel, Switzerland. This article is an open access article distributed under the terms and conditions of the Creative Commons Attribution (CC BY) license (https://creativecommons.org/licenses/by/4.0/).
Share and Cite
Mitra, S.; Evans, G.M. Vaporization Dynamics of a Volatile Liquid Jet on a Heated Bubbling Fluidized Bed. Fluids 2025, 10, 19. https://doi.org/10.3390/fluids10010019
Mitra S, Evans GM. Vaporization Dynamics of a Volatile Liquid Jet on a Heated Bubbling Fluidized Bed. Fluids. 2025; 10(1):19. https://doi.org/10.3390/fluids10010019
Chicago/Turabian StyleMitra, Subhasish, and Geoffrey M. Evans. 2025. "Vaporization Dynamics of a Volatile Liquid Jet on a Heated Bubbling Fluidized Bed" Fluids 10, no. 1: 19. https://doi.org/10.3390/fluids10010019
APA StyleMitra, S., & Evans, G. M. (2025). Vaporization Dynamics of a Volatile Liquid Jet on a Heated Bubbling Fluidized Bed. Fluids, 10(1), 19. https://doi.org/10.3390/fluids10010019