Abstract
In a non-transferred plasma torch, the working gas becomes ionized and forms plasma as it interacts with the electric arc at the cathode tip. However, in certain cathode shapes, particularly flat ones, and under specific conditions, the gas flow can separate at the cathode tip, forming a vortex region. While this flow separation is influenced by geometric factors, it occurs in the critical zone where plasma is generated. Understanding the causes of this separation is essential, as it may significantly impact torch performance. If the separation proves detrimental, it is important to identify ways to mitigate it. This paper presents a computational analysis of a non-transferred plasma torch to investigate the physics behind flow separation. The results highlight the location and causes of the separation, as well as its potential advantages and disadvantages. Finally, the paper explores theoretical approaches to address flow separation in plasma torches, offering practical insights for enhancing their design and efficiency.
1. Introduction
A conventional DC non-transferred plasma torch typically consists of a tungsten rod cathode and a water-cooled copper anode shaped as a nozzle. The voltage difference between the cathode and anode generates an arc within the channel. This arc naturally follows the shortest path, often resulting in a shorter arc length and lower torch voltage [1]. An insulator separates the electrodes and includes an inlet for the working gas. When this gas is introduced into the gap between the electrodes, a DC arc forms and is forced through the nozzle, creating a high-temperature, high-velocity plasma jet. Electromagnetic forces and gas flow stabilize and constrict the arc column, heating the plasma to nearly 14,000 K [2]. The arc current produces Joule heating, which ionizes the gas, leading to rapid expansion and significant increases in temperature and velocity. Additionally, the arc current interacts with its self-induced magnetic field, and the resulting Lorentz force further accelerates the gas toward the outlet.
The flow dynamics inside a plasma torch are influenced by factors such as the working gas, input power, flow rate, and the shape and size of the electrodes. Previous studies have examined the effects of these parameters [3]. This study specifically focuses on flow separation phenomena at the cathode tip. In rod-type DC non-transferred plasma torches, three common cathode designs—flat, tapered, and conical—are typically used, as shown in Figure 1 [1,4,5,6]. The shape of the cathode tip plays a critical role in stabilizing the plasma arc and ensuring overall torch performance [7]. Conical and tapered cathodes provide smooth flow transitions due to their gradual shapes, while flat cathodes cause abrupt changes in flow, leading to flow separation at the tip. Understanding this flow separation is crucial, as gas ionization and plasma formation occur in this region.
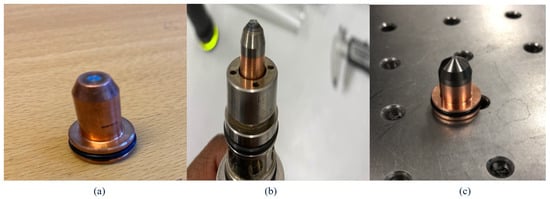
Figure 1.
(a) Flat cathode, (b) tapered cathode, (c) conical cathode.
Comprehending the flow physics inside plasma torches is essential for designing more efficient systems. Experimental techniques face significant challenges due to the extreme temperature and velocity inside plasma torches, making computational methods the preferred approach. Early computational studies in the 1990s by researchers at the Massachusetts Institute of Technology utilized magnetohydrodynamics (MHD) equations under the assumption of local thermal equilibrium (LTE) to analyze the effects of electric arcs on plasma jet temperature and velocity [1,8]. In the early 2000s, He-Ping et al. conducted 3D computational analyses using similar MHD models, predicting the arc attachment location on the anode surface [9]. Jing et al. also used 2D axisymmetric MHD modeling, concluding that arc voltage increases linearly with mass flow rate when the current and outlet temperature are held constant [10]. While most early research assumed fully ionized plasma under LTE conditions, more recent studies have shifted toward non-LTE models. Comparative studies of LTE and non-LTE methods have explored plasma torch jet structures, showing that non-LTE models offer higher accuracy but are more complex to implement [11,12,13]. LTE models remain reliable except in boundary layer regions, where the LTE approximation becomes invalid.
Recent advancements in plasma torch modeling include studies by Zhukovskii et al., which integrated a one-dimensional non-LTE plasma sheath model near the cathode (developed by Benilov and Marotta) with a 3D two-temperature MHD model for the plasma body [7,14,15]. Since their inception three decades ago, plasma torches have often incorporated some form of plasma swirl to stabilize the arc and flow. For example, Perambadur et al. used a transient 3D LTE model to study swirl dynamics and secondary gas injection for stabilizing arc and flow fluctuations. Another method to induce swirl involves applying an external axial magnetic field via a solenoid, creating azimuthal plasma motion that further stabilizes the arc. This technique, initially explored in fusion plasma physics in the 1950s, was recently applied to plasma torches by Perambadur et al., showing significant reductions in axial arc column fluctuations [12].
Although numerous studies agree that swirl generally stabilizes the arc and plasma flow, the underlying physics are less frequently discussed. Swirl minimizes pressure in the region behind the cathode, generating a favorable pressure gradient along the cathode wall that eliminates flow separation or recirculating zones. Zhou et al. demonstrated that swirl effectively prevents flow separation behind the cathode, though they noted that stagnation flow in this region could increase torch pressure, accelerating cathode erosion [14]. Nemchinsky and Showalter confirmed these findings through experimental and theoretical studies [16]. Despite this, computational studies often limit their analyses to specific operating conditions, such as fixed power levels, leaving gaps in understanding how swirl flow behaves under varying conditions. For instance, at high discharge currents, swirl may fail to eliminate flow separation, as Zhou et al. highlighted [14].
The aim of this study is to provide a comprehensive investigation of flow separation at the cathode tip using computational modeling of MHD equations. By analyzing separation conditions and locations, the study evaluates whether flow separation positively or negatively impacts torch performance. Furthermore, it proposes methods for mitigating flow separation to optimize torch efficiency and durability.
2. Computational Modeling
The physics inside a non-transferred plasma torch involves the combination of electromagnetics and flow modeling. In this study, computational analysis is conducted in COMSOL v.6.1 using the Equilibrium Discharge Interface (EDI) model under plasma models, with the validity of the model explained in our previous work [3]. The EDI method helps to model thermal plasmas generated by arcs or inductively coupled discharges, which are assumed to be under partial or complete local thermal equilibrium (LTE) conditions [17]. At the macroscopic level, these plasmas can be considered conductive fluid mixtures, leading to the magnetohydrodynamic (MHD) equations. This approach combines the Navier–Stokes, heat, and Maxwell equations to describe the motion of the conducting fluid in the electromagnetic field. The EDI is based on assumptions that simplify the MHD equations.
- The plasma is a two-component mixture of electrons and ions.
- The plasma is under the LTE condition, that is, the electron temperature is approximately equal to the heavy particle temperature under a low electric field at atmospheric pressure.
- The plasma flow is considered to be a locally neutral Newtonian fluid mixture.
- The plasma flow is laminar (The density of the working gas used in the simulations is very low, which leads the Reynolds number to be in the laminar flow range).
- The plasma is optically thin.
2.1. Governing Equations
Considering the aforementioned assumptions, the equilibrium discharges can be described by a set of equations defined within the physics interface, which encompasses the various multiphysics interfaces.
Mass conservation
where the velocity (u) is defined in the axial and tangential directions. Here, is the mass density of the fluid.
Momentum equation
where p denotes the pressure, represents the stress tensor, is dynamic viscosity, B is the magnetic field, is electrical conductivity and E is the electric field.
Conservation of energy
where is the Ohmic heating, 4 the volumetric radiation loss, is Boltzmann constant and is the work conducted by the pressure.
Maxwell equations
Here, as in current equations there is no source within the plasma. Further, the self-induced magnetic field is calculated from Ampere’s law
In the above equation, B is magnetic flux density, A is magnetic vector potential and H is the magnetic field. Models B and H are related using relative permeability defined by the material property.
No equation of state is necessary since an equation of state follows from the energy equation only after simplifying conditions. For the solution of these equations, boundary conditions are necessary. Boundary conditions are specified and explained in the following section.
2.2. Geometry and Modeling Setup
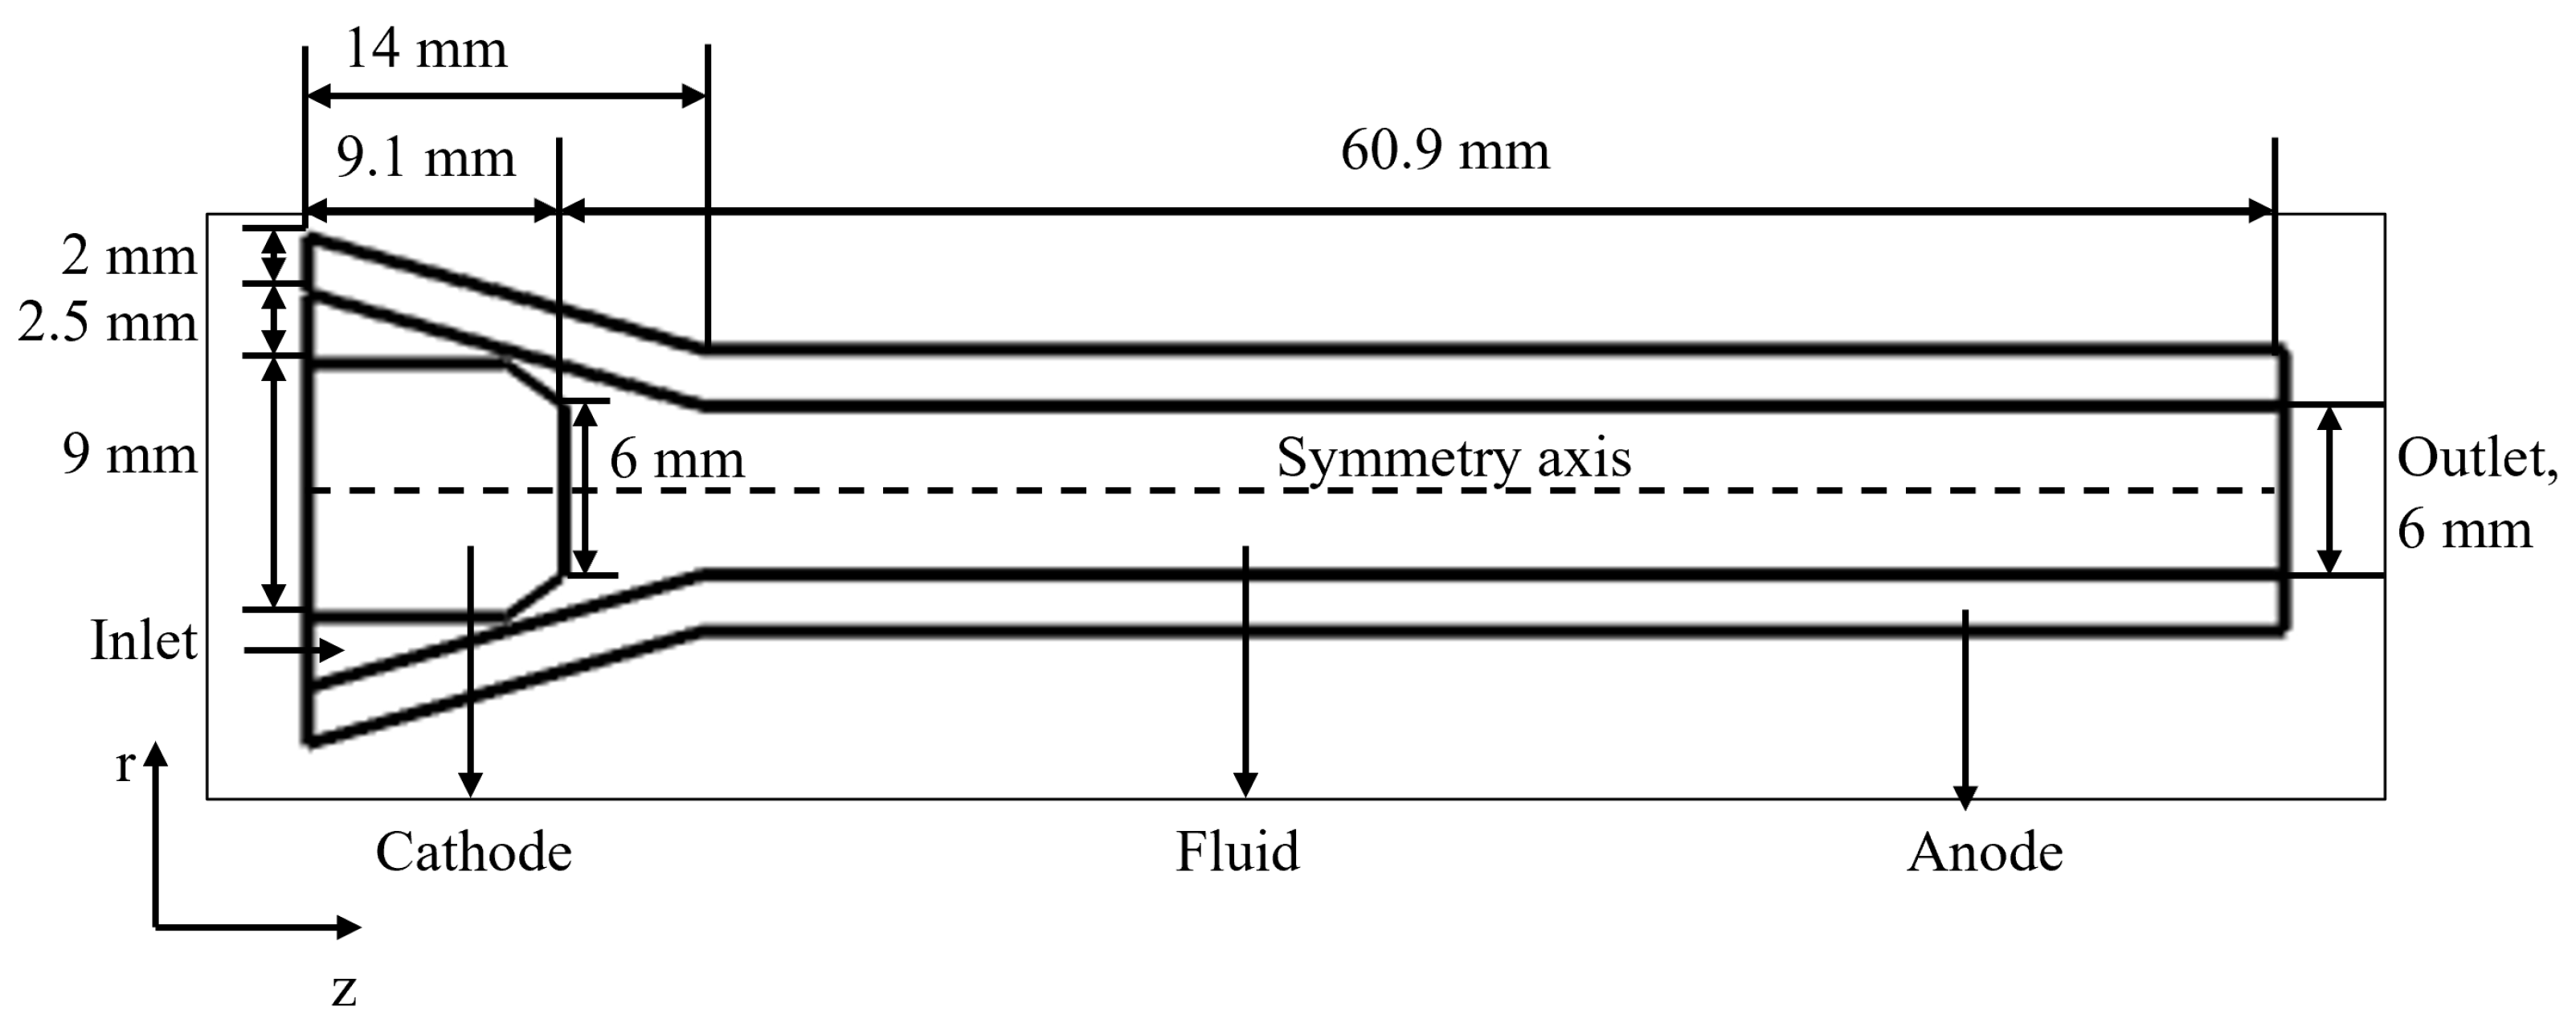
The geometry, dimensions, and input conditions used in this analysis are based on the 18 kW DC plasma torch (PNIX-100R1 model, Plasnix, Incheon, Republic or Korea) employed in our experiments [18]. Figure 2 presents a schematic of the 2D axisymmetric geometry that shows cathode, anode, and fluid regions. The cathode has a diameter of 9 mm and a length of 9.1 mm and is made of tungsten. The anode is 70 mm long with a 6 mm outlet diameter and is made of copper. The region between the electrodes represents the fluid domain, defined as nitrogen. The material properties of nitrogen are specified for ionized nitrogen up to a temperature of 24,000 K, with detailed ionization properties outlined in our previous work [3].
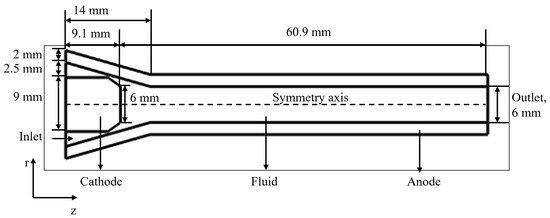
Figure 2.
Schematic representation of the plasma torch geometry used for all analysis cases.
A triangular mesh is defined for the geometry. To understand the impact of the mesh, a grid-independent study is conducted for different mesh sizes: mesh 1: 10,141, mesh 2: 15,926, mesh 3: 47,162, and mesh 4: 248,541 elements. It could be observed that mesh has very little influence on the velocity and temperature variations. However, the experimentally measured velocity is slightly closer to the velocity obtained using mesh 4. Therefore, further analysis was conducted using mesh 4. The results indicated that the mesh with 248,541 elements produced results most consistent with experimental data, and this mesh was used for all subsequent case studies.
In this study, the computational modeling involves multiphysics simulations, with each model solved only in the relevant regions. The electric and magnetic field model is applied in the cathode and fluid regions, the laminar flow model in the fluid region, and the heat and mass transfer model in the cathode, anode, and fluid regions. In the electric and magnetic field model, the primary input parameter is the current density, defined at the cathode tip to control the input power. Different power levels are examined, with the current density magnitude ranging from to . The current density defined at the cathode tip is negative to maintain outward current flow. The anode region is set as the ground. The working gas enters the system between the cathode and anode, as shown in Figure 2. For the laminar flow model, the main input is the nitrogen flow rate, set close to 60 L/min (the flow rates and the direction of flow are adjusted for different case studies) for all case studies. The outlet boundary condition is defined at the plasma torch exit. In the heat and mass transfer model, the cathode tip is maintained at a temperature of 3500 K to initiate thermionic emissions [19]. During thermionic emission, positive ions from the plasma are accelerated toward the cathode, generating heat at the electrode surface. As the electrode heats up, more electrons are emitted via thermionic emissions, which in turn cools the cathode. Further, the convective heat flux is defined at the anode region, with a heat transfer coefficient (h) of 10,000 and a temperature of 500 K; the values are obtained from the literature [1].
COMSOL recommends the use of Multifunctional Massively Parallel Sparse Direct Solvers (MUMPS) and Parallel Sparse Direct Solvers (PARDISO) for solving multiphysics problems. These direct methods are based on lower-upper (LU) decomposition. There are two approaches to obtaining solutions: the fully coupled approach and the segregated approach. In the fully coupled approach, a single large system of equations is formed, solving for all unknowns simultaneously and including all couplings between the unknowns in a single iteration. In contrast, the segregated approach subdivides the problem into two or more segregated steps, solving subsets of the unknowns sequentially. In our previous work, we conducted a case study to determine the most effective solver. We concluded that the PARDISO solver, used with the fully coupled approach, provided better convergence results in less time [3].
3. Results
This section presents the computational results obtained from various case studies, conducted by varying the input power (by adjusting the surface current parameter) and flow directions.
3.1. Position and Condition at Which Separation Occurs
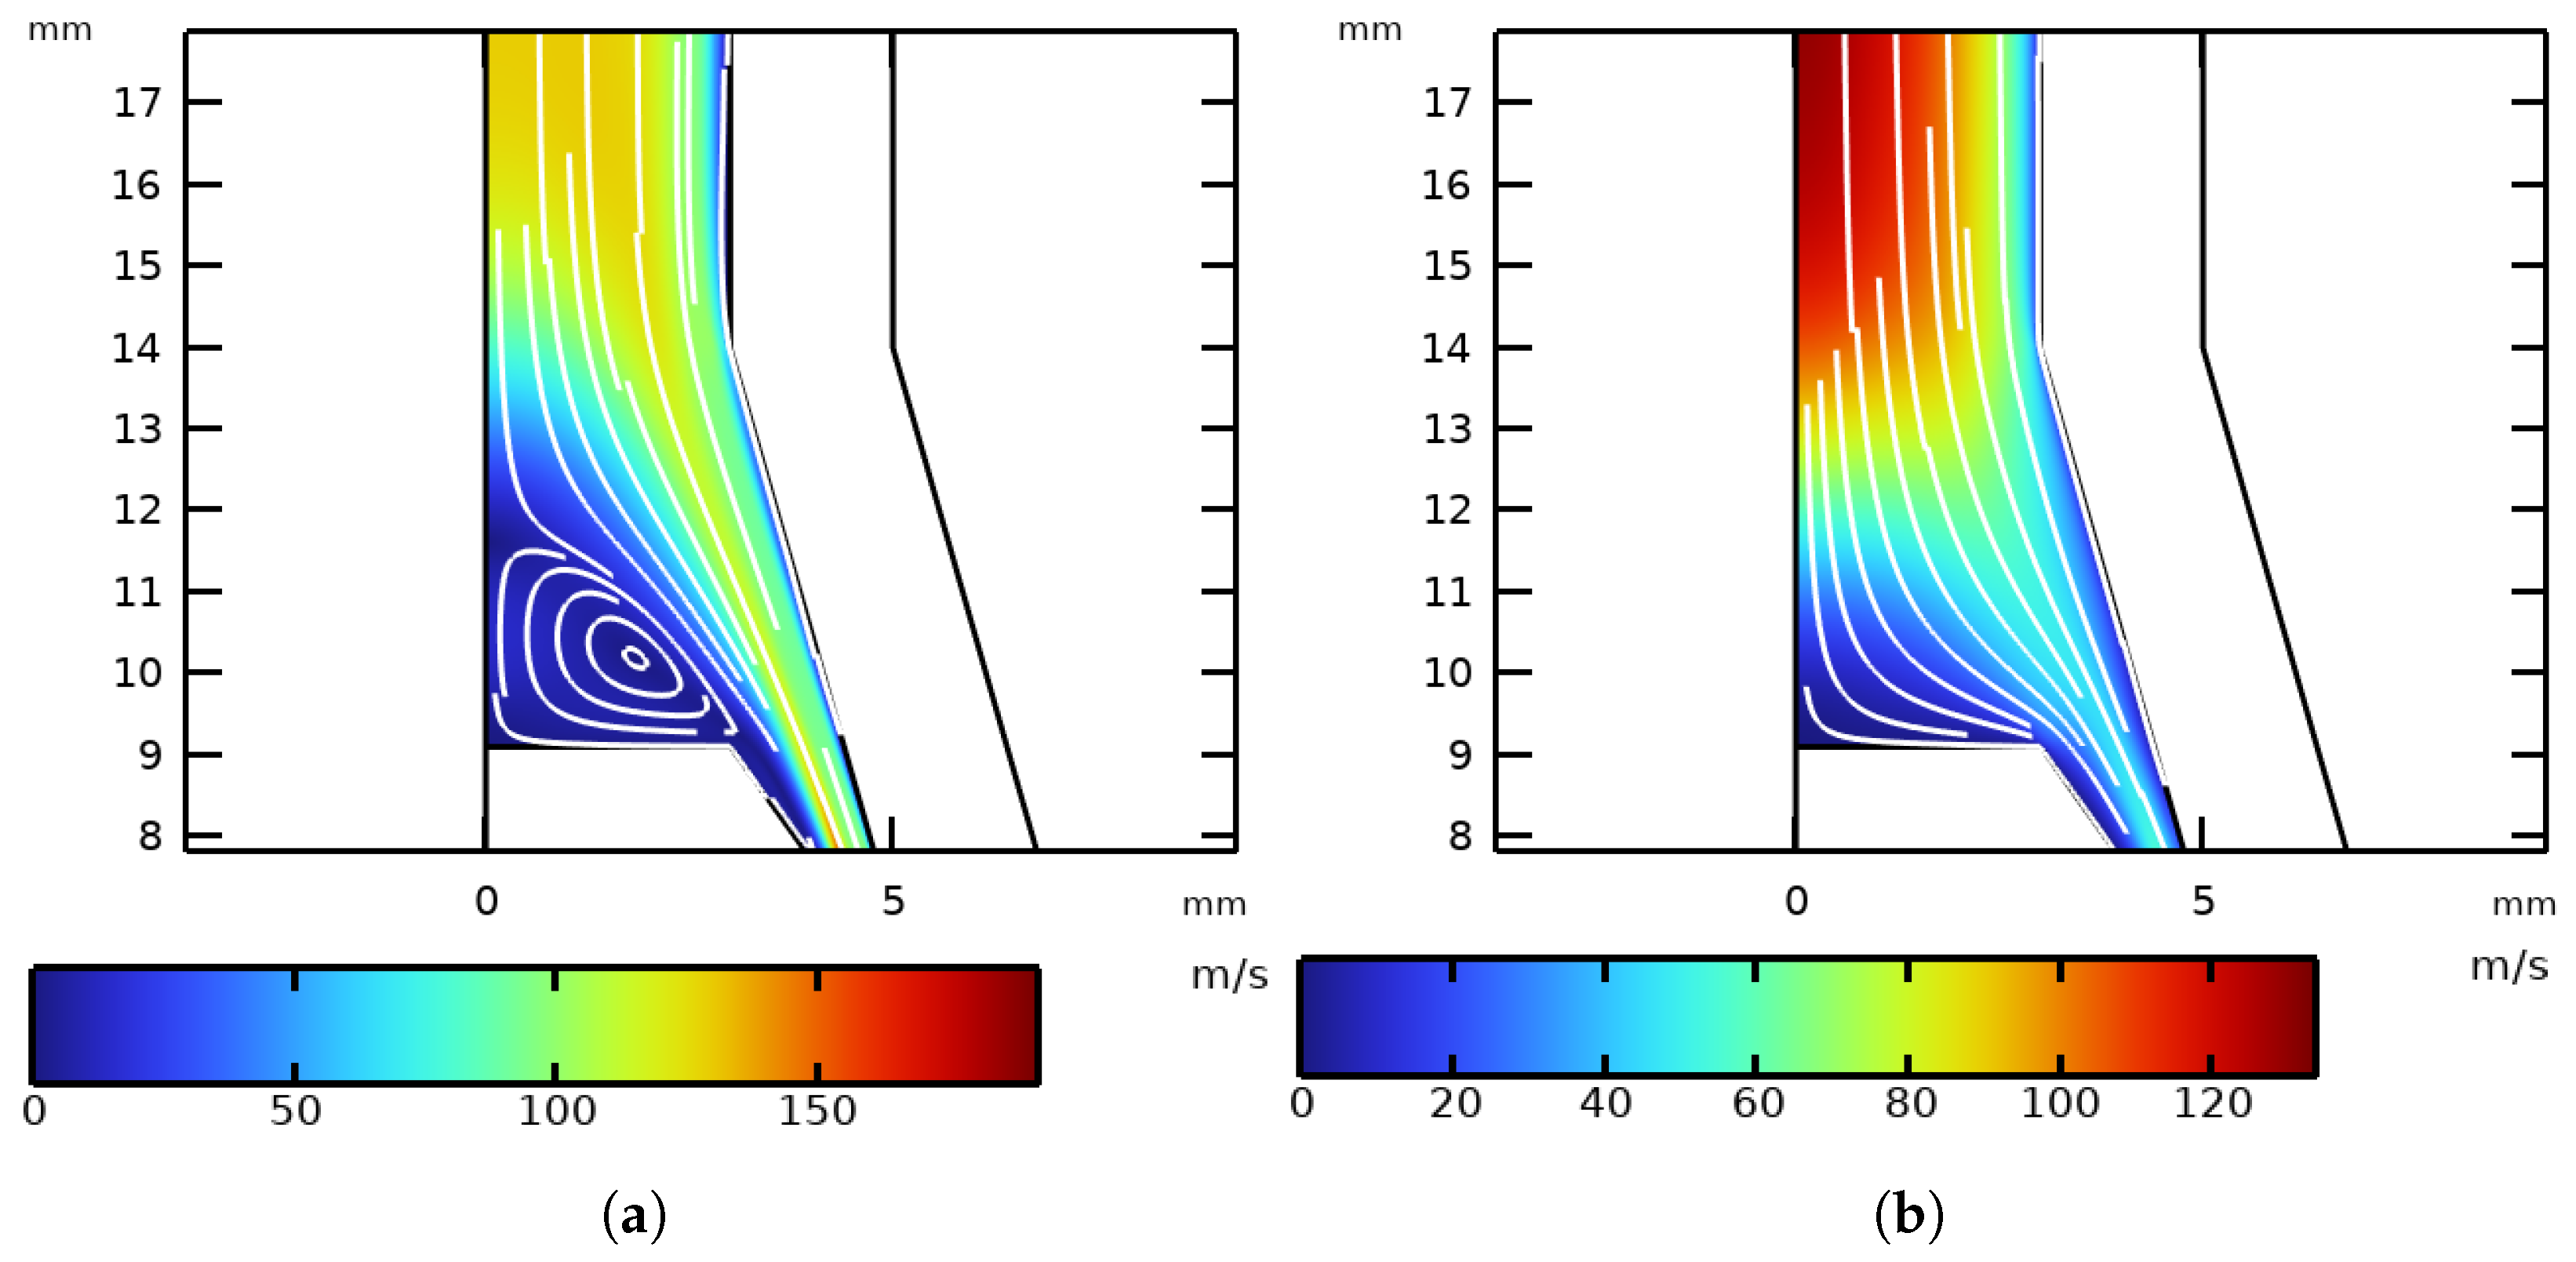
Figure 3 illustrates the velocity magnitude and streamlines at 1 kW input power and by changing the directions of the inlet velocity. Figure 3a shows the streamlines for an inflow rate of 60 L/min, with 10% tangential flow and 90% axial flow. Flow separation at the cathode tip is evident.

Figure 3.
Surface plot and streamlines of velocity (a) Cases with 10% tangential and 90% axial flow at 1 kW and. (b) Cases with 10% axial and 90% tangential flow at 1 kW input power.
Figure 3b illustrates cases with a distribution of 90% tangential and 10% axial flow at 1 kW input power, respectively. No flow separation is observed at the cathode tip in this case. These findings indicate that flow separation at the cathode tip primarily occurs when the axial flow component dominates the tangential flow.
Furthermore, the input power plays a crucial role in influencing flow separation. Table 1 summarizes the range of power levels at which flow separation at the cathode tip occurs under various inflow conditions. The case studies show that flow separation occurs at low and high input power levels, with a mid-range of power where separation is not observed.

Table 1.
Range of powers for different inflow conditions (inflow in the axial direction is and inflow in the tangential direction is ) at which the separation at the cathode tip is observed.
3.2. General Effects of Separation
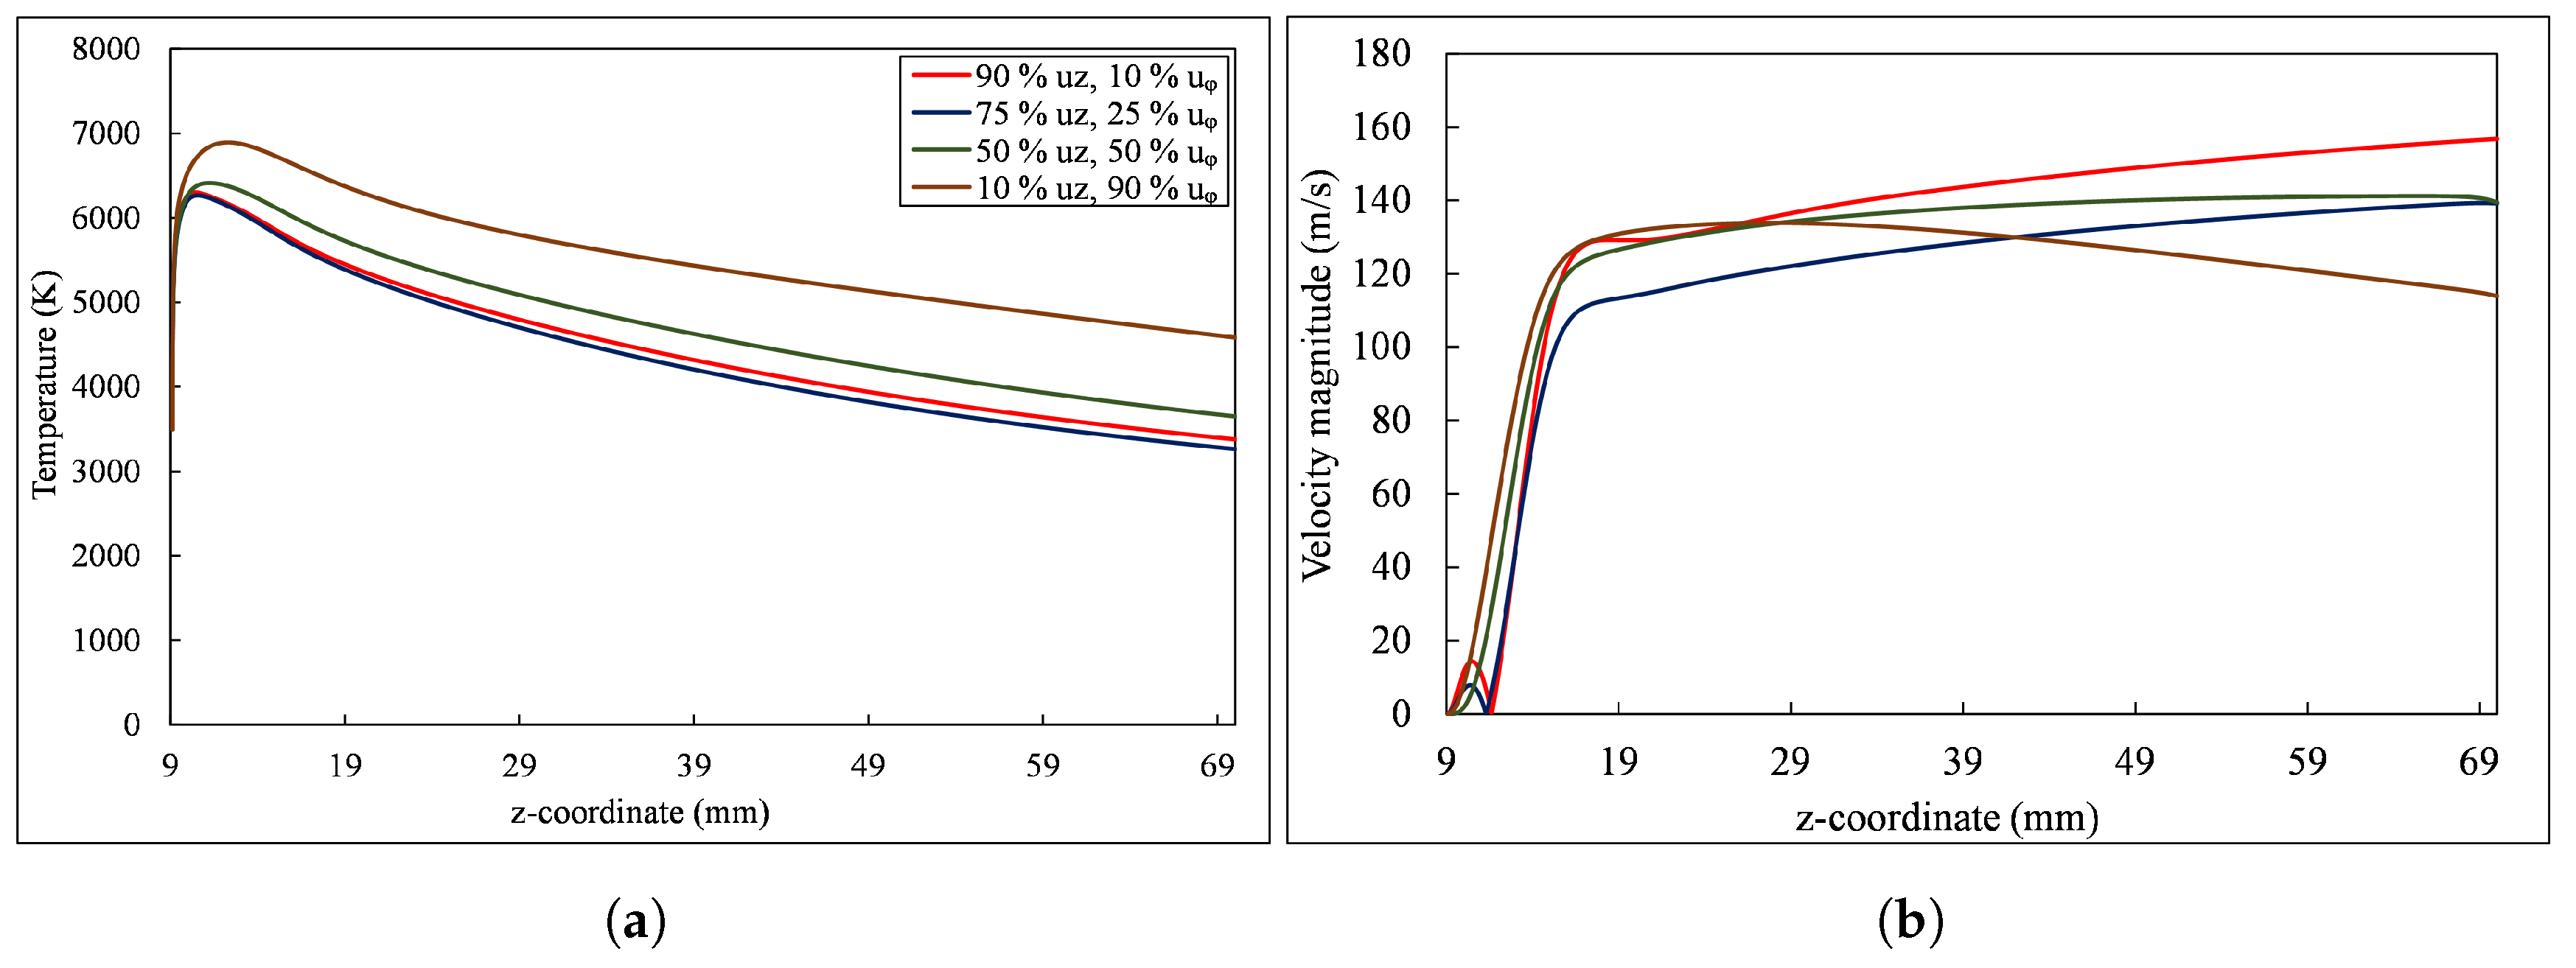
To examine the effect of flow separation at the cathode tip, velocity and temperature profiles were plotted along the symmetry axis from the cathode tip to the outlet. Additionally, surface plots of electric potential and streamlines of electric field are plotted by maintaining a constant inflow rate of 60 L/min while varying the flow directions, with a fixed input power of 1 kW.
Figure 4a shows the temperature distribution of the plasma jet under different flow conditions. In all cases, the temperature increases near the cathode tip and decreases toward the outlet due to cooling from the anode. However, as tangential flow increases, the temperature at the cathode tip rises by approximately 700 K, and at the torch outlet by around 1200 K.
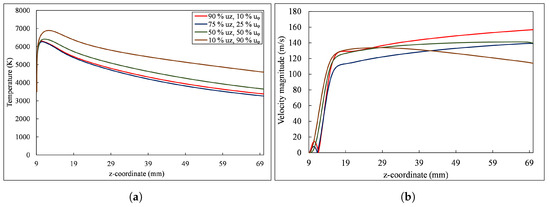
Figure 4.
(a) Temperature and (b) velocity variations for different flow conditions at the same input power (1 kW).
Figure 4b illustrates the velocity profile of the plasma jet. The black line and blue line represent cases where axial flow dominates, both showing flow separation at the cathode tip. In contrast, the green and brown lines correspond to cases where tangential flow is equal to or greater than axial flow, with no separation observed. According to the literature, plasma jet velocity typically increases sharply at the cathode tip due to gas expansion and gradually decreases toward the outlet [1]. However, in cases with flow separation, the velocity continues to increase toward the outlet, whereas in cases without separation, the jet velocity follows the expected trend, decreasing towards the outlet.
3.3. Ways to Avoid Separation at the Cathode Tip
Studies on flow separation have highlighted both the benefits and drawbacks associated with this phenomenon. In conventional fluids, flow separation typically results in mechanical energy dissipation, as evidenced by total pressure losses within the system. It may also induce unsteady, time-dependent flows accompanied by vortex shedding. However, it is important to note that the present study models plasma as a fluid, which diverges from the true behavior within the boundary layers at the cathode and anode. In a more detailed plasma analysis, especially near the cathode, the local thermodynamic equilibrium (LTE) model does not hold, and charge neutrality is not maintained [15]. This region, where arc discharge initiation occurs, is not fully understood regarding convection, which is rarely explored in the literature. The depth of this near-cathode layer is extremely thin—significantly thinner than the velocity boundary layer—thus suggesting that the convection effects within it should be minimal.
As shown in Figure 4, applying adequate swirl flow helps to reduce flow separation. However, the resulting increase in torch pressure may also accelerate cathode erosion. Previous findings have pinpointed the regions and conditions under which flow separation occurs at the cathode tip and examined its influence on jet flow characteristics. To effectively mitigate separation at the cathode tip, a deeper understanding of the roles of flow direction and input power is essential. The subsequent section provides a detailed analysis of these factors.
3.3.1. Low Currents
Figure 4 illustrates cases where flow separation at the cathode tip occurs when axial flow dominates over tangential swirl flow. For the case of the dominating swirl as in Figure 3b, near the cathode there is no separation, and the flow is a type of reversed stagnation point flow. Further downstream there is also a region in which the plasma undergoes a nearly rigid body rotation and can be characterized by an angular velocity . This flow configuration resembles that of a Bodewadt boundary layer, which is an exact solution of the Navier–Stokes equations. Although the Bodewadt flow is incompressible and extends infinitely, it is considered valid locally behind the cathode in this context. In the Bödewadt boundary layer, the velocity components are assumed to be of the stagnation point type.
To gain further insights into the effects of swirl flow, the theory of the Bodewadt boundary layer is applied. In the Bödewadt boundary layer, the velocity components are assumed to be of the stagnation flow point type as Equations (7)–(9). See details in Appendix A. Far downstream, the pressure variation follows the behavior predicted by these equations.
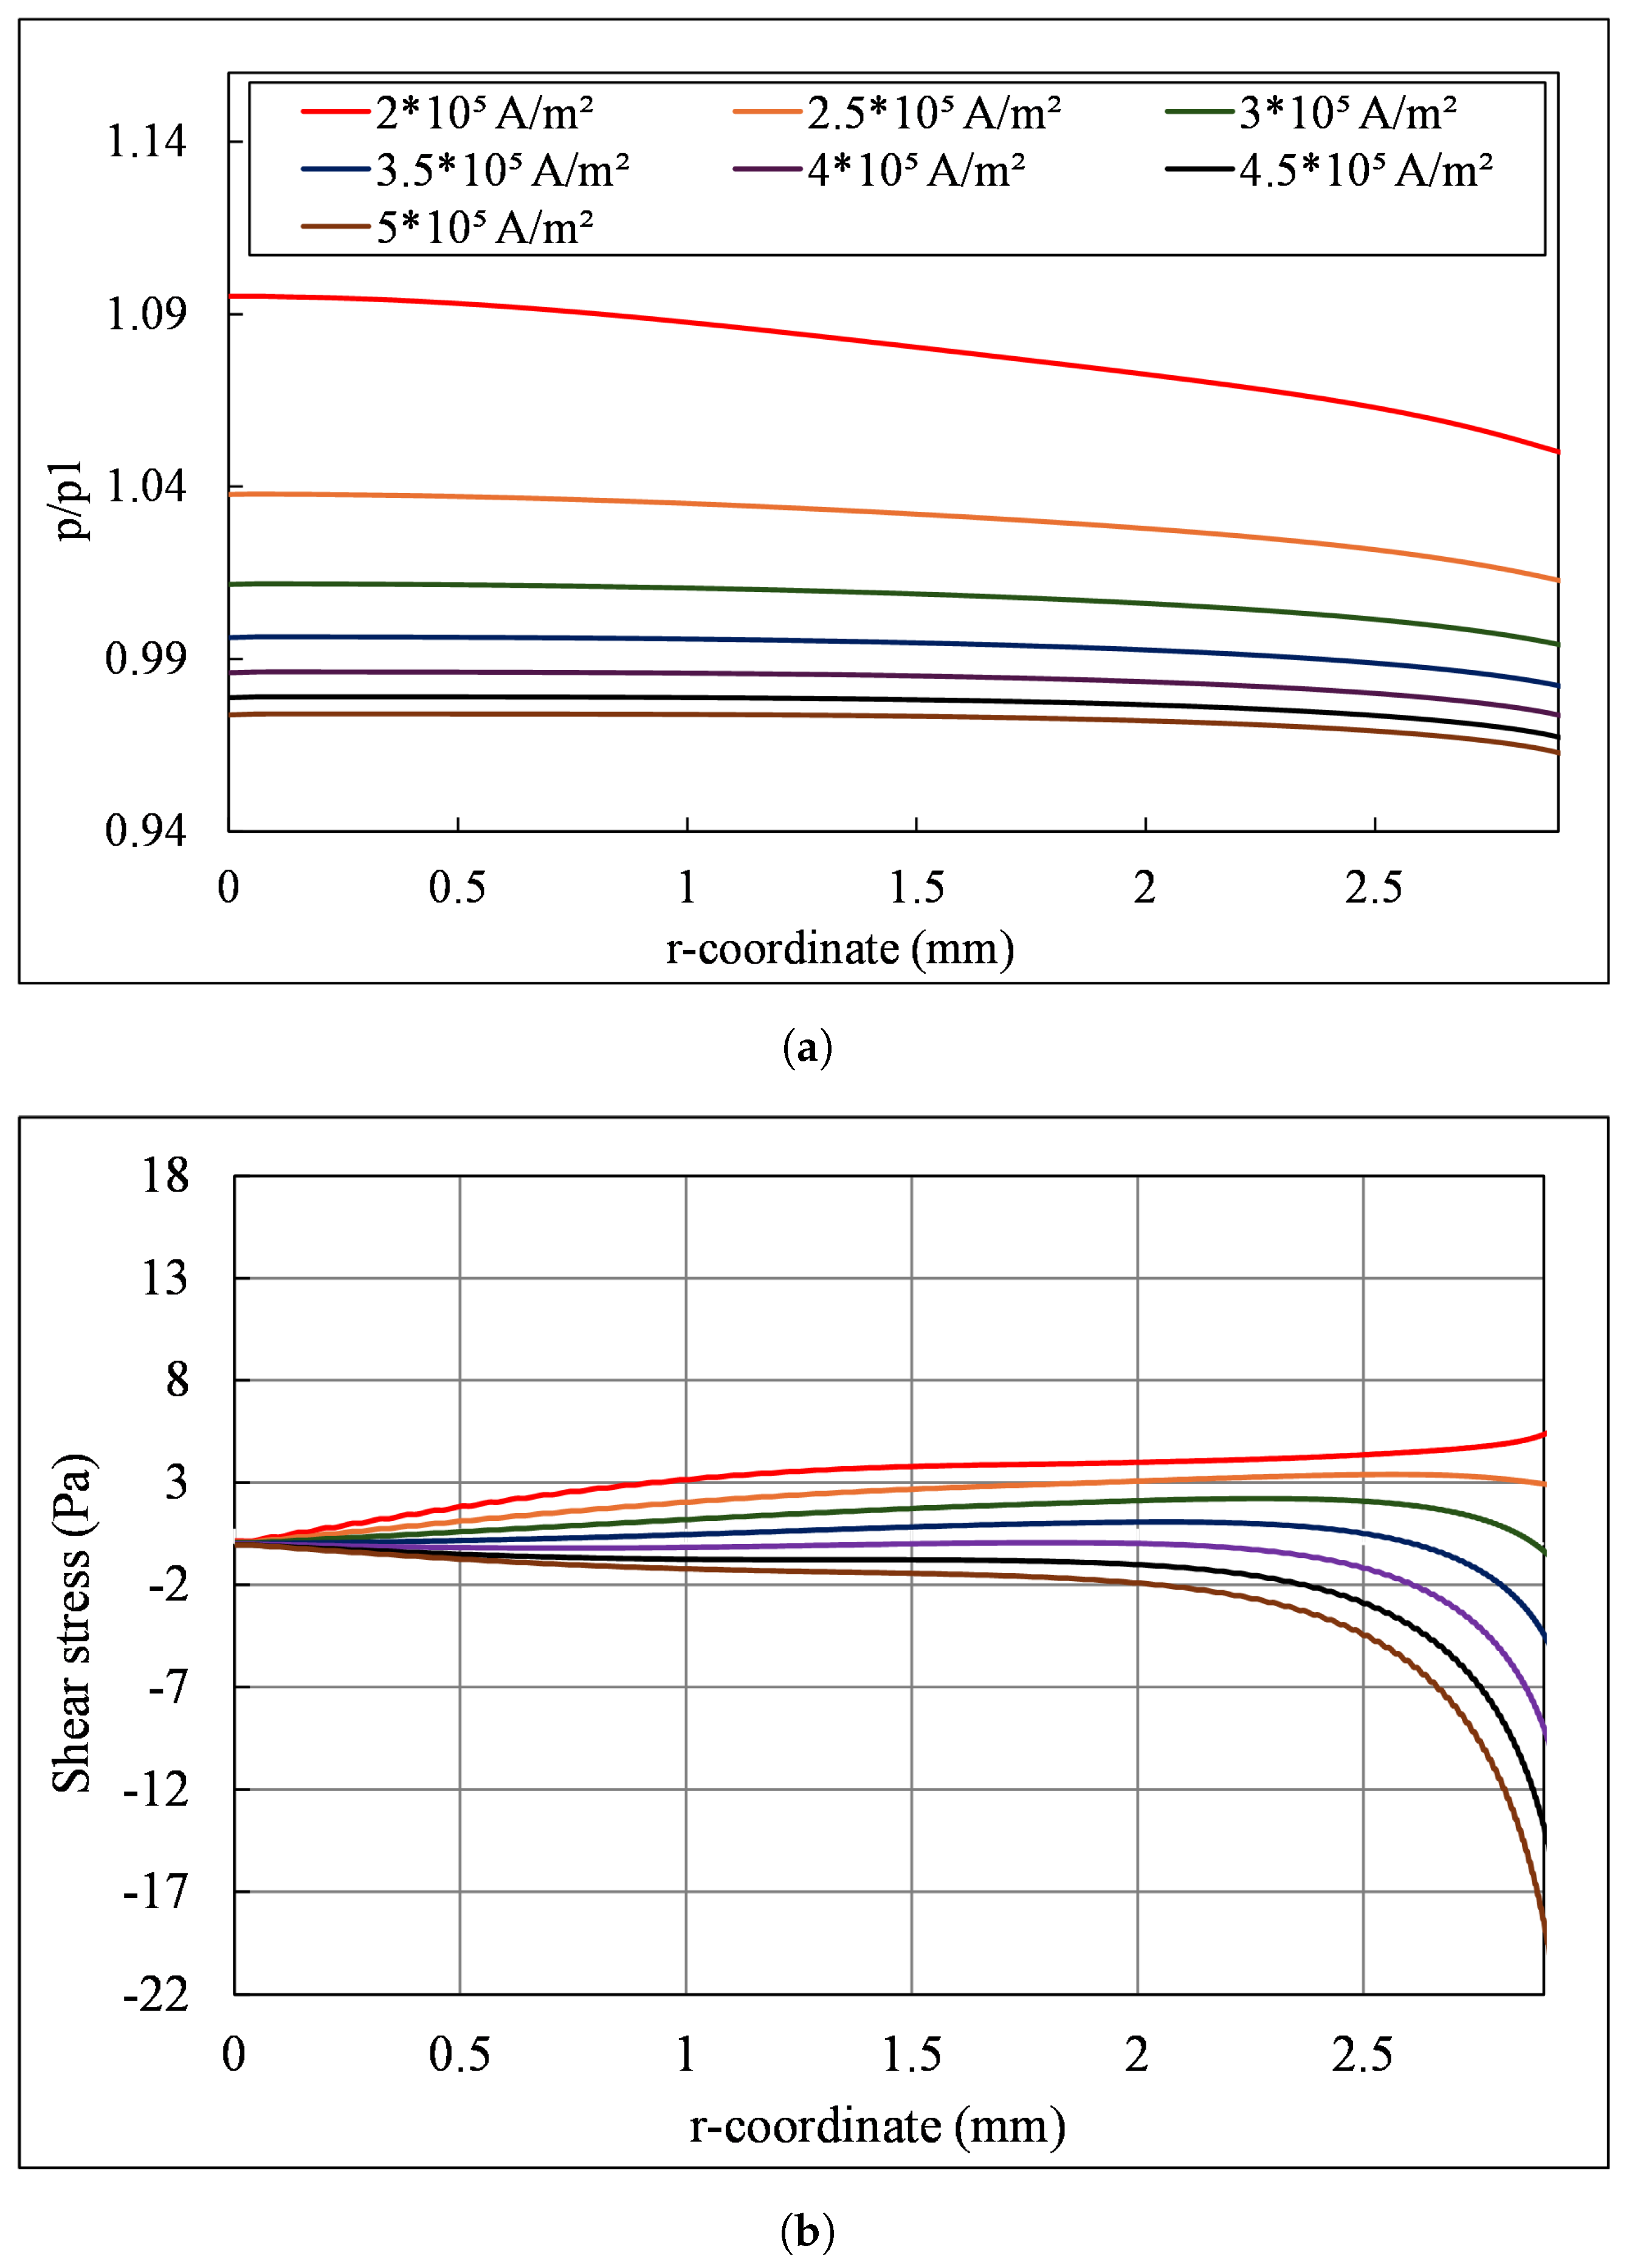
The pressure distribution in the boundary layer next to the cathode, therefore, has a minimum at the stagnation point resulting in a favorable pressure gradient causing a pressure force in the flow direction. This suggests that when the swirl is sufficiently strong, a large enough angular velocity, , can prevent flow separation in the boundary layer. While this principle holds for compressible cases as well, there is no exact similarity solution, such as the Bodewadt boundary layer, for compressible fluids. To test this concept in the plasma torch, we examine specific cases. In these cases, we fix the inlet velocity component, , while varying the inlet component, , and introduce the swirl parameter, S, where . Additionally, to relate magnetic forces to inertial forces, a local dimensionless parameter, , is introduced as follows:
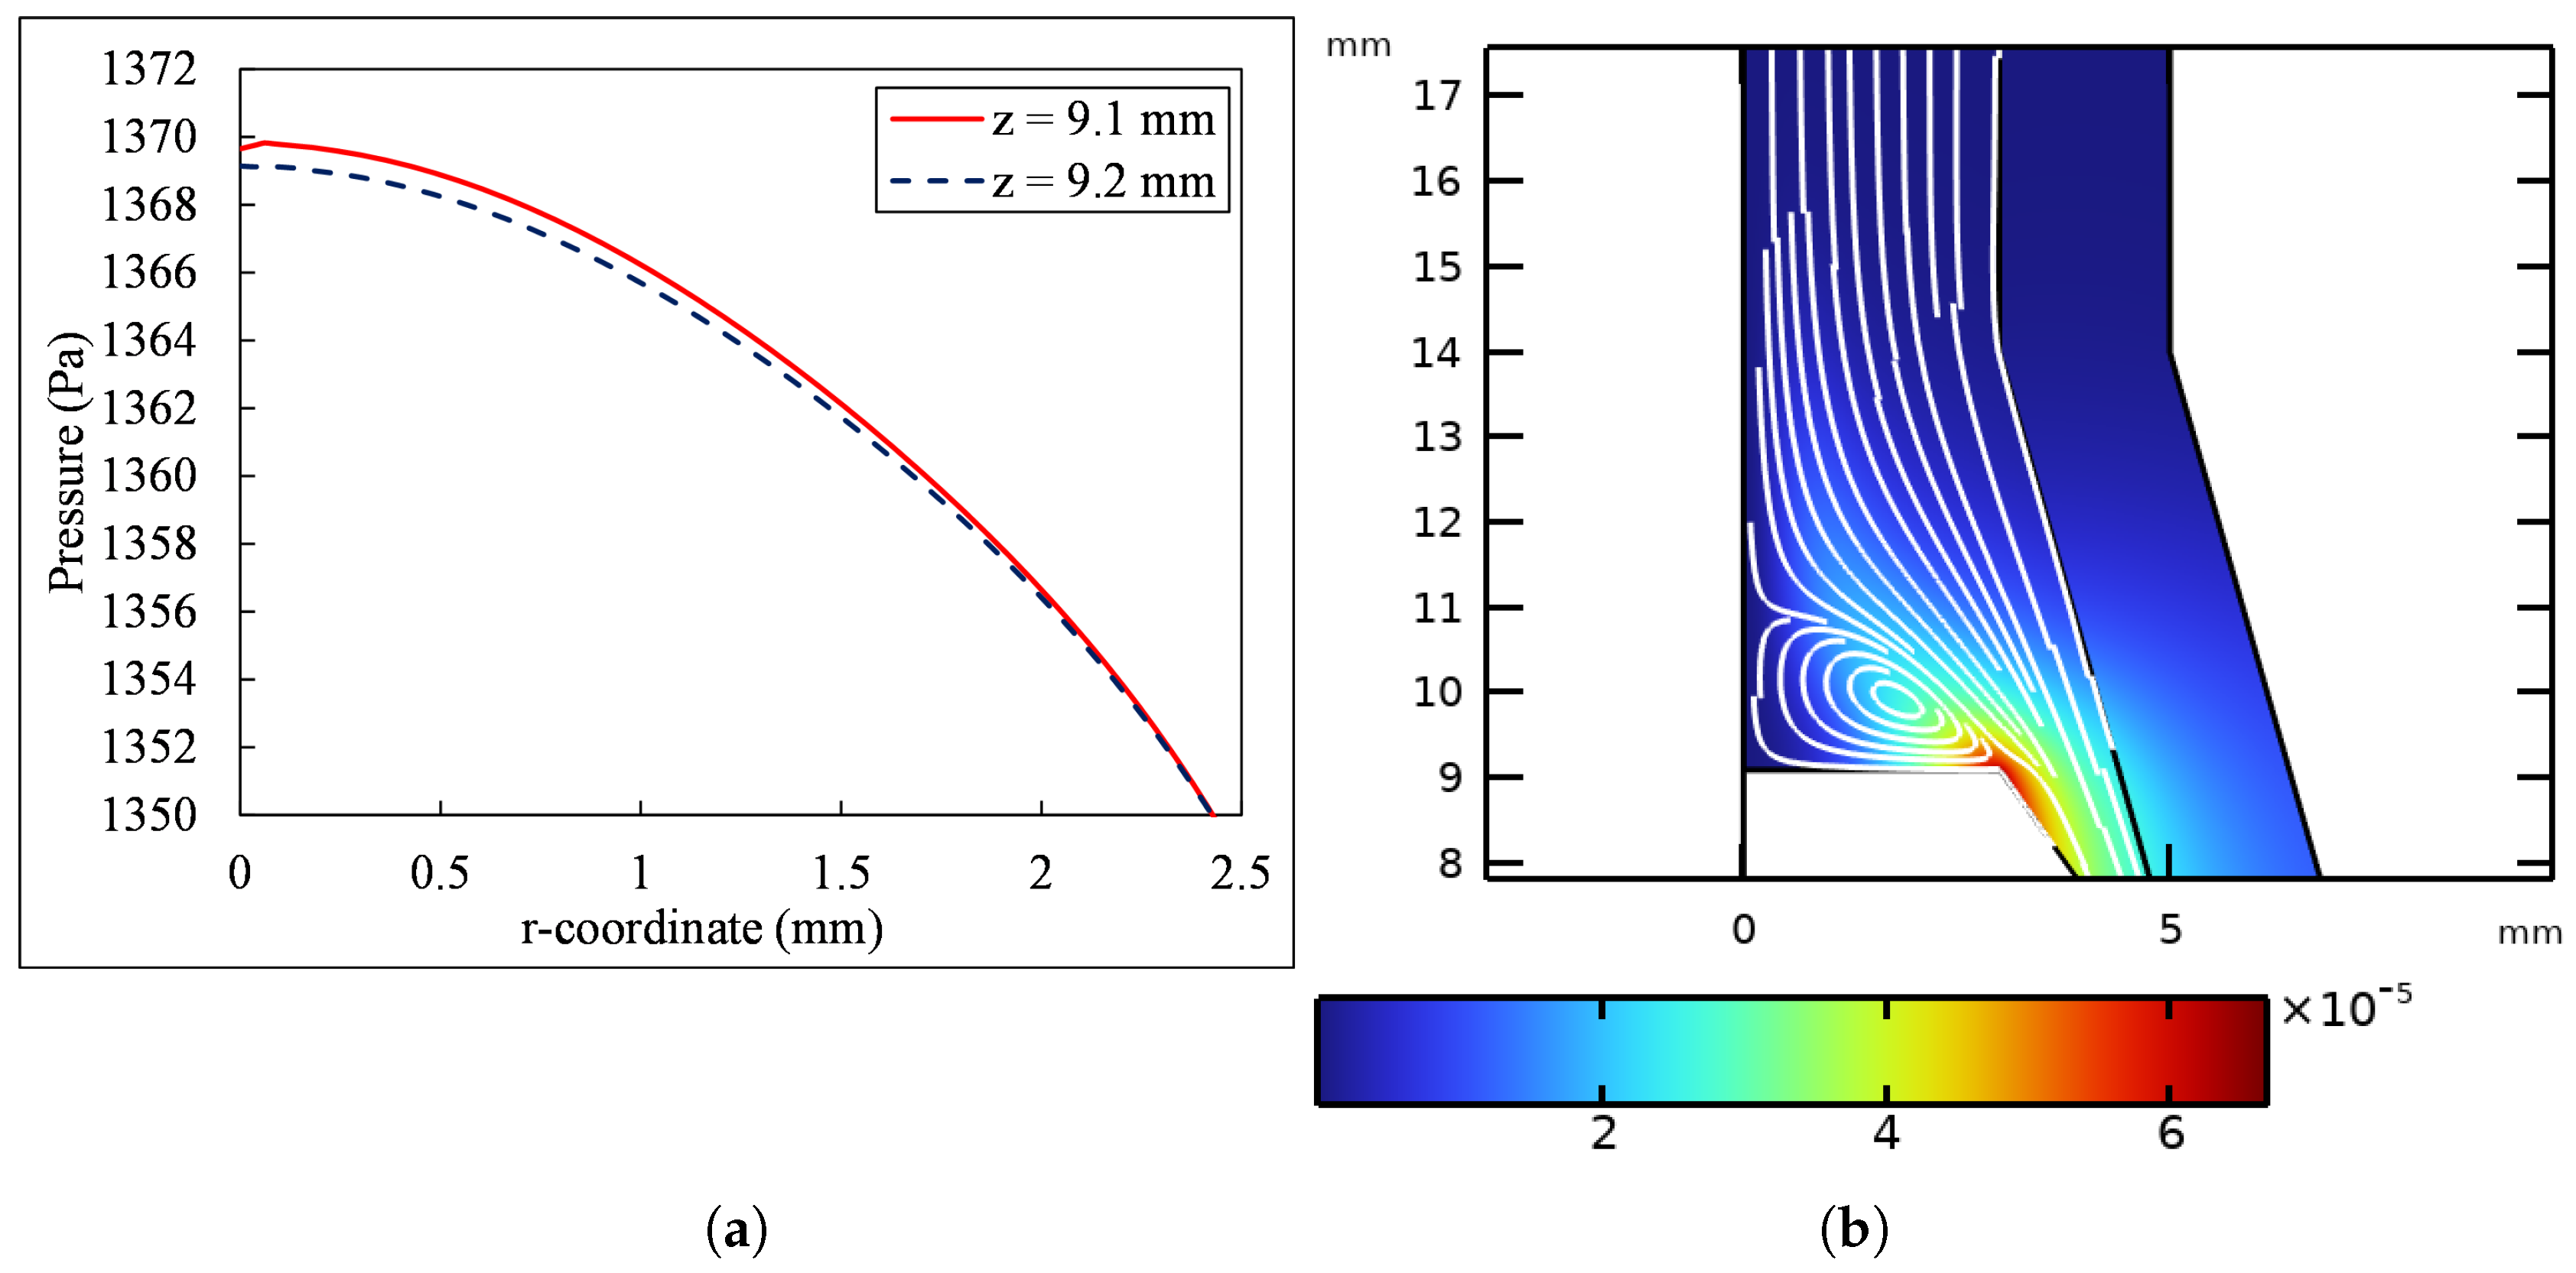
where represents the pressure at the cathode corner and is the magnetic pressure; Figure 5b shows a surface plot of with velocity streamlines for the case where there is no azimuthal inlet velocity, the axial velocity is 10.53 m/s, and the swirl parameter is S = 0. The corresponding pressure distribution along the cathode surface is depicted in Figure 5a, which shows a decrease in pressure as the radial distance from the symmetry axis increases. The normal current density at the cathode tip is . In this case, the value is extremely small, indicating a negligible influence from the magnetic field. A distinct region of separated flow is visible and the pressure distribution along the cathode is adverse, , meaning the pressure force opposes the flow.

Figure 5.
(a) Pressure distribution along the cathode at input surface current , inlet axial velocity is 10.5 m/s and S = 0, (b) surface plot of with velocity streamlines.
To observe any effect of swirl on flow separation, a significantly large swirl parameter is required, as shown in Figure 6, where S is increased to 40. In this case, the pressure distribution plot in Figure 6a shows a slight increase in pressure up to a certain point, followed by a decrease, with flow separation occurring at approximately the point of maximum pressure. When the swirl parameter is further increased to 60, as shown in Figure 6b,d, the pressure plot reveals a larger increase followed by a decrease. This indicates that increasing the swirl parameter expands the region without flow separation. The surface plot in Figure 6d shows minimal separation at the cathode tip, though a small amount of separation still occurs at the sharp corner of the cathode. From these results, it can be concluded that to prevent flow separation at the cathode tip, a parabolic radial pressure distribution created out of swirl is necessary. This is in agreement with a corresponding turbulent flow study by Zhoe et al. in which the effect of swirl flow is to eliminate separation behind the cathode [14].
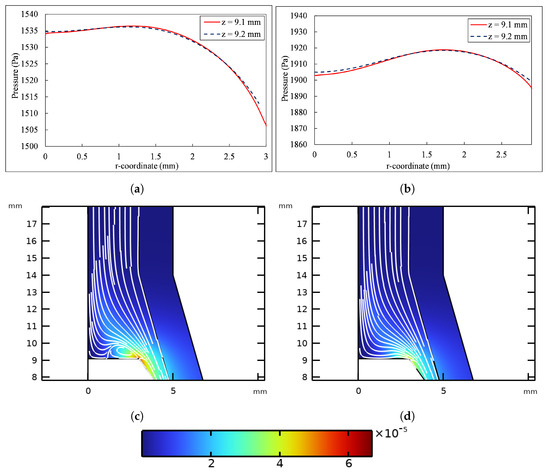
Figure 6.
(a,b) Pressure distribution, (c,d) Surface plot of with velocity streamlines at input surface current , inlet axial velocity is 10.5 m/s and S = 40 (a,c), S = 60 (b,d).
3.3.2. Intermediate Currents
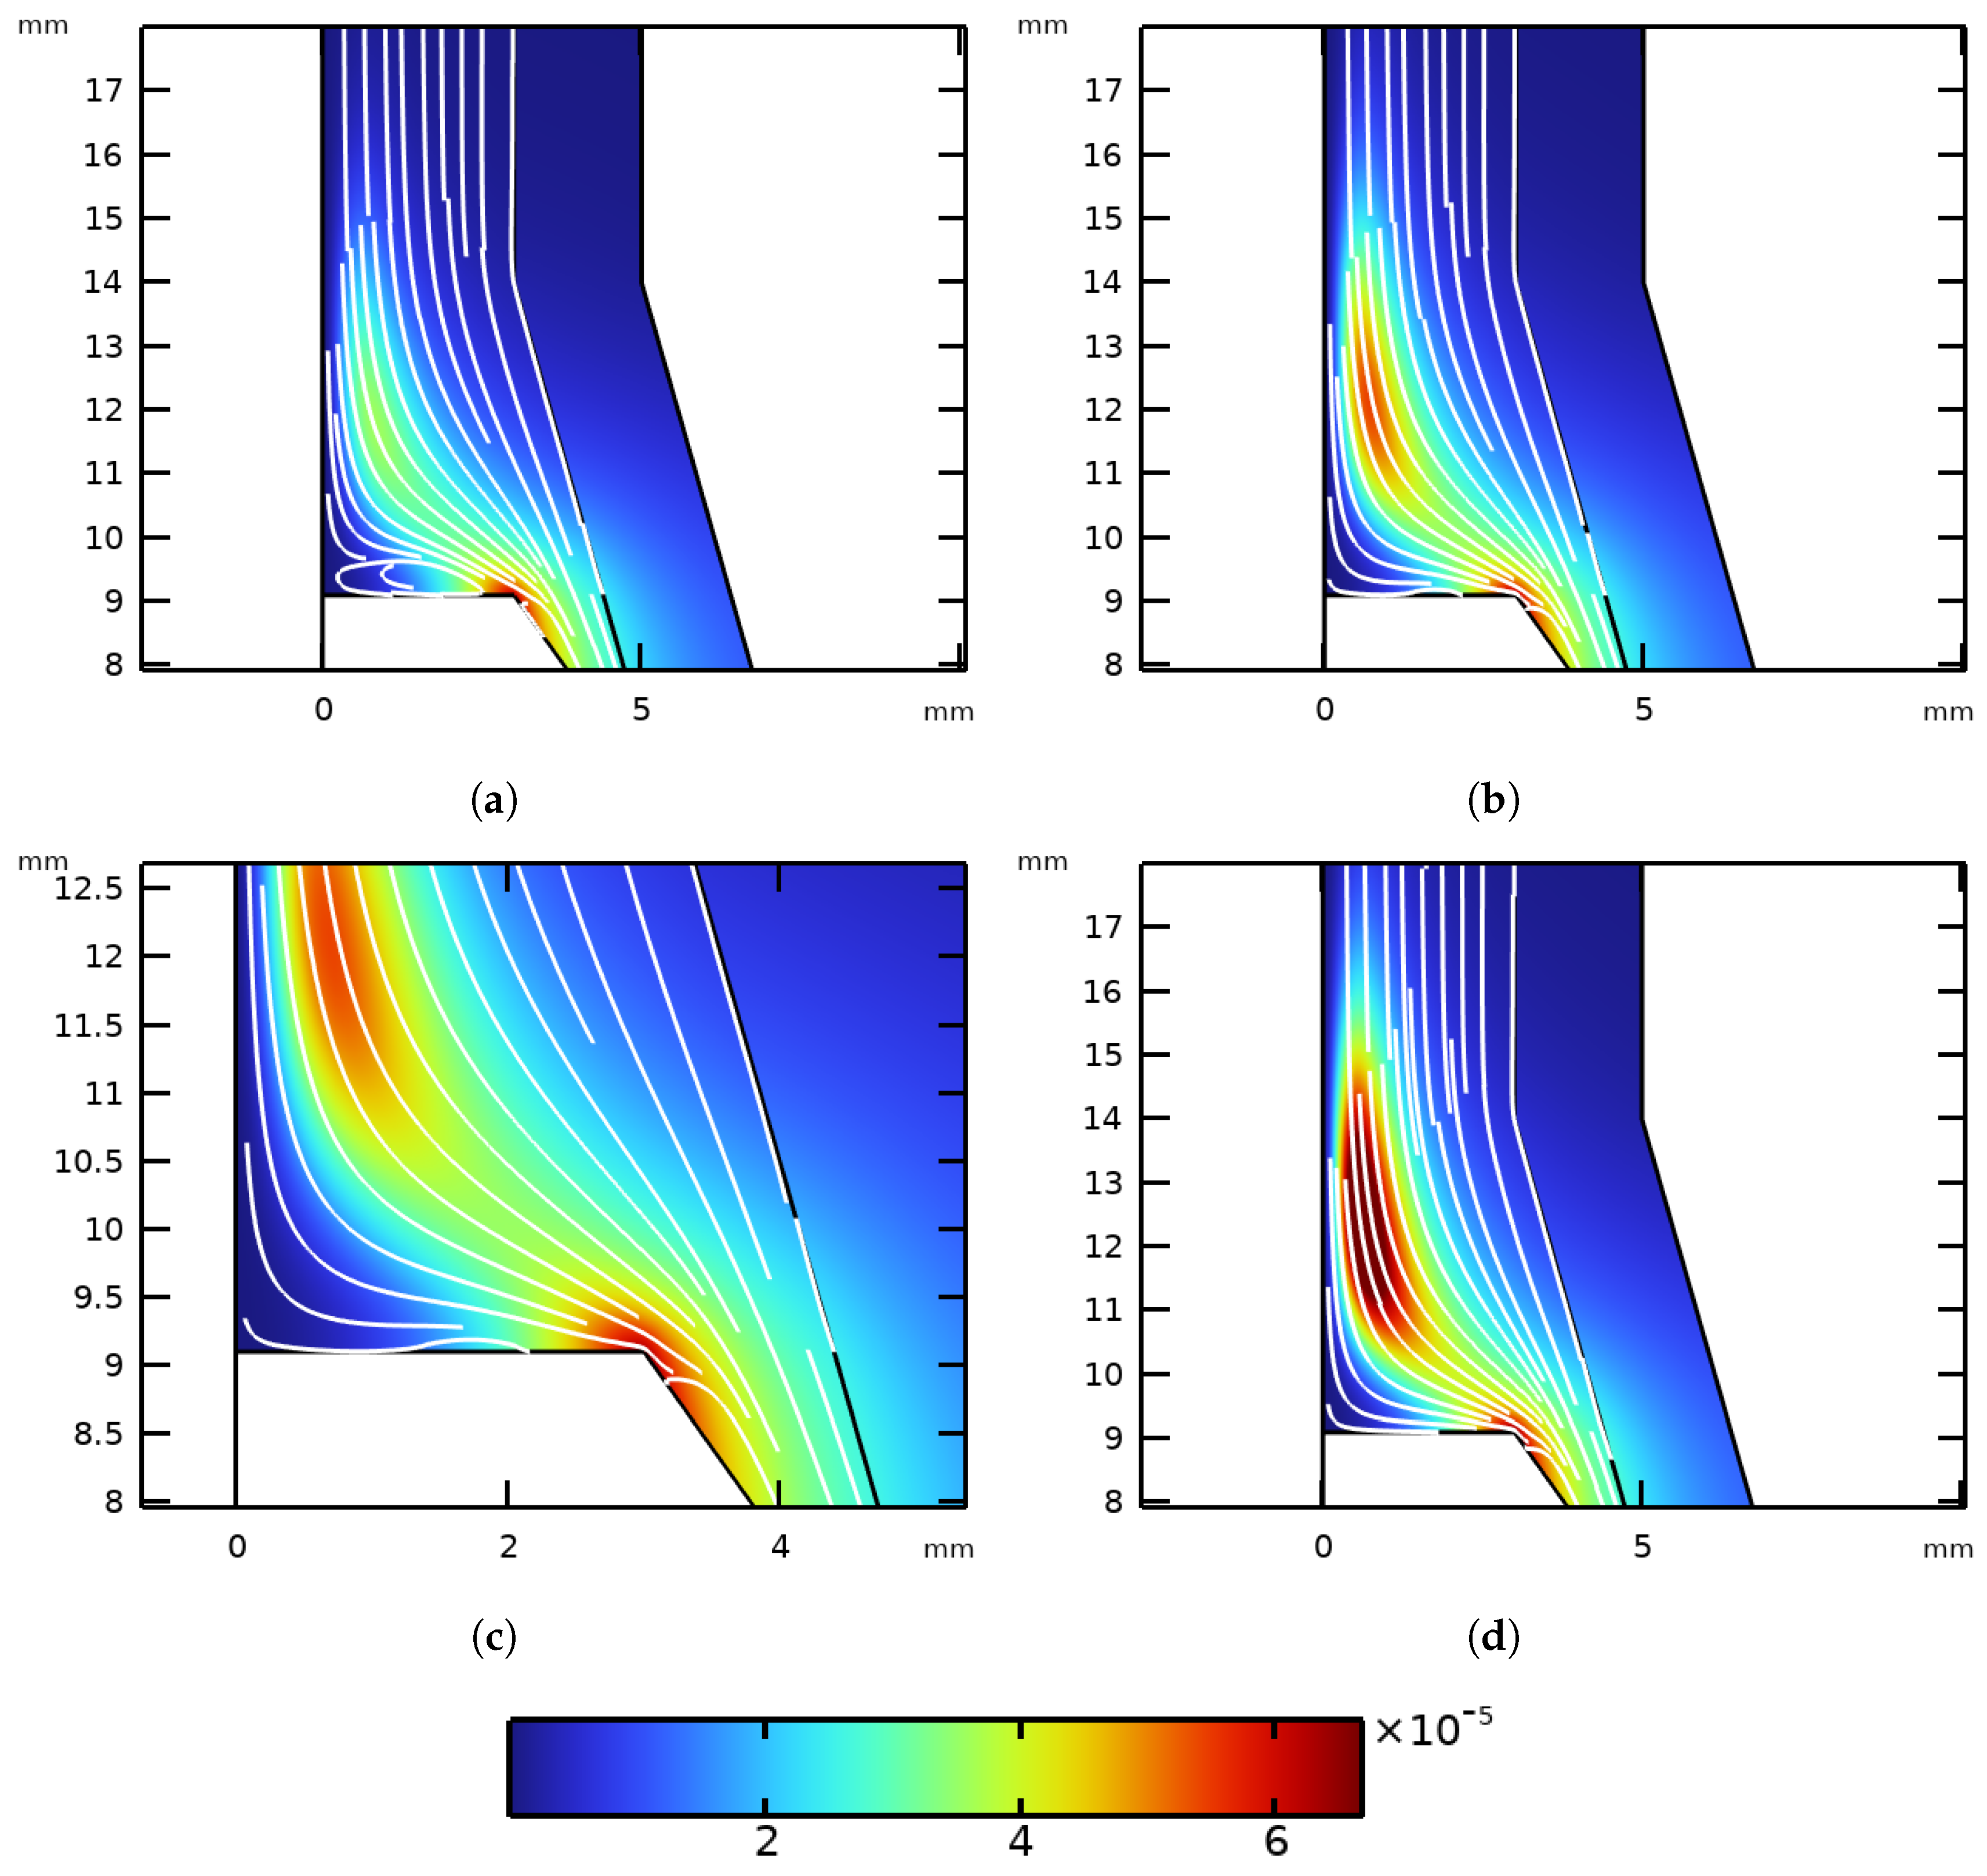
Increasing the current without introducing a swirl can eliminate flow separation. Figure 7 presents surface plots with velocity streamlines for different current levels. From these plots, it is evident that as the current at the cathode tip increases, the extent of separation decreases. However, the corresponding pressure distribution remains adverse, meaning the pressure force opposes the flow. In Figure 7d, the flow exhibits characteristics of a reversed stagnation point. So although the pressure is adverse, separation does not occur because the pressure gradient is not strong enough to overcome the flow and induce separation.

Figure 7.
Surface plot with velocity streamlines (a) , (b) , (c) , (d) .
Figure 8 displays the pressure variation for different currents, showing that the pressure gradient decreases as the current increases. To identify the point of separation, we consider the zeros of the shear stress at the cathode wall. The wall shear stress, , is plotted along the cathode in Figure 8b. By examining the flow starting from the outer edge of the cathode and moving toward the symmetry axis, it is clear that the pressure force opposes the flow. For example, in the case of a current of , the shear stress increases along the wall but never reaches zero, indicating no separation. In contrast, for a surface current of , there are two points where the shear stress is zero, consistent with the flow in Figure 7b and close up Figure 7c, where a separation bubble is observed between r = 1 mm and r = 2.2 mm. Further increasing the current eliminates these zeros in the shear stress, indicating no flow separation, even though the pressure distribution remains adverse.
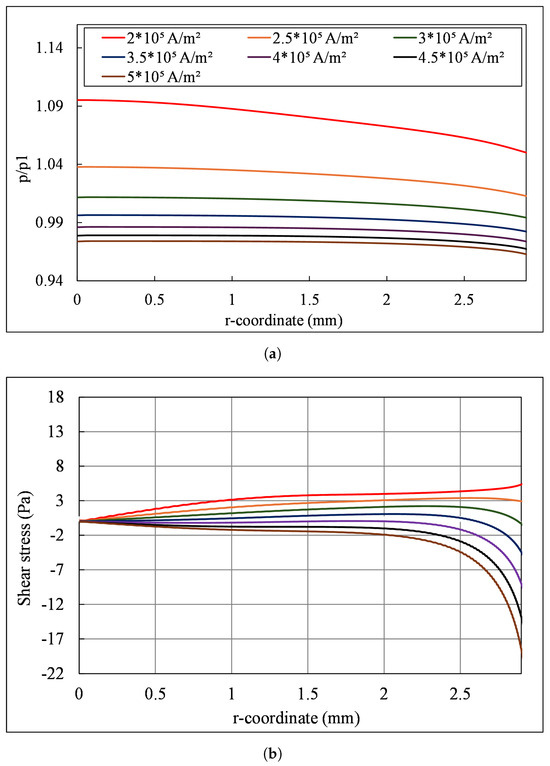
Figure 8.
(a) Pressure variation for different currents, (b) shear stress for different input surface currents, S = 0, inlet axial velocity = 10.53 m/s.
The reverse stagnation point flow persists until the current reaches approximately . In Figure 9a,b, where the surface current is and , magnetic effects begin to play a significant role due to the large values of . In Figure 9a, a small region of separated flow forms near the stagnation point, and as the current increases, this region expands, as shown in Figure 9b. Figure 9c presents the corresponding wall shear stress for intermediate current values. The plot indicates that the critical surface current for the onset of flow separation is around .

Figure 9.
Surface plots of with velocity streamlines at current (a) , (b) , (c) shear stress.
3.3.3. High Currents
Examples of higher currents are shown in Figure 10a,b, with the corresponding wall shear stress presented in Figure 10c. Magnetic field effects become significant at these higher current levels, with the value reaching around 0.1. The influence of the magnetic field on flow separation is discussed in the context of the radial component of the Navier–Stokes equation, which includes the Lorentz force (a detailed explanation is provided in Appendix B). Assuming a uniform surface current at the cathode, , an approximate expression for the magnetic field can be derived using Ampère’s law.
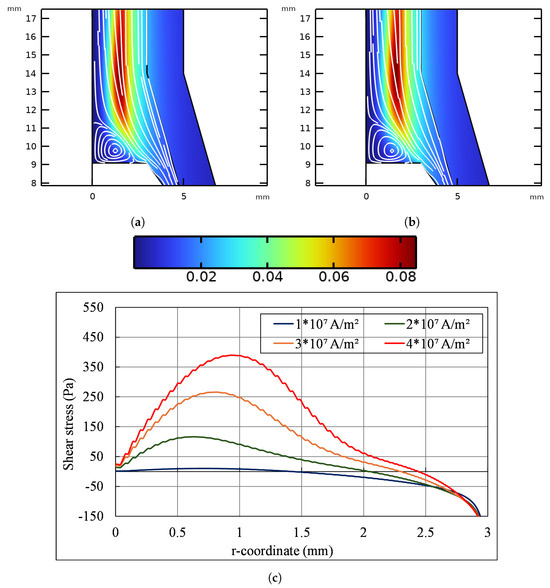
Figure 10.
Surface plots of with velocity streamlines (a) , (b) , (c) shear stress.
Including the Lorentz force in the radial component of the Navier–Stokes equation using Equation (A7) in the appendix gives
At the cathode wall using the no-slip condition, the flow is incompressible since , and therefore, Equation (14) reduces to Equation (15).
The pressure gradient is unfavorable, with , acting against the flow, while the magnetic force increases with both current and radial position, acting in the direction of the flow. However, the pressure gradient also increases in magnitude with the current and magnetic field, resulting in a net force opposing the flow, which ultimately leads to flow separation. By integrating Equation (15) twice along a line where r is constant at the point of separation, the velocity profile near the wall at can be obtained.
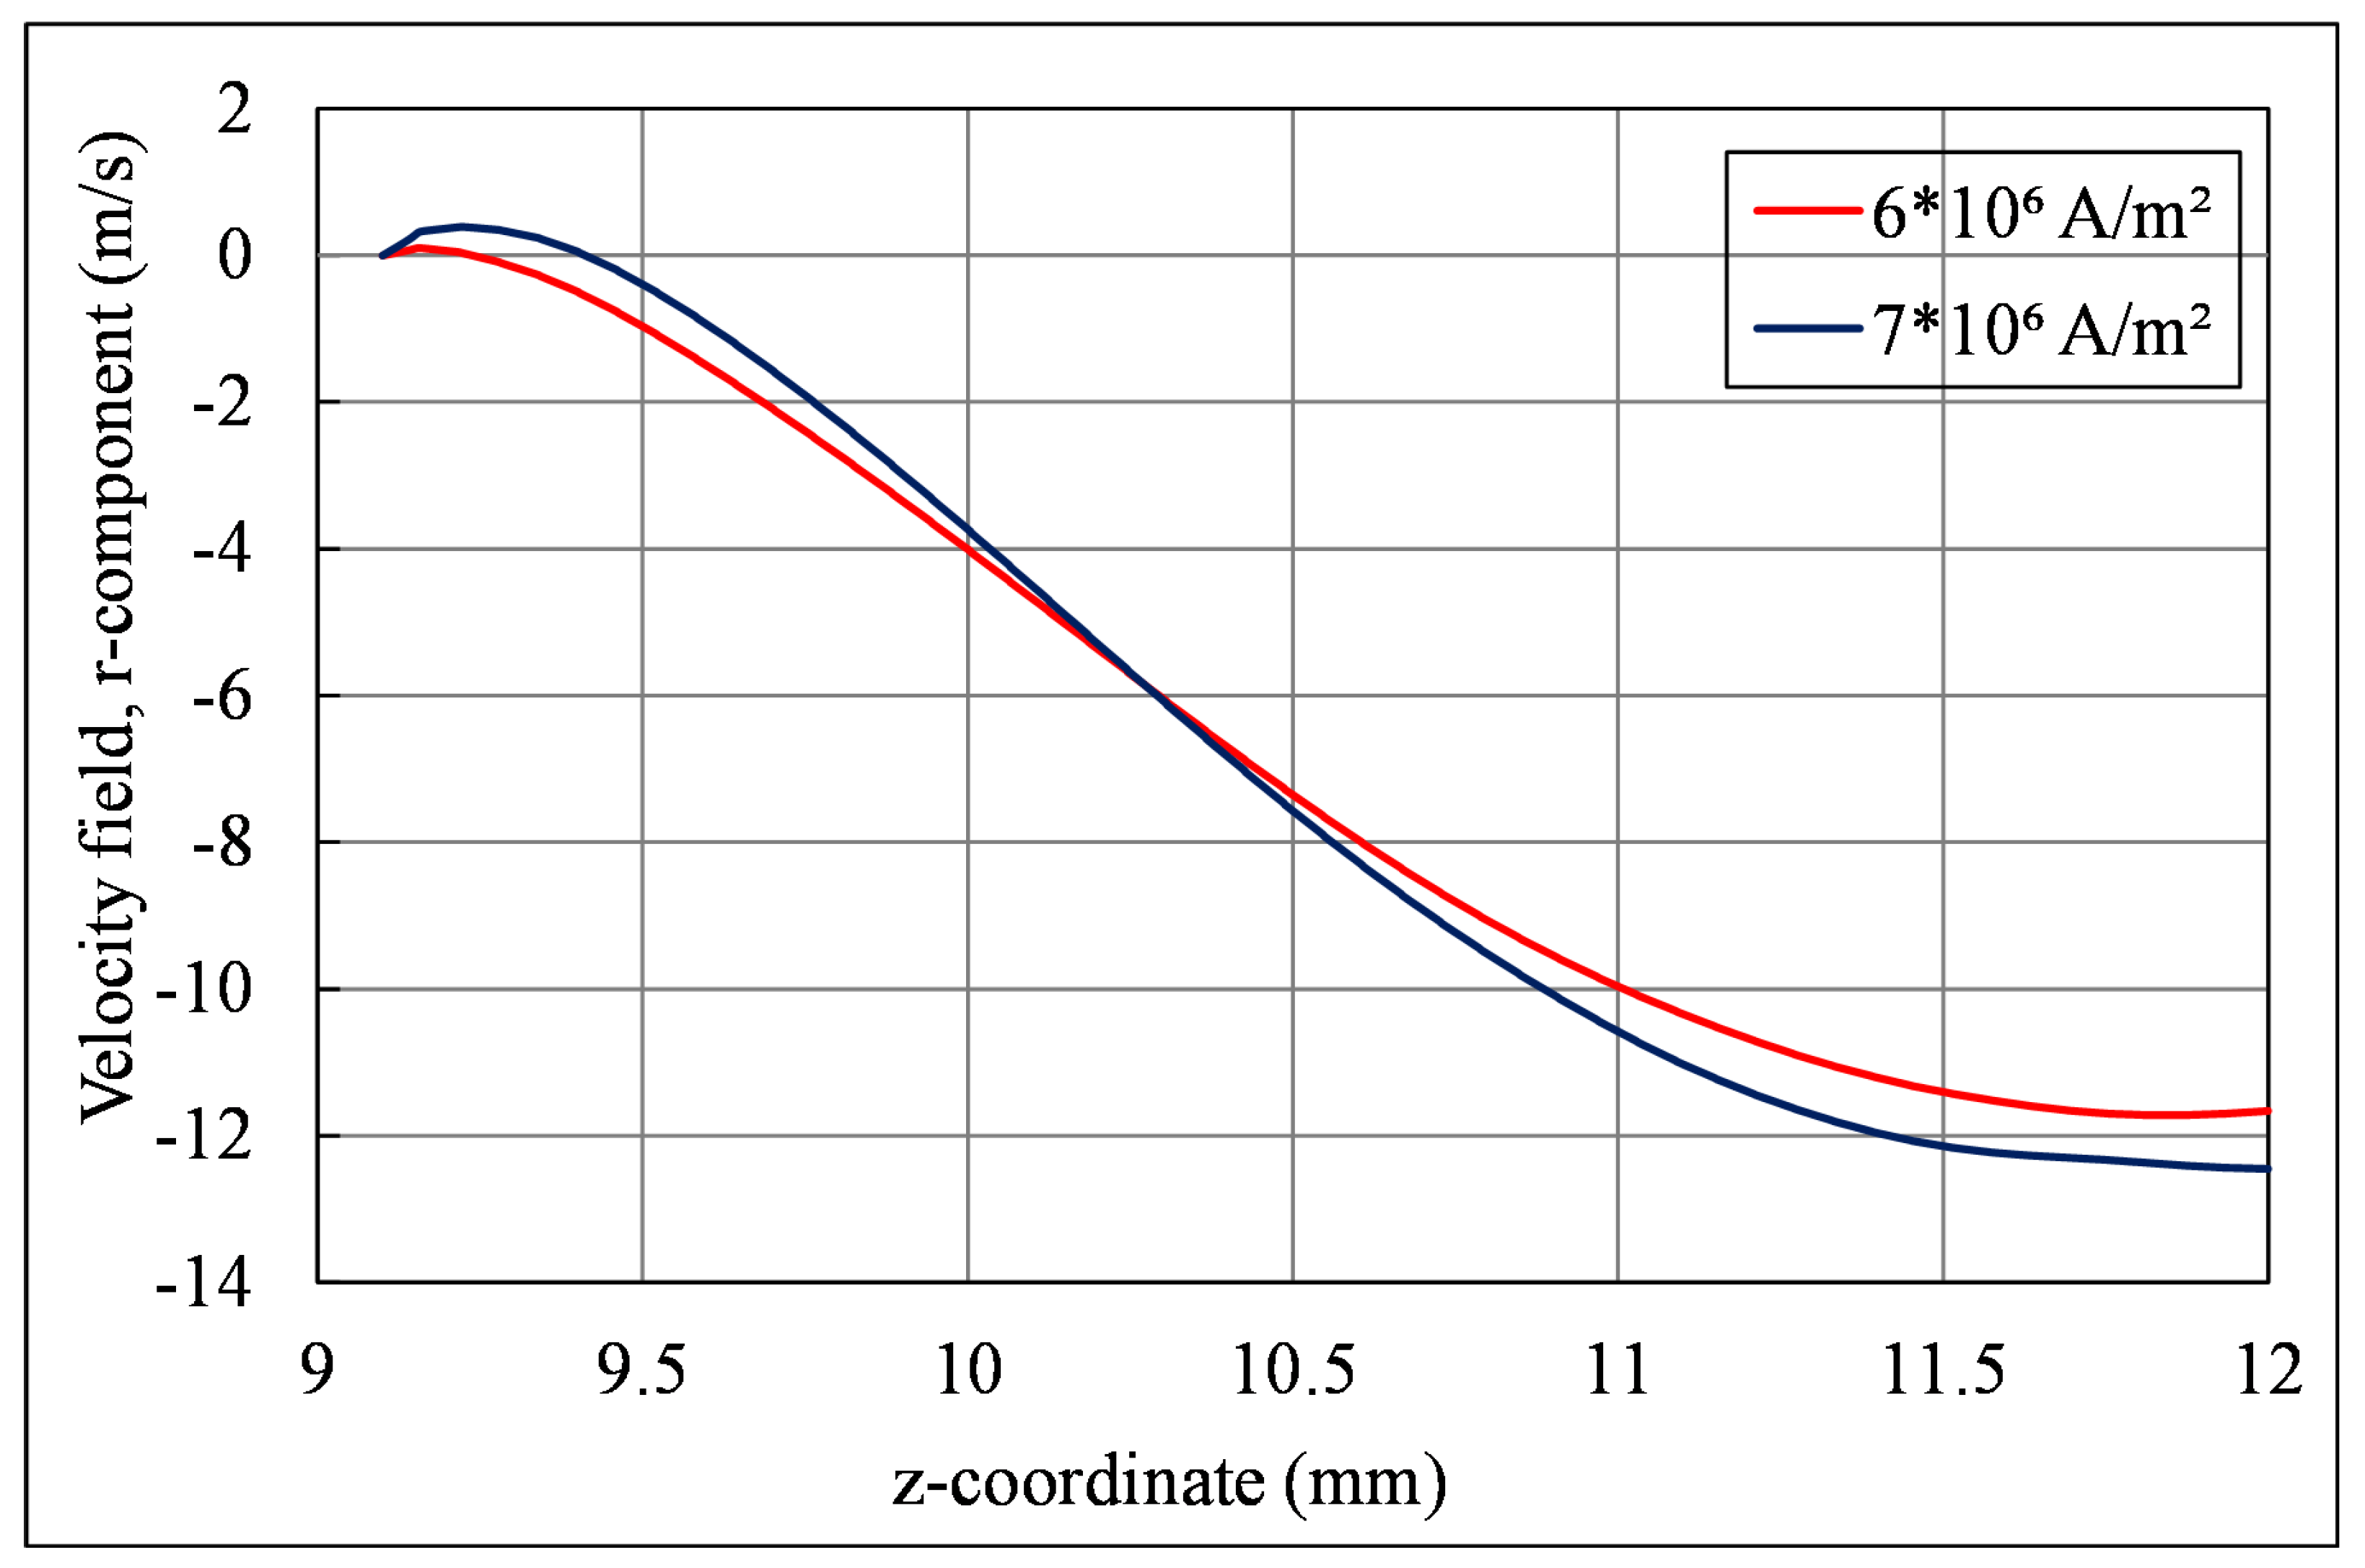
The coefficient in front of can be interpreted as the curvature of the velocity profile, and the effect of the magnetic field is to reduce this curvature near the point of separation. Figure 11, shows the radial component of velocity along a line at r = 0.5 mm, mm, corresponding to the separation with the surface current . The dotted plot shows radial velocity at the current . The separation then occurs at larger r > 0.5 mm. Therefore, there is a small region of positive radial velocity at r = 0.5 mm.
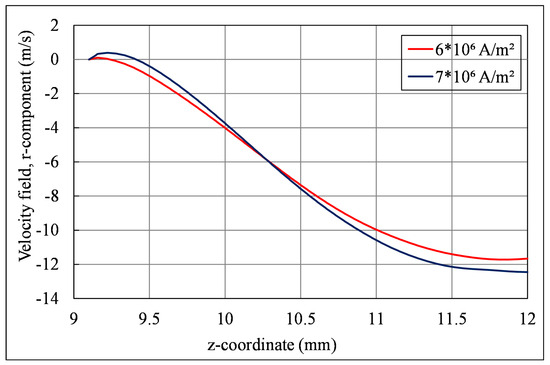
Figure 11.
Radial component of velocity close to the cathode in the axial direction for different surface currents ().
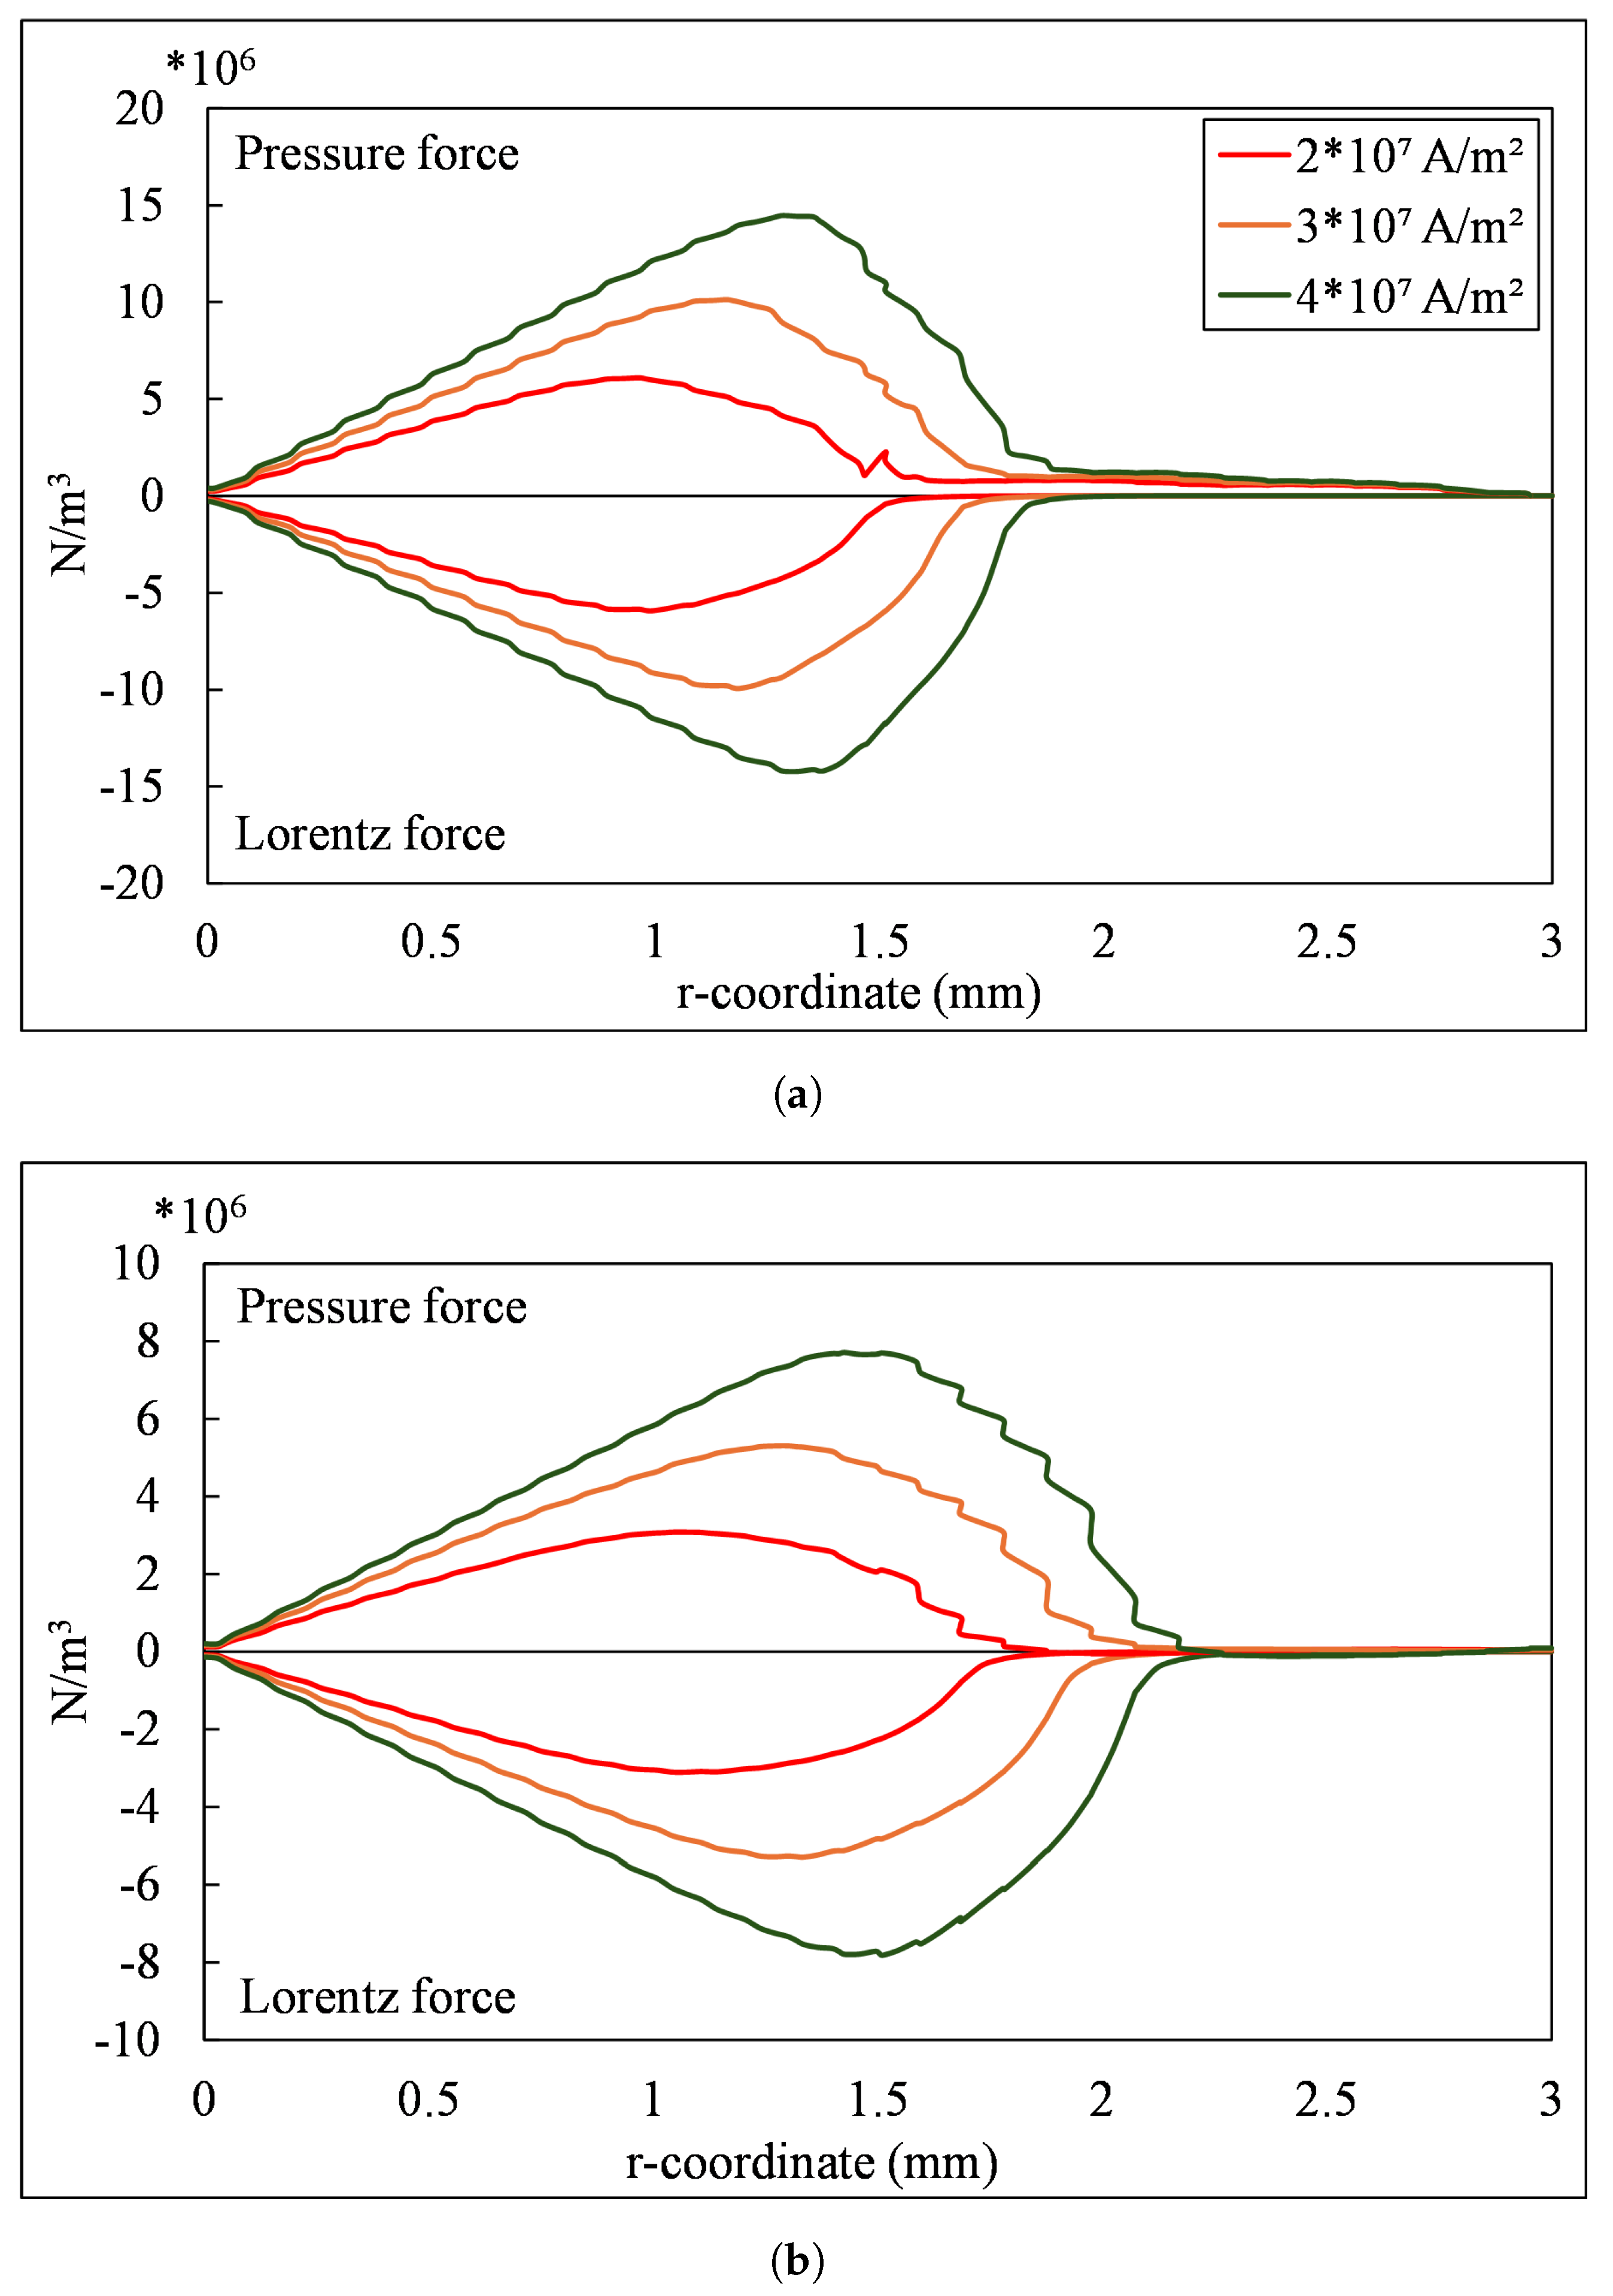
The surface plots in Figure 10a,b also display the magnetic pressure, . It should be noted that a significant magnetic force is observed only for large values of the dimensionless quantity . From these surface plots, the direction of the Lorentz force is indicated. The components are as follows:
From Figure 10a,b, the z-component of the force initially indicates a deceleration, followed by acceleration after the maximum magnetic pressure at around z = 14mm. It is also noteworthy that the maximum Lorentz force occurs 2 mm from the symmetry axis, with no magnetic force present along the axis itself. Further downstream of the torch, a Lorentz force balance is observed between the radial component of the Lorentz force and the radial pressure force, as illustrated in Figure 12, at positions z = 15 mm and z = 25 mm.
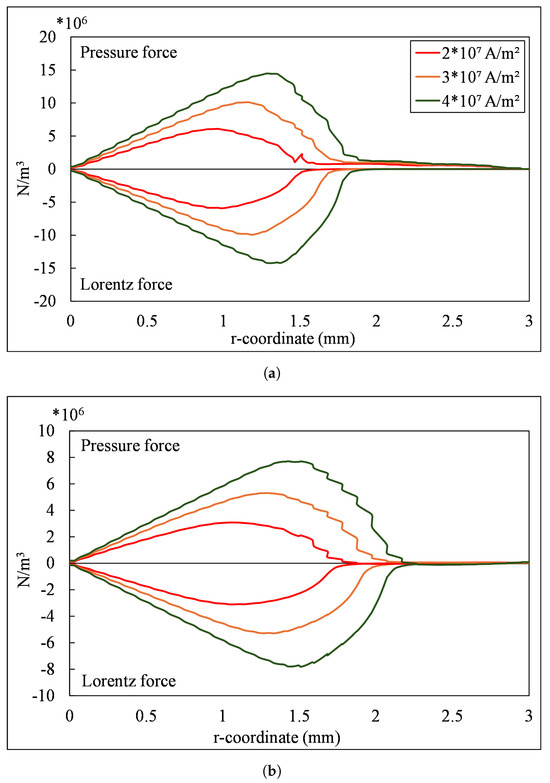
Figure 12.
Equilibrium between radial pressure force and radial component of Lorentz force at (a) z = 15 mm, (b) z = 25 mm.
4. Conclusions
In this study, a computational analysis is performed on a 2D axisymmetric rod-type non-transferred plasma torch. The analysis uses the equilibrium discharge interface approach in COMSOL v6.1. All case studies are conducted on the same geometry and boundary conditions, with variations only in input power and flow direction. The objective of the analysis is to identify the conditions under which flow separation occurs, determine the location of the separation, examine its effects on plasma jet flow properties, and explore methods to eliminate the separation at the cathode tip.
To identify the conditions and location of separation, factors such as swirl, pressure variation, wall shear stress, and the magnetic field on the cathode surface are analyzed. At low current and power levels, where magnetic field effects are negligible, the flow separates without swirl. The presence of swirl introduces a region with a favorable pressure gradient along the cathode surface, meaning the pressure force aligns with the flow direction . For a sufficiently strong swirl, a stagnation-like flow forms near the symmetry axis.
At higher current and power levels, the scenario changes. In these conditions, there is no flow separation even without swirl. Although the pressure gradient is unfavorable, it is weak and insufficient to cause separation. To further analyze these conditions, an additional method is introduced. Since wall shear stress becomes zero at the point of separation, evaluating this parameter along the cathode wall provides a reliable way to locate regions of separated flow.
As the current and power increase further, the magnetic field starts to play a significant role, and additional regions of separated flow appear. In this regime, the pressure distribution becomes more unfavorable, with and its intensity increases. However, the radial component of the Lorentz force, acting in the opposite direction, is not strong enough to eliminate the separation.
In summary, this analysis highlights the critical factors influencing flow separation in plasma torches, including pressure gradient, swirl, wall shear stress, and magnetic field effects. The findings also provide insights into conditions for mitigating flow separation and optimizing the plasma torch’s performance.
- The flow separation is majorly observed at the cathode tip when the magnitude of axial flow dominates the tangential flow.
- The flow separation can also be observed when the input power is very low or high and it can be eliminated in the middle range as shown in Table 1. It is also interesting to note that when the direction of the inlet flow is adjusted, the range of power at which the separation disappears is not constant for all the cases.
- The separation at the cathode tip alters the trend of velocity changes in a plasma torch. The temperature of the plasma jet in the absence of separation is higher than in the cases with the separation.
- To effectively eliminate separation at the cathode tip, a strong swirl flow is recommended for low-current conditions, while at higher currents, avoiding excessively high currents is advisable.
These findings provide valuable insights into optimizing plasma torch performance by managing flow separation at the cathode tip. As discussed earlier, unseparated flow is generally beneficial. However, it has some notable side effects, particularly in relation to increased cathode erosion. Research by Zhou et al. and Nemchinsky, both theoretical and experimental, suggests that the flow pattern near the cathode significantly influences erosion [14,16]. Specifically, flow patterns with large regions of stagnation tend to cause more erosion compared to patterns with separated flow. This relationship is intriguing and will be explored in greater detail in future studies.
As noted earlier, the physical model used in the present study is not entirely comprehensive, as it does not fully describe the behavior of the cathode and anode. Important aspects such as heat and electrical conduction are not included. For instance, the surface current at the cathode is prescribed rather than derived from a more consistent treatment of the cathode–plasma interaction. A more detailed analysis would require a non-local thermodynamic equilibrium (non-LTE) model of this region, incorporating the plasma sheath structure, including a space-charge sheath and an ionization layer, as described in the theory of Benilov and Marotta. This detailed approach is also critical for studying cathode erosion [15].
Recent studies, such as those by Benilov et al., have incorporated a plasma–cathode interaction model into a two-dimensional axisymmetric MHD framework, which is similar to the model used in the present study [15]. Such work provides a promising foundation for addressing the limitations identified here and for further advancing the understanding of cathode erosion and flow dynamics.
Author Contributions
Conceptualization, S.L.S., L.-G.W., H.W., H.O.Å. and A.S.; methodology, S.L.S., L.-G.W., H.W., H.O.Å. and A.S.; software, S.L.S. and H.O.Å.; validation, S.L.S.; formal analysis, S.L.S. and H.O.Å.; investigation, S.L.S., L.-G.W., H.W., H.O.Å., A.S. and P.G.; resources, L.-G.W., H.W. and A.S.; data curation, S.L.S.; writing—original draft preparation, S.L.S. and H.O.Å.; writing—review and editing, L.-G.W., H.W., H.O.Å., A.S. and P.G.; visualization, S.L.S.; supervision, L.-G.W., H.O.Å., H.W., A.S. and P.G.; project administration, L.-G.W.; funding acquisition, L.-G.W., H.W., H.O.Å. and A.S. All authors have read and agreed to the published version of the manuscript.
Funding
The funding is obtained by Swedish Energy Agency, Project grant no. 49609-1.
Data Availability Statement
The data that support the findings of this study are available within the article.
Conflicts of Interest
The authors declare no conflict of interest.
Appendix A. Bödewadt Boundary Layer Theory
Continuity and momentum equations for an incompressible flow.
Substituting u, v, w in Equations (10)–(13).
Integrating Equation (A10) for the pressure gives,
Equation (A8) further becomes,
where boundary conditions are as follows.
At large z we then have
The pressure is the same within the boundary layer so the pressure gradient is favorable in the boundary layer.
Appendix B. Relating Magnetic Field and Separation
Lorentz force is defined as
In plasma torch
where magnetic pressure is defined as follows,
References
- Westhoff, R.; Szekely, J. A model of fluid, heat flow, and electromagnetic phenomena in a nontransferred arc plasma torch. J. Appl. Phys. 1991, 70, 3455–3466. [Google Scholar] [CrossRef]
- Venkatramani, N. Industrial plasma torches and applications. Curr. Sci. 2002, 83, 254–262. [Google Scholar]
- Siddanathi, S.; Westerberg, L.G.; Åkerstedt, H.O.; Wiinikka, H.; Sepman, A. Computational modeling and temperature measurements using emission spectroscopy on a non-transferred plasma torch. Aip Adv. 2023, 13, 025019. [Google Scholar] [CrossRef]
- Chiné, B. A 2D model of a DC plasma torch. In Proceedings of the Comsol Conference, Bangalore, India, 20–21 October 2016; Volume 2016, pp. 12–14. [Google Scholar]
- Huang, R.; Fukanuma, H.; Uesugi, Y.; Tanaka, Y. Comparisons of two models for the simulation of a DC arc plasma torch. J. Therm. Spray Technol. 2013, 22, 183–191. [Google Scholar] [CrossRef]
- Selvan, B.; Ramachandran, K.; Sreekumar, K.; Thiyagarajan, T.; Ananthapadmanabhan, P. Numerical and experimental studies on DC plasma spray torch. Vacuum 2009, 84, 444–452. [Google Scholar] [CrossRef]
- Zhukovskii, R.; Chazelas, C.; Rat, V.; Vardelle, A.; Molz, R.J. Effect of cathode-plasma coupling on plasma torch operation predicted by a 3D two-temperature electric arc model. J. Therm. Spray Technol. 2023, 32, 532–547. [Google Scholar] [CrossRef]
- Dilawari, A.H.; Szekely, J.; Westhoff, R. An assessment of the heat and fluid flow phenomena inside plasma torches in non-transferred arc systems. ISIJ Int. 1990, 30, 381–389. [Google Scholar] [CrossRef]
- He-Ping, L.; Xi, C. Three-dimensional modelling of the flow and heat transfer in a laminar non-transferred arc plasma torch. Chin. Phys. 2002, 11, 44. [Google Scholar] [CrossRef]
- Deng, J.; Li, Y.; Xu, Y.; Sheng, H. Numerical simulation of fluid flow and heat transfer in a DC non-transferred arc plasma torch operating under laminar and turbulent conditions. Plasma Sci. Technol. 2011, 13, 201. [Google Scholar] [CrossRef]
- Modirkhazeni, S.M.; Trelles, J.P. Non-transferred arc torch simulation by a non-equilibrium plasma laminar-to-turbulent flow model. J. Therm. Spray Technol. 2018, 27, 1447–1464. [Google Scholar] [CrossRef]
- Perambadur, J.; Shukla, P.; Klimenko, A.Y.; Murphy, A.B.; Rudolph, V. Arc dynamics in a vortex-stabilized non-transferred plasma torch with a tangential gas feed. J. Phys. D Appl. Phys. 2021, 54, 495501. [Google Scholar] [CrossRef]
- Yadav, A.; Karmakar, S.; Kar, S.; Kumar, M. Numerical modelling of a direct current non-transferred thermal plasma torch for optimal performance. Contrib. Plasma Phys. 2023, 63, e202200088. [Google Scholar] [CrossRef]
- Zhou, Q.; Yin, H.; Li, H.; Xu, X.; Liu, F.; Guo, S.; Chang, X.; Guo, W.; Xu, P. The effect of plasma-gas swirl flow on a highly constricted plasma cutting arc. J. Phys. Appl. Phys. 2009, 42, 095208. [Google Scholar] [CrossRef]
- Benilov, M.; Marotta, A. A model of the cathode region of atmospheric pressure arcs. J. Phys. D Appl. Phys. 1995, 28, 1869. [Google Scholar] [CrossRef]
- Nemchinsky, V.A.; Showalter, M. Cathode erosion in high-current high-pressure arc. J. Phys. D Appl. Phys. 2003, 36, 704. [Google Scholar] [CrossRef]
- Boulos, M.I.; Fauchais, P.; Pfender, E. Thermal Plasmas: Fundamentals and Applications; Springer Science & Business Media: Berlin/Heidelberg, Germany, 2013. [Google Scholar]
- Sepman, A.; Gullberg, M.; Wiinikka, H. Measuring NO and temperature in plasma preheated air using UV absorption spectroscopy. Appl. Phys. B 2020, 126, 100. [Google Scholar] [CrossRef]
- Rasor, N.S. Thermionic energy conversion plasmas. IEEE Trans. Plasma Sci. 1991, 19, 1191–1208. [Google Scholar] [CrossRef]


Disclaimer/Publisher’s Note: The statements, opinions and data contained in all publications are solely those of the individual author(s) and contributor(s) and not of MDPI and/or the editor(s). MDPI and/or the editor(s) disclaim responsibility for any injury to people or property resulting from any ideas, methods, instructions or products referred to in the content. |
© 2025 by the authors. Licensee MDPI, Basel, Switzerland. This article is an open access article distributed under the terms and conditions of the Creative Commons Attribution (CC BY) license (https://creativecommons.org/licenses/by/4.0/).