Article

Hybridization of a Micro-Scale Savonius Rotor Using a Helical Darrieus Rotor

by
Martin Moreno
1,
Iván Trejo-Zúñiga
1,*,
Jesús Terrazas
1,
Arturo Díaz-Ponce
2 and
Andrés Pérez-Terrazo
1,*
1
Laboratory of Energy Innovation and Intelligent and Sustainable Agriculture (LEIISA), Universidad Tecnológica de San Juan del Río, San Juan del Río 76800, Mexico
2
Unidad Aguascalientes, SECIHTI—Centro de Investigaciones en Óptica A.C., Prol. Constitución 607, Fracc. Reserva Loma Bonita, Aguascalientes 20200, Mexico
*
Authors to whom correspondence should be addressed.
Fluids 2025, 10(3), 63; https://doi.org/10.3390/fluids10030063
Submission received: 22 January 2025 / Revised: 3 March 2025 / Accepted: 5 March 2025 / Published: 6 March 2025
(This article belongs to the Special Issue CFD Applications in Environmental Engineering)

Abstract

:
This study presents a micro-scale hybrid wind turbine that integrates a Savonius rotor with a Helical Darrieus rotor, aiming to enhance energy conversion efficiency and adaptability for decentralized renewable energy generation. The hybrid design leverages the high torque generation of the Savonius rotor and the aerodynamic efficiency of the Helical Darrieus rotor. Computational analyses using CFD simulations and experimental validation with a 3D-printed prototype in a closed wind tunnel were conducted at speeds ranging from 3 to 8 m/s. The results demonstrate that the hybrid turbine achieves a power coefficient of 0.26 at an optimal tip-speed ratio of 2.7, marking a 180% improvement over standalone Savonius rotors. The hybridization process mitigates the low-speed inefficiencies of the Savonius rotor. It compensates for the high-speed limitations of the Darrieus rotor, resulting in a turbine capable of operating efficiently over a wider range of wind speeds. This balanced integration maximizes energy harvesting and improves adaptability to varying wind conditions, achieving balanced and synergistic performance.

1. Introduction

Wind energy stands as a cornerstone in the global transition to renewable energy, experiencing substantial growth due to its capacity to replace fossil fuels and significantly reduce greenhouse gas emissions [1,2]. In this context, micro-scale Vertical Axis Wind Turbines (micro-scale VAWTs) have emerged as a promising decentralized renewable energy generation solution, particularly in urban and rural environments where space and wind conditions vary significantly. These turbines offer unique advantages, such as capturing wind from any direction and operating efficiently at low wind speeds. However, the performance of micro-scale VAWTs can be further optimized to maximize energy capture and improve overall efficiency.
Among micro-scale VAWT designs, the Savonius rotor (SR) finds widespread application in power generation due to its simplicity, low manufacturing cost, and dependable performance in low wind conditions. Efforts to improve SR performance have explored various blade geometries, including semicircular, Bach, and elliptical designs [3,4]. While semicircular designs remain preferable due to their simplicity, the elliptical configuration provides only a marginal improvement in power coefficient, with a difference of just 0.01. When considered alongside the challenges of optimizing micro-scale VAWTs, this minimal gain underscores the need for more impactful design innovations.
Though aimed at addressing the limitations of single-stage SRs, multistage configurations present inherent challenges. Misaligned stages can reduce efficiency and diminish energy capture, counteracting the anticipated performance gains [5]. Although multistage designs help reduce torque fluctuations, they often result in a lower power coefficient as the number of stages increases. Using twisted blades mitigates some drawbacks by improving static torque and operational smoothness. However, optimizing parameters such as the phase shift and twist angles remains critical to achieving a balanced and efficient design [6,7]. This highlights the broader importance of carefully engineered hybrid solutions.
Several studies have examined hybrid designs that combine SRs and Darrieus rotors (DRs). This methodology combines the high-torque capabilities of SR rotors with the aerodynamic efficiency of the DR rotors, allowing hybrid systems to operate effectively in a variety of wind conditions, described in detail in [8]. Simulation-driven designs focus on optimizing turbine configurations using computational models. The authors in [9] achieve a compact design operating in the 3–7 m/s range with a λ of 0.30. Similarly, ref. [10] employing a two-blade SR and three-blade DR combination achieves a C P of 0.36 in low wind conditions (1–3 m/s). In the same sense, ref. [11] achieves a C P of 0.42 with NREL S809 airfoils, focusing on moderate wind conditions. Experimental-only studies, such as [12,13], highlight practical applications and real-world performance. Ref. [12] employs a wood-based two-blade SR and three-blade DR configuration, achieving a C P of 0.34 in a wind range of 7.5–12 m/s. In contrast, ref. [13] utilizes aluminum materials for durability, achieving a C P of 0.32 and targeting broader wind speeds (3–10 m/s).
A few studies employ a dual-methodology approach, integrating both simulations and experimental analyses to deliver more comprehensive and robust evaluations of hybrid turbine performance. In the work of [14], the authors integrate semi-circle helical (SCH) blades with NACA0021 airfoils, achieving a C P of 0.36 and a C T of 0.68 in a wind range of 2–3 m/s. Similarly, ref. [15] focuses on a range of high wind speeds (5–20 m/s), combining PVC and aluminum materials in a three-bladed SR and DR configuration. Simulation studies stand out for their flexibility and cost-effectiveness, and the experimental designs provide insights into practical challenges. By integrating both approaches, studies can achieve more robust and reliable turbine designs, as demonstrated by the limited but impactful dual-methodology work reviewed.
This study proposes that the Savonius Helical Darrieus Hybrid Rotor (HSHDR) combines the complementary strengths of the SR and HDR to overcome the inherent limitations of stand-alone designs, providing a robust and efficient solution for micro-VAWT applications, where a micro-VAWT is defined as a turbine with a rotor height less than 1.5 m [7]. The hybridization leverages the high torque generation of the SR, which ensures efficient operation at low wind speeds, and the superior aerodynamic efficiency of the HDR, optimized for higher wind speeds. This combination solves critical problems, such as the low efficiency of the SR and the limited low-wind capability of the DR, enabling consistent performance in varying wind conditions. Hybridization increases the turbine’s energy capture potential, improving power coefficients and operational stability. Bringing these complementary features together demonstrates the transformative potential of hybrid designs in advancing decentralized renewable energy solutions.
This paper is structured into five sections, each addressing critical aspects of the study. Section 2 introduces the structural and aerodynamic design of the HSHDR, detailing its hybrid configuration, which integrates a two-bladed Savonius rotor in the inner layer and a three-bladed Helical Darrieus rotor in the outer layer. This section also outlines the experimental methodology, emphasizing a closed wind tunnel to ensure laminar flow and minimal turbulence, providing controlled conditions for accurate performance evaluation. Section 3 presents the experimental and numerical findings, focusing on the rotor’s performance across varying wind speeds. The C p and C T are analyzed as functions of tip-speed ratio ( λ ), identifying optimal operating conditions for maximizing energy capture. Detailed velocity and pressure contour plots offer insights into the rotor’s aerodynamic behavior, highlighting efficient energy conversion and the formation of vortices at a wide wind range. These results demonstrate notable improvements over traditional designs while identifying areas for further refinement. Lastly, Section 4 and Section 5 synthesizes the experimental and numerical results, critically evaluating the HSHDR’s effectiveness in enhancing performance. The discussion emphasizes the advantages of hybridization, such as increased power and torque outputs.

2. Proposed Hybrid Savonius and Helical Darrieus Rotors

2.1. Problem Statement
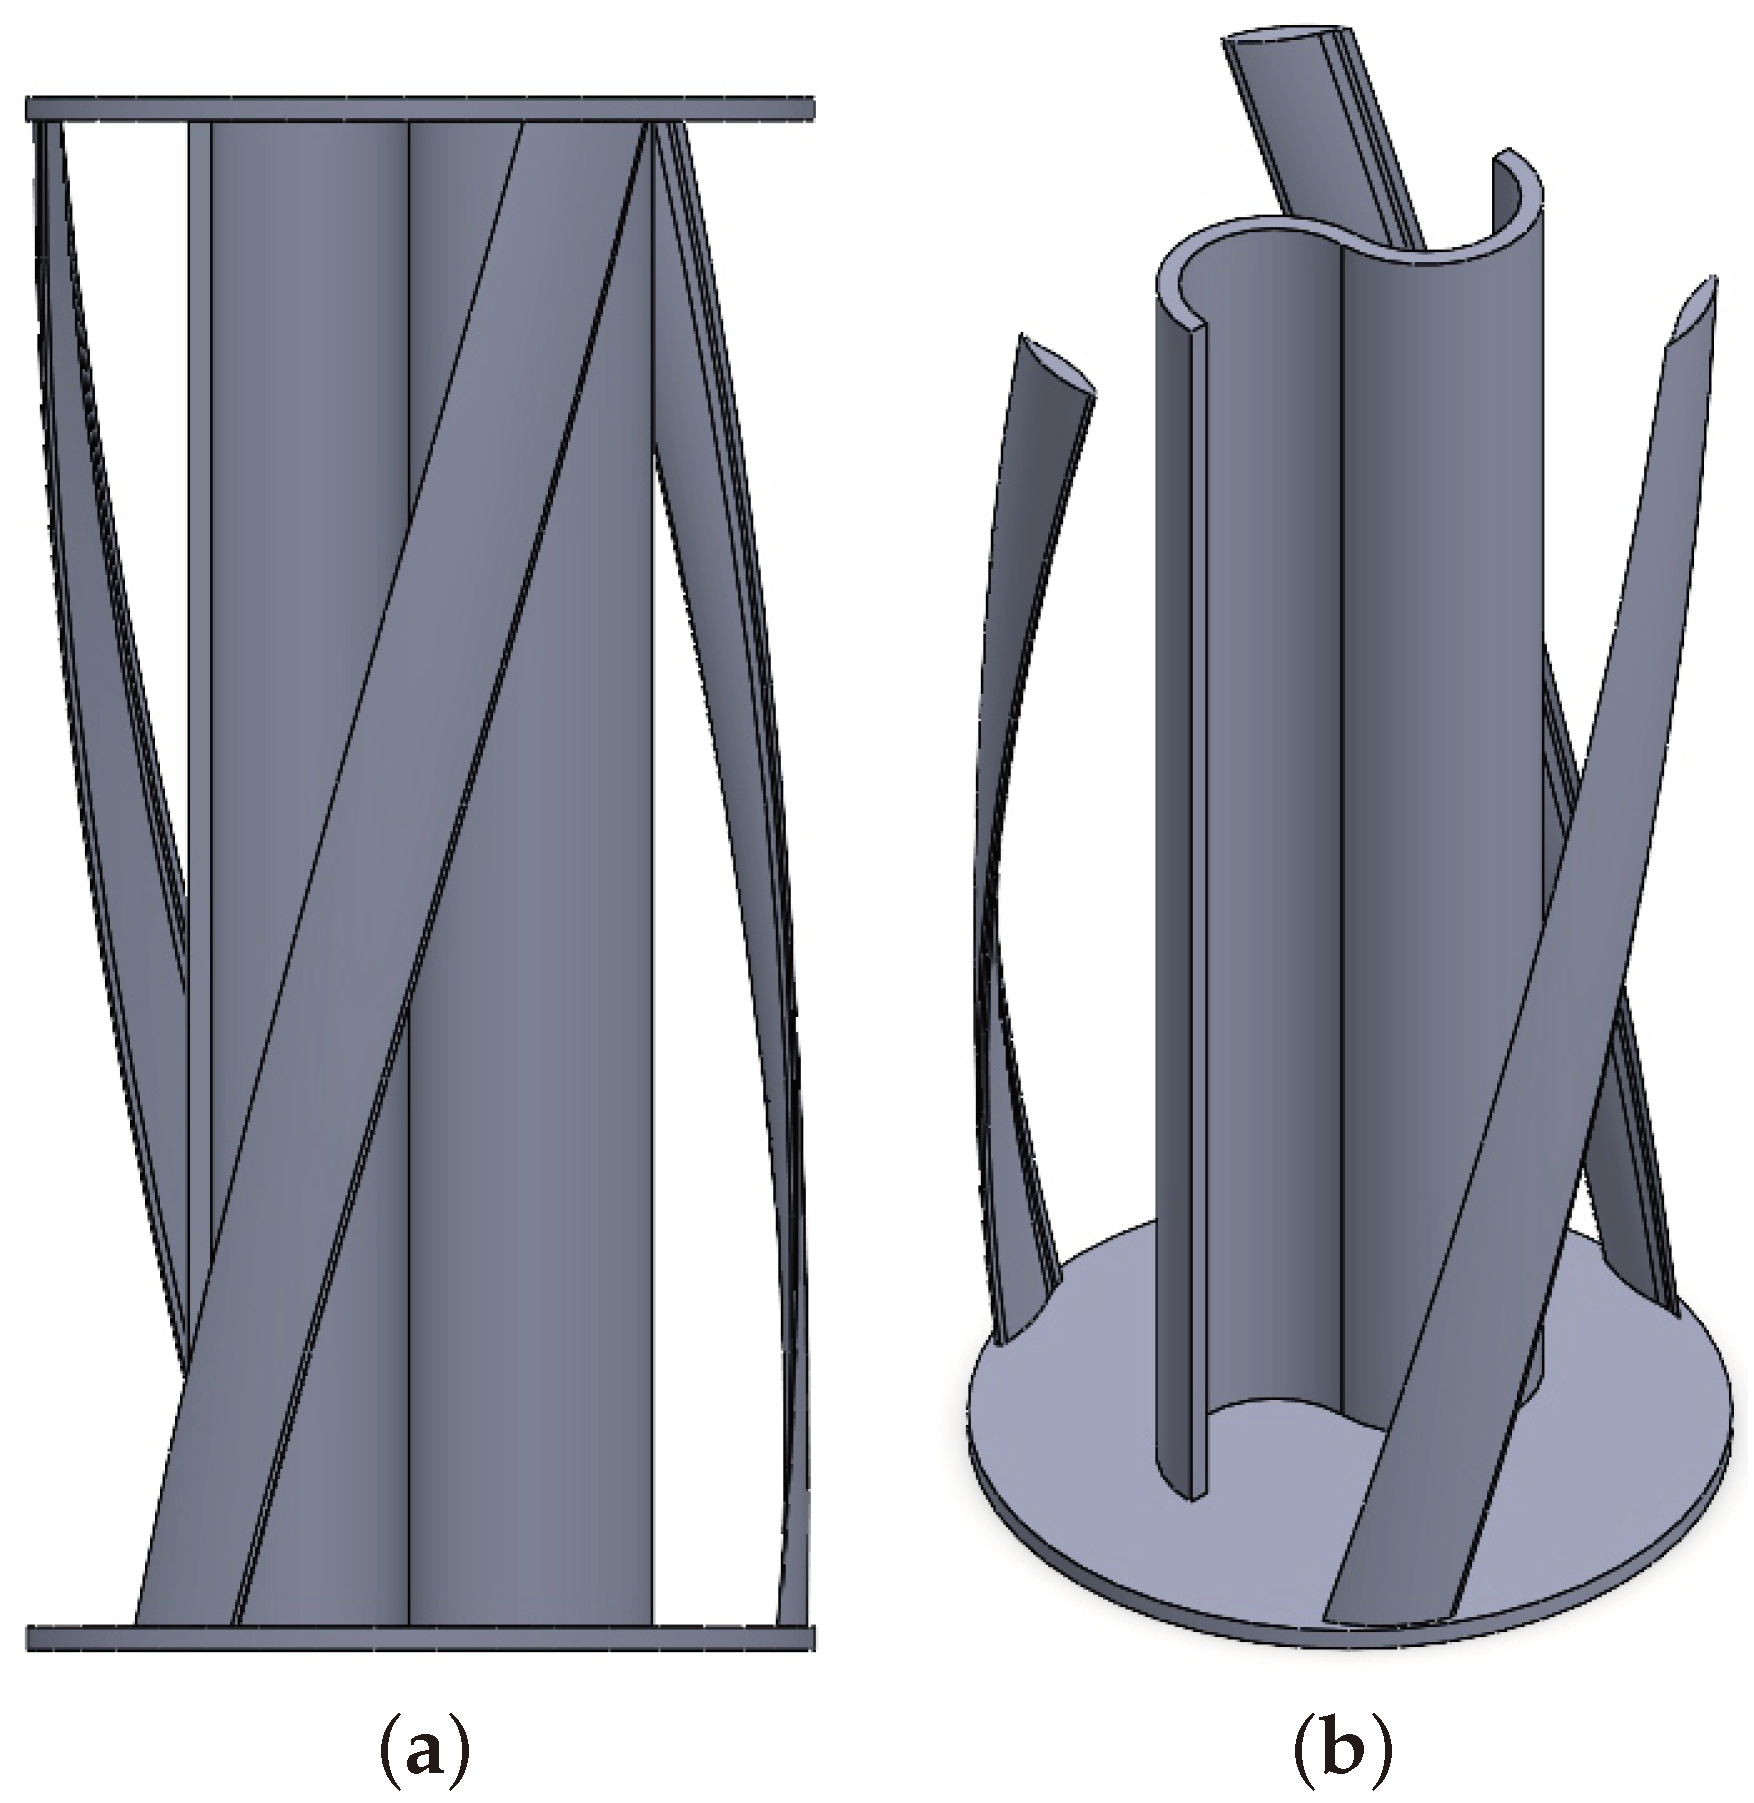
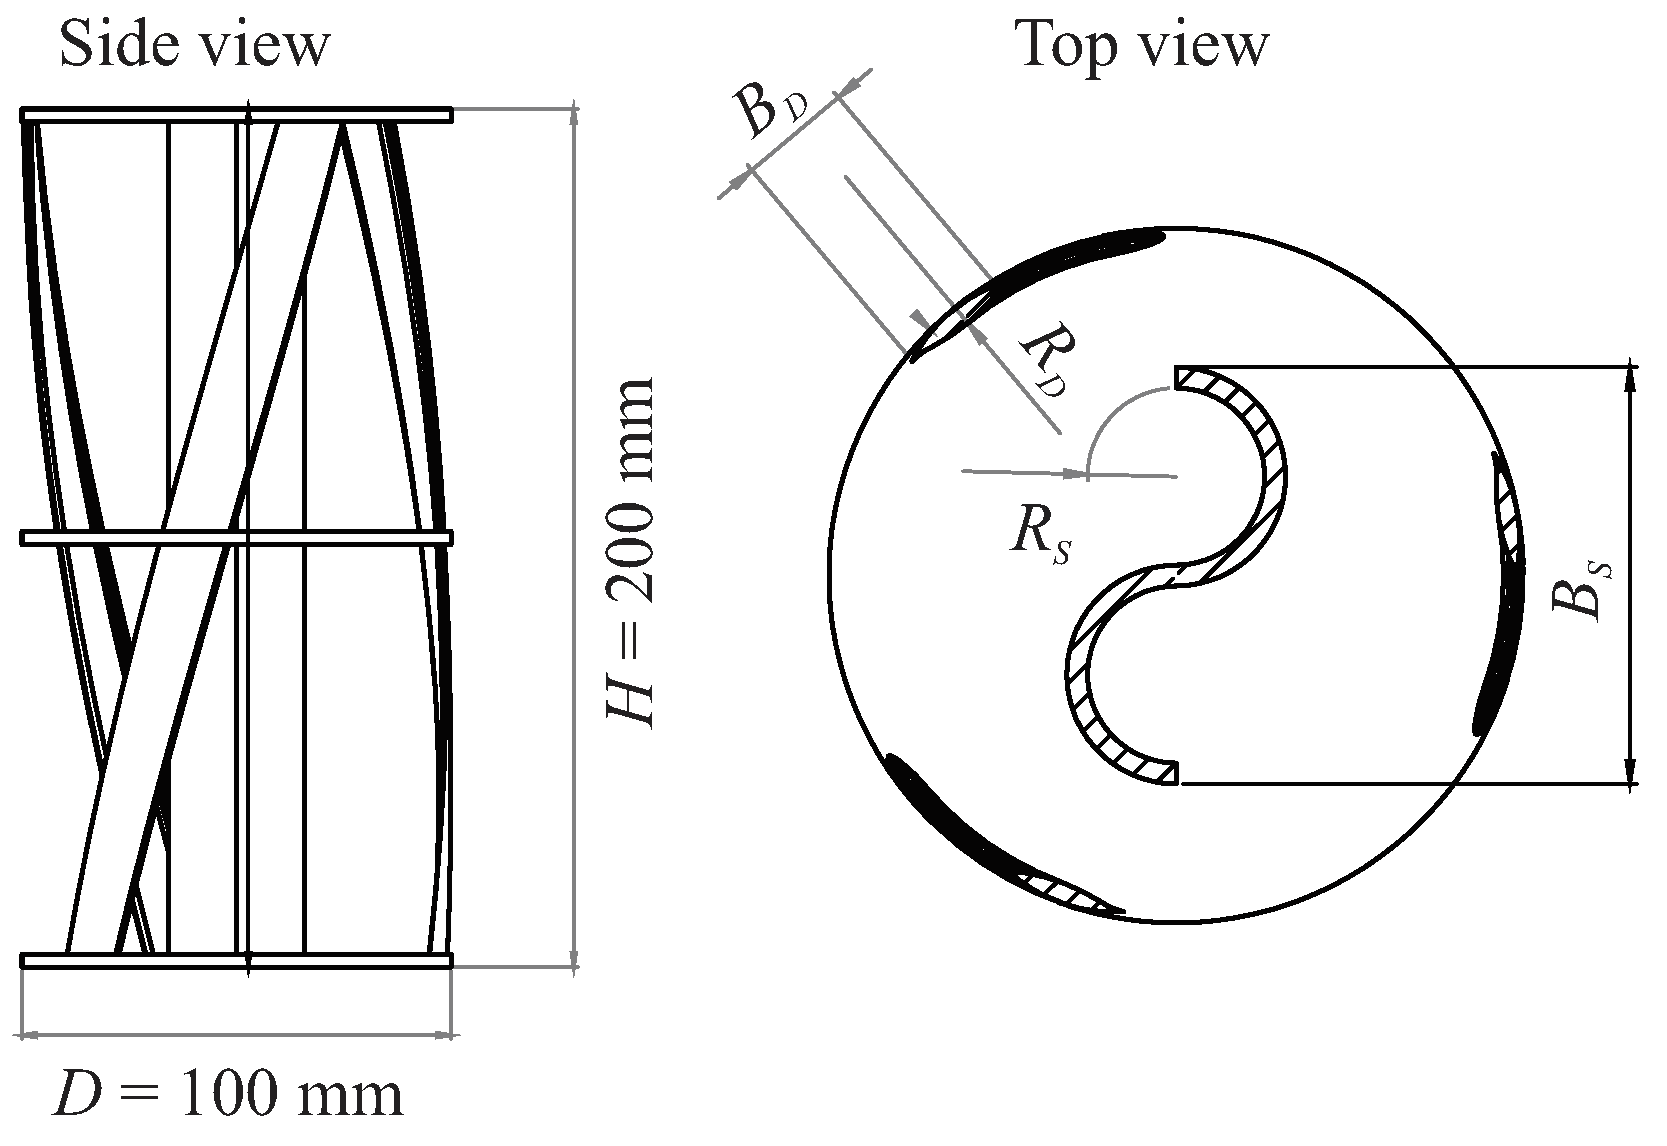
Previous studies have a variety of approaches to hybridize SRs and DRs, where the SR is much smaller than the DR. These designs operate predominantly as an SR or DR, which limits the potential benefits of true hybridization. Designs that rely heavily on SR characteristics tend to excel in low-speed, high-torque conditions. In contrast, those that resemble DR configurations tend to perform better at high speeds, prioritizing aerodynamic efficiency. This tendency to favor one rotor type over the other indicates that the full potential of hybridization remains underutilized.
The challenge is to achieve a balanced integration of SR and DR characteristics, combining the high torque and low-speed efficiency of the SR with the aerodynamic advantages of the DR. A true hybrid design should deliver consistent performance over a wider range of wind conditions without sacrificing the unique strengths of either rotor type. While current designs attempt to achieve this goal, they often fail to take full advantage of the complementary capabilities of the SR and DR rotors, leaving ample room for improvement in hybrid turbine configurations.

2.2. HSHDR Design

The HSHDR features a compact design with both rotors enclosed by end plates, ensuring they are the same height, as shown in Figure 1. The SR is placed inside, while the HDR forms the outer layer, maximizing space and enhancing their combined performance. This innovative configuration meets the demand for efficient micro-scale wind turbines and stands out as the first design of its kind for rotors less than 1500 mm high.
The HSHDR design is distinguished by its ability to generate high torque even under low wind conditions. Both the SR and HDR rotors operate at the same rotational speed, ensuring uniform mechanical stress and reducing wear, which contributes to the system’s durability and efficiency. The innovative configuration features a twisted, three-bladed HDR with a 45 angle in the outer layer and a two-bladed SR with straight blades in the inner layer. The progressive twisting of the HDR blades along the rotor height significantly enhances aerodynamic performance.
Figure 2 details the geometry of the proposed HSHDR: Savonius blade curvature radius R S = 12.75 mm, Darrieus profile radius R D = 27.42 mm, and blade distances for Savonius B S = 60 mm and Darrieus of B D = 16.26 mm. The rotor was designed with a height of H = 200 mm and a diameter of D = 100 mm, resulting in an aspect ratio of A R = H / D = 2 . These specifications were deemed appropriate for low-power load applications.

2.3. Governing Equations

C p represents the efficiently the rotor converts wind power ( P wind ) into mechanical power ( P rotor ), and it can be determinated by (1), where T is the dynamic torque, ω is the angular velocity, ρ is the air density, A is the rotor’s swept area, N is the rotor speed in rpm, and V is the wind speed. Dynamic torque affects the rotor’s efficiency, while static torque T s impacts its capability.
C p = P rotor P wind = T × ω 0.5 ρ A V 3 = 2 π N T 60 × 0.5 ρ A V 3 ,
The static C TS and dynamic torque C T coefficients are defined by (2), where D is the rotor diameter, and H is the rotor height.
C TS = 4 T s ρ V 2 D 2 H , C T = 4 T ρ V 2 D 2 H ,
The tip-speed ratio ( λ ) is given by (3), where u t is the rotor tip speed,
λ = u t V .
For small turbines, airflow is treated as incompressible, governed by the Reynolds-Averaged Navier–Stokes equations by (4) and (5), where ρ u i u j ¯ is the Reynolds stress tensor.
u i ¯ x i = 0 ,
u i ¯ t + u j ¯ u i ¯ x j = 1 ρ p ¯ x i + ν 2 u i ¯ x j 2 x j u i u j ¯ ,
To close these equations, the κ - ω SST turbulence model is applied [16,17]. The Reynolds number ( Re ) is calculated by (6), where μ is the air’s shear viscosity,
Re = ρ V D μ .

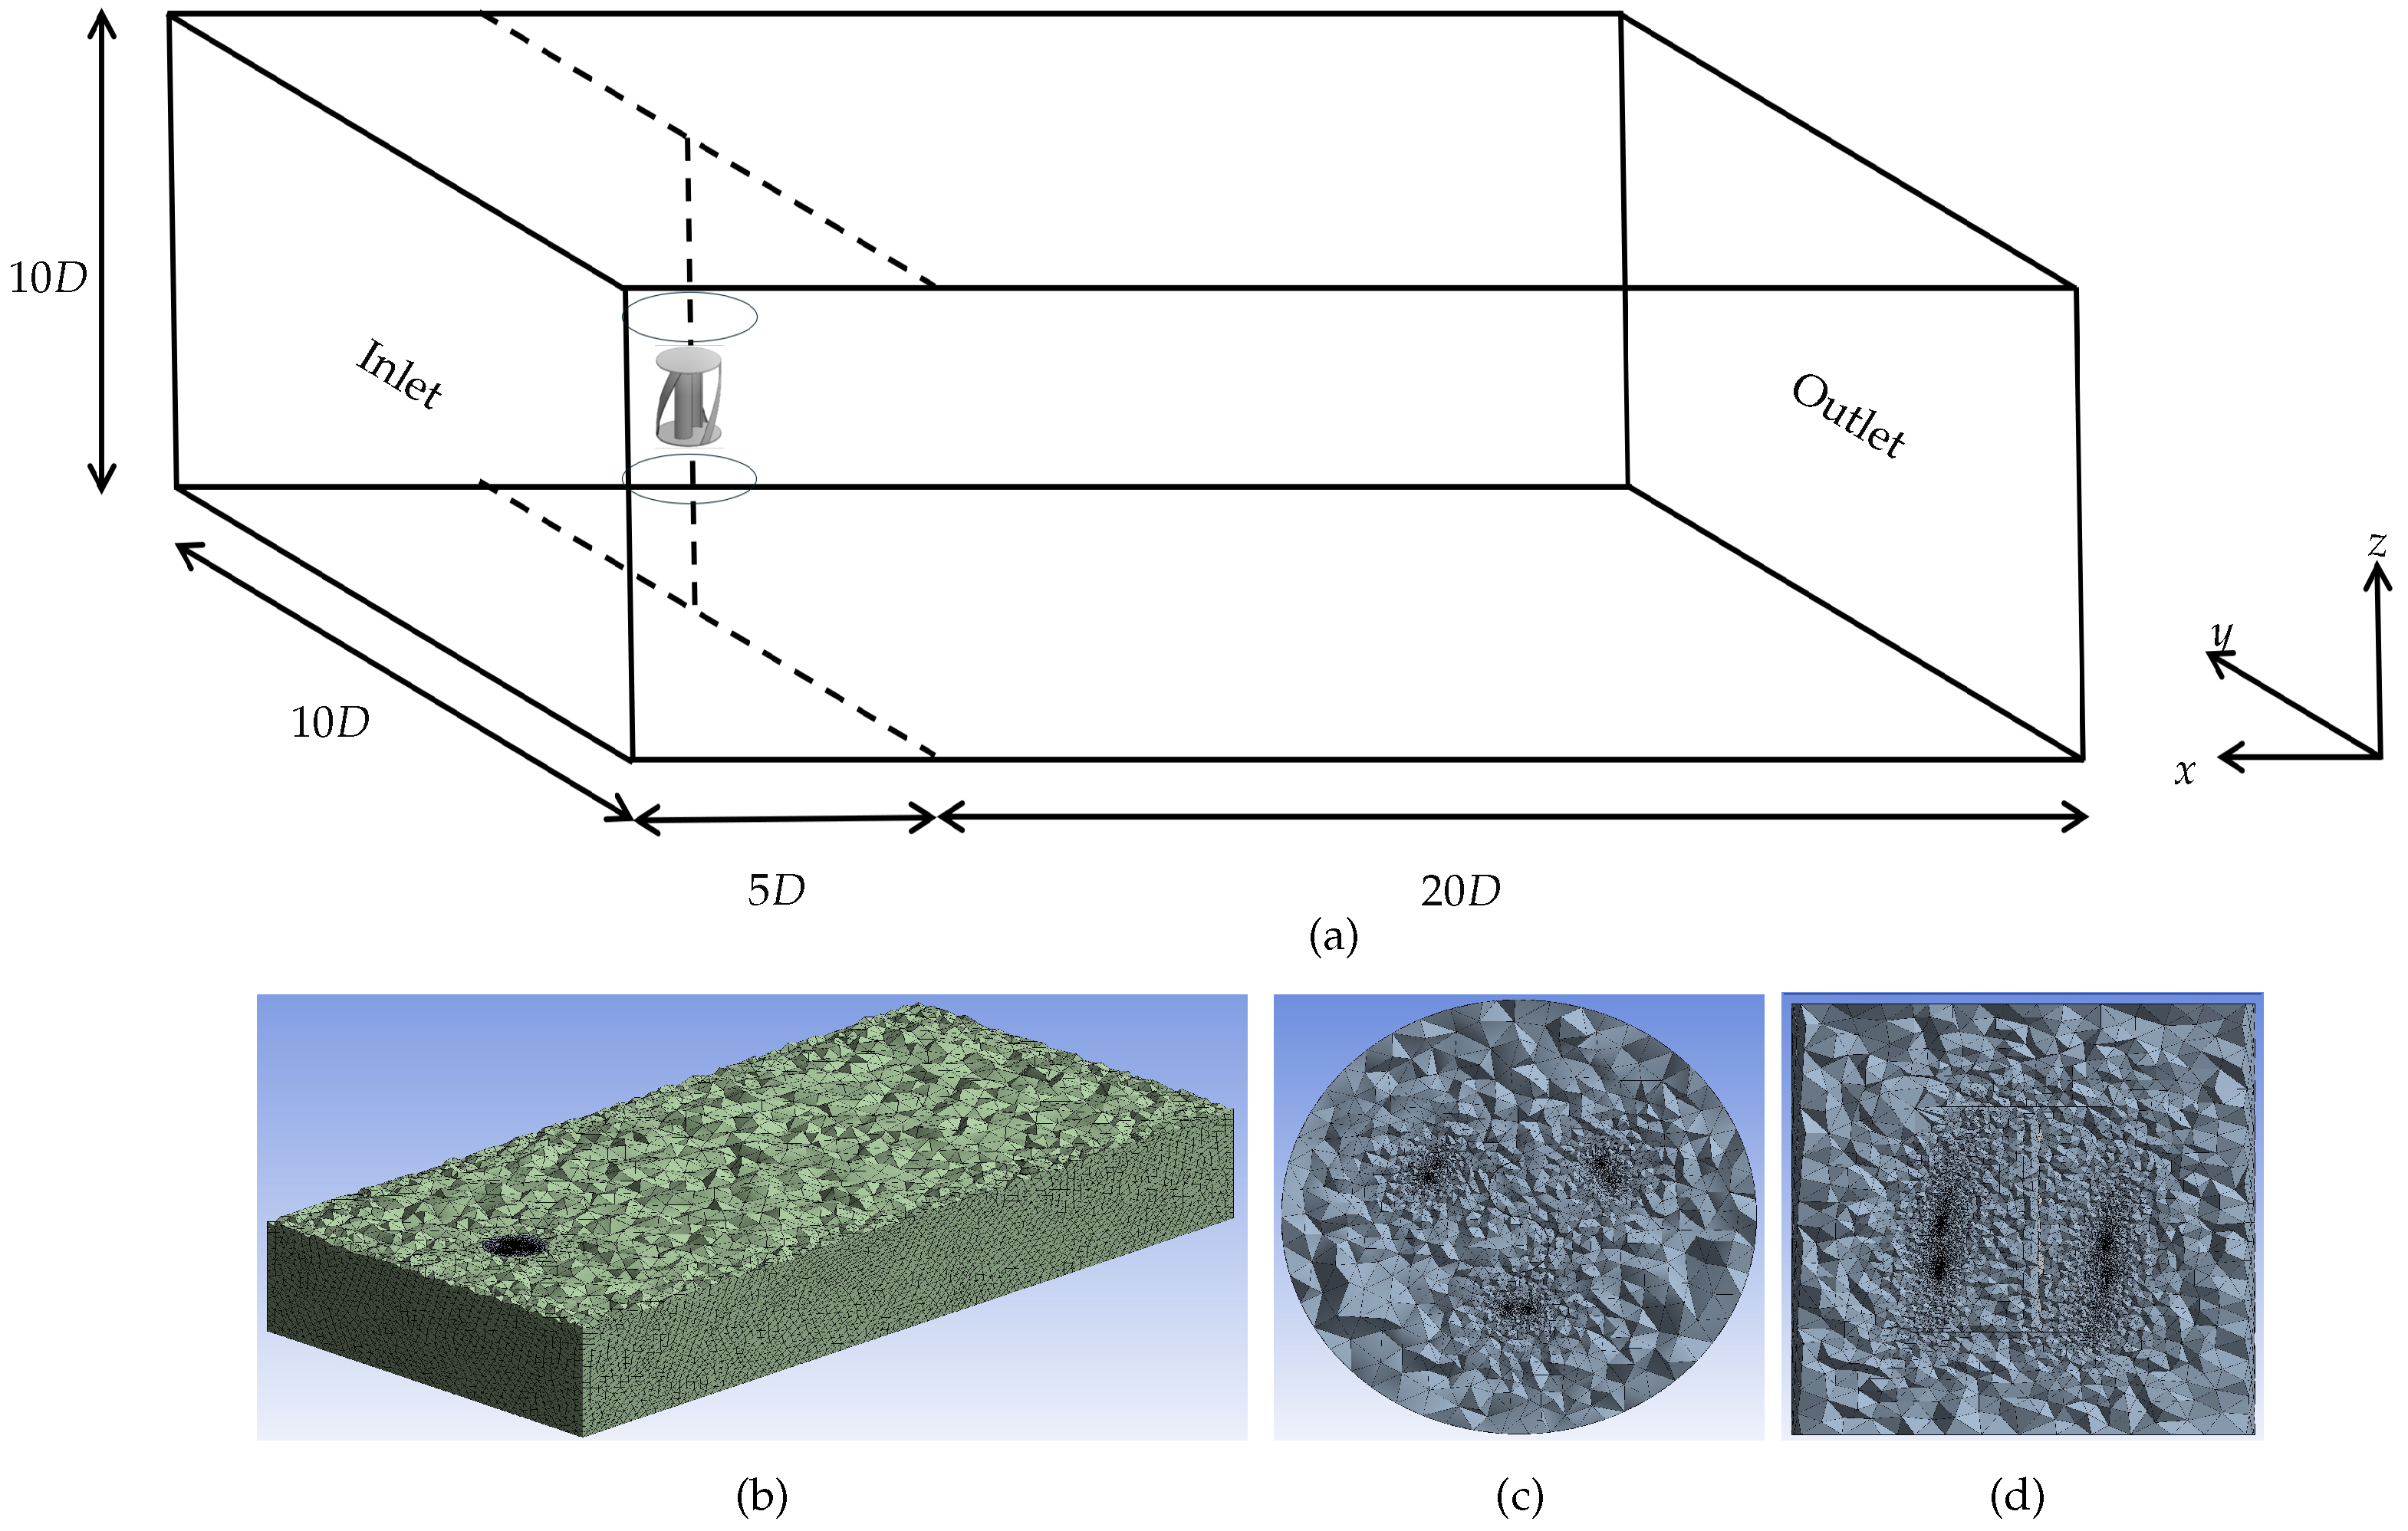
2.4. Numerical Methods and Domain Details

The numerical solution of (4) and (5) was carried out using ANSYS® Fluent 2022, a computational fluid dynamics (CFD) software based on the finite volume method [18]. The computational domain was rectangular, with dimensions defined relative to the rotor diameter: an upstream length of X up = 5 D , extending from the test chamber inlet to the rotor axis; a downstream length of X down = 20 D , measured from the rotor axis to the chamber outlet; and a width and height of Y = 10 D and Z = 10 D , respectively, as shown in Figure 3a. These domain sizes were selected based on their effect on the C T . The mesh consisted of tetrahedral cells, with a uniform growth rate of 1.2, and included five inflation layers near the rotor to improve resolution, as depicted in Figure 3b–d.
The computational domain in Figure 3a is divided into an inner rotating zone containing the rotor model and an outer stationary zone, separated by a 1.5 D diameter interface to ensure smooth flow around the rotor. The domain size, defined in multiples of the turbine diameter, helps reduce rotor induction effects at the inlet and allows wind velocity to recover at the outlet. The inlet boundary is positioned 5 D upstream of the rotor to minimize its impact on the velocity profile, while the outlet boundary is set 20 D downstream to capture the wake formation [19]. This setup ensures that the boundary conditions have minimal influence on rotor performance. The HSHDR is aligned along the y-axis and placed midway between the chamber’s lateral walls, 5 D from the inlet plane.
Table 1 lists the parameters for six different cases used to analyze the sensitivity of C T to spatial resolution, with optimal time steps t determined for each run, as shown in (7), where Δ θ represents the angular step, and ω denotes the angular velocity. This table shows that increasing the cell count in the stationary zone from 419,733 to 1,112,265 results in only a minor change in C T , with a maximum relative deviation of 1.5%. Consequently, to optimize computational efficiency, the numerical analysis of the HSHDR was conducted using the resolution from Case 4.
Δ t = π 180 Δ θ ω .
Optimal performance was ensured by maintaining a consistent Re operational range across all simulations. The relationship between C p and C T with λ at a given Re range was designed to remain unaffected by geometric variations. Two criteria evaluated convergence: (i) minimal fluctuations in the mean values of C P and T, and (ii) stability C T over multiple rotational cycles. Fulfillment of these conditions ensures that the numerical model reliably captures rotor performance under various operating scenarios.

3. Results

This section examines the performance of the HSHDR across a wide range of wind conditions by exploring the relationship between C p and C T as functions of λ . The aim is to provide a comprehensive understanding of the HSHDR’s behavior. The prototype was fabricated using PLA plastic through 3D printing, selected for its high strength and minimal thermal expansion.

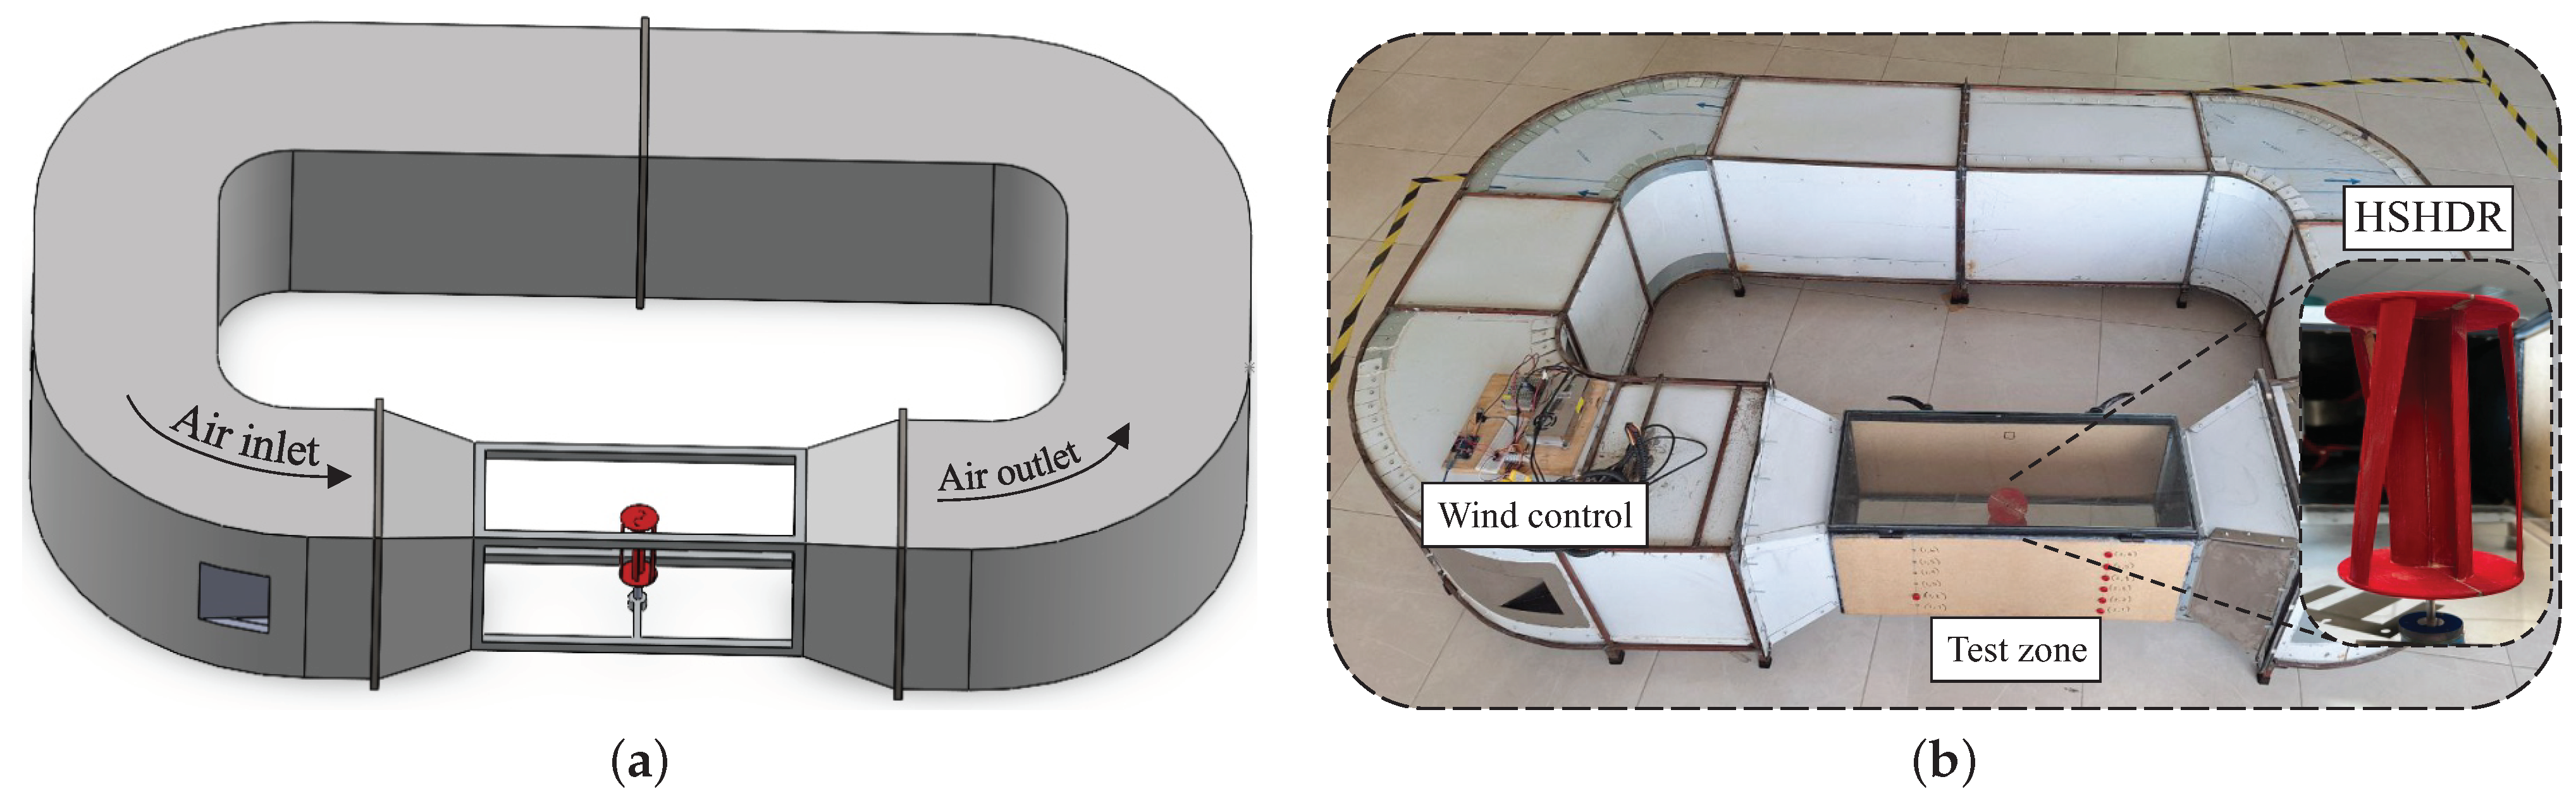
3.1. Experimental Setup

Experimental evaluation of the HSHDR design was conducted using a closed-loop wind tunnel, as illustrated in Figure 4. The wind tunnel provides a controlled environment to evaluate the turbine performance under different wind conditions. The airflow path, as shown in the schematic representation in Figure 4a, moves uniformly from the air inlet through the test area to the air outlet, ensuring a constant flow during testing. The wind tunnel setup, depicted in Figure 4b, includes the test area where the HSHDR was mounted and the wind control system for adjusting the airflow parameters.
The wind tunnel is equipped with instruments to ensure accurate measurements. Wind speeds within the test area were measured with a TROTEC BA30WP anemometer (TROTEC GmbH, Heinsberg, Germany), which provided precise and reliable data to validate airflow uniformity. The rotational speed of the HSHDR was measured with an Omron E6B2-CWZ6C encoder (Omron Corporation, Kyoto, Japan), which includes high-resolution information. These instruments were interfaced with a Q2-USB data acquisition module (Quanser, Markham, ON, Canada), which allowed real-time data processing and visualization through MATLAB/Simulink 2016 ensuring the reliability and immediacy of the measurements. The wind generation system consists of three A2212 1000 kv brushless motors (Shenzhen Xinxida Technology Co., Ltd., Shenzhen, China), each regulated by a three-phase inverter (ESC 30A) (Shenzhen Xinxida Technology Co., Ltd., Shenzhen, China). This configuration allows precise control of wind speeds in the test area, facilitating the evaluation of the HSHDR under varying conditions. The wind control system, as shown in Figure 4b, ensured consistency and repeatability in the experiments, a critical factor in validating the aerodynamic performance of the turbine. This experimental setup integrates advanced instrumentation and control systems, offering a robust framework for comprehensively evaluating the HSHDR. By ensuring controlled test conditions, the experimental design allowed a thorough investigation of the hybrid turbine performance.
In addition, the design incorporates an analytical approach, dividing the rotor into three measurement profiles (I, II, and III) positioned at different heights—20 mm, 100 mm, and 180 mm—for aerodynamic and structural analysis. These profiles are not part of the rotor but represent sectional slices, as depicted in Figure 5.

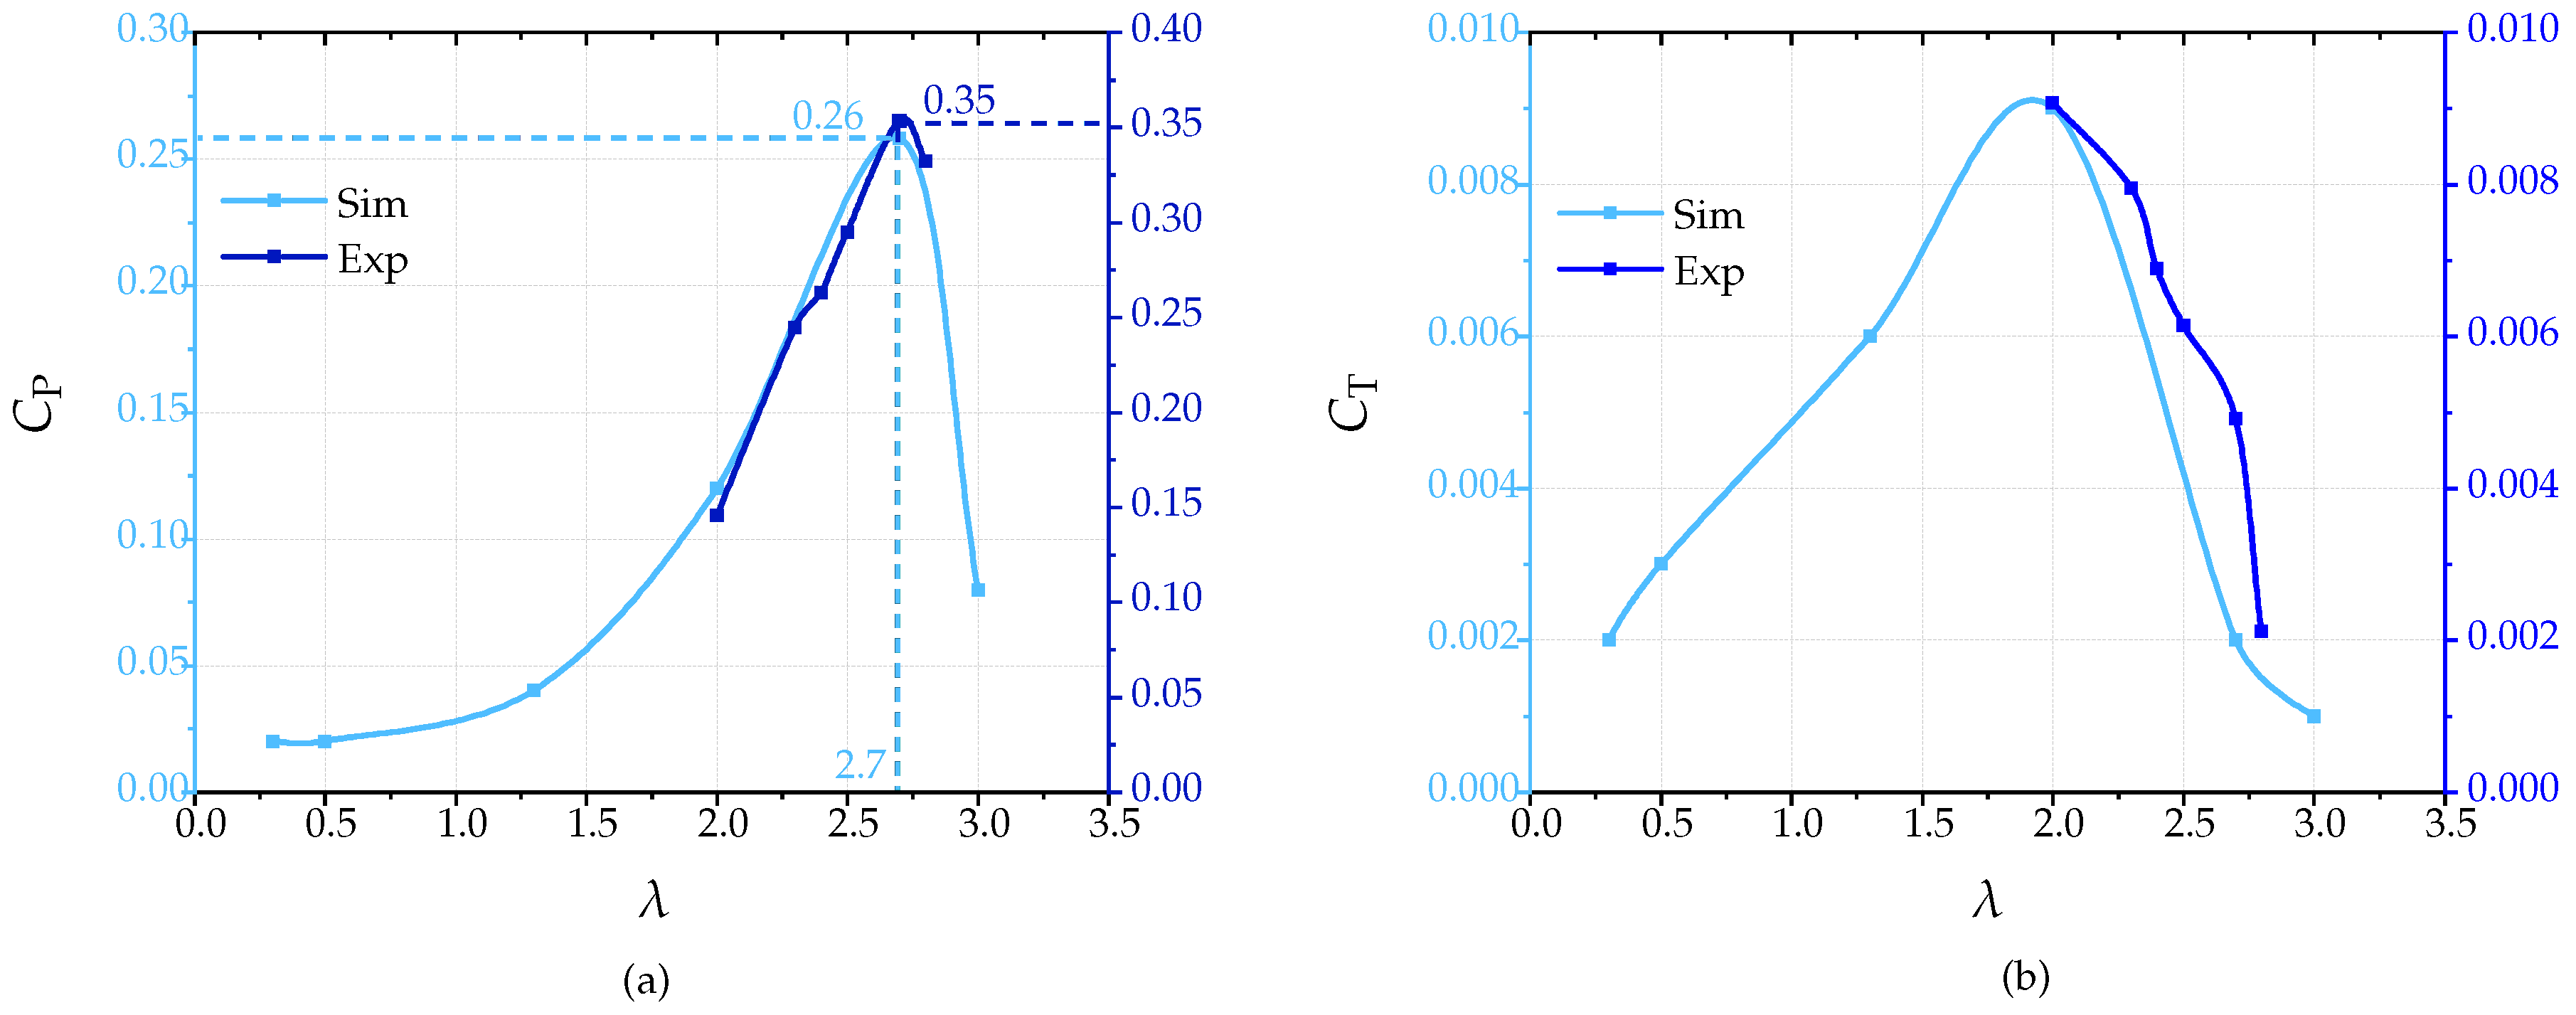
3.2. Experimental Validation

The analysis was conducted through experimental tests in a closed wind tunnel with the rotor prototype placed in the test zone, as shown in the inset of Figure 4b. Furthermore, numerical simulations were carried out to assess the system’s dynamic performance.
To determine relationship between the coefficients C p and C T and the tip-speed ratio λ for the HSHDR is shown in Figure 6. As λ increases, C p rises sharply, reaching its peak near λ = 2.7 , which represents the optimal operating point for maximum power extraction in the simulation, having λ between 0.0 and 3.0. Beyond this point, C p gradually declines due to increased aerodynamic drag, reducing efficiency. Similarly, C T , which reflects the wind’s force driving the rotor, peaks around λ = 2.7 and then decreases. Experimental results indicate a similar trend. Due to the close-tunnel characteristics, the λ is shorter (2.0–2.8) range than in the simulation. The experimental C T reaches a peak value of 0.00907, closely matching the simulated peak of 0.0091, shown in Figure 6b. In contrast, the experimental C P attains a higher peak value of 0.35 compared to 0.26 in the simulation, illustrated in Figure 6a. The discrepancy between the experimental and simulated C P values arises due to differences in the inflow conditions. In CFD simulations, the wind flow is assumed to be uniform and free of turbulence, whereas in experiments, the wind turbine operates in a recirculating channel where variations in the incoming flow velocity and turbulence intensity influence the turbine’s aerodynamic response [20]. Additionally, the C T fluctuations observed after peak λ are likely attributed to blade–wake interactions and post-stall vortex shedding, which become more pronounced in experimental conditions due to unsteady inflow variations and turbulence within the recirculating channel. Unlike CFD simulations, which assume a uniform, idealized flow field, the experimental setup introduces velocity gradients, boundary layer effects, and turbulence intensity variations. This leads to deviations in C T scaling and increased load transients. These flow complexities contribute to higher fluctuations in aerodynamic forces, affecting the turbine’s performance and structural integrity [21].

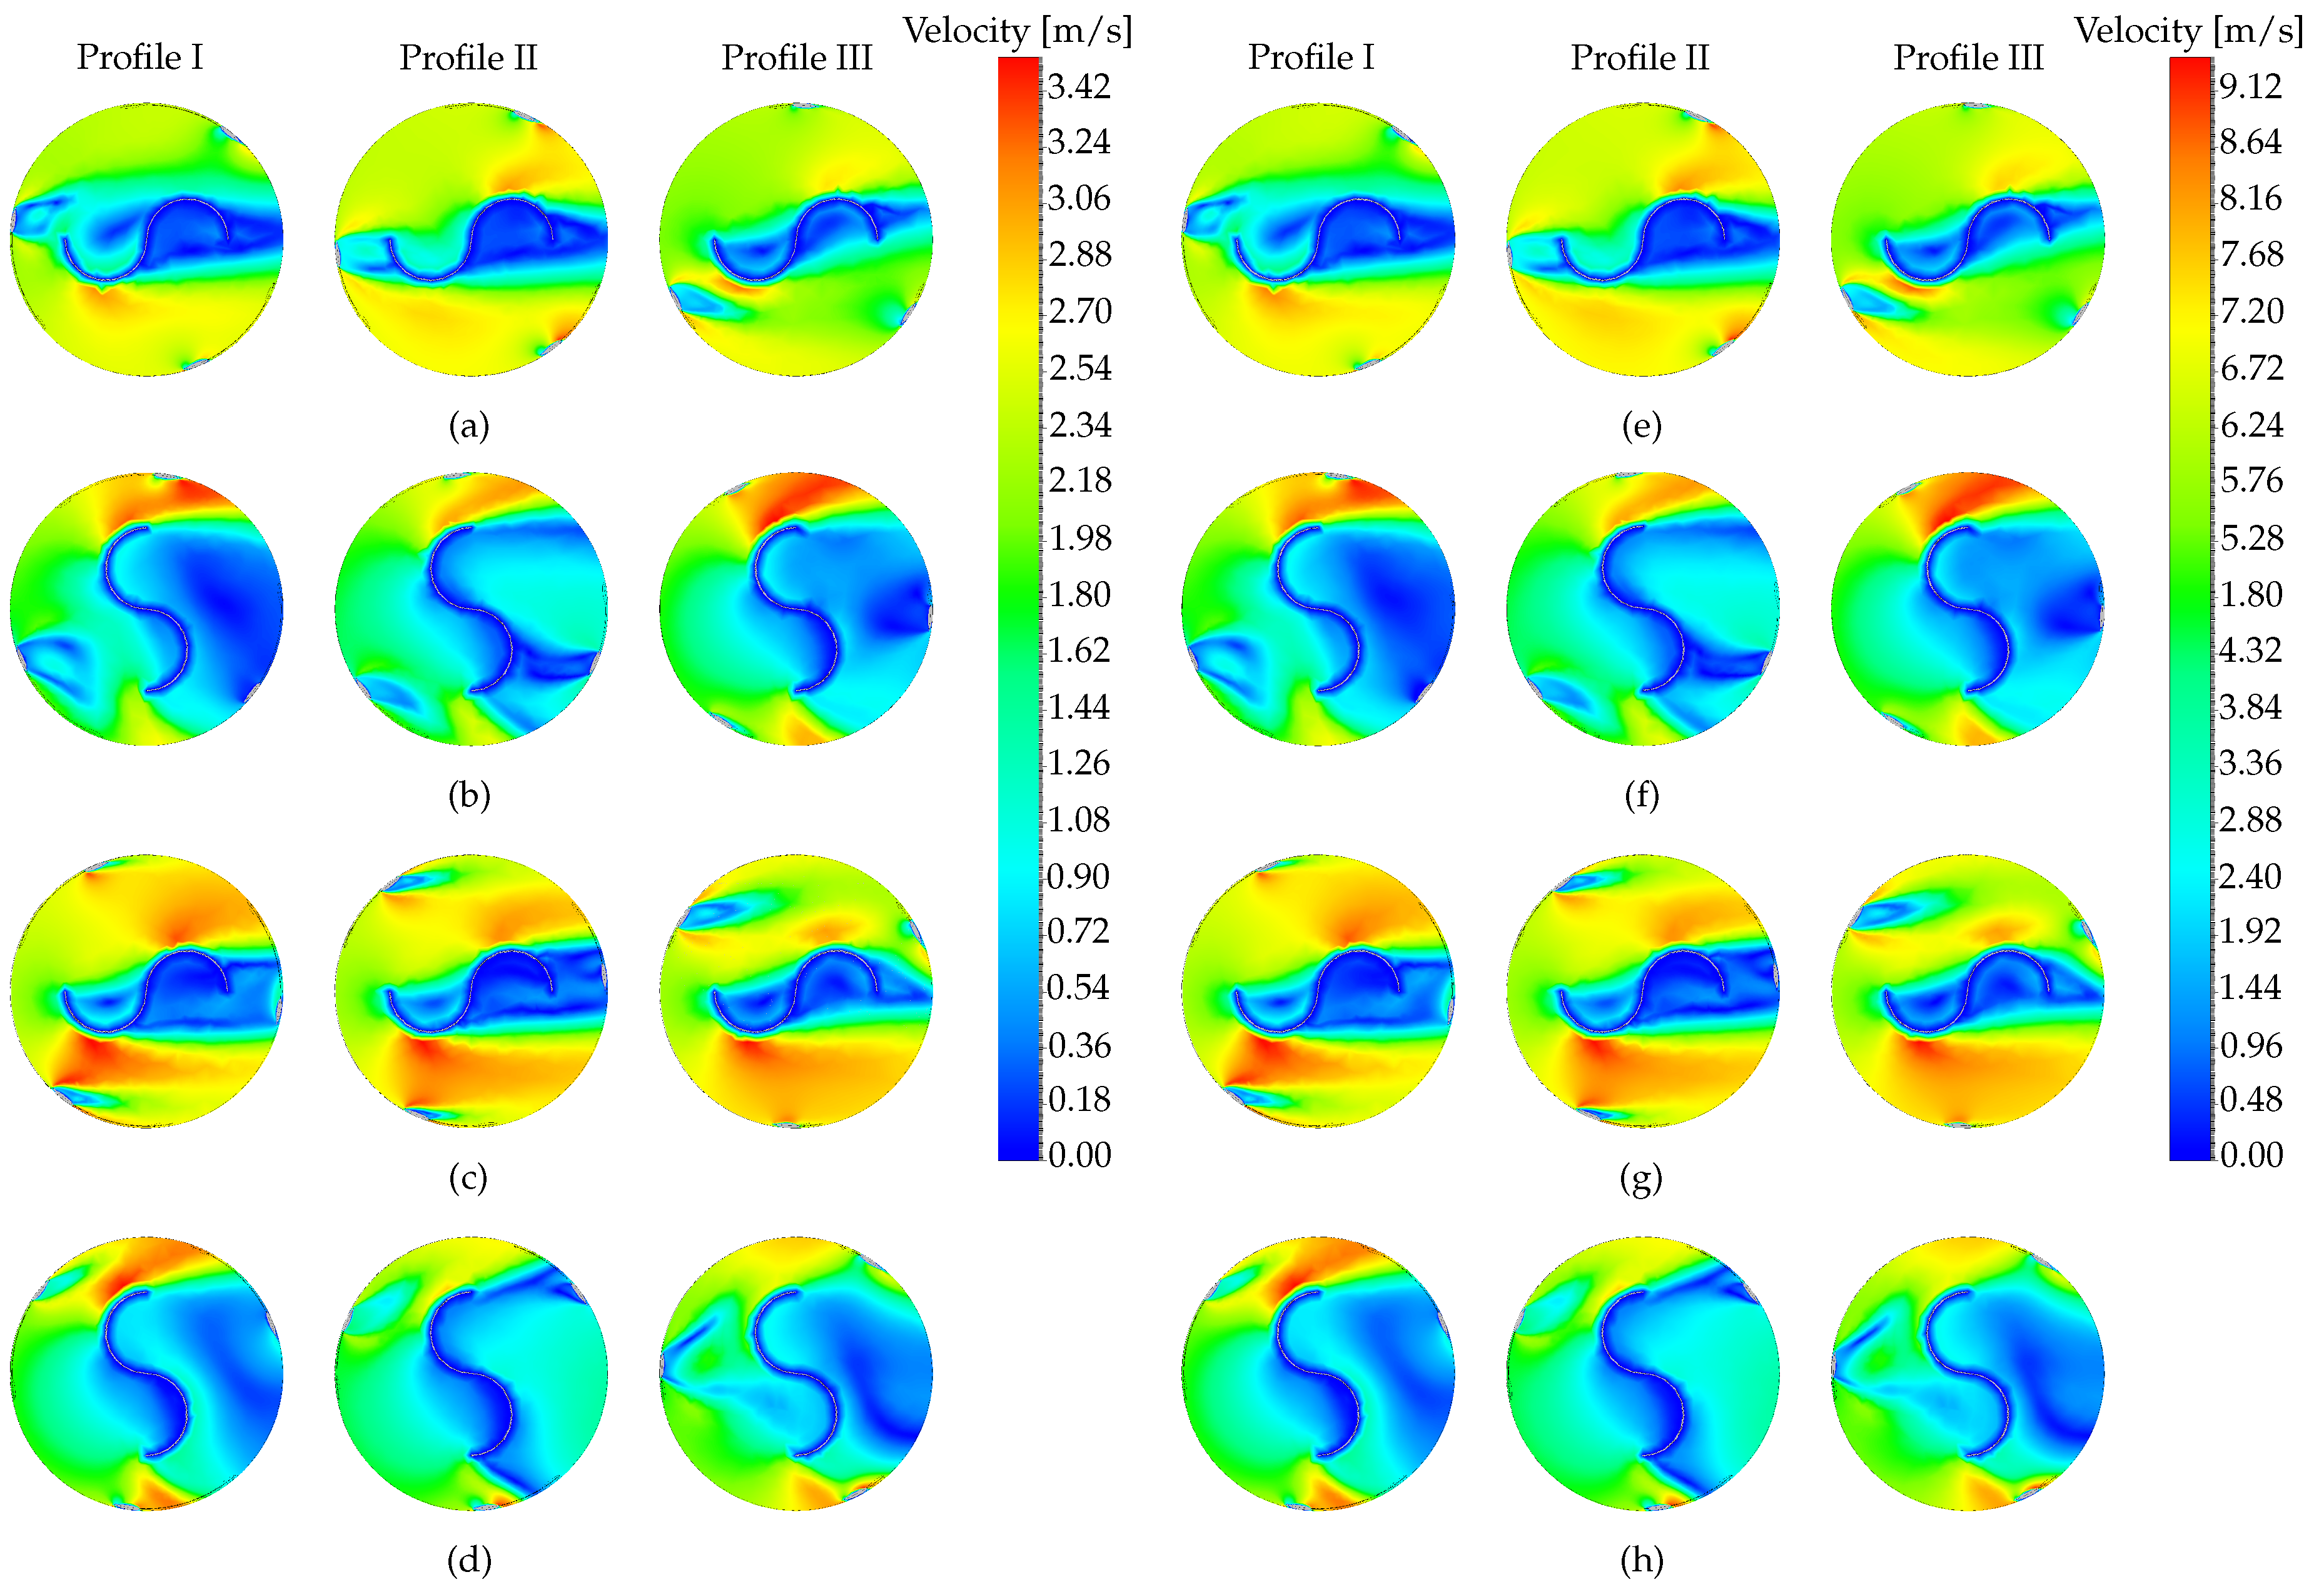
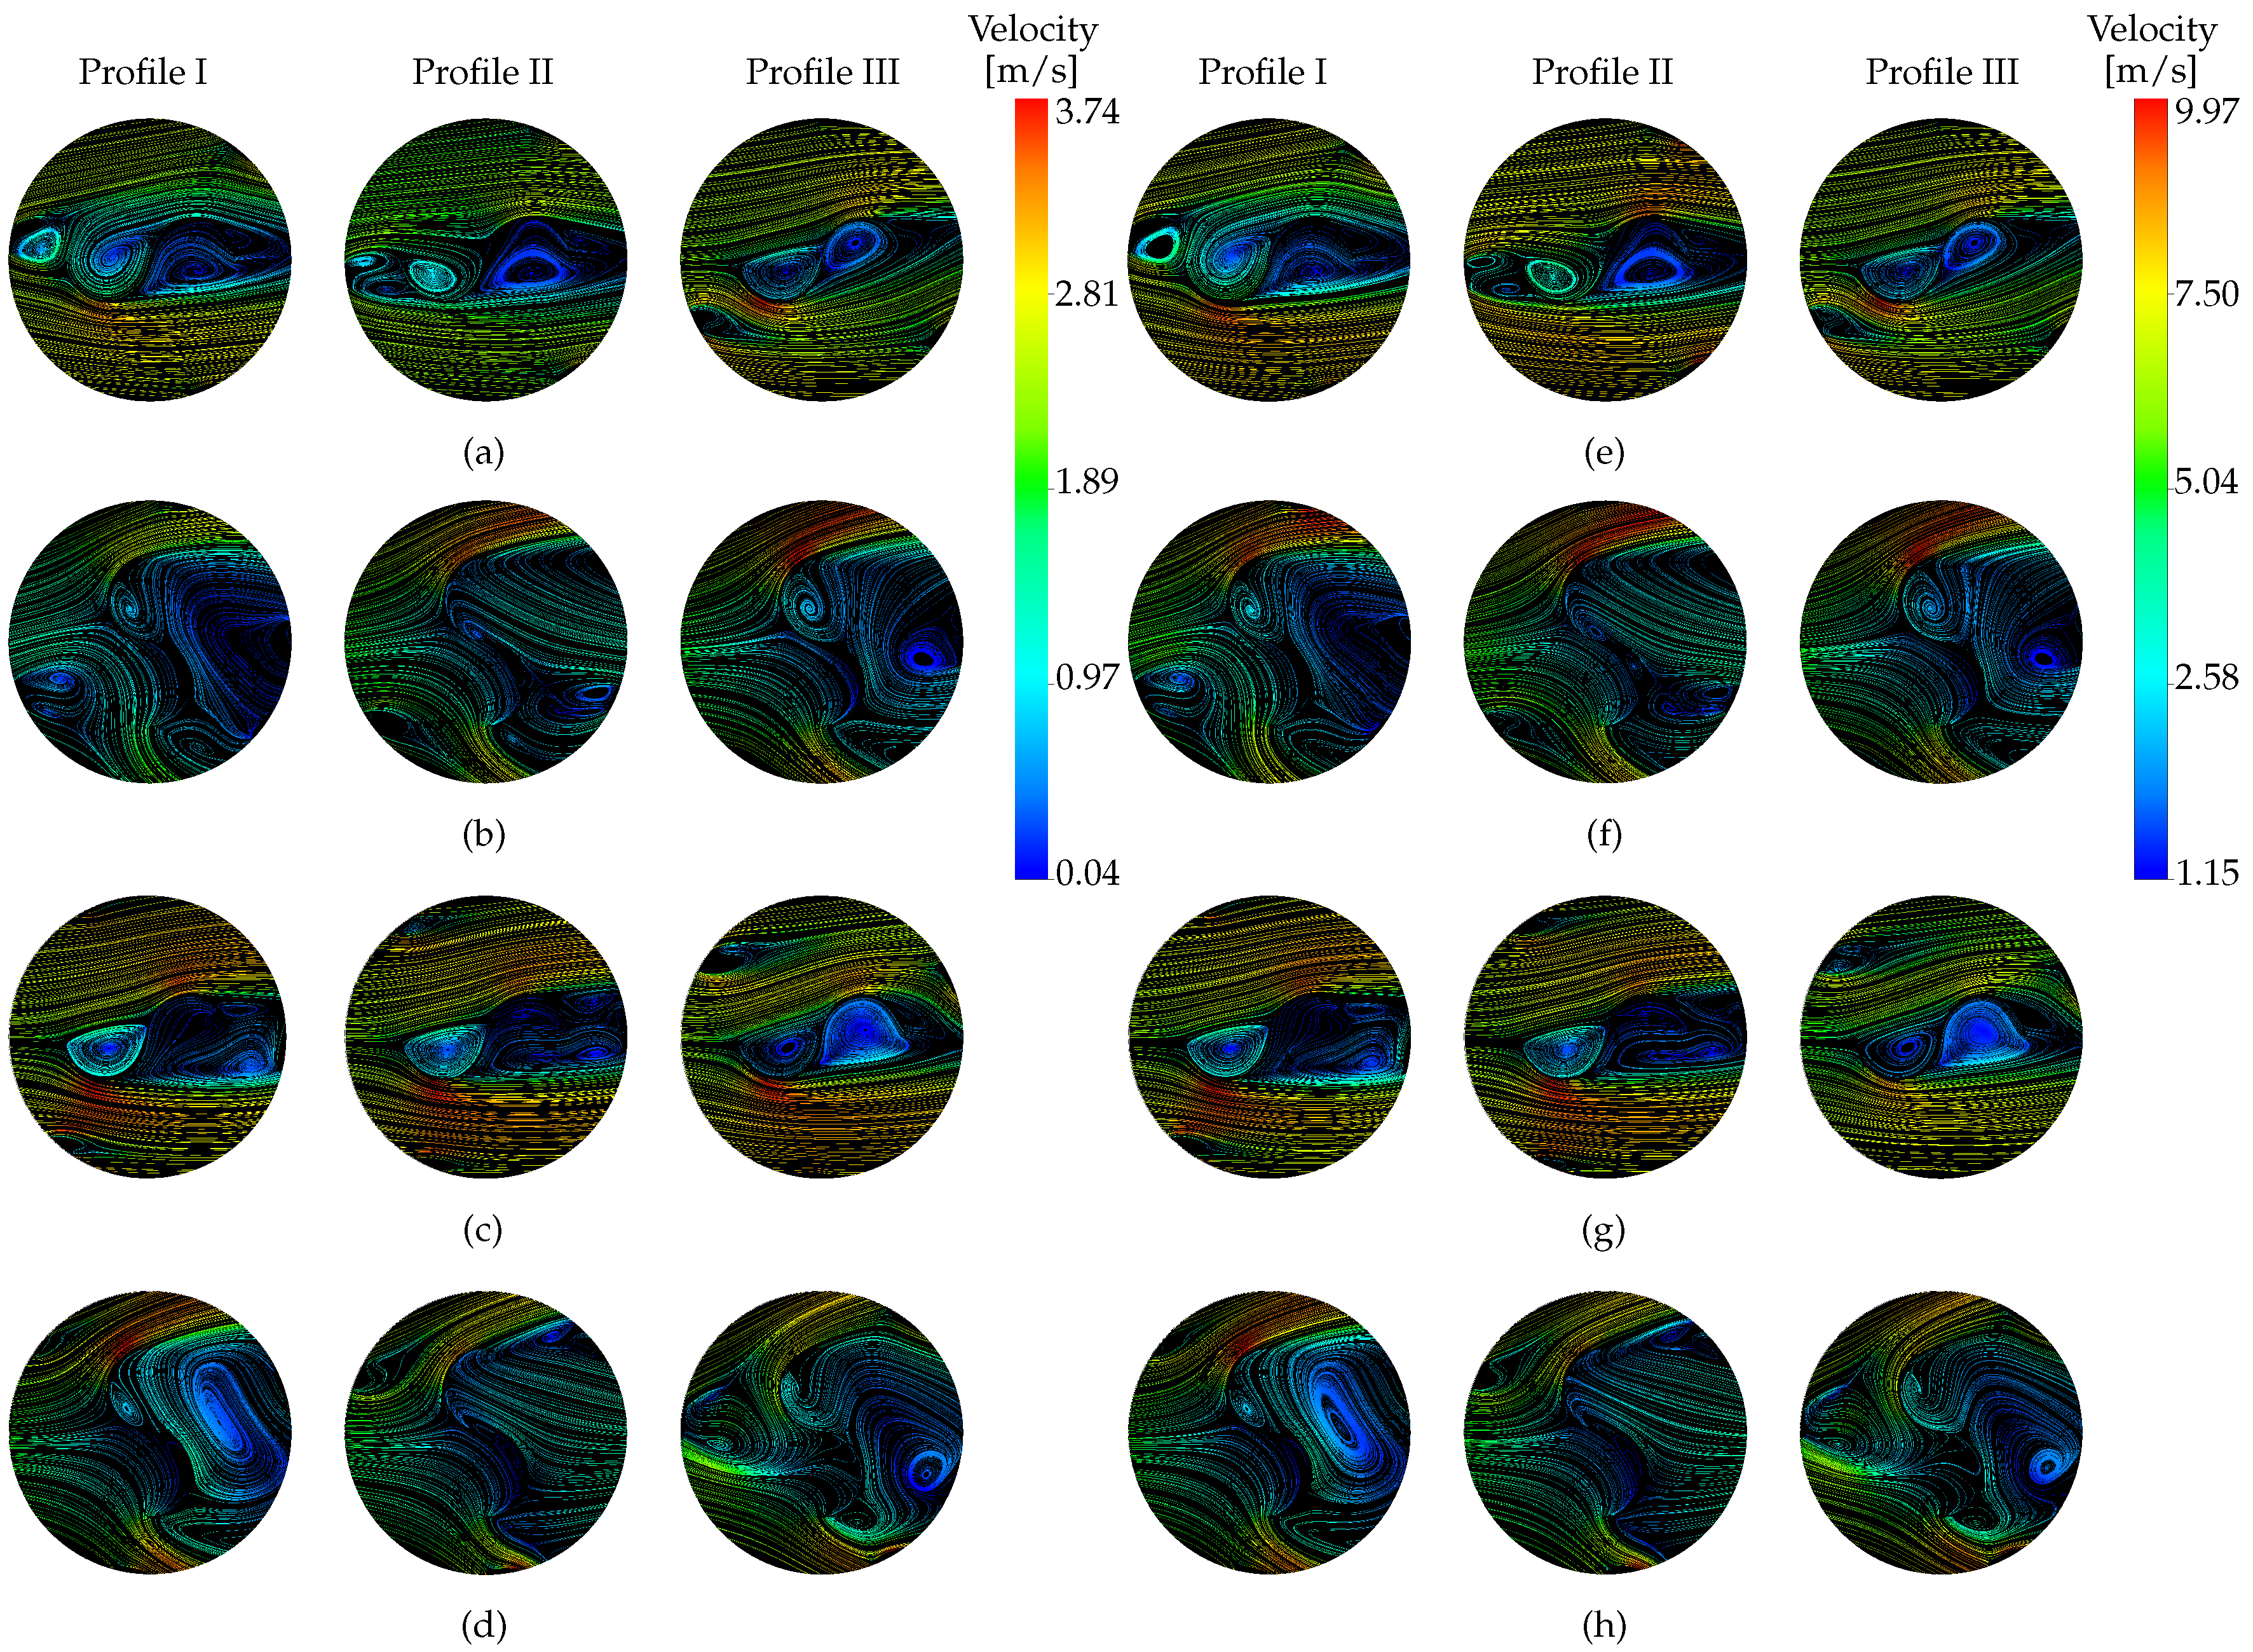
3.3. Performance Assessment

The CFD analysis of the optimized HSHDR configuration offers a detailed evaluation of the hybridization performance. As illustrated in Figure 7, Figure 8 and Figure 9, the turbulence generated by the Savonius rotor impacts a considerably smaller section of the Darrieus blades, highlighting improved aerodynamic interactions. This adjustment enhances the synergy between the Savonius and Darrieus rotors, optimizing the hybridization’s effectiveness. Furthermore, the detailed CFD analysis of pressures, velocities, and streamlines in the proposed hybrid wind turbine demonstrates improved utilization of the velocity field. It also highlights a significant reduction in vortex-induced effects, enhancing torque and overall turbine performance.
The performance of the HSHDR under a wide range of wind speeds, from 3 m / s to 8 m / s , is analyzed through pressure contour plots at horizontal measurement profile I, II, and III, as shown in Figure 7. These plots illustrate the pressure distribution at azimuthal angles θ = 0 , 90 , 180 , and 270 . The pressure field and velocity distributions, as presented in Figure 7 and Figure 8, illustrate a more effective redirection of the vortices generated by the HDR blades, thereby minimizing their impact on the SR. Additionally, the wake produced by the SR backstream exerts a reduced influence on the HDR blades, further enhancing the overall performance of the hybrid system. In Figure 7b,d, the pressure distribution is consistently oriented to support the turbine’s rotation. As the turbine operates, the pressure field decreases significantly (Figure 7a,c); however, it remains sufficiently strong and positioned to continue promoting the turbine’s rotation. Figure 8a,c illustrate the velocity field and the influence of the HDR blades, which generate small vortices. Despite these vortices, the velocity field remains dominant in the region that facilitates turbine rotation. Notably, the vortex formed downstream of the SR is larger, and its effects benefit the turbine’s rotational movement. In Figure 8b,d, a more pronounced influence of the HDR blades on the velocity field acting on the SR is observed. However, the vortices formed in this region are smaller, and their effects are less significant than the velocity field’s contribution to the SR’s rotation.
The pressure contours in Figure 7a–d distinguish high-pressure regions on the windward side of the blades and low-pressure zones on the leeward side, driving the turbine’s rotational motion. As the wind speed increases, the pressure contrast becomes more pronounced, improving the rotor’s power output. This pressure distribution becomes more pronounced at higher wind speeds, underscoring the rotor’s enhanced power output under such conditions (Figure 7e–h).
The velocity contours presented in Figure 8 further detail the flow dynamics. At a wind speed of 3 m / s , the velocity ranges from 0 to 3.42 m / s . Higher velocities occur near the blade tips, where wind interaction is strongest, while lower velocities are observed in the trailing regions due to flow detachment (Figure 8a–d). At a wind speed of 8 m / s , the velocity range increases to 9.12 m / s , with the regions of maximum velocity expanding further outward (Figure 8e–h). This increased velocity range indicates intensified aerodynamic interactions, contributing to improved turbine performance and power generation.
Streamline contour plots in Figure 9 provide a comprehensive view of the turbine’s flow field. The streamlines at the lower wind speed reveal moderate flow acceleration and recirculation areas, particularly near the trailing edges, shown in Figure 9a–d. The streamlines reveal moderate flow acceleration near the blade tips and recirculation areas on the leeward side, indicating regions where aerodynamic forces are effectively harnessed despite the slower wind conditions. As the wind speed increases to 8 m / s , the velocity range extends up to 9.97 m / s , with significantly more pronounced flow acceleration and the formation of stronger vortices, as illustrated Figure 9e–h. These high-velocity zones around the blade tips reflect increased aerodynamic forces.
Figure 9a,c illustrate the formation and evolution of vortices upstream, which are characterized by lower intensity and smaller size than those formed downstream. This flow behavior, observed in the turbine, aligns with the patterns described in the previous figures, further enhancing the turbine’s rotational motion. Figure 9b,d depict the formation of additional vortices; however, their intensity downstream is lower than that of the upstream vortices. The combined analysis of Figure 7, Figure 8 and Figure 9, across wind speeds ranging from 3 to 8 m/s, along with the obtained CP values, confirms the efficiency of the hybridization approach. The system effectively exploits the complementary advantages of both the SR and HDR turbines. This is further supported by the data presented in Figure 10, which demonstrate that the HSHDR configuration performs in a manner that lies between the behaviors of the SR and DR turbines. Additionally, it is evident from the figure that the HSHDR system can reach a high rotational speed regime within this wind speed range.

4. Discussion

The configurations shown in Table 2 represent various hybridization processes combining SR and DR rotors. The proposed HSHDR is shown to have a C P = 0.26 and achieves better efficiency under moderate wind speeds, outperforming configurations such as [10,12], primarily due to its compact size and operational range in higher wind conditions. For instance, [10] operates between 1 and 3 m/s, functioning predominantly as an SR, while [12] operates in the 7.5–12 m/s range, behaving more like a DR. Unlike these configurations, which do not fully leverage the hybridization potential, the HSHDR combines the strengths of both rotor types to improve performance significantly. Its wind speed range of 3–8 m/s is also well suited for urban and rural environments with moderate wind conditions, making it more practical than [15], which is optimized for higher wind speeds (5–20 m/s) and less suitable for these settings.
From a structural perspective, the proposed use of PLA material distinguishes it from configurations like [12], which employs wood, or [13], using aluminum. While PLA may lack the robustness of these heavier materials, its lightweight nature and ease of manufacturing provide significant advantages in terms of cost and adaptability, particularly for experimental setups and educational applications. The PLA’s properties align intending to create an accessible and scalable hybrid turbine.
The proposal’s λ = 2.7 fits well with practical wind conditions, offering a balance between the lower λ = 0.89 in [22] and higher [23] ( λ = 3.00 ). While λ values have specific benefits, the proposed design ensures reliable and efficient energy generation over its wind range. However, its C T = 0.009 is much lower compared to [14] ( C T = 0.68 ), suggesting a smaller contact area with the air.
The proposed HSHDR design distinguishes itself by adopting a dual-methodology approach that integrates experimental validation with computational simulations, offering a comprehensive evaluation framework. This contrasts sharply with studies like [11], which rely solely on simulations, potentially limiting practical applicability, and [12], which depend exclusively on experimental testing, thereby restricting the scope for parameter variation and modeling. By combining these methods, the proposed design achieves a balance between the precision of controlled computational analysis and the tangible real-world reliability of experimental data.
Table 2. Hybrid turbine configurations and performance parameters, ordered by methodology type and C P .
Ref.H/D SR [mm]H/D DR [mm] C P C T λ Blade SRAirfoil DRMaterialTypeV [m/s]
[22]NRNR0.600.89NRSCNRNRSimNR
[24]600/3001000/6000.450.222.50SCHNACA0021NRSim7
[11]NRNR/3000.42NR3.50SCNREL S809NRSim3–7
[25]NR/1000NR0.41NR0.80SCNACA0018NRSim5–10
[26]NRNR0.39NR1.50BNACA0018NRSim5–10
[10]220/220750/7500.36NR2.80SCNACA0012NRSim1–3
[27]370/2001030/5000.33NR1.40SCNACA0021NRSim2–10
[23]1000/952.41450/10300.190.083.00SCNACA0021NRSim7–9
[28]NRNR0.15NRNRSCNRCF+AlSim3.2–13
[9]200/57.5NR/200NRNR0.30SCNACA0012NRSim3–7
[12]250/80300/3000.34NR2.29SCNREL S818WoodExp7.5–12
[14]1000/5001450/10300.360.680.45SCHNACA0021NRBoth2–3
[29]800/4561000/11000.33NRNRSCHNACA0010NRBoth0.65–10
[13]1000/5001000/7500.32NR2.24SCNREL S818AlBoth3–10
HSHDR200/60200/1000.260.0092.70SCNACA 4412PLABoth3-8
[15]160/46330/1000.20NR4.00SCNACA4418PVC+AlBoth5–20
[30]710/NRNR0.03NR0.60SCNACA0018PVC+WoodBoth4
Table terms: SC = semi-circle; SCH = semi-circle Helical; B = Bach, NR = not reported; Sim = simulation, Exp= experimental; Both = simulation and experimental.
This dual approach enhances the robustness of the findings and addresses key limitations observed in other studies. For instance, while [11] provides insights into aerodynamic behavior through simulations, it lacks validation against real-world scenarios, potentially overestimating performance metrics under idealized conditions. Conversely, ref. [12] presents credible experimental data but does not benefit from simulation tools’ broader parameter exploration and optimization capabilities. The proposed HSHDR bridges this gap, delivering a well-rounded predictive and empirically grounded evaluation.
Moreover, this integration enables the identification of critical performance bottlenecks, such as the low C T observed in the proposed design, which contrasts with the significantly higher of [14]. Unlike single-method studies, the dual approach facilitates targeted improvements by correlating simulation data with experimental feedback, ensuring that refinements are theoretically sound and practically viable.
Figure 10 shows how the HSHDR achieves hybridization by effectively combining the performance characteristics of the SR and DR designs. The power coefficient curve of HSHDR overlaps with the performance regions of both the SR and DR, reaching a moderate peak at λ = 2.7 . This demonstrates that the HSHDR integrates with the capability of the SR, which excels at low λ , with the high efficiency of the DR for higher λ .
Unlike the SR, which peaks early near 1 and decays rapidly, and the DR, which peaks only at 6 and does not contribute significantly at lower elevations, the HSHDR combines both advantages. This wide operating range reflects the true hybridization of the HSHDR, which leverages the strengths of both rotor types for various wind conditions.

5. Conclusions

This study highlights the significance and innovation of the HSHDR design, which combines the high torque generation of the Savonius rotor with the aerodynamic efficiency of the Helical Darrieus rotor. The HSHDR achieves a power coefficient of 0.26 at an optimal tip-speed ratio of 2.7, marking a substantial improvement over stand-alone rotor configurations. This performance is advantageous for urban and rural environments with variable wind conditions. Both experimental and computational analyses validated the design’s effectiveness, emphasizing its capability to enhance energy capture and overall aerodynamic performance. Pressure and velocity contour plots also demonstrated vortex dynamics, showcasing the design’s ability to reduce drag and improve rotational efficiency.
Simulation and experimental analyses were conducted to ensure the robustness and reliability of the results, bridging the gap left by previous studies that relied solely on simulations or physical tests. The HSHDR presents a scalable and cost-effective solution for decentralized renewable energy generation, comprehensively evaluating its performance and adaptability in diverse operating conditions.

Author Contributions

Conceptualization, A.P.-T.; Methodology, A.P.-T., M.M. and I.T.-Z.; Software, J.T.; Validation, J.T. and A.D.-P.; Formal analysis, A.P.-T.; Investigation, A.P.-T. and J.T.; Data curation, I.T.-Z. and A.D.-P.; Writing—original draft, M.M.; Writing—review and editing, I.T.-Z. and A.D.-P.; Visualization, M.M.; Supervision, M.M. and I.T.-Z.; Project administration, M.M. and I.T.-Z. All authors have read and agreed to the published version of the manuscript.

Funding

This research received no external funding.

Data Availability Statement

The data presented in this study can be obtained upon request from the corresponding author. The data are not publicly available due to privacy considerations.

Conflicts of Interest

The authors declare no conflicts of interest.

References

  1. Güney, T.; Üstündağ, E. Wind energy and CO2 emissions: AMG estimations for selected countries. Environ. Sci. Pollut. Res. 2021, 29, 21303–21313. [Google Scholar] [CrossRef] [PubMed]
  2. Barthelmie, R.J.; Pryor, S.C. Climate Change Mitigation Potential of Wind Energy. Climate 2021, 9, 136. [Google Scholar] [CrossRef]
  3. Im, H.; Kim, B. Power Performance Analysis Based on Savonius Wind Turbine Blade Design and Layout Optimization through Rotor Wake Flow Analysis. Energies 2022, 15, 9500. [Google Scholar] [CrossRef]
  4. Mohamed, M.H.; Alqurashi, F.; Thévenin, D. Automatic Blade Shape Optimization of a Three-Bladed Modified Savonius Turbine. Front. Energy Res. 2022, 9, 796860. [Google Scholar] [CrossRef]
  5. Mahesa Prabowoputra, D.; Hadi, S.; Sohn, J.M.; Prabowo, A.R. The effect of multi-stage modification on the performance of Savonius water turbines under the horizontal axis condition. Open Eng. 2020, 10, 793–803. [Google Scholar] [CrossRef]
  6. Saad, A.S.; Elwardany, A.; El-Sharkawy, I.I.; Ookawara, S.; Ahmed, M. Performance evaluation of a novel vertical axis wind turbine using twisted blades in multi-stage Savonius rotors. Energy Convers. Manag. 2021, 235, 114013. [Google Scholar] [CrossRef]
  7. Pérez-Terrazo, A.; Moreno, M.; Trejo-Zúñiga, I.; López, J.A. A Two-Stage Twisted Blade μ-Vertical Axis Wind Turbine: An Enhanced Savonius Rotor Design. Energies 2024, 17, 2835. [Google Scholar] [CrossRef]
  8. Sarma, J.; Jain, S.; Mukherjee, P.; Saha, U.K. Hybrid/Combined Darrieus–Savonius Wind Turbines: Erstwhile Development and Future Prognosis. J. Sol. Energy Eng. 2021, 143, 050801. [Google Scholar] [CrossRef]
  9. Chawla, S.; Chauhan, A.; Bala, S. Parametric study of hybrid Savonius-Darrieus turbine. In Proceedings of the 2015 2nd International Conference on Recent Advances in Engineering & Computational Sciences (RAECS), Chandigarh, India, 21–22 December 2015; pp. 1–5. [Google Scholar] [CrossRef]
  10. Liang, X.; Fu, S.; Ou, B.; Wu, C.; Chao, C.Y.; Pi, K. A computational study of the effects of the radius ratio and attachment angle on the performance of a Darrieus-Savonius combined wind turbine. Renew. Energy 2017, 113, 329–334. [Google Scholar] [CrossRef]
  11. Irawan, E.N.; Sitompul, S.; Yamashita, K.I.; Fujita, G. Computational Fluid Dynamics Analysis on the Improvement of Hybrid Savonius-Darrieus NREL S809 at Various Fluid Flows. In Proceedings of the 2023 4th International Conference on High Voltage Engineering and Power Systems (ICHVEPS), Denpasar, Indonesia, 6–10 August 2023; pp. 389–394. [Google Scholar] [CrossRef]
  12. Bhuyan, S.; Biswas, A. Investigations on self-starting and performance characteristics of simple H and hybrid H-Savonius vertical axis wind rotors. Energy Convers. Manag. 2014, 87, 859–867. [Google Scholar] [CrossRef]
  13. Wilberforce, T.; Olabi, A.; Sayed, E.T.; Alalmi, A.H.; Abdelkareem, M.A. Wind turbine concepts for domestic wind power generation at low wind quality sites. J. Clean. Prod. 2023, 394, 136137. [Google Scholar] [CrossRef]
  14. Eftekhari, H.; Al-Obaidi, A.S.M.; Srirangam, S. Numerical Investigation of Hybrid Savonius-Darrieus Vertical Axis Wind Turbine at Low Wind Speeds. J. Phys. Conf. Ser. 2023, 2523, 012032. [Google Scholar] [CrossRef]
  15. Pallotta, A.; Pietrogiacomi, D.; Romano, G. HYBRI—A combined Savonius-Darrieus wind turbine: Performances and flow fields. Energy 2020, 191, 116433. [Google Scholar] [CrossRef]
  16. Menter, F.R. Two-equation eddy-viscosity turbulence models for engineering applications. AIAA J. 1994, 32, 1598–1605. [Google Scholar] [CrossRef]
  17. Menter, F.R.; Kuntz, M.; Langtry, R. Ten Years of Industrial Experience with the SST Turbulence Model. Turbul. Heat Mass Transf. 2003, 1, 625–632. [Google Scholar]
  18. ANSYS, Inc. ANSYS Fluent User’s Guide, Version 2022; ANSYS, Inc.: Canonsburg, PA, USA, 2022. [Google Scholar]
  19. Song, K.; Wang, W.Q.; Yan, Y. Numerical and experimental analysis of a diffuser-augmented micro-hydro turbine. Ocean Eng. 2019, 171, 590–602. [Google Scholar] [CrossRef]
  20. Le Fouest, S.; Mulleners, K. The dynamic stall dilemma for vertical-axis wind turbines. Renew. Energy 2022, 198, 505–520. [Google Scholar] [CrossRef]
  21. Araya, D.B.; Colonius, T.; Dabiri, J.O. Transition to bluff-body dynamics in the wake of vertical-axis wind turbines. J. Fluid Mech. 2017, 813, 346–381. [Google Scholar] [CrossRef]
  22. Pan, J.; Ferreira, C.; van Zuijlen, A. Performance analysis of an idealized Darrieus–Savonius combined vertical axis wind turbine. Wind Energy 2024, 27, 612–627. [Google Scholar] [CrossRef]
  23. Roshan, A.; Sagharichi, A.; Maghrebi, M.J. Nondimensional Parameters’ Effects on Hybrid Darrieus–Savonius Wind Turbine Performance. J. Energy Resour. Technol. 2019, 142, 011202. [Google Scholar] [CrossRef]
  24. Abdelsalam, A.M.; Kotb, M.; Yousef, K.; Sakr, I. Performance study on a modified hybrid wind turbine with twisted Savonius blades. Energy Convers. Manag. 2021, 241, 114317. [Google Scholar] [CrossRef]
  25. Asadi, M.; Hassanzadeh, R. Effects of internal rotor parameters on the performance of a two bladed Darrieus-two bladed Savonius hybrid wind turbine. Energy Convers. Manag. 2021, 238, 114109. [Google Scholar] [CrossRef]
  26. Asadi, M.; Hassanzadeh, R. On the application of semicircular and Bach-type blades in the internal Savonius rotor of a hybrid wind turbine system. J. Wind Eng. Ind. Aerodyn. 2022, 221, 104903. [Google Scholar] [CrossRef]
  27. Ghafoorian, F.; Mirmotahari, S.R.; Eydizadeh, M.; Mehrpooya, M. A systematic investigation on the hybrid Darrieus-Savonius vertical axis wind turbine aerodynamic performance and self-starting capability improvement by installing a curtain. Next Energy 2025, 6, 100203. [Google Scholar] [CrossRef]
  28. Nuñez-Quispe, J.J.; Nuñez-Quispe, A.A.; Cedamanos-Cuenca, R.O. Performance analysis of a hybrid vertical axis wind turbine through CFD for distributed generation in rural areas of Peru. J. Phys. Conf. Ser. 2020, 1618, 042013. [Google Scholar] [CrossRef]
  29. Budea, S.; Simionescu, S.M. Performances of a Savonius-Darrieus Hybrid Wind Turbine. In Proceedings of the 2023 11th International Conference on ENERGY and ENVIRONMENT (CIEM), Bucharest, Romania, 26–27 October 2023; pp. 1–5. [Google Scholar] [CrossRef]
  30. Kumar, Y.; Roga, S.; Wanmali, N.K. Experimental analysis of hybrid VAWT and the effect of semi-cylindrical attachment to the trailing edge. Energy Sustain. Dev. 2023, 74, 115–126. [Google Scholar] [CrossRef]
Figure 1. Design of the proposed HSHDR in a micro-scale VAWT: (a) side view and (b) longitudinal section in the isometric view.
Fluids 10 00063 g001
Figure 2. Geometry of the proposed HSHDR in a micro-scale VAWT: R S = 12.75 mm, R D = 27.42 mm, B S = 60 mm, and B D = 16.26 mm.
Fluids 10 00063 g002
Figure 3. Computational domain and mesh structure: (a) schematic of the domain, (b) top view of the computational domain, (c) mesh on circular plates, and (d) mesh around the rotor in the ( y , z ).
Fluids 10 00063 g003
Figure 4. Experimental setup for efficiency analysis of the HSHDR. (a) CAD Model. (b) Physical Prototype.
Fluids 10 00063 g004
Figure 5. Measurement profiles (I, II, and III) at different heights (20 mm, 100 mm, and 180 mm) for the aerodynamic and structural analysis.
Fluids 10 00063 g005
Figure 6. Comparison of simulated (CFD) and experimental results for the hybrid Savonius Helical Darrieus rotor: (a) C P as a function of λ , showing peak performance at λ 2.7 ; (b) C T vs. λ , experimental torque fluctuations due to transient aerodynamic effects and wake interactions.
Fluids 10 00063 g006
Figure 7. Pressure contour plots of the HSHDR at different azimuthal angles: (ad) wind velocity V = 3 m/s ( Re = 0.6298 ) at θ = 0 , 90 , 180 , and 270 , and (eh) wind velocity V = 8 m/s ( Re = 0.6298 ) at θ = 0 , 90 , 180 , and 270 . The color-scale bar indicates the pressure contrast.
Fluids 10 00063 g007
Figure 8. Velocity contour plots of the HSHDR at different azimuthal angles: (ad) Wind velocity V = 3 m/s ( Re = 0.6298 ) at θ = 0 , 90 , 180 , and 270 , and (eh) Wind velocity V = 8 m/s ( Re = 0.6298 ) at θ = 0 , 90 , 180 , and 270 . The color-scale bar indicates the flow velocity contrast.
Fluids 10 00063 g008
Figure 9. Streamline contour plots of the HSHDR at different azimuthal angles: (ad) wind velocity V = 3 m/s ( Re = 0.6298 ) at θ = 0 , 90 , 180 , and 270 , and (eh) wind velocity V = 8 m/s ( Re = 0.6298 ) at θ = 0 , 90 , 180 , and 270 . The color-scale bar indicates the flow velocity contrast.
Fluids 10 00063 g009
Figure 10. Overlay of C p curves for SR, DR, and HSHDR configurations, demonstrating hybridization benefits.
Fluids 10 00063 g010
Table 1. Mesh resolution sensitivity for C T .
Mesh DensityCase 1Case 2Case 3Case 4Case 5Case 6
Total number of cells2,517,3792,613,6562,744,1952,840,4723,209,9113,306,188
Number of cells in rotating zone1,796,0741,861,4541,796,0741,861,4541,796,0741,861,454
Number of cells in stationary zone419,733419,733646,549646,5491,112,2651,112,265
C T 0.7880.7760.7880.7760.7850.777
Disclaimer/Publisher’s Note: The statements, opinions and data contained in all publications are solely those of the individual author(s) and contributor(s) and not of MDPI and/or the editor(s). MDPI and/or the editor(s) disclaim responsibility for any injury to people or property resulting from any ideas, methods, instructions or products referred to in the content.

