Abstract
Inside a closed, thin-walled hollow cylinder, there is a solid state of phase change material (NePCM) that has been nano-enhanced. This NePCM is heated at its bottom, with nanoparticles (Al2O3) inserted and homogenized within the PCM (sodium acetate trihydrate, C2H3O2Na) to create the NePCM. The hollow cylinder is thermally insulated from the outside ambient temperature, while the heat supplied is sufficient to cause a phase change. Once the entire NePCM has converted from a solid to a liquid due to heating, it is then cooled, and the thermal insulation is removed. The cylindrical liquefied NePCM bar is cooled in this manner. Thermal entropy, entransy dissipation rate, and bar efficiency during the heating and cooling of the NePCM bar were analyzed by changing variables. The volume fraction ratio of nanoparticles, inlet heat flux, and liquefied bar height were the variables considered. The results indicate a significant impact on the NePCM bar during liquefaction and convective cooling when the values of these variables are altered. For instance, with an increase in the volume fraction ratio from 3% to 9%, at a constant heat flux of 104 Wm−2 and a liquefied bar height of 0.02 m, the NePCM bar efficiency decreases to 99%. The thermal entropy from heat conduction through the liquefied NePCM bar is significantly lower compared to the thermal entropy from convective air cooling on its surface. The thermal entropy of the liquefied NePCM bar increases on average by 110% without any cooling. With a volume fraction ratio of 6%, there is an 80% increase in heat flux as the bar height increases to 0.02 m.
1. Introduction
Phase change materials (PCMs) are widely used in various fields of thermal engineering as a simple way of storing thermal energy including thermal storage of solar energy and waste heat. When the PCM is heated, it changes from a solid to a liquid phase, absorbing and storing heat. During the cooling process, the PCM changes from a liquid to a solid phase, releasing heat. The significance of the PCM is evident in its ability to store energy with a minimal temperature difference between heat absorption and release. In the past, researchers have developed various types of PCMs and conducted numerous tests to enhance their performance. PCMs have shown great potential in efficiently accumulating waste and solar heat. Various groups of authors have published numerous research papers and studies on this topic. The use of practical latent heat energy storage systems based on phase change materials is hindered by the low thermal conductivity of these materials, as investigated by Dhaidan et al. [1]. The issue of long energy release time in PCM energy storage systems was studied by Sarani et al. [2]. Previous review articles discussed the impact of one or several thermal conductivity enhancers on PCM melting, as reported by Al-Salami et al. [3]. In reference to Shahsavar et al. [4], the thermal generation characteristics of phase change materials (PCMs) in a latent heat storage unit for lithium-ion batteries were studied. Improving the thermal performance of energy storage by utilizing sodium acetate trihydrate, was studied by Zhang et al. [5].
A Nano-enhanced phase change material (NePCM) was developed to enhance the PCM to maximize its thermal characteristics. One significant disadvantage of the PCM is its low thermal conductivity, which limits the rate of heat transfer through the material. The addition of nanoparticles increases conductivity and specific heat capacity, thus increasing heat storage capacity and improving heating and cooling performance compared to basic PCMs. Different nanoparticles are added to the base fluid to improve the physical properties and thermal performance of various process devices. The use of nanoparticles in various applications is determined by their physical properties, including their shape, dimensions, and concentration within the PCM. The volume fractions of nanoparticles vary, and the resulting fluid after dispersion is referred to as a nanofluid. References [6,7,8,9,10] discuss a novel combined passive cooling solution for building-integrated concentrated photovoltaics incorporating micro-bars, phase change materials, and the thermo-physical properties of nano-enhanced materials. This was analyzed by several researchers, such as Sharma et al. [6], Colla et al. [7], Leong et al. [8], and He et al. [9]. In Dhaidan et al.’s paper [10], the melting of n-octadecane with CuO nanoparticle suspensions in a square enclosure was studied both experimentally and numerically. The melting process of a nano-phase change material in a square enclosure filled with a porous medium was investigated numerically and analytically, as reported by Al-Jethelah et al. [11]. The focus of the heat transfer enhancement techniques includes nanoparticles, porous metal foams, and extended surfaces for the PCM-based thermal energy storage system of a flat plate solar collector, as analyzed by Keshteli et al. [12]. The impact of including CuO nanoparticles on the thermal and flow structure under different volume fractions is investigated by Sharma et al. [13].
Thermal entropy and entransy are physical quantities commonly used in technical applications to estimate thermal irreversibilities. During convective heat transfer, thermal irreversibilities occur alongside hydraulic irreversibilities caused by frictional and local losses of hydraulic energy. Thermal and hydraulic irreversibilities are often explained using thermal and hydraulic entropy. In cases where hydraulic losses are minimal, only thermal irreversibilities are considered. Many researchers have explored heat transfer and entropy generation within solid bodies of varying shapes, dimensions, and materials. For instance, Zullo [14] analyzed the entropy generated inside a solid body due to conduction, with a focus on thermal conductivity. In reference [15], Din et al. studied internal heat generation and transfer within a bar, while Tian and Wang [16] investigated entropy generation and applied the second law of thermodynamics to establish mathematical inequalities related to heat conduction in adiabatic cylinders. The relationship between thermal irreversibilities of low-conductivity materials in concentric hollow cylinders has been established and reported by Alic [17]. Some researchers have focused on analyzing different irreversibilities of one or more cylindrical bodies under various conditions of stationary and transient heat exchange with the environment. The study reported by Aziz and Khan [18] investigated the minimum entropy generation for steady conduction in a flat wall, a hollow cylinder, and a hollow sphere. The transient entropy of hollow cylinders and entropy flow analysis of the thermal transmission process was reported by Alic [19] and Chen et al. [20], respectively. Thermally generated entropy resulting from different types of heat transfer and the minimization of thermal irreversibility is commonly utilized in various thermal processes. Thermal irreversibilities occur in various processes due to heat exchange, accumulation of heat, material phase change, and other factors. Entropy generation in a dissipative nanofluid flow analyzed by Lu et al. [21]. In reference to Alic [22], the analysis of nanofluid irreversibility within heating elements was investigated. The intensity of thermal irreversibilities varies and in certain processes and phenomena they can be several times higher. The thermal entropy resulting from phase changes, such as the transition of a solid material into a liquid phase, has been analyzed by several authors. Guelpa et al. [23] examined the design enhancements of a shell-and-tube latent heat thermal energy storage unit using entropy generation. The entropy generation of water combined with nano-sized particles containing encapsulated phase change material in a square enclosure was numerically analyzed and reported by Zadeh et al. [24]. In addition to thermal entropy, the analysis of various process systems is often performed using entransy or entransy dissipation rate. Many studies and researchers have focused on introducing entransy and its application to describe and optimize various technical processes. Entransy and entransy dissipation rates represent a new physical quantity, indicating the potential of heat transfer and the loss of the ability of heat transfer, respectively. The entransy dissipation principle of heat transport potential capacity enhances the heat conduction efficiency in the heat conduction optimization reported by Guo et al. [25]. Cheng et al. [26] analyzed heat exchangers based on the concepts of entransy dissipation, entropy generation, and entransy dissipation. Furthermore, several researchers have developed optimization models and methods to minimize the entransy dissipation rate of cylindrical, hollow bodies.
1.1. The Methodology
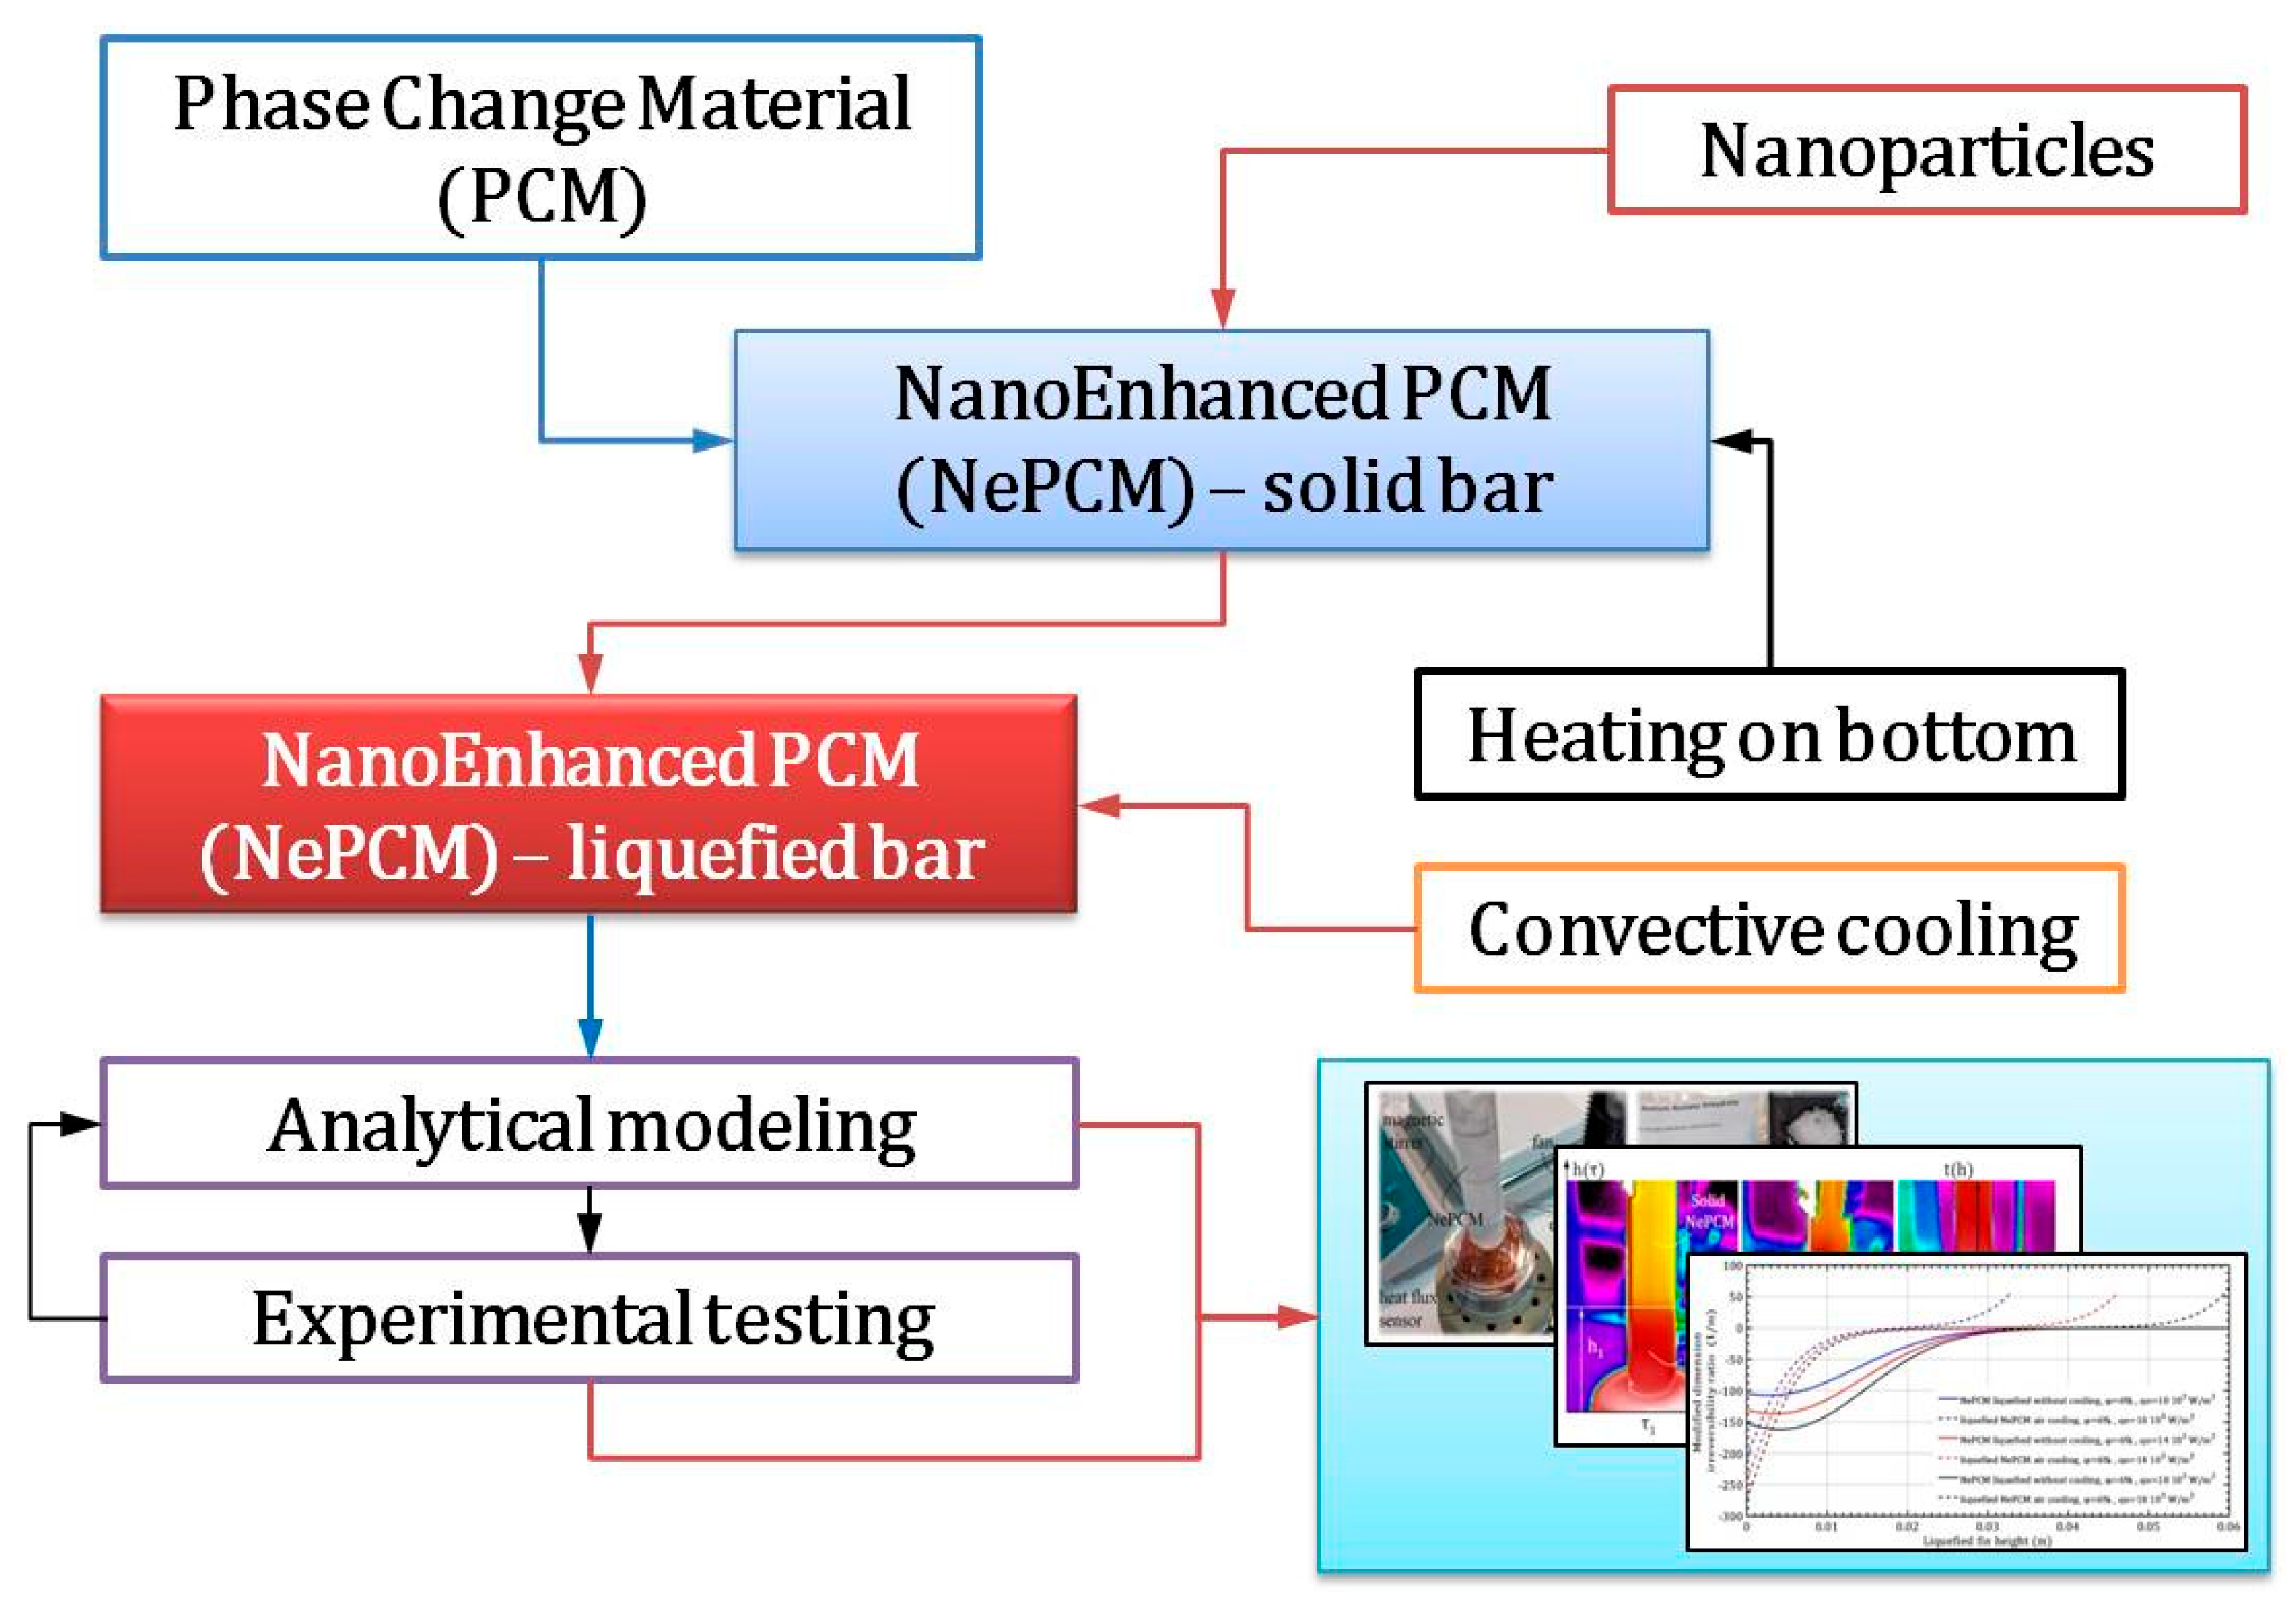
The methodology established in this work is based on previous research and analysis. The concept is to create a heated liquefied bar at the bottom and cool it by the forced flow of ambient air. Inside a closed, hollow, thin-walled cylinder is a solid-state phase change material (NePCM) that has been nano-enhanced. This NePCM is heated at the bottom. Nanoparticles (Al2O3) are embedded and homogenized within the PCM (sodium acetate trihydrate, C2H3O2Na) to create the NePCM. The analysis is conducted in two steps; the first involves the phase transformation of the solid NePCM bar into the liquid phase. First, the hollow cylinder is thermally insulated from the external environment, while the heat supplied to its bottom is enough to cause a phase change in the NePCM. Once the entire volume of the NePCM has changed from solid to liquid due to heating, the thermal insulation is removed and the outer wall of the NePCM bar is cooled by convection. The second step involves forced cooling through cross-flow air over the outer surface of the liquefied bar. Using the established testing methodology, the thermal irreversibility of the bar is examined during the phase change and cooling of the liquefied NePCM bar. The variables considered were the ratio of nanoparticle volume fraction, input heat flux, and height of the liquefied bar. The methodology of the analysis outlined in the paper is clearly demonstrated in the flow chart in Figure 1.
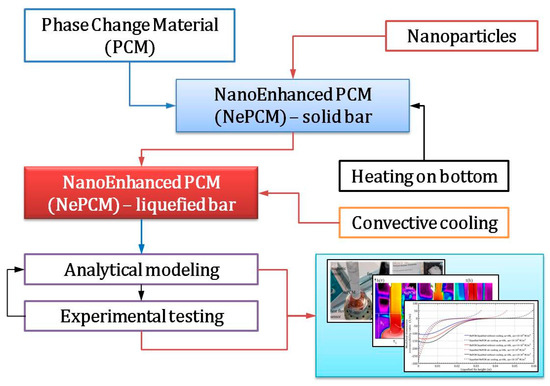
Figure 1.
Methodological approach to the analysis and testing of nano-enhanced phase change material liquefaction.
1.2. Novelty and Objective
The novelty and objective of this study are evident in the following aspects:
- -
- A well-defined methodology for analytically modeling transient thermal irreversibilities in a NePCM bar during combined conductive-convective heat transfer.
- -
- The ability to optimize process and geometric parameters of the NePCM bar by maximizing the modified irreversibility ratio.
- -
- The novelty covered by the established methodology is based on a combined analytical model and experimental testing that includes:
- -
- The transient temperature field of a NePCM bar during its liquefaction by an external heat source.
- -
- The transient temperature field of the liquefied NePCM bar during forced cooling of its outer surface.
- -
- Thermal transient irreversibilities are generated in both cases, which enable the establishment of an efficient optimization model based on minimizing them.
2. Methodology
2.1. Temperature Distribution of a NePCM Cylindrical Bar
In the preparation process, Al2O3 nanoparticles were evenly distributed within the base phase change material (PCM) sodium acetate trihydrate (C2H3O2Na) in various volume fraction ratios φ, creating a nano-enhanced phase change material (NePCM). At the start of the heating process (see Figure 2a), the NePCM is solid inside a vertically enclosed thin-walled cylindrical pipe. The inclusion of nanoparticles in the PCM changes its physical properties. As mentioned earlier, the NePCM is enclosed within a thin-walled pipe that is sealed at the ends, bottom, and top. For further analysis, the NePCM inside a thin-walled pipe with sealed ends is treated as a cylindrical thermal bar. The bottom of this cylindrical bar is heated by the input heat flux qo, which is distributed within the solid NePCM, as depicted in Figure 2a. Throughout the heating process, the outer surface of the bar is insulated from the surroundings, ensuring that all the input heat is utilized for the NePCM phase change from solid to liquid. Once the heating process is finished, the NePCM transitions into the liquid phase up to a height s, which is the height of the bar. As the NePCM is heated from the bottom to height s, a temperature distribution is established. This temperature field is considered one-dimensional and unsteady.
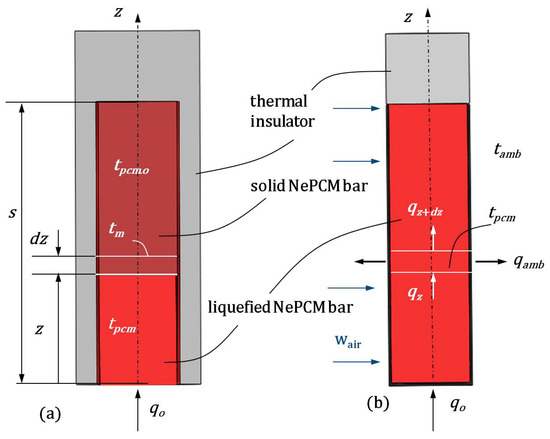
Figure 2.
(a) Heating causes the bottom of the NePCM to transition from a solid to a liquid phase. (b) Cool the liquefied cylindrical bar using cross-flow air.
In order to conduct analytical modeling, the following assumptions were established:
- -
- The temperature field of the cylindrical bar is one-dimensional and depends only on the z coordinate.
- -
- Incoming heat flux at the bottom of the bar is uniform across its circular cross-section.
- -
- The physical properties of NePCM are consistent throughout its volume.
- -
- The volume concentration of nanoparticles does not alter the liquefaction temperature of the NePCM bar.
In this scenario, the differential equation for the temperature distribution of the liquefied NePCM bar with the dominant temperature gradient occurring in the axial direction (z), as shown in Figure 2a, can be expressed as:
where apcm is the thermal diffusivity, τ is time, and r, β, and z are cylindrical coordinates. Equation (1) is valid when there is no internal heat source within the liquefied cylindrical bar and when the temperature changes in the remaining two cylindrical coordinates, r and β, are disregarded.
Solving Equation (1) involves introducing the dimensionless parameter
and after combining Equations (1) and (2), it follows
and the solution can be found in the form of
where the constants C1 and C2 are determined based on the specified boundary conditions, as shown in Figure 2a,
and have a form
By combining the previous equations, we obtain Equation (7), which represents the temperature of the liquefied bar over time and along its z-axis.
The thermal diffusivity of a phase change material is determined by its density, thermal conductivity and specific heat capacity. Therefore, the density, specific heat capacity, specific enthalpy, and thermal conductivity coefficient can be determined using Equations (8)–(10) as reported by Brinkman [27] and Pak and Cho [28].
For determining the effective thermal conductivity of the homogeneous NePCM, the Maxwell Garnett equation [29] was used.
Yu and Choi [30], extended the Maxwell correlation Equation (11) to include nanoparticle size in order to calculate the thermal conductivity of nanofluids.
where h is the radius of the microlayer around the spherical nanoparticle, and dp is the nanoparticle diameter. Hamilton and Crosser [31] propose a thermal conductivity model that considers the shape of nanoparticles. They introduce a shape factor (n = 3/ω) into the expression, where ω represents the sphericity of the nanoparticles. Additionally, Warrier and Teja [32] analyzed the impact of the size of dispersed metal nanoparticles within the base fluid on the thermal conductivity of nanofluids. In the previous equations, ρpcm.o, cpcm.o, ipcm.o, and λpcm.o represent the density, specific heat capacity, specific enthalpy diffusion, and thermal conductivity coefficient of the basic PCM, while φ represents the volume fraction ratio of nanoparticles. After adding nanoparticles, the specified physical properties for the nano-enhanced phase change material are marked with ρpcm, cpcm, ipcm, and λpcm. The reason for not taking into account the size of the particle is based on the use of Al2O3 nanoparticle sizes ranging from 10 nm to 15 nm in the experimental method of nano-enhanced phase change material (NePCM), and the comparative results of mathematical modeling and results obtained by experimental testing. In most research and analysis, the influence of nanoparticle size is often overlooked. Instead, the focus is placed on the percentage of nanoparticles present in PCM. However, the size and shape of nanoparticles have a significant impact on the effective thermal conductivity value.
2.2. Temperature Distribution During the Cooling Process of a Cylindrical Bar Using Liquefied NePCM
In Figure 2b, the NePCM liquid phase is established up to a height of s. Once this height is reached, the thermal insulating cylindrical material is removed to allow for forced cooling of the outer surface of the liquefied bar. Heat continues to enter the bottom of the liquefied bar at a constant flux qo. It is assumed that heat is transferred through the bar via conduction in the direction of the z-axis. Additionally, the cooling of the outer surface of the bar is assumed to be achieved solely through forced convection. This forced convection is accomplished by the air cross-flow at a temperature of tair. Under these conditions, the heat balance of the part of the liquefied NePCM bar at a distance z from its bottom is
where Af represents the surface area of the bottom of the bar, and Pf is the bar’s perimeter.
It is assumed that on each elemental part of the bar, with height dz, the change in temperature is insignificant and equal to a constant value tpcm.co. Rearranging equation (13) and introducing a shift gives:
where the general solution of Equation (14) can be represented as Equation (15), where C3 and C4 are differential constants. By solving Equation (15) we can determine the temperature distribution inside the liquefied bar, as shown in Equation (16).
The height of the liquefied bar s is determined by the heat balance at the melting interface
from where is it obtained
where ρpcm is the density of the liquefied NePCM bar, ipcm is the specific latent heat of the NePCM fusion previously determined by Equation (10), and qo is the input heat flux at the liquefied interface.
2.3. The Thermal Entropy of the Liquefied NePCM Bar Due to Heat Conduction
The thermal entropy involves heat conduction inside the liquefied NePCM bar in the first case, while in the second case, it involves convective cooling of the bar. The analysis conducted considers stationary conditions, where the NePCM material has changed phase up to height s and conduction has been established from the bottom to the top, as shown in Figure 2a. Above height s there is a thermal insulator that only allows heat exchange from the outer surface of the cylindrical shell. Therefore, the change in NePCM thermal entropy due to conductive heat transfer through the liquefied NePCM bar is represented by Equation (19),
where Spcm.cond = dSpcm.cond/dz, and apcm is the thermal diffusivity. The temperature gradient of the liquefied bar dTpcm/dz is obtained according to Equation (7). By liquefying the NePCM bar, the thermal insulation around the bar is removed, allowing ambient air to flow across its outer surface. Simultaneously, a constant heat flux qo enters the bottom of the liquefied bar. Under these conditions, there is internal heat conduction through the liquefied bar and heat exchange between its outer surface and the ambient air, as shown in Figure 2b. Due to these conditions, thermal irreversibilities are generated. The expression for the thermal entropy of the NePCM liquefied bar during cooling can be written in the following form:
where Spcm.conv = dSpcm.conv/dz, and the temperature gradient of the liquefied bar dTpcm.co/dz is found according to Equation (16).
2.4. Entransy Dissipation Rate
Entransy as a relatively new physical quantity is used to optimize various thermal processes and phenomena. It primarily measures the potential for heat transfer. Entransy dissipation represents a loss in the ability of heat transfer and indicates the thermal irreversibility of any process. The rate of entransy dissipation due to heat conduction inside the liquefied NePCM bar is determined by Equation (21).
With the removal of thermal insulation in Figure 2b, the liquefied NePCM bar is cooled by convection. In this case, the entransy dissipation rate follows the equation shown below.
2.5. Modified Dimension Irreversibility Ratio
The ratio of the entransy dissipation rate to the thermal entropy represents a new dimension of irreversibility ratio, as reported by Alic [33]. This dimension of irreversibility ratio (ψ) is a function of two variables: entransy flow dissipation and thermal entropy, denoted as ψ(Epcm, Spcm). This ratio signifies the ratio of the differential change in entransy dissipation rate to the differential change in thermal entropy, as shown in Equation (23).
Since the entransy dissipation values are much higher than the thermal entropy values, the dimension irreversibility ratio (ψ) obtains a large value. In order to maximize this irreversibility dimension, the thermal entropy was minimized, while the entransy dissipation ratio was maximized. Due to the significant difference in the values of Epcm and Spcm, their similar influence on the obtained ψmax would not be considered. Therefore, the modified irreversibility dimension ratio was introduced as the relationship dψ/ψ = f (dEpcm/dz, dSpcm/dz), which is represented by Equations (23) and (24) for both analyzed cases.
The ratio of thermal entropy to entransy dissipation has been reduced to a comparable order of magnitude. This decrease allows for the precise maximization of (dψ/dz)max. By maximizing the modified irreversibility dimension ratio, we can establish a foundation for optimizing the processes discussed in this paper and in similar studies.
2.6. Experimental Testing
The temperature distribution inside a cylindrical vessel filled with nano-enhanced phase change material (NePCM) was studied using the measurement set up shown in Figure 3. The NePCM was produced through a two-step method that involved mixing Al2O3 nanoparticles with liquefied base PCM (sodium acetate trihydrate, C2H3O2Na). Sodium acetate trihydrate is a common salt hydrate phase change material with a melting temperature of 58.0 °C and a latent heat of 264.0 kJkg−1. The Al2O3 powder was mixed into the liquefied PCM using a magnetic stirrer. Precise mass measurements of sodium acetate trihydrate and gamma phase nano—alumina powder were conducted using the precision digital scales Sterne ST-DT-50-001-8K (Stern Pinball, Inc., Elk Grove Village, IL, USA). In the conducted analysis, gamma phase-nano alumina powder with a purity of 99.9% was used. This powder was formed at a temperature between 500 °C and 700 °C, and the Al2O3 nanoparticle sizes ranged from 10 nm to 15 nm. The powder has a uniform particle size distribution, high purity, high specific surface area, high resistance to high temperatures, and high activity.
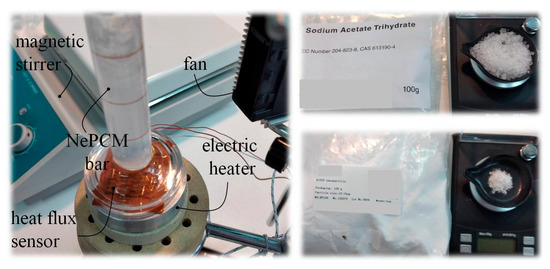
Figure 3.
Preparation and heating of NePCM inside a vertical cylindrical vessel—experimental testing.
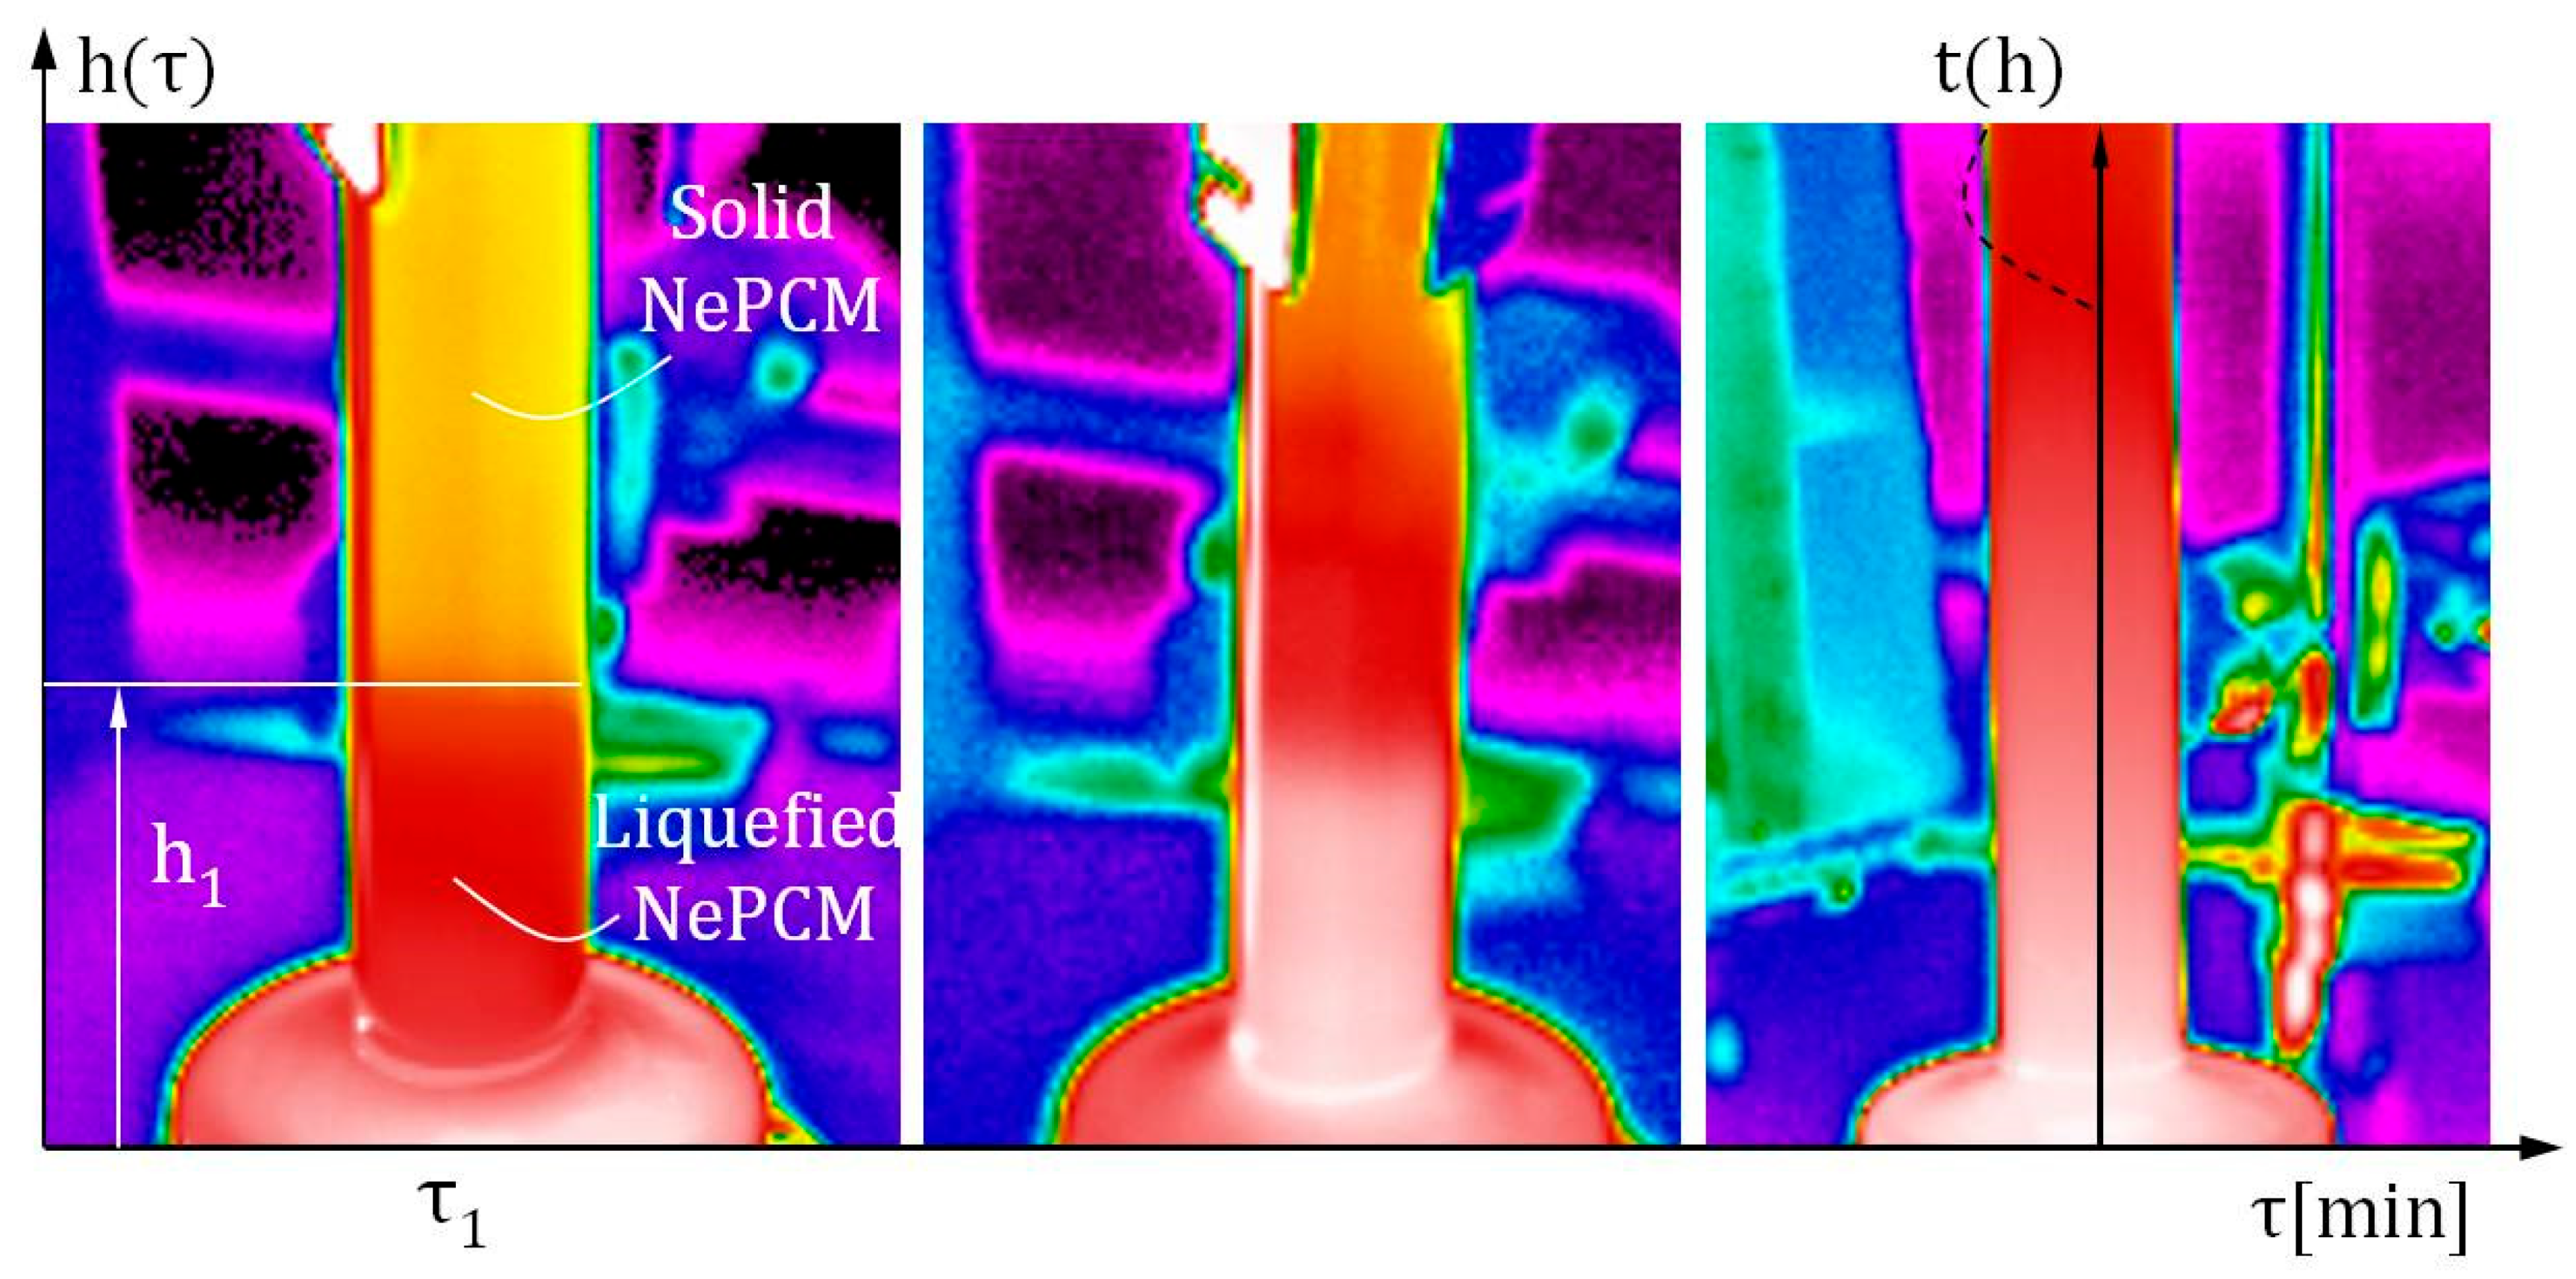
While this method is reliable and widely applicable, its main disadvantage is nanoparticle agglomeration. As a result, the volume fraction ratio is limited to small values. The volume fraction ratio, denoted as φ, is 0.3%. The input heat flux at the bottom of the cylindrical vessel was varied between 8500 Wm−2 and 1.2·104 Wm−2. Air flow around the outer surface of the cylindrical vessel is ensured by an air axial fan with a constant volumetric flow rate of 0.004 m3s−1. The established air flow is directed perpendicular to the outer surface of the hollow cylinder, along its entire height. A hot wire anemometer specifically the HWA2005DL (General Tools & Instruments, New York, NY, USA) was used to measure air flow volumetric flow, with an air velocity accuracy of ±3% of the reading and a range of 0.2 ms−1 to 20 ms−1. The air flow rate is measured directly in front of the outer surface of the hollow cylinder. The height of the hollow cylinder is 70 mm, with an inner diameter of 10 mm. The hollow cylinder wall is made of borosilicate glass and has a thickness of 1 mm. The measurement of the input heat flux at the bottom of the hollow cylinder in Figure 3 was conducted using a thin film heat flux sensor model HFS-3 Omega (Omega Engineering Inc., Norwalk, CT, USA). Between this sensor and the bottom of the hollow cylinder, a layer of conductive thermal paste is applied to prevent thermal contact resistance. The maximum recommended heat flux for the HFS-3 Omega is 9 × 10⁴ Wm−2. Thermograms were generated and analyzed using a Fluke Ti32 infrared thermal imaging camera and SmartView 2.3.2 software. The temperature profile of the outer surface of the hollow cylinder is determined by analyzing thermograms and extracting lines t(h), as shown in Figure 1. After conducting multiple measurements and analyzing the thermograms, the average temperature of the outer wall of the cylinder assembly is used as the reference value. The temperature distributions of the outer surface of the hollow cylinder were obtained during the described measurement procedure.
During the thermal imaging analysis, Figure 4 shows that the Fluke Ti32 camera (Fluke Corporation, Everett, WA, USA) used has a temperature measurement accuracy of ±2 °C or 2%. To reduce the influence of reflection on the generated thermogram, the outer surface of the glass hollow cylinder was painted with matte paint. The emissivity coefficient of the repainted glass surface was determined to be 0.85. During thermographic imaging, any potential objects that could emit thermal radiation towards the outer surface of the hollow cylinder should be removed.

Figure 4.
Infrared thermal imaging analysis was used to examine the heating and phase change of NePCM on the outer surface within a cylindrical vessel.
3. Results and Discussion
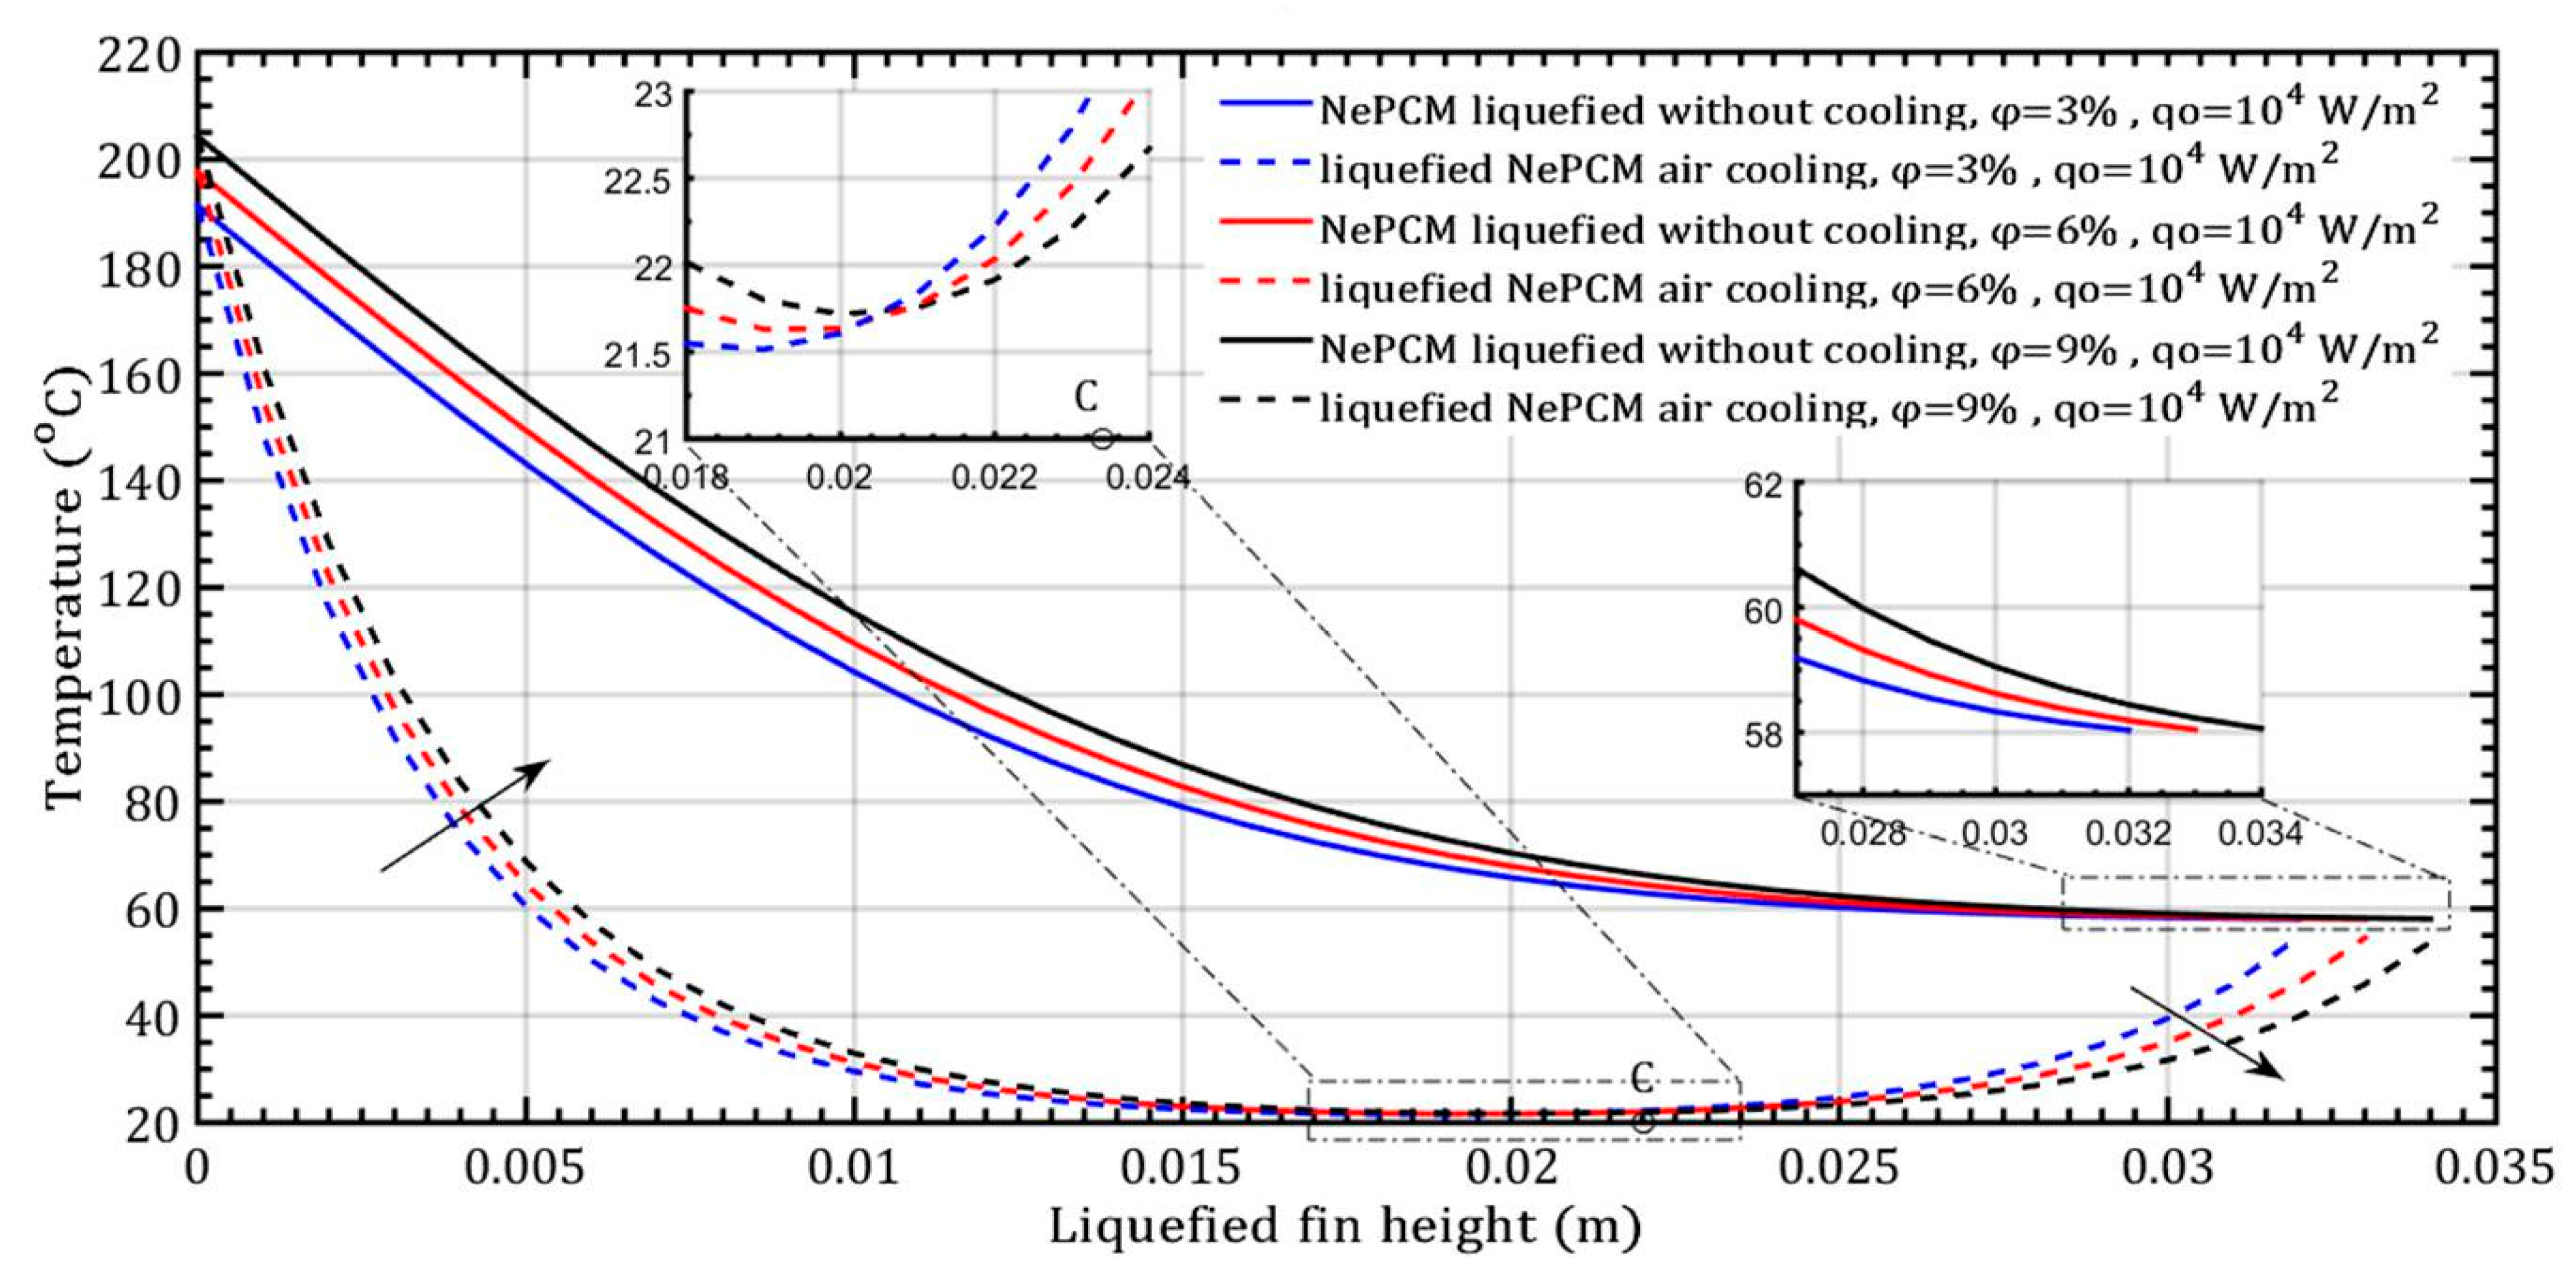
The transition from the solid to liquid phase of the NePCM bar occurs due to a constant input heat flux of 104 Wm−2 at the bottom. In the conducted analysis, the volume fraction ratio varies by 3%, 6%, and 9%, as shown in Figure 5. As the volume fraction ratio increases, the height of the liquefied bar also increases by 32 mm, 33 mm, and 34 mm, respectively. Figure 5, the diagram, shows the temperature profile of a bar with a diameter of 8 mm cooling from the outside by ambient air velocity of 4 ms−1. The dashed lines indicate the liquefied state of the bar. The rapid temperature drop of NePCM along the height of the bar is due to the conductive resistance to heat transfer. A higher volume fraction ratio increases the conductive heat transfer coefficient of NePCM and decreases the conductive resistance. The highest volume fraction 9% Al2O3, in both examined cases, ensures the smallest temperature gradient along the height of the NePCM bar. Due to convective cooling, heat removal reduces the heating of the NePCM bar with height, causing a faster decrease in its temperature with height, as shown by dashed lines.
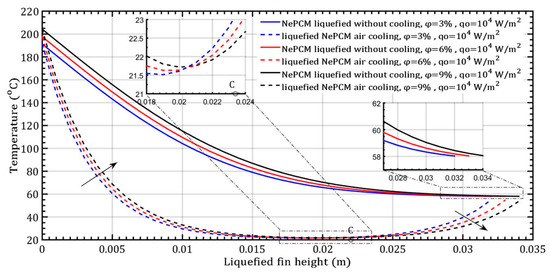
Figure 5.
The temperature distribution of the liquefied NePCM bar varies depending on the volume fraction ratio of Al2O3 nanoparticles.
During the cooling process (indicated by dashed lines), two intervals can be observed. The first interval extends to point C, where the NePCM is liquefied to a height of 21 mm. The second interval extends from point C to the maximum height of the liquefied bar, which is 34 mm. The heating time for all variations of the volume fraction ratio of nanoparticles is limited to 500 s in this analysis. The ambient air temperature was maintained at a constant 20 °C. The physical properties of both the basic PCM and nanoparticles, as well as characteristic control parameters, are detailed in Table 1 and Table 2.

Table 1.
Physical properties of nanoparticles and the base phase change material (PCM).
Table 2.
Characteristic control parameters.
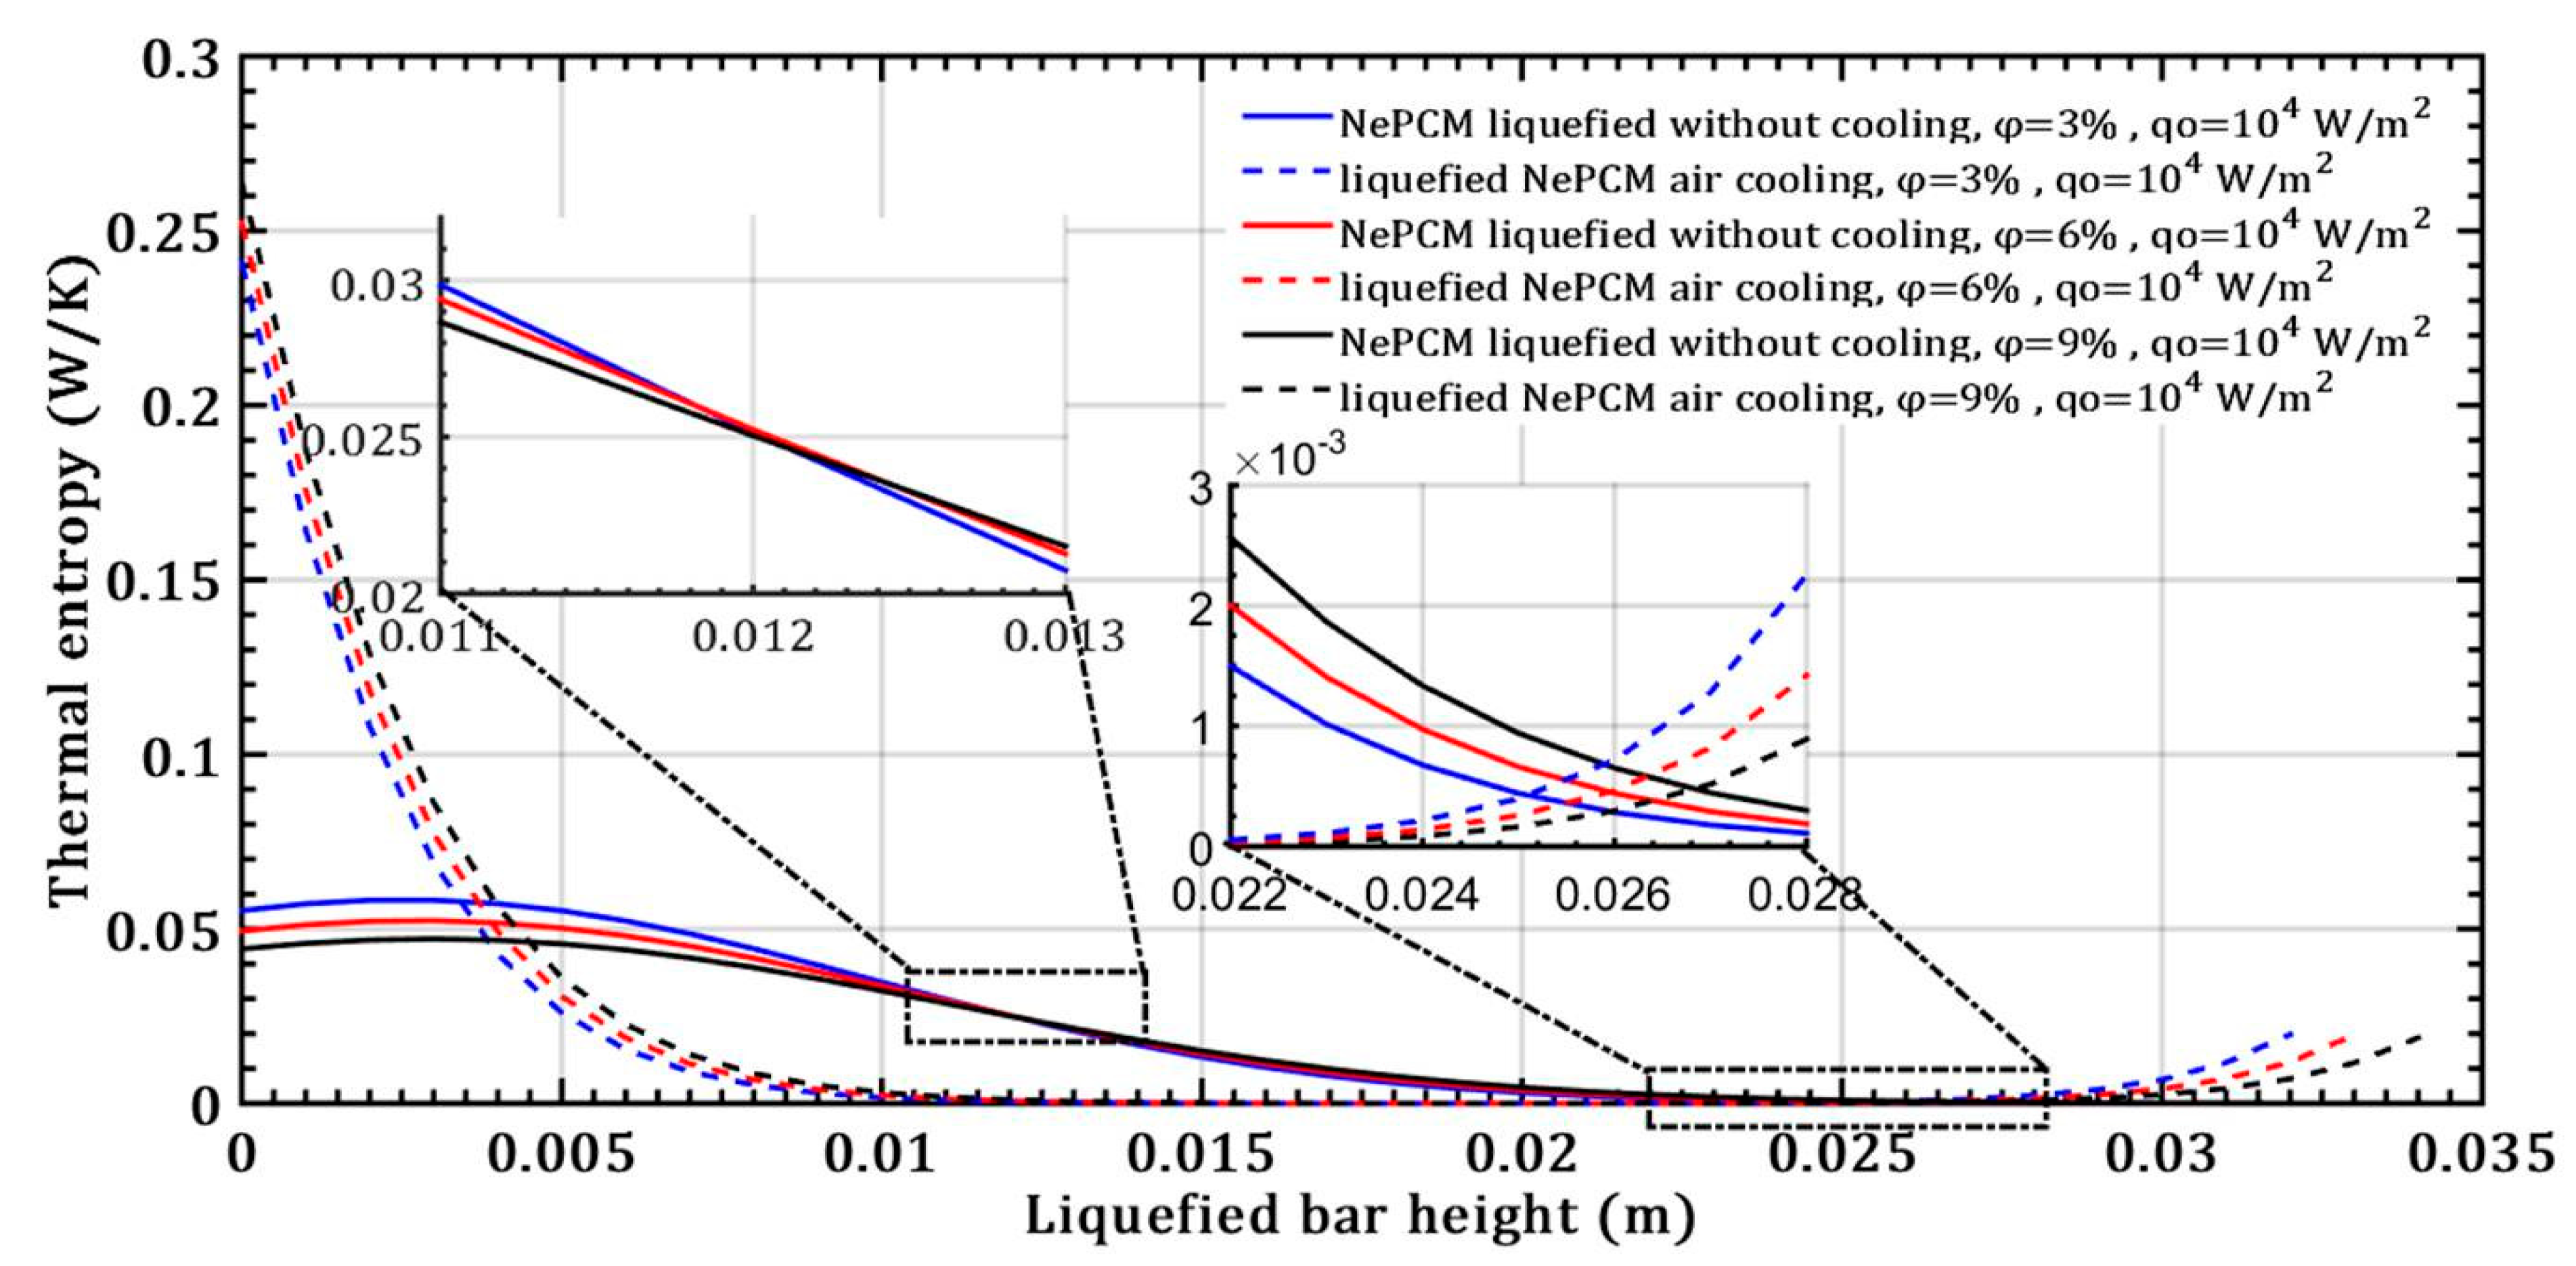
The melting temperature of the base PCM material is 58 °C (sodium acetate trihydrate, C2H3O2Na). In this analysis, it is assumed that this value remains constant even with the addition of Al2O3 nanoparticles. Figure 6 illustrates the entropy generated as a result of thermal irreversibility in the NePCM bar, considering changes in volume fraction ratio and a constant input heat flux at the bottom of the bar. Due to conductive heat transfer through the liquefied NePCM bar thermal entropy obtains a significantly lower value, up to the first 4 mm of its height. The thermal entropy decreases rapidly due to the convective cooling of the liquefied NePCM bar, dropping rapidly from a value of about 0.25 Wm−1K−1. During convective cooling, the NePCM bar with a higher content of nanoparticles has a slightly higher value of thermal entropy, as it allows for more intense heat exchange with the environment. The nanoparticles of Al2O3 enhance the thermal conductivity of the PCM, facilitating the conductive transfer of heat through the bar and from the bar to the ambient environment.
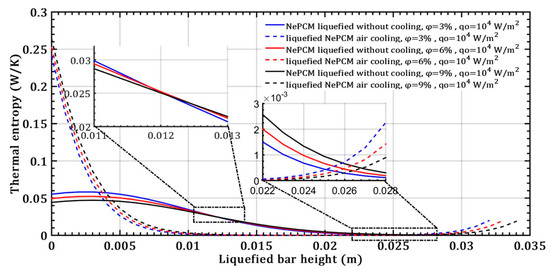
Figure 6.
The thermal entropy of a liquefied NePCM bar was studied by varying the volume fraction ratio of Al2O3 nanoparticles.
The higher values of thermal entropy up to a height of 0.004 m in the NePCM bar during convective cooling are due to the presence of a higher temperature gradient. In point A, as shown in Figure 7, the NePCM bar efficiency value is at a minimum of 0.01 for all three cases of changing the volume fraction ratio. Point A is also where the bar efficiency of all three analyzed cases of liquefied bar cooling intersect. As the bar height increases from 20 mm to 35 mm, the bar efficiency gradually increases. The lowest rate of decrease in NePCM bar efficiency occurs at the maximum Al2O3 nanoparticle volume concentration of 9%. The influence of the volume concentration of nanoparticles on NePCM efficiency is not significant because the temperature of the bar is more significantly affected by the intensity of convective heat exchange from its outer surface to the ambient.
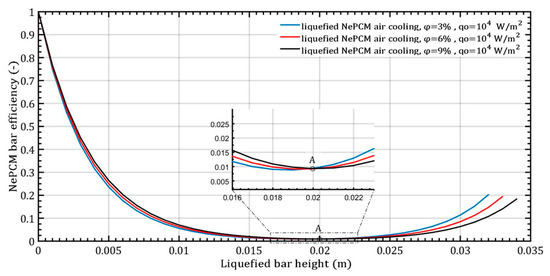
Figure 7.
The efficiency of NePCM liquefied bars varies depending on the volume fraction ratio of Al2O3 nanoparticles.
The maximum efficiency of the NePCM bar is achieved due to the significant temperature difference between the bar and the ambient surroundings. The temperature is highest at the bottom of the NePCM bar and gradually decreases as you move away from the bottom, reaching a minimum value at a height of 0.02 m where the temperature matches the ambient temperature of 20 °C. Because the bar is subject to convective cooling, the efficiency of heat exchange is influenced by the temperature disparity between its outer surface and the ambient surroundings. Therefore, greater contrast in these temperatures results in higher efficiency values for the NePCM liquefied bar. The entransy dissipation rate of the liquefied bar is illustrated in Figure 8, showing the variation in the volume fraction ratio of Al2O3 nanoparticles with a constant input heat flux at the bottom of the bar. In the liquefied NePCM bar, the entransy dissipation value gradually decreases from 1.1 × 10⁴ Wm−2K to lower values. Increasing the volume fraction of Al2O3 nanoparticles leads to reduced entransy dissipation, particularly for a bar height of 15 mm (Point A). However, for a bar height greater than 15 mm, the impact of the volume fraction ratio on entransy dissipation diminishes. In the scenario of a liquefied bar that cools rapidly, the entransy dissipation gradually decreases to zero, reaching this point at a bar height of 20 mm (Point B). Beyond a bar height of 20 mm, the entransy dissipation rate shifts signs and becomes negative for all three analyzed cases. In a physical sense, the inflection points A and B differ in the total value of the entransy dissipation rate. From the aspect of differential geometry, inflection points A and B are points on the curve where the curvature changes its sign.
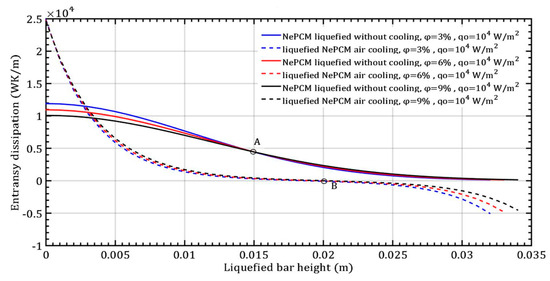
Figure 8.
Entransy dissipation of a liquefied NePCM bar with varying volume fraction ratios of Al2O3 nanoparticles.
The entransy dissipation function changes shape from convex to concave, or vice versa. The inflection point B has a value of 0 Wm3K−1 because it is a NePCM bar at that point where there is no change in temperature per the height of the bar. Without convective cooling of the NePCM bar in the analyzed interval of 500 s, its temperature remains constant after a height of 0.03 m. Therefore, at point A, the entransy dissipation is 0.45 × 10⁴ Wm3K−1.
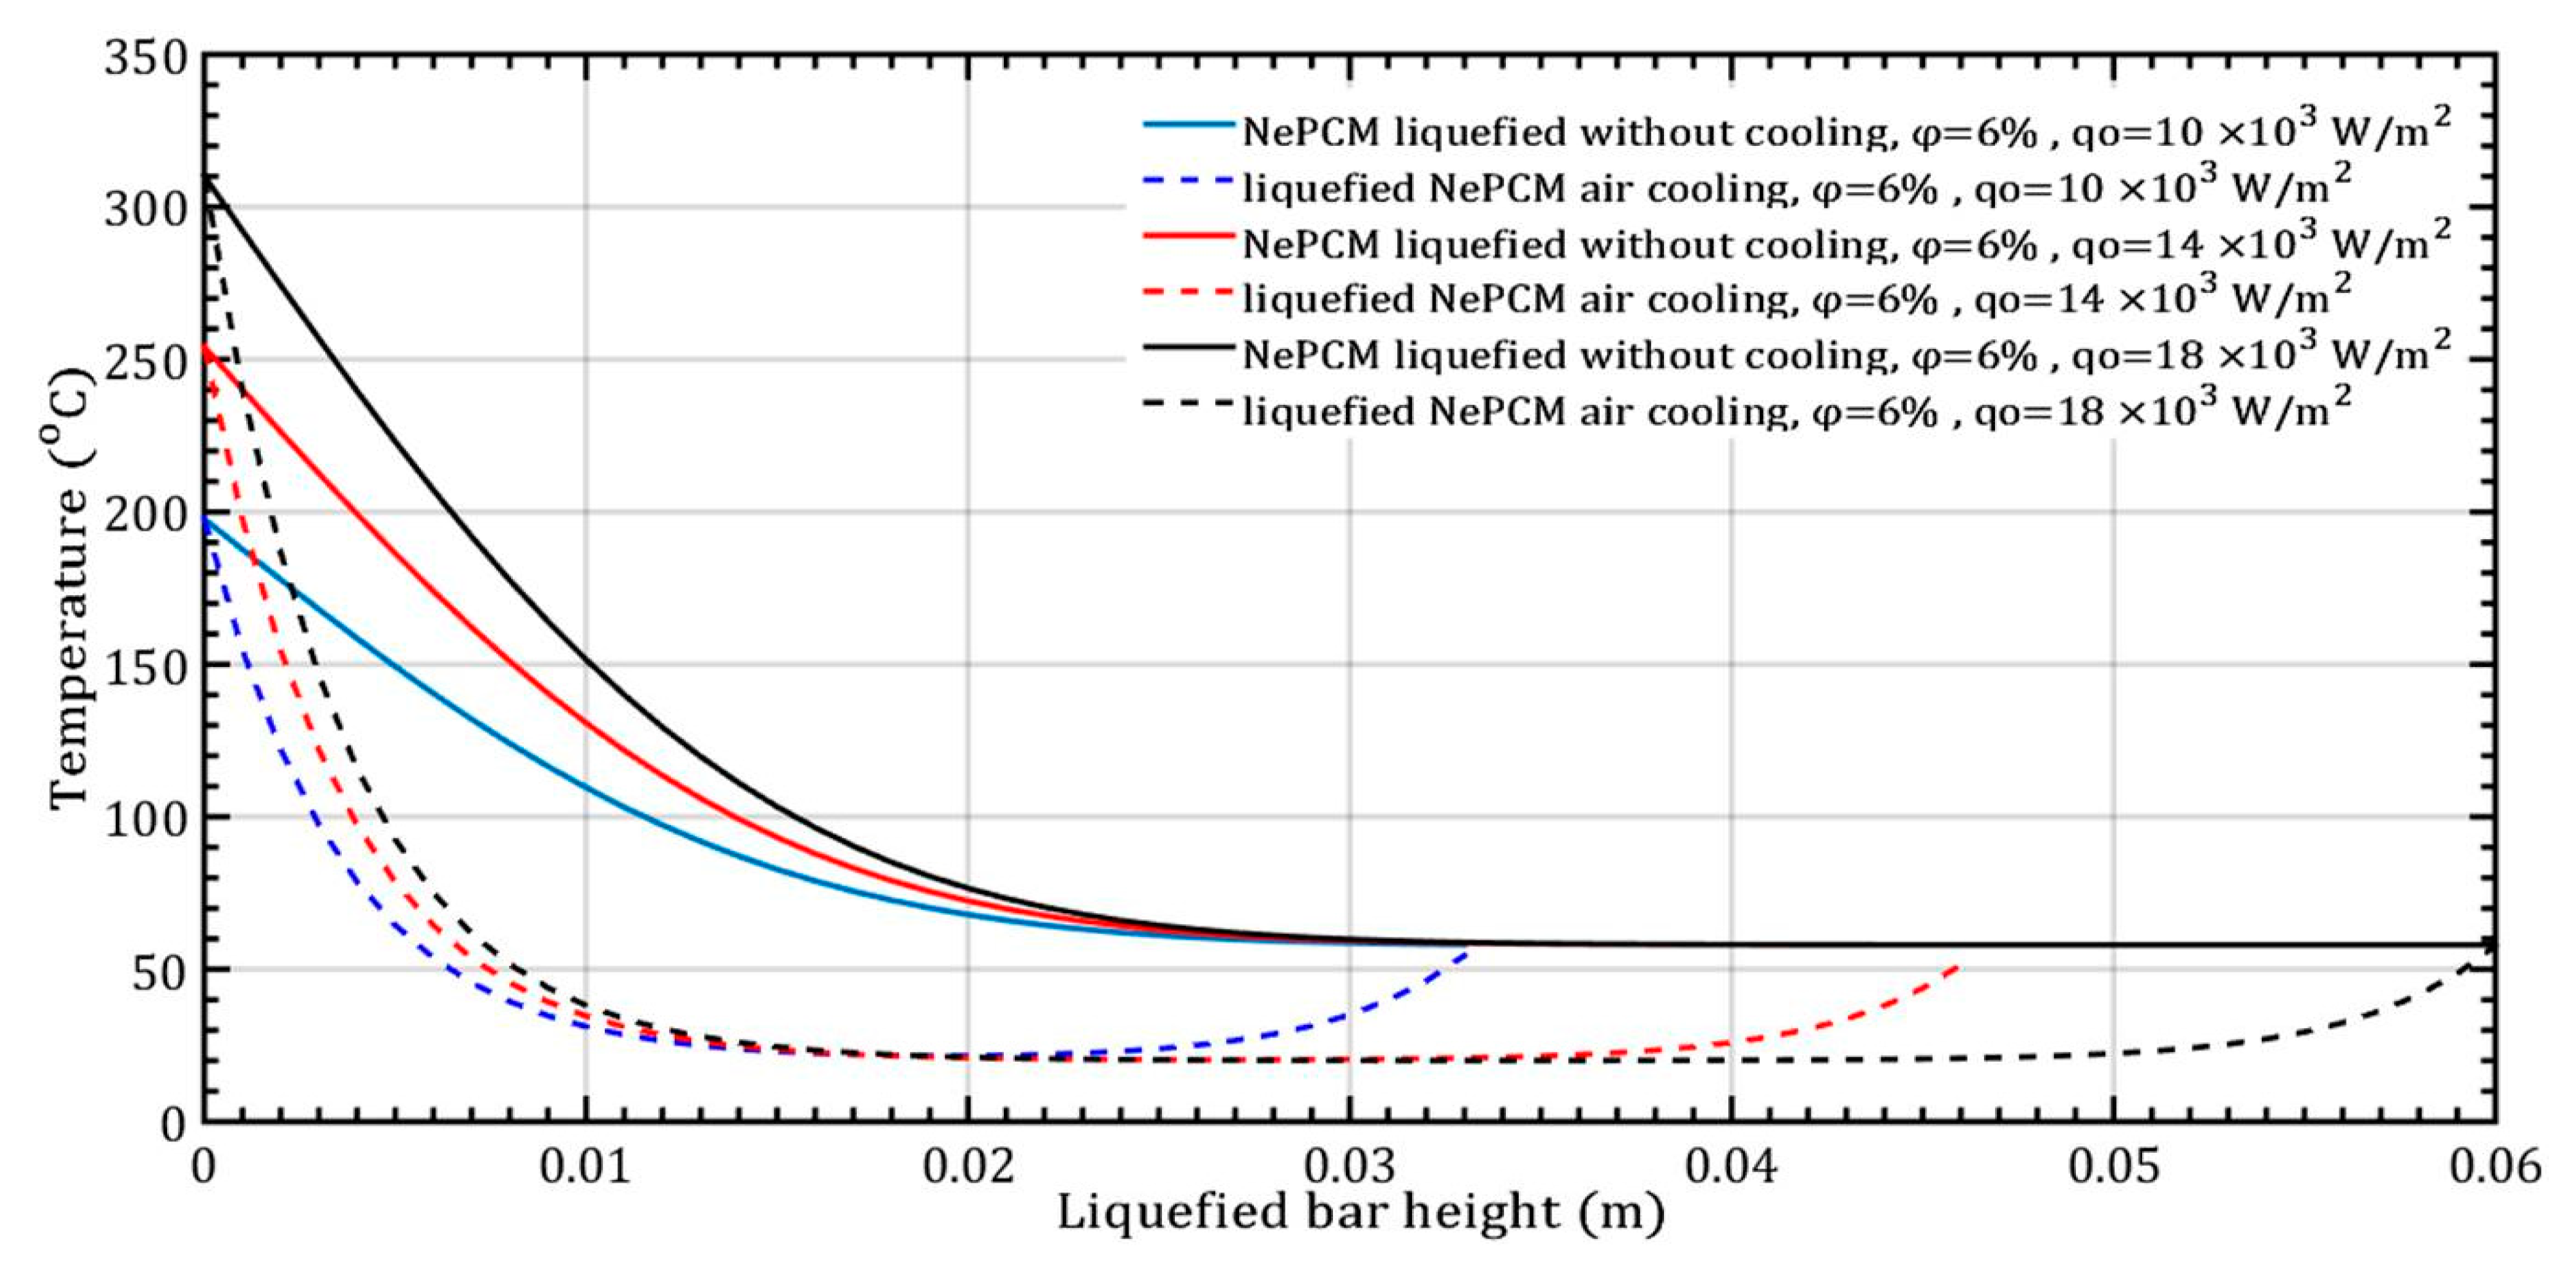
At a constant volume fraction ratio of 6%, the input heat flux varies by 10 × 103 Wm−2, 14 × 103 Wm−2, and 18 × 103 Wm−2, as shown in Figure 9. The duration of the NePCM liquefaction process remains consistent in all three analyzed cases, lasting 500 s.
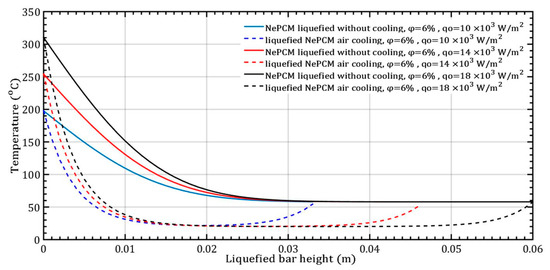
Figure 9.
The temperature of the liquefied NePCM bar varies with changes in the input heat flux.
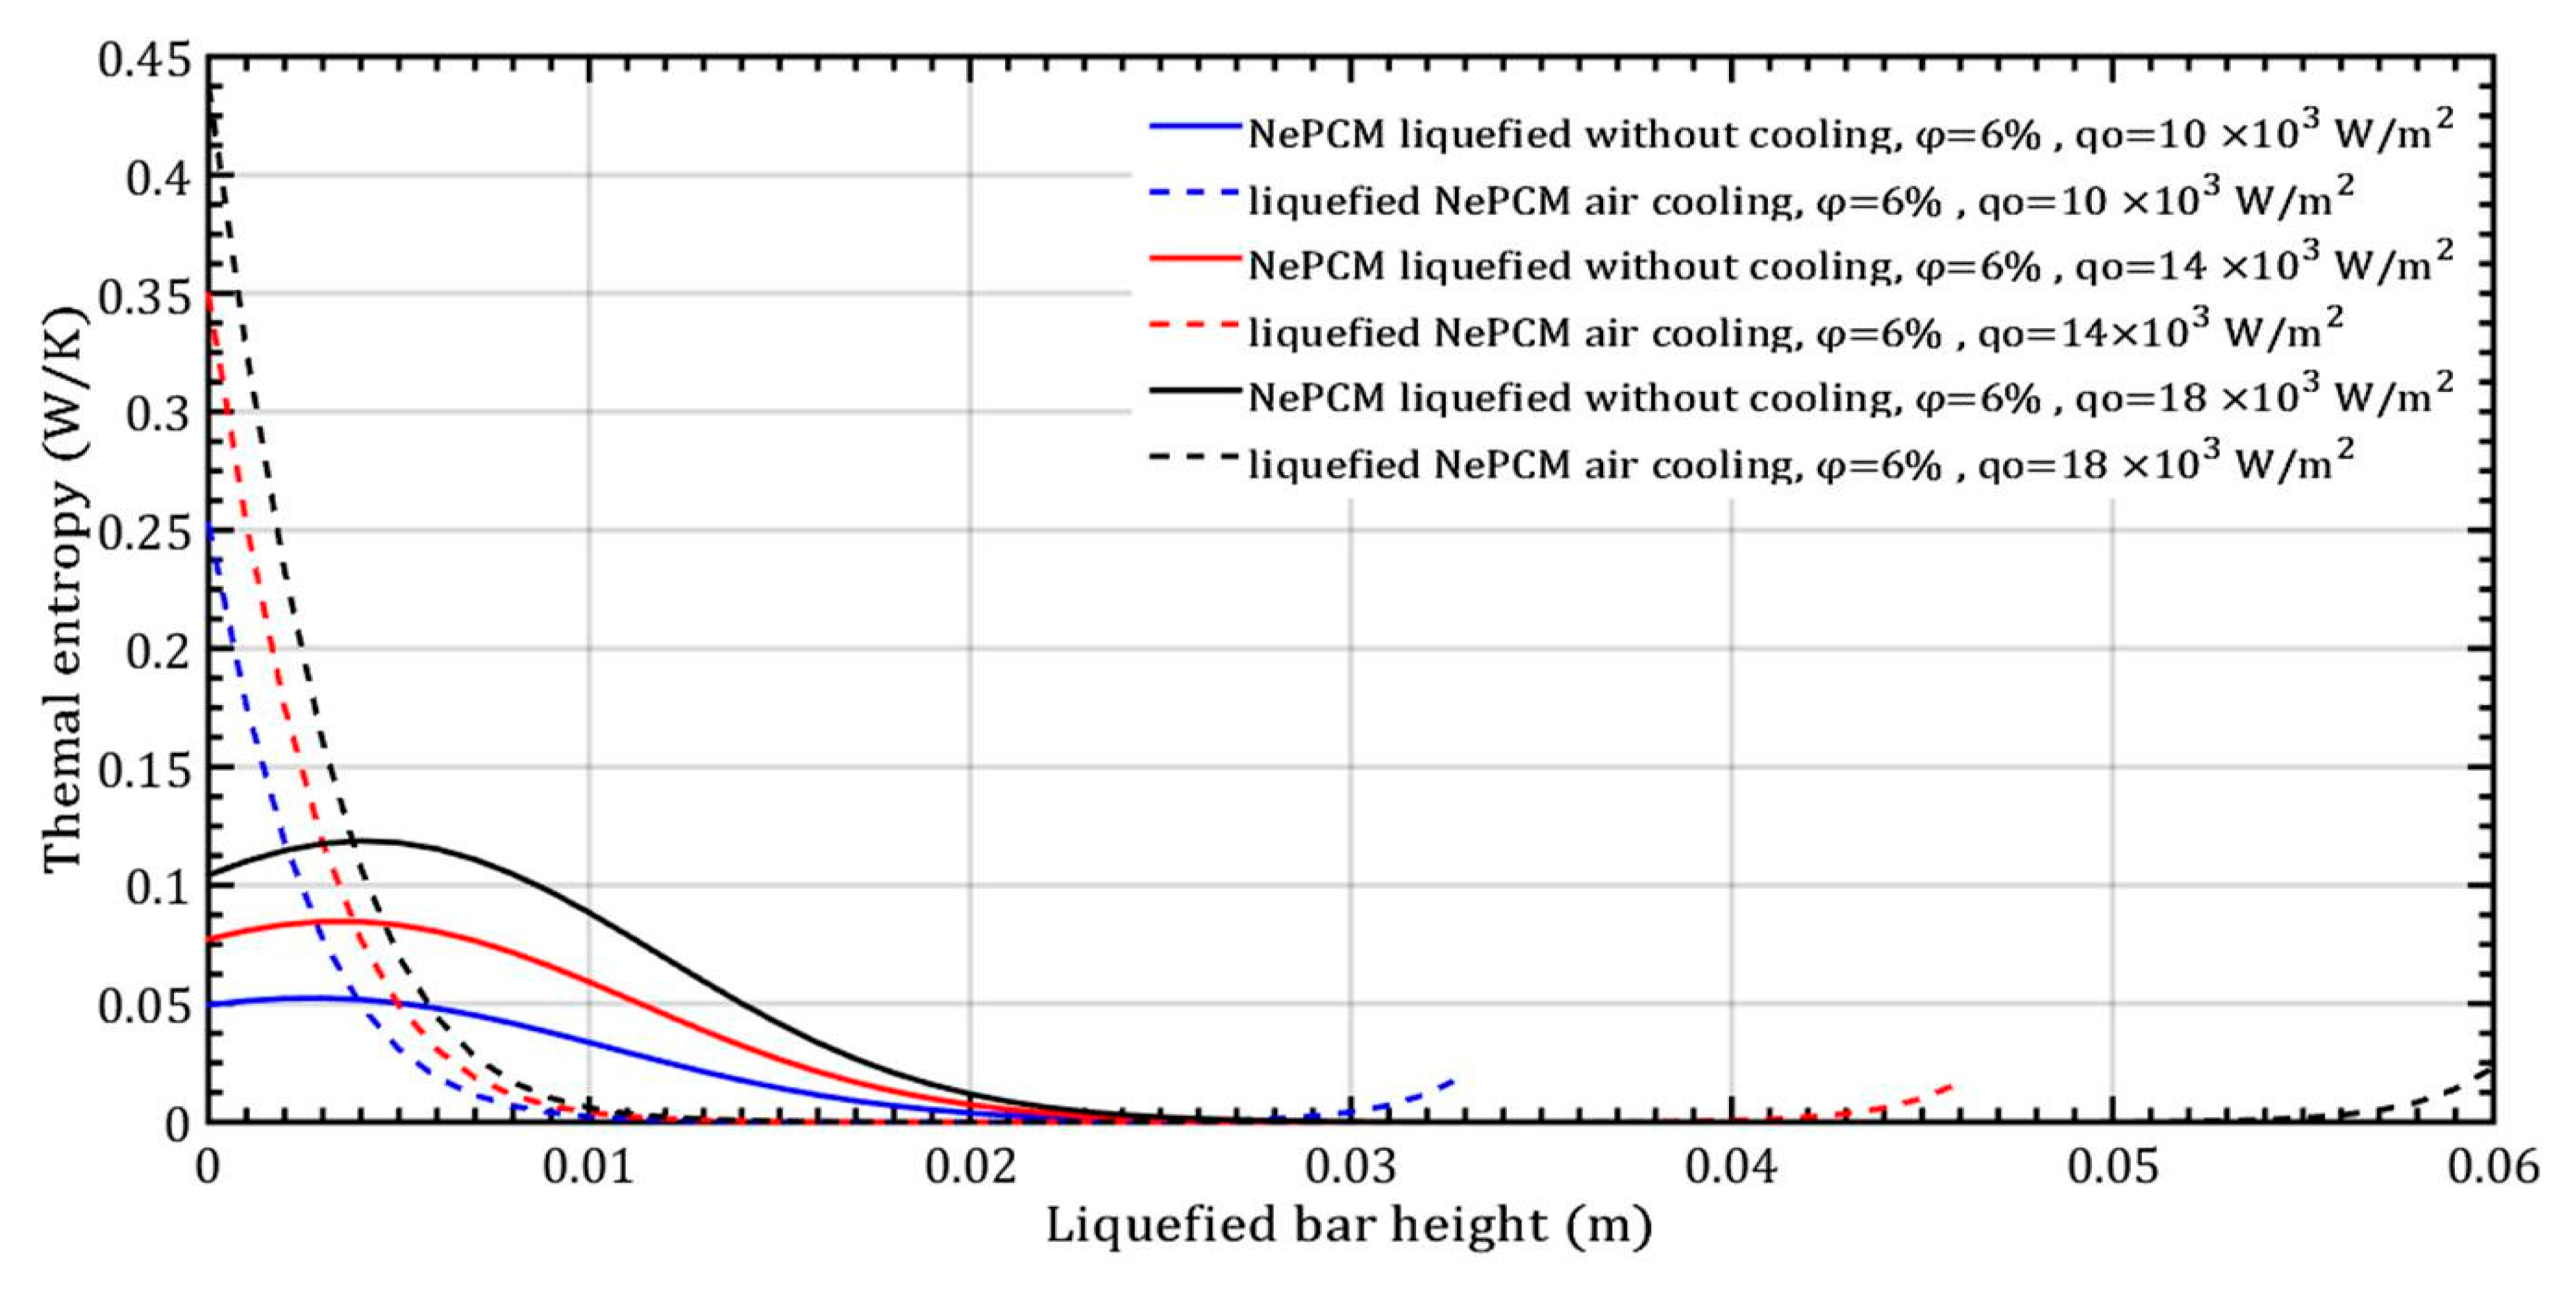
The temperature gradient of the liquefied NePCM bar is most rapid at the maximum input heat flux of 18 × 103 Wm−2. For bar heights greater than 30 mm, the temperature of the NePCM remains constant at 58 °C across all three cases. At a bar height of 20 mm, the temperature drops to the ambient temperature of 20 °C for all tested scenarios. Beyond the three tested cases, after a bar height of 20 mm, the NePCM temperature increases to around 55 °C in all three cases. Without convective cooling, the three analyzed input heat fluxes are intense enough to liquefy the NePCM bar up to a height of 0.034 m. A higher input heat flux results in a higher temperature at the bottom of the bar and a temperature at the end equal to the liquefied temperature of the bar. Because the heating time of the bar is limited to 500 s, no further increase in the temperature of the liquefied bar due to conduction alone was achieved. The thermal entropy of the NePCM bar with a constant volume fraction ratio of 6% is depicted in Figure 10 for the case of varying input heat flux. A significant decrease in thermal entropy is observed during the cooling process of the liquefied bar, dropping to nearly 0 Wm−1K−1 at a height of 10 mm. As the height increases beyond 28 mm, the thermal entropy values continue to rise at an input heat flux of 104 Wm−2. At input heat fluxes of 14 × 103 Wm−2 and 18 × 103 Wm−2, the entropy increases for heights exceeding 40 mm and 55 mm, respectively. The higher value of thermal entropy during convective cooling of a NePCM bar is often a result of increased heat exchange due to forced convection. The total thermal entropy rapidly decreases to a negligible value at a NePCM bar height of 0.01 m.
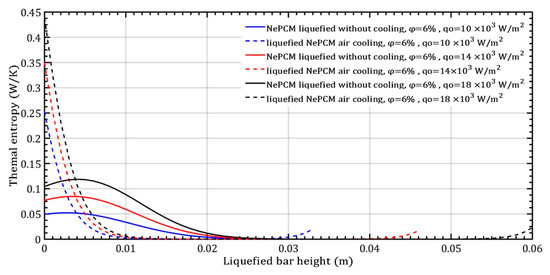
Figure 10.
The thermal entropy of the liquefied NePCM bar varies with the heat flux.
When the heat flux changes by 10 × 103 Wm−2, 14 × 103 Wm−2, and 18 × 103 Wm−2 while maintaining a constant volume fraction ratio of 6%, the NePCM bar efficiency as a function of its length is depicted in Figure 11. In all three cases analyzed, the bar efficiency rapidly decreases to 0 at the selected bar height of 12 mm. Up to a bar height of 12 mm, there is no effect of the change in the input heat flux on the bar efficiency. An increase in bar efficiency is observed after a liquefied bar height of 12 mm and a heat flux of 104 Wm−2, then again after a height of 22 mm and 14 × 103 Wm−2 and finally after a height of 45 mm and 18 × 103 Wm−2. The reason for the rapid decrease in efficiency of the NePCM bar from a value of 1 at the base to 0 at a height of 0.02 m is the rapid decrease in temperature along its height. At the bottom of the NePCM bar, the temperature is at its maximum, ranging from about 200 °C to 300 °C, resulting in maximum efficiency. However, due to convective cooling, at a height of 0.02 m, the temperature of the bar equals the ambient temperature, leading to minimum efficiency.
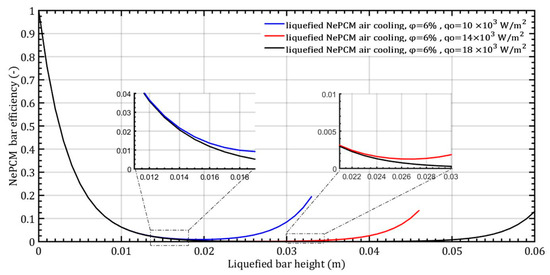
Figure 11.
The efficiency of NePCM liquefied bar is determined by the input heat flux.
The changes in entransy dissipation rate in response to variations in the input heat flux by 10 × 103 Wm−2, 14 × 103 Wm−2, and 18 × 103 Wm−2, while maintaining a constant volume fraction ratio of 6% are depicted in Figure 12. The impact of increasing the input heat flux on the entransy dissipation value is significantly more pronounced than the effect of increasing the volume fraction of Al2O3 nanoparticles, as shown in Figure 8. Entransy dissipation values at a minimum heat flux of 104 Wm−2 become negative when the bar height is approximately 20 mm. At the maximum heat flux of 18 × 103 Wm−2, the entransy dissipation rate turns negative beyond a bar height of 41 mm.
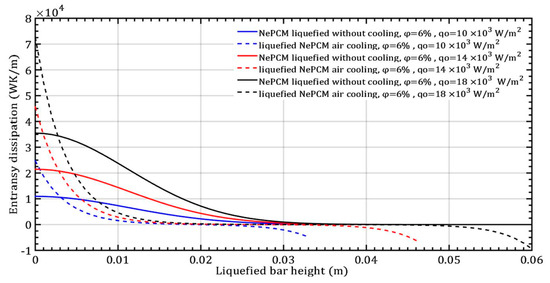
Figure 12.
The entransy dissipation of a liquefied NePCM bar varies with the heat flux.
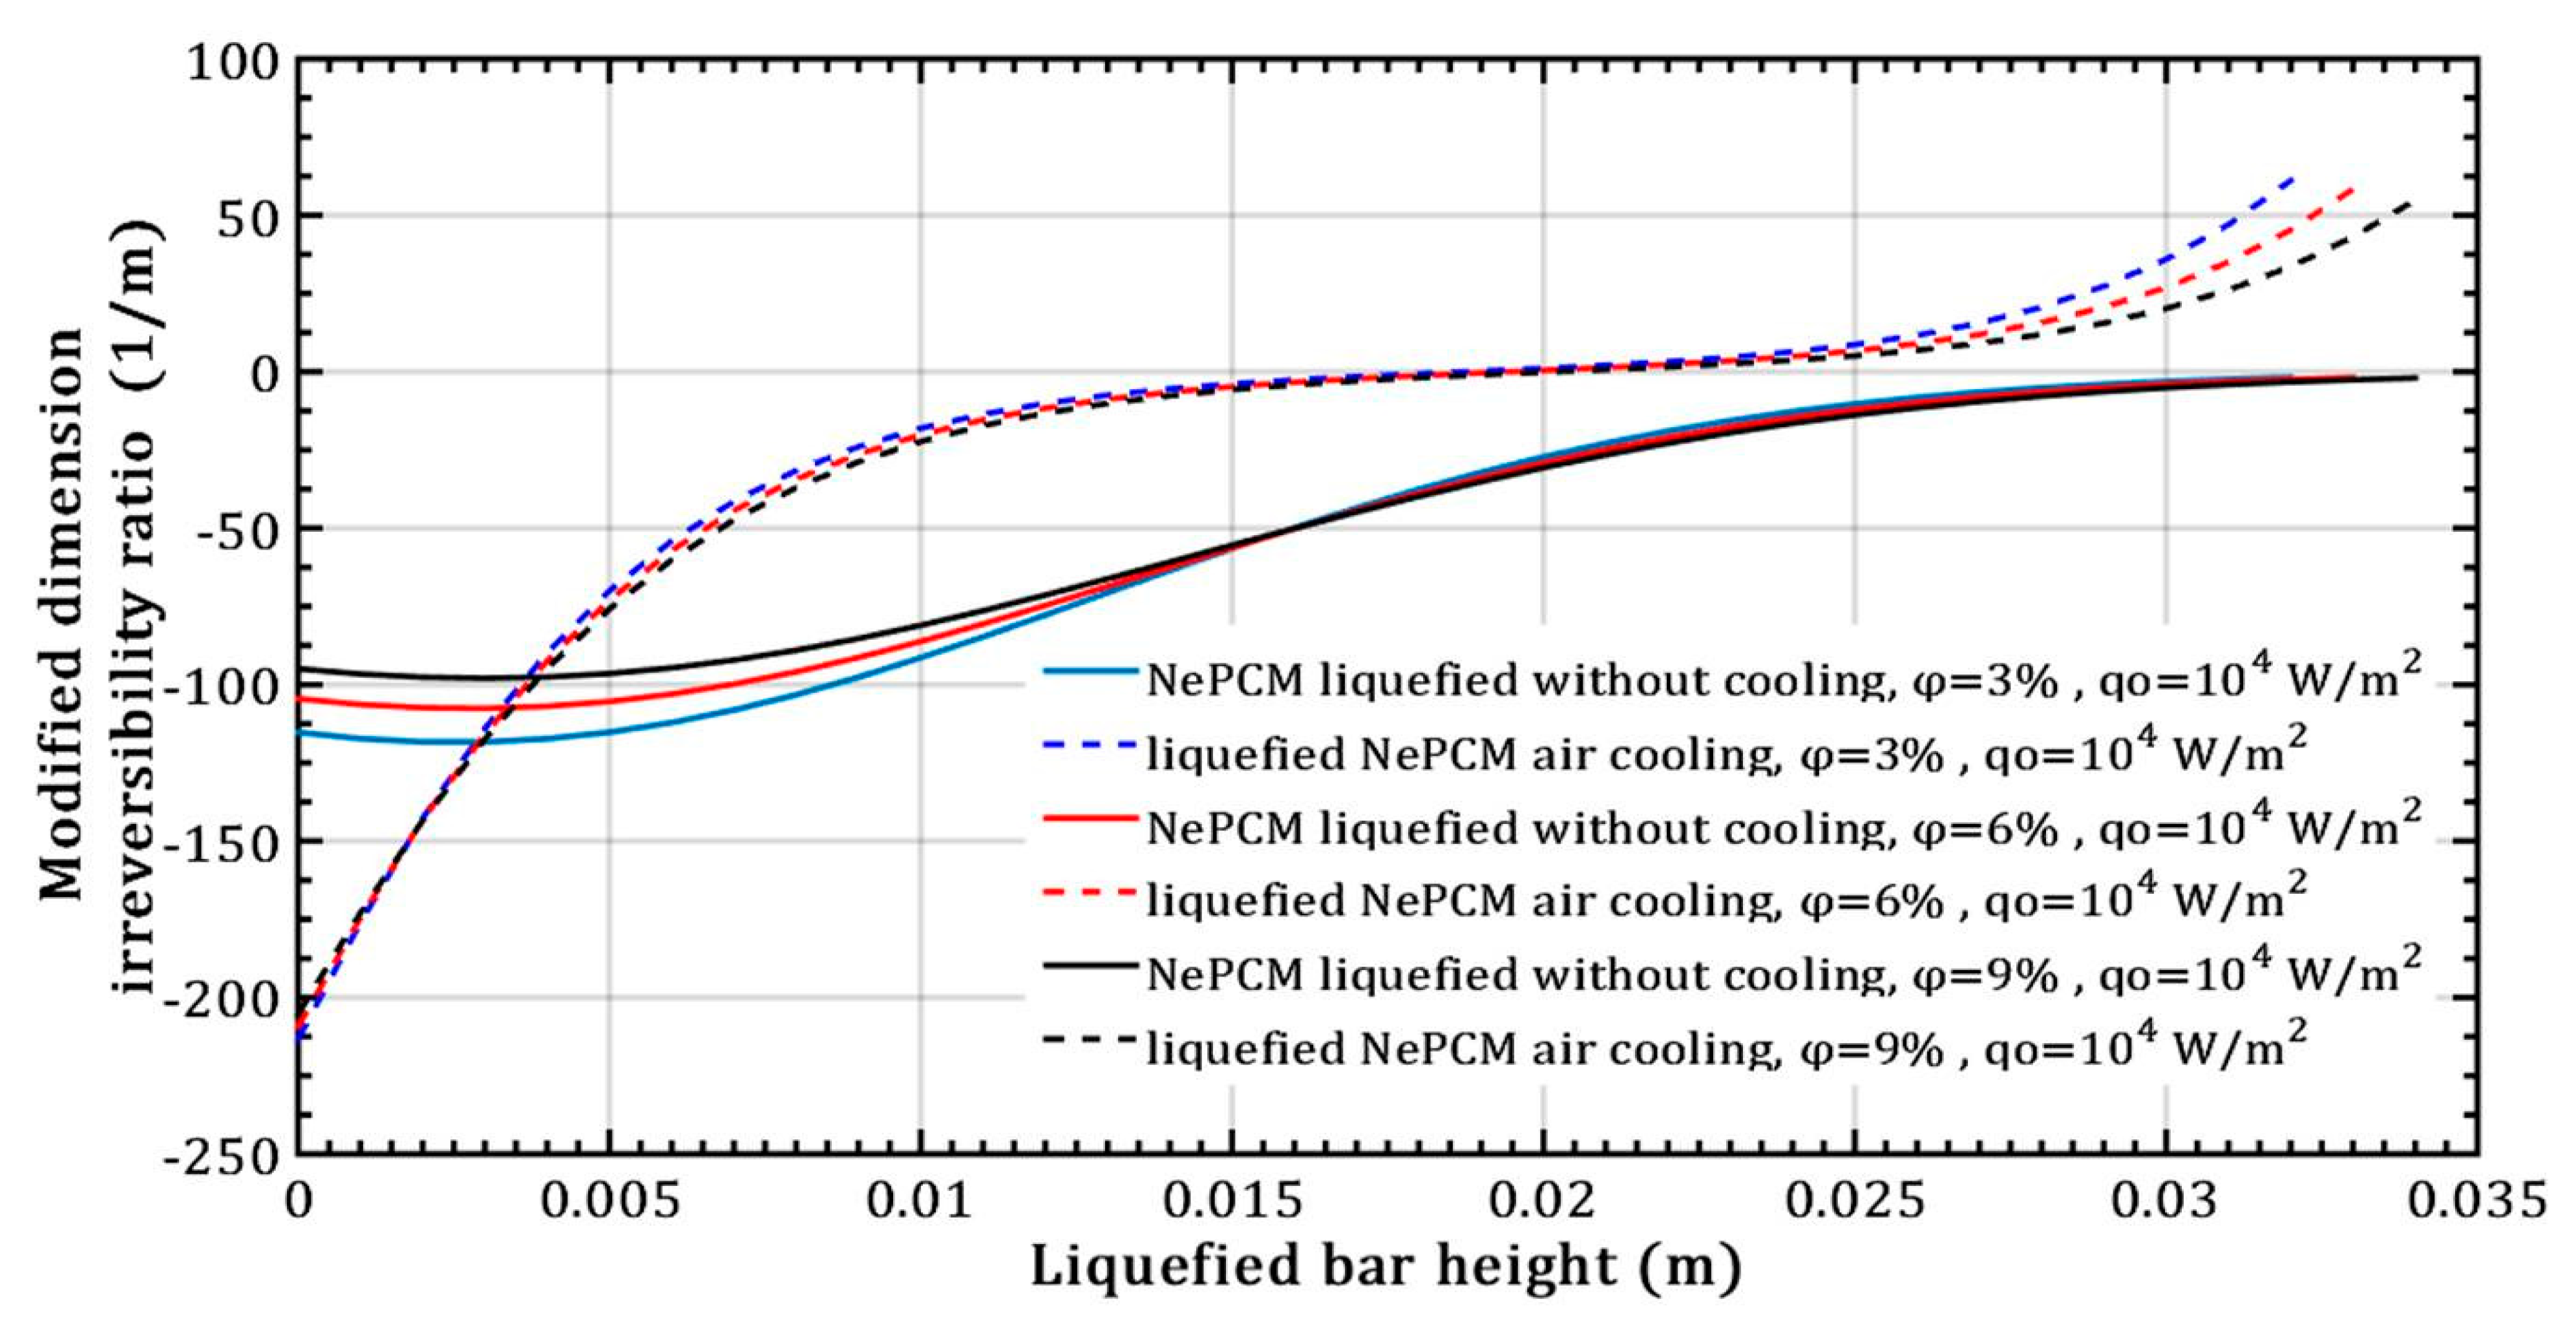
The impact of altering the volume fraction ratio of Al2O3 nanoparticles on the modified dimension irreversibility ratio at a constant heat flux of 104 Wm−2, is depicted in Figure 13. The values of this ratio remain negative throughout the length when conducting heat through a NePCM liquefied bar without cooling. Only at the maximum height of the liquefied bar, which is about 0.035 m does its value approach zero. In the case of liquefied bar cooling, the values of the modified dimension irreversibility ratio become positive and rapidly increase after a bar height of about 0.02 m. The reason for the negative values of Δ is the fact that the temperature of the liquefied bar decreases with increasing distance from its bottom, causing a negative temperature gradient dT.

Figure 13.
Modified dimension irreversibility ratio refers to the variation in volume fraction ratio of Al2O3 nanoparticles.
At a height of 0.02 m in the liquefied bar with air cooling, when the value of Δ is equal to zero, the temperature at that (s) is equal to the temperature at the bottom as shown in Figure 13. When NePCM is liquefied without cooling, the values of Δ are negative throughout the bar`s height, indicating that a temperature gradient directed from the bottom to the top has been established over the entire height of the bar.
Since the temperature of the NePCM bar is 20 °C at a height of 0.02 m, the value of the modified dimension irreversibility ratio is zero, Δ = 0. This scenario relates to the convective cooling of the NePCM bar. In the absence of convective cooling, the value of Δ is zero only at the end of the bar, specifically at a height of 0.034 m, which is a result of its temperature at that point. Due to the conductive thermal resistance and the limited time of 500 s, the top of the NePCM bar remains unheated and maintains an ambient temperature of 20 °C.
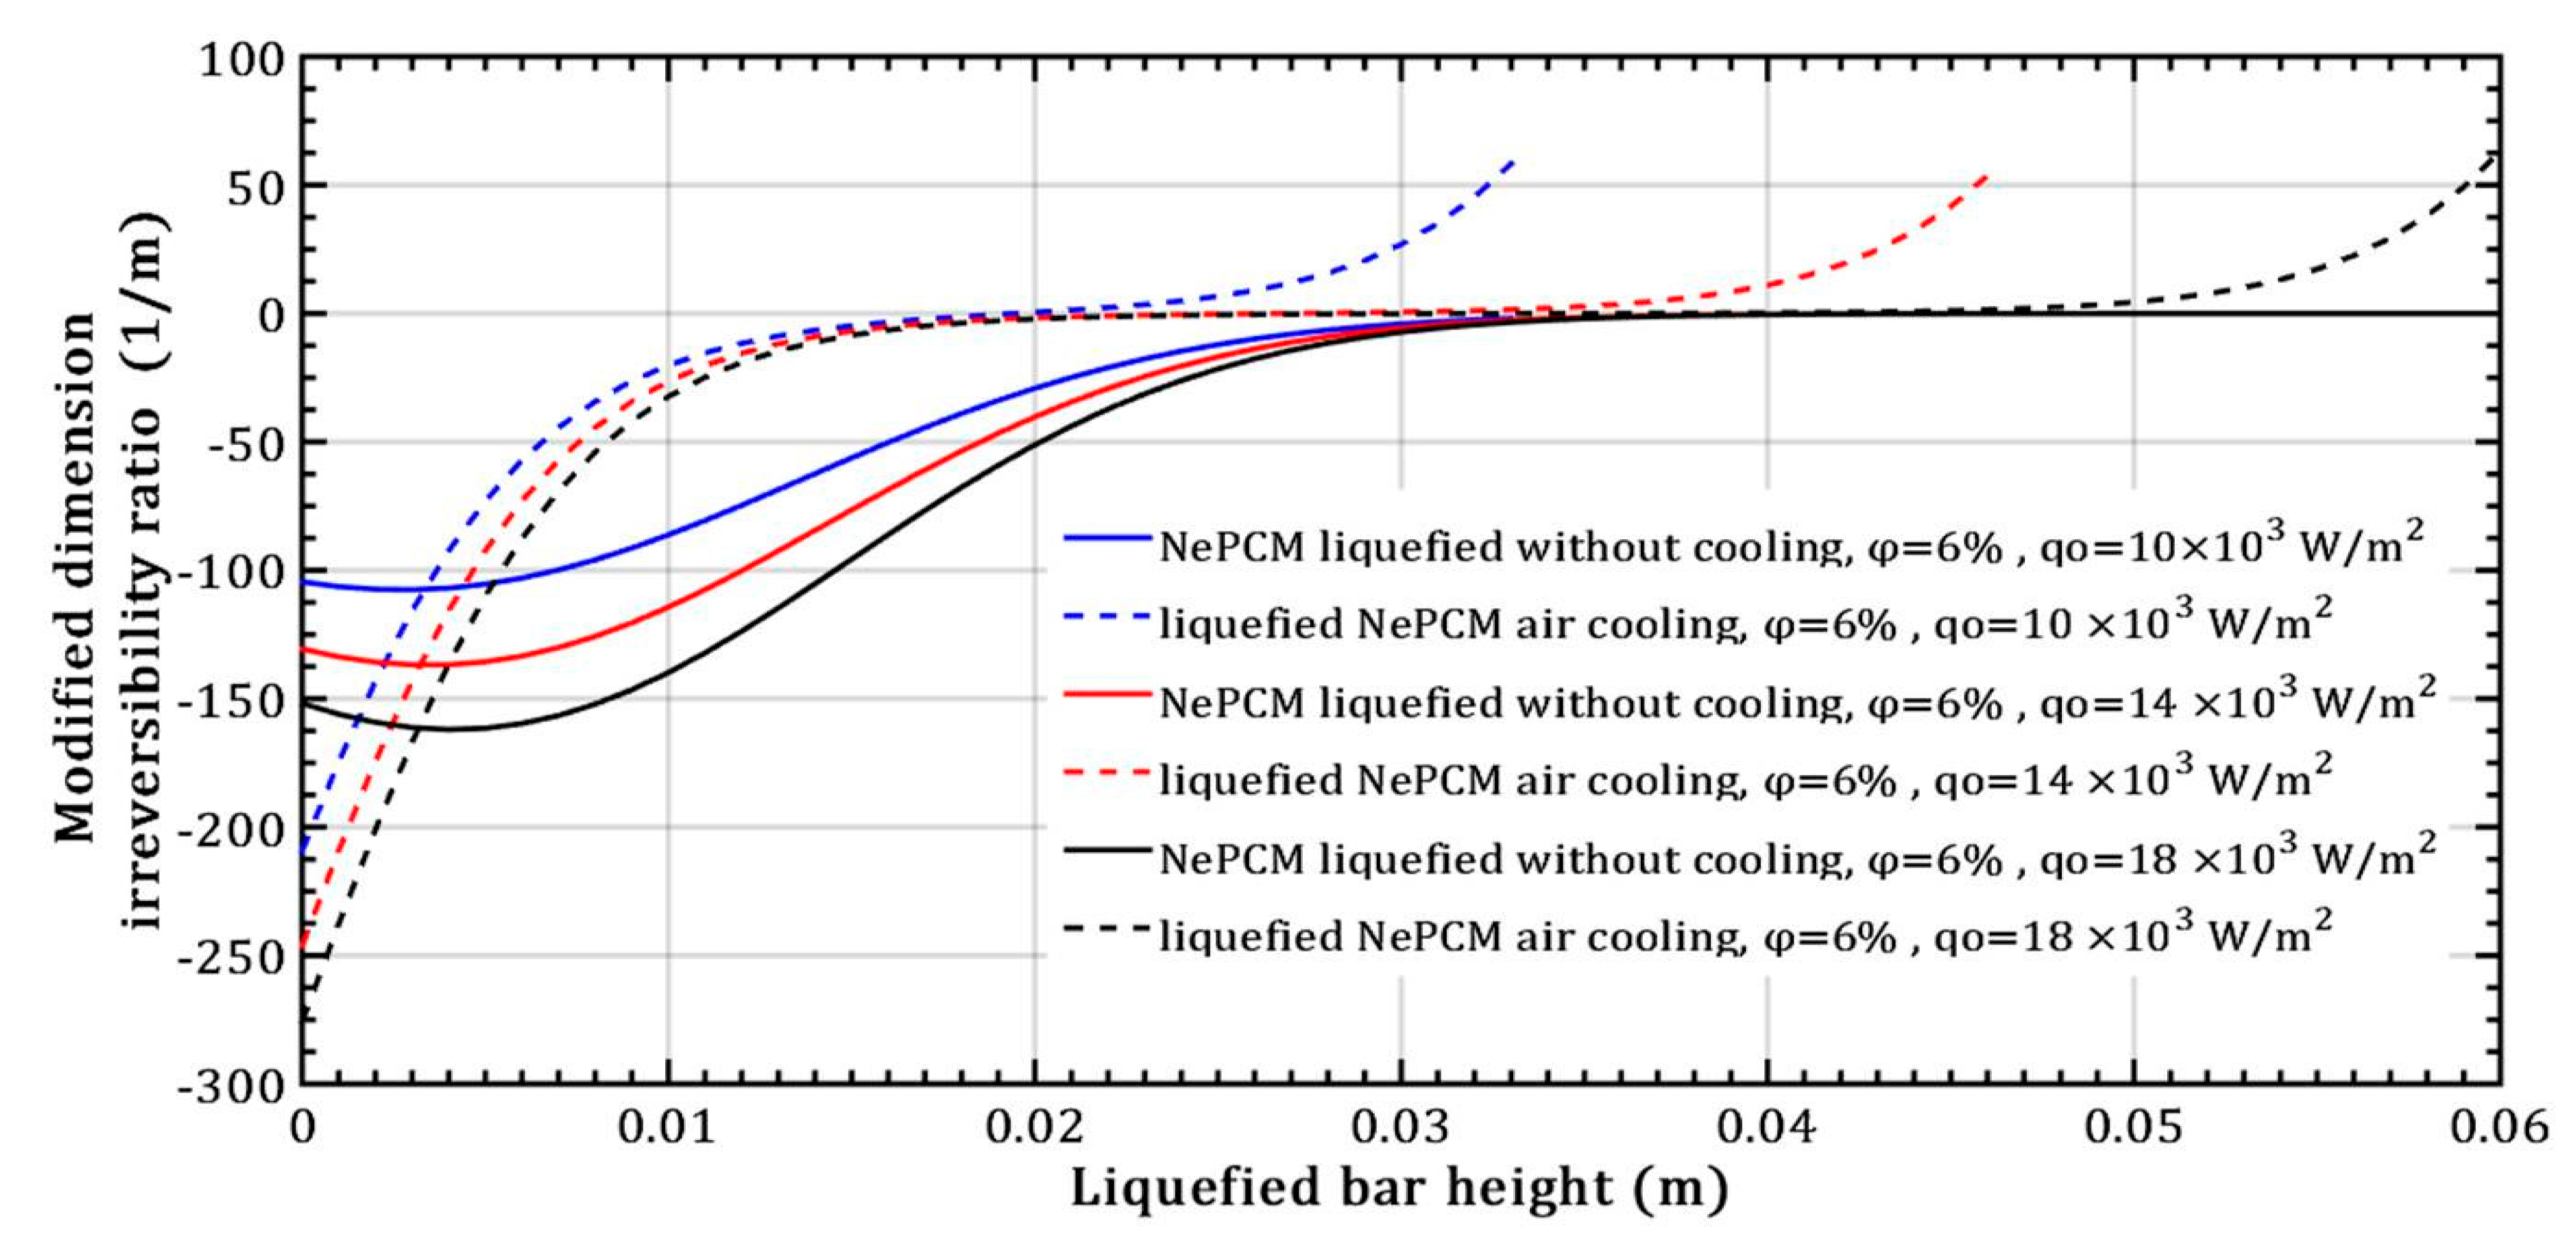
For a constant volume fraction ratio of Al2O3 nanoparticles at 6% and varying input heat flux, Figure 14 shows the modified dimension irreversibility ratio. Above a bar height of 0.02 m and a minimum heat flux of 104 Wm−2, the ratio Δ increases rapidly from zero during conductive heating of the NePCM liquefied bar entering the positive region. During liquefied bar cooling, the modified dimension irreversibility ratio values are negative up to a bar height of approximately 0.035 m, after which Δ equals zero. The negative Δ values stem from the fact that the temperature of the liquefied bar at z = s, is the same as the temperature at the bar`s bottom. The negative value of the modified dimension irreversibility ratio is due to the decrease in temperature of the NePCM bar, resulting in a negative temperature gradient along its height. When convective cooling is present, the temperature gradient values between the NePCM bar and the ambient are smaller compared to when there is no convective cooling. This leads to a higher slope for the modified dimension irreversibility ratio (shown as dashed lines in Figure 14). As a result of convective cooling, the NePCM bar rapidly drops below the NePCM melting temperature of 58 °C.

Figure 14.
Modified dimension irreversibility ratio—variation of heat flux.
When the input heat flux changes in the case of liquefied bar air cooling, the fastest decrease in temperature (dT) occurs at a minimum heat flux of 104 Wm−2, as shown in Figure 14. The situation differs in the case of liquefied bar without air cooling, where the slowest temperature increase occurs at the minimum heat flux of 104 Wm−2.
The impact of changing the input heat flux on the modified irreversibility ratio is more significant in the case of NePCM without cooling compared to when air cooling of the liquefied bar is present. Sensitivity analysis determines the variability of output results from a mathematical model based on changes in input variables, revealing the following:
- -
- There is no effect on the thermal entropy of the liquefied NePCM bar when increasing the volume fraction ratio from 3% to 9%. This is observed at a constant heat flux of 104 Wm−2 and a height of the liquefied bar of 0.012 m.
- -
- However, with an increase in the volume fraction ratio from 3% to 9%, at a constant heat flux of 104 Wm−2 and a height of the liquefied bar of 0.02 m, the NePCM bar efficiency decreases by 99%.
- -
- The entransy dissipation value decreases by 50% and is not affected by the volume fraction ratio at a liquefied bar height of 0.015 m and a heat flux of 104 Wm−2 for the case without bar cooling. However, with a liquefied bar height of 0.02 m and a heat flux of 104 Wm−2, entransy dissipation decreases by 100% with bar cooling, becoming negative for bar heights over 0.02 m.
- -
- The thermal entropy value of the liquefied NePCM bar increases by an average of 110% without cooling at a volume fraction ratio of 6% and an 80% increase in heat flux, with the bar height reaching up to 0.02 m.
- -
- The entransy dissipation ratio of the liquefied NePCM bar at 0.035 m without cooling is not affected by the increase in heat flux. However, with bar cooling the entransy dissipation decreases by about 98% when the heat flux increases by 80% and the bar height is up to 0.01 m.
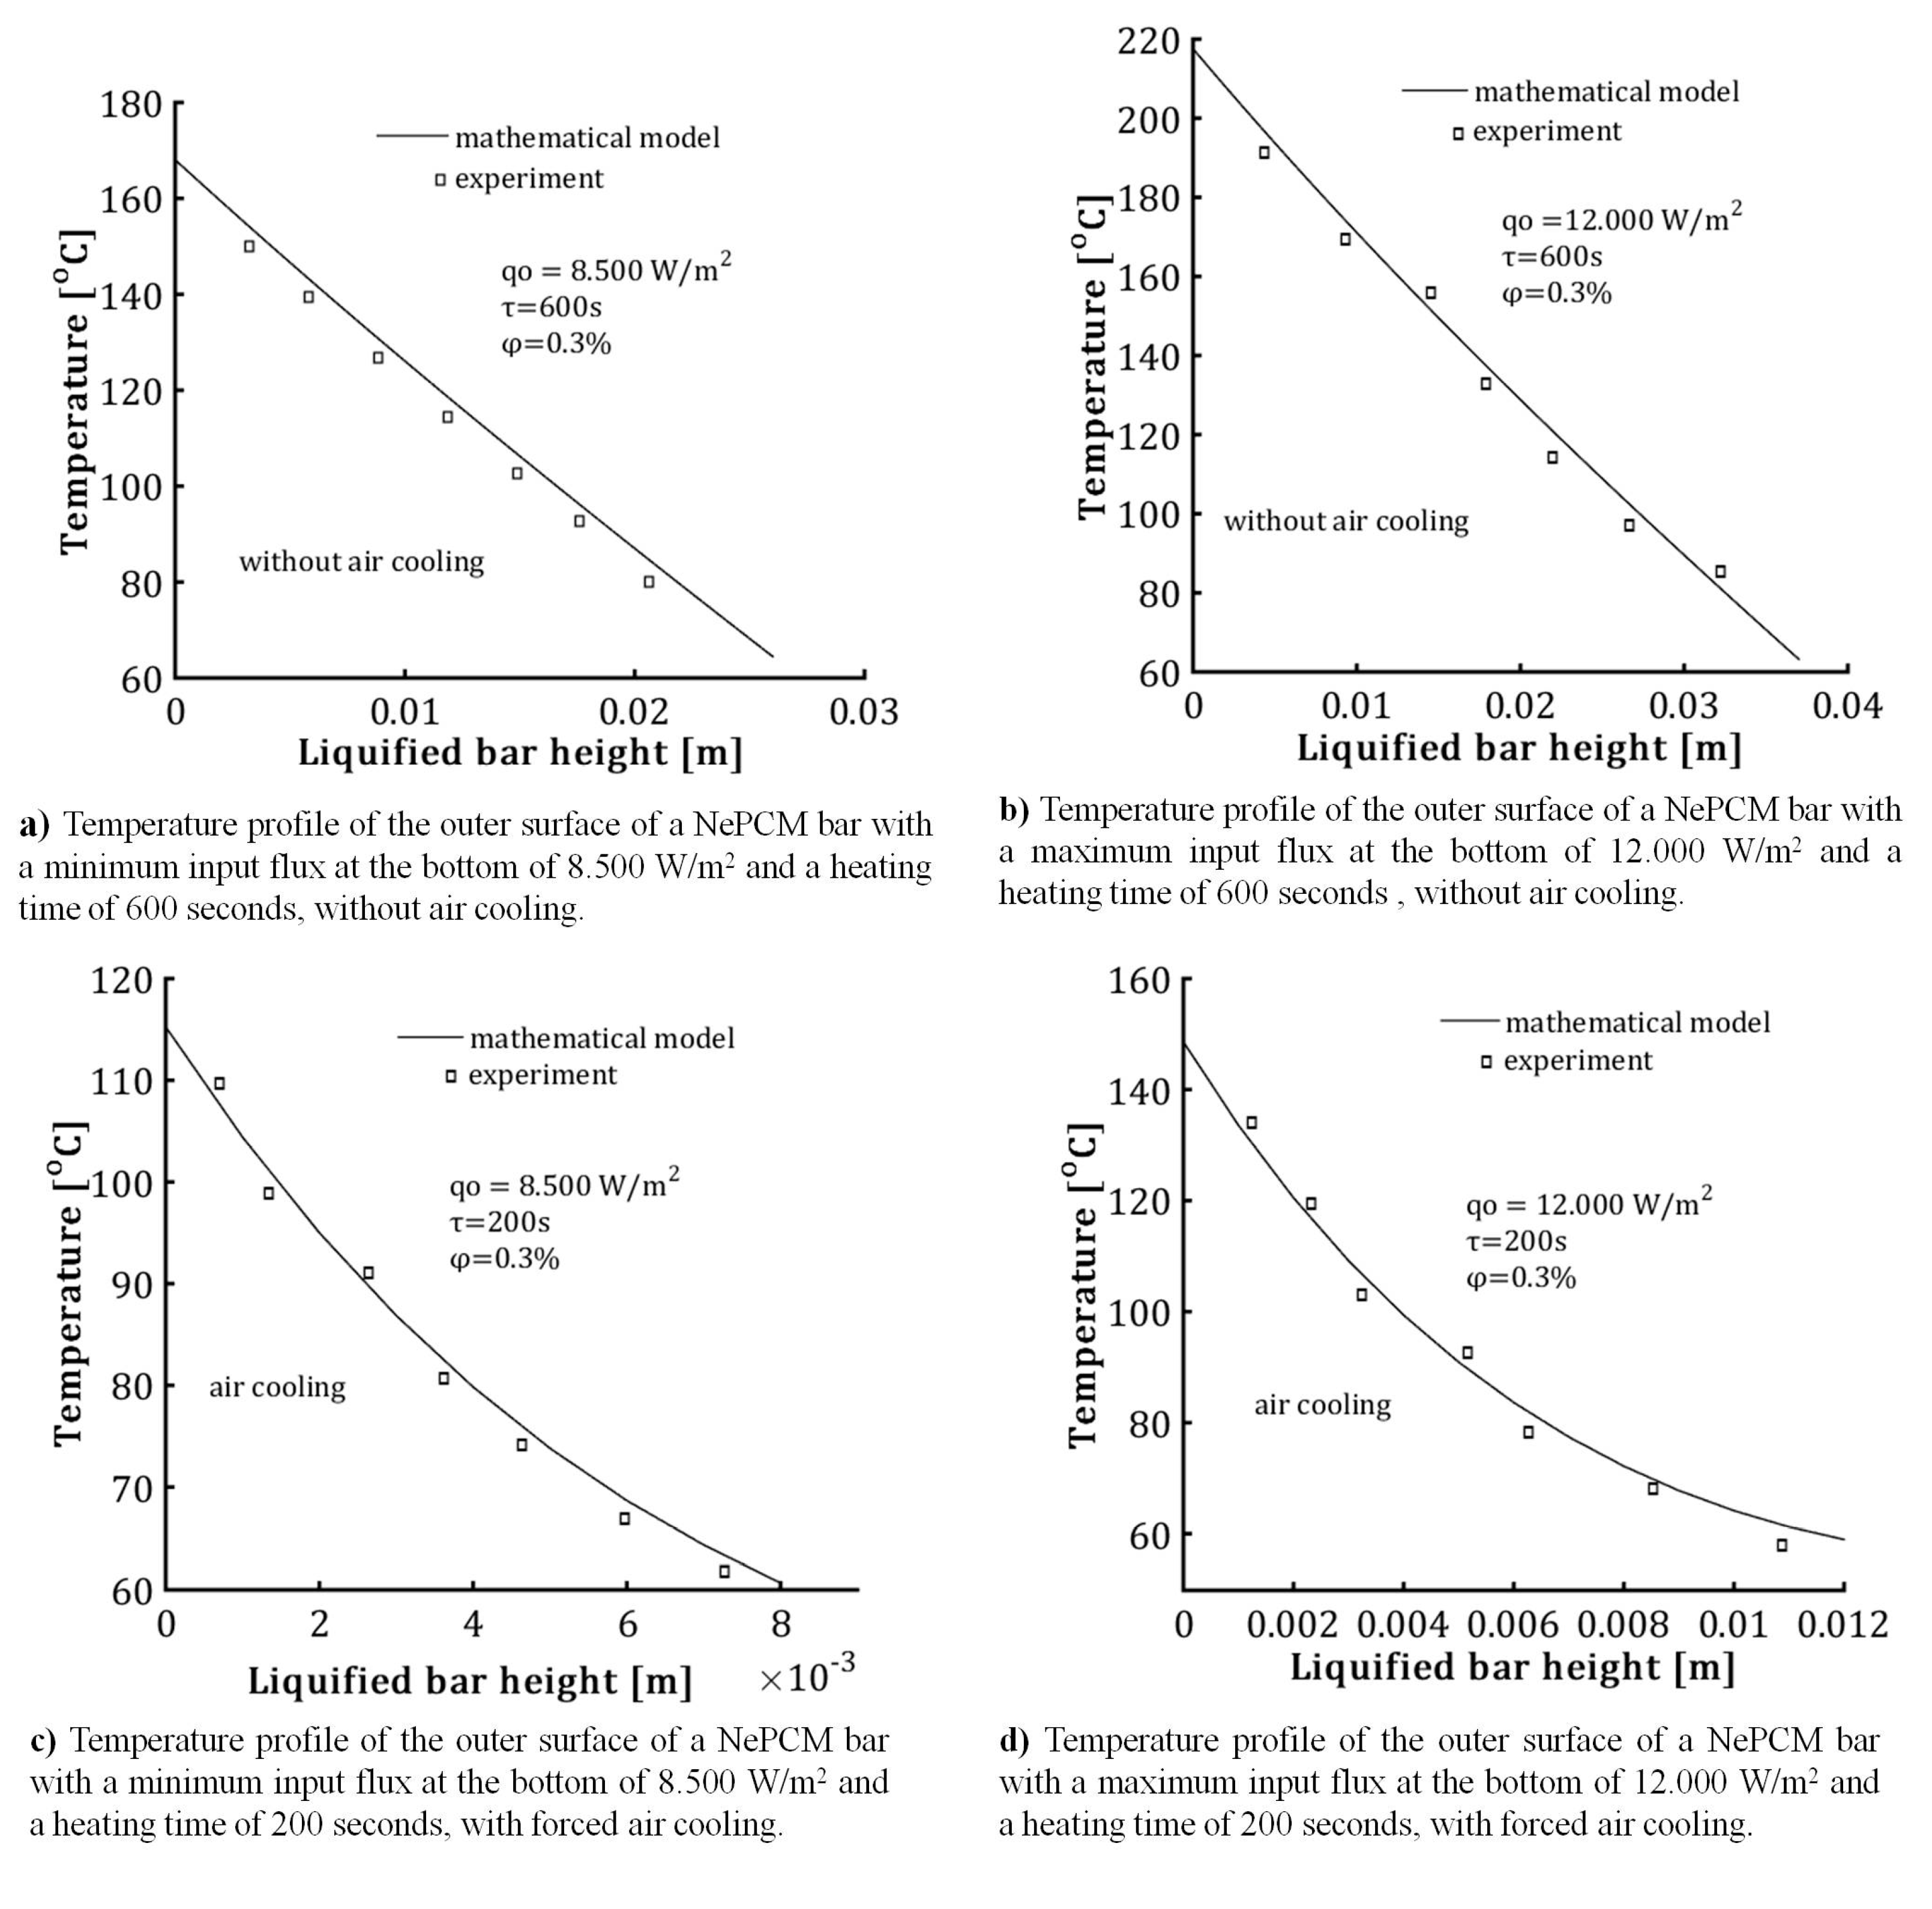
Based on the experimental tests conducted, the temperature of the liquefied NePCM bar with specified restrictions is shown in Figure 15. The volume fraction ratio is limited to 0.3% to prevent nanoparticle agglomeration. The input heat flux at the bottom of the bar ranges from 8500 Wm−2 to 12,000 Wm−2. Both heat fluxes were kept constant for a total heating time of 200 s in the first case and 600 s in the second. The cylindrical NePCM bar, without external cooling, is coated with thermal insulation material. The thermal insulator used around the outer surface of the cylindrical vessel was a polystyrene insulation tube with a thermal conductivity of 0.033 Wm−1K−1. After being heated for 600 s, the polystyrene insulation tube is removed, and a thermographic thermogram is produced. Thermographic analysis was conducted using a Fluke Ti32 thermographic camera. Thermogram processing was established using SmartView 2.3.2 software. The temperature distributions obtained are displayed in Figure 15a,b. The temperature distribution along the outer wall of the cylindrical vessel represents the average value of multiple thermographic analyses conducted under the same conditions. In the second case, as illustrated in Figure 15c,d, the NePCM bar is not thermally insulated. This means that heat is applied to the bottom of the bar and subjected to air forced convection due to air flow from the outer surface of the bar.

Figure 15.
The temperature distribution along the length of the liquefied bar was studied for cases of both forced cooling and non-cooling, taking into account variations in the process parameters.
The increased heat transfer from forced convection causes a decrease in temperature at the bottom of the NePCM bar. Additionally, forced convection lowers the total height of the liquefied NePCM bar, allowing it to reach temperatures below the PCM melting point of 58 °C more rapidly. In the conducted test, the maximum height of the liquefied NePCM bar is 37 mm (see Figure 15b), achieved with a maximum heating time of 600 s and a maximum input flux of 12,000 Wm−2 without requiring air cooling.
4. Conclusions
An analytical model of transient thermal irreversibility in nano-enhanced phase change material (NePCM) in the form of a cylindrical bar during its heating and liquefaction has been developed. The analysis of combined conductive and convective heat transfers inside and around the NePCM bar allows for the evaluation of the impact of physical parameters on thermal irreversibilities.
In the final conclusions, based on the establishment of the methodology, limitations and variations of the adopted physical parameters, the key results of the analysis are discussed as follows:
- -
- Increasing the volume fraction ratio of Al2O3 nanoparticles in basic PCM leads to an increase in melting height and a decrease in the rate of forced convective air cooling of NePCM bars.
- -
- The transient thermal entropy of the liquefied NePCM bar is significantly lower when not cooled compared to when cooled using forced convective air cooling.
- -
- Changing the value of the input heat flux has a significant impact on both the intensity and rate of change of the transient thermal entropy.
- -
- When it comes to the efficiency of the NePCM bar, varying the input heat flux has no significant effect at lower heights of the liquefied NePCM bar.
- -
- The impact of the volume fraction ratio of Al2O3 nanoparticles on the entransy dissipation rate of NePCM bars is negligible compared to the variation in the input heat flux.
Future research could explore the impact of various types of hybrid NePCM, extended heating durations, and the development of natural convection on the outer surface of the NePCM bar at different incline angles. Furthermore, future research following the methodology outlined in this study will focus on examining how nanoparticle size and shape impact the thermophysical properties of NePCM and thermal irreversibility.
Funding
This research received no funding.
Data Availability Statement
The data are contained within the article.
Conflicts of Interest
The author declares no conflicts of interest.
Nomenclature
| cpcm.o | specific heat capacity of PCM, kJkg−1K−1 |
| cp | specific heat capacity of nanoparticles, kJkg−1K−1 |
| cpcm | specific heat capacity of nano-enhanced phase change material, kJkg−1K−1 |
| ipcm | specific enthalpy of nano-enhanced phase change material, kJkg−1 |
| ip | specific enthalpy of nanoparticles, kJkg−1 |
| s | liquefied bar height, m |
| tpcm | temperature of liquefied bar in NePCM, °C |
| tpcm.o | temperature of solid bar in NePCM, °C |
| tm | temperature of phase change in PCM, °C |
| apcm | thermal diffusivity of nano-enhanced phase change material, m2 s−1 |
| tair | ambient air temperature, °C |
| Epcm.conv | entransy dissipation rate of NePCM in a liquefied bar is influenced by convective heat transfer, Wm−2K |
| Spcm.cond | thermal entropy of NePCM in a liquefied bar is influenced by conductive heat transfer, Wm−1K−1 |
| Spcm.conv | thermal entropy of NePCM in a liquefied bar is influenced by convective cooling, Wm−1K−1 |
| Epcm.cond | entransy dissipation rate of NePCM in a liquefied bar is influenced by conductive heat transfer, Wm−2K |
| Greek symbols | |
| φ | volume fraction ratio of nanoparticles,- |
| qo | inlet heat flux into the bottom of the bar, Wm−2 |
| τ | time, s |
| λpcm.o | thermal conductivity coefficient of PCM, Wm−1 K−1 |
| λpcm | thermal conductivity coefficient of NePCM, Wm−1 K−1 |
| λp | thermal conductivity coefficient of nanoparticles, Wm−1 K−1 |
| αpcm | convection heat transfer coefficient, Wm−2 K−1 |
| ρpcm.o | density of PCM, kgm−3 |
| ρpcm | density of NePCM, kgm−3 |
| ρp | density of nanoparticles, kgm−3 |
| ψ | dimension irreversibility ratio, K2 |
References
- Dhaidan, N.S.; Hassan, A.F.; Al-Gaheeshi, A.M.R.; Al-Mousawi, F.N.; Homod, R.Z. Experimental investigation of thermal characteristics of phase change material in finned heat exchangers. J. Energy Storage 2023, 71, 108162. [Google Scholar] [CrossRef]
- Sarani, I.; Payan, S.; Nada, S.A.; Payan, A. Numerical investigation of an innovative discontinuous distribution of fins for solidification rate enhancement in PCM with and without nanoparticles. Appl. Therm. Eng. 2020, 176, 115017. [Google Scholar] [CrossRef]
- Al-Salami, H.A.; Dhaidan, N.S.; Abbas, H.H.; Al-Mousawi, F.N.; Homod, R.Z. Review of PCM charging in latent heat thermal energy storage systems with fins. Therm. Sci. Eng. Prog. 2024, 51, 102640. [Google Scholar] [CrossRef]
- Shahsavar, A.; Shaham, A.; Yıldız, Ç.; Arıcı, M. Entropy generation characteristics of phase change material in a variable wavy walled triplex tube latent heat storage unit for battery thermal management system. J. Energy Storage 2022, 51, 104374. [Google Scholar] [CrossRef]
- Zhang, Z.; Duan, Z.; Wang, J. Sodium acetate trihydrate-based composite phase change material with enhanced thermal performance for energy storage. J. Energy Storage 2021, 34, 102186. [Google Scholar] [CrossRef]
- Sharma, S.; Tahir, A.A.; Reddy, K.S.; Mallick, T.K. Nano-enhanced Phase Change Material for thermal management of BICPV. Appl. Energy 2017, 208, 719–733. [Google Scholar] [CrossRef]
- Colla, L.; Fedele, L.; Mancin, S.; Danza, L.; Manca, O. Nano-PCMs for enhanced energy storage and passive cooling applications. Appl. Therm. Eng. 2017, 110, 584–589. [Google Scholar] [CrossRef]
- Leong, K.Y.; Rahman, M.R.A.; Gurunathan, B.A. Nano-enhanced phase change materials: A review of thermo-physical properties, applications and challenges. J. Energy Storage 2019, 21, 18–31. [Google Scholar] [CrossRef]
- He, M.; Yang, L.; Lin, W.; Chen, J.; Mao, X.; Ma, Z. Preparation, thermal characterization and examination of phase change materials (PCMs) enhanced by carbon-based nanoparticles for solar thermal energy storage. J. Energy Storage 2019, 25, 100874. [Google Scholar] [CrossRef]
- Dhaidan, N.S.; Khodadadi, J.M.; Al-Hattab, T.A.; Al-Mashat, S.M. Experimental and numerical investigation of melting of phase change material/nanoparticle suspensions in a square container subjected to a constant heat flux. Int. J. Heat Mass Transf. 2013, 66, 672–683. [Google Scholar] [CrossRef]
- Al-Jethelah, M.S.M.; Tasnim, S.H.; Mahmud, S.; Dutta, A. Melting of nano-phase change material inside a porous enclosure. Int. J. Heat Mass Transf. 2016, 102, 773–787. [Google Scholar] [CrossRef]
- Keshteli, A.N.; Iasiello, M.; Langella, G.; Bianco, N. Using metal foam and nanoparticle additives with different fin shapes for PCM-based thermal storage in flat plate solar collectors. Therm. Sci. Eng. Prog. 2024, 52, 102690. [Google Scholar]
- Sharma, A.; Kothadia, H.B.; Singh, S.; Mondal, B. Solidification of nanoparticle-based PCM in a fin-aided triplex-tube energy storage system for cooling applications. Therm. Sci. Eng. Prog. 2023, 42, 101872. [Google Scholar] [CrossRef]
- Zullo, F. Entropy Production in the Theory of Heat Conduction in Solids. Entropy 2016, 18, 87. [Google Scholar] [CrossRef]
- Din, Z.U.; Ali, A.; De la Sen, M.; Zaman, G. Entropy generation from convective–radiative moving exponential porous bars with variable thermal conductivity and internal heat generations. Sci. Rep. 2022, 12, 1791. [Google Scholar] [CrossRef]
- Tian, X.; Wang, L. Heat conduction in cylinders: Entropy generation and mathematical inequalities. Int. J. Heat Mass Transf. 2018, 121, 1137–1145. [Google Scholar] [CrossRef]
- Alic, F. The modified dimension and dimensionless irreversibility analysis of low conductivity material of concentric hollow cylinders. J. Therm. Anal. Calorim. 2022, 147, 14555–14569. [Google Scholar] [CrossRef]
- Aziz, A.; Khan, W.A. Classical and minimum entropy generation analyses for steady state conduction with temperature dependent thermal conductivity and asymmetric thermal boundary conditions: Regular and functionally graded materials. Energy 2011, 36, 6195–6207. [Google Scholar] [CrossRef]
- Alic, F. Transient Entropy Generation Analysis of Liquid vortex Isolated by Hollow Heated Cylinder. Appl. Math. Model. 2017, 44, 321–335. [Google Scholar] [CrossRef]
- Chen, C.; Wang, J.; Zhao, H.; Yu, Z.; Han, J.; Chen, J.; Liu, C. Entropy Flow Analysis of Thermal Transmission Process in Integrated Energy System Part I: Theoretical Approach Study. Processes 2022, 10, 1717. [Google Scholar] [CrossRef]
- Lu, D.; Afridi, M.I.; Allauddin, U.; Farooq, U.; Qasim, M. Entropy Generation in a Dissipative Nanofluid Flow under the Influence of Magnetic Dissipation and Transpiration. Energies 2020, 13, 5506. [Google Scholar] [CrossRef]
- Alic, F. The non-dimensional analysis of nanofluid irreversibility within novel adaptive process electric heaters. Appl. Therm. Eng. 2019, 152, 13–23. [Google Scholar] [CrossRef]
- Guelpa, E.; Sciacovelli, A.; Verda, V. Entropy generation analysis for the design improvement of a latent heat storage system. Energy 2013, 53, 128–138. [Google Scholar] [CrossRef]
- Zadeh, S.M.H.; Mehryan, S.A.M.; Sheremet, M.; Ghodrat, M.; Ghalambaz, M. Thermo-hydrodynamic and entropy generation analysis of a dilute aqueous suspension enhanced with nano-encapsulated phase change material. Int. J. Mech. Sci. 2020, 178, 105609. [Google Scholar]
- Guo, Z.Y.; Zhu, H.Y.; Liang, X.G. Entransy-A Physical Quantity describing Heat Transfer Ability. Int. J. Heat Mass Transf. 2007, 50, 2545–2556. [Google Scholar] [CrossRef]
- Cheng, X.; Zhang, Q.; Liang, X. Analyses of entransy dissipation, entropy generation and entransy-dissipation-based thermal resistance on heat exchanger optimization. Appl. Therm. Eng. 2012, 38, 31–39. [Google Scholar] [CrossRef]
- Brinkman, H.C. The viscosity of concentrated suspensions and solution. J. Chem. Phys. 1952, 20, 571–581. [Google Scholar] [CrossRef]
- Pak, B.C.; Cho, Y.I. Hydrodynamic and heat transfer study of dispersed fluids with submicron metallic oxide particles. Exp. Heat Transf. 1998, 11, 151–170. [Google Scholar] [CrossRef]
- Maxwell, J.C.A. Treatise on Electricity and Magnetism; Clarendon Press: Oxford, UK, 1881. [Google Scholar]
- Yu, W.; Choi, S.U.S. The role of interfacial layers in the enhanced thermal conductivity of nanofluids: A renovated Maxwell model. J. Nanopart. Res. 2003, 5, 167–171. [Google Scholar] [CrossRef]
- Hamilton, R.; Crosser, O.K. Thermal Conductivity of Heterogeneous Two-Component Systems. Ind. Eng. Chem. Fundam. 1962, 1, 187–191. [Google Scholar] [CrossRef]
- Warrier, P.; Teja, A. Effect of particle size on the thermal conductivity of nanofluids containing metallic nanoparticles. Nanoscale Res. Lett. 2011, 6, 247. [Google Scholar] [CrossRef] [PubMed]
- Alic, F. Entransy Dissipation Analysis and New Irreversibility Dimension Ratio of Nanofluid Flow. Energies 2020, 13, 114. [Google Scholar] [CrossRef]


Disclaimer/Publisher’s Note: The statements, opinions and data contained in all publications are solely those of the individual author(s) and contributor(s) and not of MDPI and/or the editor(s). MDPI and/or the editor(s) disclaim responsibility for any injury to people or property resulting from any ideas, methods, instructions or products referred to in the content. |
© 2025 by the author. Licensee MDPI, Basel, Switzerland. This article is an open access article distributed under the terms and conditions of the Creative Commons Attribution (CC BY) license (https://creativecommons.org/licenses/by/4.0/).