Article

Pressure Change for Single- and Two-Phase Non-Newtonian Flows through Sudden Contraction in Rectangular Microchannel

by
Masaki Toshimitsu
1,
Yukihiro Yonemoto
2,* and
Akimaro Kawahara
2,*
1
Department of Mechanical and Mathematical Engineering, Graduate School Science and Technology, Kumamoto University, 2-39-1, Kurokami, Chuo-ku, Kumamoto 860-8555, Japan
2
Advanced Thermal and Fluid Energy System, Division of Industrial Fundamentals, Faculty of Advanced Science and Technology, Kumamoto University, 2-39-1, Kurokami, Chuo-ku, Kumamoto 860-8555, Japan
*
Authors to whom correspondence should be addressed.
Fluids 2021, 6(12), 440; https://doi.org/10.3390/fluids6120440
Submission received: 19 November 2021 / Revised: 3 December 2021 / Accepted: 6 December 2021 / Published: 7 December 2021
(This article belongs to the Special Issue Advances in Multiphase Flow Science and Technology)

Abstract

:
The flow characteristics of the single-phase liquid and the gas–liquid two-phase flows including the Newtonian and non-Newtonian liquids were experimentally investigated in a horizontal rectangular micro-channel with a sudden contraction—specifically the pressure change across the contraction. The rectangular cross-sectional dimension has Wu × Hu (width × height) = 0.99 × 0.50 mm2 on the upstream side of the contraction and Wd × Hd = 0.49 × 0.50 mm2 on the downstream side. The resulting contraction ratio, σA (=Wd/Wu), was 0.5. Air was used as the test gas (in the case of the gas–liquid two-phase flow experiment), distilled water and three kinds of aqueous solution, i.e., glycerin 25 wt%, xanthangum 0.1 wt% and polyacrylamide 0.11 wt% were used as the test liquid. The pressure distribution in the flow direction upstream and downstream of the channel was measured. The pressure change and loss at the sudden contraction were determined from the pressure distribution. In addition, the pressure change data were compared with the calculation by several correlations proposed by various researchers as well as a newly developed correlation in this study. From the comparisons, it was found that calculations by the newly developed correlations agreed well with the measured values within the error of 30%.

1. Introduction

Thermo-fluid devices and blood circulatory systems contain flow channels of various cross-sections, e.g., circular and rectangular, as well as various types of geometrical singularities, such as abrupt flow area changes (sudden contractions, sudden expansions and bends, branches, etc.). Gas–liquid two-phase mixtures passing through the contractions and the expansions are seen in piping connections as well as are relevant to many applications such as chemical reactors, power generation units, heat exchangers, and petrochemical plants [1]. With the progress of advanced micromachining technology, devices have been miniaturized and the use of micro-devices has become widespread, e.g., micro-reactors [2], mobile-type fuel cell [3], and micro-heat exchangers [4]. Thus, it is essential for the development and the design of the micro-devices to know the characteristics of the single-phase flow and the two-phase flow across the singularities [5,6].
Flow area change, i.e., sudden contraction and expansions might cause flow separation at the sharp edge. The separation might induce the flow pattern change and affect the mass transfer performance. For example, since the flow is often laminar in the microchemical reactor, the flow parameters, which are bubble length, liquid slug length, and liquid film thickness around the bubbles, are changed by utilizing the sudden contraction and expansion to promote the reaction. In the microchemical reactors, many non-Newtonian fluid flows are frequently observed. Therefore, the knowledge of the single-phase and two-phase hydrodynamic properties of non-Newtonian fluids that pass through singularities at micro- and/or mini-scales is required to create even micro-reactors with an even higher performance. However, the flow characteristics of non-Newtonian fluids passing through singularities in a microchannel are not always fully understood, compared to Newtonian flow in micro- and mini-channels [1,5,6,7,8,9]. In addition, although numerical simulations precede the research on the flow in the microchannel, e.g., [10,11], there are insufficient data to be compared with the simulation results, and it is desired to construct a database on the non-Newtonian flow through micro-singularities as well as in the straight microchannels, e.g., [12,13].
Among flow parameters, the determination of the pressure loss produced by the singularities is of considerable importance in the design of the piping system. Table 1 shows previous studies investigating the pressure drop for two-phase flow through sudden contraction in a channel with a relatively small characteristic diameter. Abdelall et al. [5] and Chalfi et al. [6] experimentally investigated the pressure change due to sudden contraction from the experiment of the air-distilled water system in the circular cross-sectional flow channel. Chen et al. [7,8] conducted experiments on an air-distilled water system in which the flow suddenly contracted from a rectangular cross-section flow channel to a circular cross-sectional one and measured the pressure drop in the contraction section. Kawahara et al. [9] conducted the experimental investigations on gas–liquid two-phase flows through a sudden contraction in rectangular microchannels. Two rectangular microchannels with different contraction ratios were used. The widths of the wide channels upstream of the contraction were 0.53 or 0.78 mm (0.230 mm in height), while those of the narrow ones downstream were fixed at 0.270 mm (0.230 mm in height). Distilled water, ethanol 49 wt% aqueous solution, pure ethanol and hydrofluoroether (HFE)-7200 were used as the test liquids, and nitrogen was used as the test gas. In these previous studies, no studies investigated the two-phase flow of non-Newtonian liquids through sudden contraction placed in channels of 1 mm or less. In this connection, the purpose of this study was to experimentally investigate the pressure drop of single-phase non-Newtonian liquid and two-phase gas and non-Newtonian liquid flows across the sudden contraction in a horizontal rectangular microchannel and compare it with Newtonian liquids. Two kinds of polymer aqueous solutions which exhibit shear thinning behavior with elasticity, were used as the non-Newtonian liquid. Data on the pressure drop due to the contraction for single-phase and two-phase flows were obtained and analyzed. In addition, several correlations for predicting the pressure drop were validated against the present data.

2. Experiments

2.1. Test Apparatus

Figure 1 shows a schematic diagram of the present channel made of two transparent acrylic resin plates. As shown in Figure 1a, a rectangular channel groove with a sudden contraction was machined on one of the two plates by an end mill. The channel with the rectangular cross-section was constructed by covering the plate with a groove and the other flat plate with an upper plate. Table 2 shows the cross-sectional dimensions of the channel. Here, W and H are the width and the height of the channel in the upstream or downstream of the contraction and DH is the hydraulic diameter. σA is the contraction ratio (=Ad/Au: area ratio of the downstream to upstream). The channel has three ports. The ports #1 and #2 were liquid and gas inlets, respectively. Thus, two phases were supplied through a T-junction type gas–liquid mixer. Port #3 was the gas–liquid mixture outlet to atmosphere. Pressure taps #P1—P2 were connected to calibrated pressure transducers. The distance between the ports and the pressure taps is shown in Figure 1b.
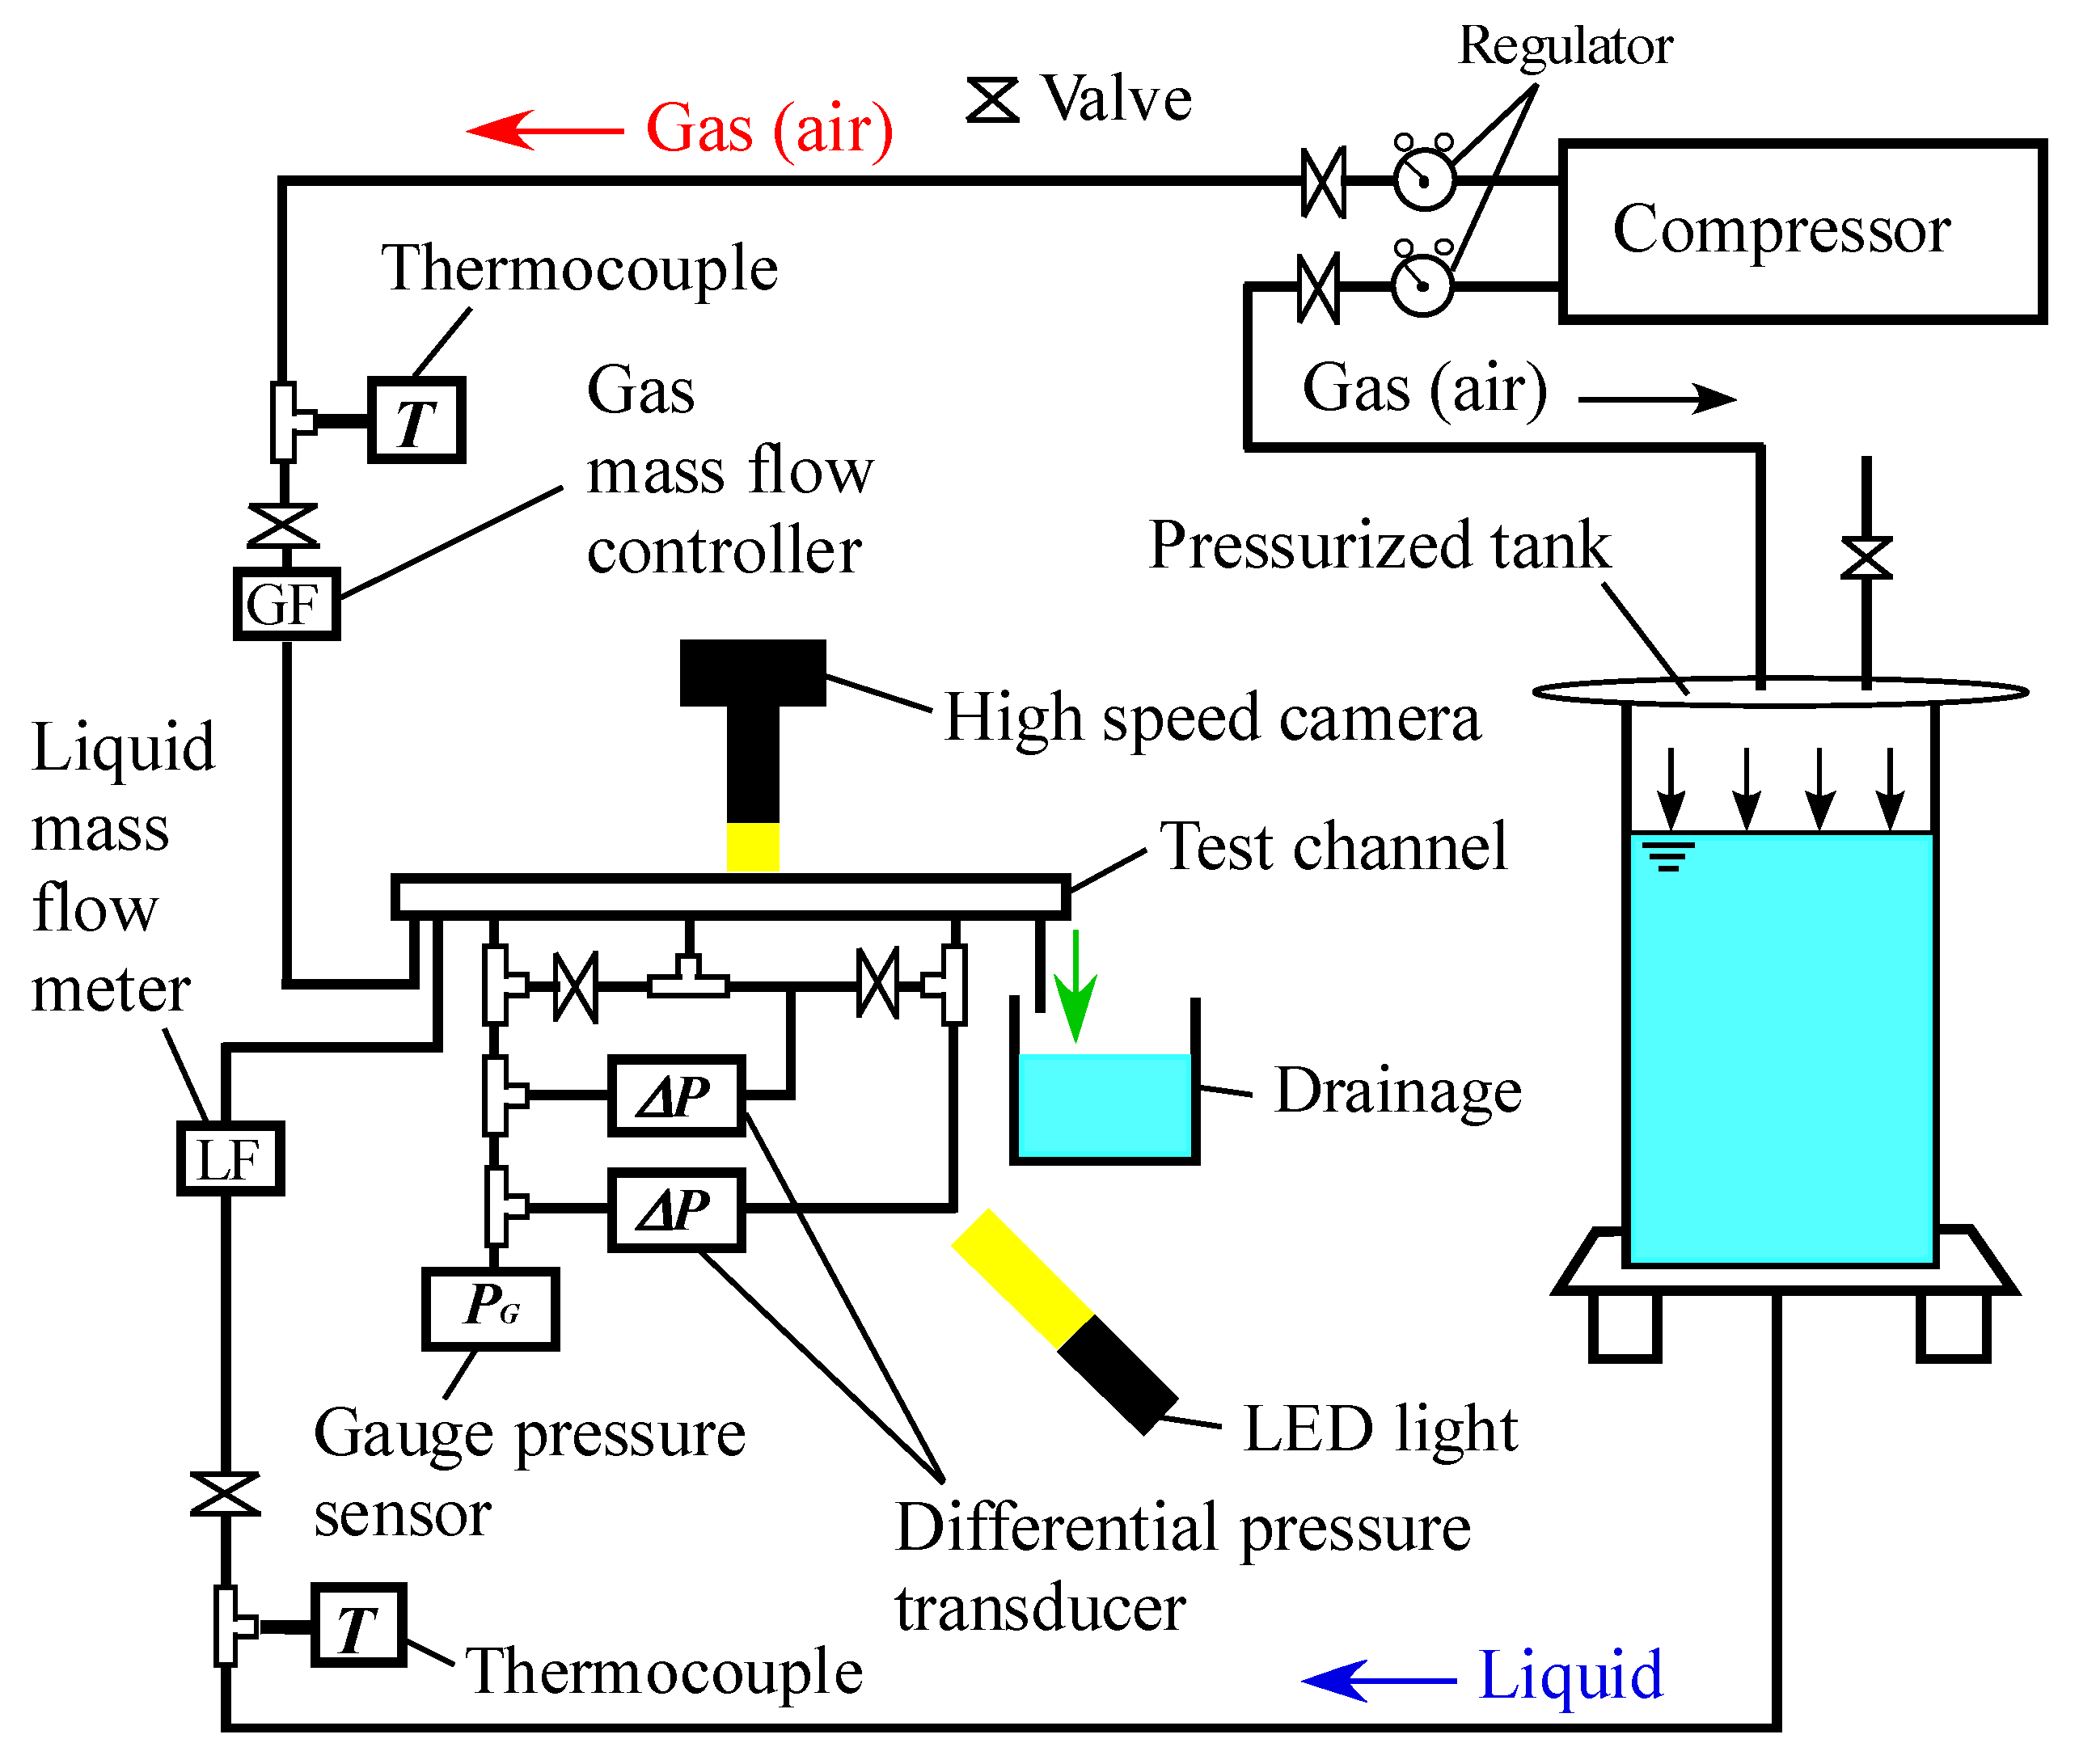
Figure 2 shows the present test apparatus. As the test fluids, distilled water and aqueous solutions of glycerin and polymer (see Section 2.2) were used for the liquid phase, while air was used for the gas phase. The liquid was introduced into a horizontal, rectangular channel by a pneumatic-type pump. The pump consisted of a pressure tank containing one of the test liquids and a compressor for pushing the liquid surface in the tank. This pump gave a stable and pulsation-free liquid flow. All tubing and fittings were made of stainless steel or brass to prevent any volumetric expansion in the flow loop and fluid leakage by a high pressure. A gas and liquid mixture made at a mixer flowed through the test channel and discharged to the atmosphere. The liquid flow rate was preliminarily monitored with a liquid flow meter (200 CCM, FD-SS02A, Keyence, Osaka, Japan) determined by weighing the liquid discharged in a small container over a sufficient period of time with an electronic balance (320 ± 0.001 g, Mettler Toledo, Tokyo, Japan). The gas flow rate was read from a calibrated mass flow meter (200 SCCM, Type HM5141B07AS, Tokyo Keiso Co., Ltd., Tokyo, Japan). The two-phase flows were observed with a high-speed video camera (Hi-Dcam PCI 8000S, NAC Image Technology, Tokyo, Japan) in four observation areas in Figure 1, i.e., Section 1 (Mixer), Section 2 (upstream), Section 3 (contraction), and Section 4 (downstream).

2.2. Test Liquids and Flow Conditions

In this study, distilled water and an aqueous solution of 25 wt% glycerin (abbreviation, GL25%) were used as the Newtonian liquid, and two aqueous solutions of 0.1 wt% xanthan gum (XG) and 0.11 wt% polyacrylamide (PAM) as non-Newtonian liquid. XG 0.1 wt% and PAM 0.11 wt% are pseudoplastic fluids whose apparent viscosity decreases as the shear rate increases. In addition, XG 0.1 wt% has strong pseudoplasticity, and PAM 0.11 wt% has weak pseudoplasticity but strong elasticity [14,15,16]. Table 2 shows the physical properties of each test liquid. ρL and σL are the density and surface tension, respectively. The viscosity of the test liquids is given by the power-law model:
τ = K ( d u d y ) n
where τ is the wall shear stress, K is the consistency coefficient, n index is the flow index, and du/dy is the shear rate. By a capillary method [17], i.e., measuring the single-phase liquid pressure drop across the test section, the K and n index for the working liquids were determined and shown in Table 3. In the measurement, the liquid temperature ranges from 22 to 25 °C. (du/dy)y=0 is the shear rate at the channel wall as
( d u d y ) y = 0 = a + b n n 8 u D h
a and b are the channel geometry factor [18] defined as
a + b = 3 [ 2 ( 1 + α * ) 2 { 1   192 π 5 α * m = 0 1 ( 2 m + 1 ) 5 tanh ( 2 m + 1 ) π 2 α * } ] 1
a = [ 2 ( 1 + α * ) 2 { 1 + 4 m = 0 ( 1 ) m + 1 ( 2 m + 1 2 π ) 3 1 cosh ( 2 m + 1 ) π 2 α * } ] 1
Here, the α* (=H/W) is the aspect ratio of the rectangular channel. The values of (a, b) of the present channel are (0.2437, 0.7275) for the upstream channel and (0.2122, 0.6772) for the downstream channel. Regarding viscosity, in the case of Newtonian fluid, the K value becomes viscosity, μL, because n = 1. In the case of non-Newtonian fluid, the apparent viscosity, μa, is defined as
μ a = K [ ( d u d y ) y = 0 ] n 1
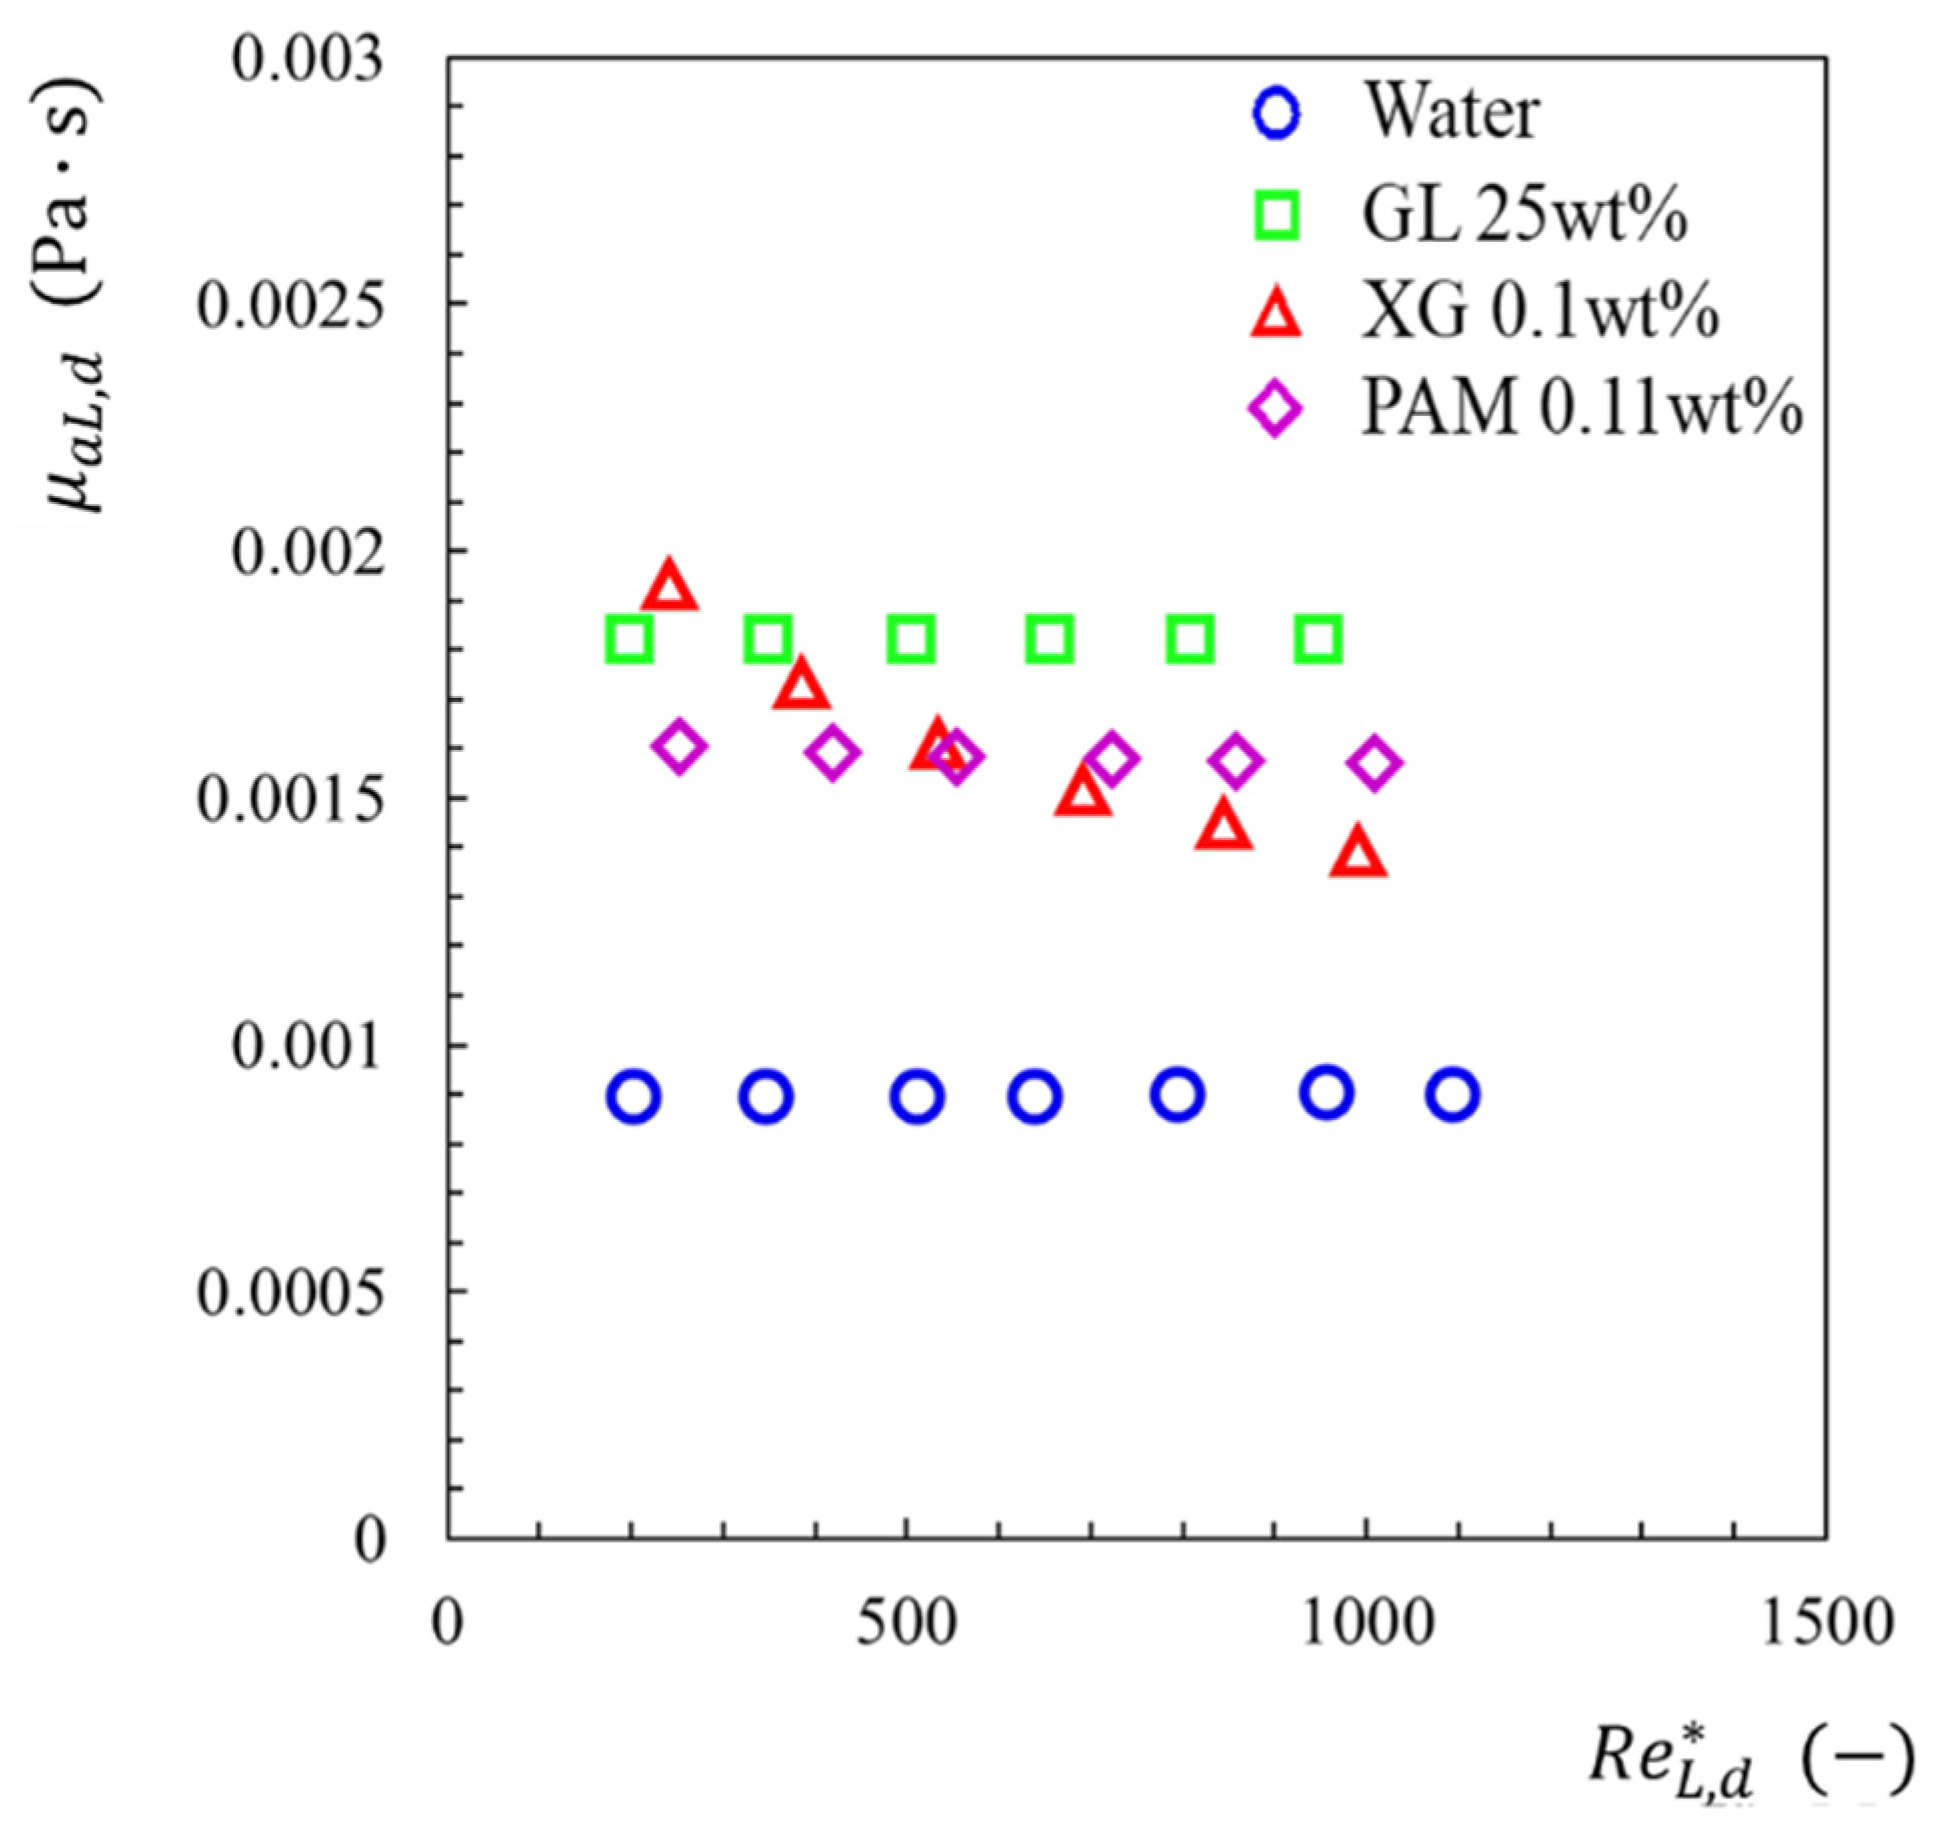
The apparent viscosities of XG 0.1 wt% and PAM 0.11 wt% under the present flow conditions were 1.50 to 2.38 mPa·s and 1.58 to 1.61 mPa·s, respectively.
Table 4 shows two-phase flow conditions. jL,d and jG,d are the volumetric flux of liquid and gas in the channel downstream of the contraction. ReL,d and ReG,d are the generalized Reynolds number [18] defined as
R e k , d * = ρ k j k , d 2 n D h , d n 8 n 1 K ( b + a b ) n
The subscript k is the phase index (k = G, gas phase; k = L, liquid phase).

2.3. Data Reduction for Pressure Change through Contraction

Figure 3 shows typical pressure distributions along the upstream and the downstream from the contraction. Figure 3a shows the pressure measured for two-phase flows at jL,d = 0.86 and jG,d = 0.87 m/s. The ordinate is the gauge pressure, while the abscissa is the distance from the contraction. To obtain experimental data on pressure change due to the contraction, ΔPC, the linear extrapolation of the axial pressure distribution was performed, and the difference of intersecting points, Pu and Pd, at the sudden contraction was estimated, as shown in Figure 3b.

3. Results and Discussions

3.1. Single-Phase Liquid Flow

3.1.1. Friction Factor in the Straight Channel

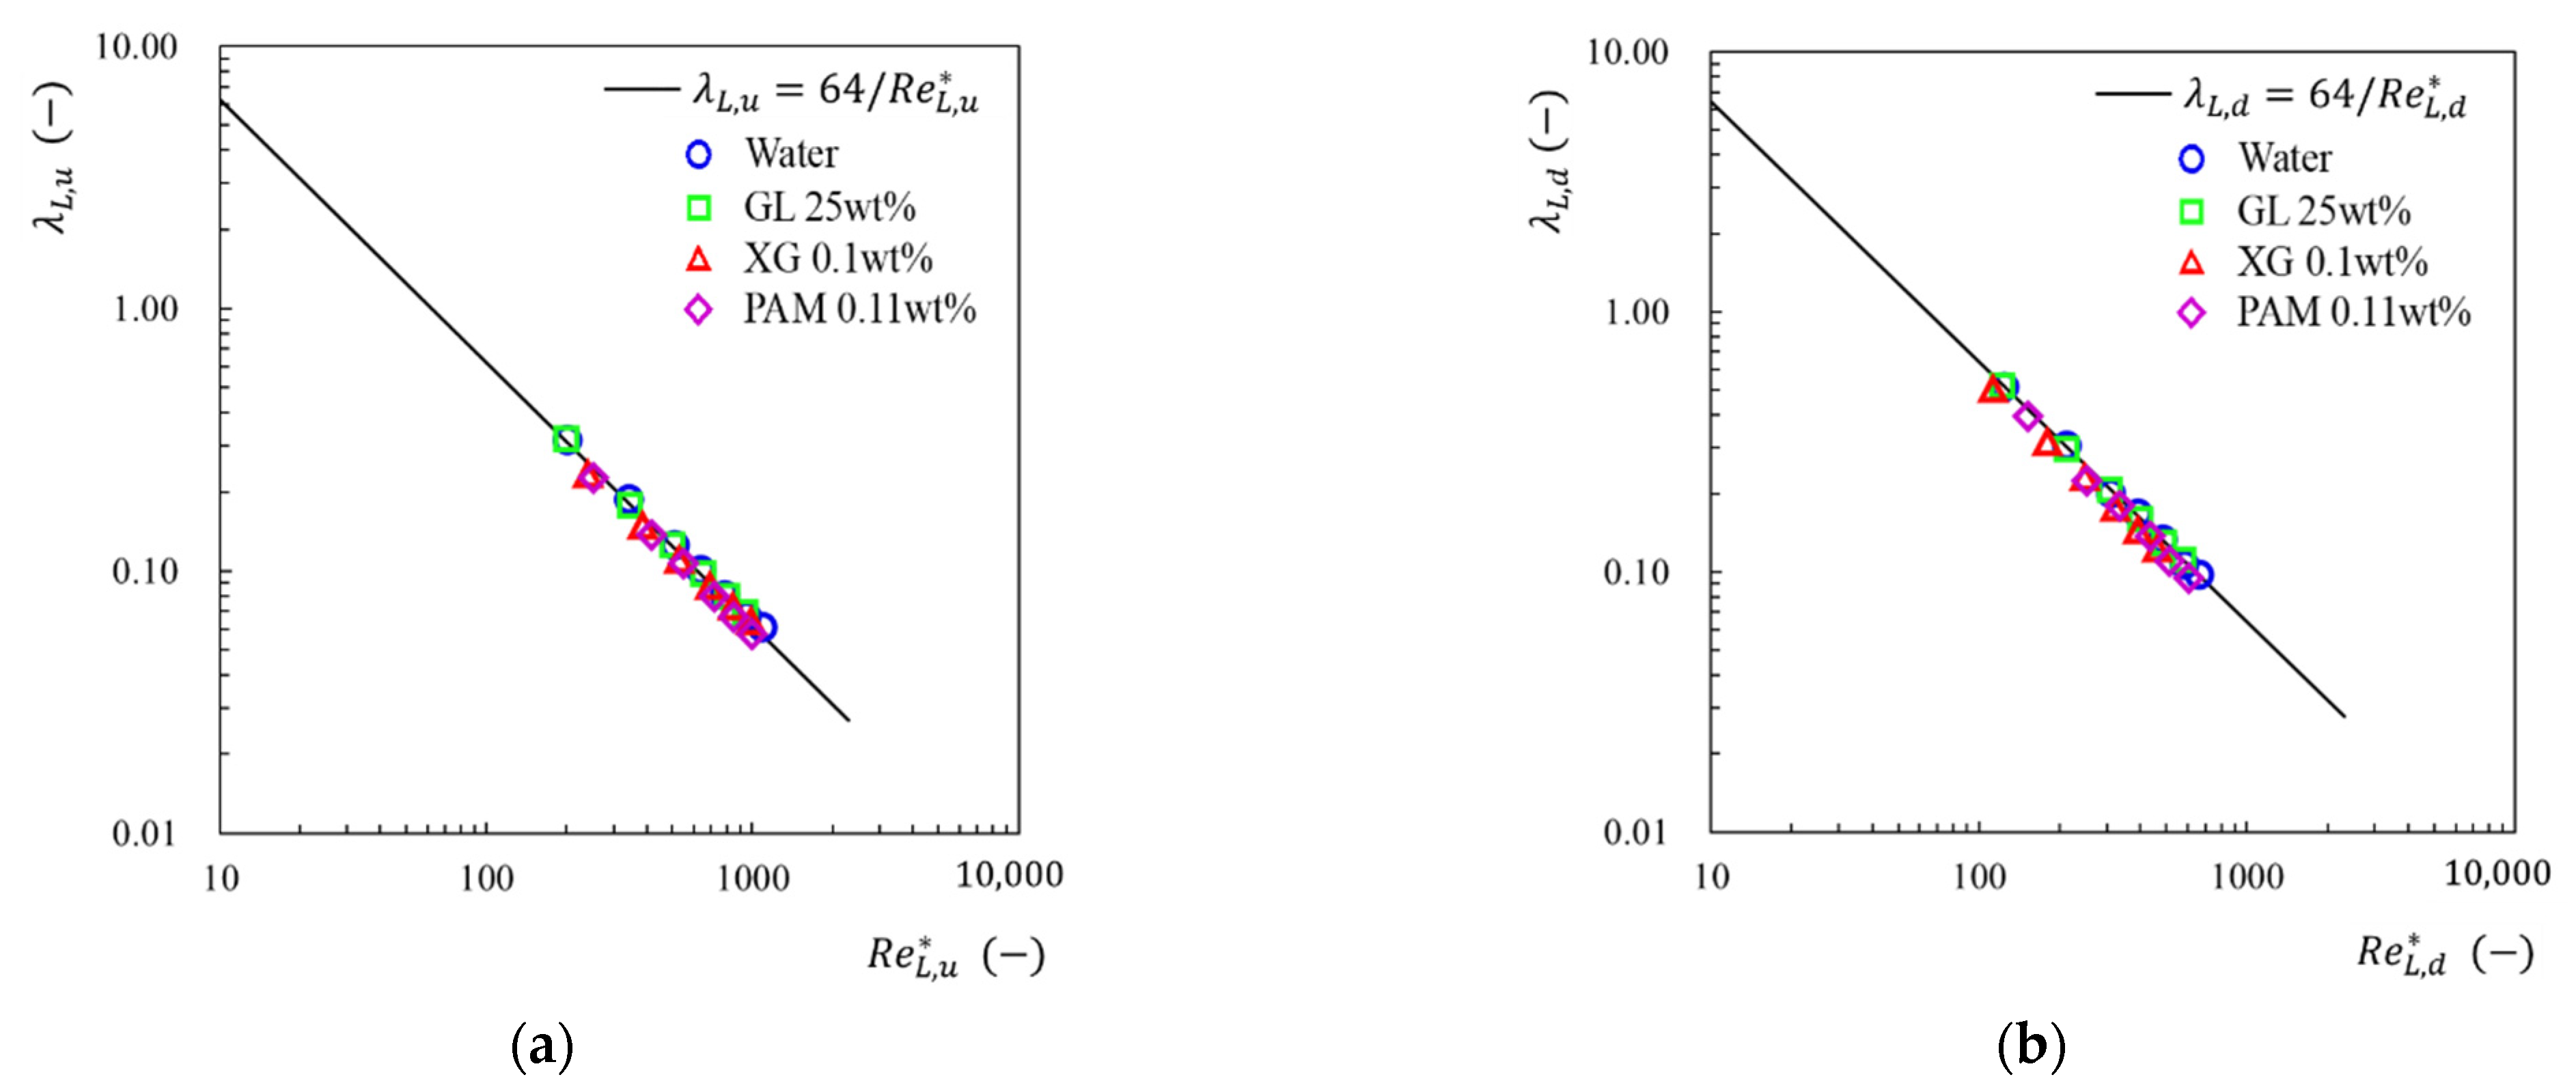
As a preliminary test to check the pressure measurement accuracy, the single-phase friction factors were determined from the upstream and the downstream fully developed pressure lines. Figure 4a,b show the Darcy friction factor data for the channels upstream and downstream of the contraction, respectively. The data are plotted against the generalized Reynolds number with a mean liquid velocity, uL (=volume flow rate/flow area), as the characteristic velocity. The solid line shows the calculation by the classical theory for laminar flow:
λ L = 64 R e L *
The calculations agree with the data within 2% root-mean-square errors for Newtonian liquids (water and glycerin aqueous solution) and 13% root-mean-square errors for non-Newtonian liquid (XG and PAM aqueous solutions).

3.1.2. Pressure Change across Sudden Contraction

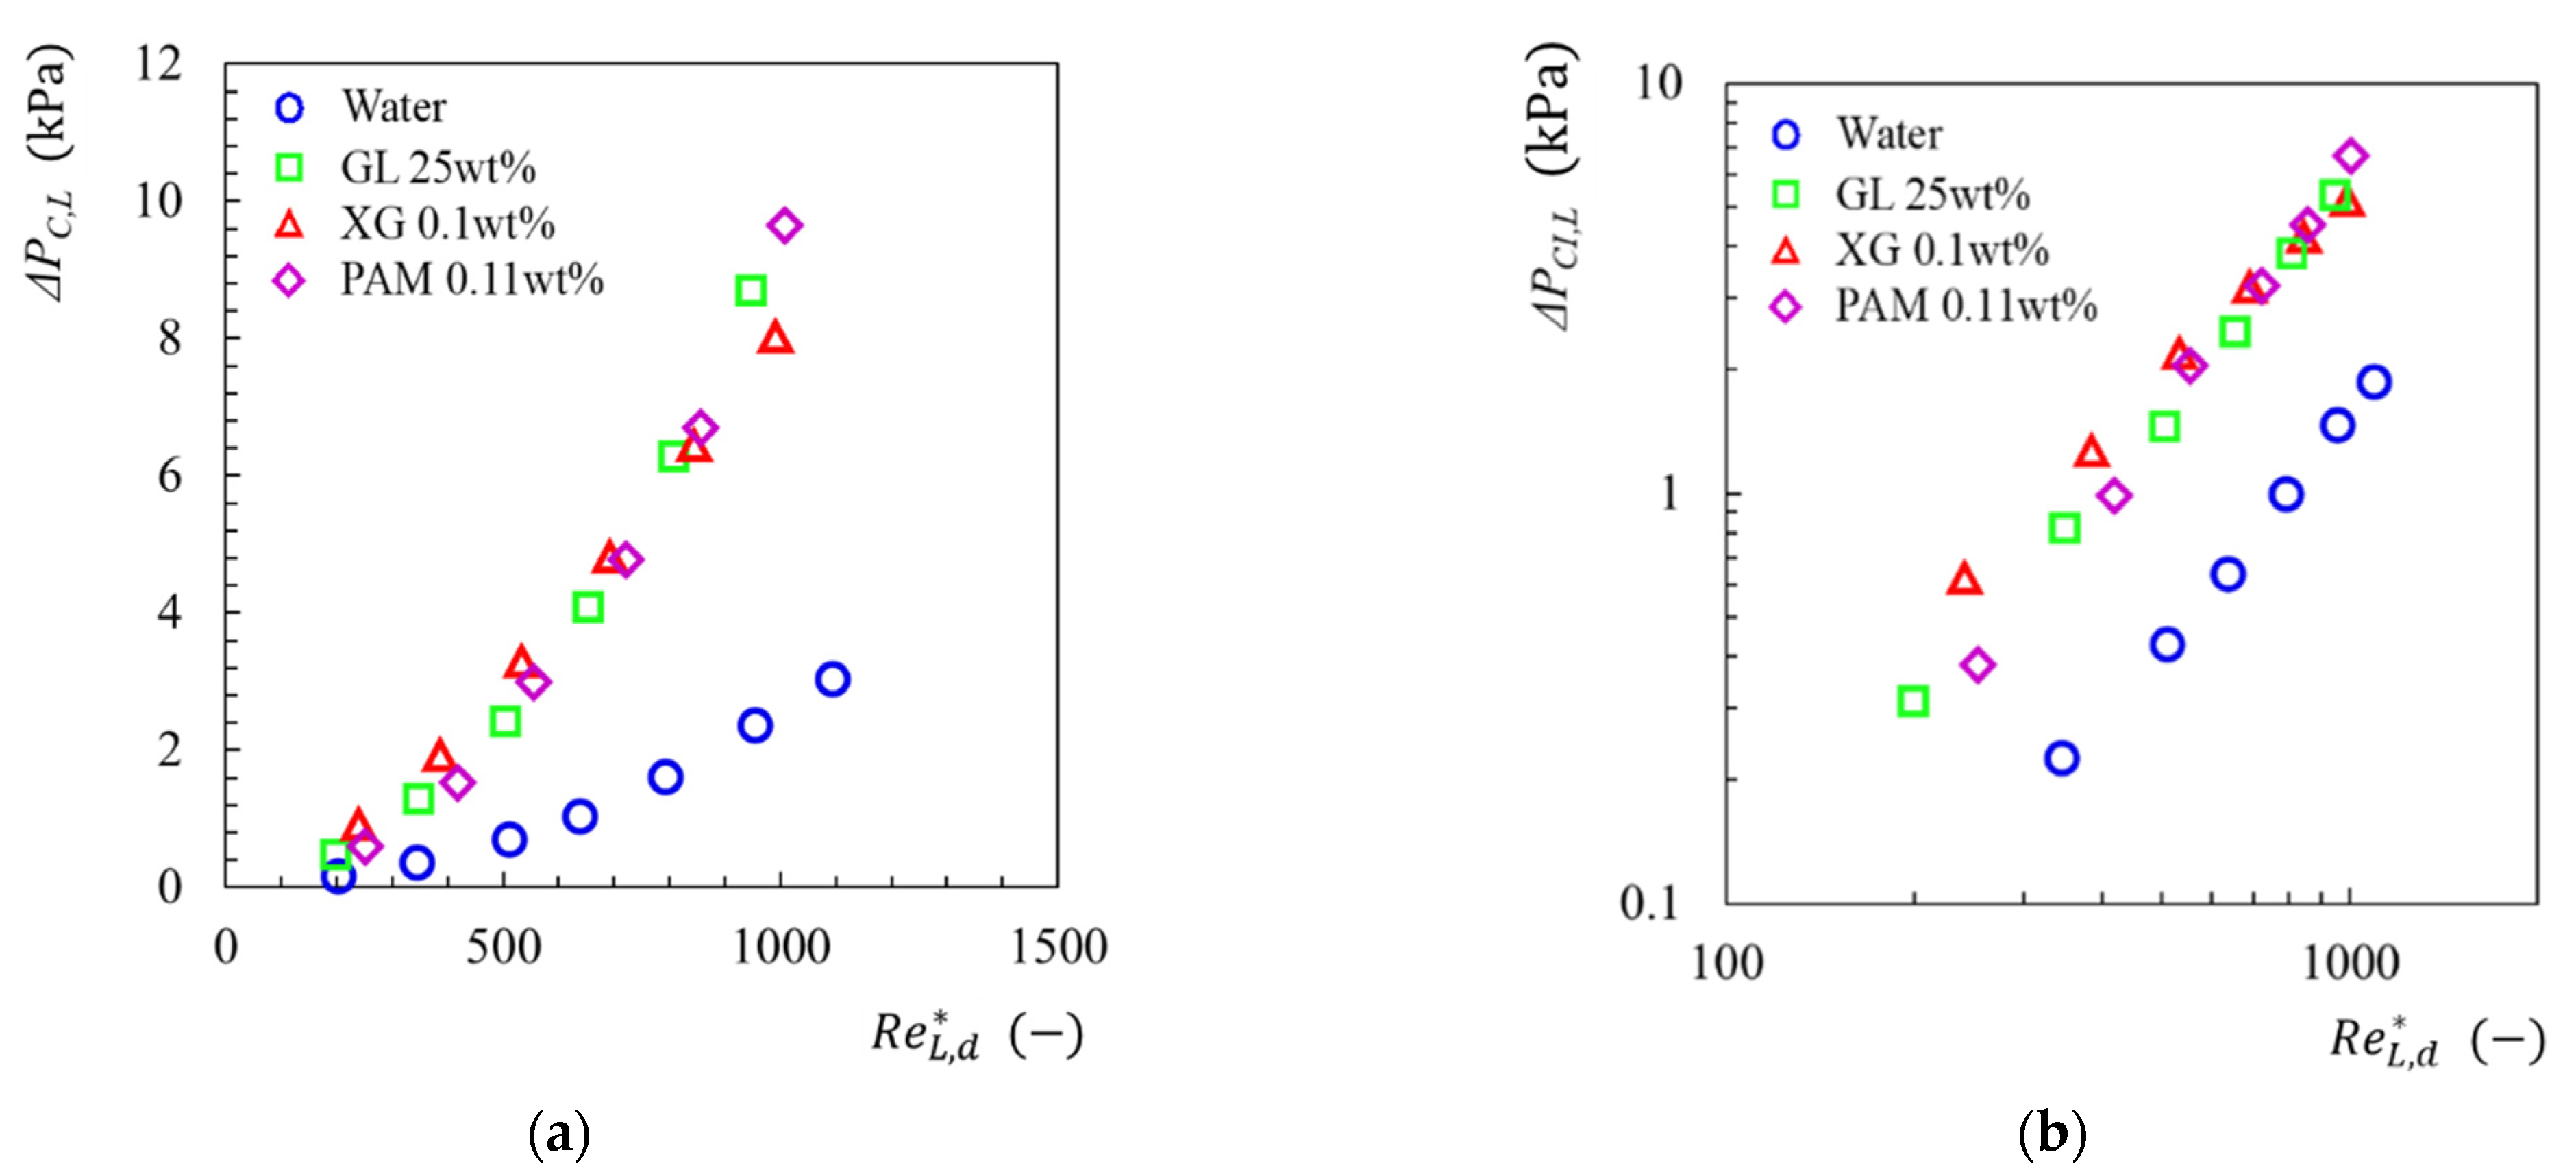
Figure 5a shows the data on the pressure change, ΔPC,L, through the contraction for single-phase liquid flows. These data are plotted against the generalized Reynolds number in the downstream channel, R e L , d * . ΔPC,L increases with the increase in the Reynolds number. The ΔPC,L consists of the reversible component, ΔPCR,L, and the irreversible one, ΔPCI,L. From the energy balance, the reversible one is given by
Δ P C R , L = ( 1 σ A 2 ) ρ L u L , d 2 2
Figure 5b shows the data on the irreversible pressure change obtained by subtracting the reversible pressure change by Equation (8) from the total pressure change data shown in Figure 5, ΔPCI,L = ΔPC,L − ΔPCR,L. ΔPCI, increases with the Reynolds number. The magnitude of the ΔPCI,L values of each test liquid at the same Reynolds number depends on an apparent viscosity of each liquid. Figure 6 shows variation in the apparent viscosity by Equation (5) over the range of the flow conditions. Comparing Figure 5b and Figure 6, it can be seen that the irreversible pressure change of the liquid with a large apparent viscosity is large for non-Newtonian liquid, i.e., XG and PAM. On the other hand, comparing the pressure change between non-Newtonian and Newtonian liquids, the pressure change Newtonian liquid is slightly larger for the Newtonian liquid than the Newtonian one, despite its lower viscosity for the non-Newtonian than Newtonian at similar viscosities. The reason for the larger pressure change is due to the elasticity having a polymer solution [14,15,16]. It is considered that this elasticity changed the energy dissipation in vena contracta.
The irreversible change, ΔPCI,L, is usually expressed by
Δ P C I , L = k C , L ρ L u L , d 2 2 = ( 1 1 C C ) 2 ρ L u L , d 2 2 ,  
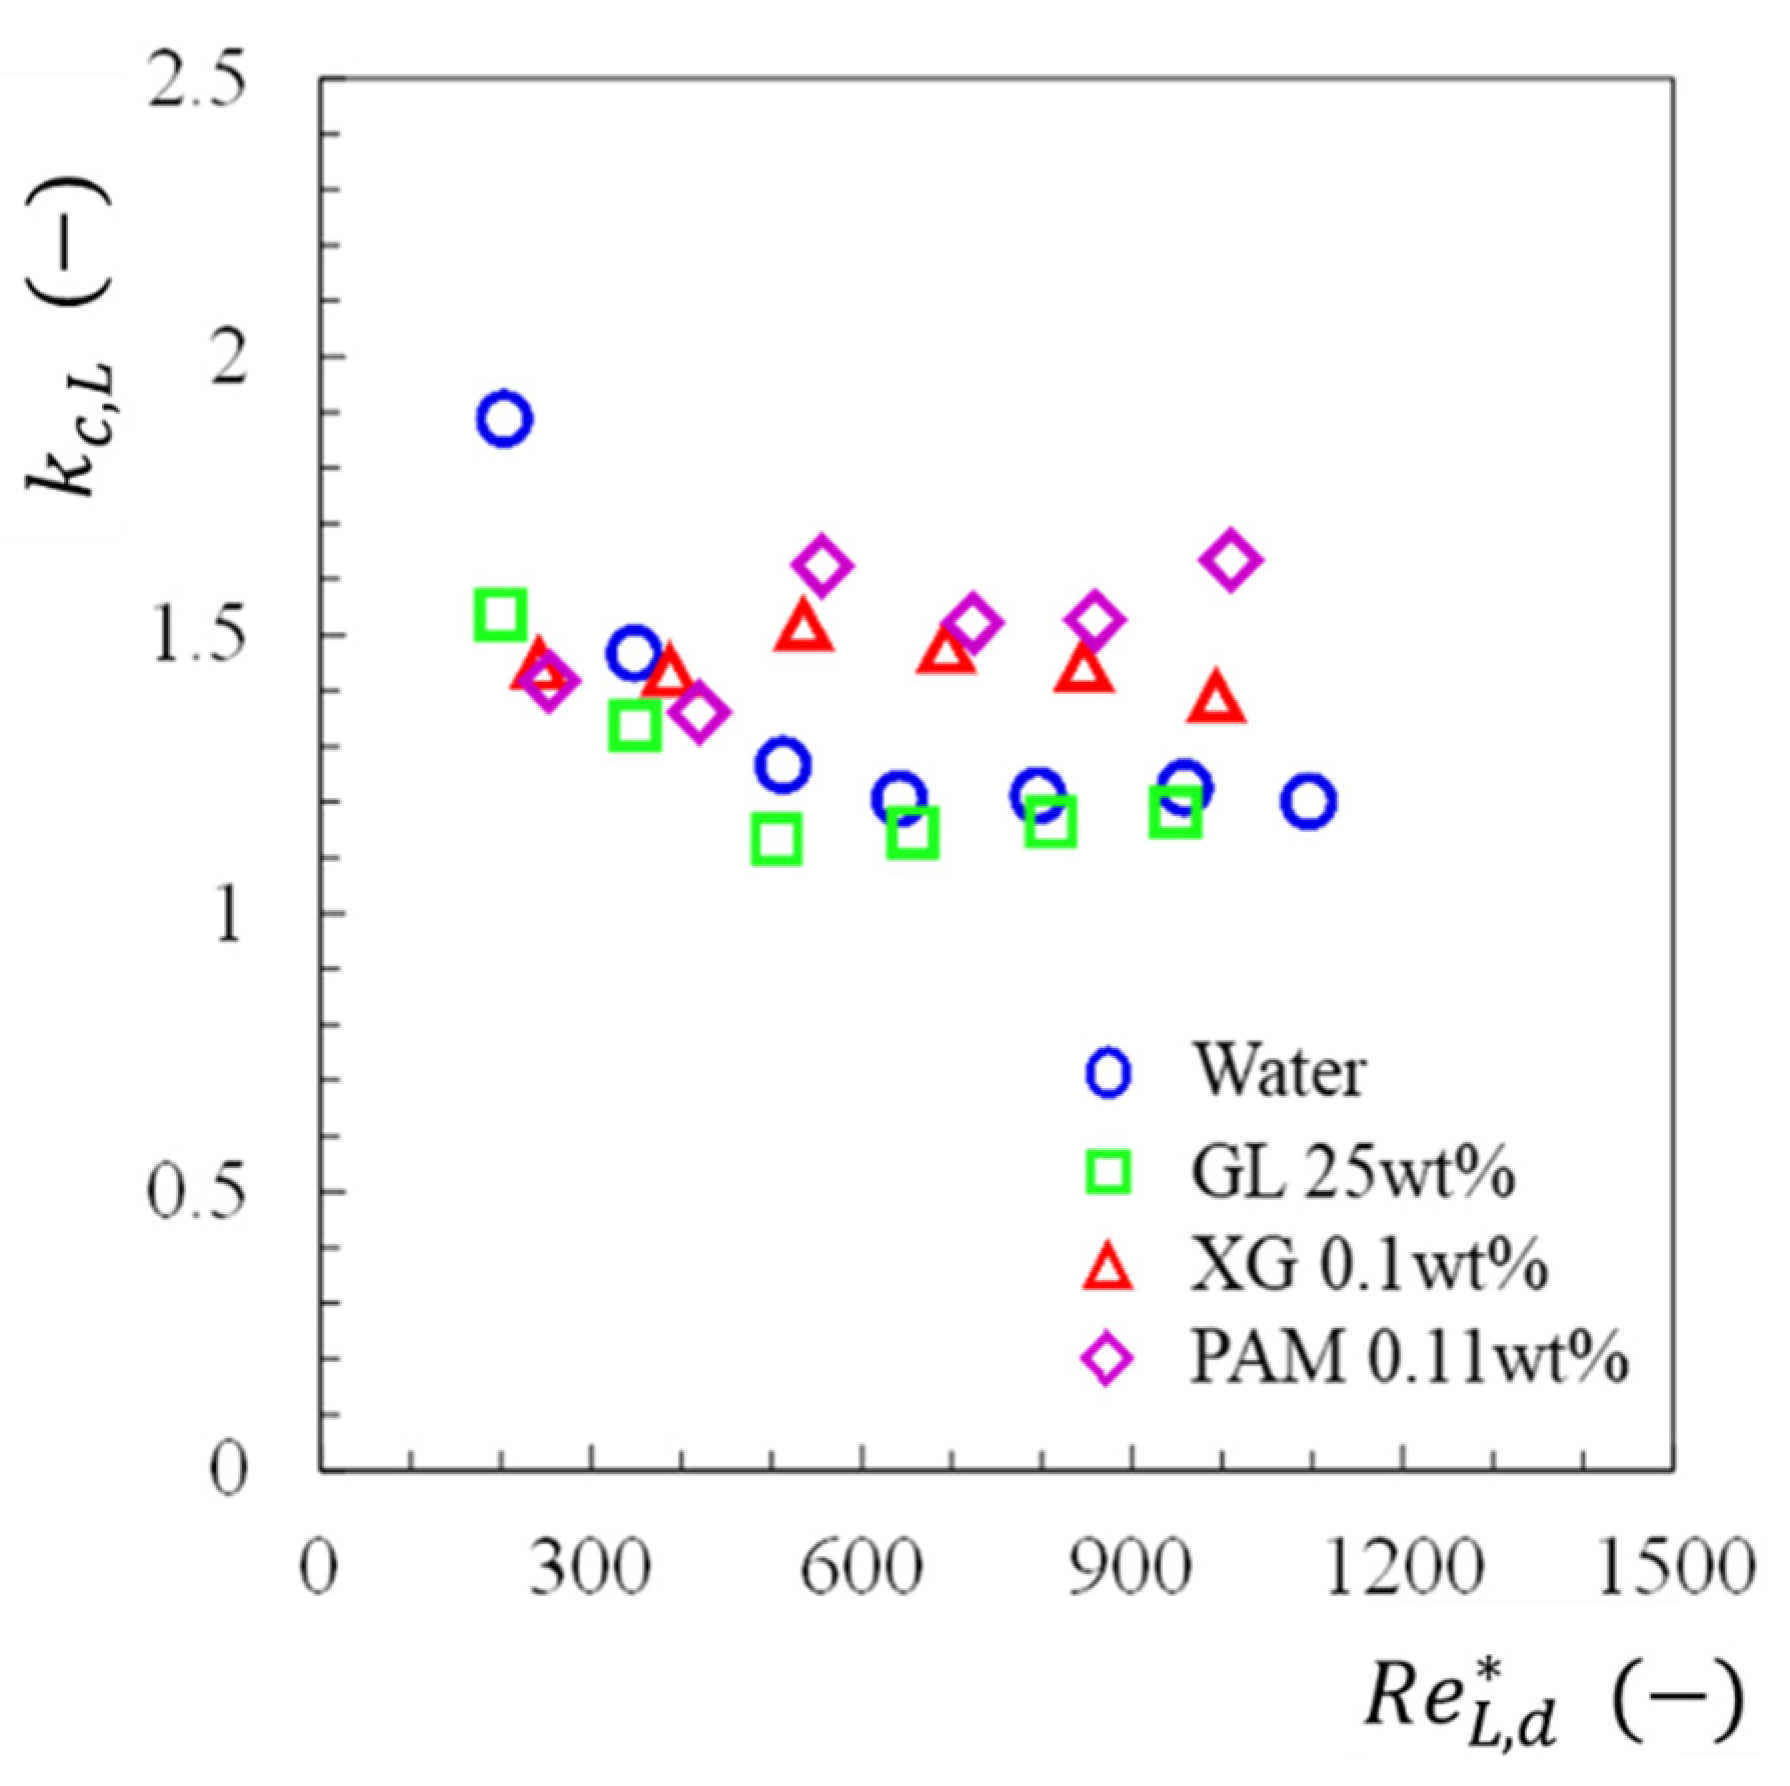
where kC,L is the contraction pressure loss coefficient and CC is the contraction coefficient which is the ratio of the cross-sectional area for vena contracta to that for the downstream channel. Figure 7 shows the data on kC,L plotted against the generalized Reynolds number downstream of the contraction. The coefficient kC,L for Newtonian liquids (water and glycerin solution) slightly depends on the Reynolds number. That is, kC,L tends to decrease and approach a constant value as the Reynolds number increases. On the other hand, the coefficient for non-Newtonian liquids (XG and PAM solutions) is almost constant regardless of the Reynolds number.
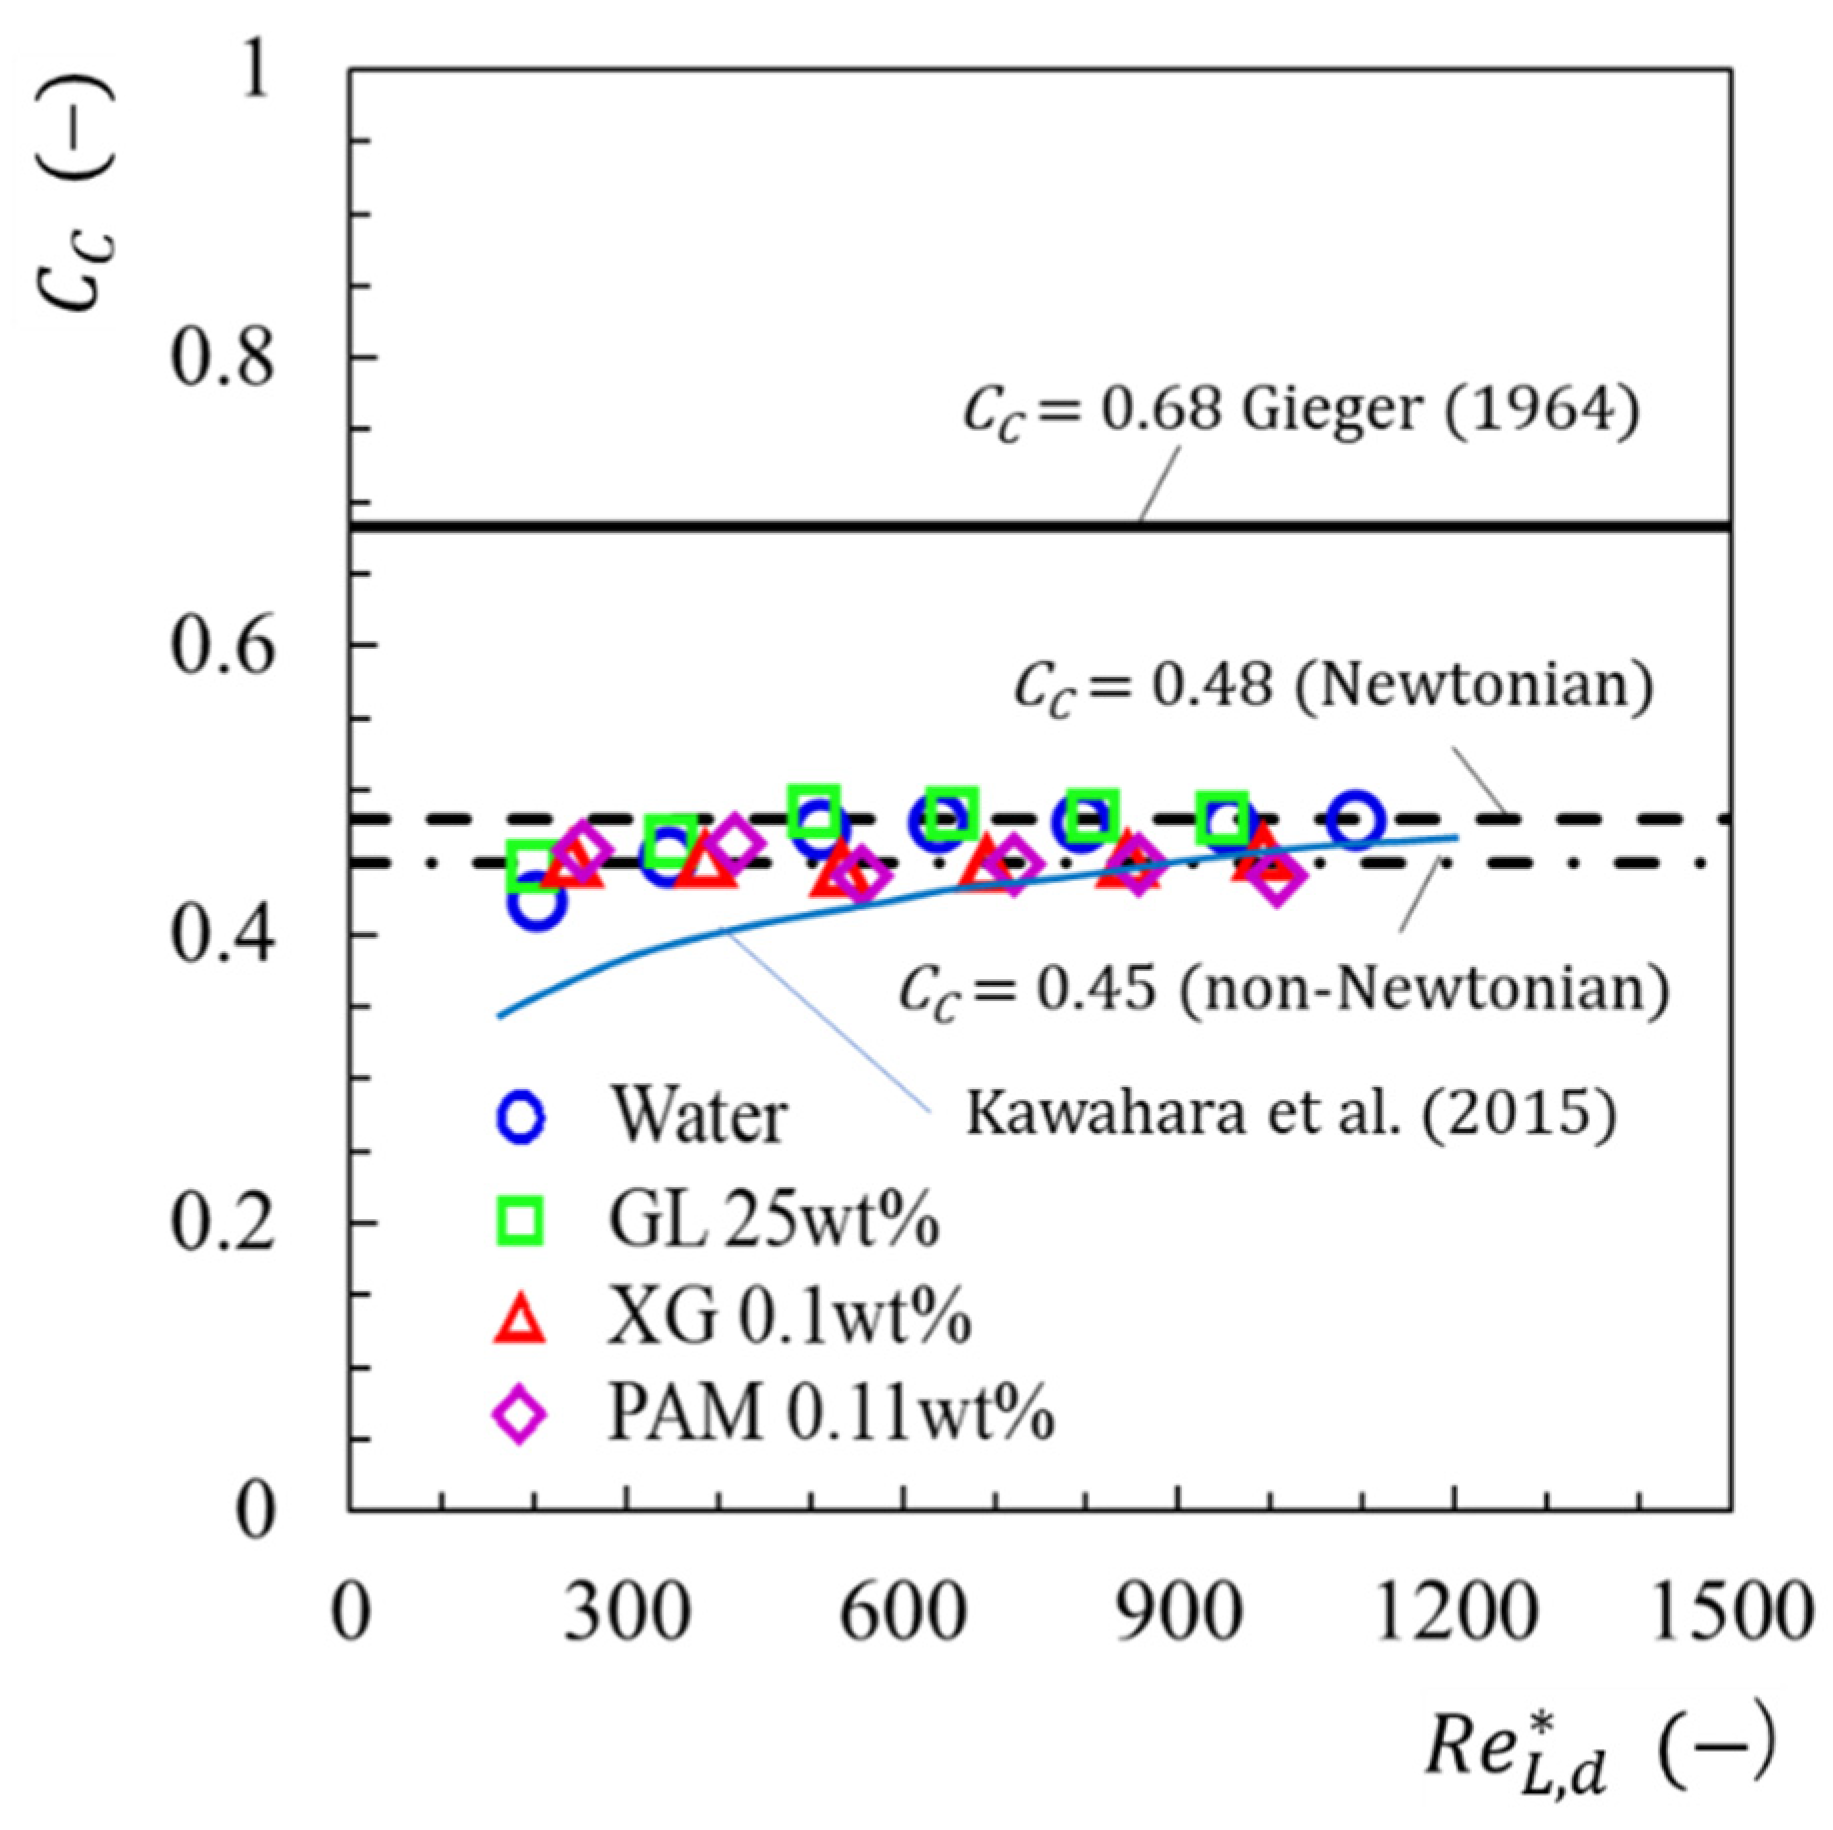
Figure 8 shows the present contraction coefficient data against the generalized Reynolds number in the downstream channel. The bold solid line shows the calculation by Geiger’s [19] correlation:
C c = 1 1 σ A 2.08 ( σ A 1 ) + 0.5731
In addition, the blue solid line is calculated by
C C = B + ( 1 B ) σ A 4.519 ,   B = 0.0645   ln R e L , d * 0.00792
Equation (11) [9] is correlated with the data obtained for micro- and/or mini-channels with two contraction ratios (σA = 0.35 and 0.5) for single-phase Newtonian liquid flows. The present CC data approach the blue solid line as the Reynolds number increases. The average value of CC within the range of this experimental condition is 0.48 for Newtonian case and 0.45 for non-Newtonian case.

3.2. Two-Phase Flow

3.2.1. Flow Pattern

Figure 9 shows a typical photo of the two-phase flow when the combination of the volumetric flux of liquid phase jL and that of gas jG for each test liquid is almost the same. The flow in Section 1 (mixer), Section 2 (upstream of contraction), Section 3 (contraction) and Section 4 (downstream of contraction) are shown in order from the photograph on the left in Figure 1. In Section 1, a photograph was selected of the moment when bubbles were generated; in Sections 2 and 4, a photograph shows the entire image of the bubbles; and in Section 3, there is a photograph in which bubbles passed approximately half of the sudden contraction part. Regarding Section 1, the bubble formation for each liquid was similar, which is the squeezing formation [20,21]. However, there was a difference in the distance between the bubble and the opposite channel wall, which was the smallest in the case of the distilled water system. The length of the generated bubbles becomes longer in the order of the XG system > distilled water system > PAM system > GL system.
Regarding Section 2, the flow regime was slug flow, in which bubbles and liquid slugs flow intermittently. Bubble flow, in which the bubble length in the flow direction is smaller than the channel width, was also observed for another jL and jG combination. The size relationship of the bubble length was the same as that of the bubble size in Section 1 if the bubble coalescence does not occur. The thickness of the liquid film around the gas bubble was in the order of GL type > PAM type > XG type > distilled water type. In addition, the shape of the bubble nose depends on the test liquids. The liquid film thickness and the shape might be related to reduce the flow resistance of the bubbles. Due to the minimization of the energy dissipation, the bubbles become thinner (smaller than the projected area of the bubble) and the bubble nose becomes sharper as the liquid viscosity increases. With the exception of the XG type, the thickness of the liquid film increases as the apparent viscosity increases. The reason why the liquid film thickness of the XG system is lower than that of the GL system and the PAM system is that the apparent viscosity of XG 0.1 wt%, which is a strong pseudoplastic fluid, is locally smaller than those apparent viscosities near the bubbles.
Regarding Section 3, the constriction of bubbles was the largest in the GL type. This is thought to be because the surface tension of GL 25 wt% is smaller than that of other liquid phases.
Regarding Section 4, the magnitude relationship of the gas bubble length was different from that of the bubble size in Section 1, and it was XG system > PAM system > GL system ≈ distilled water system. The reason for which the magnitude relationship changed compared to Section 1 is that the expansion of bubbles in the PAM system and the GL system was larger than that in the distilled water system. This is because the PAM and GL systems had a larger pressure loss than the water system, as shown in Figure 3a.

3.2.2. Two-Phase Pressure Change across Sudden Contraction

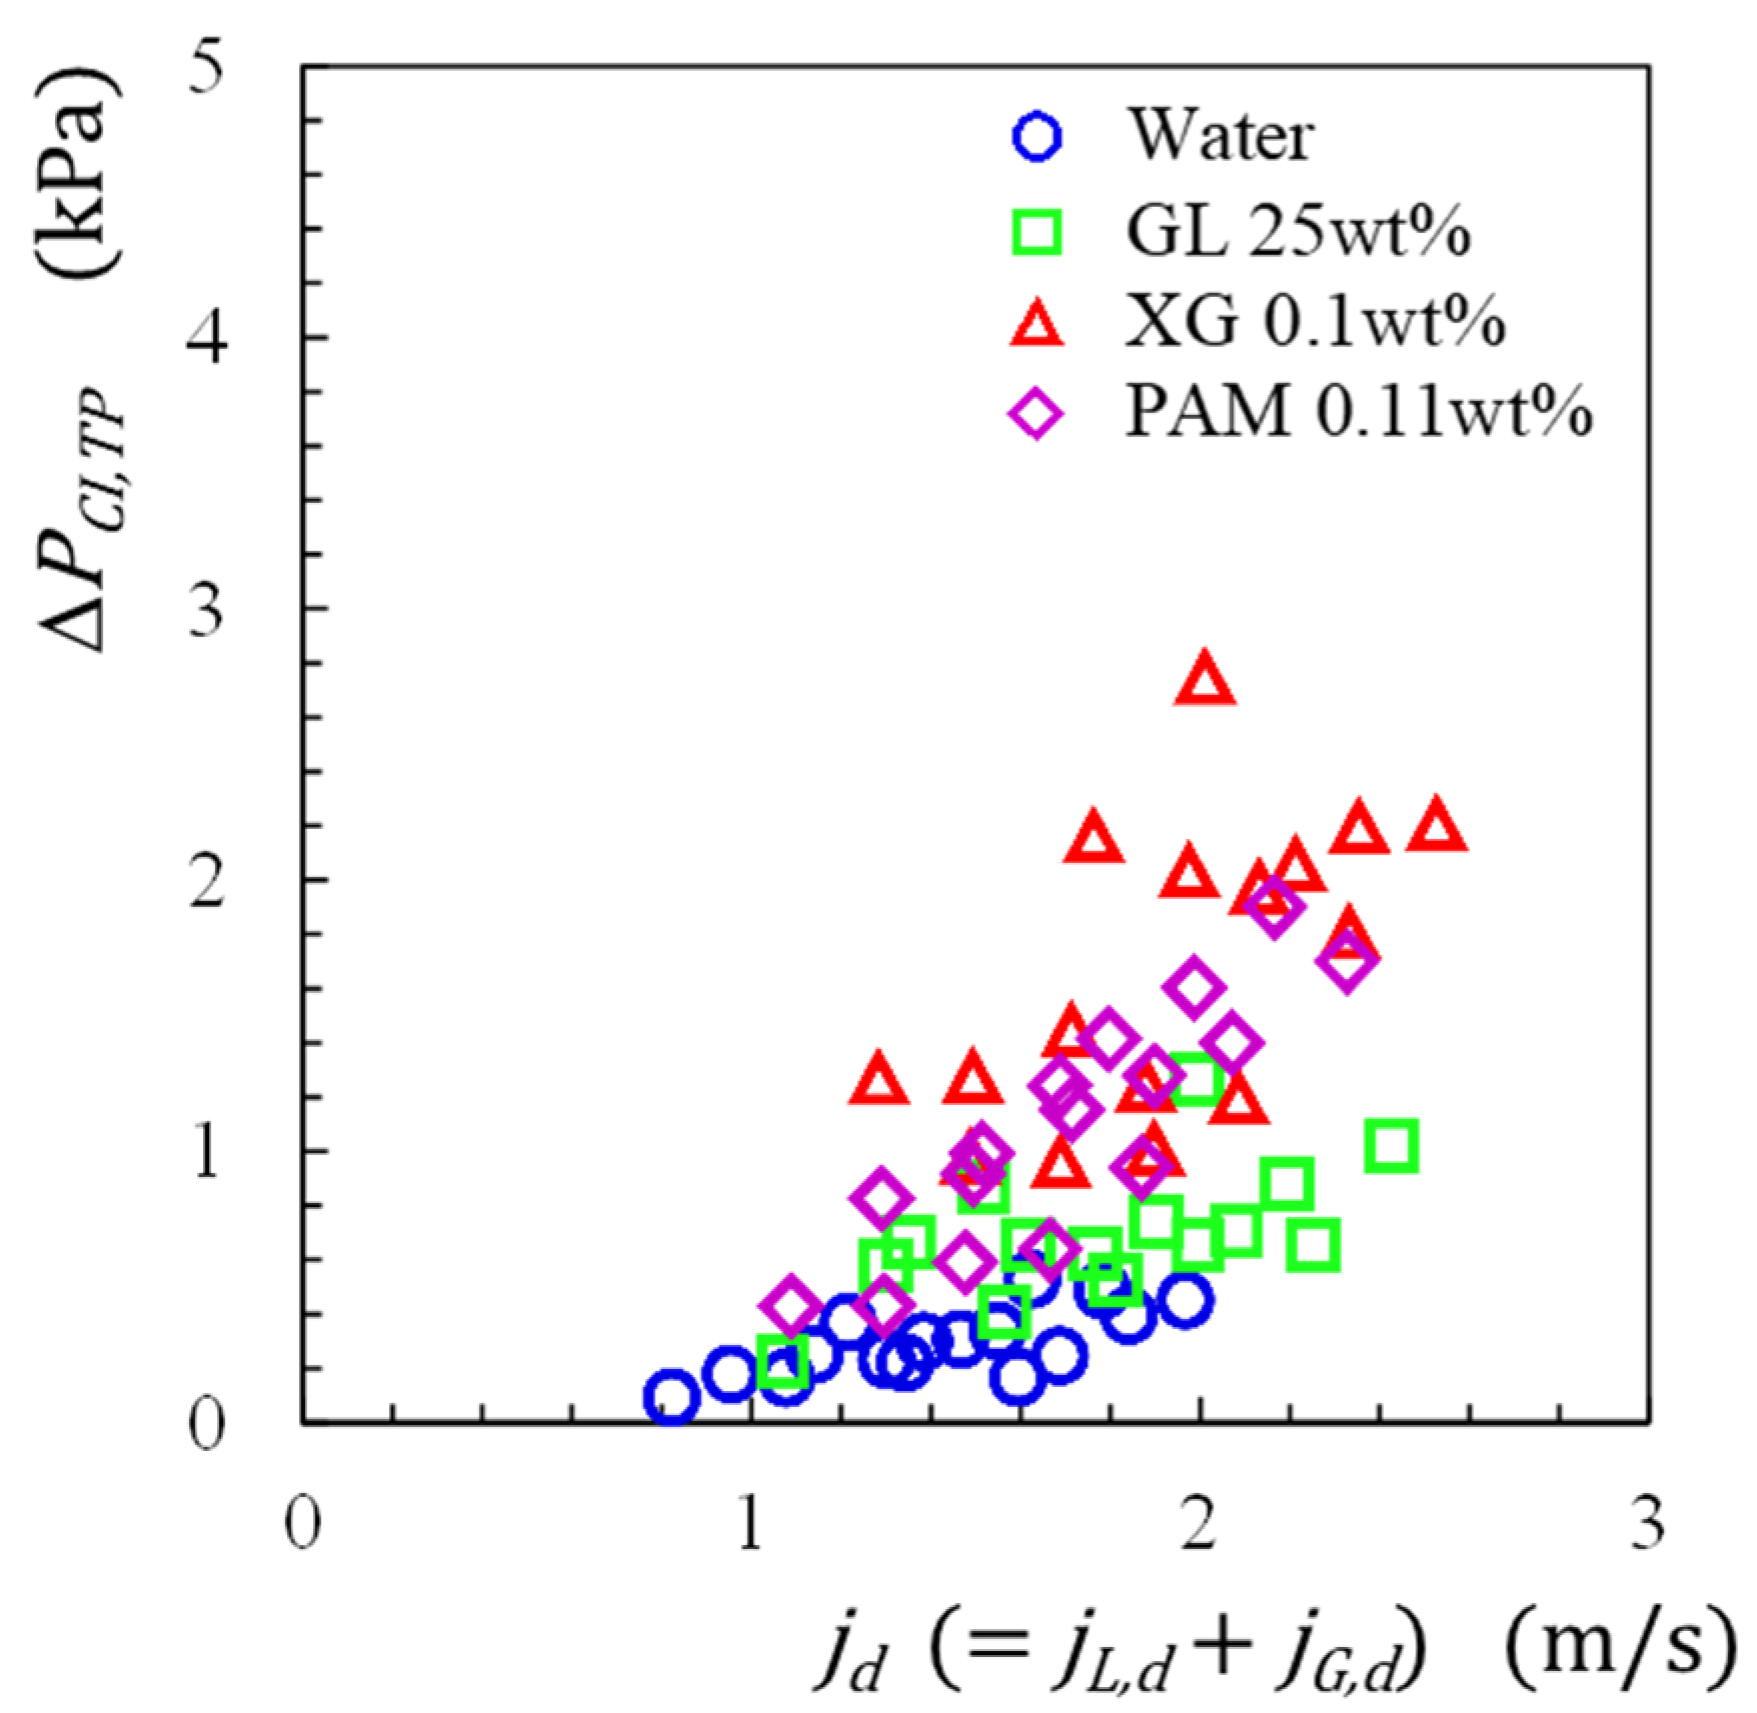
Figure 10 shows the experimental data on two-phase pressure change due to the contraction, ΔPC,TP. The data are plotted against the total volumetric flux, jd (=jG,d + jL,d), in the downstream of the contraction. The ΔPC,TP value increases with the total volumetric flux. Focusing on the magnitude relationship of ΔPC,TP of each gas–liquid system in the same jd, the order of magnitude was XG system > PAM system > GL system > distilled water system.

3.2.3. Correlation of Two-Phase Pressure Change

The present experimental data for ΔPC,TP were compared with models and/or correlations in the literature, i.e., those of Chisholm [22], Collier–Thome [23], Schmidt–Friedel [24], and Abdelall et al. [5]. The Chisholm and Collier–Thome correlations were based on homogeneous flow models. Regarding the correlation of Abdellal et al., the predicted values were evaluated on the basis of two approaches [5]. One was based on the slip flow model (type A) and the other one was based on the two-phase multiplier with the Martinelli factor (type B). Table 5 shows the comparison results with the mean and root-mean-square errors. Among three correlations, the calculation by Collier–Thome correlation agrees with the experimental data for the Newtonian liquid with 30% root-mean-square error. On the other hand, the calculation by Abdelall et al. agrees with the experimental data for the non-Newtonian liquid with 20–30% root-mean-square error.
As a trial, another correlation was developed for predicting two-phase pressure change. The pressure change, ΔPC,TP., was assumed to be the sum of reversible and irreversible changes, ΔPCR,TP and ΔPCI,TP, as follows:
Δ P C , T P = Δ P C R , T P + Δ P C I , T P
Based on the energy balance, ΔPCR,TP is expressed as
Δ P C R , T P = 1 2 [ ρ G α u G 2 + ρ L ( 1 α ) u L 2 ] d 1 2 [ ρ G α u G 2 + ρ L ( 1 α ) u L 2 ] u
Here, α is the void fraction, uG and uL are the mean velocity of gas and liquid phases. The subscripts “u” and “d” represent the values for upstream and downstream channels. The experimental data on the irreversible change, ΔPCI,TP, was determined from the experimental data for ΔPC,TP by subtracting the reversible change, ΔPCR,TP, calculated by Equation (13). The value of the void fraction was obtained by substituting the experimental value of the bubble velocity measured in upstream or downstream channel into the following equation:
α = u G j G
Figure 11 shows the two-phase irreversible change due to the contraction determined. The ΔPCI,TP values increase with increase in the total volumetric flux, jd.
In the present study, the two-phase pressure loss coefficient due to the contraction, kCI,TP, is defined as
Δ P C I , T P = k C I , T P 2 [ ρ G α u G 2 + ρ L ( 1 α ) u L 2 ] d .
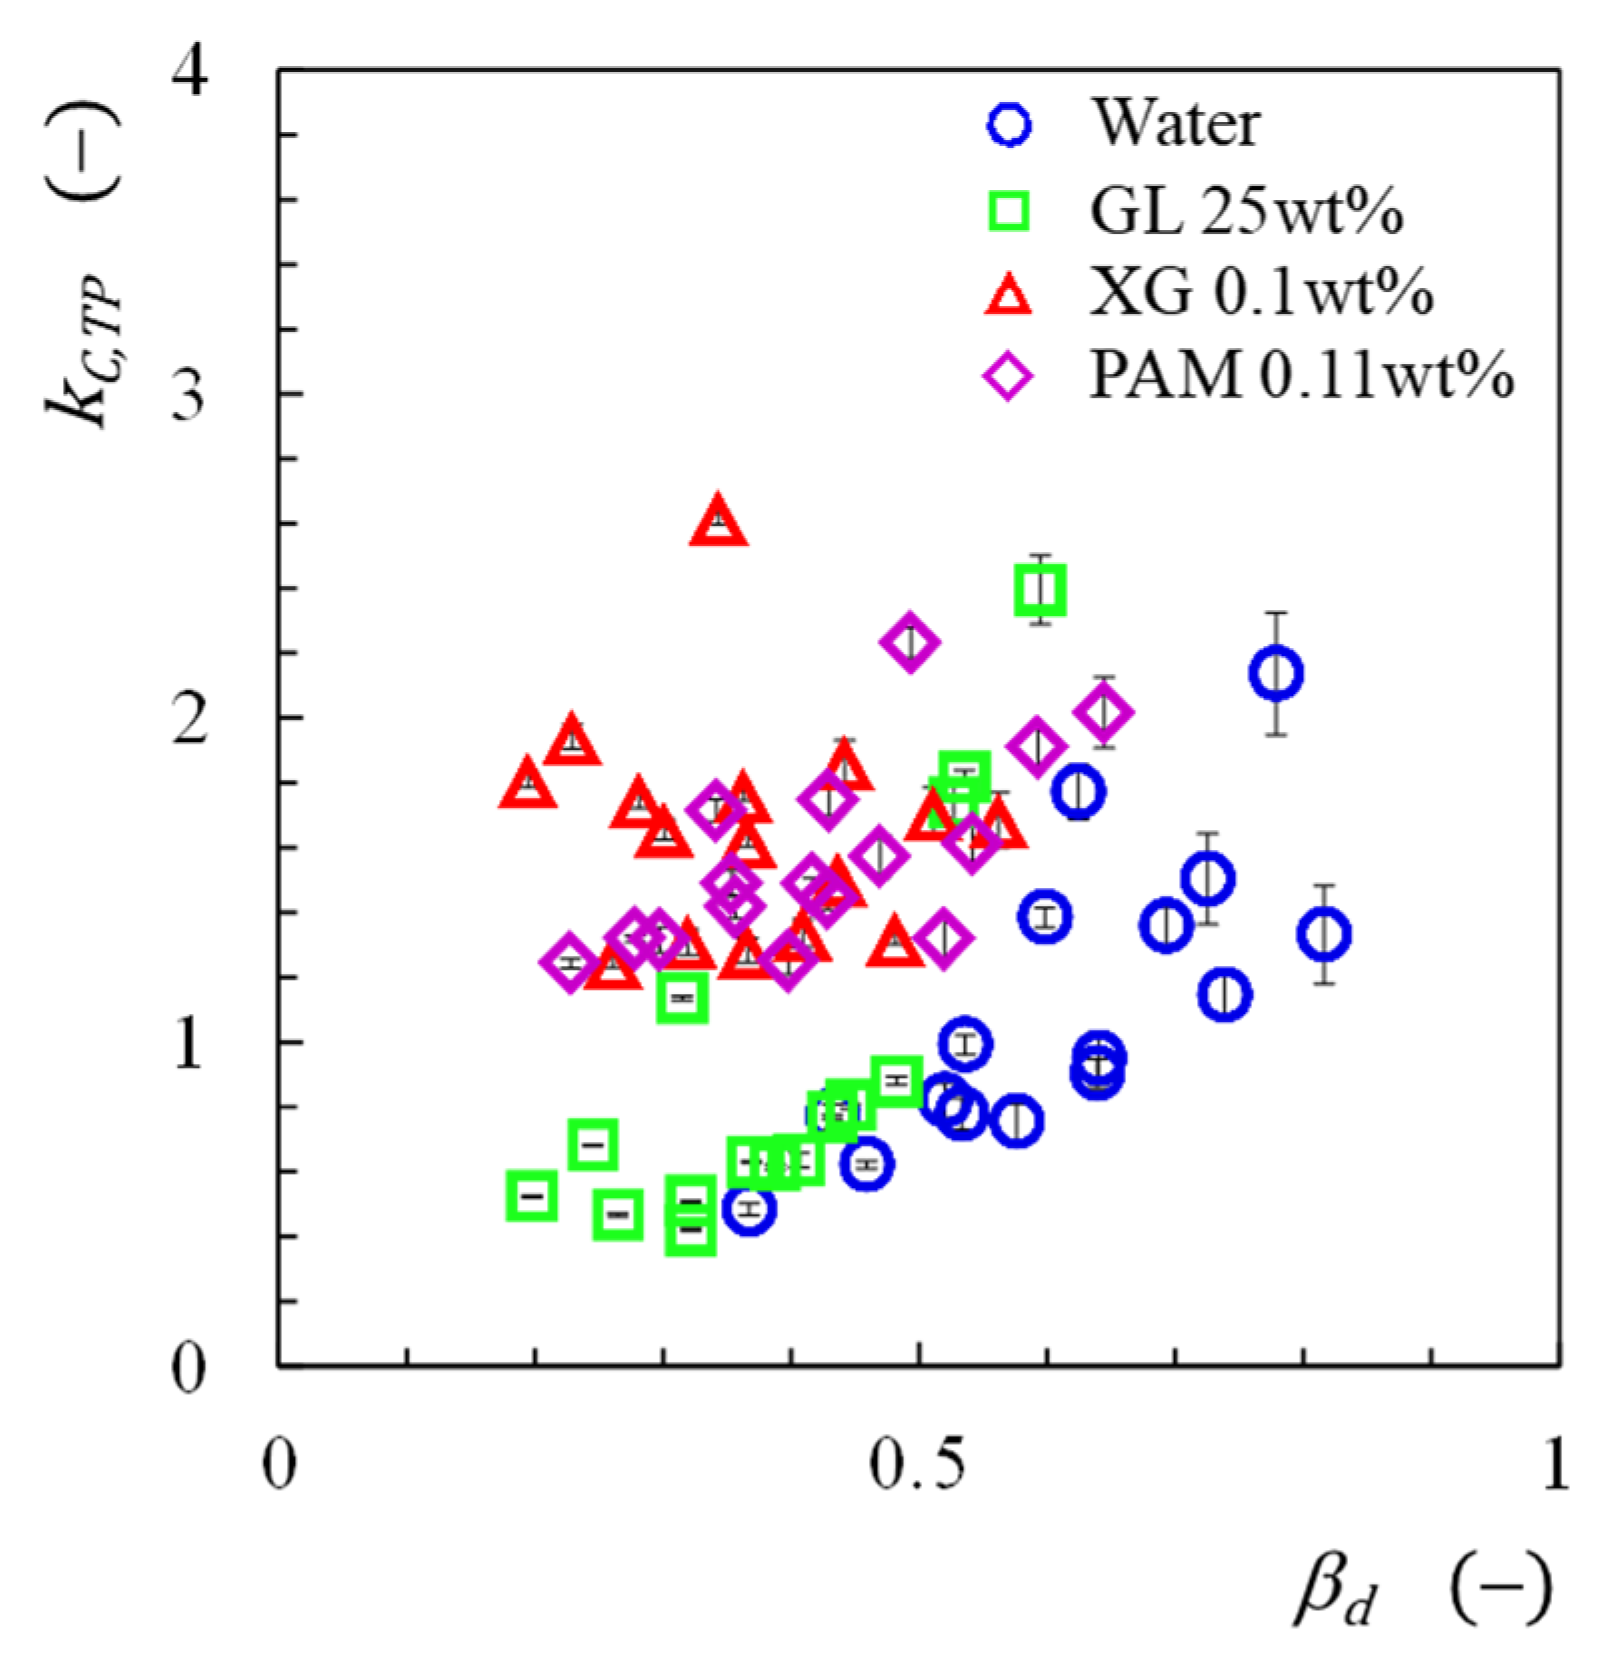
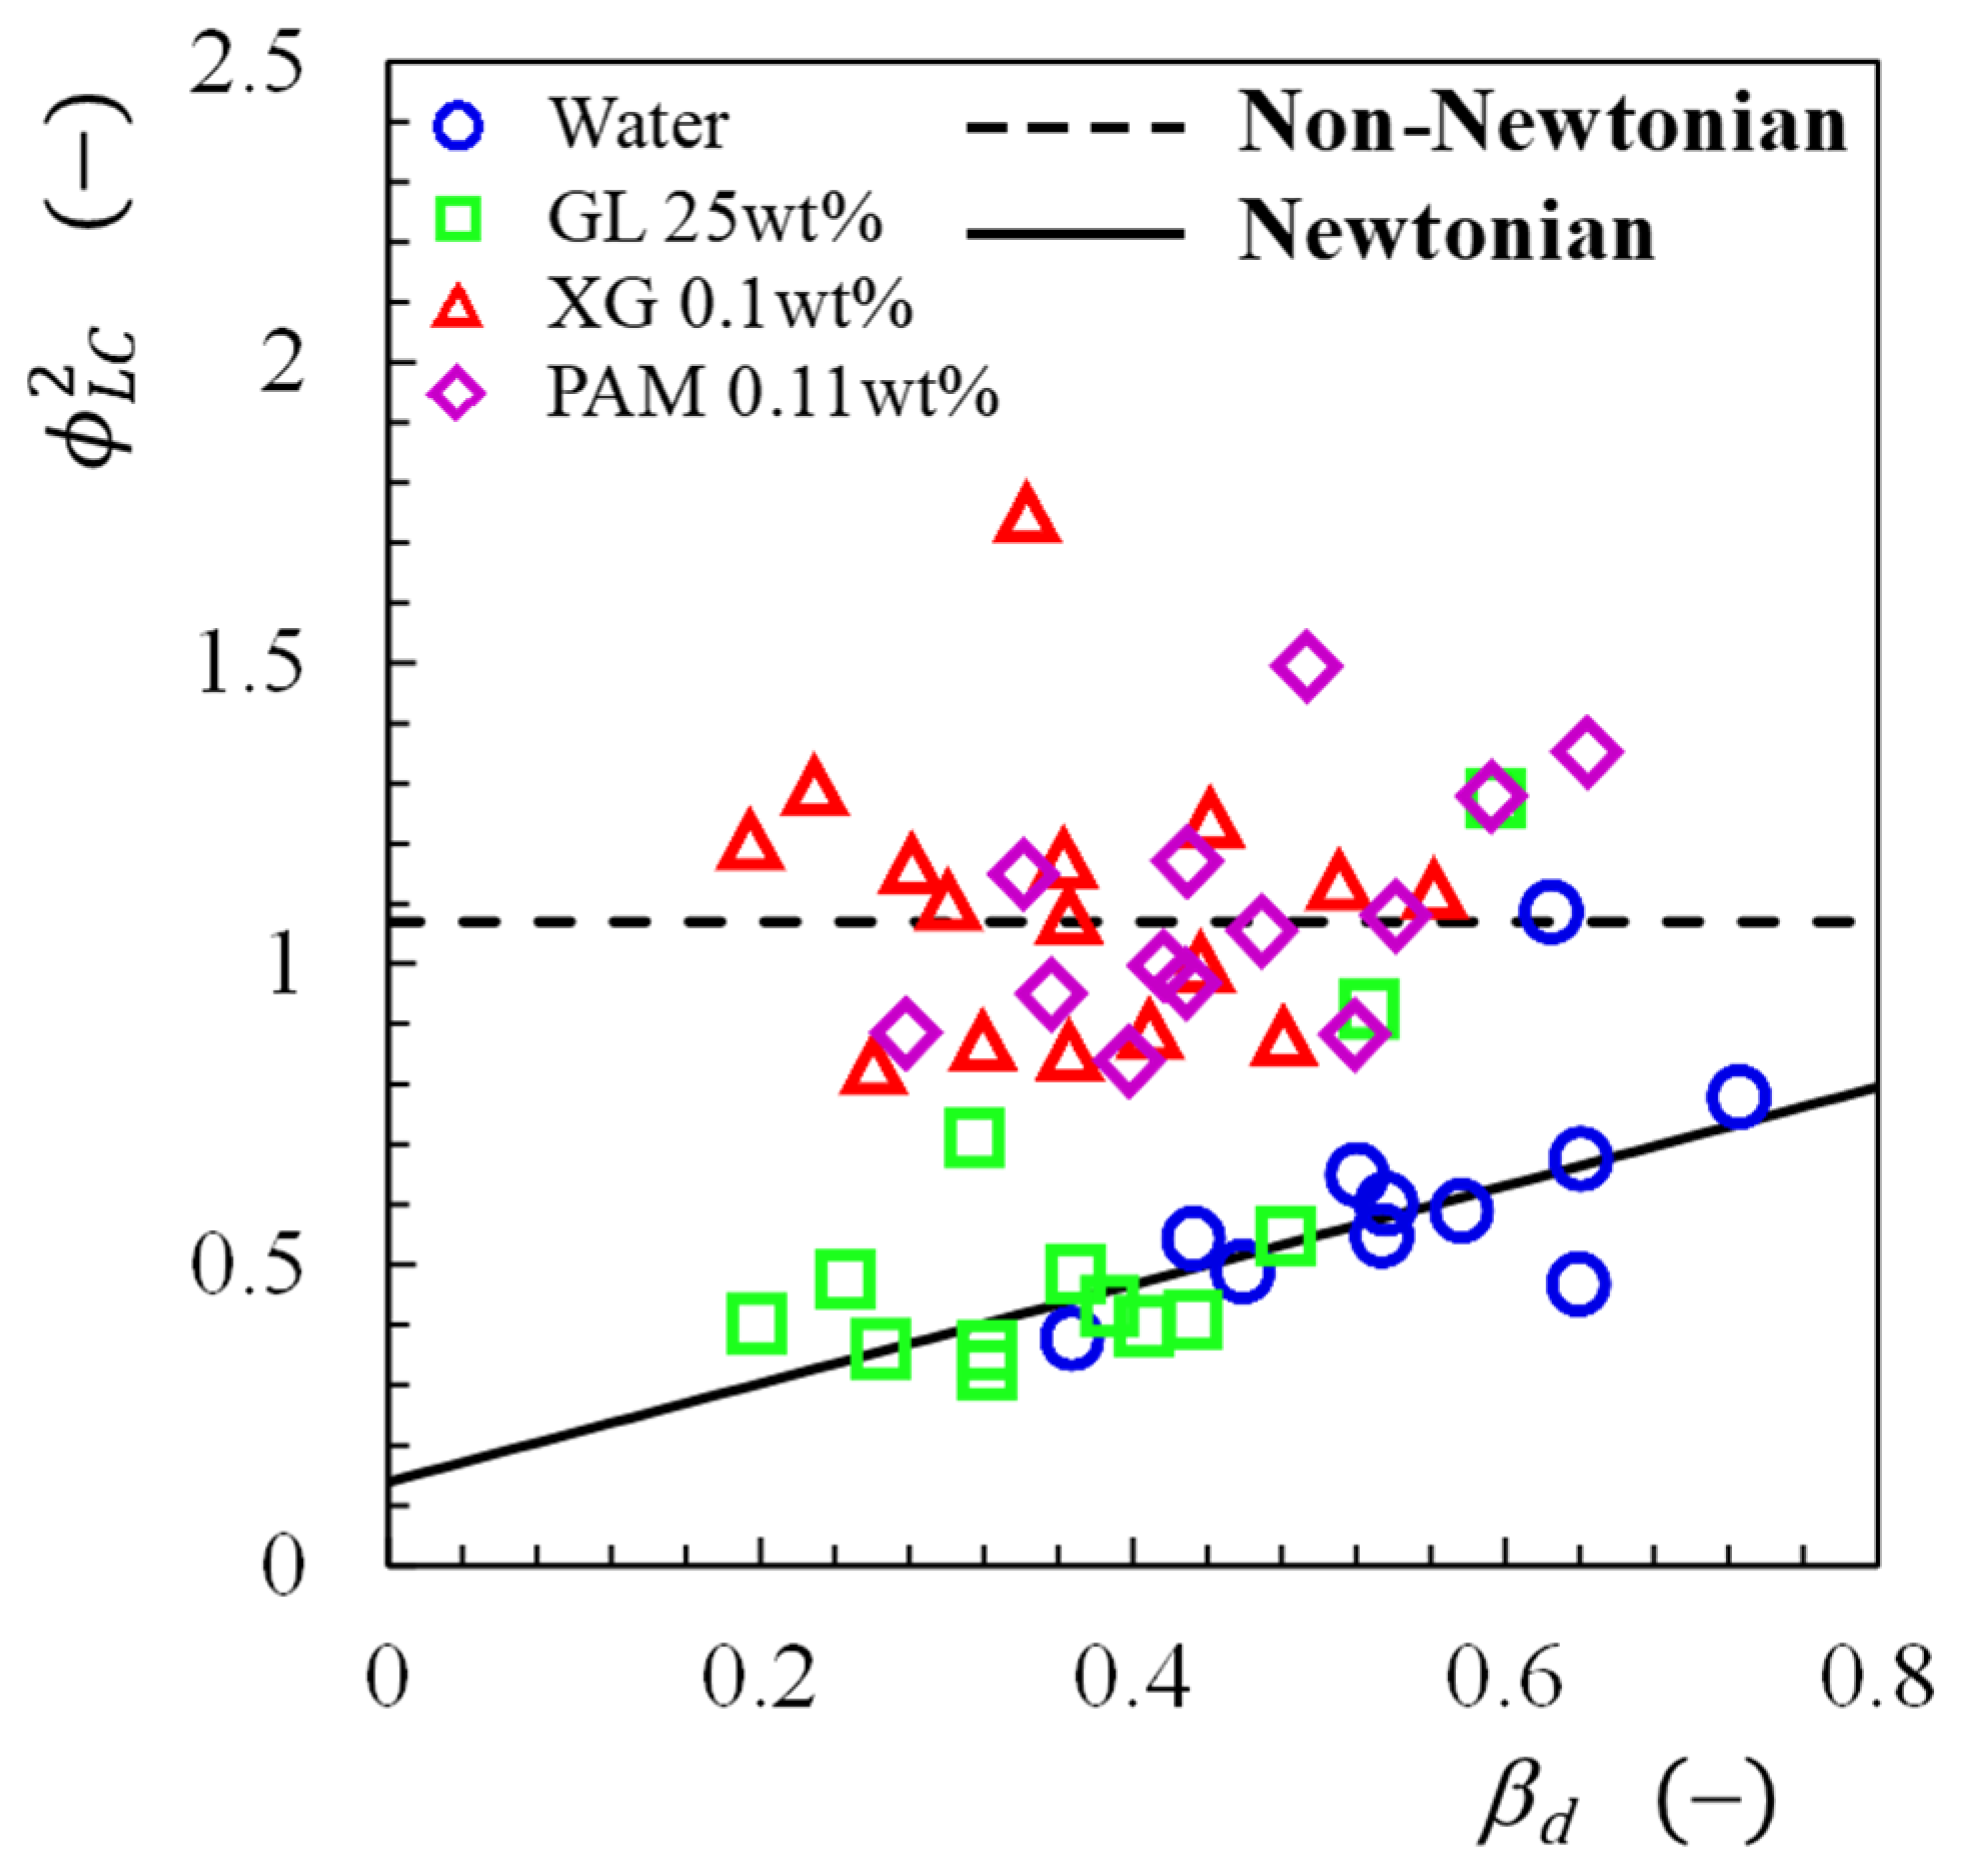
Figure 12 shows the loss coefficient, kCI,TP, data determined for all test liquids. The data are plotted against the volumetric quality in the channel downstream of the contraction, βd (=jG,d/(jG,d + jL.d)). The kCI,TP values for Newtonian liquids flow increases with the βd. The kCI,TP values for the non-Newtonian liquids’ flow are almost constant against the βd.
The kCI,TP values were correlated with the two-phase multiplier, ϕ L C 2 , as follows:
k C I , T P = ϕ L C 2 k C I , L .
Here, kCI,L is the loss coefficient when the liquid phase flows alone through the contraction. Figure 13 shows the two-phase multiplier data plotted against the volumetric flow quality, βd, in the channel downstream from the contraction. The ϕ L C 2 data for the Newtonian liquid are almost less than unity and increase with βd. On the other hand, the ϕ L C 2 data for the non-Newtonian liquid are constant against βd and nearly equal to unity. Figure 14 shows a typical photo of the bubble passing through the sudden contraction. From these photos, it can be observed that the liquid film thickness around the bubble just downstream from the contraction is larger for the non-Newtonian liquid than the Newtonian one whose thickness is difficult to see. That is, due to the passage of bubbles, the vena contracta formed immediately after the sudden contraction disappeared. Therefore, it is considered that the energy dissipation in the vena contracta was reduced.
Over βd = 0.15 − 0.70, the present ϕ L C 2 data were correlated as follows:
ϕ L C 2 = 0.82 β d + 0.14   for   Newtonian   liquid
ϕ L C 2 = 1.07   for   non - Newtonian   liquid
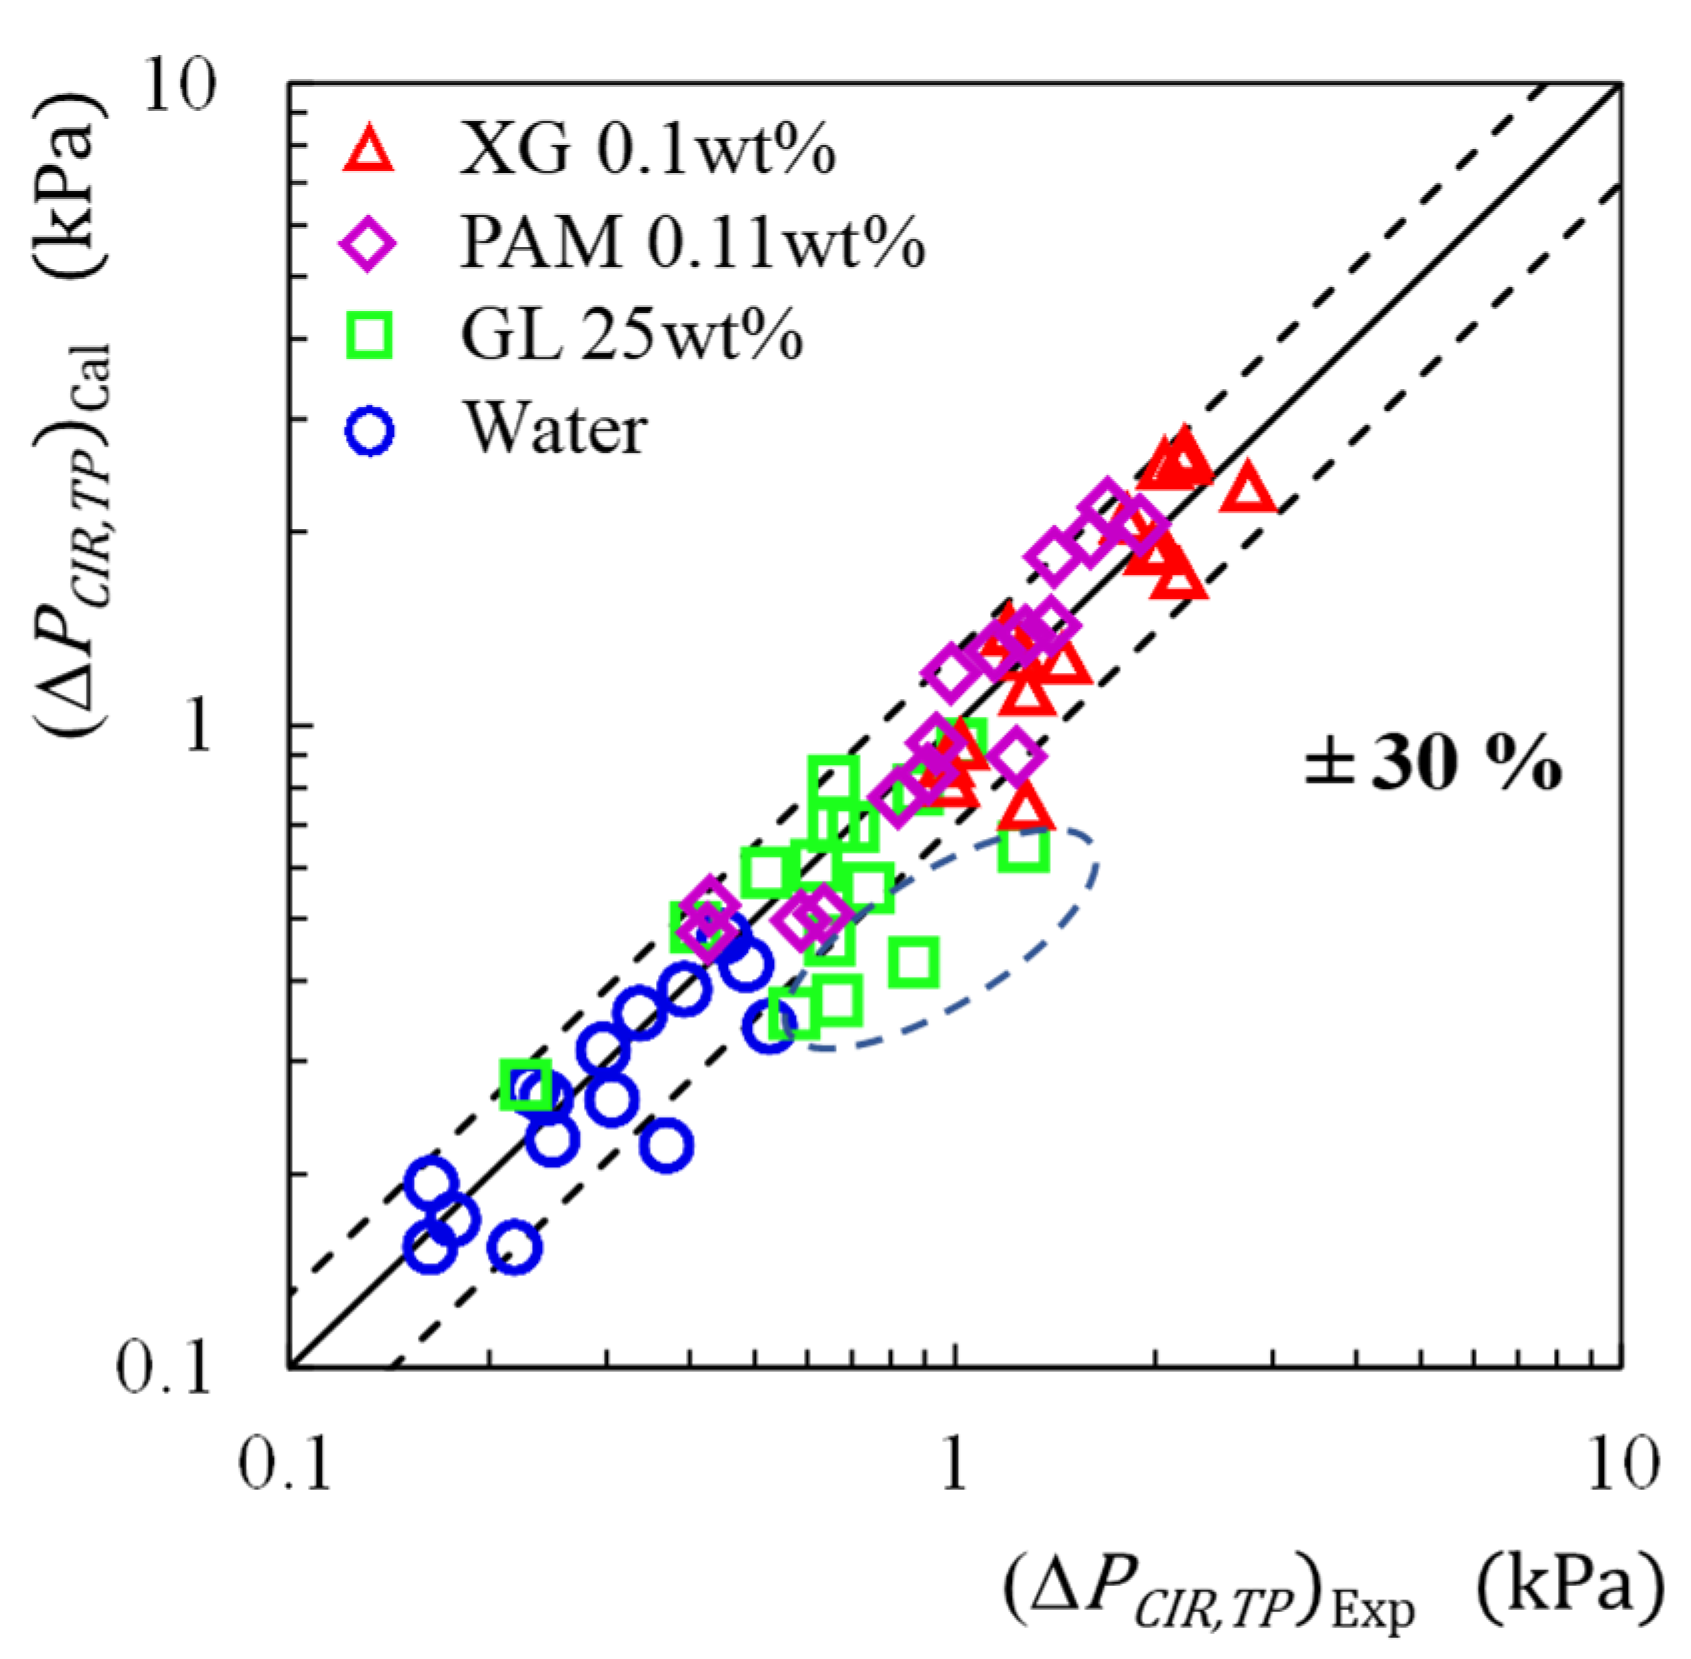
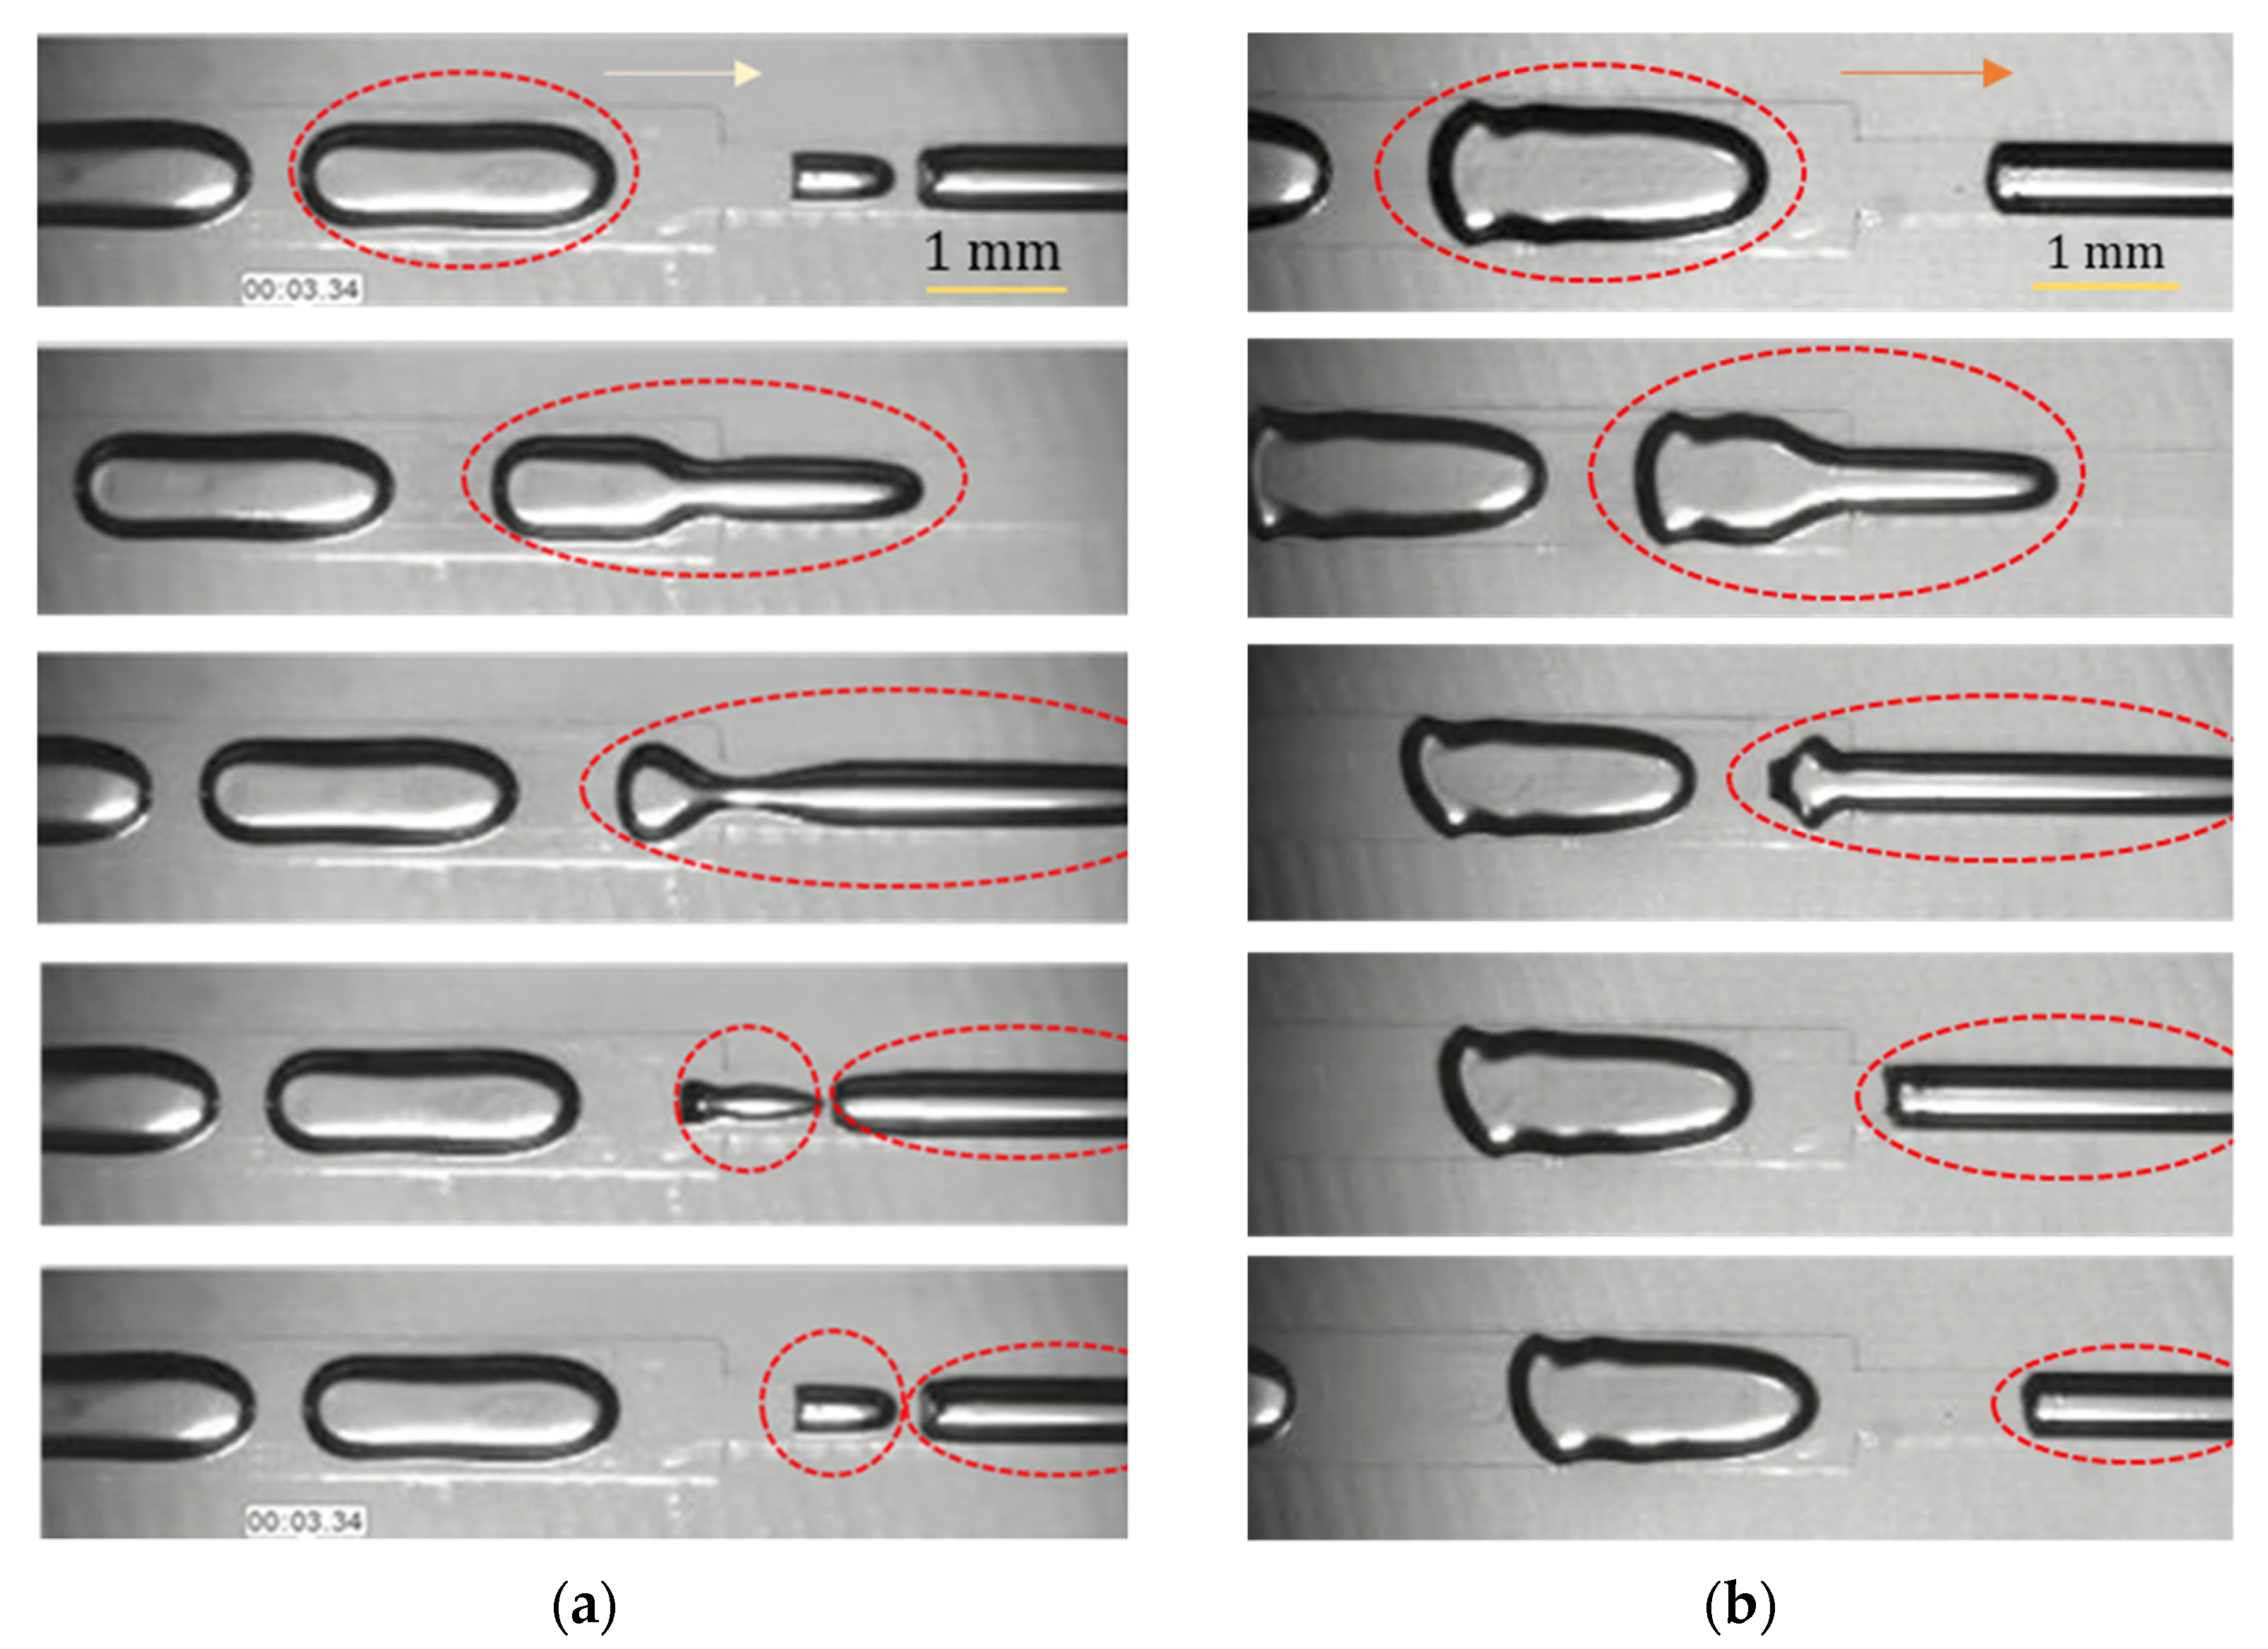
Figure 15 shows the comparison of the irreversible pressure change between the experiment and calculation by Equation (15) with the two-phase multiplier of Equations (17) and (18). The calculations agree with the experiment within a relative error of ±30%, except for some GL data in the dotted circle. In these flows for GL, the bubble breakup occurs at the contraction as shown in Figure 16a. On the other side, the bubble breakup does not occur for water and non-Newtonian liquid cases as shown in Figure 16b. An energy might be dissipated by the breakup. The calculation under-estimates the data because the calculation does not account for dissipation.

4. Conclusions

This study experimentally investigated the pressure change for the single- and two-phase Newtonian and non-Newtonian viscous flows through sudden contraction in a horizontal rectangular microchannel. The main findings are as follows:

4.1. Single-Phase Flow

  • Regardless of the test liquid, the sudden contraction pressure drop, ΔPCI,L, for single-phase liquid flows increased as the average flow velocity increased. The magnitude relation of ΔPCI,TP at the same flow velocity was PAM 0.11 wt% > XG 0.1 wt% > GL 25 wt% > distilled water.
  • The contraction coefficient obtained in this single-phase liquid experiment was considerably smaller than the value according to Gieger’s equation developed in a conventionally sized channel. In addition, the coefficients of the non-Newtonian fluids were slightly smaller than those of Newtonian fluids.

4.2. Two-Phase Flow

  • Slug or bubble flow patterns were observed in the straight channel part upstream and downstream of the contraction. The size and/or length of the bubble and liquid film thickness around the bubble depend on the liquid properties.
  • The sudden contraction pressure change ΔPC,TP increased with the total gas and liquid volumetric flux, jd, irrespectively of the test liquids.
  • The magnitude of the ΔPC,TP was affected by the pseudoplasticity and elasticity of the liquid phase, and the magnitude at the same flow velocity was XG system > PAM system > GL system > distilled water system.
  • The calculated values of ΔPC,TP by a newly developed correlation were in agreement with the experimental values within ± 30% of the relative error.

Author Contributions

Conceptualization, A.K.; methodology, A.K. and Y.Y.; software, M.T.; validation, M.T., Y.Y. and A.K.; formal analysis, M.T.; investigation, M.T.; resources, A.K. and Y.Y.; data curation, A.K.; writing—original draft preparation, A.K.; writing—review and editing, Y.Y.; visualization, M.T.; supervision, A.K.; project administration, A.K.; funding acquisition, A.K. All authors have read and agreed to the published version of the manuscript.

Funding

This research was funded by JSPS KAKENHI, Grant number 19K04172. The financial support is gratefully acknowledged.

Institutional Review Board Statement

Not applicable.

Informed Consent Statement

Not applicable.

Data Availability Statement

Data sharing is not applicable to this article.

Conflicts of Interest

The authors declare no conflict of interest.

References

  1. Wang, C.-C.; Tseng, C.-Y.; Chen, I.Y. A new correlation and the review of two-phase flow pressure change across sudden expansion in small channels. Int. J. Heat Mass Transf. 2010, 53, 4287–4295. [Google Scholar] [CrossRef]
  2. Jähnisch, K.; Baerns, M.; Hessel, V.; Ehrfeld, W.; Haverkamp, V.; Lowe, H.; Wille, C.; Guber, A. Direct fluorination of toluene using elemental fluorine in gas/liquid microreactors. J. Fluor. Chem. 2000, 105, 117–128. [Google Scholar] [CrossRef]
  3. Yen, T.J.; Fang, N.; Zhang, X.; Lu, G.Q.; Wang, C.Y. A micro methanol fuel cell operating at near room temperature. Appl. Phys. Lett. 2003, 83, 4056–4058. [Google Scholar] [CrossRef]
  4. Qu, W.; Mudawar, I. Flow boiling heat transfer in two-phase microchannel heat sinks—II. Annular two-phase flow model. Int. J. Heat Mass Transf. 2003, 46, 2773–2784. [Google Scholar] [CrossRef]
  5. Abdelall, F.F.; Hahm, G.; Ghiaasiaan, S.M.; Abdel-Khalik, S.I.; Jeter, S.S.; Yoda, M.; Sadowski, D.L. Pressure drop caused by abrupt flow area changes in small channels. Exp. Therm. Fluid Sci. 2005, 29, 425–434. [Google Scholar] [CrossRef]
  6. Chalfi, T.Y.; Ghiaasiaan, S.M. Pressure drop caused by flow area changes in capillaries under low flow conditions. Int. J. Multiph. Flow 2008, 34, 2–12. [Google Scholar] [CrossRef]
  7. Chen, I.Y.; Chu, M.-C.; Liaw, J.-S.; Wang, C.-C. Two-phase flow characteristics across sudden contraction in small rectangular channels. Exp. Therm. Fluid Sci. 2008, 32, 1609–1619. [Google Scholar] [CrossRef]
  8. Chen, I.Y.; Tseng, C.-Y.; Lin, Y.-T.; Wang, C.-C. Two-phase flow pressure change subject to sudden contraction in small rectangular channels. Int. J. Multiph. Flow 2009, 35, 297–306. [Google Scholar] [CrossRef]
  9. Kawahara, A.; Mansour, M.H.; Sadatomi, M.; Law, W.Z.; Kurihara, H.; Kusumaningsih, H. Characteristics of gas–liquid two-phase flows through a sudden contraction in rectangular microchannels. Exp. Therm. Fluid Sci. 2015, 66, 243–253. [Google Scholar] [CrossRef]
  10. Sontti, S.G.; Atta, A. CFD analysis of Taylor bubble in a co-flow microchannel with Newtonian and non-Newtonian liquid. Ind. Eng. Chem. Res. 2017, 56, 7401–7412. [Google Scholar] [CrossRef]
  11. Alves, M.A.; Oliveira, P.J.; Pinho, F.T. Numerical methods for viscoelastic fluid flows. Annual Review of Fluid Mechanics. Annu. Rev. Fluid Mech. 2021, 53, 509–541. [Google Scholar] [CrossRef]
  12. Mansour, M.H.; Kawahara, A.; Sadatomi, M. Experimental investigation of gas–non-Newtonian liquid two-phase flows from T-junction mixer in rectangular microchannel. Int. J. Multiph. Flow 2015, 72, 263–274. [Google Scholar] [CrossRef]
  13. Kawahara, A.; Yonemoto, Y.; Arakaki, Y. Pressure drop for gas and polymer aqueous solution two-phase flows in horizontal circular microchannel. Flow Turbul. Combust. 2020, 105, 1325–1344. [Google Scholar] [CrossRef]
  14. Boger, D.V.; Cable, P.J. An anomalous effect in the measurement of normal stresses in polyacrylamide solutions. Rheol. Acta 1977, 16, 322–323. [Google Scholar] [CrossRef]
  15. Chhabra, R.P.; Farooqi, S.I.; Richardson, J.F. Isothermal two-phase flow of air and aqueous polymer solutions in a smooth horizontal pipe. Chem. Eng. Res. Des. 1984, 62, 22–32. [Google Scholar]
  16. Sousa, R.G.; Reithmuller, M.L.; Pinto, A.M.F.R.; Campos, J.B.L.M. Flow around individual Taylor bubbles rising in stagnant polyacrylamide (PAA) solutions. J. Non-Newton. Fluid Mech. 2006, 135, 16–31. [Google Scholar] [CrossRef]
  17. Farooqi, S.I.; Richardson, J.F. Rheological behaviour of Kaolin suspensions in water and water glycerol Mixtures. Trans. Inst. Chem. Eng. 1980, 58, 116–124. [Google Scholar]
  18. Kozicki, W.; Chou, C.H.; Tiu, C. Non-Newtonian flow in ducts of arbitrary cross-sectional shape. Chem. Eng. Sci. 1966, 21, 665–679. [Google Scholar] [CrossRef]
  19. Geiger, G.E. Sudden Contraction Losses in Single and Two-Phase Flow. Ph.D. Thesis, University of Pittsburgh, Pittsburgh, PA, USA, 1964. [Google Scholar]
  20. Garstecki, P.; Fuerstman, M.J.; Stone, H.A.; Whitesides, G.M. Formation of droplets and bubbles in a microfluidic T-junction—Scaling and mechanism of break-up. Lab Chip 2006, 2, 437–446. [Google Scholar] [CrossRef] [PubMed]
  21. Xu, J.H.; Li, S.W.; Tan, J.; Luo, G.S. Correlations of droplet formation in T-junction microfluidic devices: From squeezing to dripping. Microfluid. Nanofluidics 2008, 5, 711–717. [Google Scholar] [CrossRef]
  22. Chisholm, D. Two-Phase Flow in Pipelines and Heat Exchangers; George Godwin: London, UK; New York, NY, USA, 1983. [Google Scholar]
  23. Collier, J.G.; Thome, J.R. Convective Boiling and Condensation; Clarendon Press: Oxford, UK, 1994. [Google Scholar]
  24. Schmidt, J.; Friedel, L. Two-phase flow pressure drop across sudden contractions in duct areas. Int. J. Multiph. Flow 1997, 23, 283–299. [Google Scholar] [CrossRef]
Figure 1. The rectangular test channel with a sudden contraction: (a) schematic diagram with dimension; and (b) photo of plate with groove.
Fluids 06 00440 g001
Figure 2. Schematic diagram of test apparatus.
Fluids 06 00440 g002
Figure 3. Pressure profile along the channel: (a) pressure profile measured for two-phase flow at jL,d = 0.86 m/s and jG,d = 0.87 m/s; and (b) schematic enlarged view of pressure profile around the contraction.
Fluids 06 00440 g003
Figure 4. Friction factors for single-phase liquid flows in straight channels upstream and downstream of the contraction: (a) upstream side; and (b) downstream side.
Fluids 06 00440 g004
Figure 5. Pressure change for single-phase liquid flows through sudden contraction: (a) total pressure change; and (b) irreversible pressure change.
Fluids 06 00440 g005
Figure 6. Variations in the apparent viscosity for the test liquid under Reynolds number conditions.
Fluids 06 00440 g006
Figure 7. Contraction coefficient for the single-phase flow of Newtonian and non-Newtonian liquids.
Fluids 06 00440 g007
Figure 8. Contraction coefficient for single-phase liquid flows.
Fluids 06 00440 g008
Figure 9. Typical flow pattern of the gas–liquid two-phase flow observed when the combination of jL and jG is almost the same for each fluid: (a) water: jL,d = 0.92 m/s, jG,d = 0.43 m/s; (b) GL 25 wt%: jL,d = 0.84 m/s, jG,d = 0.44 m/s; (c) XG 0.1 wt%: jL,d = 0.84 m/s, jG,d = 0.44 m/s; (d) PAM 0.11 wt%: jL,d = 0.85 m/s, jG,d = 0.44 m/s.
Fluids 06 00440 g009
Figure 10. Two-phase total pressure change through sudden contraction.
Fluids 06 00440 g010
Figure 11. Two-phase irreversible pressure change through sudden contraction.
Fluids 06 00440 g011
Figure 12. Relation between the two-phase contraction pressure loss coefficient and the volumetric quality in the channel downstream of the contraction.
Fluids 06 00440 g012
Figure 13. Two-phase multiplier of contraction loss coefficient.
Fluids 06 00440 g013
Figure 14. Photo of gas bubble passing through the contraction: (a) water; (b) GL 25 wt%; (c) XG 0.1 wt%; (d) PAM 0.11 wt%.
Fluids 06 00440 g014
Figure 15. Comparison of the two-phase pressure change between the experiment and calculation by the Lockhart–Martinelli method with the presented two-phase multiplier correlation.
Fluids 06 00440 g015
Figure 16. Typical photos of the bubble through the sudden contraction: (a) air–GL 25 wt%, jLd = 0.62 m/s, jGd = 0.90 m/s in which the breakup of bubbles is observed at the sudden contraction (relative error—51% for prediction); and (b) air–water, jLd = 0.65 m/s, jGd = 0.97 m/s in which the breakup of the bubbles was observed at the sudden contraction (relative error—30% for prediction). Bubbles in red dotted circle are traced with time.
Fluids 06 00440 g016
Table 1. Previous studies on gas–liquid two-phase flow through sudden contraction in small channel.
AuthorsCross–Section of Test Channels
(Shape: ○ Circular, □ Rectangular)
(Dimension in mm)
Test Fluids (Gas–Liquid)
Abdellal et al. (2008)○ 1.6 --> ○ 0.84Air–water
Chalfi et al. (2008)
Chen et al. (2008)□ 3 × 9 --> ○ 3
□ 3 × 6 --> ○ 3
Chen et al. (2009)□ 2 × 4 --> ○ 2
□ 2 × 6 --> ○ 2
□ 4 × 4 --> ○ 2
□ 4 × 6 --> ○ 2
Kawahara et al. (2015)□ 0.53 × 0.23 --> □ 0.27 × 0.23
□ 0.78 × 0.23 --> □ 0.27 × 0.23
Nitrogen gas–water
Nitrogen gas–ethanol 49 wt% aqueous solution
Nitrogen gas–ethanol
Nitrogen gas–HFE7200
Table 2. Dimensions of the test channel.
ChannelsW (mm)H (mm)Dh (mm)sA (−)
Upstream0.99 0.50 0.66 0.49
Downstream0.49 0.50 0.50
Table 3. Physical properties of the test liquids.
Test LiquidsrL (kg/m3)sL (N/m)K (Pa × sn)n (−)(du/dy)y=0 (1/s)
Distilled water9970.0728.97 × 1041.00 -
GL 25 wt%10580.0631.82 × 1031.00 -
XG 0.1 wt%9980.0733.47 × 1020.70 1400–52,000
PAM 0.11 wt%9980.0731.85 × 1030.98 1060–41,400
Table 4. Two-phase flow conditions.
Test LiquidsjL,d (m/s)jG,d (m/s) R e L , d * ReG,d
Distilled water0.29–0.850.48–1.30183–53220–50
GL 25 wt%0.61–1.530.38–1.07197–49720–50
XG 0.1 wt%0.83–1.640.39–1.07208–50620–50
PAM 0.11 wt%0.59–1.400.41–1.07205–49020–50
Table 5. Root mean square errors of five correlations of ΔPC,TP.
CorrelationsDistilled WaterGL 25 wt%XG 0.1 wt%PAM 0.11 wt%
em (%)erms (%)em (%)erms (%)em (%)erms (%)em (%)erms (%)
Chisholm (1983)1912061942118390102108
Collier-Thome (1994)−2529−2531−5355−4851
Schmidt-Friedel (1997)−3640−2533−5456−52554
Abdelall et al. A (2005)−2940839−2327−2731
Abdelall et al. B (2005)−26353350−1719−2229
Publisher’s Note: MDPI stays neutral with regard to jurisdictional claims in published maps and institutional affiliations.