Article

Dynamic Stall Characteristics of Pitching Swept Finite-Aspect-Ratio Wings

by
Al Habib Ullah
1,
Kristopher L. Tomek
2,
Charles Fabijanic
1 and
Jordi Estevadeordal
1,*
1
Department of Mechanical Engineering, North Dakota State University, Fargo, ND 58108, USA
2
Northrop Grumman, Plymouth, MN 55442, USA
*
Author to whom correspondence should be addressed.
Fluids 2021, 6(12), 457; https://doi.org/10.3390/fluids6120457
Submission received: 9 September 2021 / Revised: 11 November 2021 / Accepted: 13 November 2021 / Published: 16 December 2021
(This article belongs to the Special Issue External Aerodynamics)

Abstract

:
An experimental investigation regarding the dynamic stall of various swept wing models with pitching motion was performed to analyze the effect of sweep on the dynamic stall. The experiments were performed on a wing with a NACA0012 airfoil section with an aspect ratio of AR = 4. The experimental study was conducted for chord-based Reynolds number Rec   = 2 × 10 5 and freestream Mach number M a = 0.1 . First, a ‘particle image velocimetry’ (PIV) experiment was performed on the wing with three sweep angles, Λ = 0 o ,   15 o ,   and   30 o , to obtain the flow structure at several wing spans. The results obtained at a reduced frequency showed that a laminar separation bubble forms at the leading edge of the wing during upward motion. As the upward pitching motion continues, a separation burst occurs and shifts towards the wing trailing edge. As the wing starts to pitch downward, the growing dynamic stall vortex (DSV) vortex sheds from the wing’s trailing edge. With the increasing sweep angle of the wing, the stall angle is delayed during the dynamic motion of the wing, and the presence of DSV shifts toward the wingtip. During the second stage, a ‘turbo pressure-sensitive paint’ (PSP) technique was deployed to obtain the phase average of the surface pressure patterns of the DSV at a reduced frequency, k = 0.1 . The phase average of pressure shows a distinct pressure map for two sweep angles, Λ = 0 o ,   30 o , and demonstrates a similar trend to that presented in the published computational studies and the experimental data obtained from the current PIV campaign.

1. Introduction

Wings that experience an unsteady increase in incidence during pitching motion are known to develop an increase in lift without any detectable change in the lift–curve slope [1,2]. This has been observed in modern applications of swept wings and extends to helicopter rotors, wind turbines, and other maneuvering aircraft systems [3,4,5]. These subsonic applications use swept wings for various reasons, including stability, low perturbation velocities at low Mach numbers, and prolonged critical values of pressure coefficient [1,2,3,4,5].
The quasi-static aerodynamic stall characteristics of a fixed-aspect-ratio wing have been thoroughly studied and are well understood in the industry [6,7,8]. Although commercial applications of these quasi-static wings go well beyond those of constant wing geometries, aerodynamic performance regarding the dynamic motion and stall performance of a wing is still a current area of research. In addition, with the growing interest in small, unmanned aerial vehicles capable of performing swift, sharp maneuvers as well as nimble maneuvers, demonstrations of this types of flight are of great value in this area of research. Computational analysis of pitching wings has been conducted exhaustively [3,4,9,10,11]. Current computational studies show the presence of arch-shaped and ring-shaped vortices during finite-aspect-ratio wing pitching. However, a comprehensive experimental study still needs to be conducted to assess the presence of structures such as arch- and ring-shaped vortices during the wing pitching motion.
The dynamic stall process is characterized by the formation and propagation of a large-scale dynamic stall vortex (DSV), which induces undesirable variations in aerodynamic forces and moments [1]. Although the stall characteristics of a static, pitched wing are mostly known for sweep angles smaller than 15°, further details of the complex 3D unsteady flow remain to be uncovered, especially based on experiments. The interactions between the formation of the 3D unsteady flow components, dynamic stall characteristics, and their influence on the aerodynamic performance of the wing are the focus of this experimental investigation. An experimental study using cutting-edge flow diagnostic techniques can provide further insight into the formation and evolution of the DSV and its interaction with the wing. Various models and case studies have been carried out since the late 1980s with computational fluid dynamics, however, empirical demonstrations have yet to take place.
Reviews of the dynamic stall have been published by several researchers [1,8,12]. A fundamental understanding of the dynamic stall phenomenon requires an assessment of dynamic stall vortex (DSV) genesis, structure, and evolution. This is especially challenging under abrupt variations in the flow incidence angle. This fundamental structure and its evolution were reported in the study by Visbal and Garmann [3]. The boundary layer of a pitching wing is characterized by the formation of a laminar separation bubble (LSB). With an increasing incidence angle, the laminar separation bubble breaks down due to abrupt suction pressure, and a dynamic stall vortex (DSV) forms on the wing surface. Therefore, the laminar separation bubble (LSB) has a critical role in the formation of the dynamic stall vortex (DSV). The role of the LSB in the formation of the DSV has been shown using high-fidelity large-eddy simulations [3,4,13,14,15,16,17] for ramped and sinusoidal wing motion at Rec = 2 × 10⁵ and 5 × 10⁵, and this was confirmed by the experimental study performed by Chandrasekhara et al. [18].
The study was extended to a finite-aspect-ratio wing using large eddy simulations (LES) in the work of Visbal and Garmann [3]. Although the solution was straightforward in principle, it required significant amounts of computational resources. The study showed that the DSV also formed for a finite-aspect-ratio wing, followed by an LSB burst. Initially, the DSV remained uniform all over the wing surface. Later, it evolved into an arch-shaped vortex during the upward motion of the wing. When the wing reached its maximum phase angle and continued its downwards motion, the arch-shaped vortex evolved into a ring-shaped vortex. The ring-shaped vortex was later shed from the trailing edge of the wing. With an increasing sweep angle, the computational studies showed that the arch-shaped vortex and ring-shaped vortex shifted towards the wingtip of the wing. Although contemporary practices mitigate the undesired effects of wingtip vortices such as winglets, the computational results used for comparison simply possessed a simple, rounded tip. The round tip on the wing contributes to the formation of wingtip vortices, which is the case for all sweep angle wings. However, for wings with a higher sweep angle, the DSV interacts with the wingtip vortex, making the flow complex. It is anticipated that the effects of the wingtip vortices will strongly influence flow separation further down the wing’s span. This interaction is expected to create a station of secondary vorticity near the trailing edge above the surface that is separate from the laminar separation region. Aside from the computational study, very few experimental studies have been conducted to explain the dynamic stall of an oscillating and pitching wing [19,20,21].
The experimental investigation presented in this article strives to reconstruct the computational experiment and to affirm its results by using North Dakota State University (NDSU)’s advanced flow diagnostic techniques. These techniques include 15 Hz-rate particle image velocimetry (PIV) and pressure-sensitive paints capable of kHz time resolutions (e.g., Turbo-PSP) and lab equipment constructed specifically for this experiment. Some experimental results obtained with PIV and fast pressure-sensitive paint, that present some of the dynamic stall phenomena, have been recently published [22,23,24,25,26]. These experimental techniques are well established and are readily used in aerodynamics research [19,20,27].
This investigation aims to provide an experimental demonstration of the swept wings dynamic stall phenomena as well as an affirmation of current computational research results. The following section provides details of the experimental setup, including the actuator design, the wind tunnel model installation, and the advanced diagnostics implementation. It also outlines the testing parameters as well as the scope of the analyses. The discussion will contain comparisons with results from prior CFD simulations [3], and a comparison of the experimental results. Data from the experiments is comprised of snapshots and phase-average properties of the flow at given conditions. These are presented using vector fields and derived properties such as streamlines and surface pressure maps to reflect the wing performance. The discussion ultimately focuses on DSV formation and characteristics.

2. Experimental Setup

To test the wings’ aerodynamics between a minimum and a maximum pitching angle at a given pitching frequency, a detailed design was put forward, and it is described in the following. Following the numerical simulations conditions [10], the experiments are designed to have a minimum and a maximum angle of attack of α = 4° and 22°, respectively, an airfoil profile of the NACA0012, a moderate aspect ratio of AR = 4, and a chord Reynolds number of Rec = 2 × 10⁵. Additionally, to neglect compressibility effects, a free stream velocity of M = 0.1 will also be used. The wings can be pitched sinusoidally with nominal reduced frequencies from k = πfc/U = 0.1 to 0.2, as in the CFD studies aforementioned.
The influence of the sweep angle on the DSV patterns will be observed by testing three sweep angles for the finite-aspect-ratio pitching wing studied. These three sweep angles are Λ = 0°, 15°, and 30°, and are swept backwards relative to the spanwise direction. It was noted that the design was not structurally stable for wings with higher swept angles, while pitching at the higher frequencies and they were more difficult to synchronize to acquire phase-locked measurements. Thus, the pitching frequency was reduced to produce a reduced frequency value of 0.1 for some of the tests.

2.1. Wings and Actuator Design

An apparatus capable of pitching the wings sinusoidally was designed and constructed. The design incorporated an actuator that moves the wing between a minimum and maximum angle of attack and at a defined pitching frequency. Furthermore, the actuator has the capability to be adjusted for various ranges of pitching angles and to accept various wing shapes and sizes. The constructed actuator system was mounted alongside the wind tunnel where the wing was attached. The pitching angle was monitored using the LaVision ‘DaVis’ software used for PIV.
Since three sweep angles were tested, three individual wings were made. The wings were 3D printed from ‘ABS’ with two holes running with the pitch angle, one at 25% chord length and another 25 mm behind that. The connecting rod was bent to make it parallel to the wing axis and perpendicular to the freestream flow, as shown in Figure 1a. It is important to note that to ensure the finite-wing freestream boundary conditions, the span of the wing was limited to half of the wind tunnel throat which is 12 inches wide. This meant that the maximum span length of the wing was approximately 152 mm (6 inches). Both holes were printed about the axis of symmetry. A medium infill of 50% was used to reduce material consumption and the mass for the bulk of the wing. Figure 1a contains a cross section drawing of a test wing with a sweep angle of 30°. Printed wings at three sweep angles are shown in Figure 1b. For testing, they were mounted to allow rotation (pitching) about their aerodynamic center. Two 3.5 mm rods were inserted into the wings and permanently secured using adhesive to support the entirety of the wing. The rods were angled in accordance with the required sweep angle of the wing. The rods protrude from the wing by 30 mm and were used to mount the wing to the actuating apparatus attached to the wind tunnel. Figure 1c shows a wing with the threaded rods inserted. As previously stated, the wing was mounted and rotated about its quarter chord. Another rod behind the first rod was inserted at the wing quarter chord and it was connected to the actuation system. Figure 1d shows a Λ = 30° wing mounted in the throat of the wind tunnel.
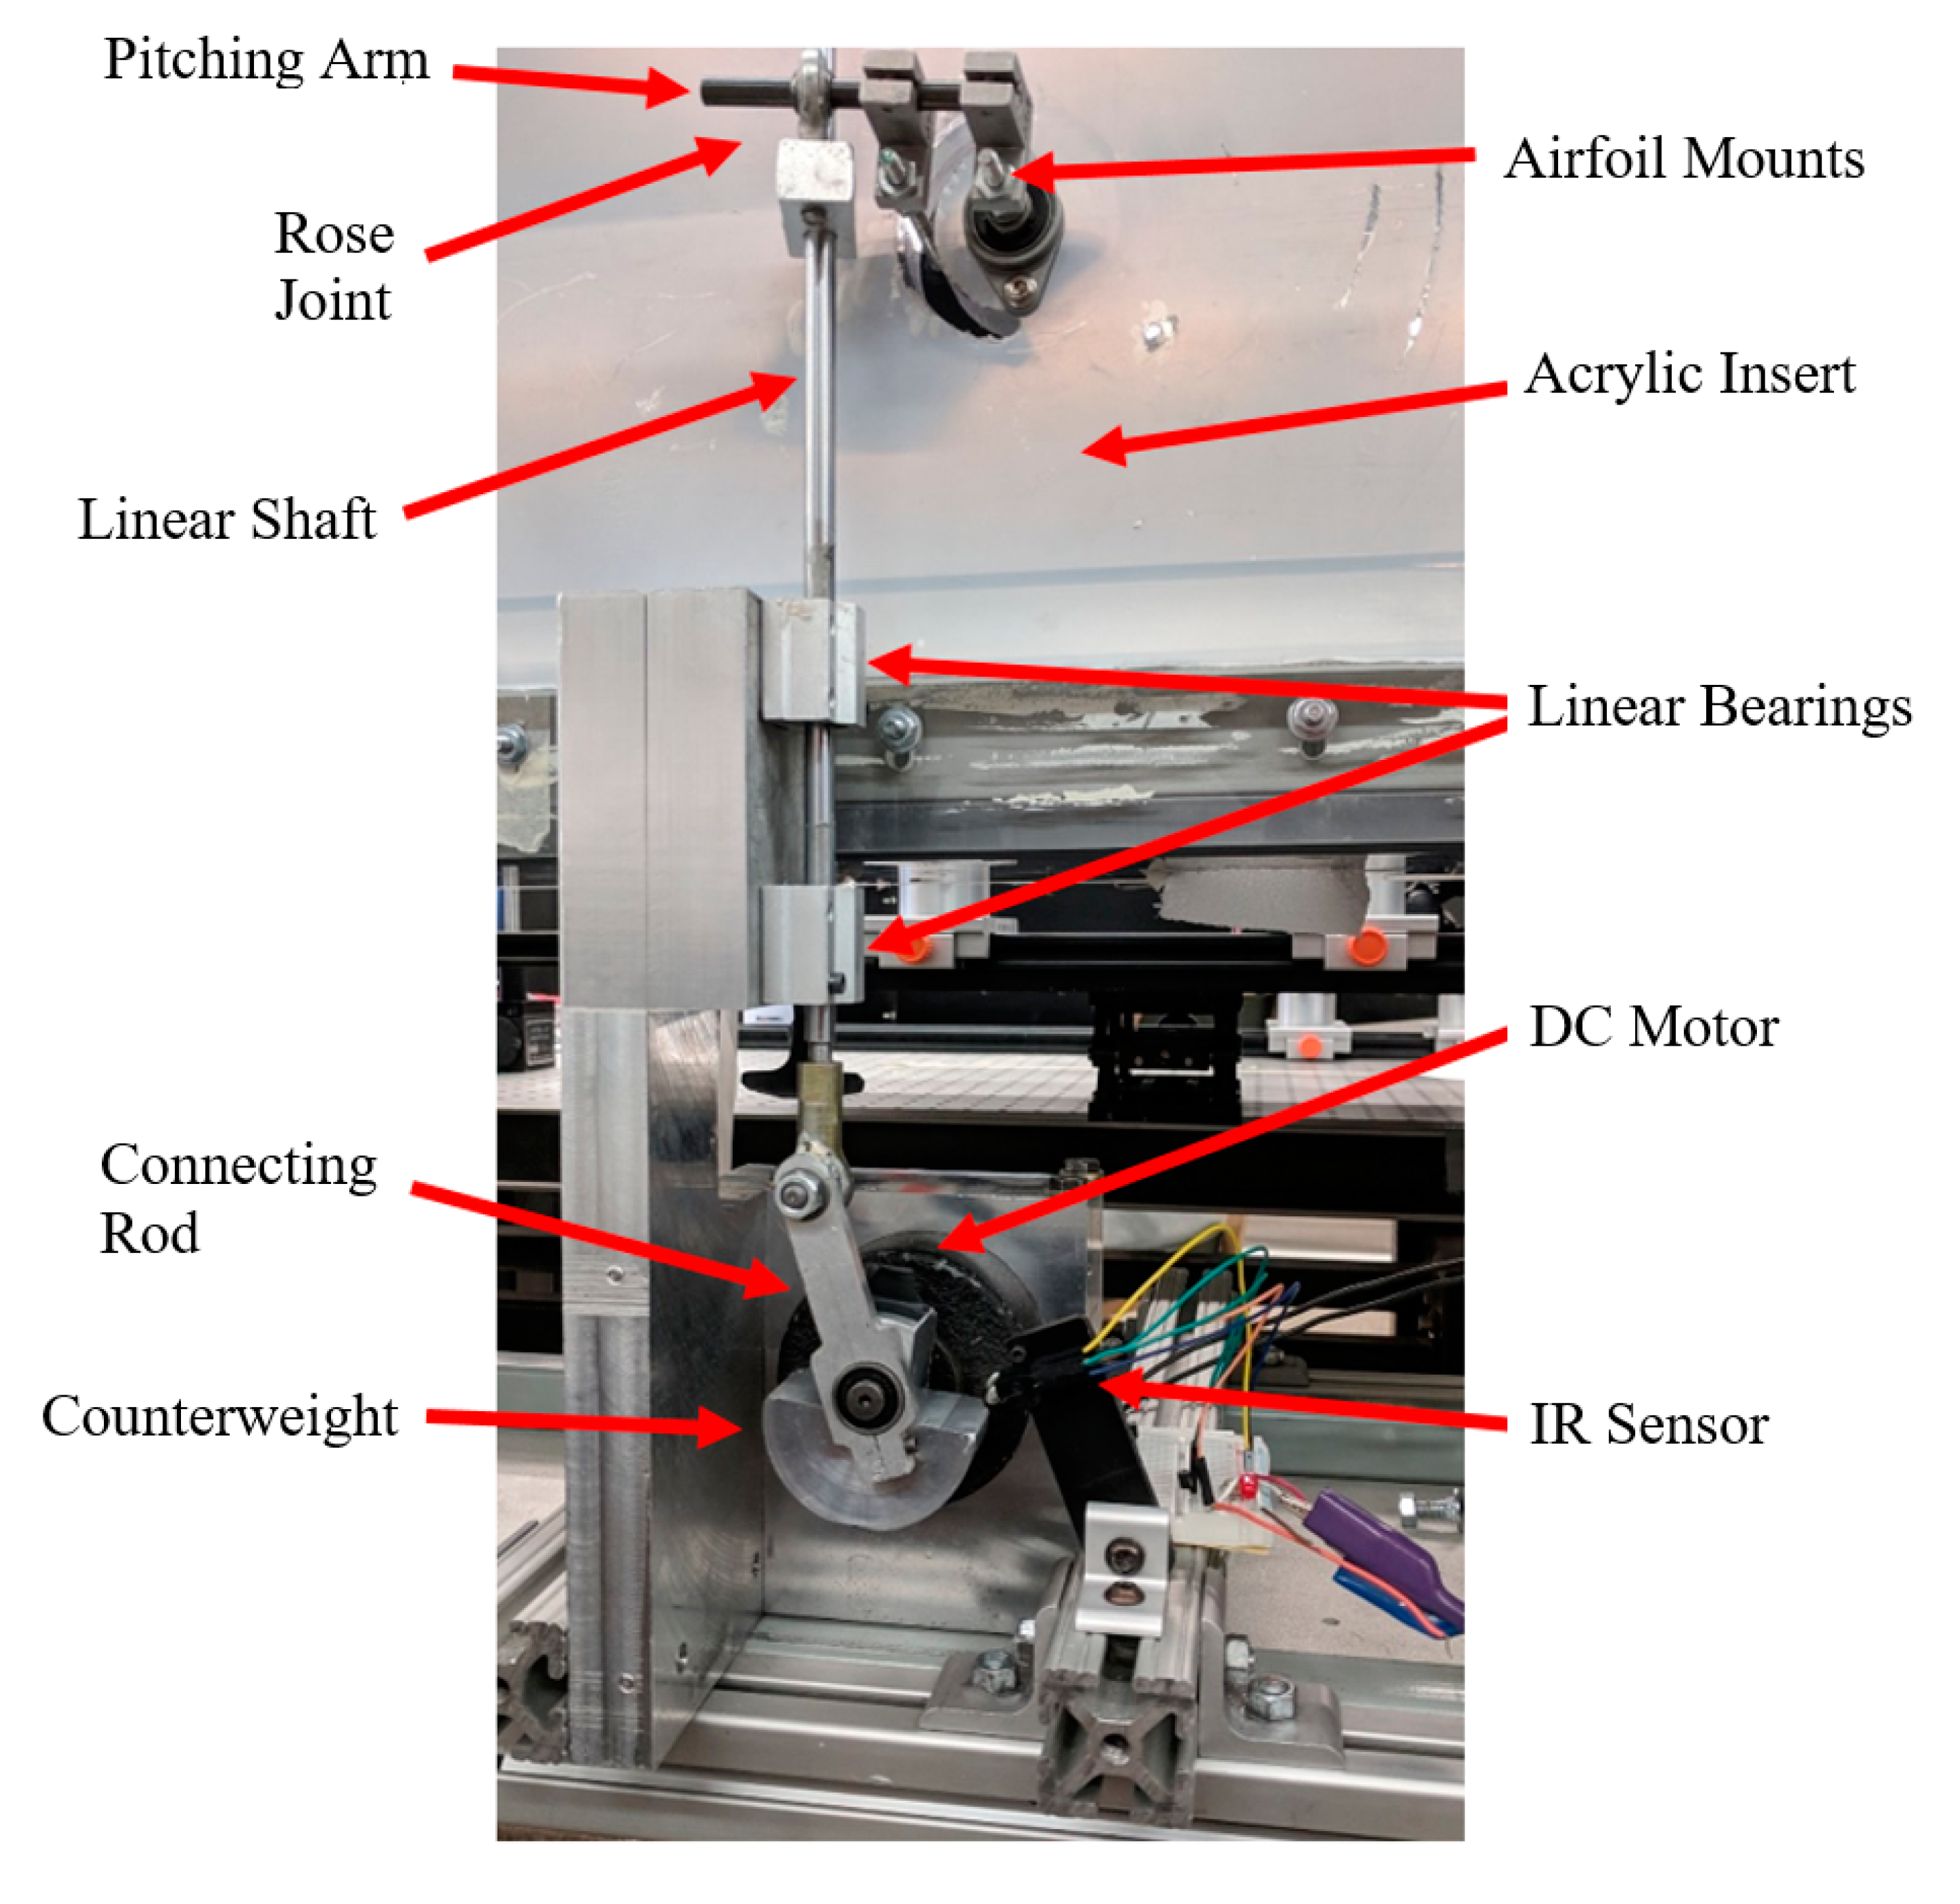
A mechanical oscillator was constructed to actuate the wing at the desired frequency and its components and functionality are described in the following. While the wing was attached to the column that allowed it to rotate freely along its rotation axis, the actuation rod behind the rotation axis was attached to an actuating linear shaft. This shaft rides along a set of linear bearings to keep it on track. A counterweight and connecting arm were machined out of aluminum and arranged in a crankshaft formation to produce the sinusoidal action. A UL 12V DC motor, capable of delivering up to 3000 RPM, was mounted at the center of the counterweight. The connecting arm was located 15 mm away in the radial direction, from the center of rotation, to produce a maximum stroke of 30 mm. The counterweight was made from stock aluminum and intended to possess a high moment of inertia to maintain stability at high frequencies. To achieve greater dynamic balance, half of the counterweight was machined off on one side to counteract the moment applied by the weight of the rod and any loads induced by the wing. The entire fixture was mounted to a thick piece of aluminum connected to a platform adjacent to the wall of the wind tunnel. Figure 2 shows the assembly and part components. A rose joint that allows traveling freely on another shaft called the pitching arm was fixed to the end of the linear shaft. The pitching arm was connected to the rods inserted into the wing and protruded through an acrylic insert. Although the model could deliver the necessary parameter values of interest, it still produced a considerable amount of transverse vibration due to the unbalanced dynamic load. Future considerations are being implemented to eliminate unwanted interference from the apparatus while in operation using a more balancing counterweight, lighter push rod, and a more robust connecting solution to fix it to the pivoted wing. The linear bearings and shaft were some of the few parts which were purchased new for this current design.

2.2. Particle Image Velocimetry

To characterize the dynamic stall phenomena, the flow was first captured using 2D PIV [28]. Fundamentally, PIV captures two consecutive instances of the flow separated by a few microseconds and cross-correlation is used to determine the displacement of particle ensembles in the flow. From the displacement and time separation between instances, the velocity of the ensembles (small groups of particles forming small interrogation windows) can be determined. The setup was such that it could capture velocity fields of the wing at several predetermined regions.
It is important to note that this is an oscillating system and the data of interest is at several specified angles of attack (or ‘phases’). Therefore, the data acquisition needed to be synchronized (‘phase-locked’) with the angle-of-attack to capture data at the desired phases. To accomplish this, a feedback system was incorporated into the actuator that allowed consistently capture data at the desired moment of actuation each to match the phase of interest. The collection of phase-locked data sets then permits the performance of phase-averaged analyses, as it will be discussed in the following sections.
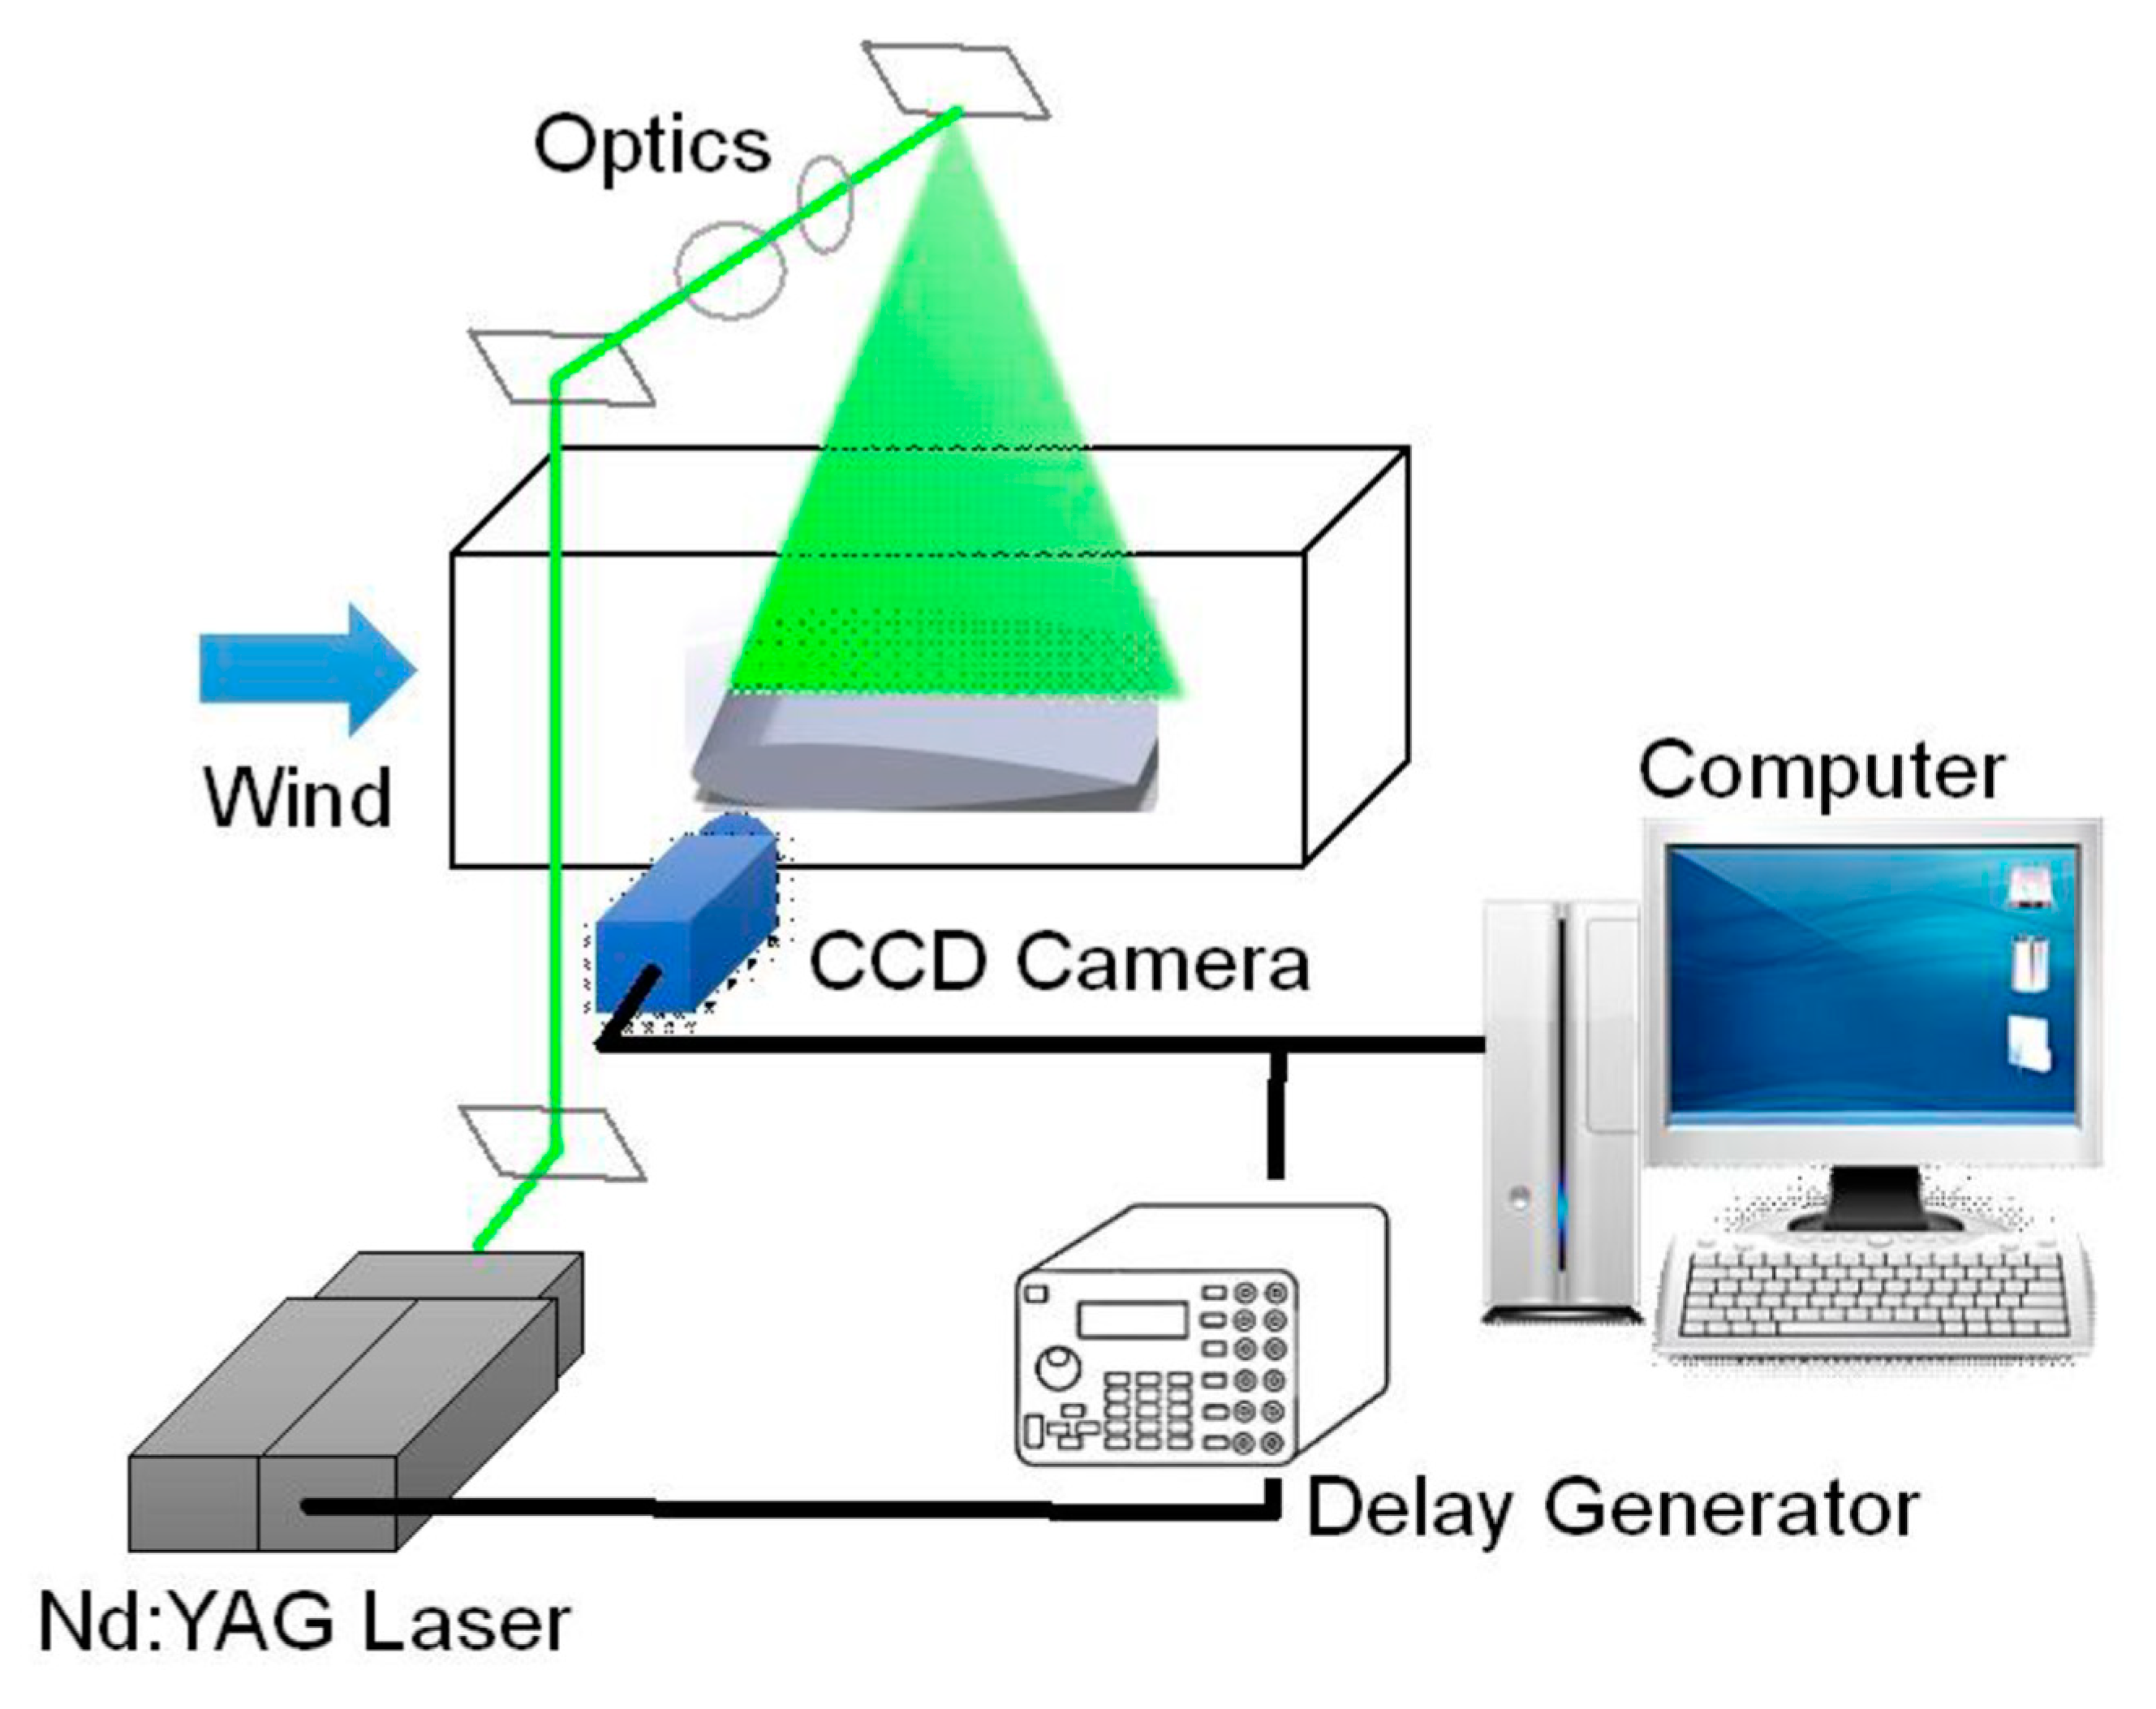
The schematic setup of the PIV system is shown in Figure 3. A wing model was placed in the wind tunnel test section and was illuminated by a double-pulsed Nd:YAG laser (NewWave MiniLase-III) that emitted two laser pulses of ~100 mJ each, at a wavelength of 532 nm, and with a repetition rate of 15 Hz. The combined laser beam was then shaped into a laser sheet (thickness < 1 mm) using a set of mirrors and spherical and cylindrical lenses. The flow, seeded with atomized ‘DEHS’ oil droplets with particle sizes of less than 1 μm to track the flow and scatter laser light, was imaged by two La Vision IMAGER LX 2M ‘double-frame’ cameras. These cameras have a resolution of 1608 × 1208, an interframe capability of 200 ns, and were setup with their axis perpendicular to the laser sheet for image acquisition. The use of two cameras in parallel yielded higher resolution in the leading and trailing edges. For the flow conditions and magnification parameters, the time between double-frame images was set to Δt = 25 μs. The cameras and the Nd:YAG lasers were connected to a workstation for imaging and data acquisition, and the timing for synchronization of the images and the laser illumination was controlled with a ‘Pulse/delay Generator’. LaVision ‘DaVis 8.1’ software was used to control the data acquisition parameters, and it was activated automatically by an external trigger from the pitching mechanism described in a subsequent section.
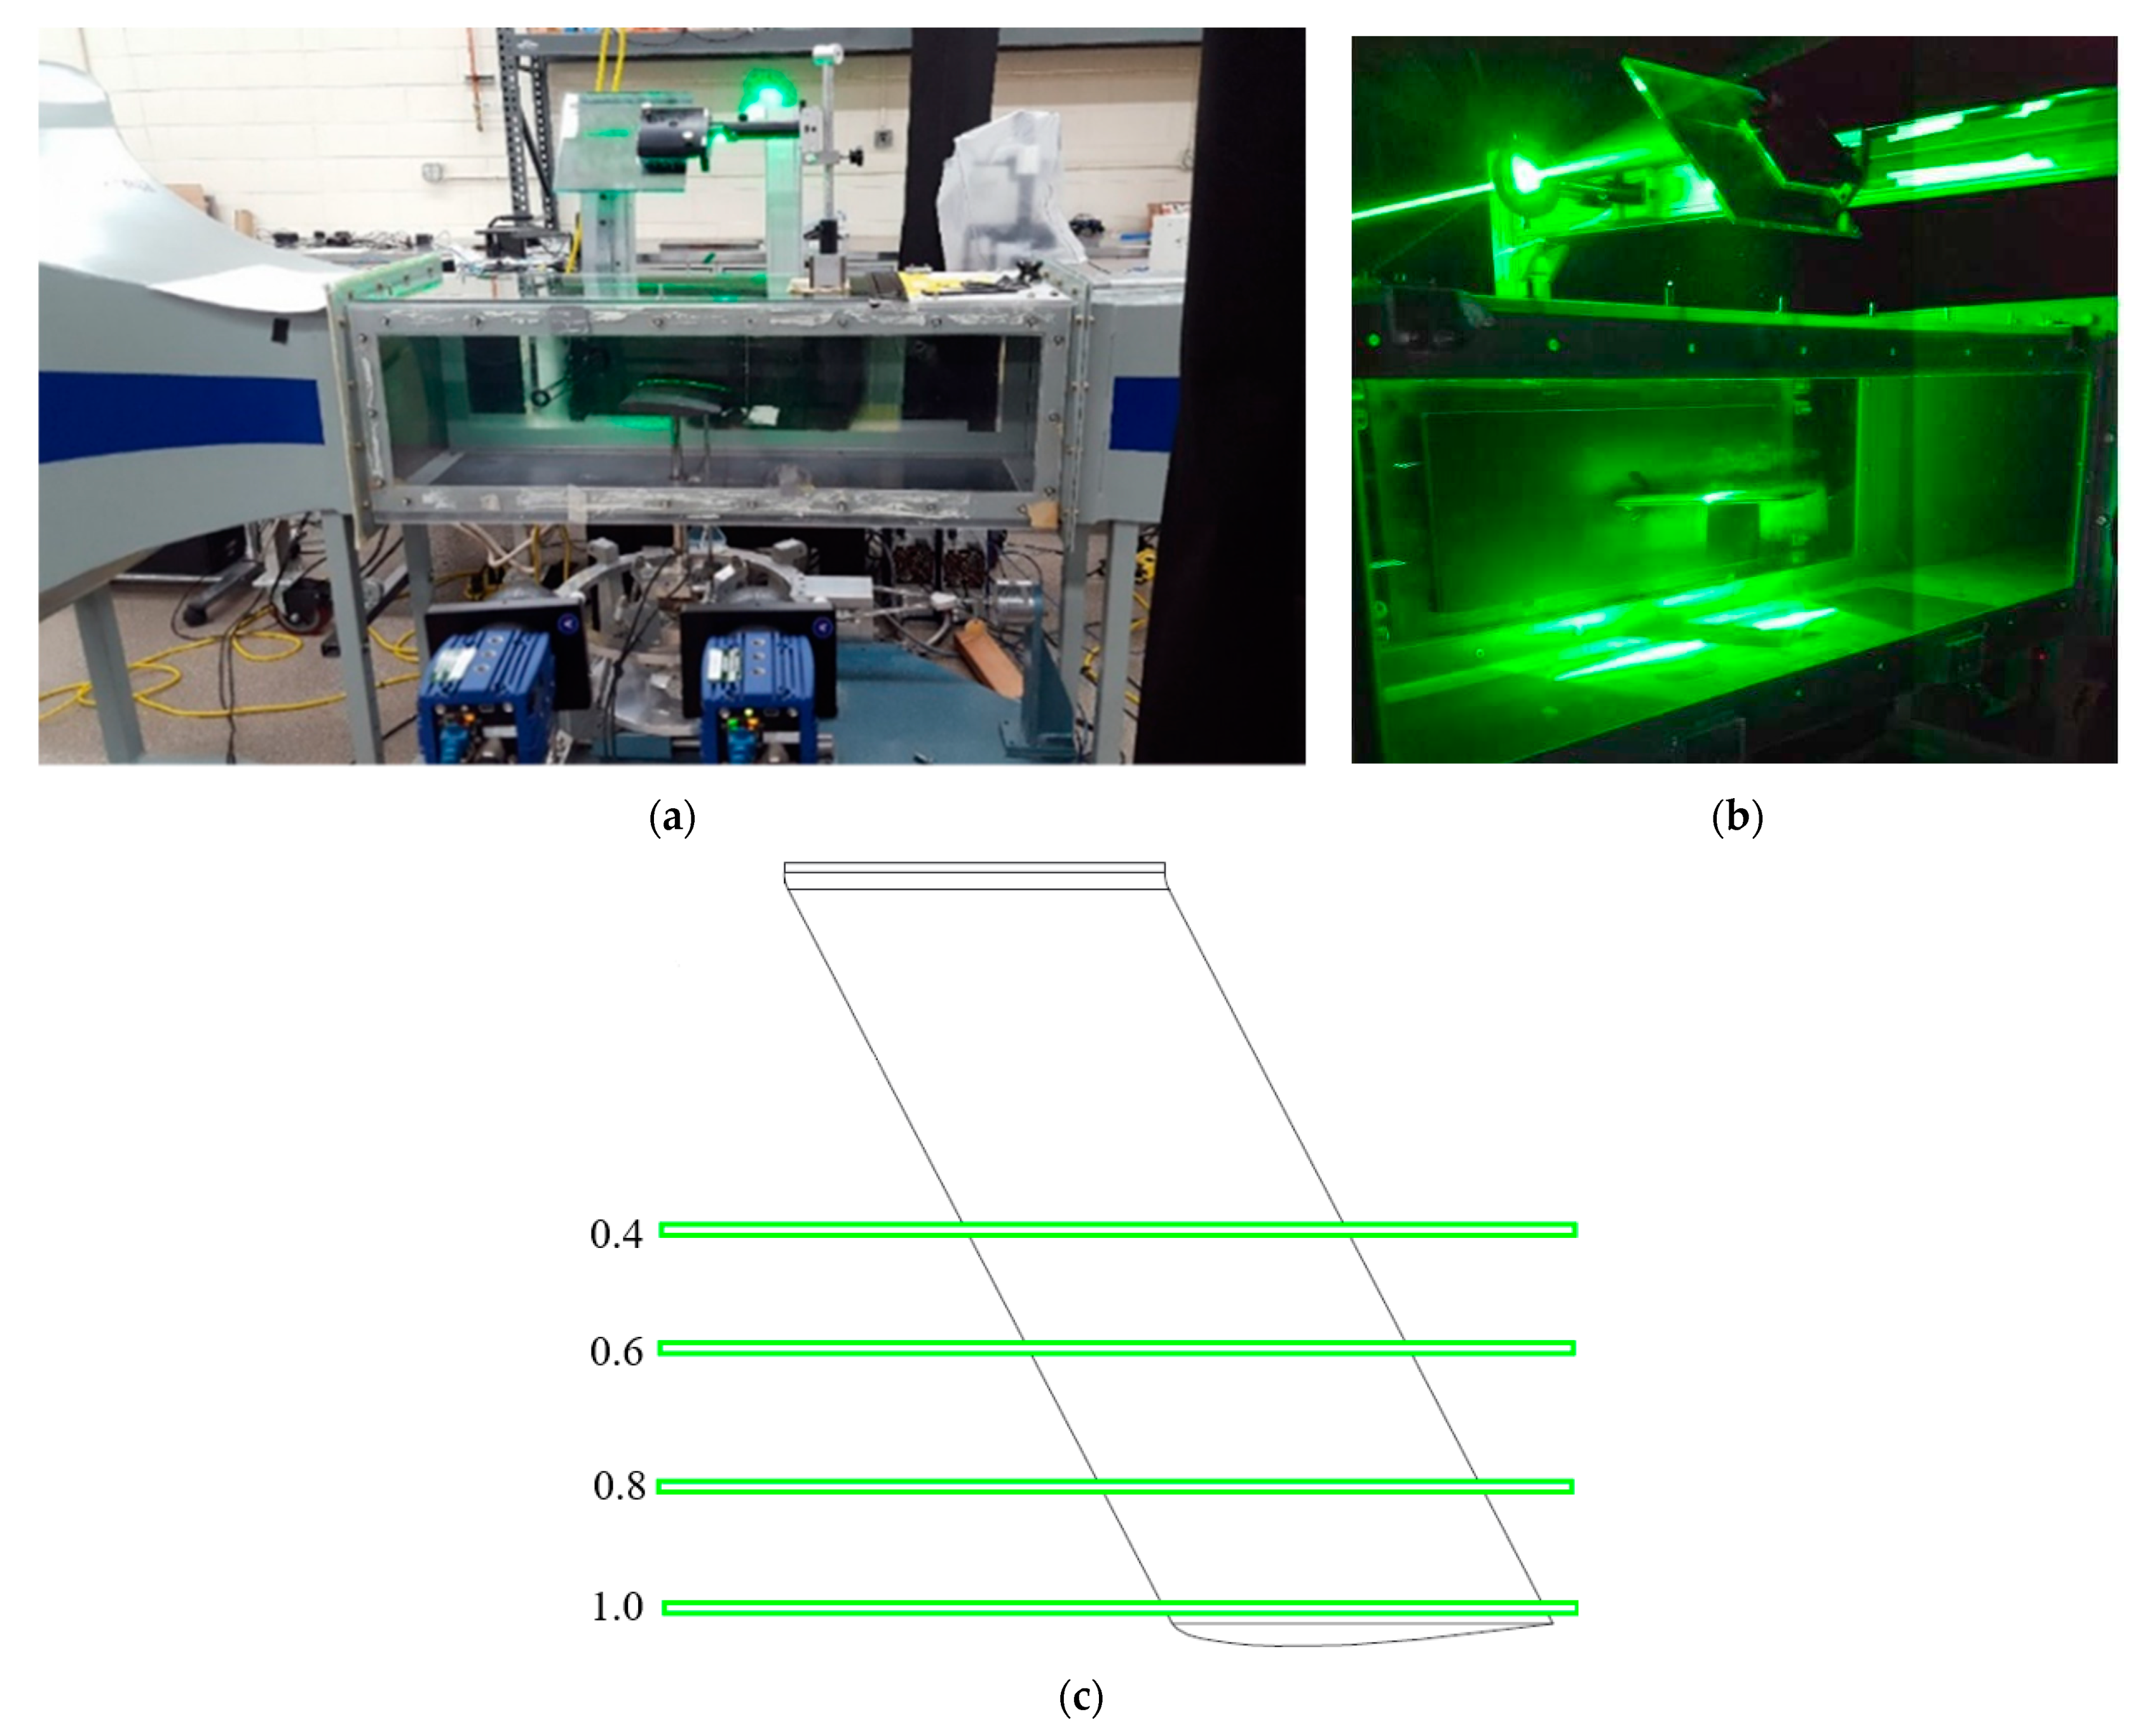
The photography in Figure 4 show the setup (Figure 4a) and the data capture (Figure 4b) during testing while the laser was firing. The wing being tested and the seeded particles can be seen in the center of the wind tunnel section. The seeding of the air during testing was acquired by dispersing the atomized ‘DEHS’ oil into the inlet area corresponding only to the location of the projected laser volume in the test section. Before collecting the data, magnification calibration was performed using LaVision ‘DaVis’ software. For data processing, each wing angle of attack required a different mask to remove areas that did not have the laser illumination to provide a clean reconstruction of the airflow that was acquired in each data set. Flat-black and ‘Dykeem Steel Red’ paints were applied to the surface of the wing to minimize the laser reflection from the surface of the wing. The red paint absorbed the green laser color, and only a dim red reflection remained; this remaining light could be readily filtered out in the image with a camera green filter if needed.
The scope of this investigation mainly focused on the top surface of the wing while undergoing a pitching maneuver. The freestream flow velocity immediately upstream the wing LE and downstream the wing TE was captured to gain information regarding the incident flow characteristics as it interacted with the wing and the flow characteristics after the wing TE. These areas are of the greatest interest since they can reveal the wing’s stall characteristics.
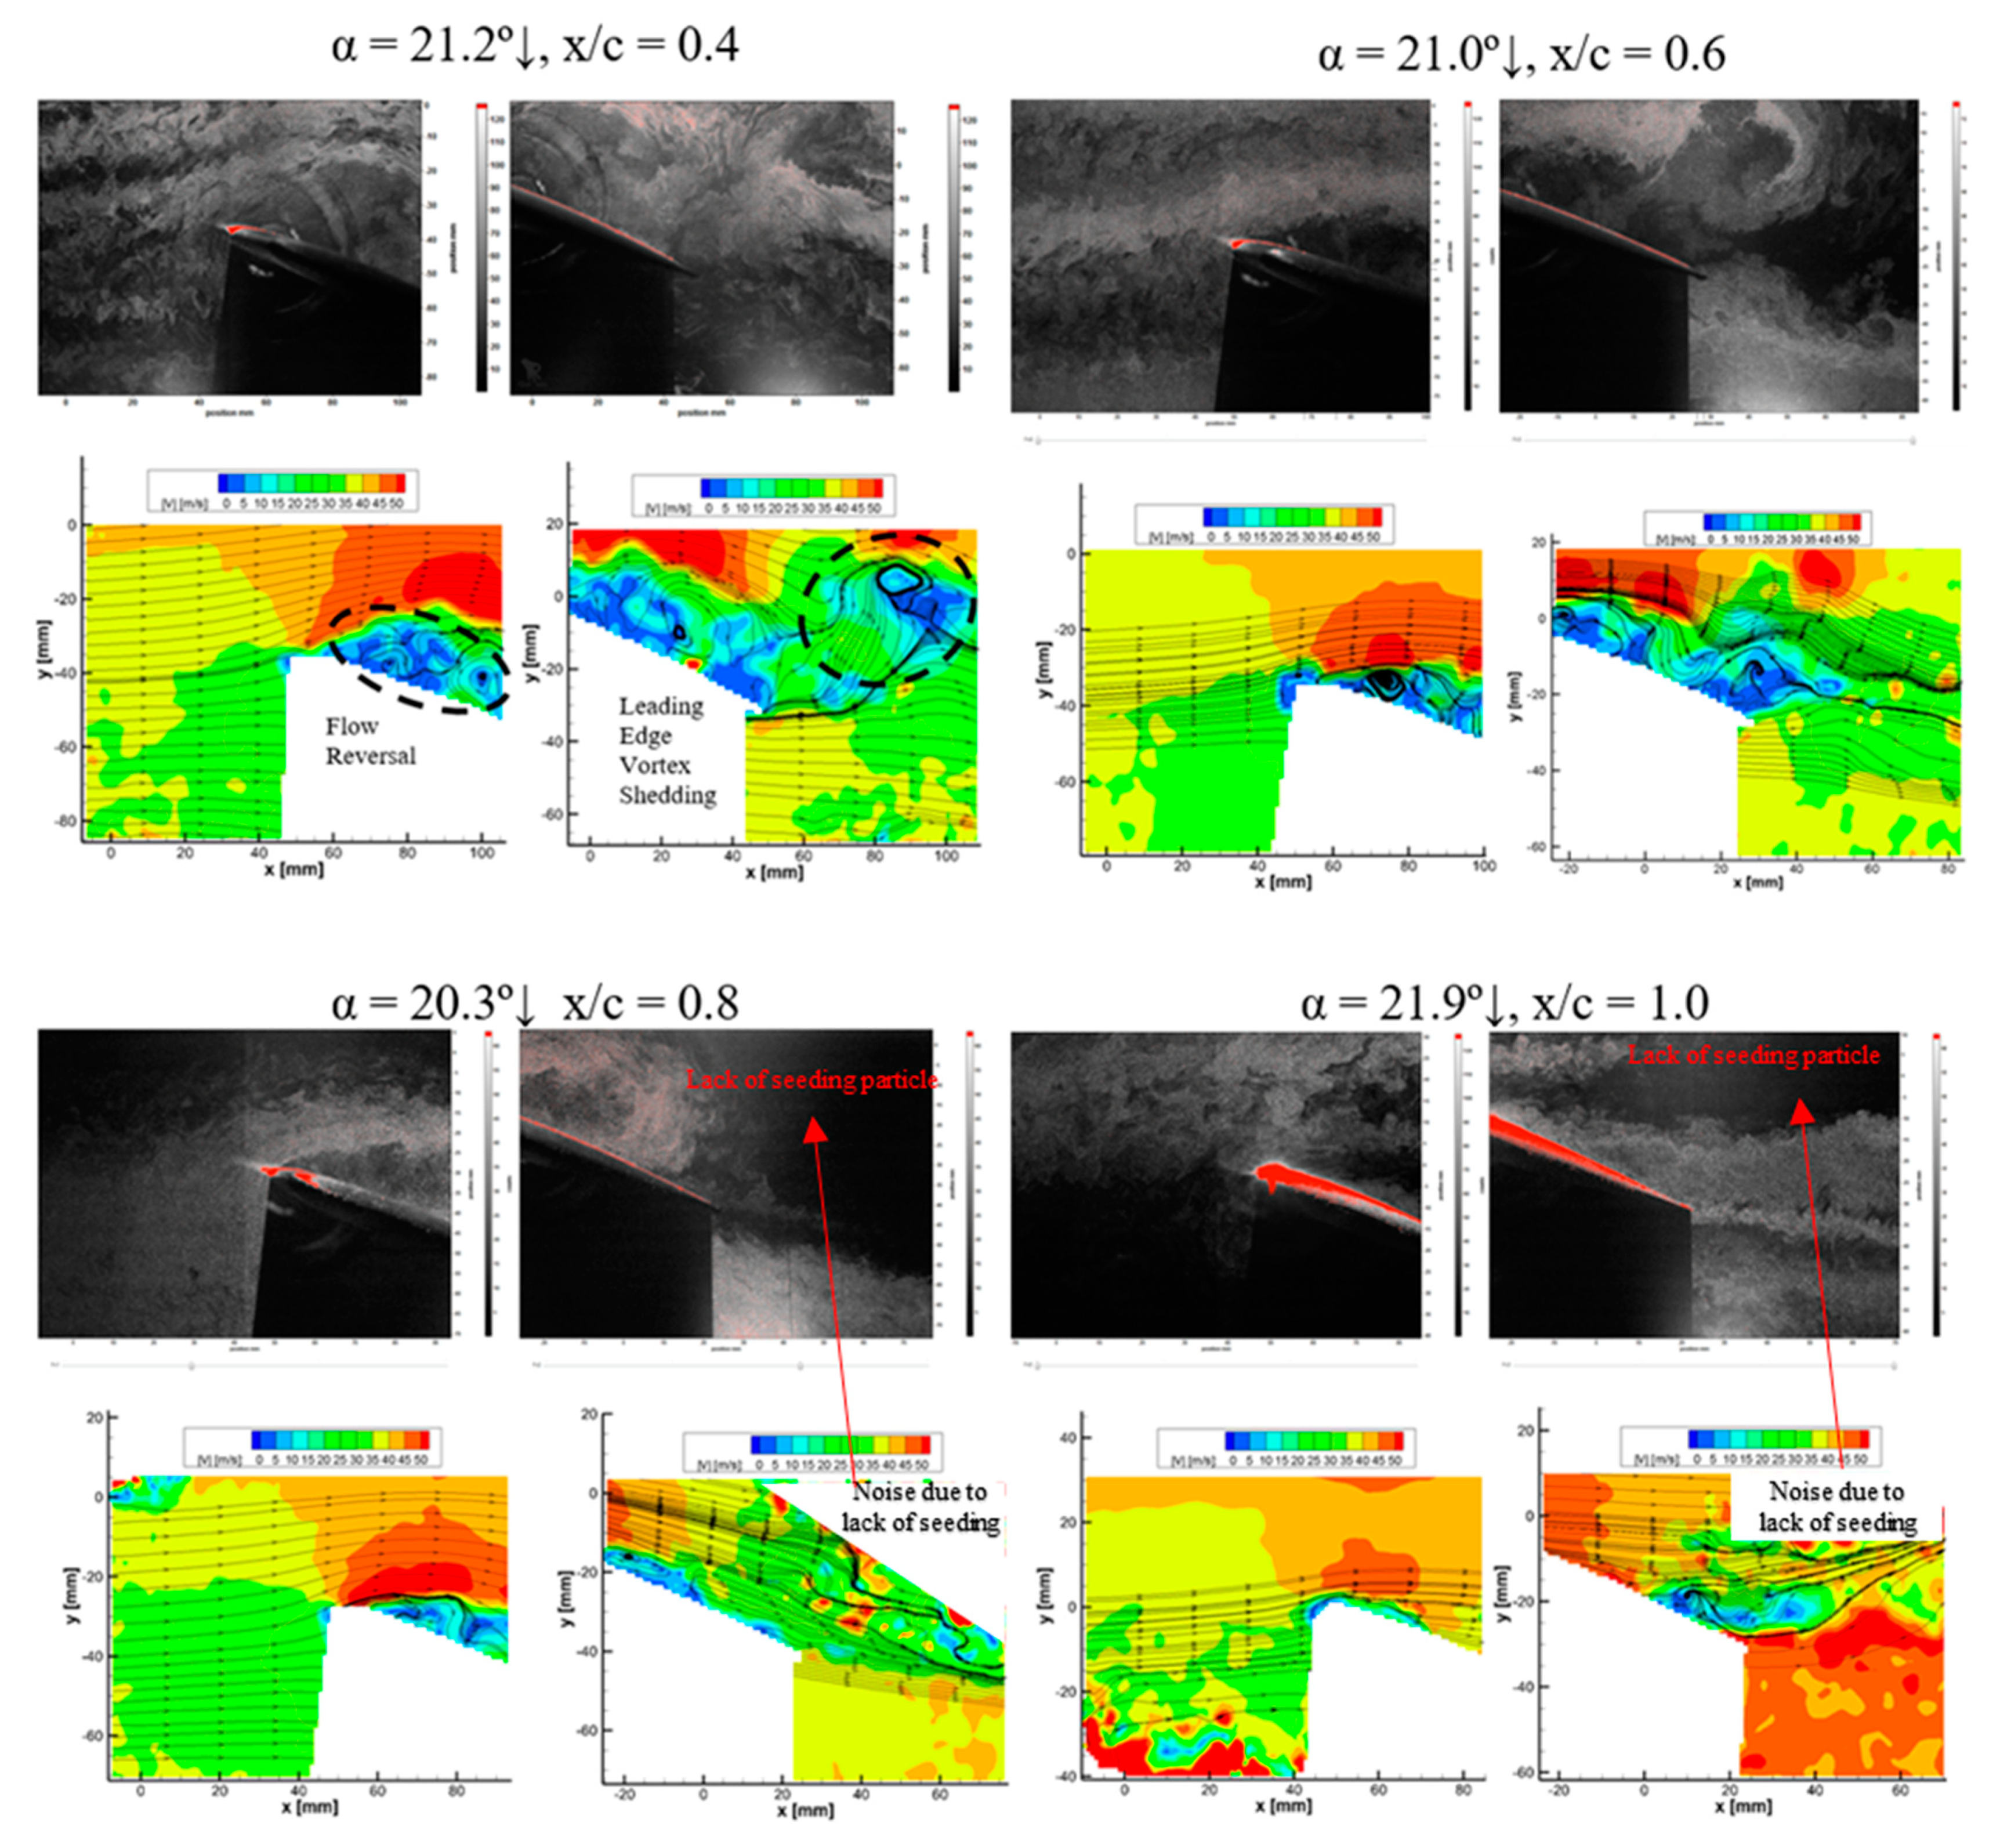
Each wing was tested at four stations along the wingspan (Figure 4c). For each 2D PIV data acquisition campaign, the flow was evaluated at x/c = 0.4, 0.6, 0.8, and 1.0 of the wingspans. Substantial data was extracted from these regions for analysis.
Data was only captured at those locations, and the fact that the laser intersection location at the wing surface changes during the pitching had to be considered during analyses. Although it would be ideal for capturing more data near the wing root, these four sections provided a substantial amount of data for the scope of the investigation. Flow structure and reversal can be readily observed using the 2D PIV data acquired. For example, flow reversal is strongly indicative of complete stall when the flow becomes completely detached from the object’s surface. This fact is in accordance with the Kutta Condition, which states that “a body with a sharp trailing edge moving through a fluid will create about itself a circulation of sufficient strength to hold the rear stagnation point at the trailing edge.” Flow reversal can be easily observed with 2D PIV as used in this investigation and it is useful for understanding when the wing stalls and when flow completely detaches.

2.3. Pressure Sensitive Paint (Turbo PSP)

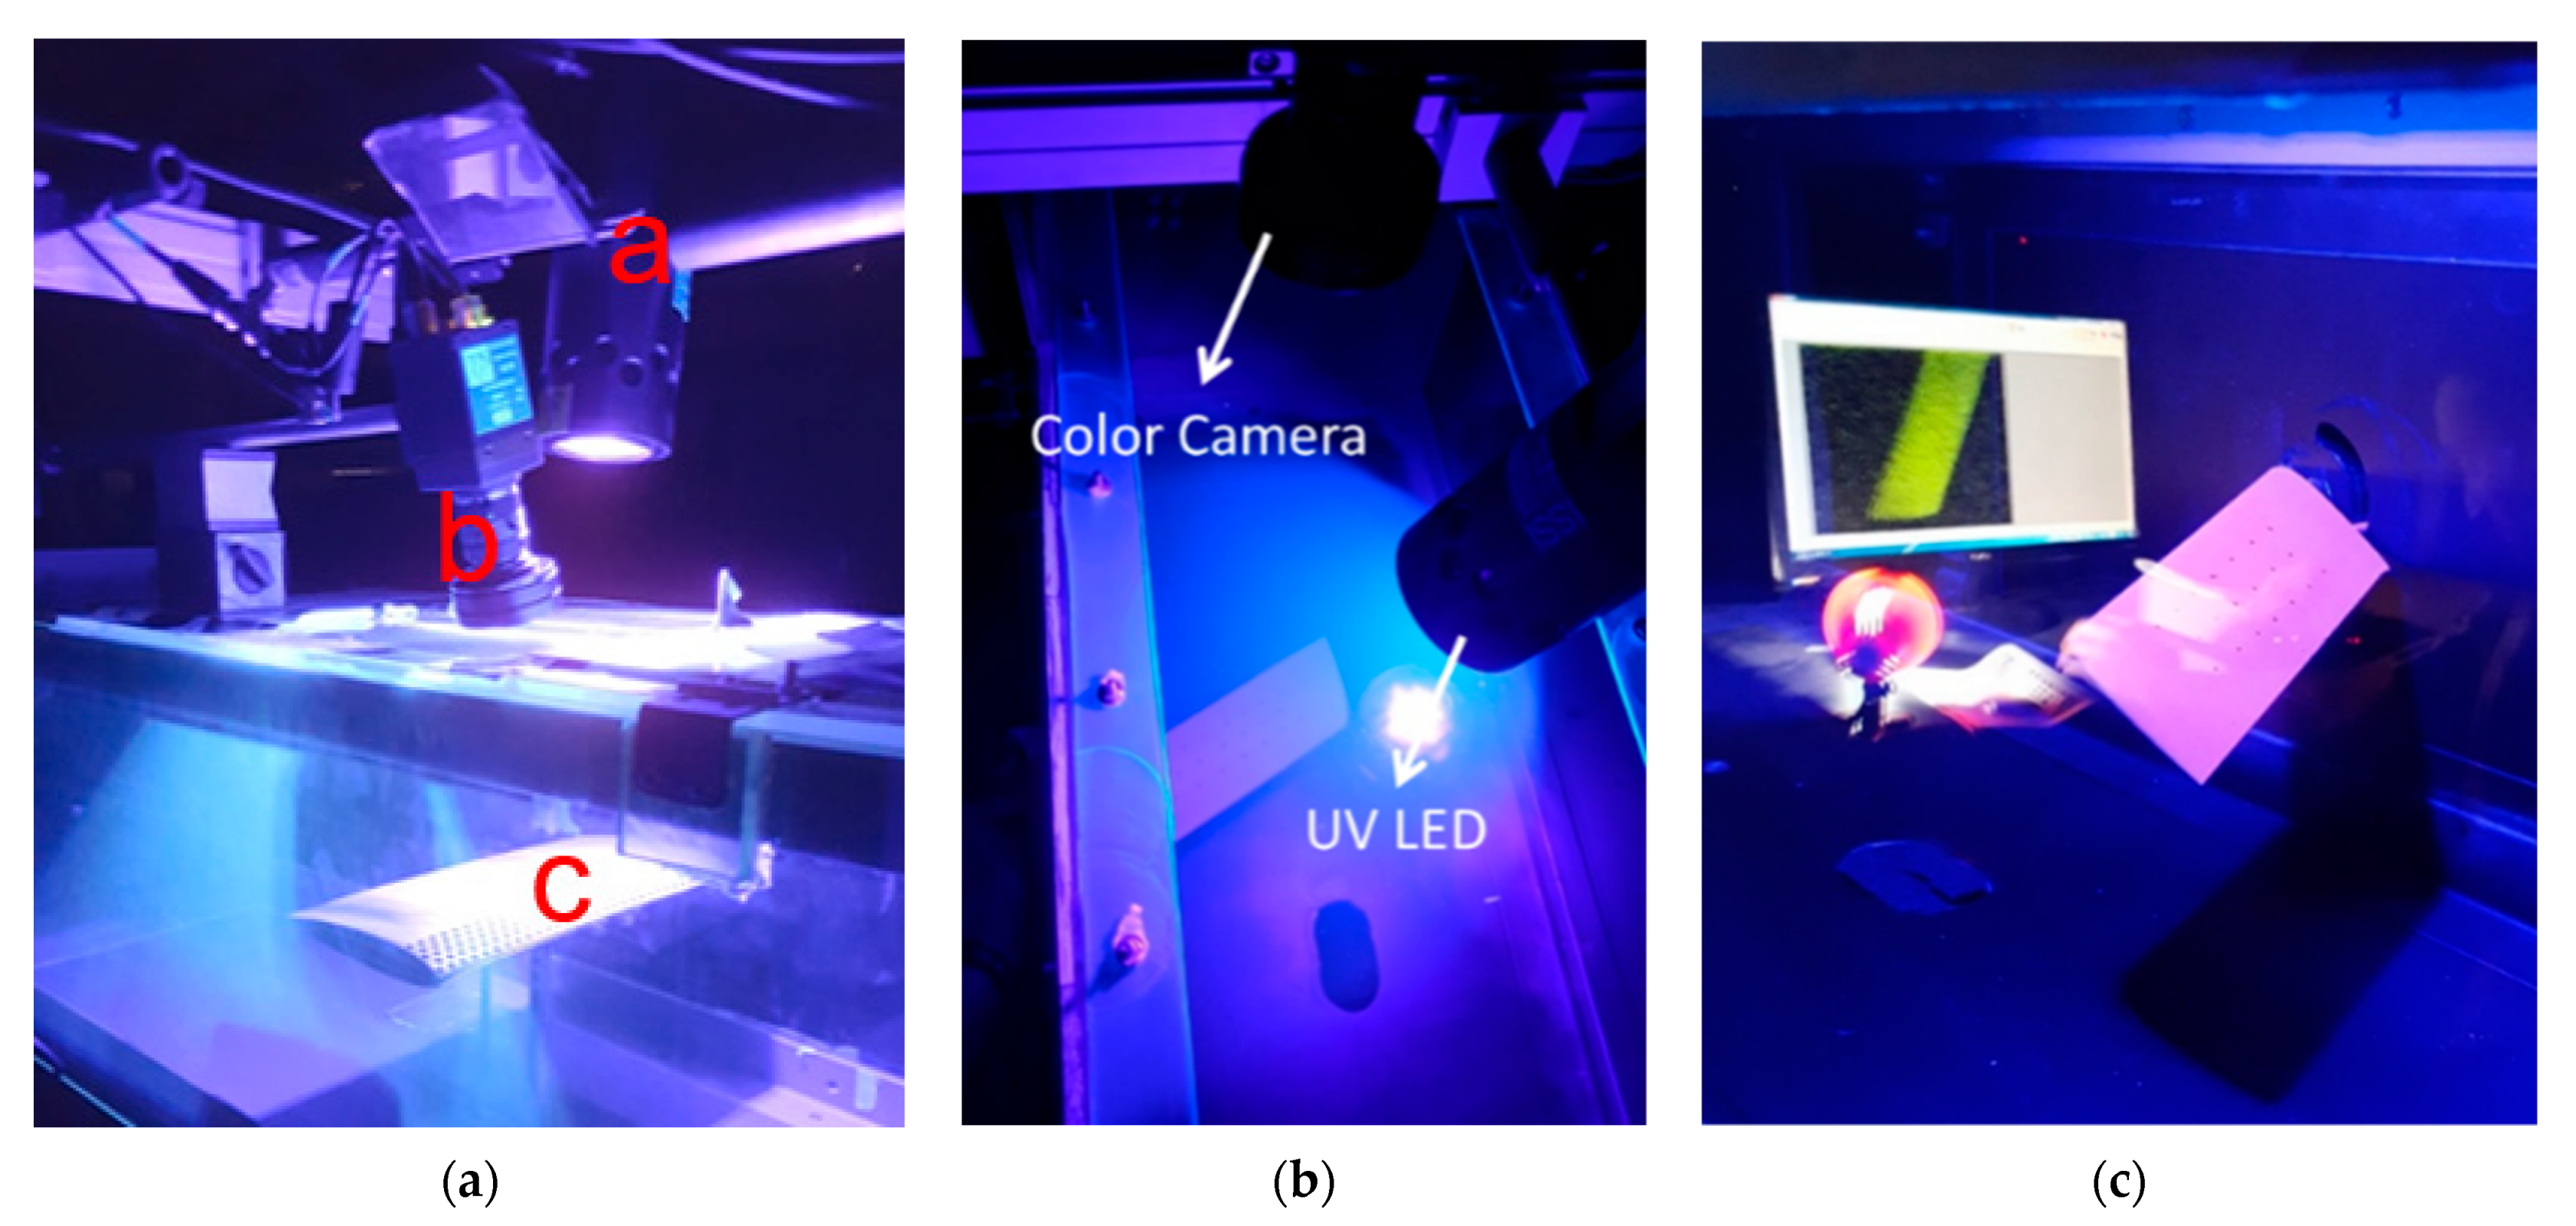
To complement PIV and to more fully characterize the dynamic stall phenomena, wing surface pressure was measured using Turbo PSP [19,20,23,24,25,26] from ISSI Inc. Given the high frequency of the pitching motion, fast PSP techniques are needed to be able to gather data at a given angle of incidence (phase) with fast response. In addition, a set of typically 64 phase averages were acquired to collect more signal from the paint at each phase [23,24,25,26]. The PSP techniques can measure the pressure accurately if the dynamic pressure is large enough (e.g., >1 kPa); therefore, in these experiments, the focus was on the higher Re number flow. In addition to the 3D printed wings, replicas with better surface quality were machined out of aluminum in a CNC machine. Following PSP practices, the aluminum surface was first spray-painted with a screen layer. The screen layer was cured at room temperature for one hour to minimize paint temperature sensitivity. After the screen layer application, the Turbo pressure-sensitive paint was applied on top of the screen layer. The experimental setup of PSP included a UV LED light mounted on top of the tunnel that illuminated the wing surface. A 35 Hz frame-rate color camera with a 610 nm red filter and an anti-reflection filter was placed on top of the tunnel to acquire the data. The LED light was positioned very close to the top surface of the wind tunnel to obtain noise-free ‘wind-off’ and ‘wind-on’ images [23,24,25,26]. The LED light was kept on continuously, and the exposure time was controlled with the camera. The camera exposure time was set to a value that permits the accumulation of enough signal during an exposure while minimizing wing motion during exposure. A typical PSP setup is shown in the photography of Figure 5.
Light off (background), wind-off, and wind-on images were recorded to reconstruct the pressure surface map. These images were recorded with the phase-locked at each angle of attack studied. As stated earlier, having low dynamic pressure makes it very challenging to obtain enough signal from an instantaneous image. Thus, during the pitching cycle, an average of 64 phase-locked frames with exposures on the order of milliseconds each was obtained to get a better averaged signal from the PSP data. It should be noted that at the frequency of these tests (15 Hz) the exposure time yielded ~2.5 degrees of wing motion (or phase change) and thus the capture comprises an integration of the signal during that time and phases. This yields some blurriness/averaging from the wing motion instead of a truly instantaneous map at a given phase. The use of faster-response PSP, such as the fast-porous single-shot lifetime PSP [24], which typically uses short duration excitation sources such as a pulsed Nd:YAG laser along with PIV cameras, would allow gathering data with shorter exposures times, but it is beyond the scope of this current investigation.

2.4. Synchronous Triggering Design for PSP Experiment

The color camera was synchronized with the specific pitching angles (‘phases’) of the pitching cycle using the following method. A basic circuit was built using an infrared sensor and a transistor which would be the source of the external trigger. A small piece of tape would pass between the beam of the infrared sensor, which would close the gate to a 2222 N transistor and create a pulse. This output pulse could be measured easily with an oscilloscope to obtain the frequency of rotation. Figure 6a shows the basic function of the rudimentary trigger circuit.
Given that the period of rotation is the same for the rotating crank as it is for the pitching cycle, the delay necessary to offset the laser can be easily calculated. For the Turbo PSP, only the camera needs to be triggered since the UV lamp illuminates continuously. The same pulse delay generator was used to control all the cameras and lasers described previously, but instead of the pulse signal being generated by the ISSI PSG-2 delay generator software, an external trigger was generated from the connection between the external trigger circuit to the trigger input of the delay generator. The output of the external trigger is a square wave, and the frequency can be measured using an oscilloscope. Figure 6b shows an example of the external trigger (yellow) and the signal sent to the laser (green) from the oscilloscope screenshot. The frequency of both signals can be seen outlined at the bottom. Intrinsically, when there is no delay on the trigger, the camera will capture data when the wing is at 16° pitching up. Knowing the frequency of actuation, the time delay can be calculated from the period and the desired angle of attack.
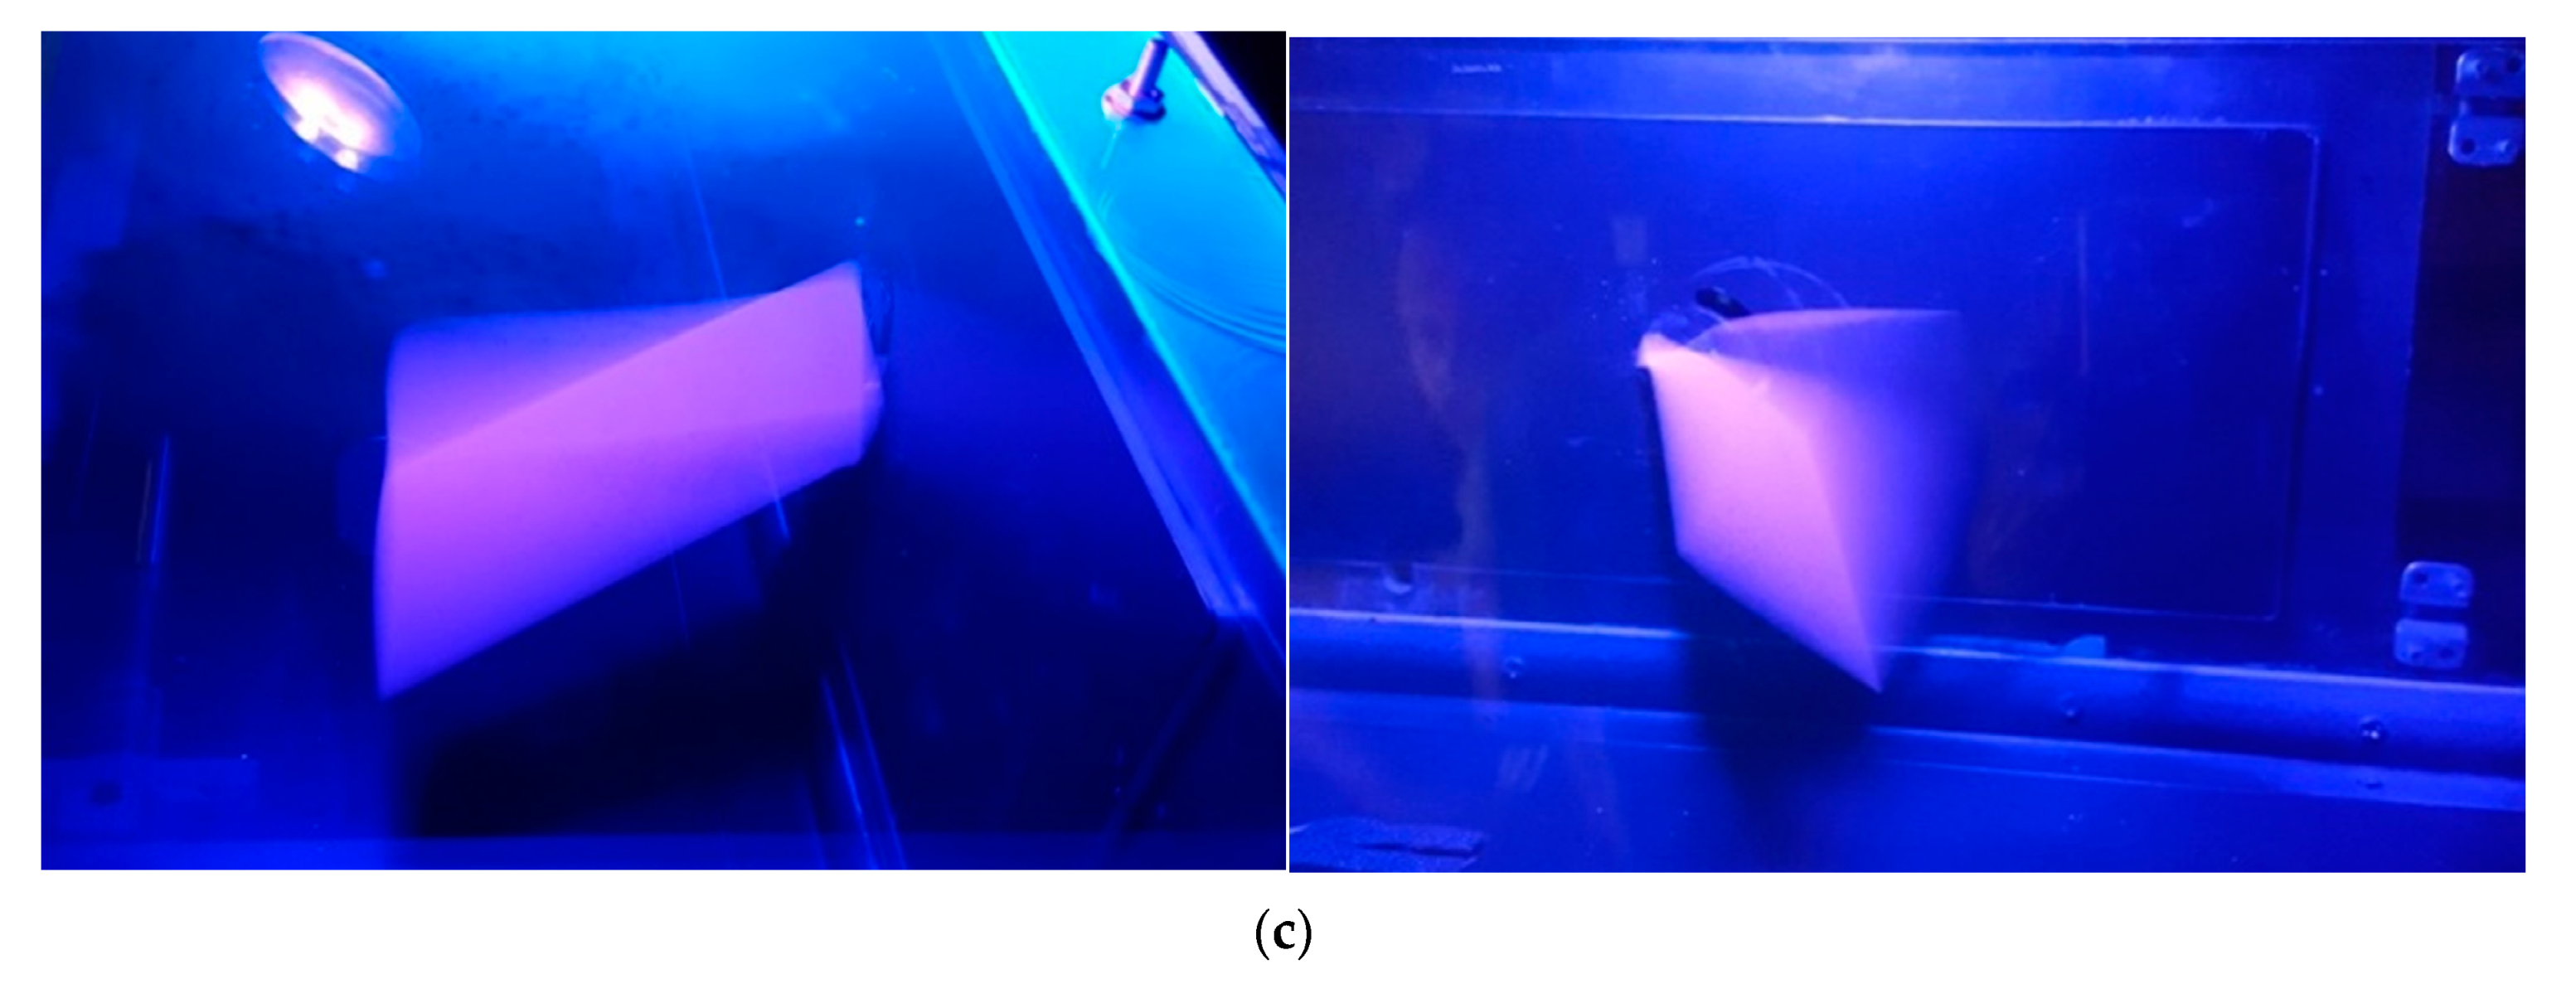
Long exposure photography showing a swept wing during pitching at ~30 Hz is shown in Figure 6c and illustrates the actuator motion. The pinkish color is due to the paint fluorescence.

2.5. Flow Parameters during PIV and PSP Testing Campaigns

During the testing campaign, the free stream flow Mach number was set at M = 0.1 (or approximately 36.5 m/s at T = 25 °C). The Reynolds number based on the wing chord (76.2 mm) was Rec = 2 × 10⁵. The wing dimensions were chosen to allow the tip to have free boundary conditions away from the wind tunnel wall by being in the center of the tunnel width (span). The minimum and maximum pitching angles relative to the free stream flow were αmin = 4° and αmax = 22°, respectively, giving a maximum pitching range of Δα = αmax − αmin = 18°. With this pitching range and the controlled environment defined by the free stream flow parameters, a nominal reduced frequency of k = πfc/U = 0.2 was set. However, during the PSP campaign, the frequency of the higher sweep pitching wings was reduced to 15 Hz due to structural robustness, which is equivalent to 0.1 as nominal reduced frequency. The experimental parameters are summarized in the following Table 1.

3. Results and Discussion

In this section, results from the PIV and PSP campaigns are presented and discussed. First, the 2D PIV campaign results for the three swept angles are provided. They include instantaneous velocity contours during the pitching cycle of the wing. Following that, the Turbo PSP results are presented and discussed. They include the phase averages of 64 frames.
The flow features conferred from the significant number of measurements and information generated from the planar PIV are presented first. For example, it was observed that the effect of increasing the sweep angle was to advance the stall phase onset. The unswept wing was able to achieve the highest pitching angle before the complete stall occurred while also possessing the smallest laminar separation bubble while pitching upward. Interestingly, after the wing had achieved its maximum pitching angle and started to pitch downward, the laminar separation bubble would collapse, and the flow would reattach to the top surface near the leading edge earlier than expected. The PIV data was captured for two phases of the pitching cycle: an upstroke (↑) and a downstroke (↓). For reference, when the leading edge (LE) goes up and the trailing edge (TE) goes down, the motion is called upstroke (↑), or pitching up, and the angle of attack increases. The reverse direction of motion of LE and TE is called downstroke (↓), or pitching down, and the angle of attack decreases. The schematic of the upstroke and downstroke phases is shown in Figure 7.

3.1. Flow Structure over Unswept Pitching Wing, Λ = 0°

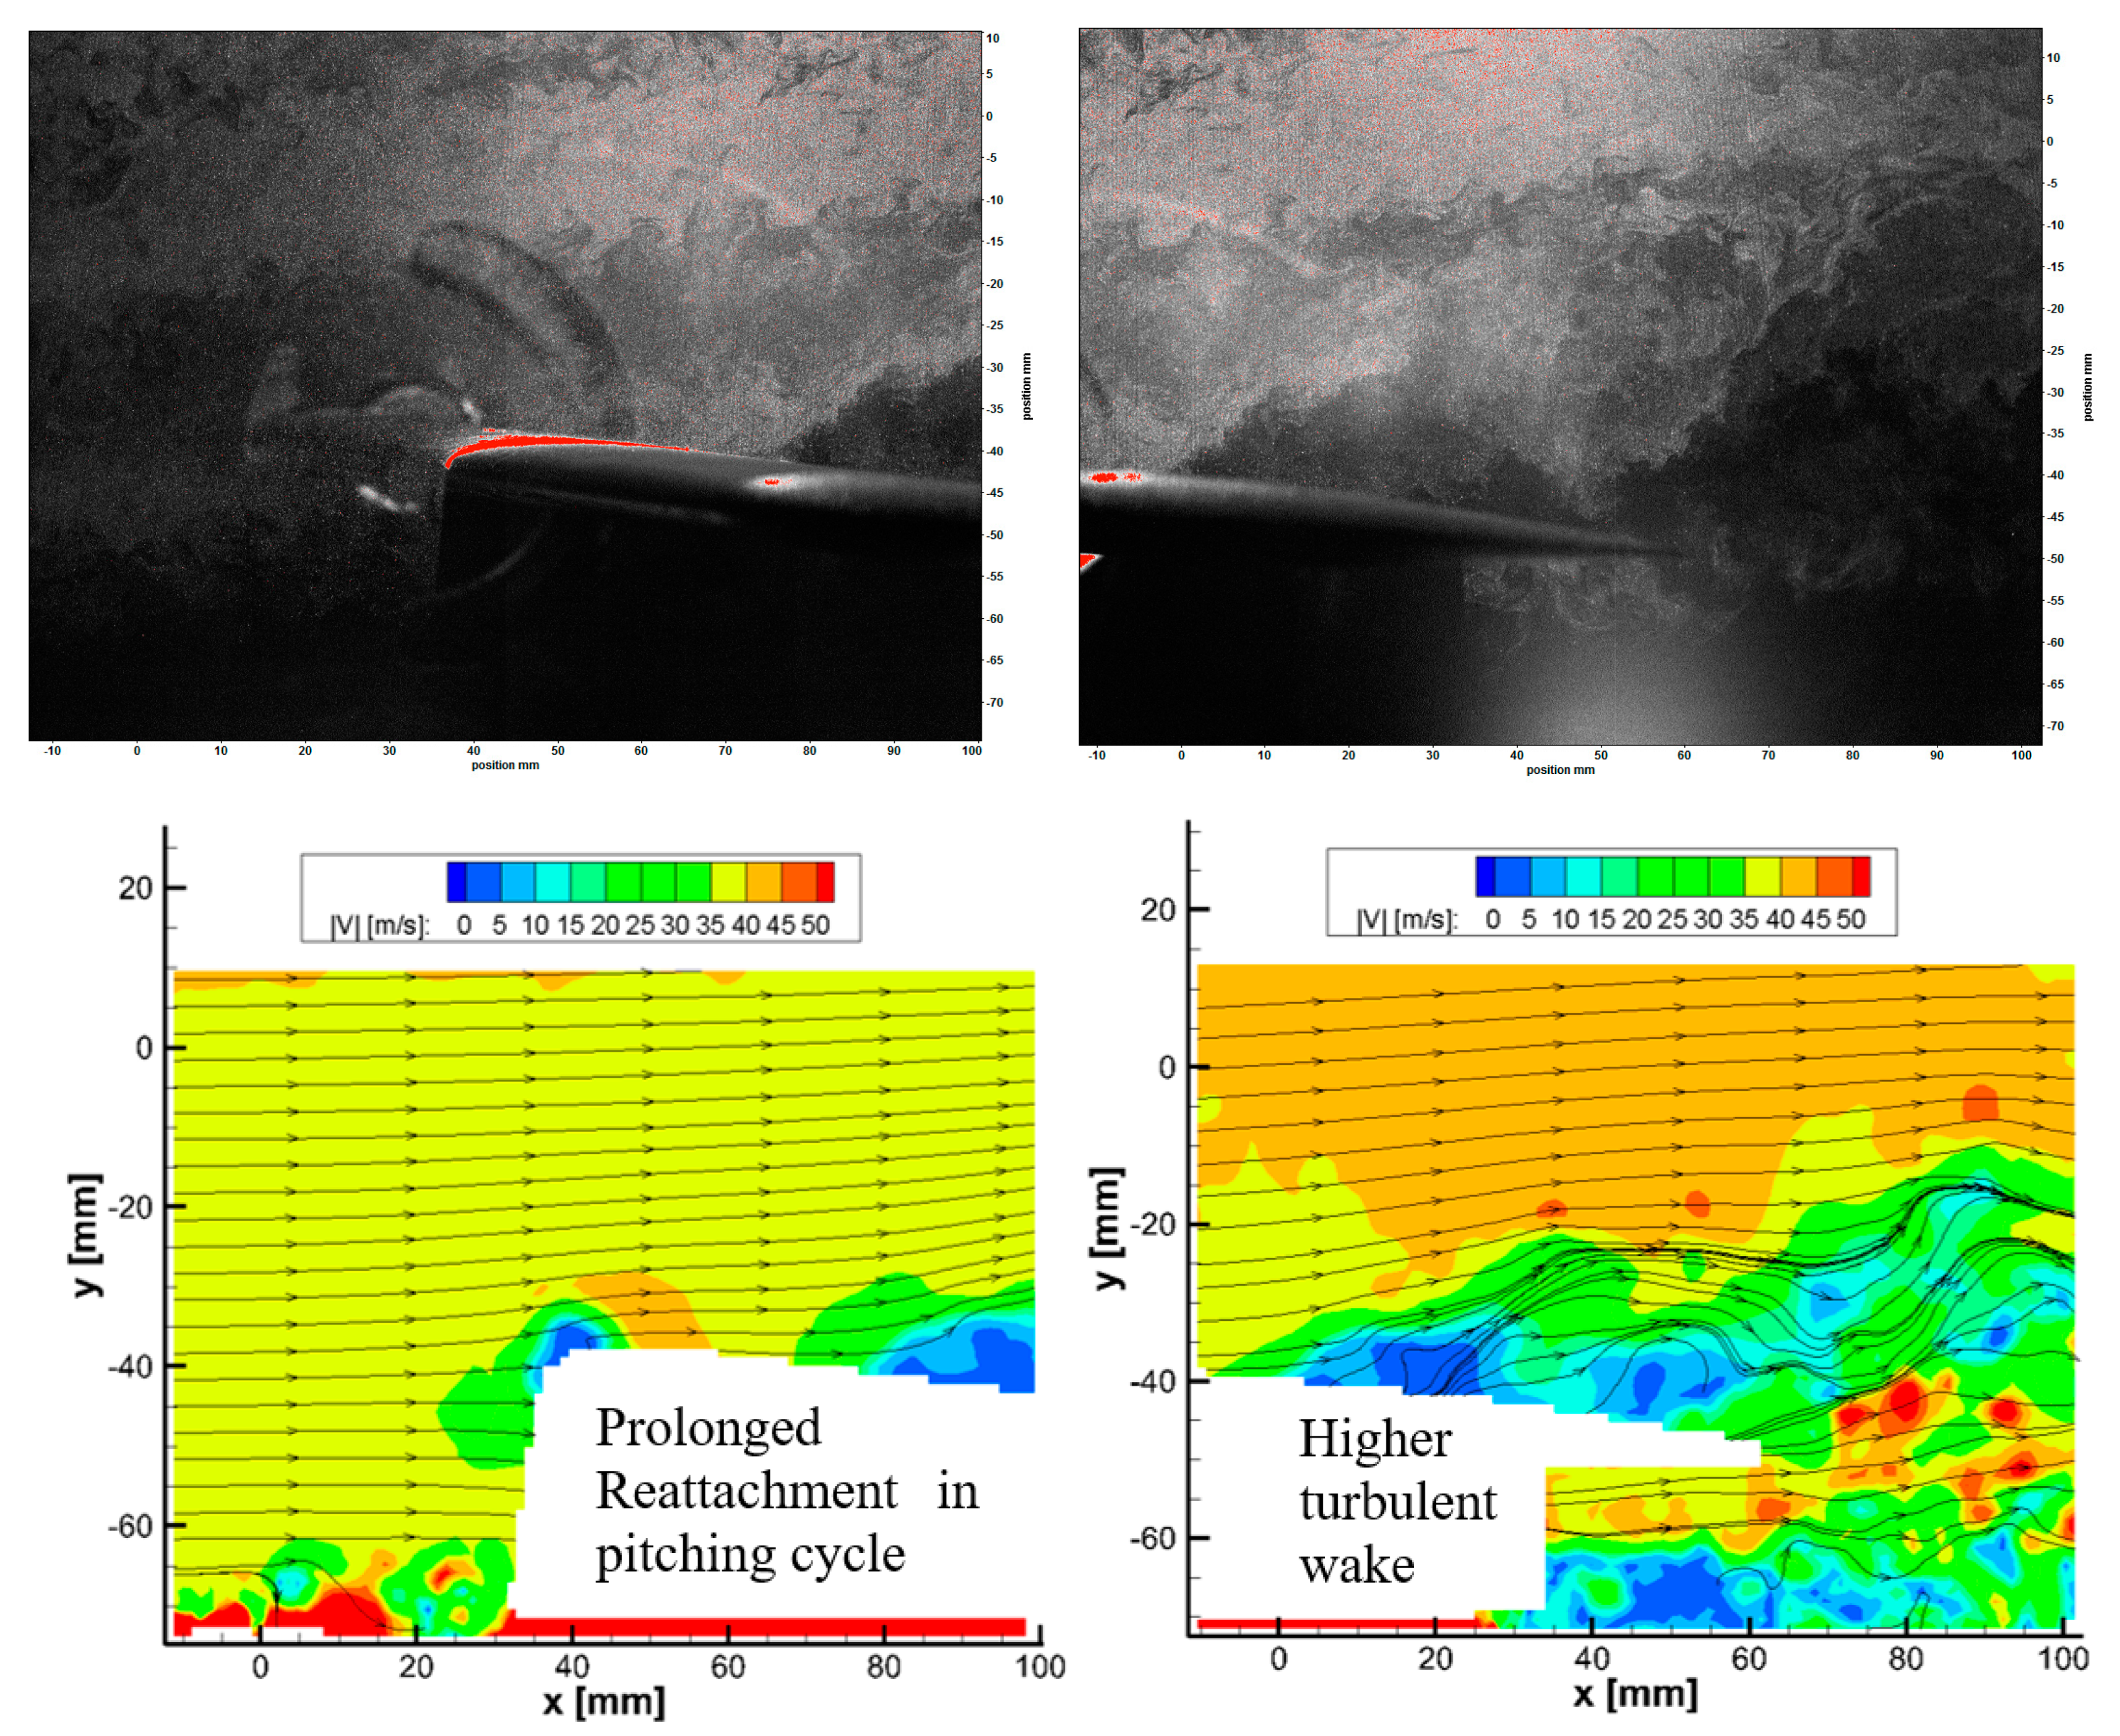
The PIV data taken with the unswept wing was analyzed and compared to previously existing data from the literature [3,9,10,11]. Three frames that correspond to angles of attack between the critical angles of 19° ↑ and 12° ↓ were selected for presentation and discussion at the spanwise position closer to the wing root, x/c = 0.4. Under the dynamic motion, the wing began to show a high degree of flow reversal at approximately 18°, referenced to free stream flow direction. In Figure 8, Figure 9 and Figure 10 shown below, flow visualization and vector maps display various characteristic pitching flow features. They include the formation of the separation region, the dynamic stall, the reattachment region while pitching upward, the flow when reaching a maximum angle, and the flow when pitching down. The following discusses these observations.
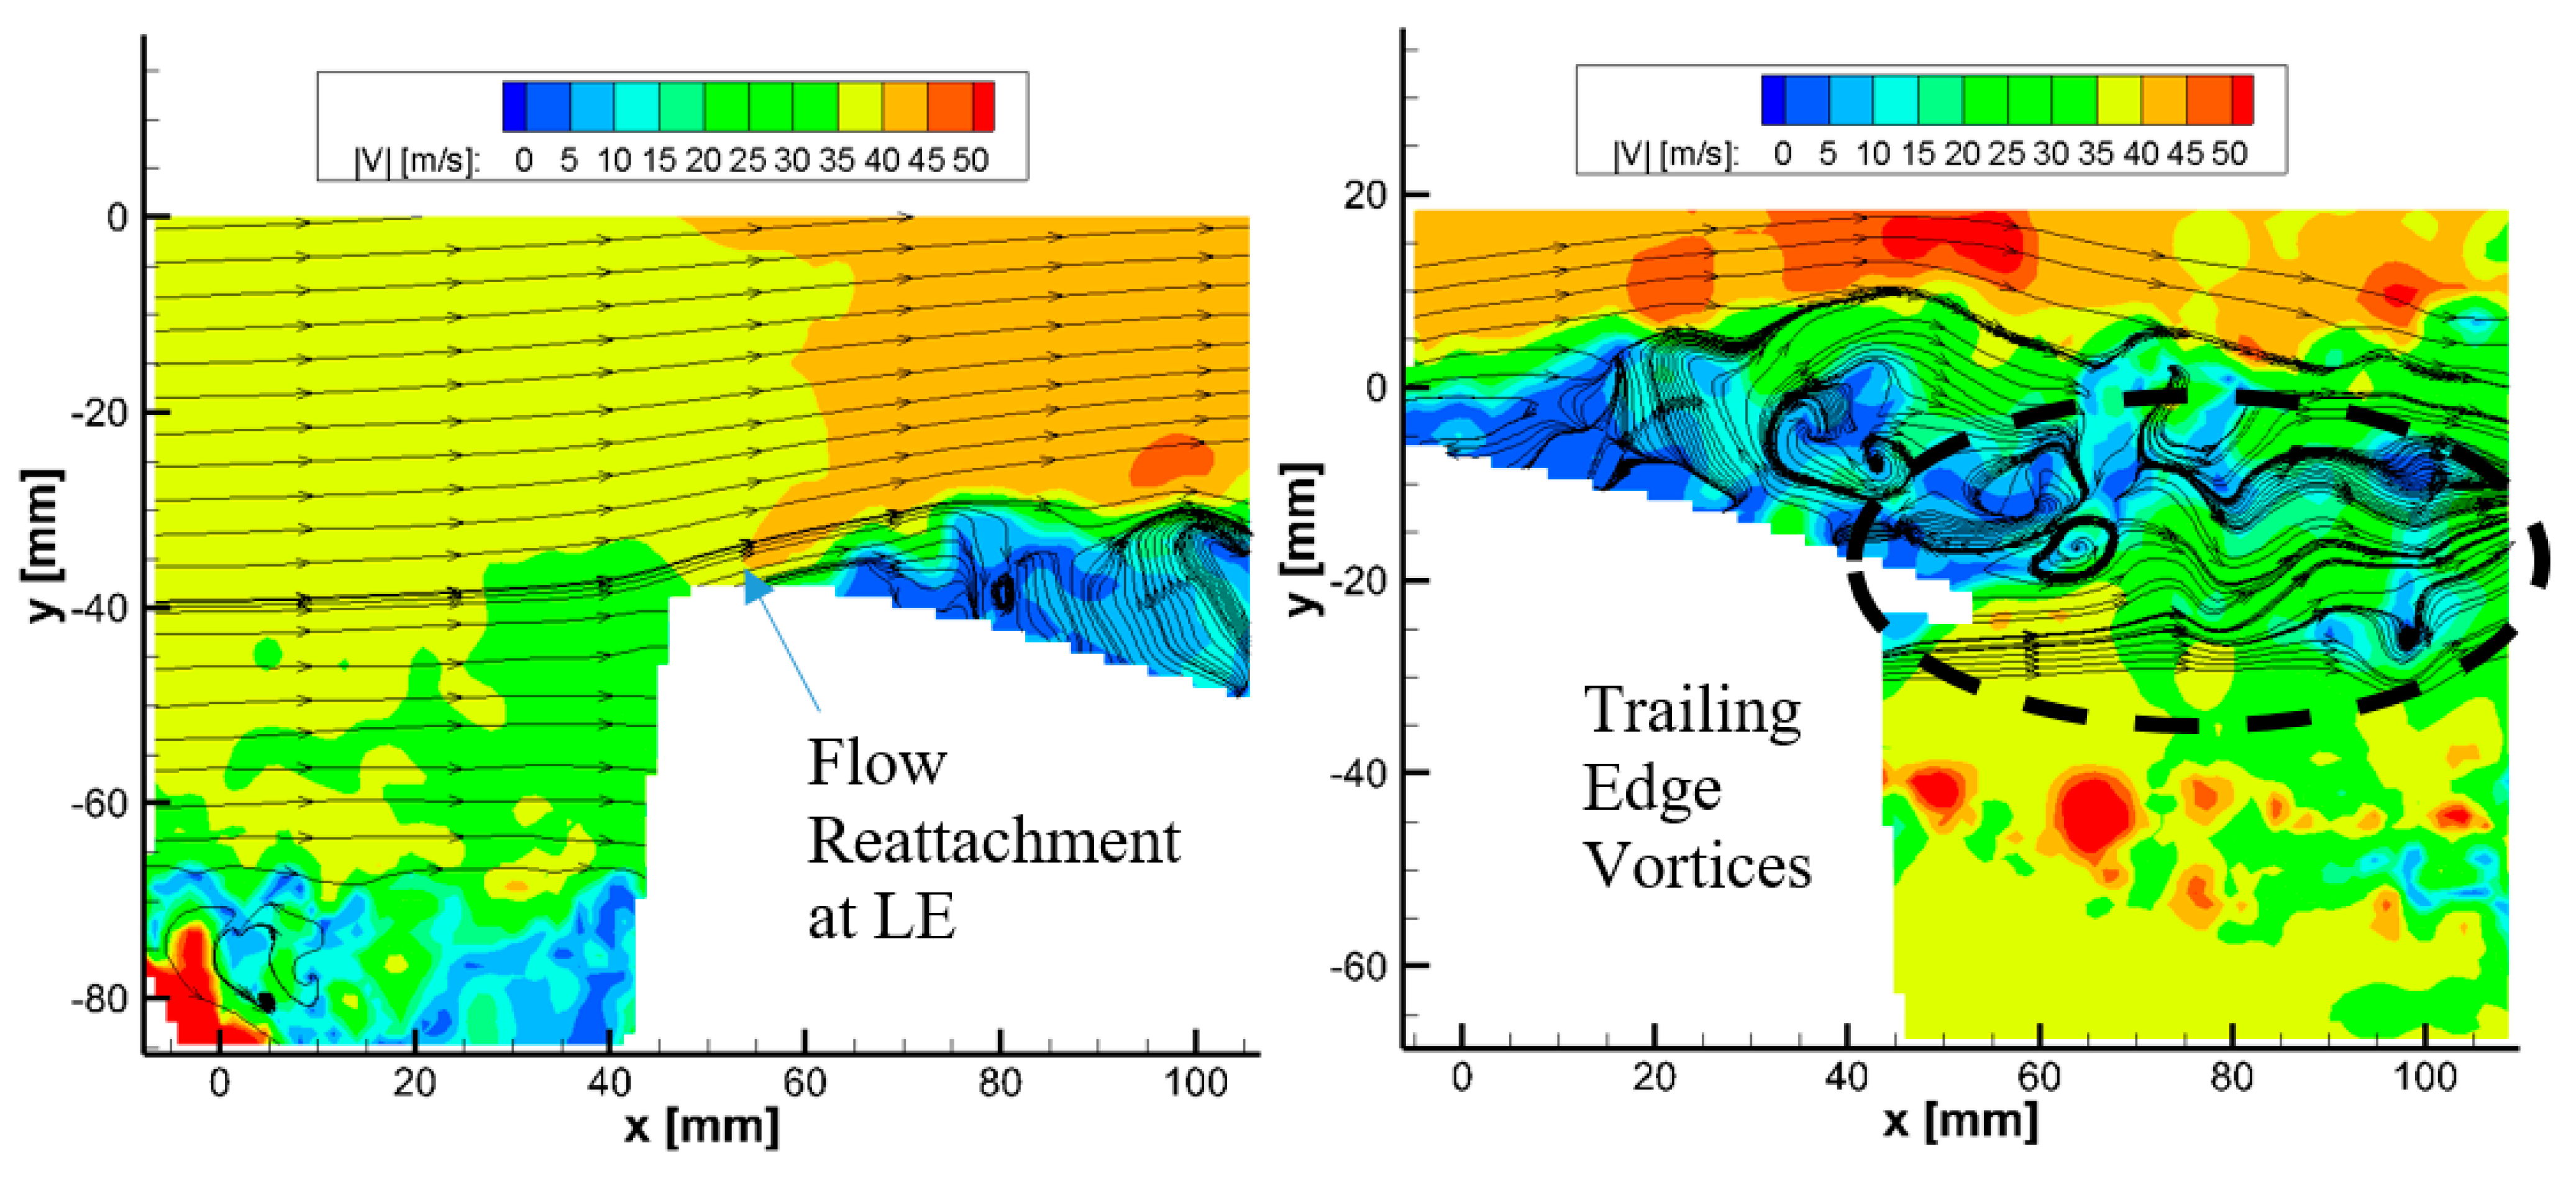
The selected sample with the instantaneous velocity contour at 21.1° of the upstroke phase (↑) during the pitching cycle is shown in Figure 8. The velocity contour results show a laminar separation bubble formed from the leading-edge region of the wing, and that it extended to about half of the entire chord length before a complete stall. When the wing began pitching downward, the flow began to reattach to the leading edge, and the laminar separation bubble would shed off the trailing edge. Flow reversal leading to stall can be observed to start at approximately 21.1° ↑ and the subsequent reattachment at the leading edge at about 16.4° ↓. In Figure 9, it can be observed that, following the formation of the laminar separation bubble and the shedding flow reversal, larger eddies are shed from the surface of the wing when returning to the freestream. It was also noted that during the upstroke, the flow over the top surface continued streaming over the laminar separation bubble, but it began to collapse as the wing started to pitch down. Consequently, the laminar separation bubble was shed and the flow reattached to the top surface. There was no clear indication that there was any form of arch or ring vortex formation above and behind the wing. Data along the 0.4 chord length location suggests some early turbulent formation of arch vortices. However, the presence of the arch vortex formation is not immediately apparent. The unswept wing with its rounded tip showed typical wingtip vortex generation at most pitching angles. In Figure 10, vortices being shed from the trailing edge during the pitching motion are shown. Interestingly, the trailing edge vortices that were formed while pitching downward were much more prominent than those formed during the upwards pitching motion. It is possible that this is due to the strong flow reversal shedding off the leading edge and upper surface during this upward motion, which seeds these smaller wingtip vortices.

3.2. Flow Structure over Swept Pitching Wing, Λ = 15°

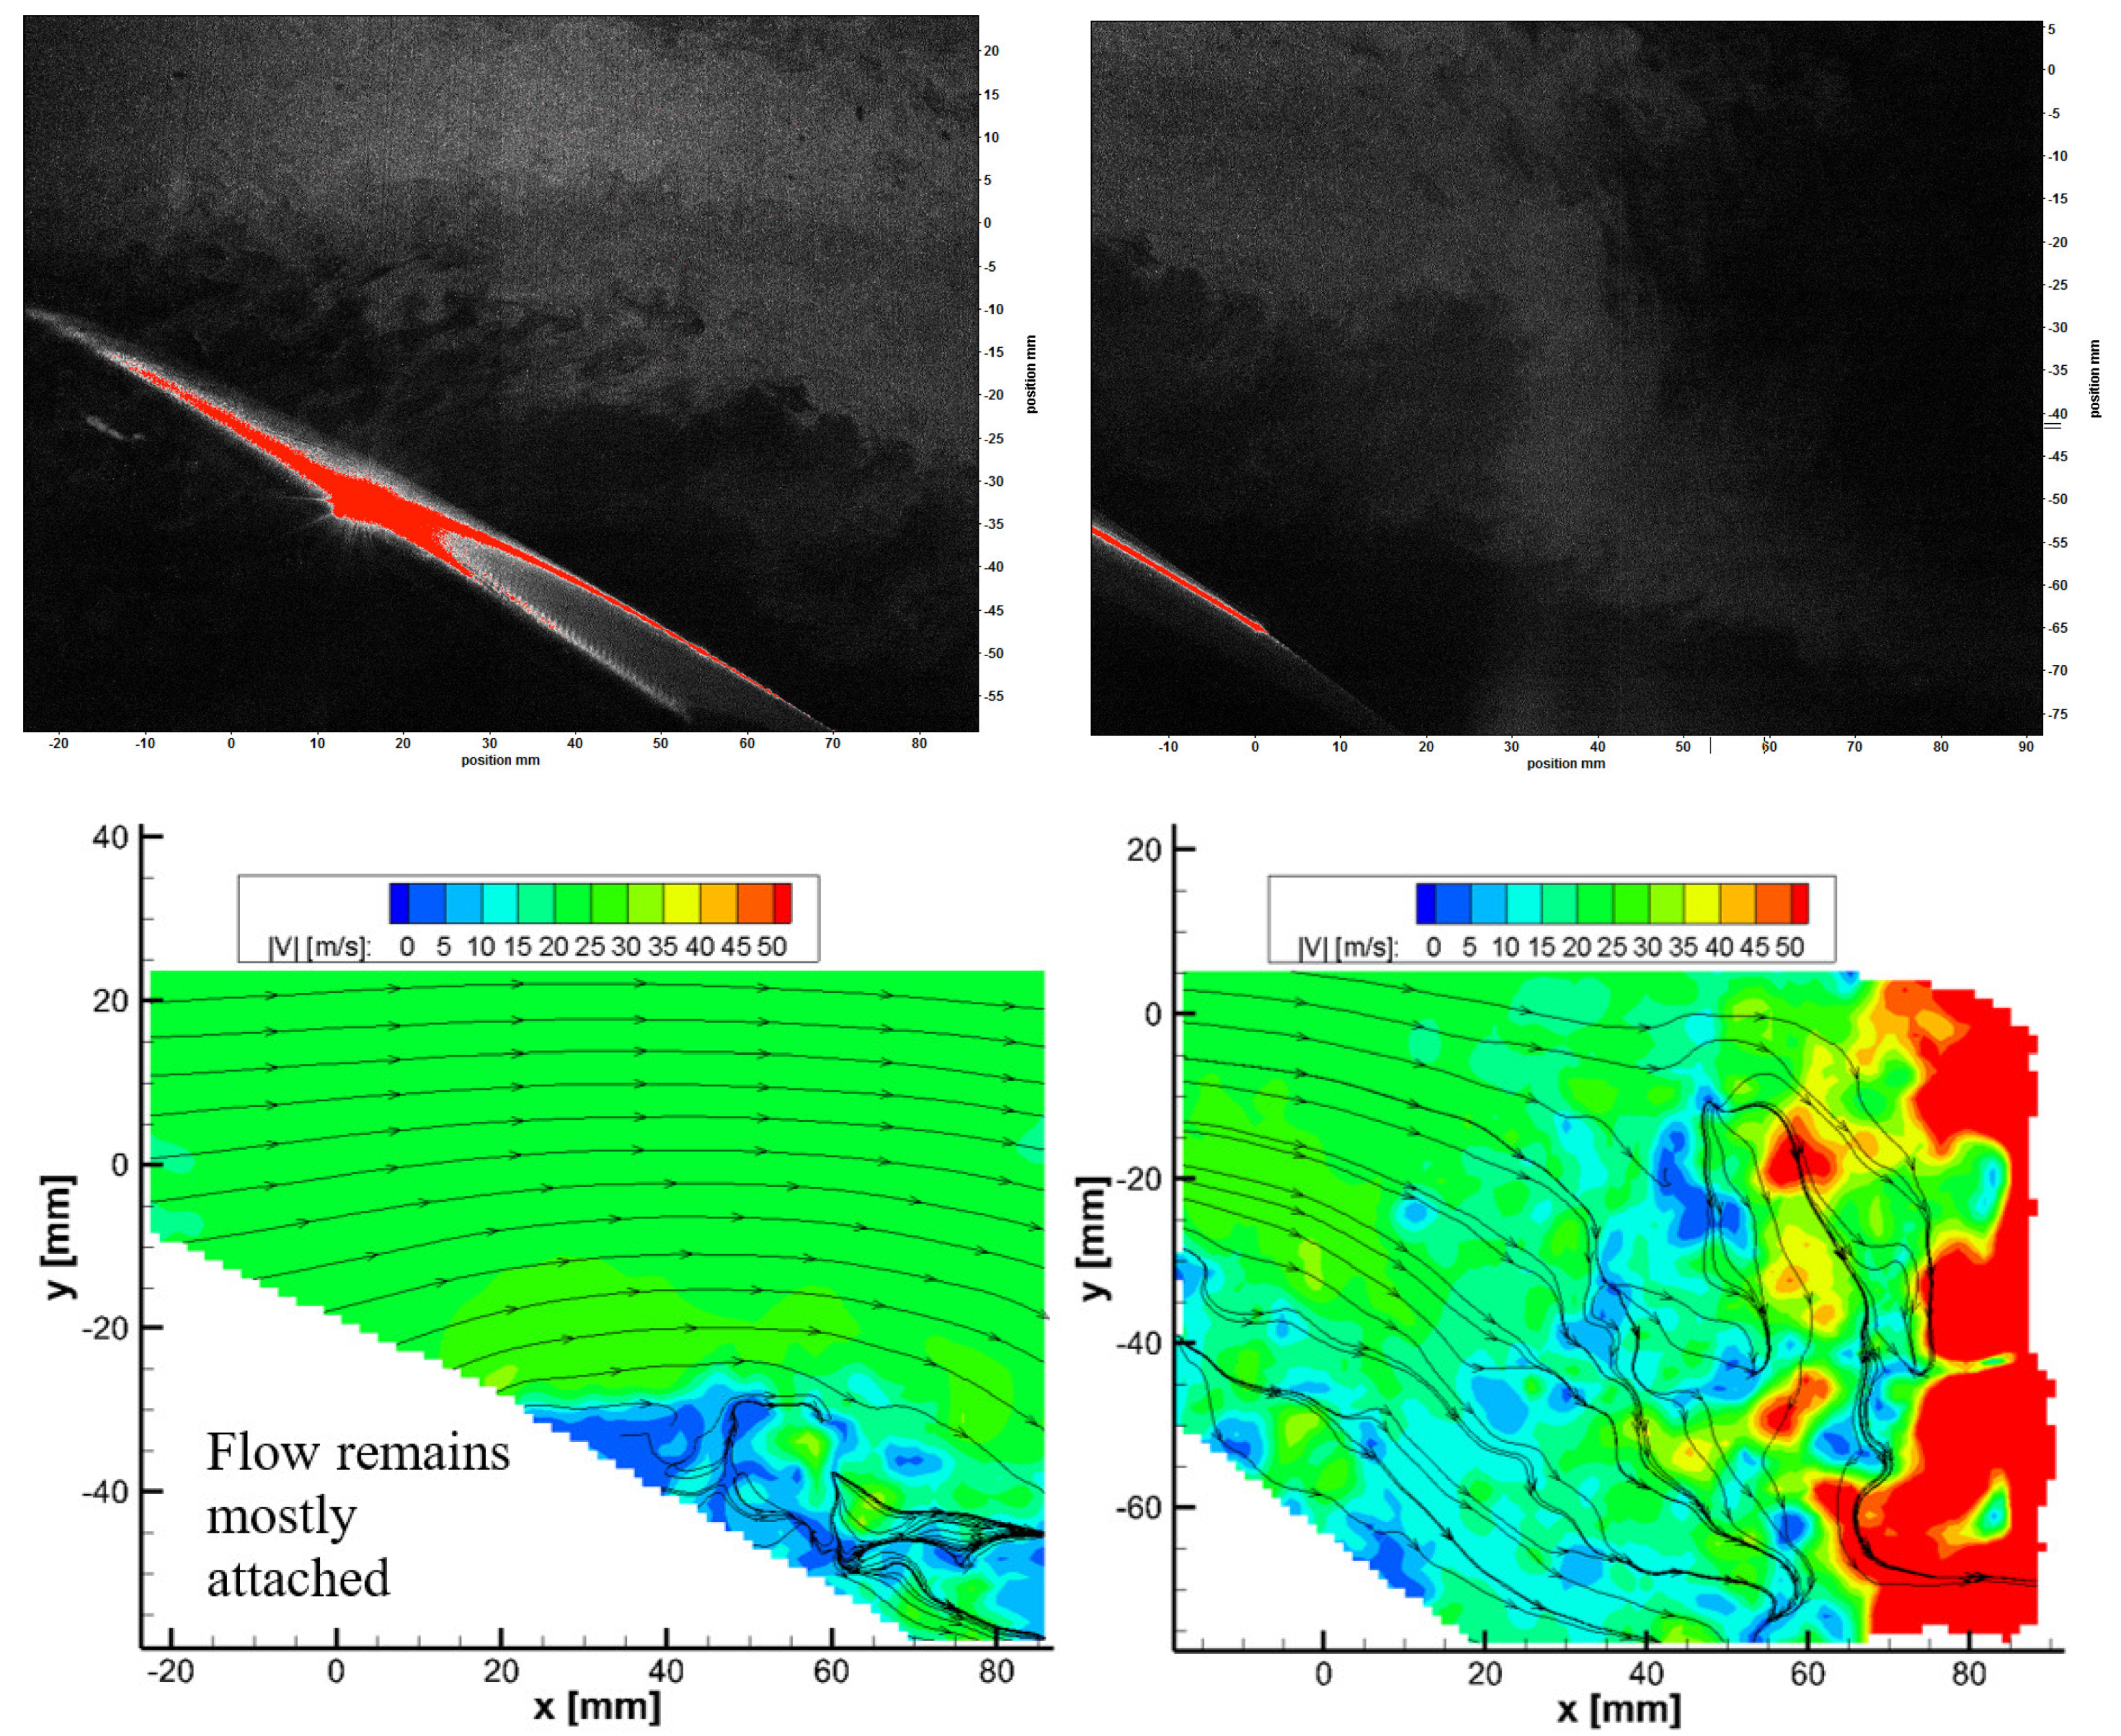
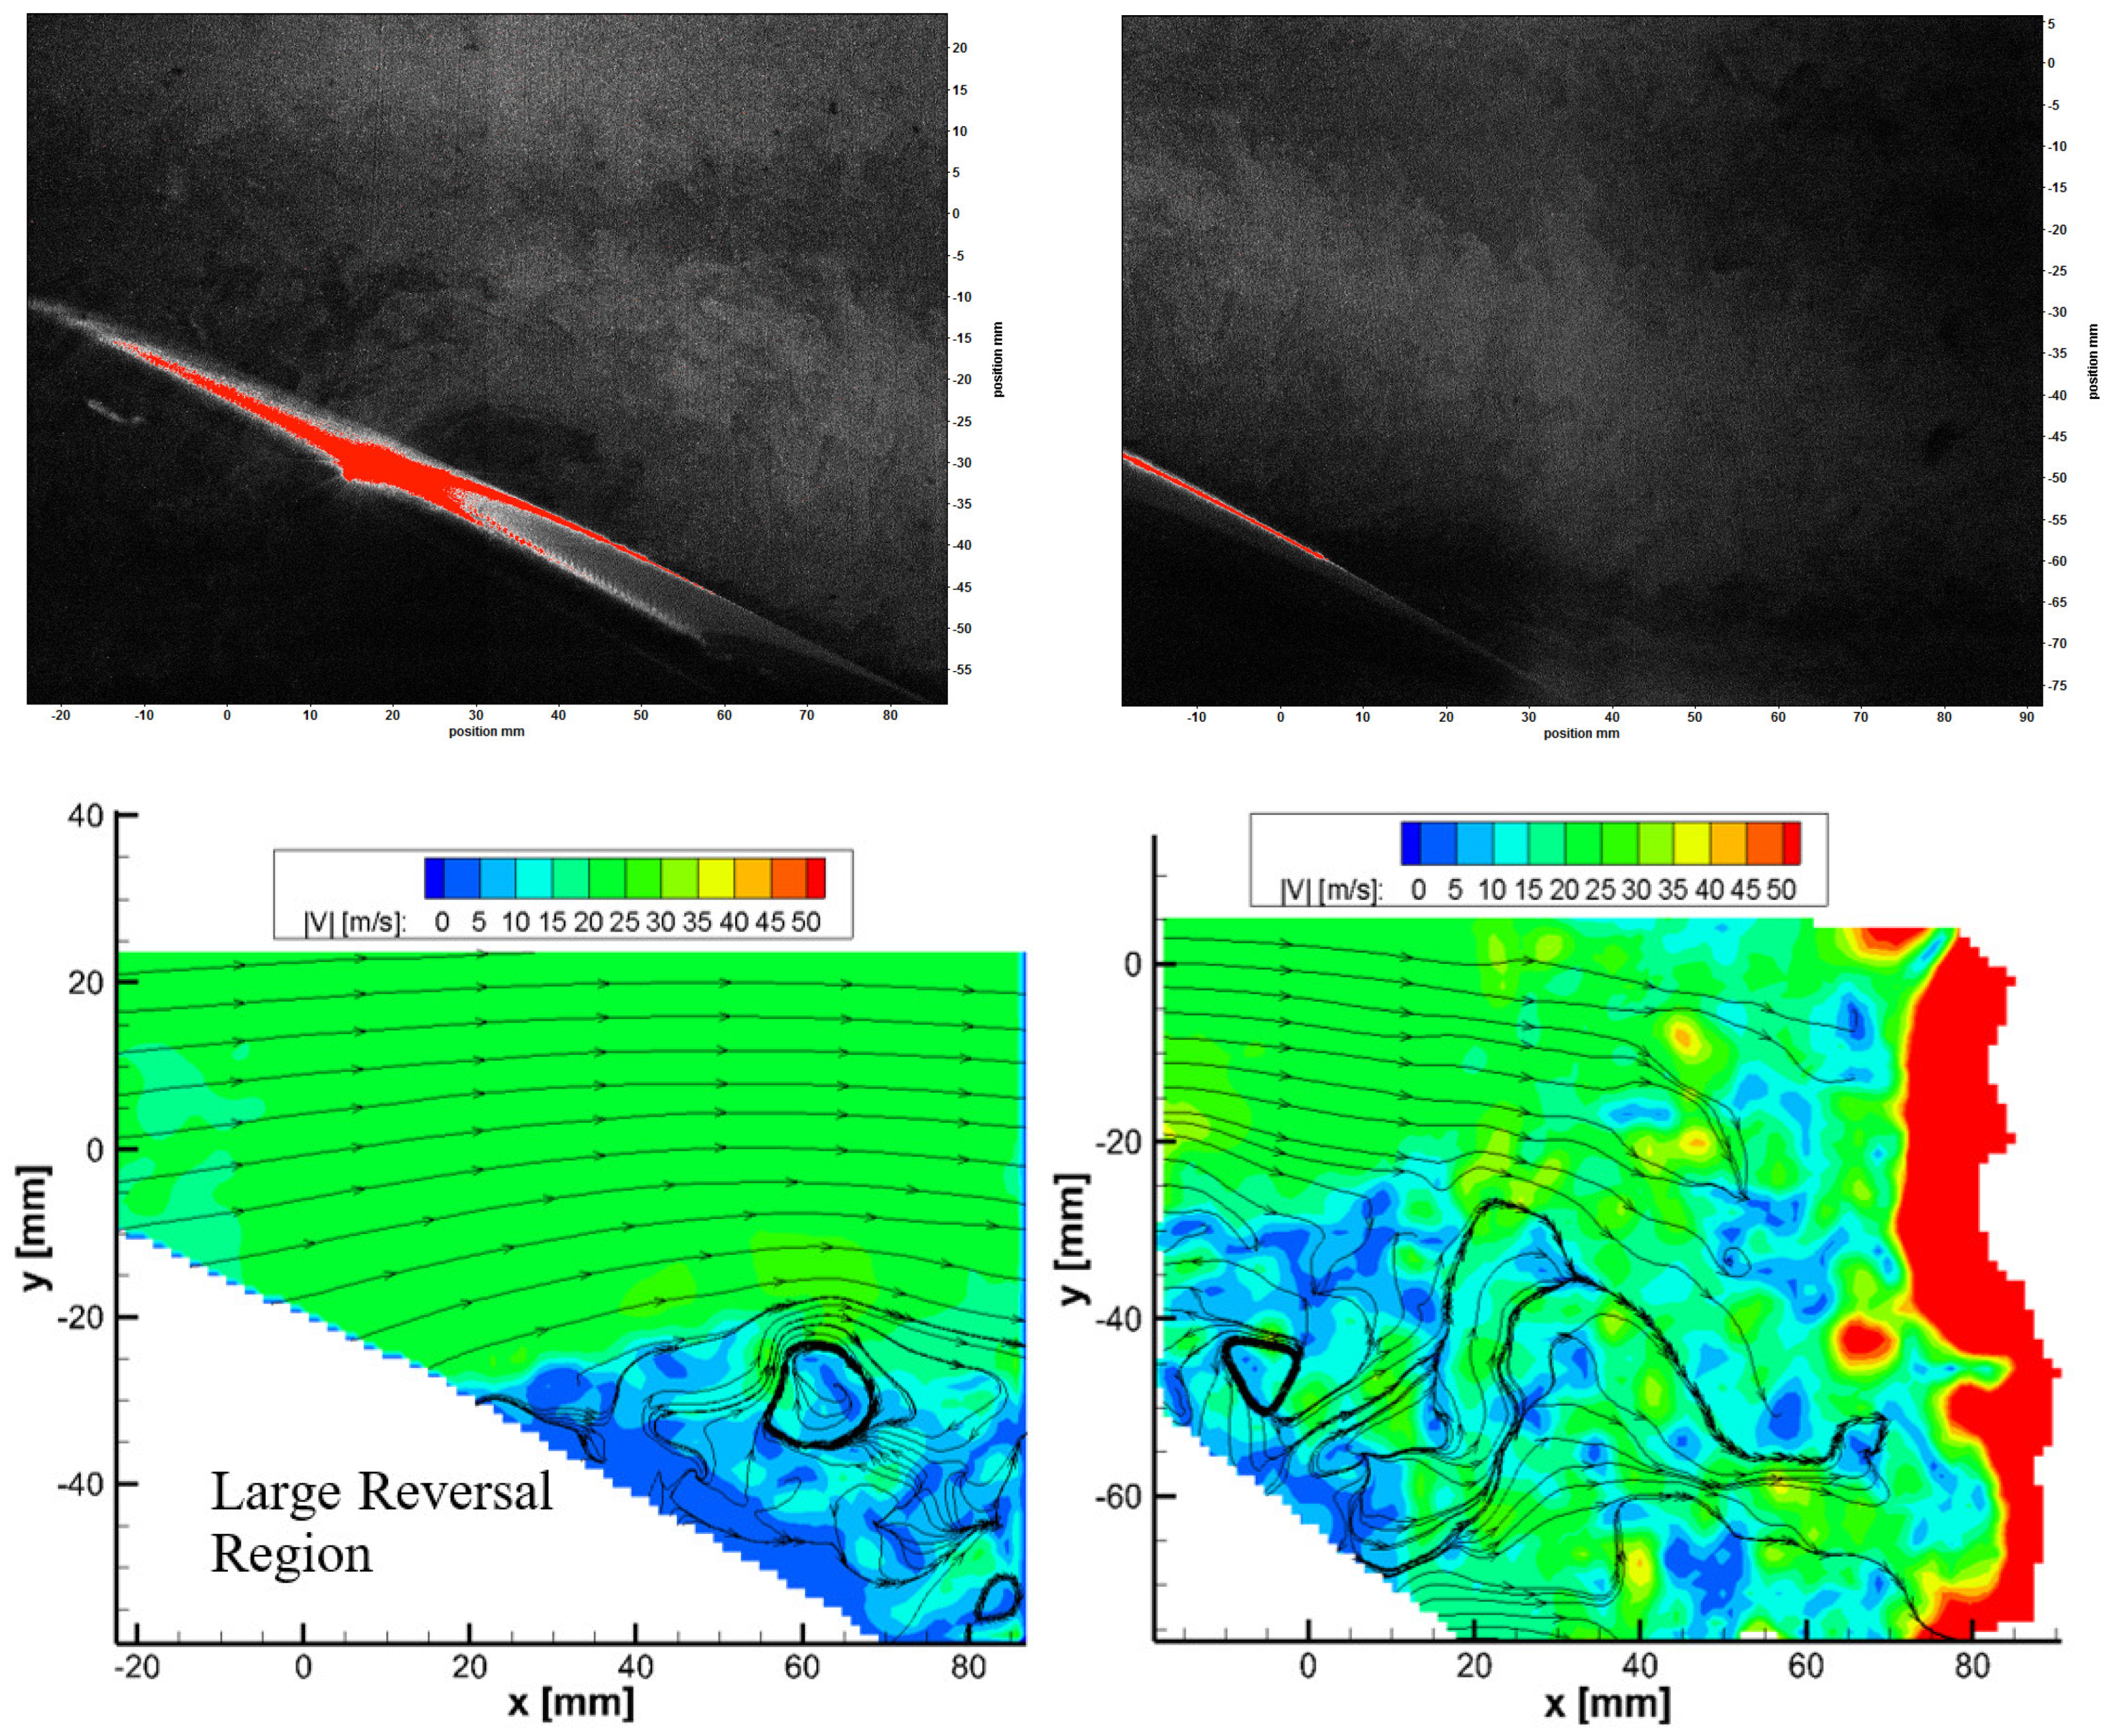
It was observed, as shown in Figure 11, Figure 12 and Figure 13, that for comparable pitching angles, the swept wing at 15° flow remained attached for a longer duration during the pitching cycle than that of the unswept case. The contours shown in Figure 11 suggest some leading-edge reversal, but due to background and surface reflection noise, it cannot be fully stated yet. However, it was noticed that more clearly defined flow reversal started much later in the pitching cycle, beyond 20° ↑. Interestingly, flow reversal at the top surface seemed to increase as the wing began to pitch downwards, as shown in Figure 12. As the downwards motion continued, flow reattachment at the leading edge was observed, and as the angle approached 14° ↓, the velocity contour showed flow reattachment. The reattachment of the flow and vortex shedding from the trailing edge of the wing is shown in Figure 13. It is possible that this is due to the larger flow reversal region, which travels back to the free stream before the flow can reattach. Flow characteristics over the laminar separation bubble are comparable to that of the unswept wing case (in the way the flow streams over the reversed region). However, the wake following the reversed region for this swept case was much greater than that from the unswept case. Furthermore, as shown in Figure 13, the shed turbulent region over the remainder of the separation region during the downstroke possesses a larger magnitude of rotation when compared to the unswept case. Interestingly, the leading-edge reattachment seemed to be prolonged to further in the pitching cycle for the swept wing than for the unswept wing.

3.3. Flow Structure over Swept Pitching Wing, Λ = 30°

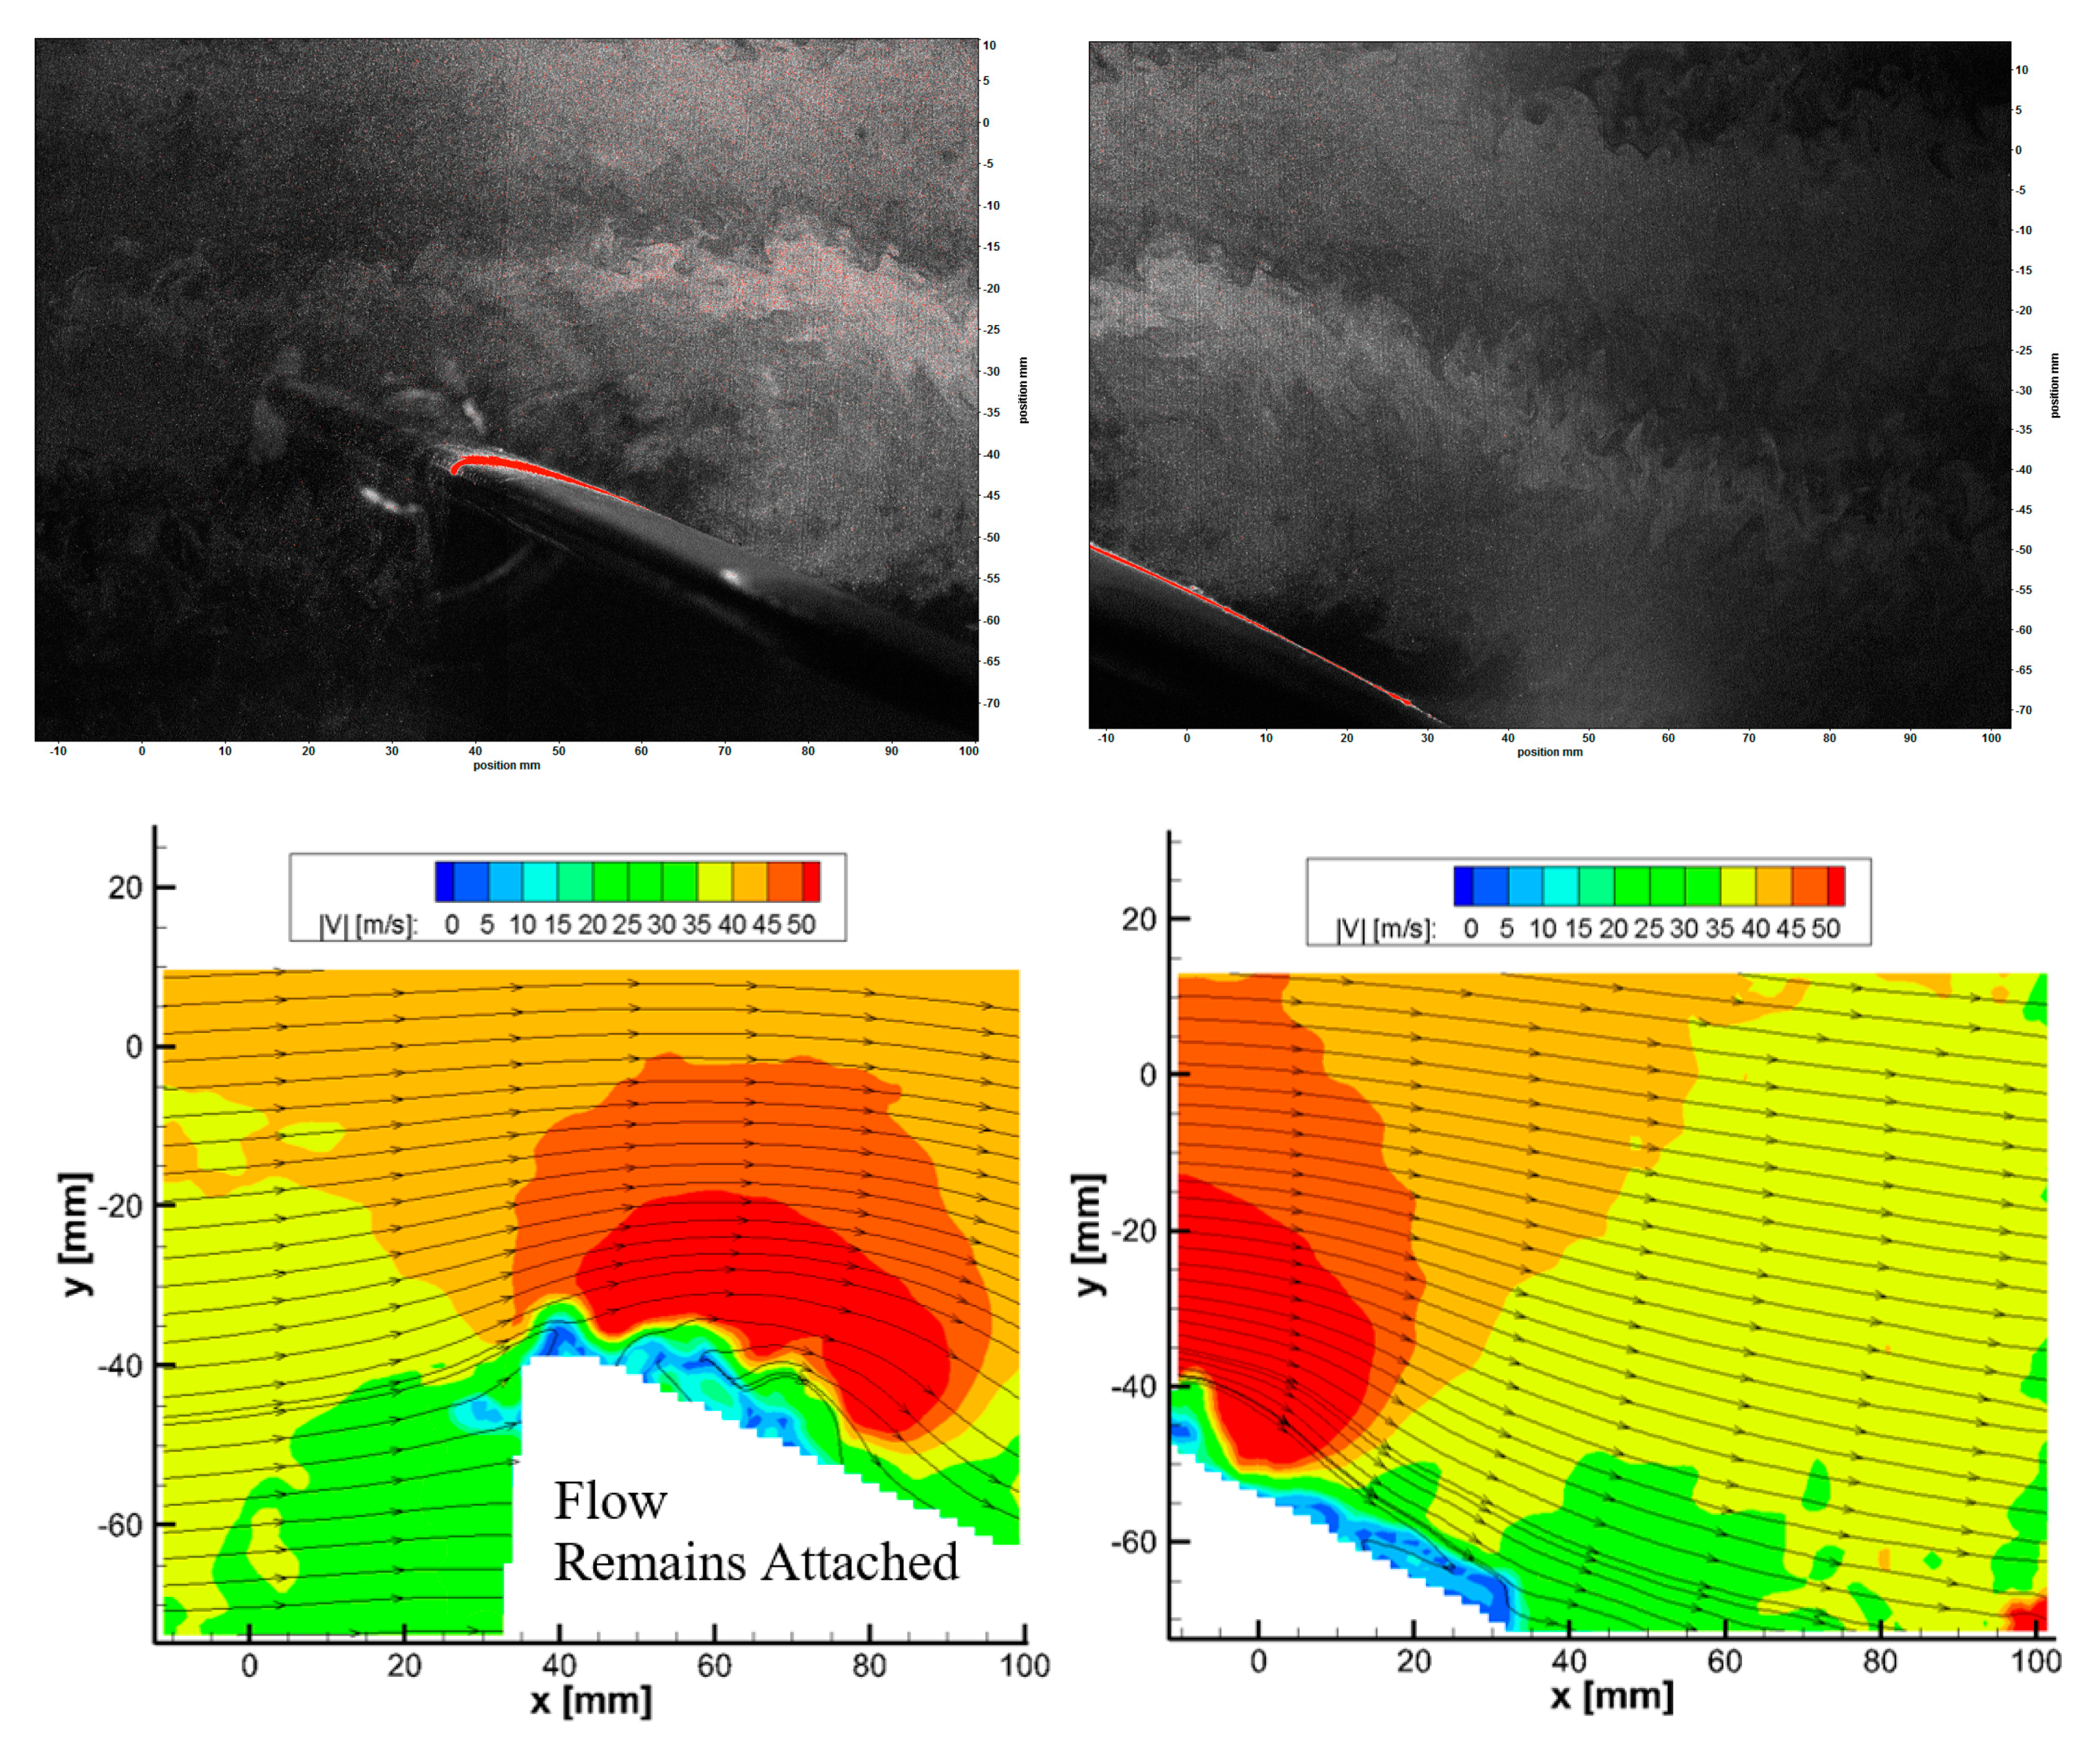
With the swept wing at 30°, it was observed that noticeable flow reversal was prolonged further in the angle pitching sequence than the previous swept case to beyond 21° ↑. Flow reversal was not entirely evident at these higher angles during pitching upward, as in the previous cases, as shown in Figure 14. This continues to suggest that flow may have the ability to remain attached at higher pitching angles as the sweep angle is increased during a dynamic pitching cycle.
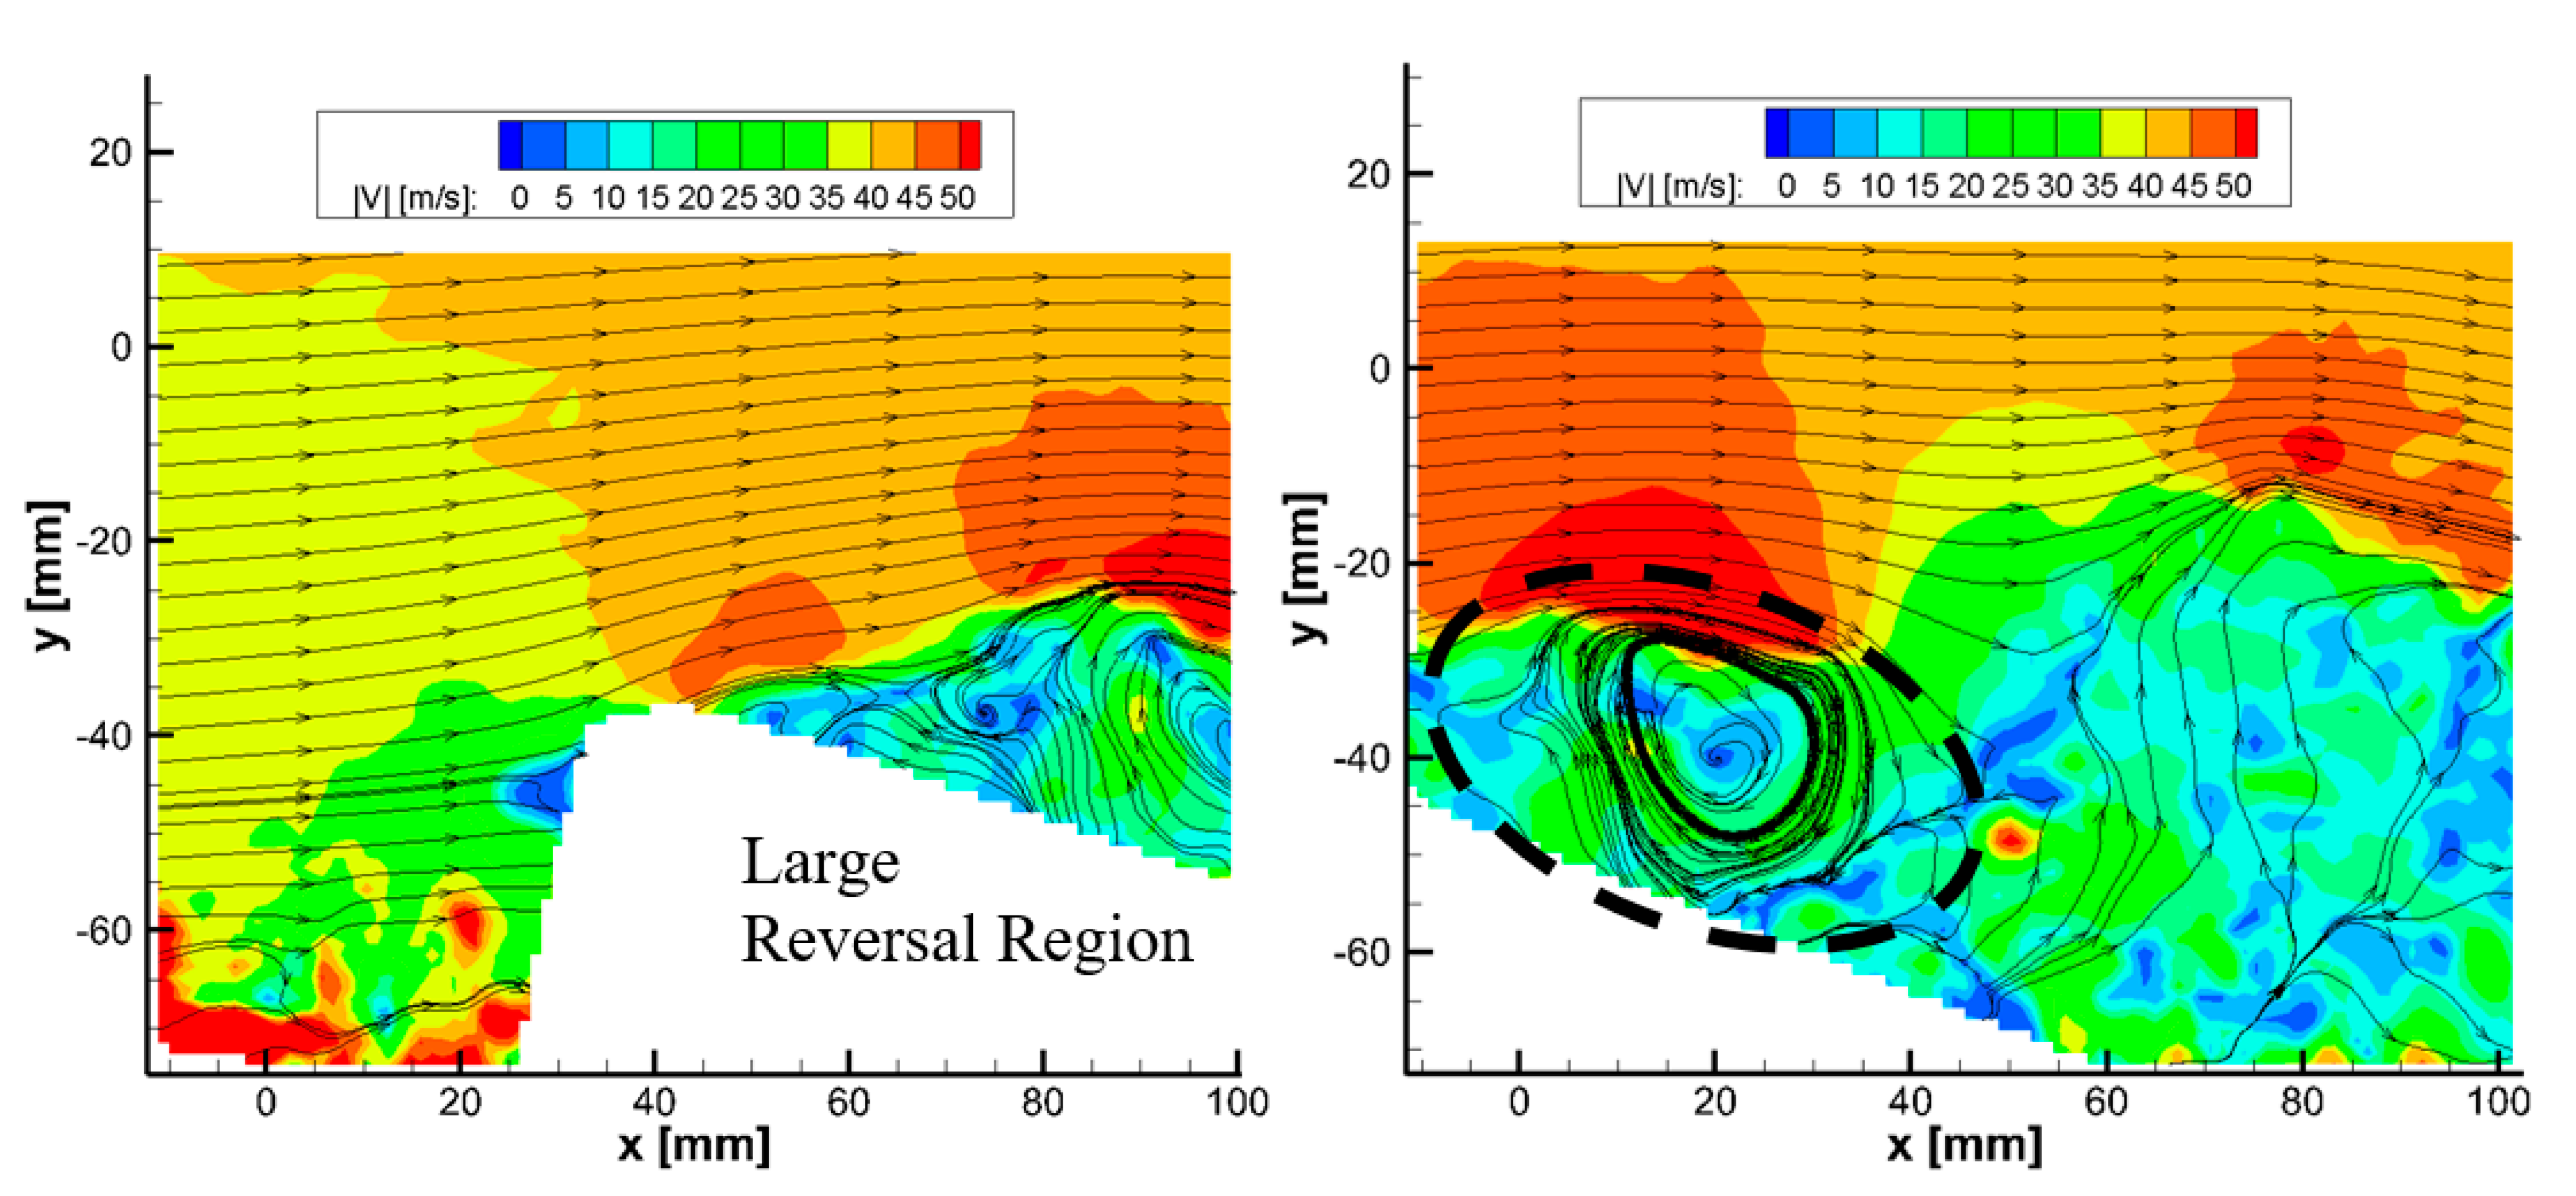
While pitching downward, as shown in Figure 15, it was noticed that the forming of the reversal region was large enough to the point where a laminar separation bubble was not formed and sustained past its maximum pitching angle and that it re-formed as the wing pitched down and flow reattached to the top surface. As the pitching angle increased, approaching stall, the reversal region became smaller. As the wing began to pitch down, the reversal region enabled the wing flow to reattach at the leading edge noticeably earlier than that observed in the lower swept angle cases. This behavior may indicate that higher degrees of sweep angle may benefit from flow reattachment proceeding wing stall during a pitching maneuver.

3.4. Dynamic Stall Behaviours at Various Spans forUnswept Pitching Wing, Λ = 0°

Results obtained for the upstroke and downstroke phases during the pitching cycle at four different spanwise locations of the unswept wing, Λ = 0°, are shown in Figure 16 and Figure 17. The results show a variation of flow structures from the wing root to the wingtip. For the upstroke phase, the results show that the flow separation was consistent across the wingspan, with stall beginning to form but with flow not fully separated while pitching upwards. As the wing started pitching downwards, the flow separation occurred and happened sooner near the wing root than the wingtip.

3.5. Turbo PSP Results

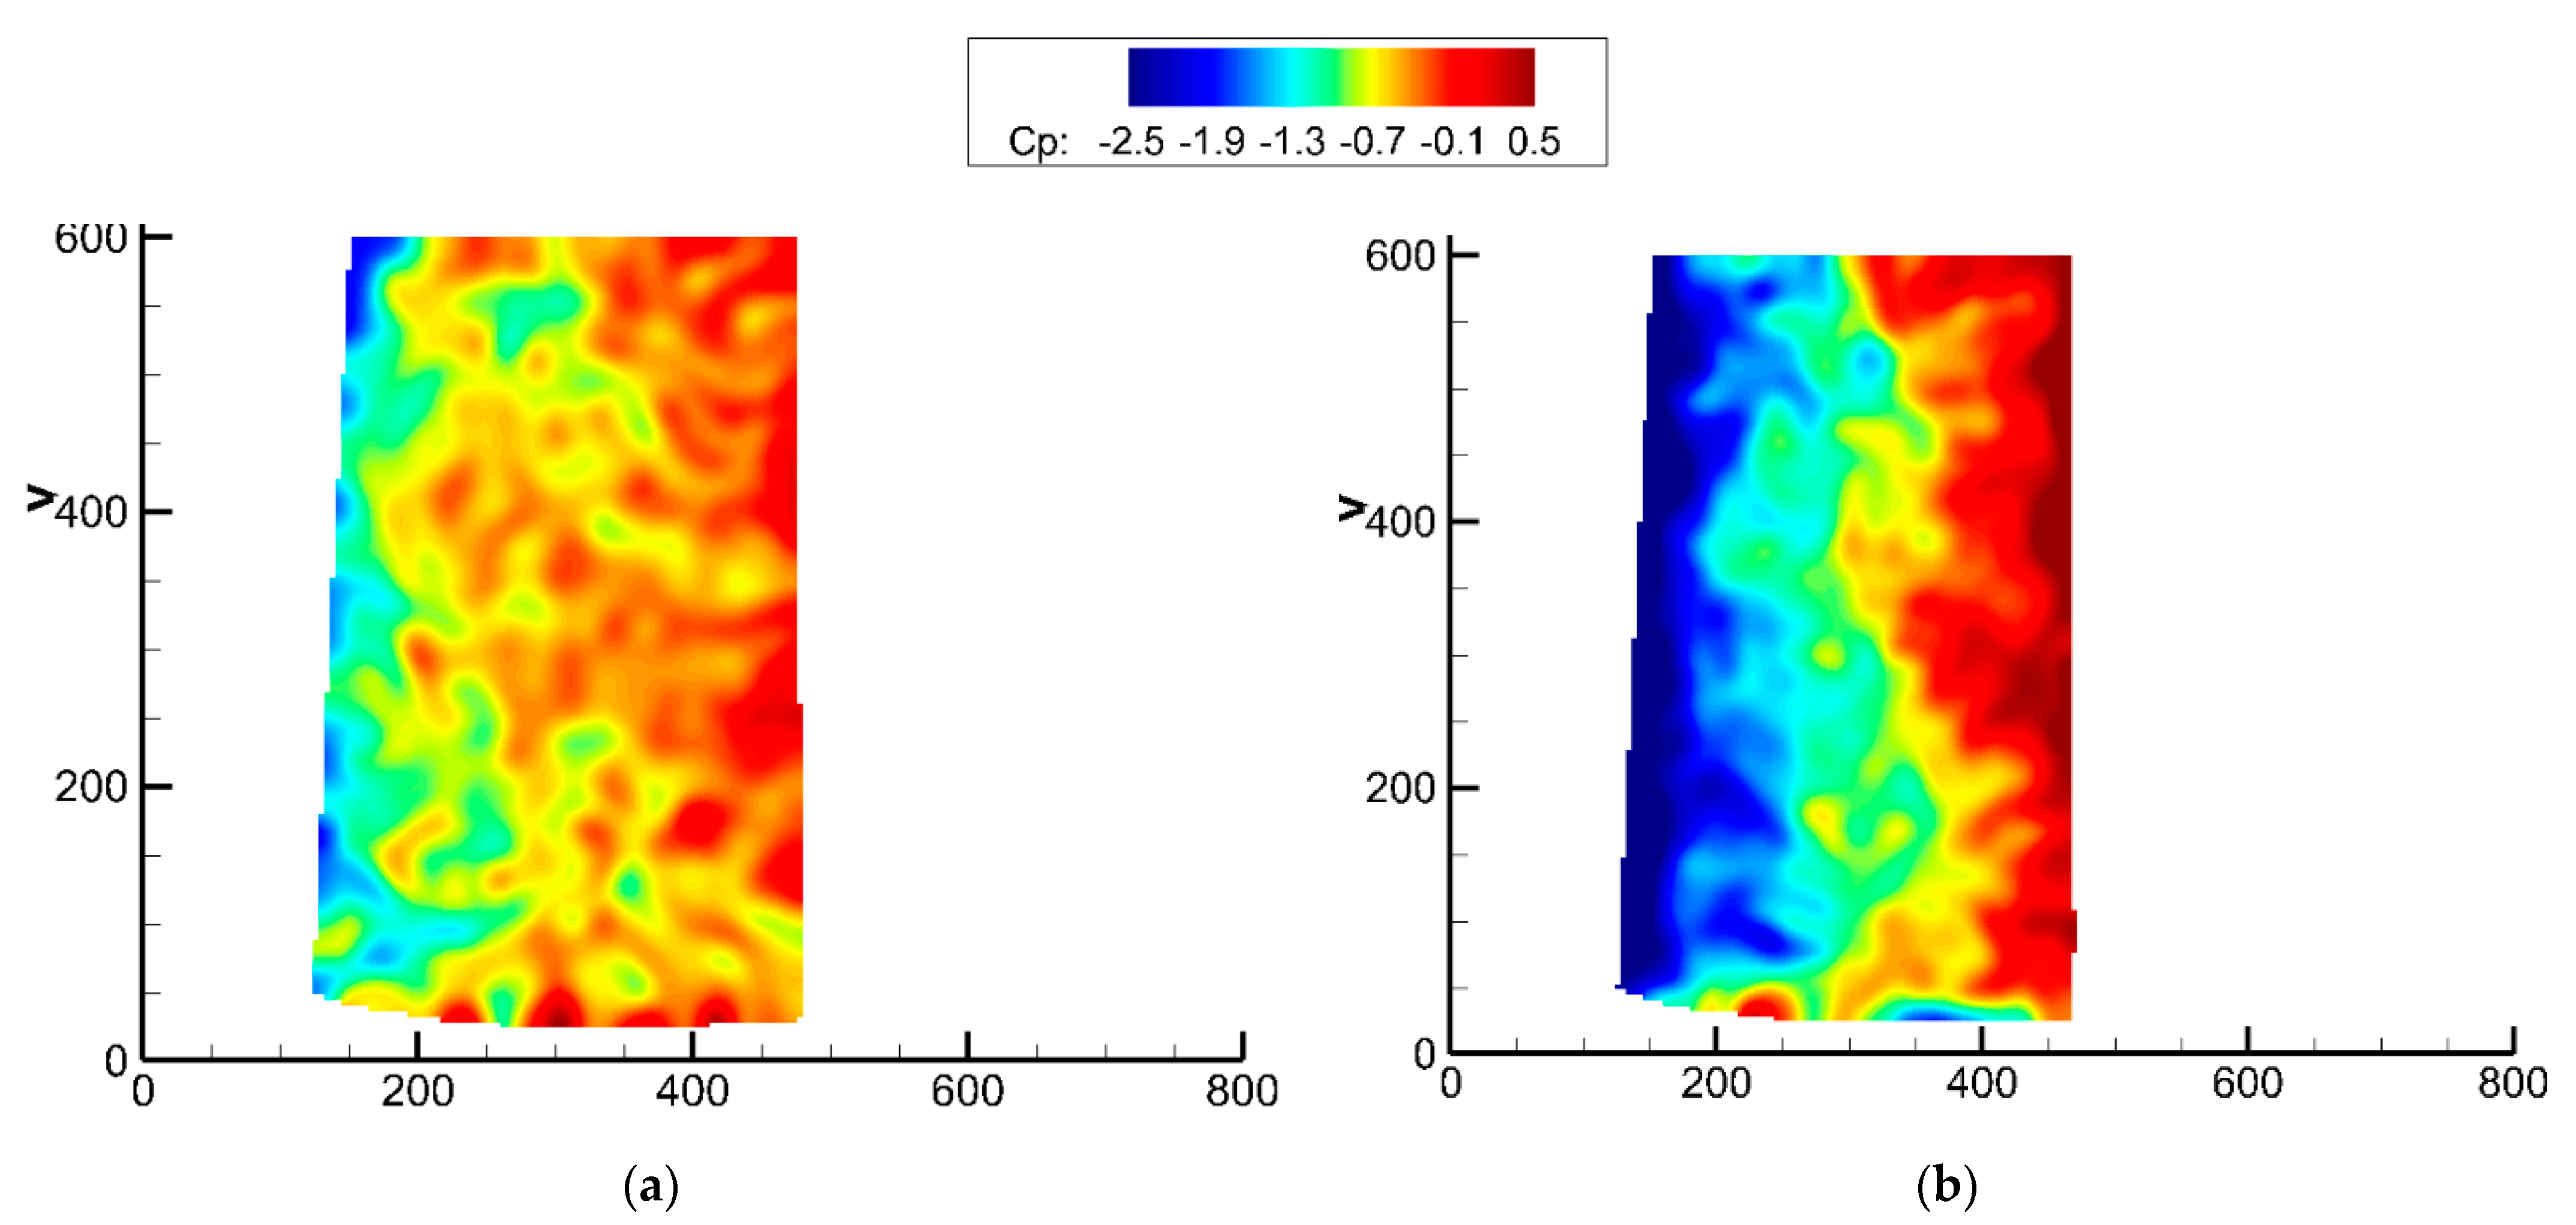
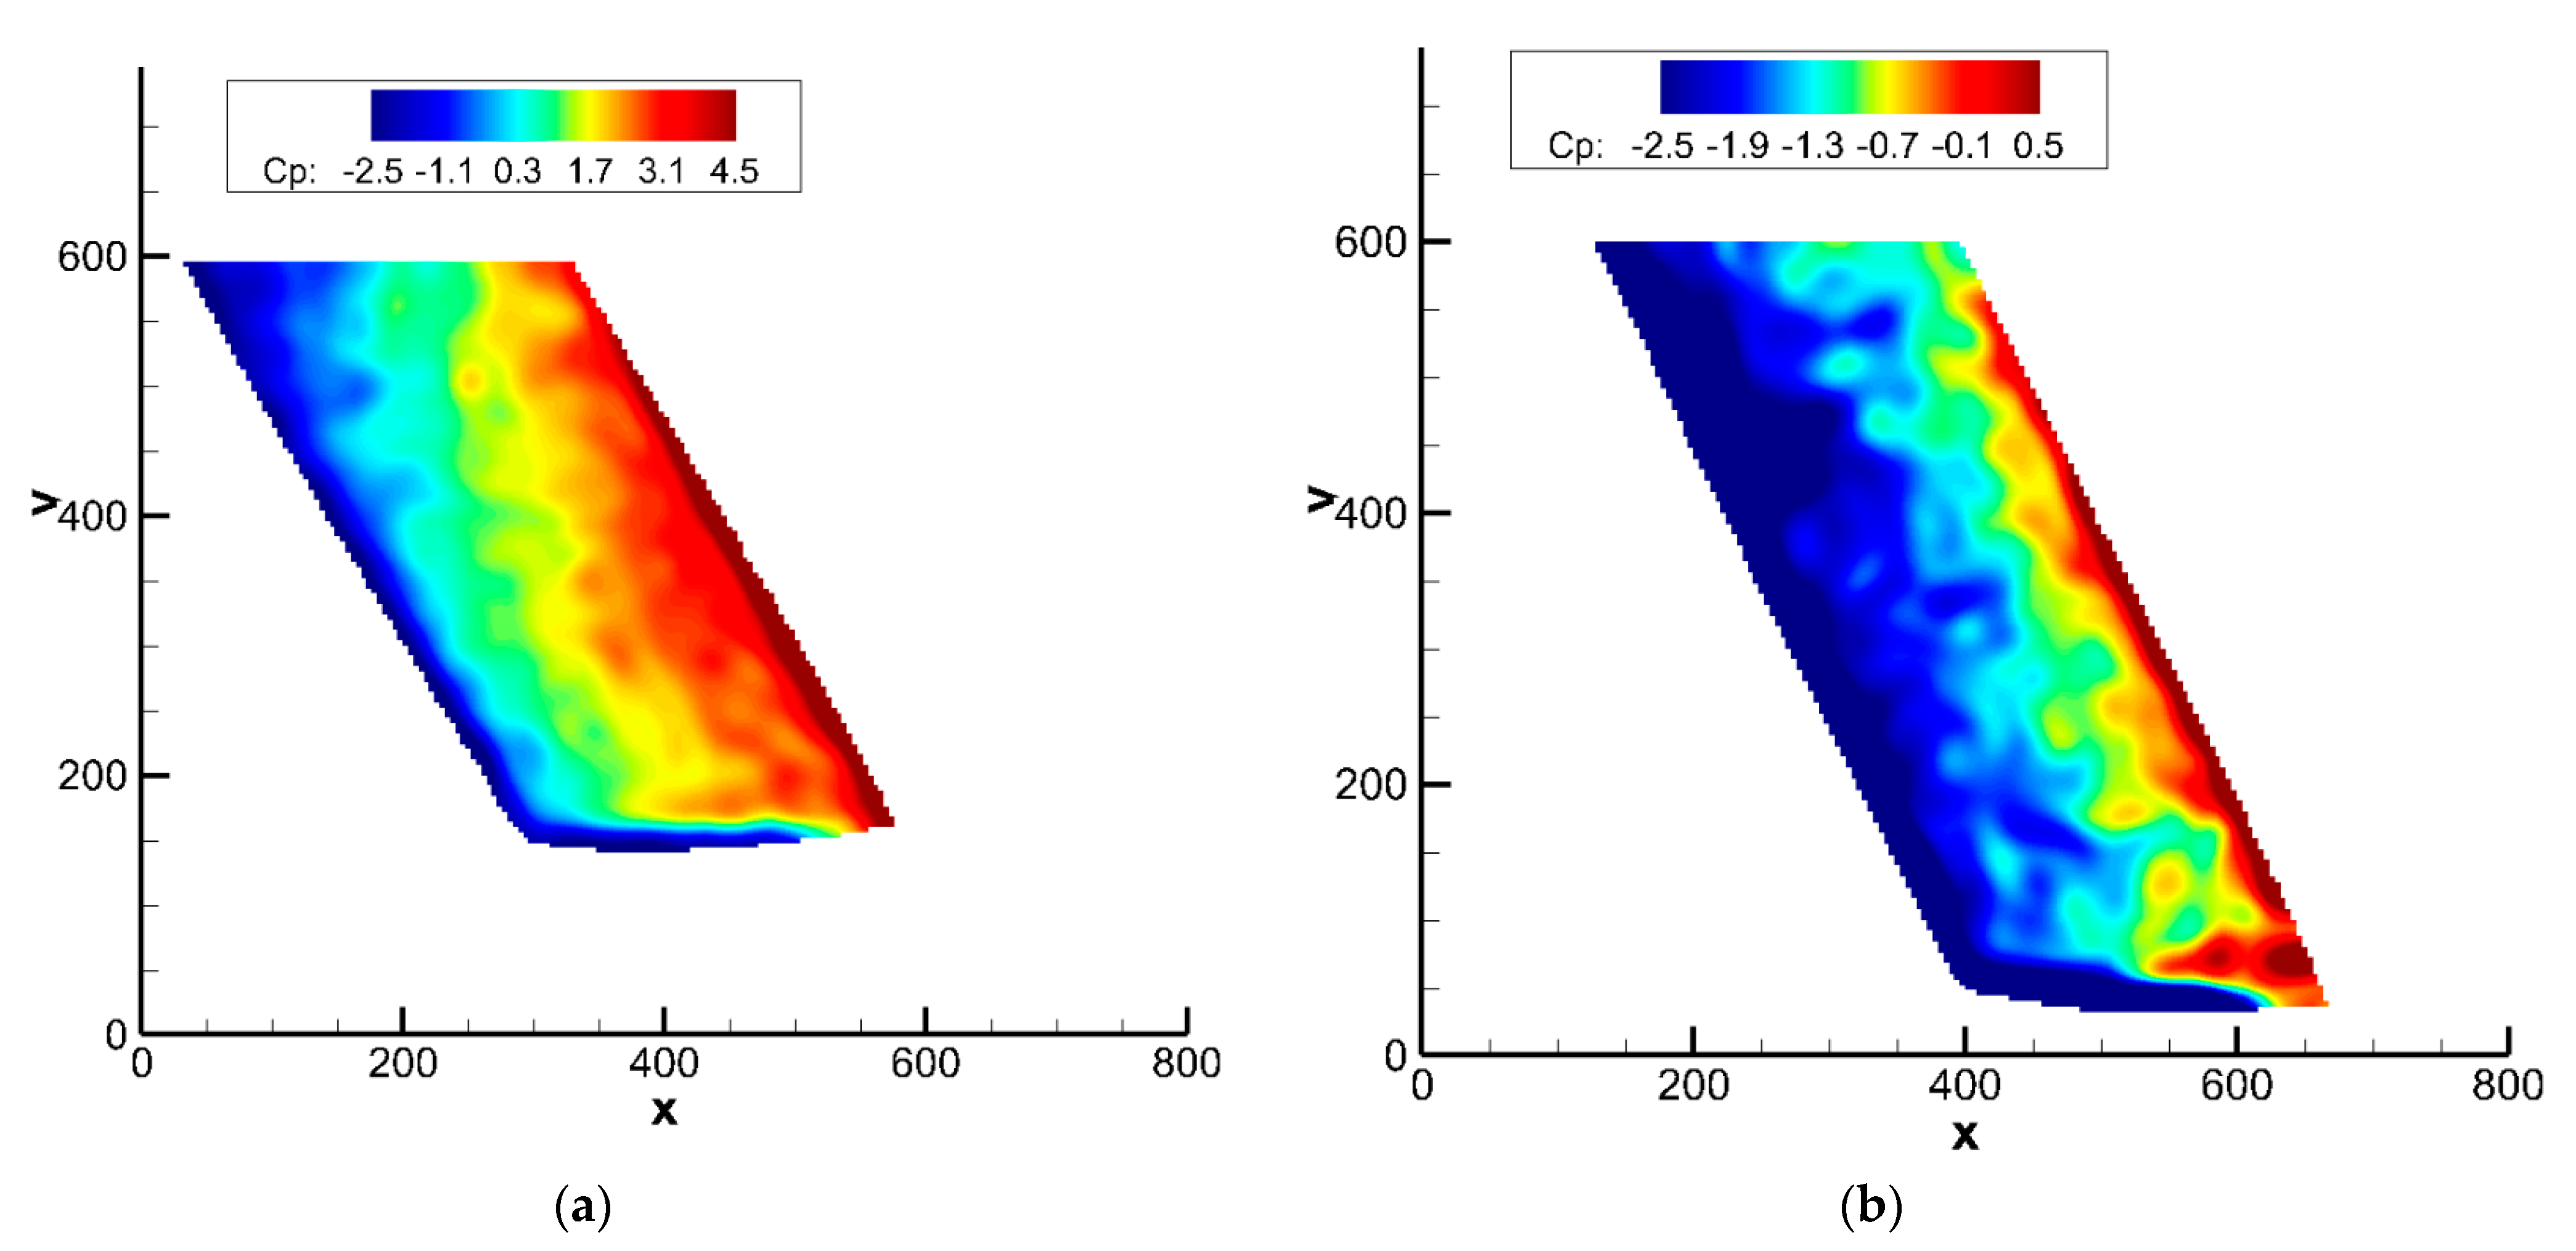
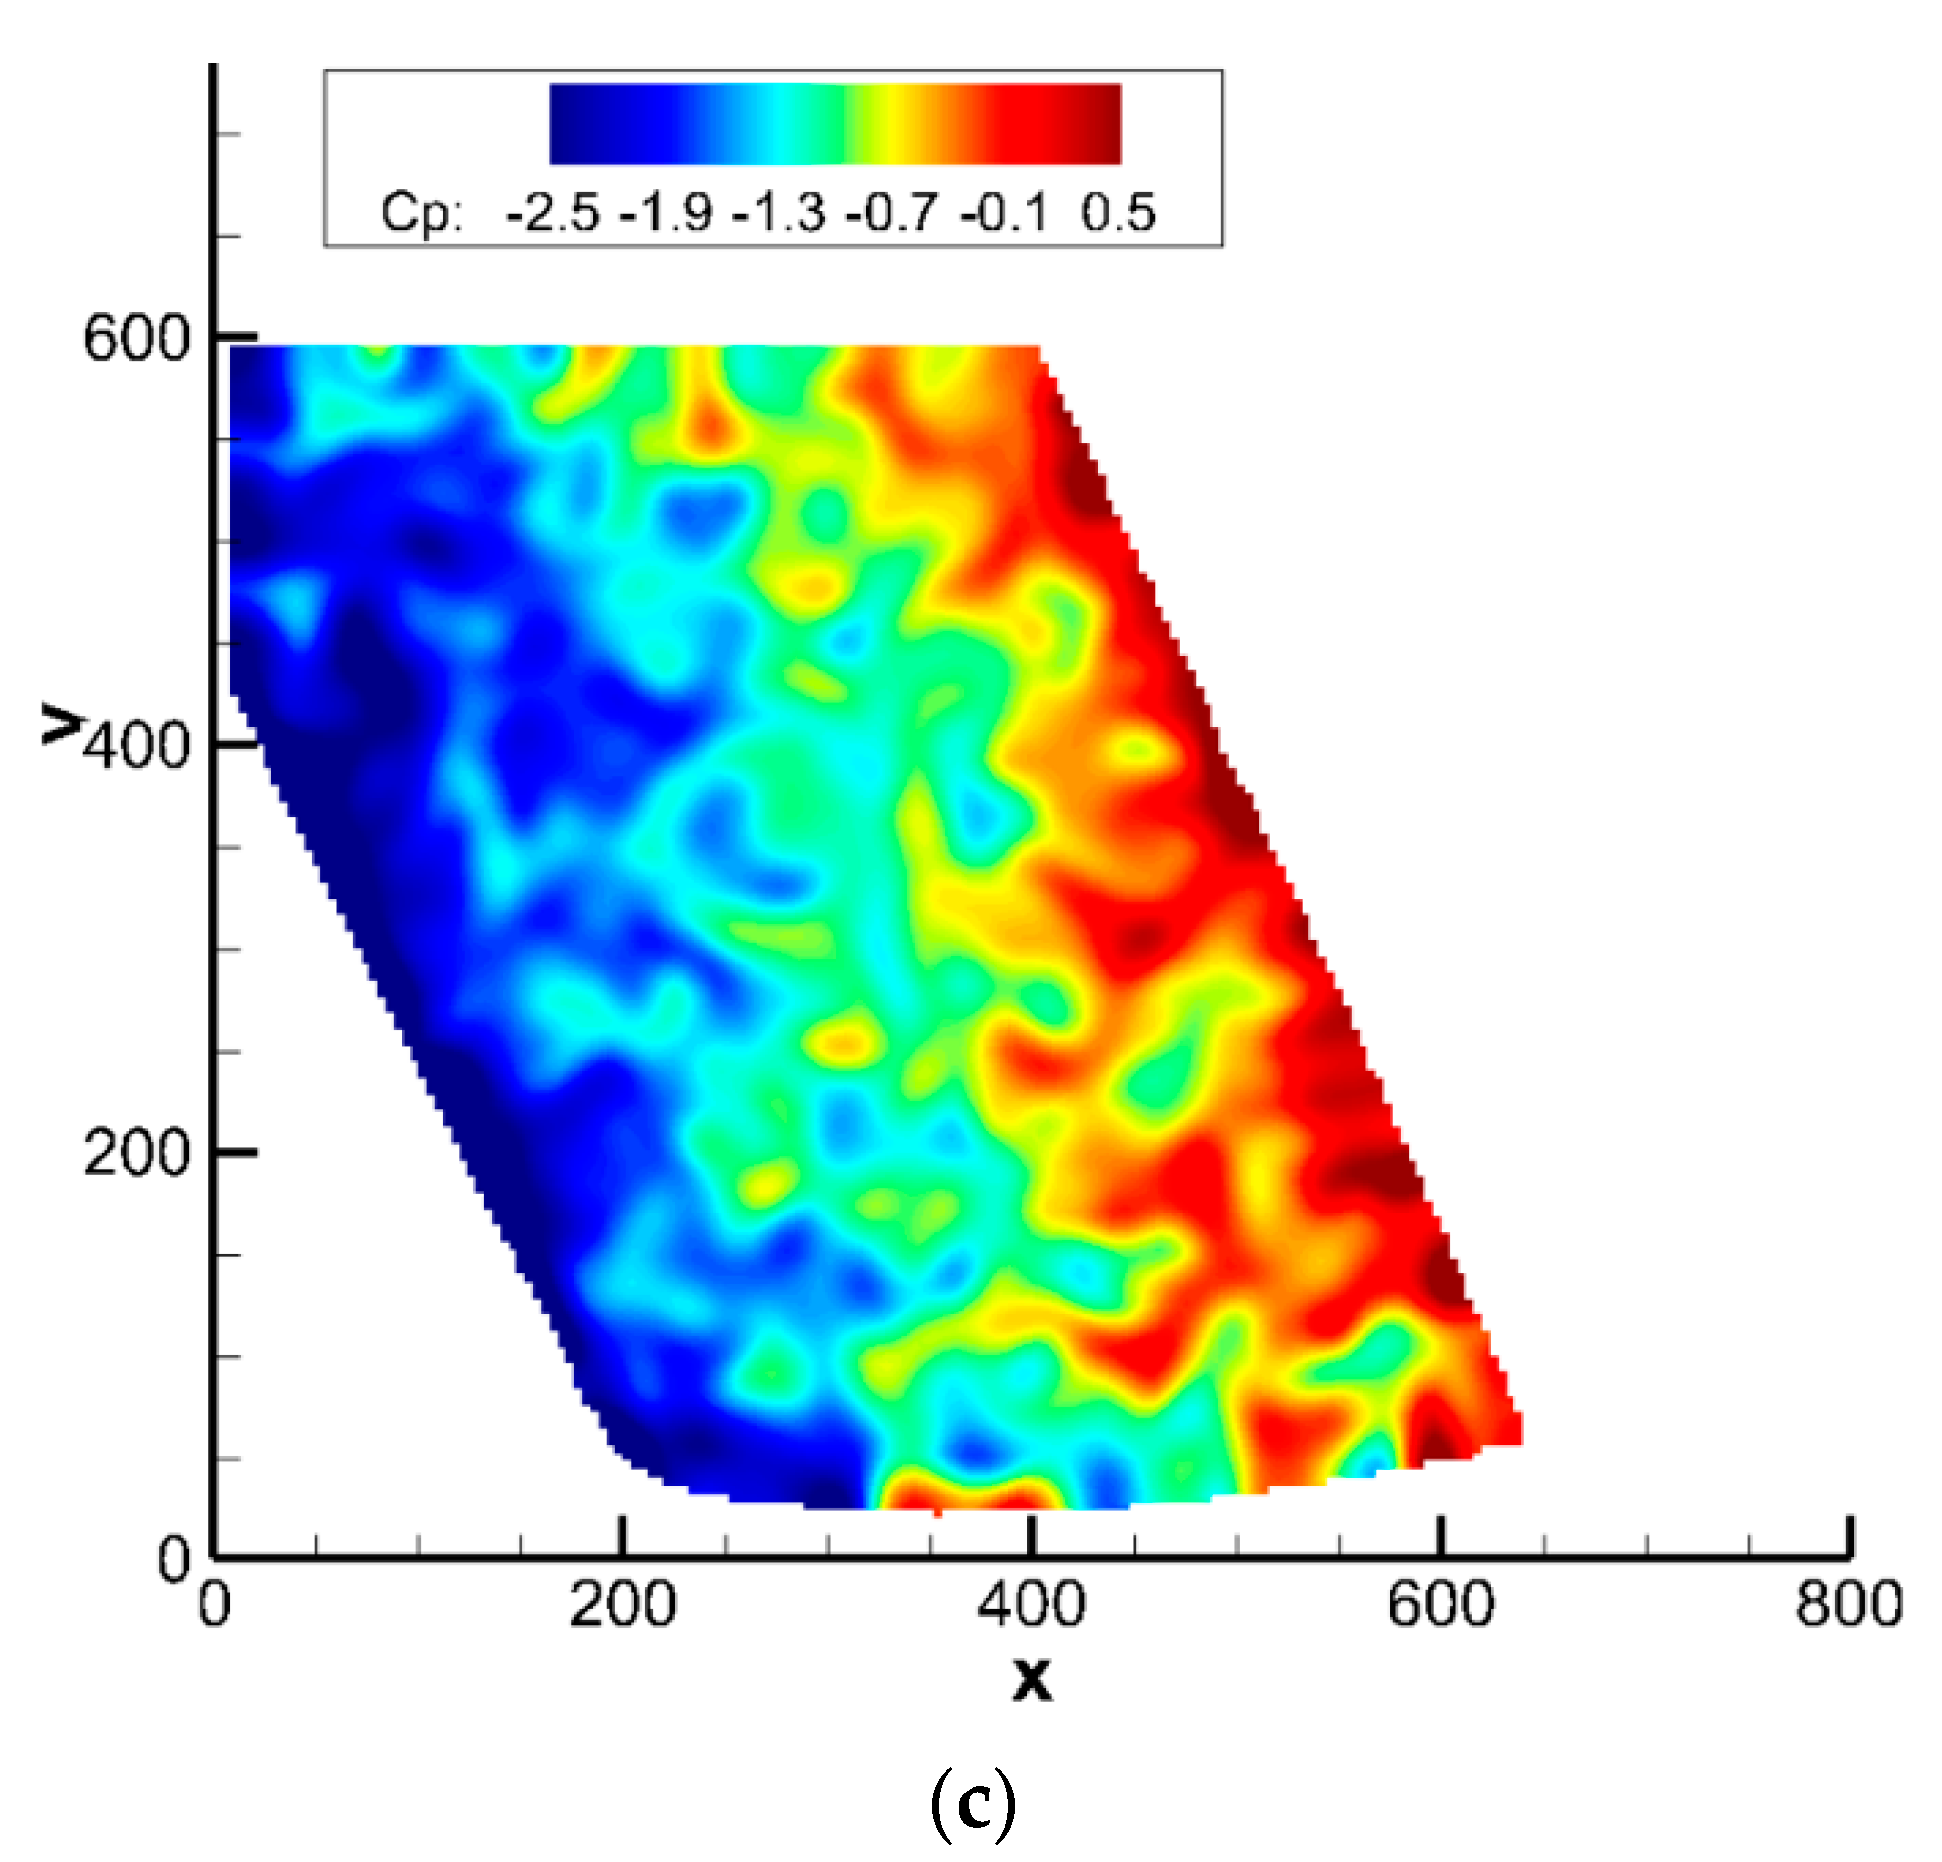
As described in the experimental setup, the conventional approach to obtain PSP measurements can be challenging due to the low dynamic pressure. This was especially the case during the upwards pitching motion of the wing. However, the downward pitching motion phases showed a higher level of pressure variation compared to the wind-off. Representative PSP cases were obtained for downward motion, and samples are shown corresponding to the sweep angles Λ = 0° and 30° in Figure 18 and Figure 19, including Cp contours. As noted earlier, the exposure times had to be kept in the millisecond range to produce enough signal from the Turbo PSP, which meant measurement integration during about 2.7 degrees of phases. In addition, the repeatability of the flow (‘phase-locked’) was not completely realized, and variations from shot to shot also contribute to the blurriness. Therefore, the data presented has a certain amount of ‘blur’ from the integration/averaging during the motion of the few degrees. Despite this limitation, the pressure maps are consistent with the PIV and the computational studies found in the literature. The phase average was obtained from 64 instantaneous frames. The results for the unswept wing show that the pressure was uniform up to the leading edge at a low phase angle of 13° (↓). As the phase angle reached 19°, the pressure was clustering at the trailing edge and flow separation can be observed. For the swept 30° wing, the pressure map showed distinctive flow characteristics compared to the unswept wing, such as those findings of the PIV campaign. At the 30° sweep angle, the cluster pressure region appears towards the wingtip. This happened because of the formation of the separation vortex towards the wingtip for moderate sweep angle. As the phase angle increased, the pressure region clustered more towards the wingtip, as shown in Figure 19.

4. Summary and Conclusions

In this investigation, the dynamic stall characteristics of pitching finite aspect-ratio wings were explored experimentally. The effect of dynamic motion, sweep angle, and wingspan position were all considered for the analyses. The experiments were conducted in a wind tunnel including three wings with sweep angles of 0°, 15°, and 30° during the pitching motion. During the PIV campaign of the experiment, the data was collected for the Re = 2 × 10⁵ and reduced frequency value k = 0.2. Results were obtained for several angles/phases of the upward and downward motions. Turbo PSP experiments were also conducted with the same Re but half of the pitching frequency when compared to the PIV experiments due to signal strength constraints. The main findings of the study are summarized in the following.
The upward pitching motion created a laminar separation bubble, LSB, on top of the wing surface for the unswept wing. The LSB integral size grew with increased phase angles. Unlike during the upward motion, the downward pitching phases were more unsteady and random in nature. Towards the higher phase angles, the vortical region grew and shed from the trailing edge of the wing.
The pitching angle at which the flow would begin to reattach was influenced by the wing sweep angle. Leading-edge reattachment was prolonged down the length of the wingspan as the sweep angle was increased. For the unswept case, flow reattachment at the leading edge occurred at approximately the same angle it stalled at, whereas for the 15° and 30° swept cases, flow separation would be prolonged closer to 20° and 22°. Additionally, the flow would reattach sooner near the root of the wing and later near the wingtip with increased sweep angles. The swept cases showed more mixing further down the wingspan, likely due to the mixing of leading-edge and wingtip vortex shedding.
Although some prolonged flow reversal was observed, detached arch and ring vortices were not fully identified for the 0° and 15° swept cases. However, a strong presence of secondary vorticity and mixing was observed for the 30° swept case. This secondary vorticity could indicate arch vortex shedding in which, by means of its rotational pattern, could produce an earlier flow reattachment during the pitching cycle.
Although the definitive proof of arch vortices during the dynamic stall cannot be concluded, the PSP results show some similarities with the phenomena of the effect of the sweep found in the computational studies [2,10]. The results show that the pressure cluster regions shift towards the trailing edge of the wing as the phase angle increases during downwards motion. The change of sweep angle increases the pressure clusters towards the wingtip.
Due to some phase-randomness and relatively long exposures of the Turbo PSP, a faster technique with more instantaneous rendering capabilities, such as ‘lifetime’ fast-porous PSP, could be used.

Author Contributions

Conceptualization and Methodology, J.E.; formal analysis, A.H.U., K.L.T. and J.E.; design, J.E. and K.L.T.; experiments and measurements, A.H.U., K.L.T., C.F. and J.E.; analyses, K.L.T., A.H.U., C.F. and J.E.; writing, A.H.U., K.L.T. and J.E.; funding acquisition, J.E. All authors have read and agreed to the published version of the manuscript.

Funding

This research was partially funded by the Ohio Aerospace Institute for the Air Force Research Laboratory, OAI-C2644-19291 contract.

Data Availability Statement

The data presented in this study are available on request from the corresponding author.

Acknowledgments

This material is based upon work supported by the Ohio Aerospace Institute for the Air Force Research Laboratory, OAI-C2644-19291. The authors are very grateful to Miguel Visbal and Daniel Garmann of the AFRL for encouraging the topic, providing CFD simulations, and giving suggestions and fruitful discussions throughout the investigations. The Department of Mechanical Engineering is acknowledged for aiding in the fabrication of various components.

Conflicts of Interest

The authors declare no conflict of interest.

References

  1. McAlister, K.W.; Carr, L.W.; McCroskey, W.J. Dynamic Stall Experiments on the NACA 0012 Airfoil; NASA: Washington, DC, USA, 1978.
  2. Carta, F.; Fink, M.; Jepson, W. The Influence of Sweep on the Aerodynamic Loading of an Oscillating NACA 0012 Airfoil; Volume 1: Technical Report; 1979. Available online: https://ntrs.nasa.gov/api/citations/19790013881/downloads/19790013881.pdf (accessed on 2 December 2021).
  3. Visbal, M.R.; Garmann, D.J. Dynamic stall of a finite-aspect-ratio wing. AIAA J. 2019, 57, 962–977. [Google Scholar] [CrossRef]
  4. Visbal, M.R.; Shang, J. Investigation of the flow structure around a rapidly pitching airfoil. AIAA J. 1989, 27, 1044–1051. [Google Scholar] [CrossRef]
  5. Kuchemann, D.; Weber, J. The Subsonic Flow Past Swept Wings at Zero Lift without and with Body; Aeronautical Research Council: London, UK, 1953. [Google Scholar]
  6. Houghton, E.L.; Carpenter, P.W. Aerodynamics for Engineering Students, 5th ed.; Elsevier: Oxford, UK, 2003. [Google Scholar]
  7. Rumsey, C. 2DN00: 2D NACA 0012 Airfoil Validation Case; Langley Research Center: Hampton, VA, USA, 2018.
  8. Gursul, I.; Wang, Z.; Vardaki, E. Review of flow control mechanisms of leading-edge vortices. Prog. Aerosp. Sci. 2007, 43, 246–270. [Google Scholar] [CrossRef] [Green Version]
  9. Visbal, M.R.; Garmann, D.J. High-fidelity simulations of dynamic stall over a finite-aspect-ratio wing. In Proceedings of the 8th AIAA Flow Control Conference, Washington, DC, USA, 13–17 June 2016; p. 4243. [Google Scholar] [CrossRef]
  10. Visbal, M.R.; Garmann, D.J. Analysis of dynamic stall on a pitching airfoil using high-fidelity large-eddy simulations. AIAA J. 2018, 56, 46–63. [Google Scholar] [CrossRef]
  11. Visbal, M.R.; Garmann, D.J. Effect of sweep on dynamic stall of a pitching finite-aspect-ratio wing. AIAA J. 2019, 57, 3274–3289. [Google Scholar]
  12. Ericsson, L.; Reding, J. Fluid dynamics of unsteady separated flow. Part II. Lifting surfaces. Prog. Aerosp. Sci. 1987, 24, 249–356. [Google Scholar] [CrossRef]
  13. Visbal, M. On some physical aspects of airfoil dynamic stall. In the International Symposium on Non-Unsteady Fluid Dynamics; American Society of Mechanical Engineers: Fairfield, NJ, USA, 1990; Volume 92, pp. 127–147. [Google Scholar]
  14. Ekaterinaris, J.A.; Platzer, M.F. Computational prediction of airfoil dynamic stall. Prog. Aerosp. Sci. 1998, 33, 759–846. [Google Scholar] [CrossRef]
  15. Visbal, M.R. Analysis of the Onset of Dynamic Stall Using High-Fidelity Large-Eddy Simulations. In Proceedings of the 52nd Aerospace Sciences Meeting, National Harbor, MD, USA, 13–17 January 2014; p. 591. [Google Scholar]
  16. Visbal, M.R. Numerical Exploration of Flow Control for Delay of Dynamic Stall on a Pitching Airfoil. In Proceedings of the 32nd AIAA Applied Aerodynamics Conference, Atlanta, GA, USA, 16–20 June 2014; p. 2044. [Google Scholar]
  17. Visbal, M.R. Control of Dynamic Stall on a Pitching Airfoil Using High-frequency Actuation. In Proceedings of the 53rd AIAA Aerospace Sciences Meeting, Kissimmee, FL, USA, 5–9 January 2015; Volume 1267. [Google Scholar] [CrossRef]
  18. Chandrasekhara, M.S.; Carr, L.W.; Wilder, M.C. Interferometric Investigations of Compressible Dynamic Stall over a Transiently Pitching Airfoil. AIAA J. 1994, 32, 586–593. [Google Scholar] [CrossRef] [Green Version]
  19. Ullah, A.H.; Fabijanic, C.; Refling, W.; Estevadeordal, J. Experimental Investigation of the Effect of Sweep on a Pitching Finite-Aspect-Ratio Wing. In Proceedings of the AIAA Scitech 2021 Forum, Orlando, FL, USA, 11–15 & 19–21 January 2021; p. 1733. [Google Scholar]
  20. Tomek, K.L.; Ullah, A.H.; Fabijanic, C.; Estevadeordal, J. Experimental Investigation of Dynamic Stall on Pitching Swept Finite-Aspect-Ratio Wings. In Proceedings of the AIAA Scitech 2020 Forum, Orlando, FL, USA, 6–10 January 2020; p. 1980. [Google Scholar]
  21. Rockwood, M.; Medina, A.; Garmann, D.J.; Visbal, M.R. Dynamic Stall of a Swept Finite Wing for a Range of Reduced Frequencies. In Proceedings of the AIAA Aviation 2019 Forum, Dallas, TX, USA, 17–21 June 2019. [Google Scholar]
  22. Stolt, A.J.; Ullah, A.H.; Estevadeordal, J. Study of leading-edge dimple effects on airfoil flow using tomographic PIV and temperature sensitive paint. Fluids 2019, 4, 184. [Google Scholar] [CrossRef] [Green Version]
  23. Watkins, N.; Leighty, B.; Lipford, W.; Wong, O.; Goodman, K.; Crafton, J.; Forlines, A.; Goss, L.; Gregory, J.; Juliano, T. Deployment of a pressure sensitive paint system for measuring global surface pressures on rotorcraft blades in simulated forward flight. In Proceedings of the 28th Aerodynamic Measurement Technology, Ground Testing, and Flight Testing Conference including the Aerospace T&E Days Forum, New Orleans, LA, USA, 25–28 June 2012; p. 2756. [Google Scholar]
  24. Gregory, J.; Asai, K.; Kameda, M.; Liu, T.; Sullivan, J. A review of pressure-sensitive paint for high-speed and unsteady aerodynamics. Proc. Inst. Mech. Eng. Part G J. Aerosp. Eng. 2008, 222, 249–290. [Google Scholar] [CrossRef]
  25. Gardner, A.D.; Klein, C.; Sachs, W.; Henne, U.; Mai, H.; Richter, K. Investigation of three-dimensional dynamic stall on an airfoil using fast-response pressure-sensitive paint. Exp. Fluids 2014, 55, 1807. [Google Scholar] [CrossRef]
  26. Disotell, K.J.; Nikoueeyan, P.; Naughton, J.W.; Gregory, J.W. Global surface pressure measurements of static and dynamic stall on a wind turbine airfoil at low Reynolds number. Exp. Fluids 2016, 57, 82. [Google Scholar] [CrossRef]
  27. Ullah, A.H.; Rostad, B.L.; Estevadeordal, J. Three-cylinder rotating system flows and their effects on a downstream dimpled airfoil. Exp. Therm. Fluid Sci. 2021, 124, 110343. [Google Scholar] [CrossRef]
  28. Raffel, M.; Willert, C.E.; Scarano, F.; Kähler, C.; Wereley, S.T.; Kompenhans, J. Particle Image Velocimetry: A Practical Guide; Springer: Berlin/Heidelberg, Germany, 2018. [Google Scholar]
Figure 1. Drawing with dimensions and geometry for the NACA0012 wing with swept angle 30° (a); and photography of three 3D printed models (b); wing test print with supporting rods (c); and Λ = 30°-wing mounted in the wind tunnel test section wall (d).
Fluids 06 00457 g001
Figure 2. Entire actuator assembly.
Fluids 06 00457 g002
Figure 3. Schematics of PIV setup.
Fluids 06 00457 g003
Figure 4. Photography of the two PIV camera views (LE and TE) (a) and of the laser firing during a test (b); laser spanwise locations for 2D PIV data collection (c).
Fluids 06 00457 g004
Figure 5. Photography of typical PSP setup: (a) UV LED (indicated with an ‘a’), 35 Hz color camera with proper filters (indicated with a ‘b’), PSP painted wing (indicated with a ‘c’) (a) and the current experiment swept wing sample setup with Turbo PSP (b,c).
Fluids 06 00457 g005
Figure 6. Rotating counter weight and infrared sensor for triggering (a), external trigger source (yellow) and laser signal pulse (green) shown on the oscilloscope screenshot (b), and illustration of actuation of wing for 30° sweep pitching motion at ~30 Hz (c).
Fluids 06 00457 g006aFluids 06 00457 g006b
Figure 7. Schematic of upward/upstroke/pitching up (↑) and downwards/downstroke/pitching down (↓).
Fluids 06 00457 g007
Figure 8. Leading- (left) and trailing- (right) edge flow structure at α = 21.1° ↑, x/c = 0.4.
Fluids 06 00457 g008
Figure 9. Leading- (left) and trailing- (right) edge flow structure at α = 21.2° ↓, x/c = 0.4.
Fluids 06 00457 g009
Figure 10. Leading- (left) and trailing- (right) edge flow structure at α = 14.4° ↓, x/c = 0.4.
Fluids 06 00457 g010aFluids 06 00457 g010b
Figure 11. Leading- (left) and trailing- (right) edge flow structure at α = 22.1° ↑, x/c = 0.4.
Fluids 06 00457 g011
Figure 12. Leading- (left) and trailing- (right) edge flow structure at α = 19.5° ↓, x/c = 0.4.
Fluids 06 00457 g012aFluids 06 00457 g012b
Figure 13. Leading- (left) and trailing- (right) edge flow structure at α = 12.8° ↓, x/c = 0.4.
Fluids 06 00457 g013
Figure 14. Leading- (left) and trailing- (right) edge flow structure at α = 21.5° ↑, x/c = 0.6.
Fluids 06 00457 g014
Figure 15. Leading- (left) and trailing- (right) edge flow structure at α = 21.1° ↓, x/c = 0.6.
Fluids 06 00457 g015
Figure 16. Instantaneous flow visualization and velocity contours during upstroke phases at x/c = 0.4, x/c = 0.6, x/c = 0.8, and x/c = 1.0 for the unswept wing, Λ = 0°.
Fluids 06 00457 g016
Figure 17. Instantaneous flow visualization and velocity contours during downstroke phases at x/c = 0.4, x/c = 0.6, x/c = 0.8, and x/c = 1.0 for the unswept wing Λ = 0°.
Fluids 06 00457 g017
Figure 18. Phase-averaged PSP maps for the unswept, Λ = 0°, wing: (a) 13° pitching down, (b) 19° pitching down, Re = 200 K and k = 0.1.
Fluids 06 00457 g018
Figure 19. Phase-averaged PSP map for 30° swept wing: pitching down phases at 17° (a, with a closer camera view), 19° (b), and at 22° (max) at close camera view (c). Re = 200 K and k = 0.1.
Fluids 06 00457 g019aFluids 06 00457 g019b
Table 1. Experimental parameters.
Experimental Parameters
Wind tunnel test area dimensions
(Height × Width × Length)
304.8 mm × 304.8 mm × 1828.8 mm
WingNACA0012
Chord length76.2 mm
Free stream Mach numberM∞ = 0.1
Chord Reynolds numberRec = 2 × 10⁵
Actuation angle rangeα = 4° and 22°
Sweep anglesΛ = 0°, 15°, and 30°
Reduced frequency k = πfc/U0.2 (PIV) and 0.1 (PSP)
Publisher’s Note: MDPI stays neutral with regard to jurisdictional claims in published maps and institutional affiliations.