Abstract
Sickle cell disease (SCD) is an inherited monogenic disease characterized by distorted red blood cells that causes vaso-occlusion and vasculopathy. Presently, electrophoresis of haemoglobin and genotyping are used as routine tests for diagnosis of the SCD. These techniques require specialized laboratories and are expensive. The low-cost microfluidics-based diagnostic tool holds a great attention for screening of red blood cell (RBC) deformability. In the present study, lubrication theory has been applied in order to develop a biomechanical model of microcirculation with altered rheological properties of sickle blood in the capillary, which is smaller in size compared to the cell diameter, to explain the multifactorial nature and pathogenesis of vaso-occlusion in SCD. The governing equations have been solved analytically for realistic boundary conditions and simulated using MATLAB. We found that the axial velocity of the cell decreases with a decrease in deformability and compliance. The height of the lubricating film predicts deformation of the cell with respect to local pressure in the microcirculation. Leak back and drag force depend non-linearly on the deformed cell radius with varying viscosity of the plasma and Reynolds number. The modelling predictions of this study is in coherence with experimental results. The analyzed parameters provide unique insights with novel possibilities to design a microfluidics-based effective therapeutic intervention for SCD.
1. Introduction
Blood is a multiphase fluid, primarily made up of red blood cells (RBCs), white blood cells (WBCs) and platelets suspended in plasma. Oxygenated blood flows away from the heart to different organs through systemic circulation. Healthy RBCs are biconcave discs with a mean diameter of 6–8 µm and a maximal thickness of 2 µm. They represent approximately 40 to 45% of the average volume of human blood and more than 99% of blood cells. RBCs are highly deformable cells, which can easily squeeze through the capillaries (where the internal diameter is less than or equal to of their own) and transport oxygen and nutrients to the different parts of the body through the network of vessels. In 1910, James B. Herrick, first reported a large number of thin, elongated, sickle-shaped cells in a blood smear of an African [1]. After 40 years Pauling et al., advocated the existence of a molecular disease due to a defective haemoglobin molecule (HbS), which was named sickle cell disease (SCD) [2]. This was the first identified molecular disease inherited genetically. The genetic basis of SCD is the substitution of valine for glutamic acid in the sixth position of each β–globin chain of the haemoglobin protein β6: Glu → Val [3]. Within the microcirculation of deoxygenated haemoglobin, molecules polymerize and form rigid fibres of HbSS that injure the cytoskeleton of the RBC and consequently cause a change in the biomechanical and rheological properties [4,5]. Morbidity and mortality due to a vaso-occlusion event in SCD under clinical manifestation inlcude recurrent painful crises, bone marrow infraction, organ damage and stroke. Early viscometry studies reveal that sickle blood cells are more viscous and less deformable than healthy red blood cells [6]. Viscosity of haemoglobin protein in sickle red blood cells is remarkably high even in their oxygenated condition, which reduces RBC deformability [7,8]. Higher plasma viscosity results in higher protein concentration by which RBC aggregation (rouleaux formation) occurs [9].
Researchers have used different techniques to investigate the effects of various factors such as changes in vessel geometry, viscosity, pressure gradient, adhesive interaction and aggregation of the RBCs on blood rheology which contribute to blood flow obstruction and leads to vaso-occlusion [10,11]. Considering RBC and its membrane as a viscoelastic solid, Evan et al., quantified that the elastic moduli of sickle RBCs are higher than average [12]. Hebbel et al., also showed that sickle RBCs are more adherent to endothelial cells than to healthy cells [13]. In a subsequent study, Evans et al. quantified the strength of sickle RBC-endothelial adhesion and demonstrated the role of plasma factor using a micropipette [14]. The deformability of an individual sickle cell was examined using optical tweezers to calculate overcrowding in confined flowing suspension [15]. Ye et al., investigated the deformation and 3D motion of RBCs in a rectangular microchannel using a dissipative particle dynamics (DPD) approach [16]. It is imperative to discuss the rheology of RBCs in the whole blood to better understand the motion of RBCs in a microchannel. Landmark studies by Fahraeus et al., in 1931 found that blood loses its homogeneous character under flow in cylindrical tubes less than 300 µm in diameter [17]. Blood viscosity decreases with decreasing tube diameter (Poiseuille Law). Several investigations were performed to find a molecular mechanism of SCD and its effects on the clinical course of the disease [18], hitherto flow dynamics in capillaries during SCD has not got much attention, despite this area being significant in being able to understand the whole event [19]. Presently electrophoresis of haemoglobin for the HbS variant and genotyping are used as routine tests for diagnosis of SCD. Both of these techniques require a specialized laboratory. New nuances of microfluidics hold great potential as a tool to measure RBC deformability and adhesion which are the key biophysical factors of vaso-occlusion in SCD. Since microfluidic systems can probe deformation of RBC incorporation at physiological flow conditions [20,21], it holds great potential as a micro-fluidic-based diagnostic tool (medical device).
The fundamental approach is to predict whether the rheological properties, with reference to mechanical properties, of the individual blood cells is suitable for the modelling of blood in capillaries with a diameter of less than 8 µm. There are many investigations in microcirculation which extend the continuum models, including the effects of the plasmatic layer near the vessel wall [22,23]. Bernard et al., studied the effect of the diameter of the undeformed cell to the capillary spacing with a pressure gradient and the ratio of the cell velocity to the average flow velocity over the cross-section of the capillary in the microcirculation [24]. Lighthill found that the undeformed shape of RBCs near the wall to be parabolic and the deformation of the cell to be proportional to the local pressure [3]. Fitz-Gerald reinvestigated his work and concluded that the mechanics of deformation of the cell to allow passage through narrow capillaries is the response of a non-uniform distribution of forces such as a local and mean pressure gradient [25]. Axisymmetric geometry of the RBC was analyzed by Zarda et al. [26] and Pedrizzetti [27] in the capillary flow at low velocities. Secomb et al., introduced symmetrical and asymmetrical quantitative models of the cells that relate red cell mechanics to the flow properties of blood in capillaries by using lubrication theory to approximate plasma flow in a narrow gap between the cell and the vessel wall [16,28]. Lin et al. [29,30] performed a numerical simulation of the axisymmetric, pressure-driven motion of red blood cells through cylindrical capillaries to investigate apparent viscosity, the bending moment, sheer stress and the flow rate with axis symmetric deformation of RBC in narrow vessels by using lubrication theory in agreement with experimental studies.
In this present work, a mathematical model has been developed for the investigation of how a pellet (red blood cell) moves through a narrow fluid filled cylindrical tube (capillary) which is smaller in size compared to the cell diameter. The pellet, containing incompressible fluid, enters the tube in edge-on position and deforms to an axis symmetrical parachute (paraboloid) shape. Single file flow is considered and neglects cell-cell interaction. The tube is taken to be nonporous in order to ignore the effect of ESL inside the capillary wall. This study is focused on the flow within the capillary for axisymmetric cell-deformation and investigates the flow profile in healthy and sickle blood. To describe the flow of a single cell, a thin lubricating film of plasma has been used between cell and capillary wall. Equations of motion are given by Navier-Stoke’s equation and a continuity equation (due to incompressibility). In a steady-state, and at a very low Reynolds number, lubrication theory has been implemented and inertial effects have been neglected. Since plasma in the capillary, on average, moves slower than within the cells, we simulated the effect of motion of a highly viscous liquid filled membrane in a narrow tube and developed the model for the flow behavior in the disease condition.
2. Mathematical Formulation
2.1. Assumptions of the Model
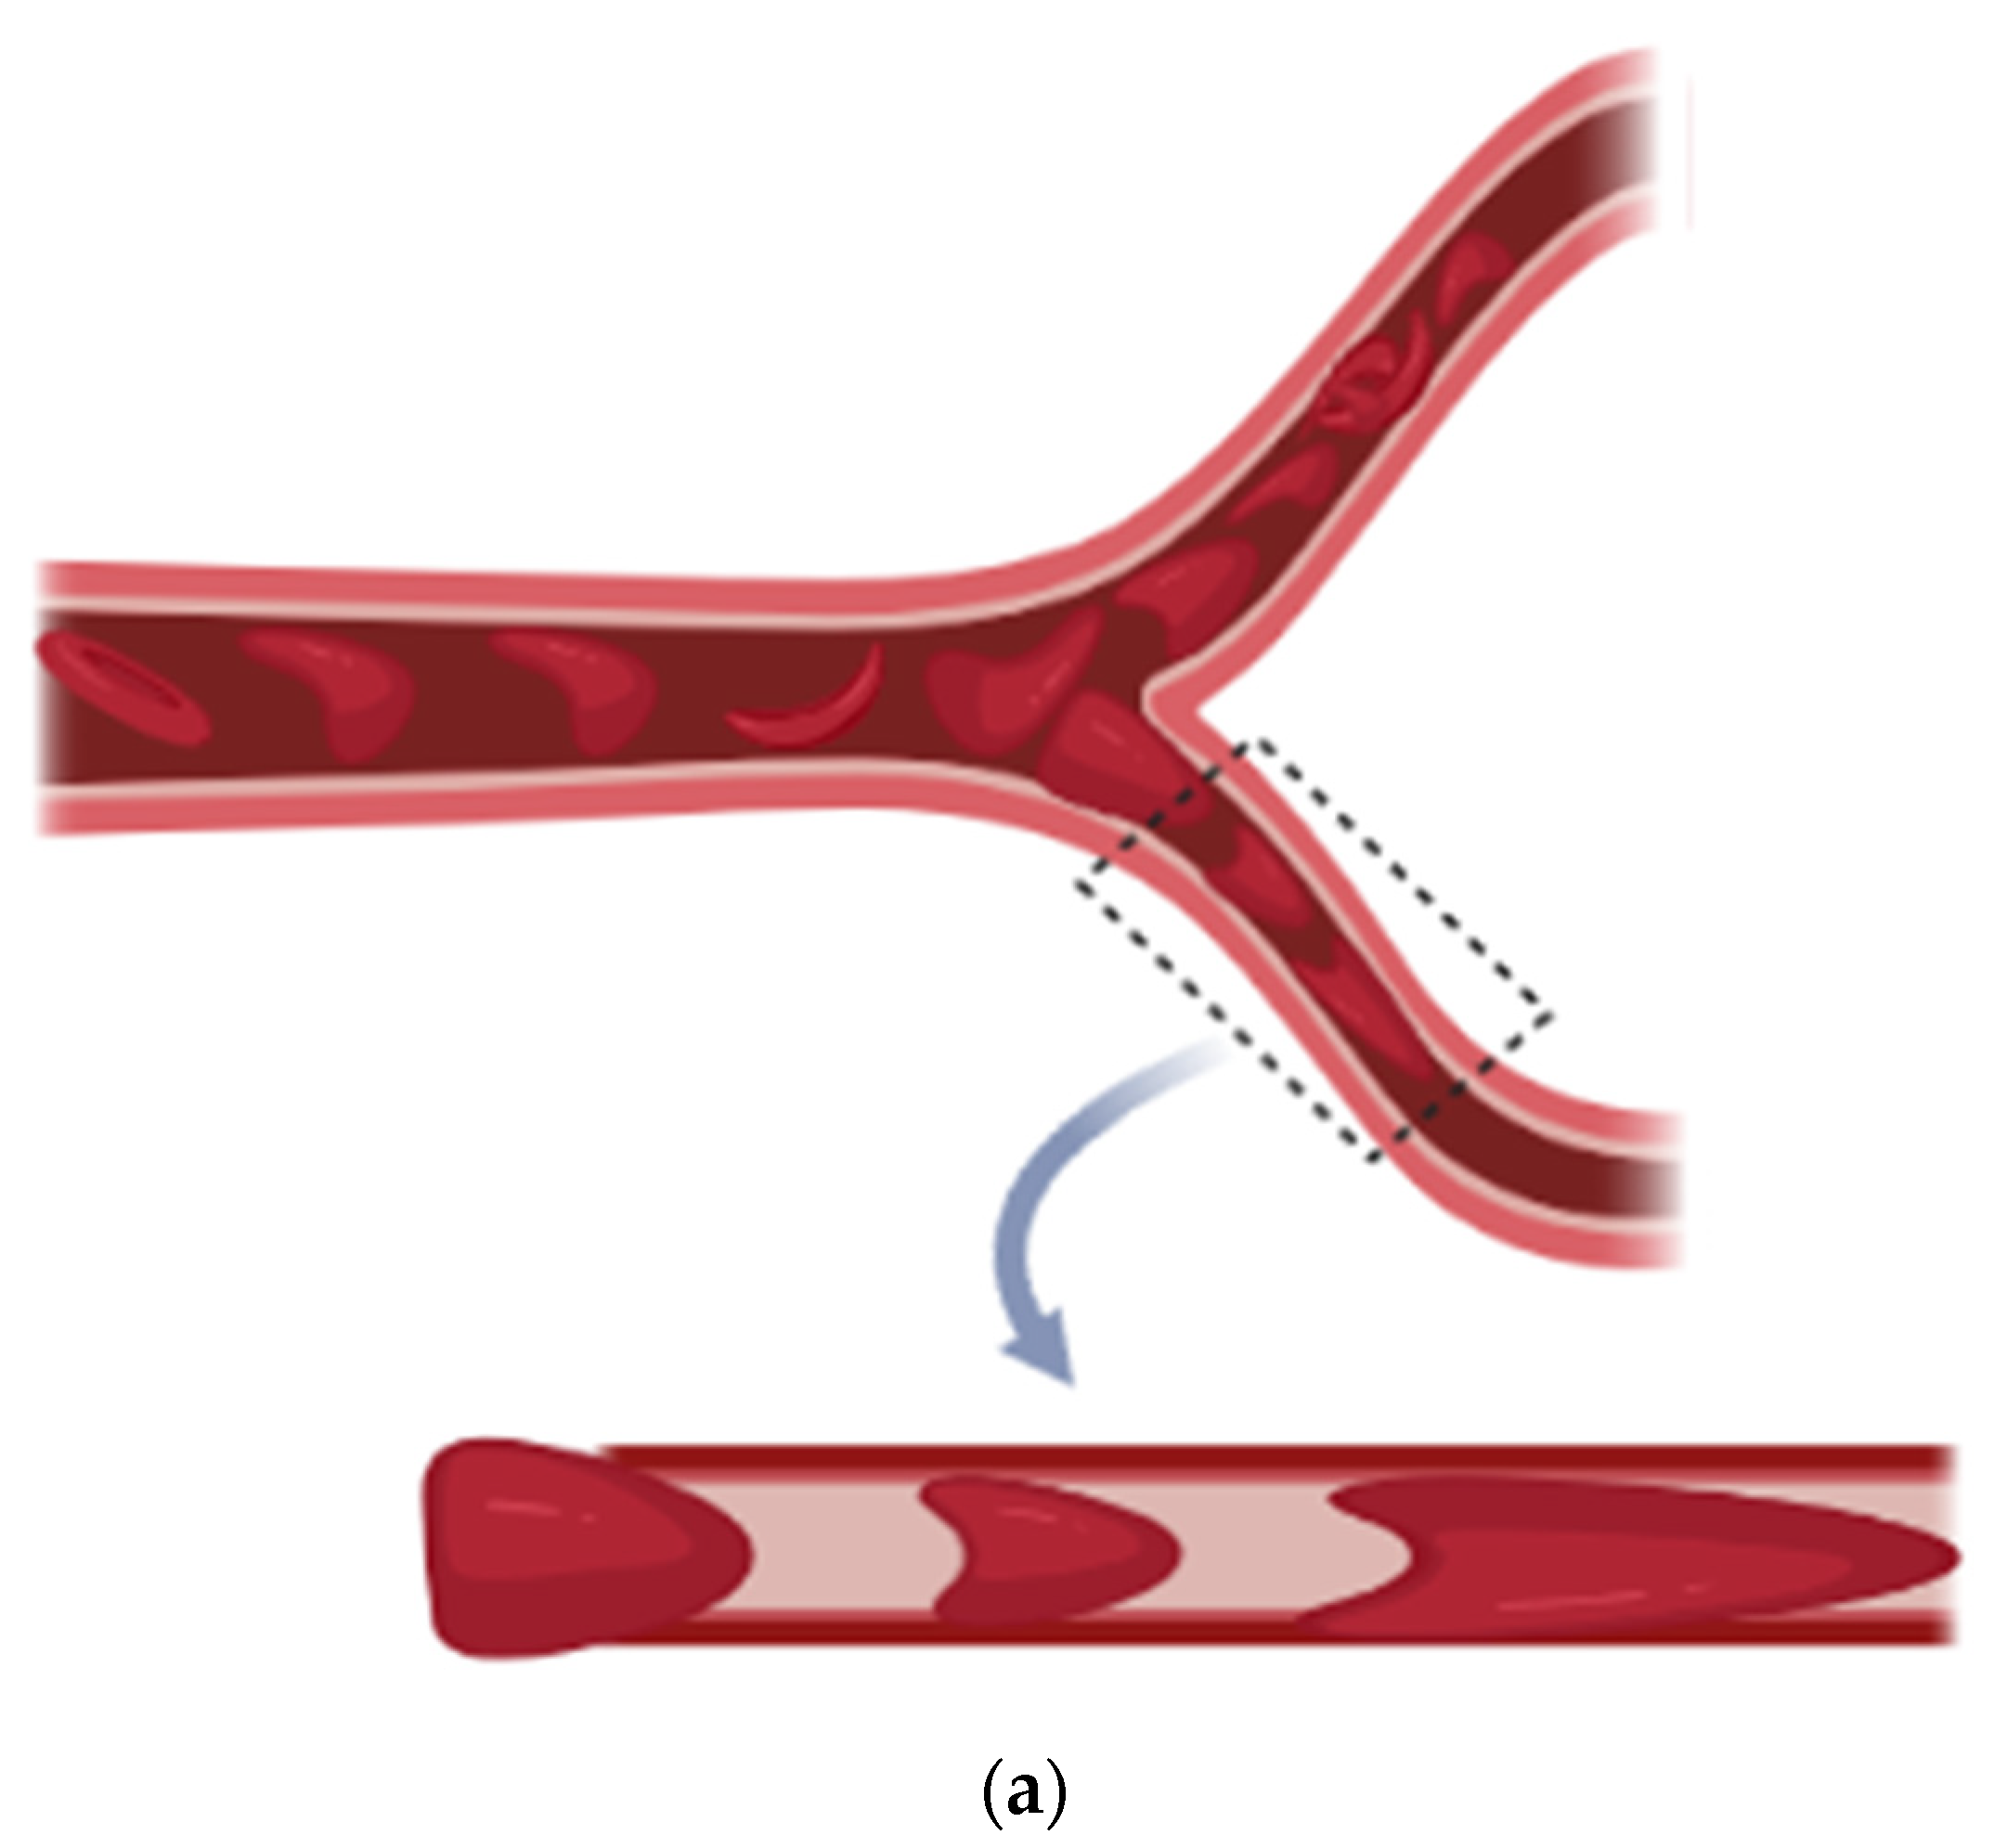
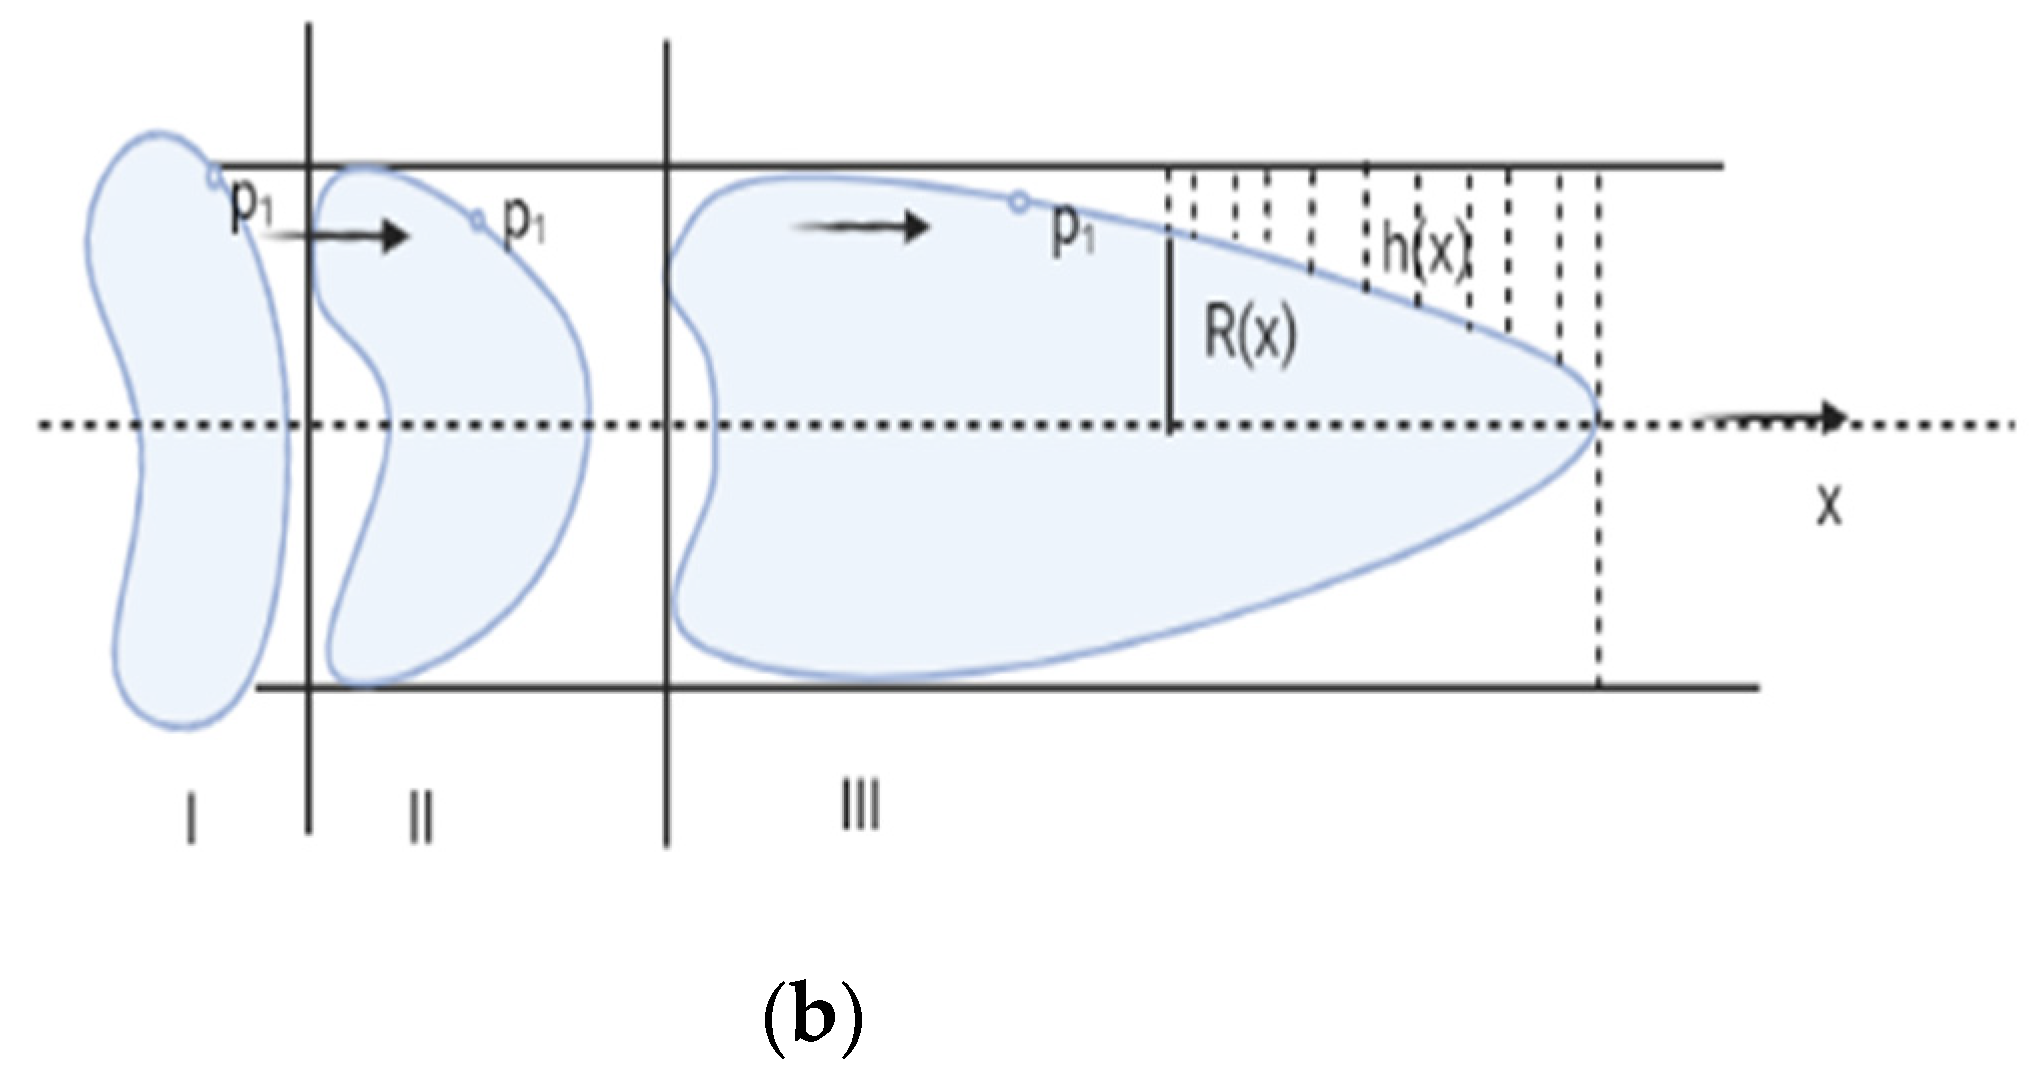
RBC deformability can be screened in microcirculation when deoxygenation occurs. RBC passes through the micro-capillaries and undergoes a complex and time dependent deformation which depends on the geometry of micropore, mechanical and rheological properties of the cell and suspending medium. To analyze the sickle red blood cell motion in the capillary, we have taken a two-dimensional cylindrical polar geometry and emphasized that the diameter of the capillary is less than that of RBC (as shown in Figure 1). Single file flow is considered and cell-cell interaction is neglected. The tube is taken to be nonporous to ignore the effect of ESL inside the capillary wall and flow in the capillary for axisymmetric cell-deformation.


Figure 1.
(a) Sickle Vaso-occlusion, (b) Geometrical Representation.
2.2. Formulation of the Model
2.2.1. Red Blood Cell Mechanics
The red blood cells that have a viscoelastic membrane and contain incompressible viscous fluid in biconcave shape show complex behavior. Its structure can easily support an increase in external pressure transmitted directly to the fluid inside the cytoskeleton. Filterability of RBCs sensitively depends on the resistance to transient deformation [31].
Sickle RBCs are comparatively less deformable (more rigid) than normal RBCs, hence we have taken deformability as a key determinant when screening for sickle red blood cells in microcirculation. Change in the flow structure is strongly correlated with a change in shape of the RBC, and it depends on the distance between two neighboring cells [32].
Here, we have used the concept of reference pressure and elastic behavior of pellets according to Fitz-Gerald [25]. In this model reference pressure applied to the rim will deform the pellet just to fit it to the tube. An additional pressure must be applied to the rim once bowing has occurred. Where is non uniform, pressure generated in the lubrication film and is cell compliance. Here we have taken the parachute shape of the RBC at the point of constriction and further deformed it into an elongated parachute (with a comparatively long tail and lower dimple on front) under the influence of additional pressure which continued until the RBC formed an elongated bullet shape. Here is measured as positive downstream from the point where the unstressed pellet has its maximum diameter. We have taken the condition when the pellet radius is almost equal to the radius of tube. We Considered an axisymmetric pellet of radius , separated from tube (capillary) radius by a gap of thickness .
is the pellet profile when the reference pressure is applied to the rim of pellet and is the unstressed tube radius. Lubrication film in the surroundings of the pellet profile generated a non-uniform pressure if the tube was also deformed linearly under the action of pressure change and elastic compliance of the tube.
Then .
For the sake of simplicity, we have taken elliptical pellet profile.
Then: .
Now:
Here is the measure of the curvature of the pellet at the point of constriction and the length of the pellet is given by .
Hence, height of lubricating film is
2.2.2. Plasma Flow Mechanics
The motion of the plasma fluid is modelled by Naiver-Stoke’s equation and the equation of continuity. We have considered as axial velocity component of fluid, where and axes are taken as along and across the capillary. and are the initial velocity components of the fluid.
Thickness of the fluid layer between the cell and the wall is sufficiently small so that lubrication theory is used to describe the squeezing flow of plasma in between the cell and tissue wall. Stoke’s equation can be reduced to the Reynolds equation.
2.3. Governing Equation
Hence, the equation of motion can be written as:
The fluid film thickness of the plasma between the cell and the tube wall is represented as:
By coupling the fluid film thickness of the plasma with Reynold’s equation, we can analyze the dynamics of the lubricating film, which is moving slower than the cell velocity.
The continuity condition may now be written as:
The drag per unit area on the pellet is:
Boundary conditions are:
Non dimensional scheme:
By using the above non-dimensional scheme, the above equations can be written as an equation of motion:
Height of lubrication film of plasma between the pellet and tube wall:
Integral form of continuity equation:
Drag force on the rim of the pellet in the tube is given by:
Dimensionless boundary conditions are given by:
On integrating Equation (9) w.r.t ‘’ we have:
2.4. Solution
Solution for the axial velocity component of fluid (plasma) in the capillary is given by:
For the sake of simplicity let .
By using Equation (15) in Equation (11) and integrating w.r.t ‘r’ Reynold’s equation, the flux per unit length in backward direction (leak back ()) is:
Drag force on the rim of the pellet in the tube is given by:
where is a dimensionless radius of the deformed pellet influenced by local pressure P2. Some notations which are used in discussion include (Mean Pressure gradient).
3. Results
The deformability of a red blood cell plays a major role in microcirculation to regain its original contour in a fraction of seconds. In sickle cell disease (SCD) RBCs become less deformable (stiff) and adherent than normal RBC, depending on oxygen saturation property of haemoglobin protein. Deformability is a key bio-physical factor that can be understood in the micro capillary flow for the screening of SCD. A set of analytical solutions have been derived to understand the flow behavior of the blood in the capillary with variation in cell compliance, pressure difference, viscosity of plasma and intracellular haemoglobin suspended in the RBC. Graphical results have been computed using MATLAB 2019b. Parameters are used in this study has been given in Table 1. Graphical representation of analytical results are as follows:

Table 1.
Model Parameters.
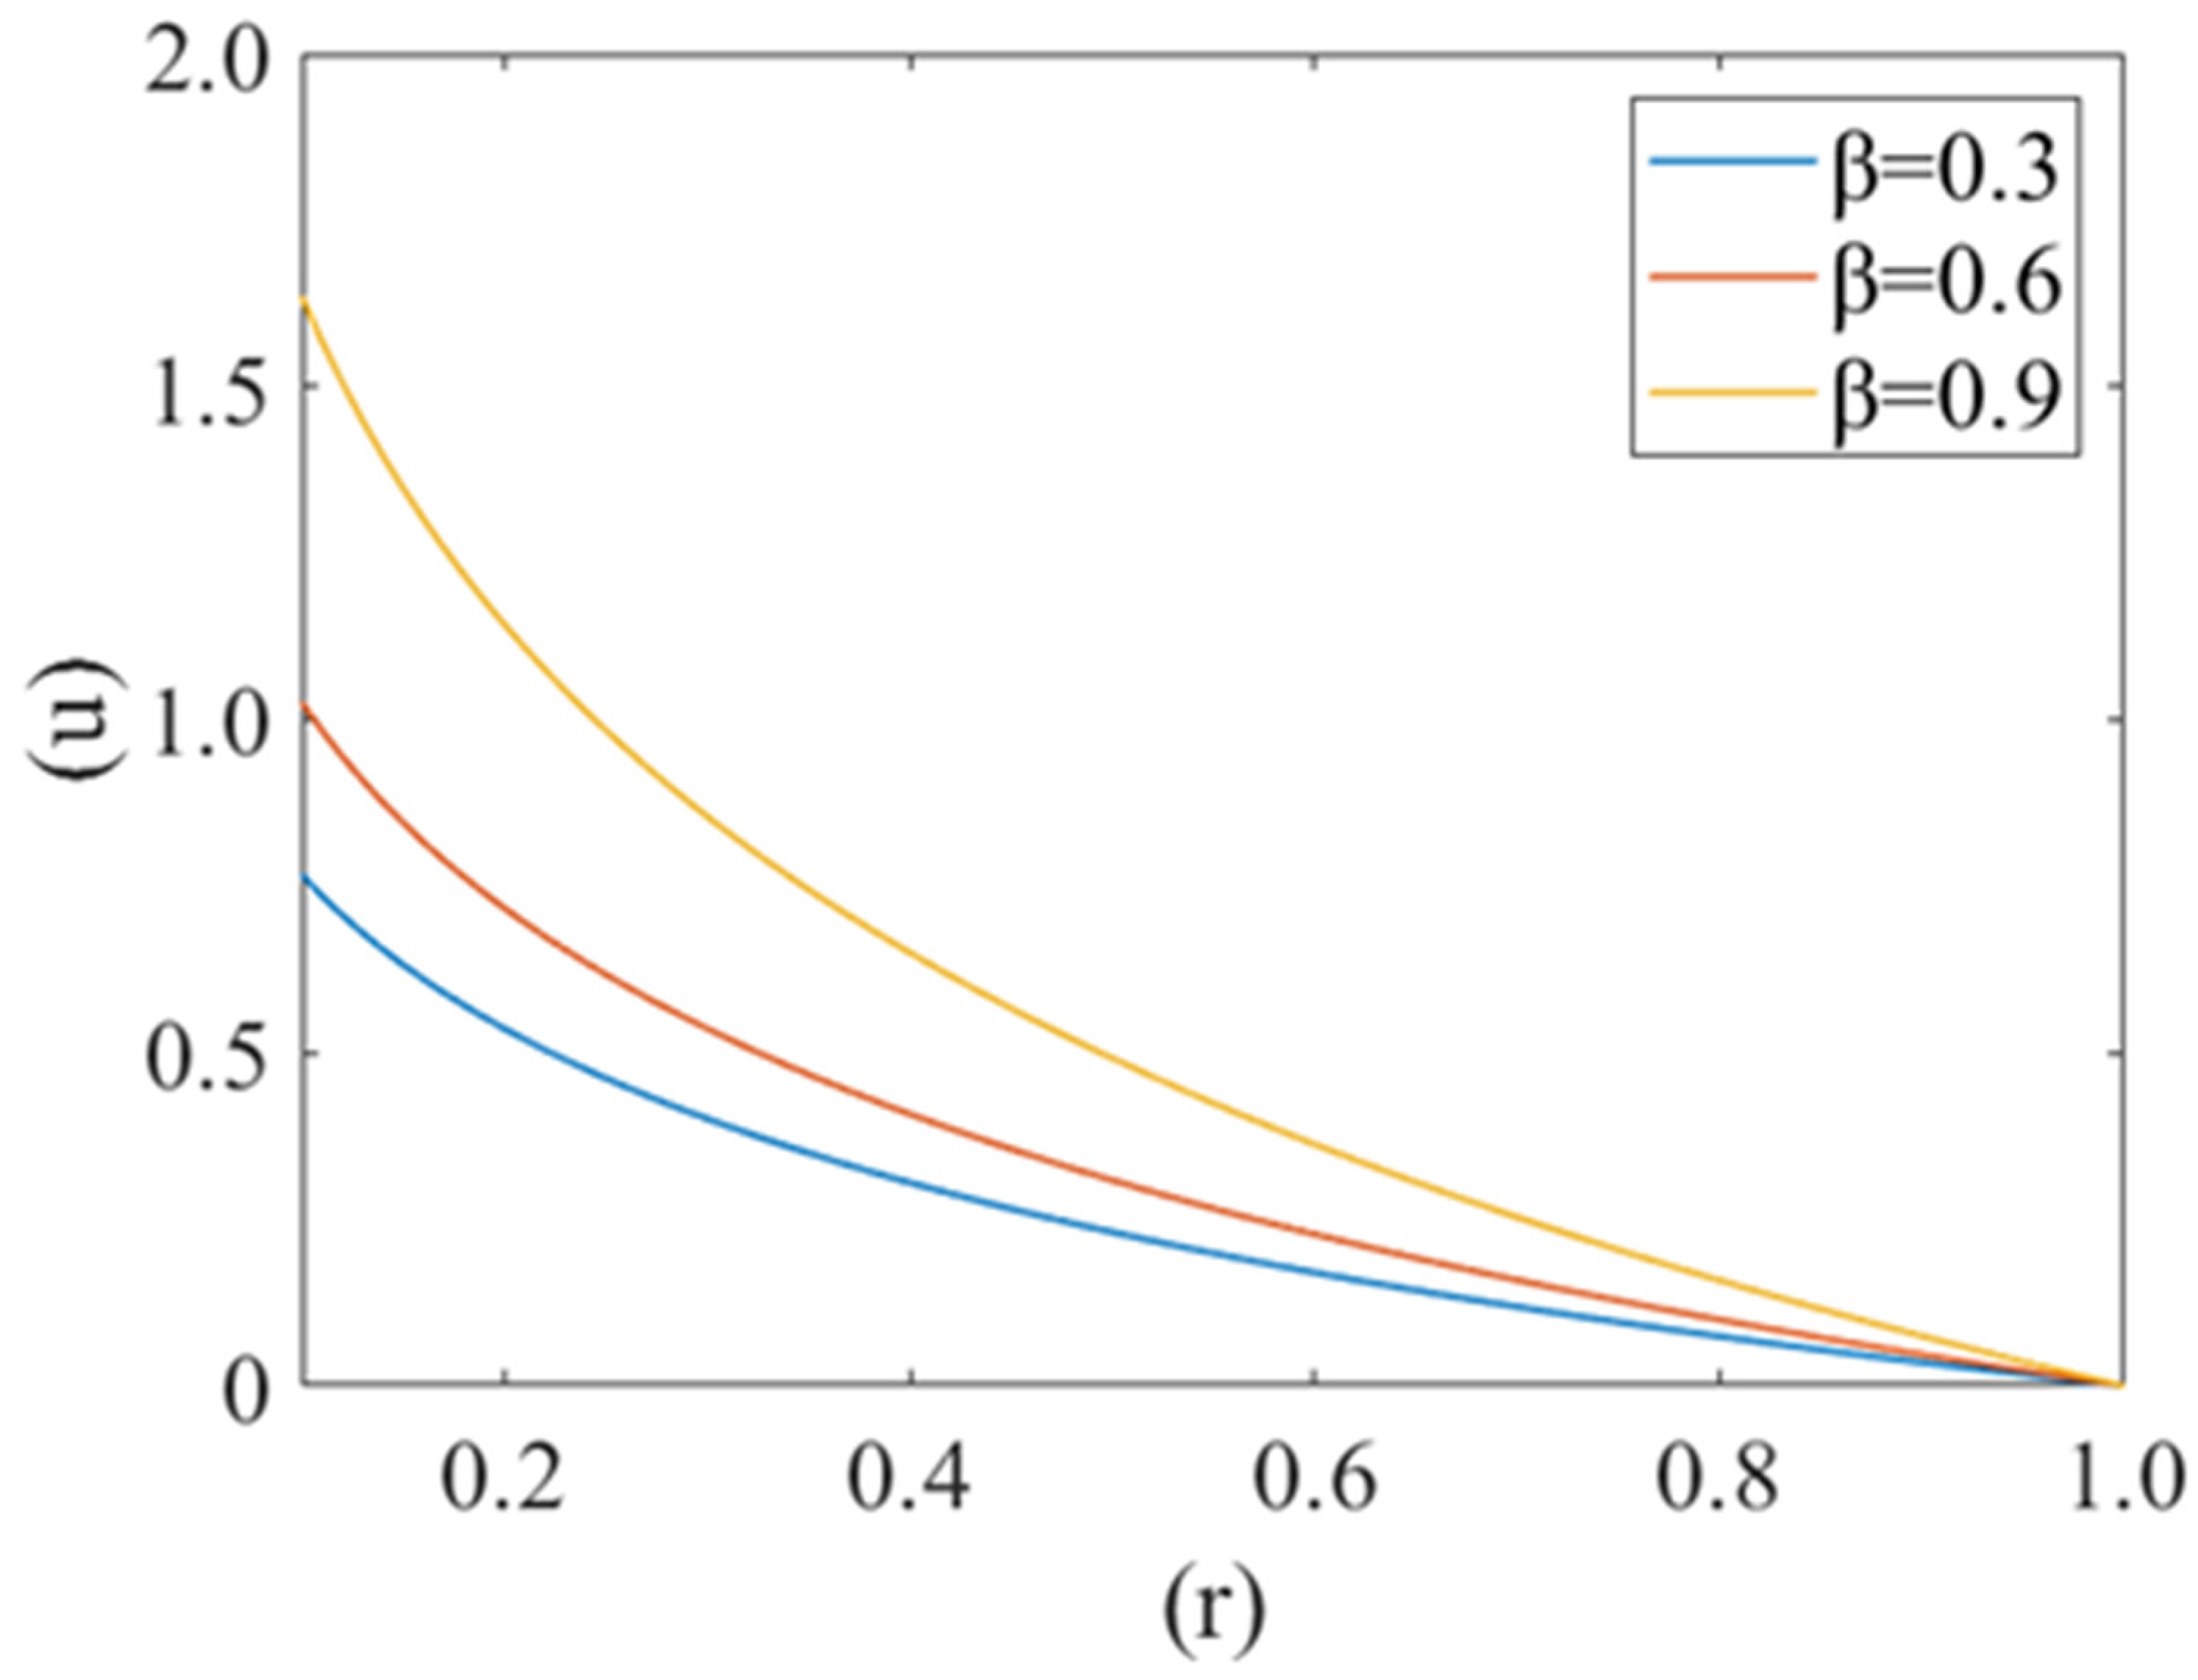
Figure 2 shows the variation in plasma fluid velocity with different cell compliance values (i.e., β = 0.3, 0.6, 0.9). Fluid velocity is at the minimum for β = 0.3 and maximum for β = 0.9. It is also observed that maximum velocity can be observed at the center of the capillary (i.e., r = 0) and minimum at the wall of the capillary (i.e., r = 1). Hence it can be said that fluid velocity increases with an increase in cell compliance i.e., β and decreases with a decrease in cell compliance.
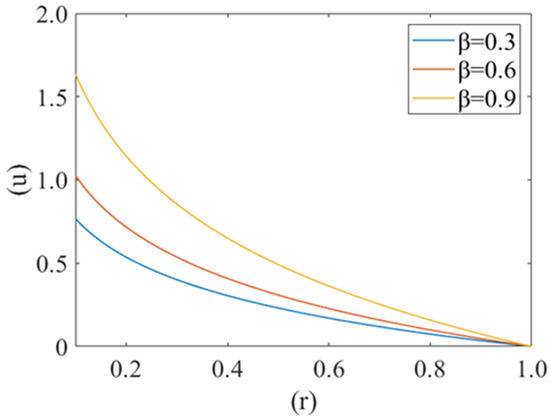
Figure 2.
Variation of axial velocity component (u) of plasma film with deformed cell radius (r) in microcirculation for different value of cell compliance () with Re = 0.25, P1 = 2, P2 = 2.5.
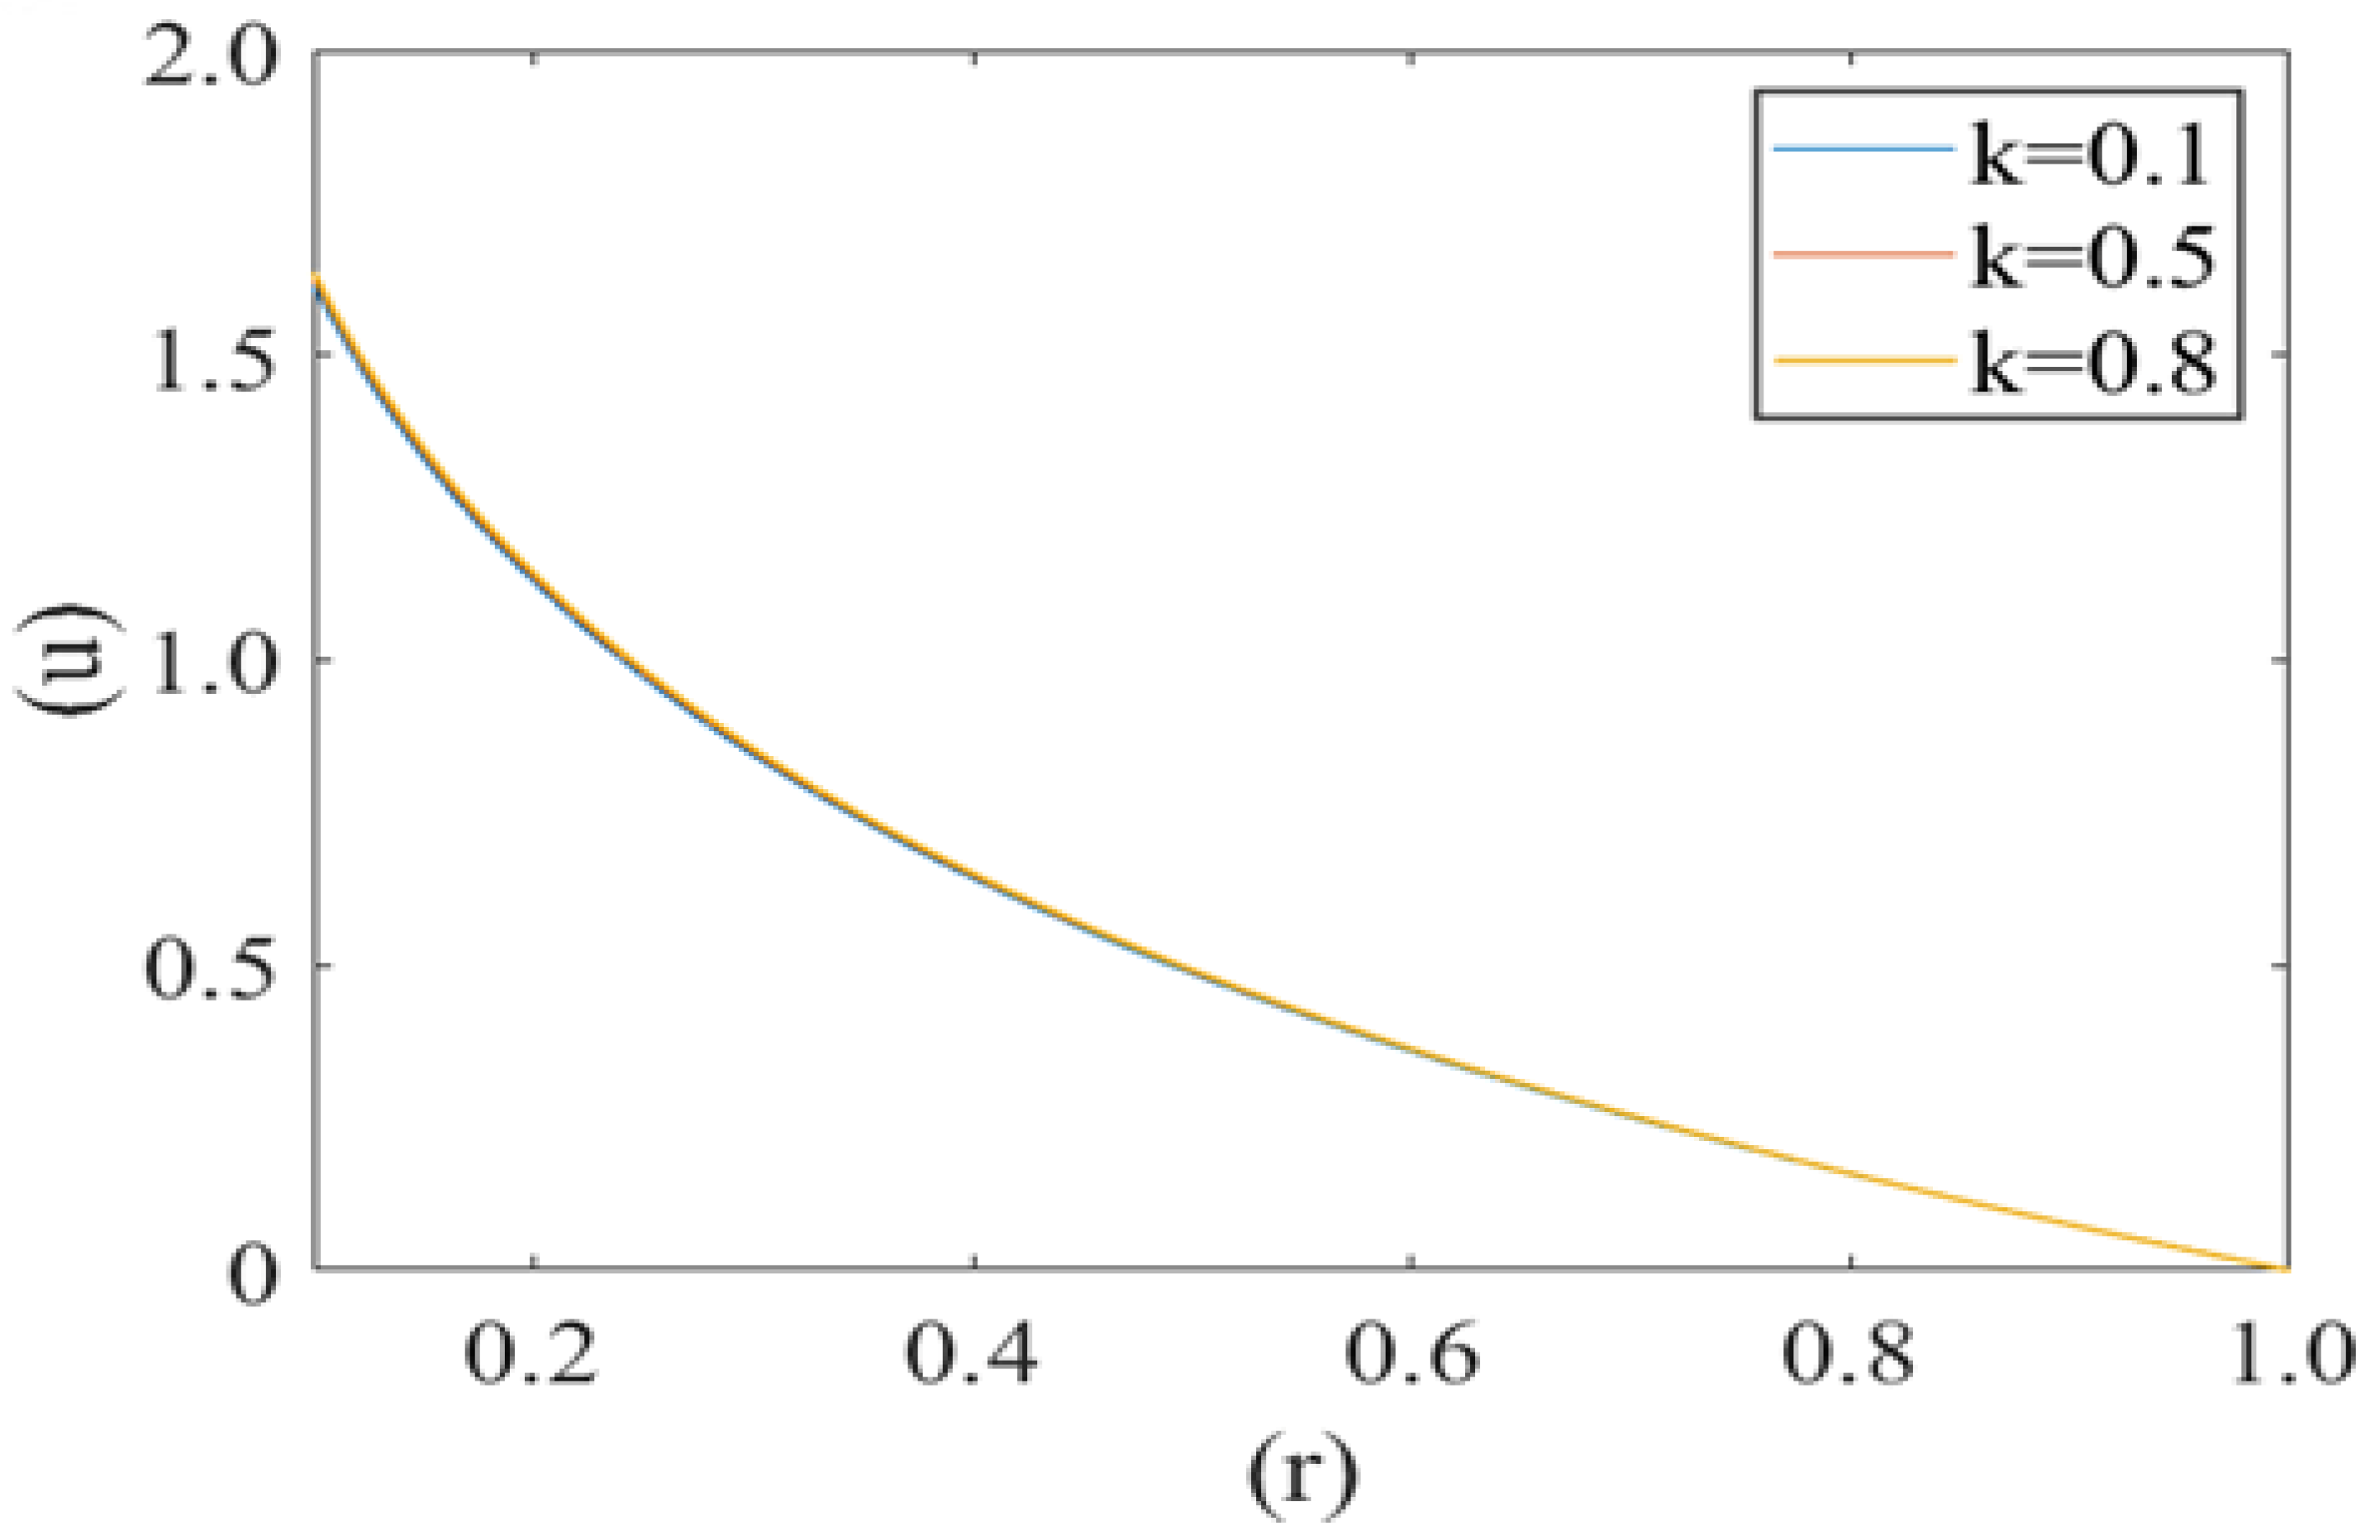
Figure 3 shows the variation in axial fluid velocity of plasma (u) for different values of radius of curvature of the deformed shape of cell (i.e., k = 0.1, 0.5, 0.8). It is noticed that fluid velocity is at its maximum at the center of the capillary (i.e., r = 0) and minimum near the capillary wall (i.e., r = 1). No significant variation has been observed for different values of radius curvature of the deformed shape of cell.
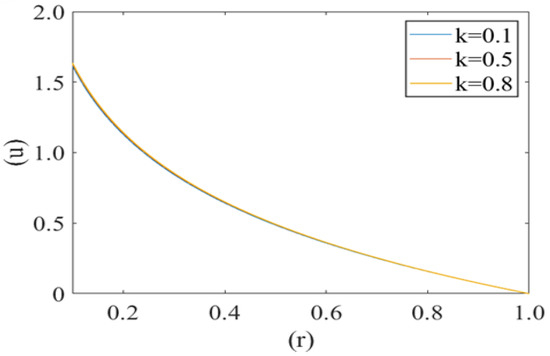
Figure 3.
Variation of axial velocity component (u) of the plasma film with a deformed cell radius (r) for different values of radius of curvature (k) of deformed shape of cell paraboloid Re = 0.25, P1 = 2, P2 = 2.5.
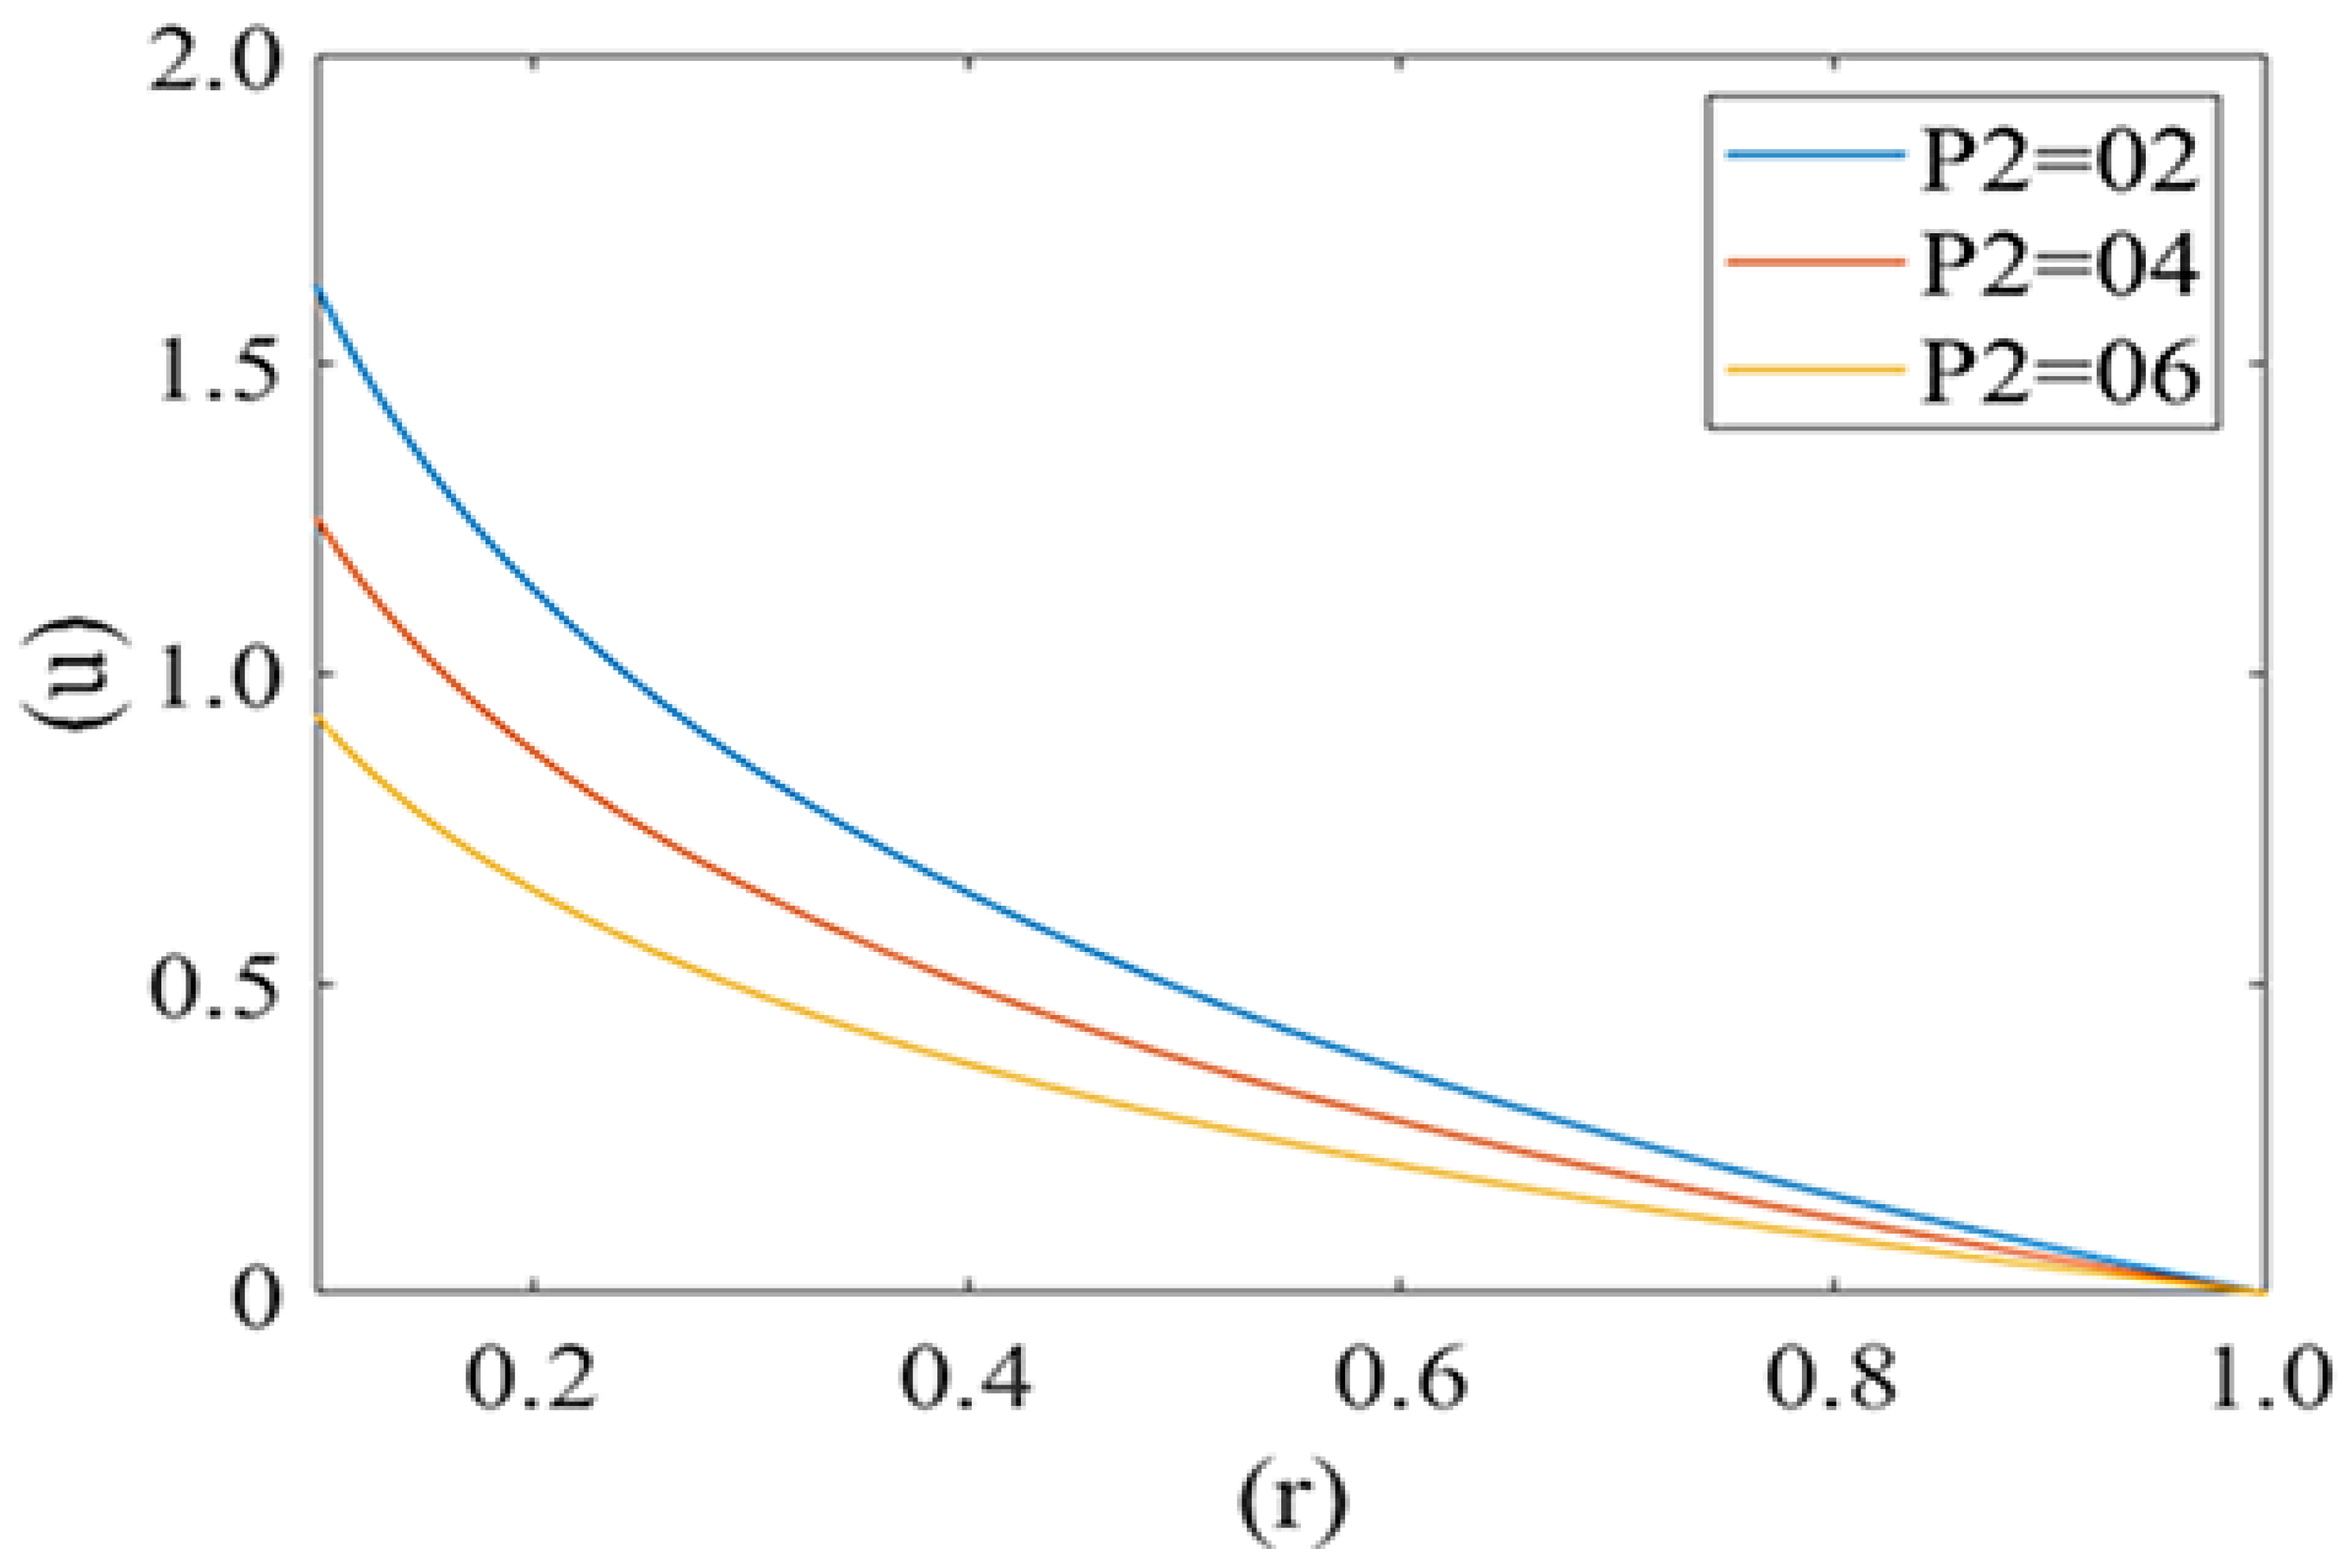
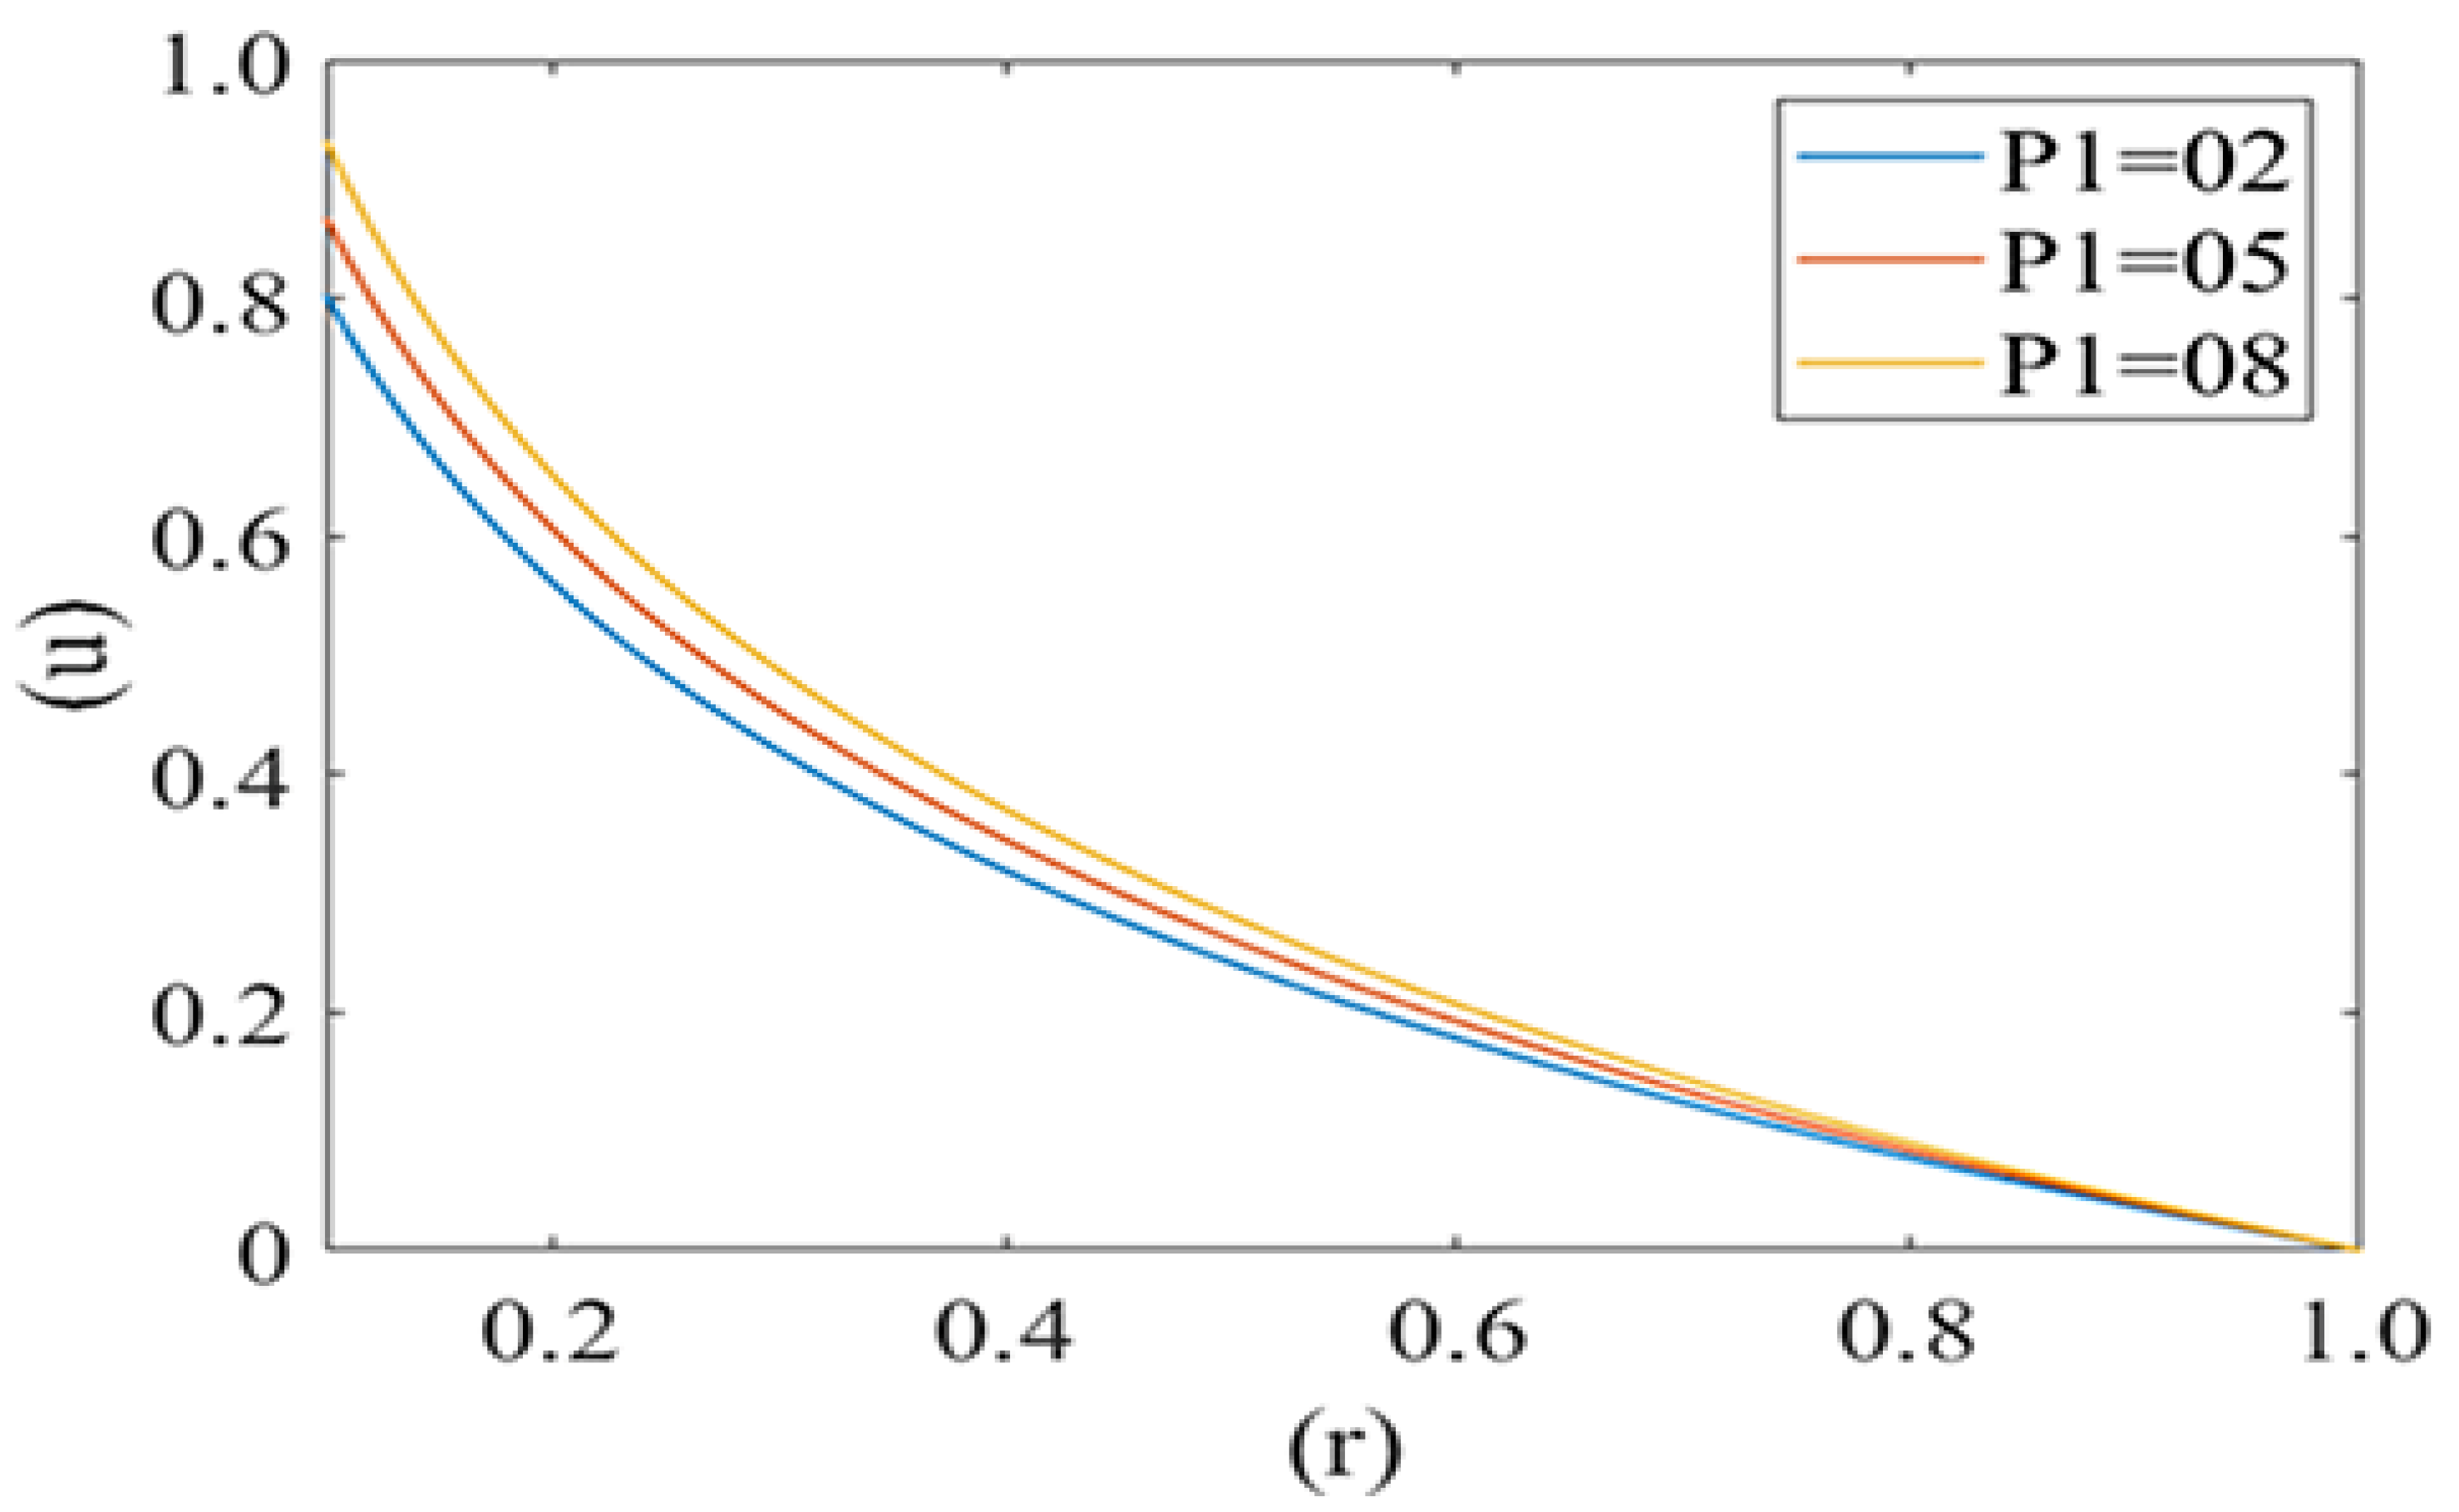
Figure 4 and Figure 5 are computed for the axial velocity component of plasma in the capillary for different values of local and mean pressures respectively (i.e., P1 = 2, 5, 8 and P2 = 2, 4, 6). Axial velocity decreases from the axis to the capillary wall along the cell surface i.e., it is at its maximum at the center and minimum at the edge of the pellet. Figure 4 represents the variation in the axial velocity of the plasma film for different values of P2 (Local pressure around the cell). It is observed that axial velocity decreases with an increase in the value of P2. Figure 5 delineates the change in the axial velocity component for different values of mean pressure gradient (i.e., P1 = 2, 5, 8), which shows that the fluid velocity decreases with a decrease in the mean pressure gradient.
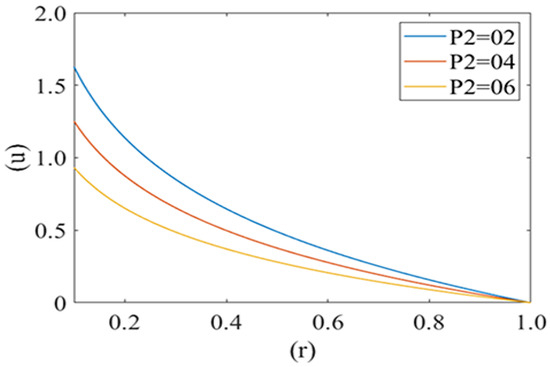
Figure 4.
Variation of axial velocity component (u) of plasma film with deformed cell radius (r) in microcirculation with variation of local pressure (P2) on the cell with Re = 0.25, P1 = 2.
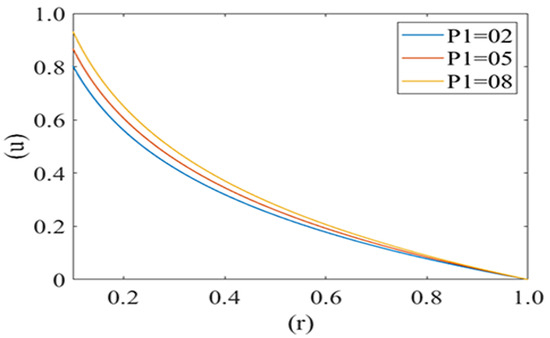
Figure 5.
Variation of axial velocity component (u) of the plasma film with a deformed cell radius (r) in microcirculation with a change in mean pressure (P1) in plasma with Re = 0.25, P2 = 2.
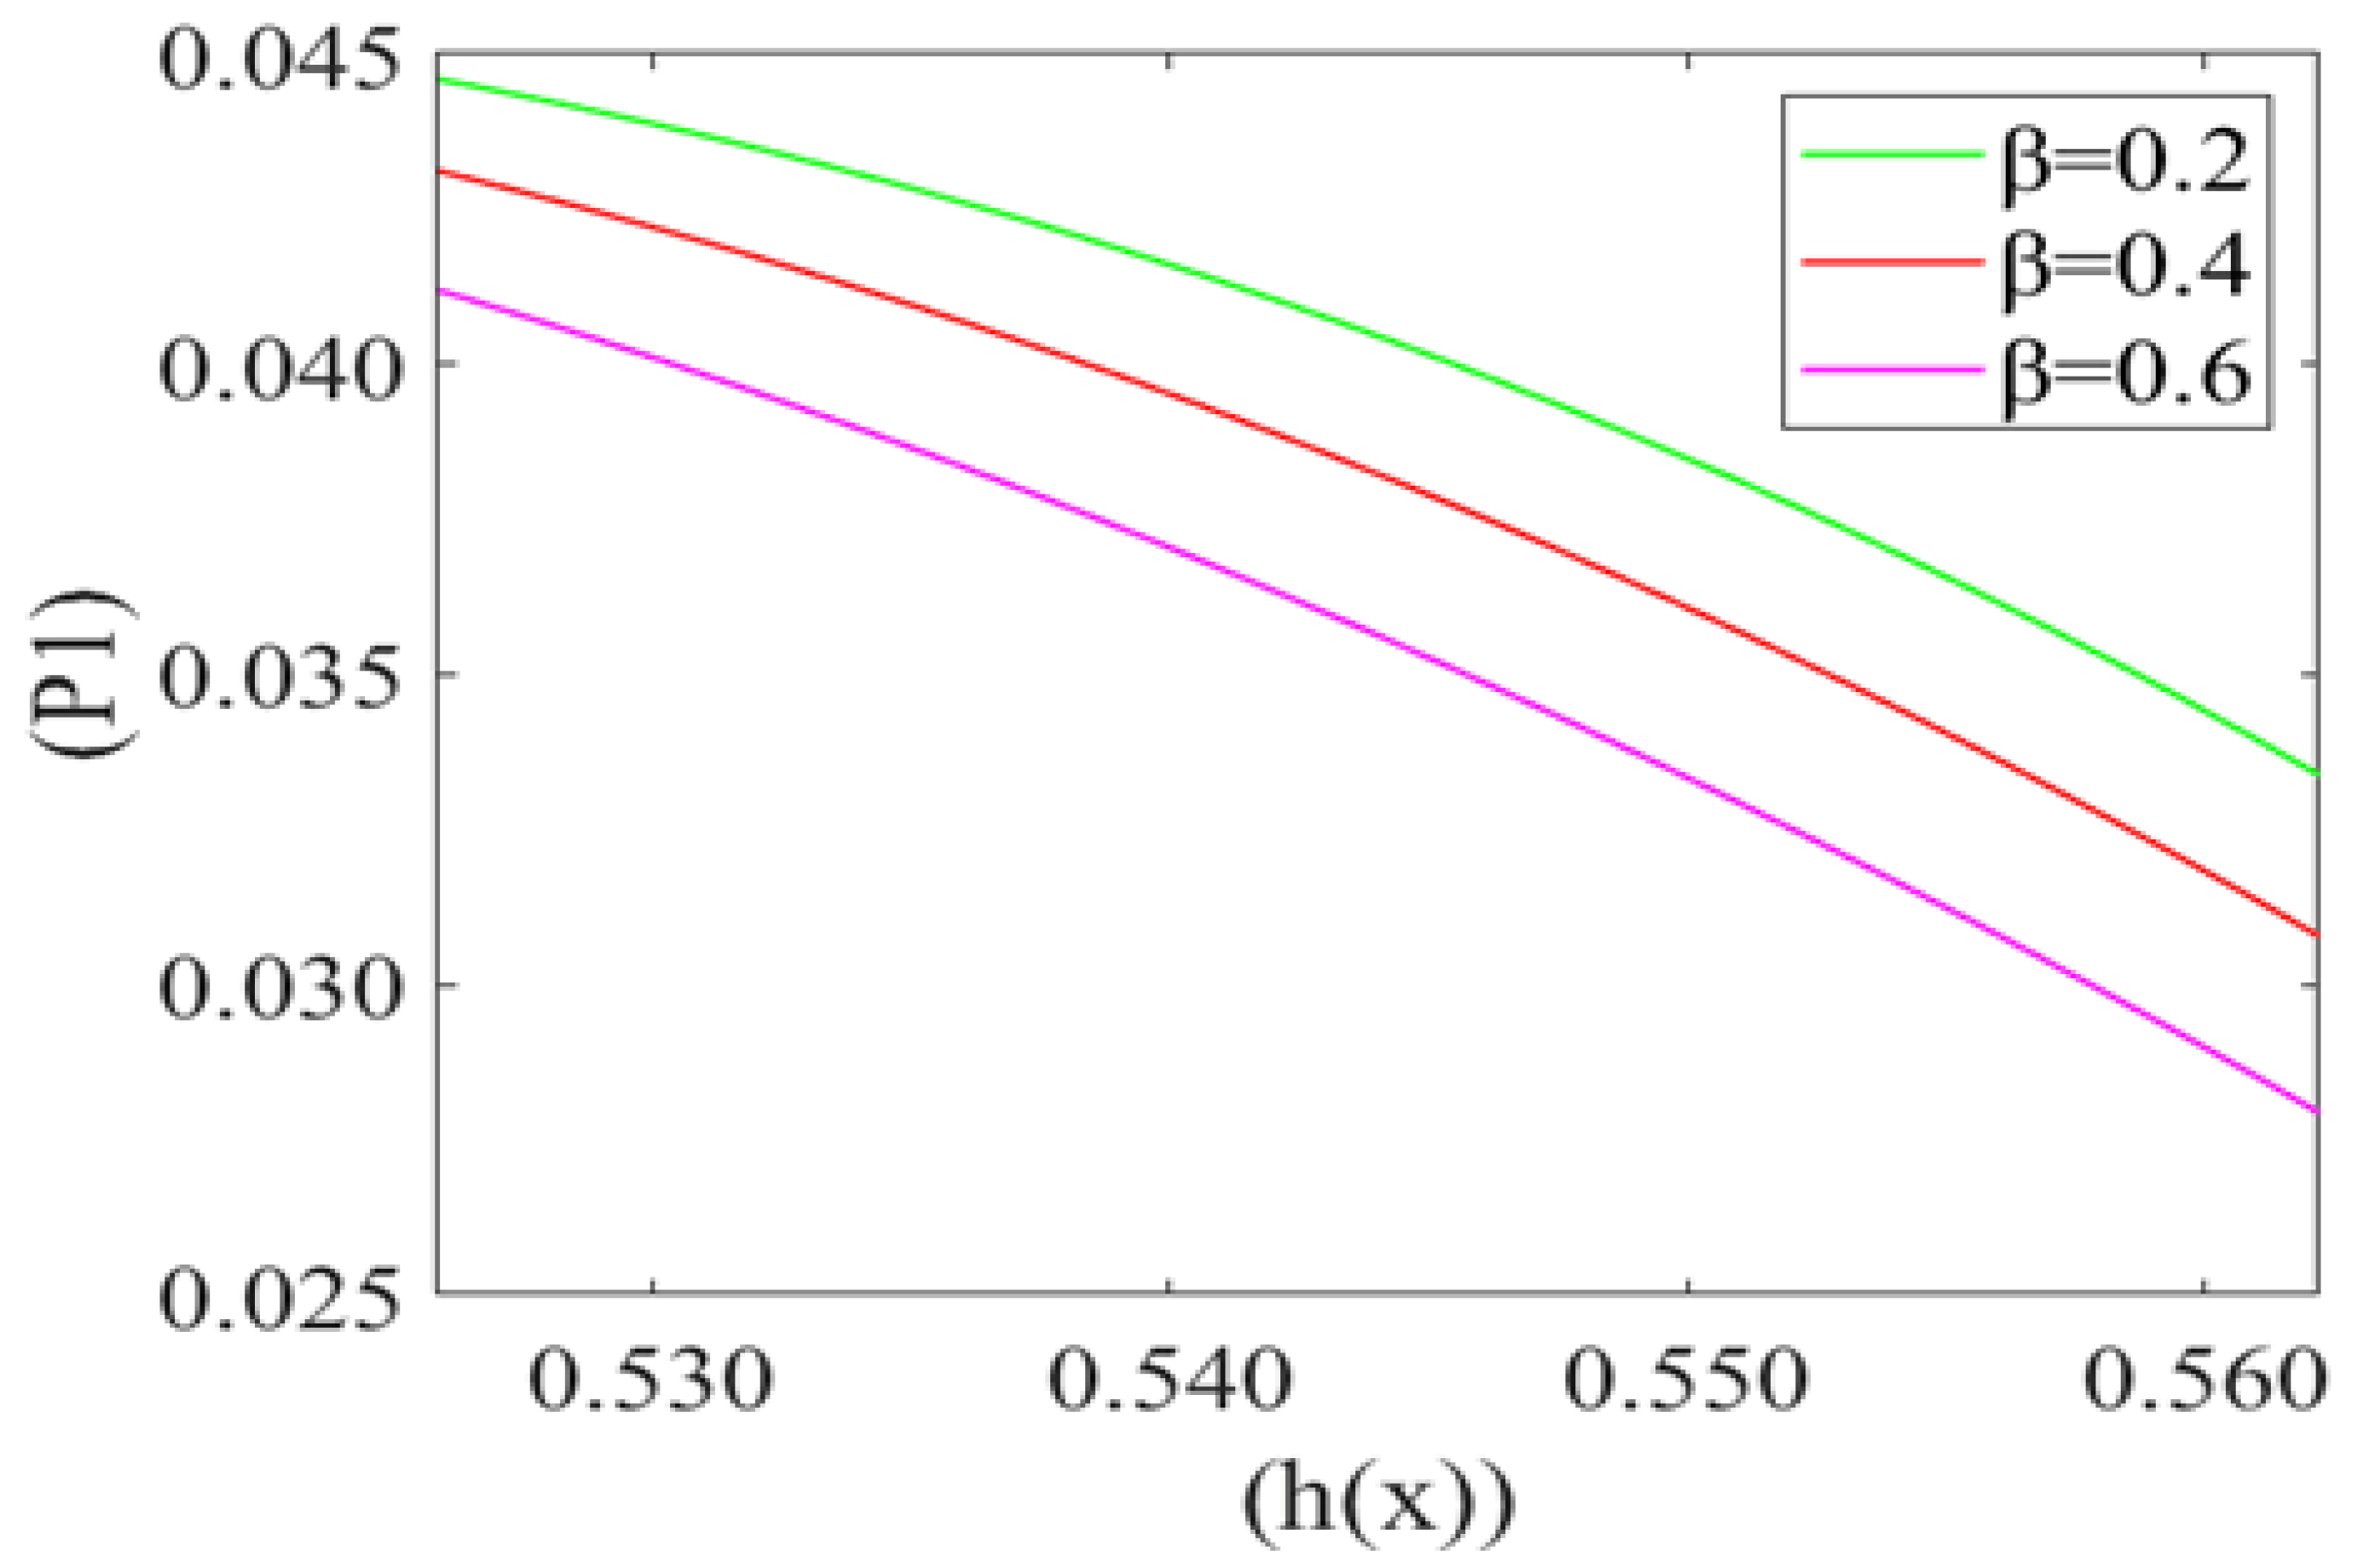
Figure 6 represents the variation in the mean pressure gradient (P1) on the red blood cell with respect to the height of the lubricating film (h(x)) of plasma for different values of beta cell compliance (i.e., β = 0.2, 0.4, 0.6). It is observed that P1 is decreasing (Very minutely) with an increase in the height of the lubricating film of plasma (h(x)). It also shows that the mean pressure gradient increases with a decrease in the value of cell compliance β. Mean pressure gradient is at its maximum for β = 0.2 and minimum for β = 0.6.
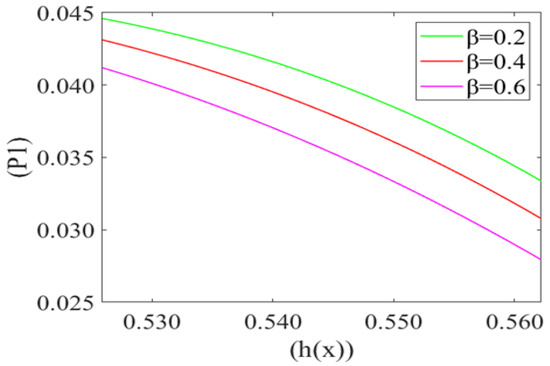
Figure 6.
Variation of mean pressure gradient (P1) with the height of the lubricating film h(x) of plasma between the cell and capillary wall for different compliance () with Re = 0.025, P2 = 5, k = 0.1.
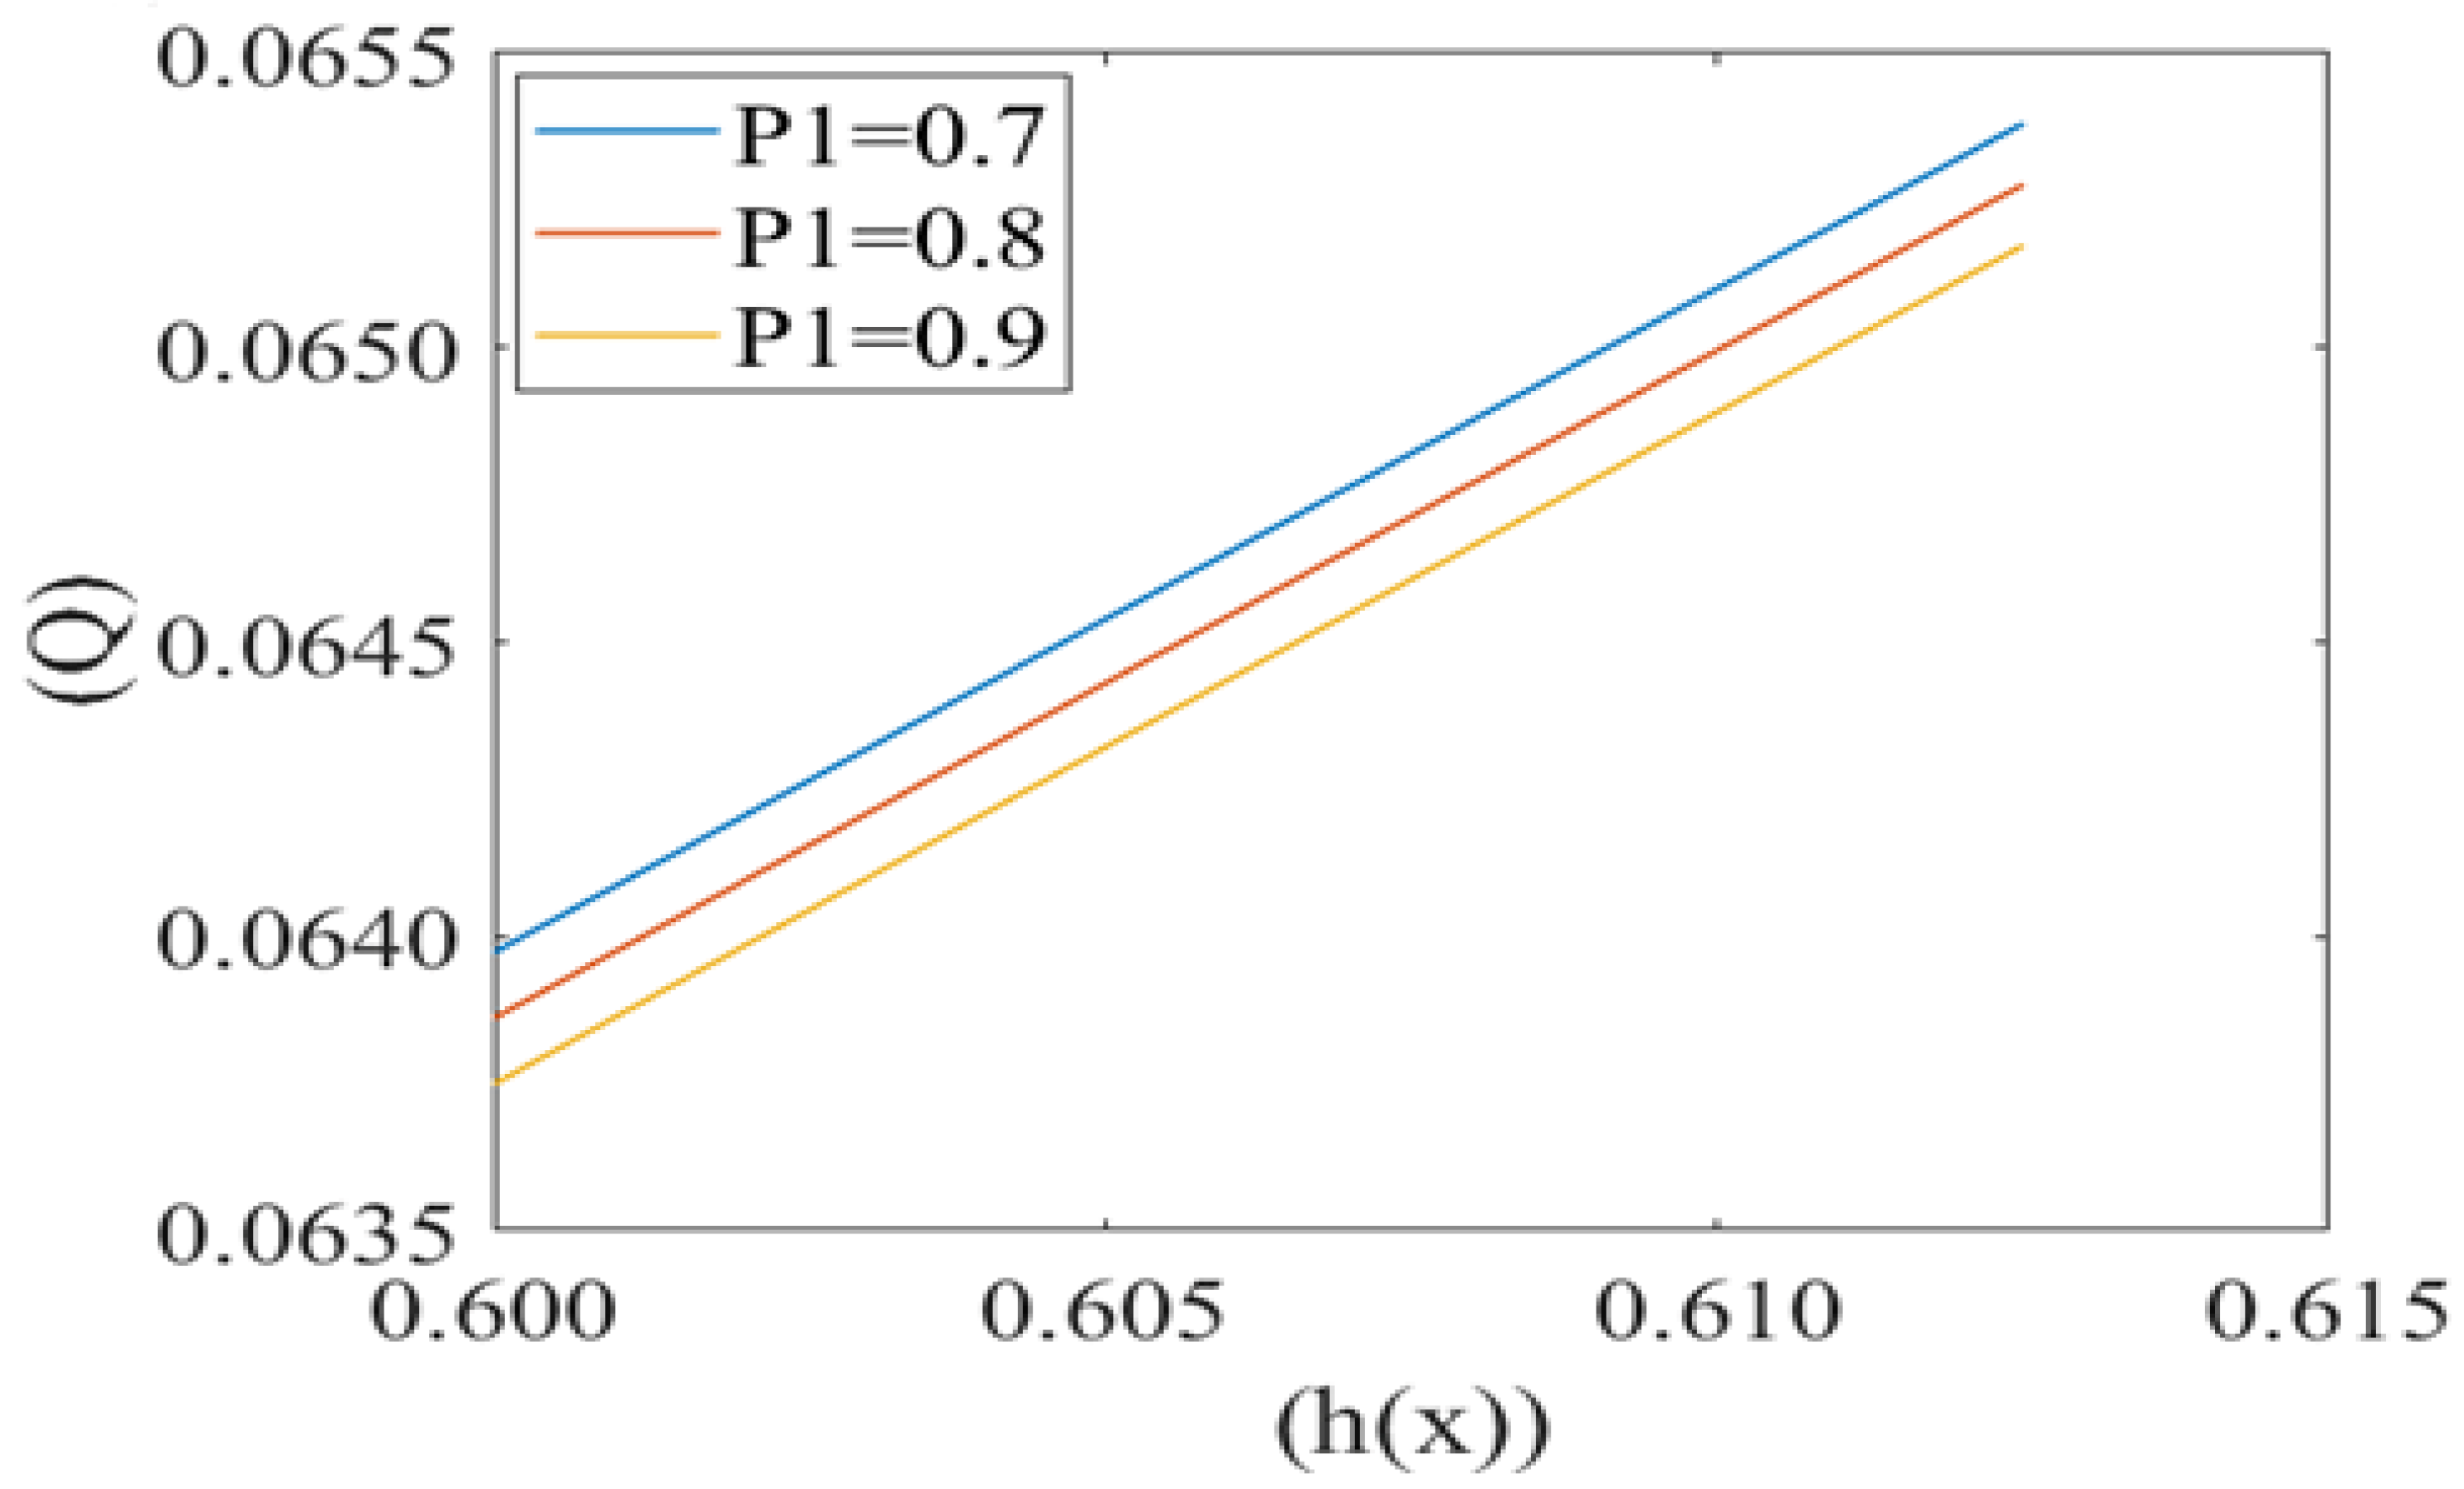
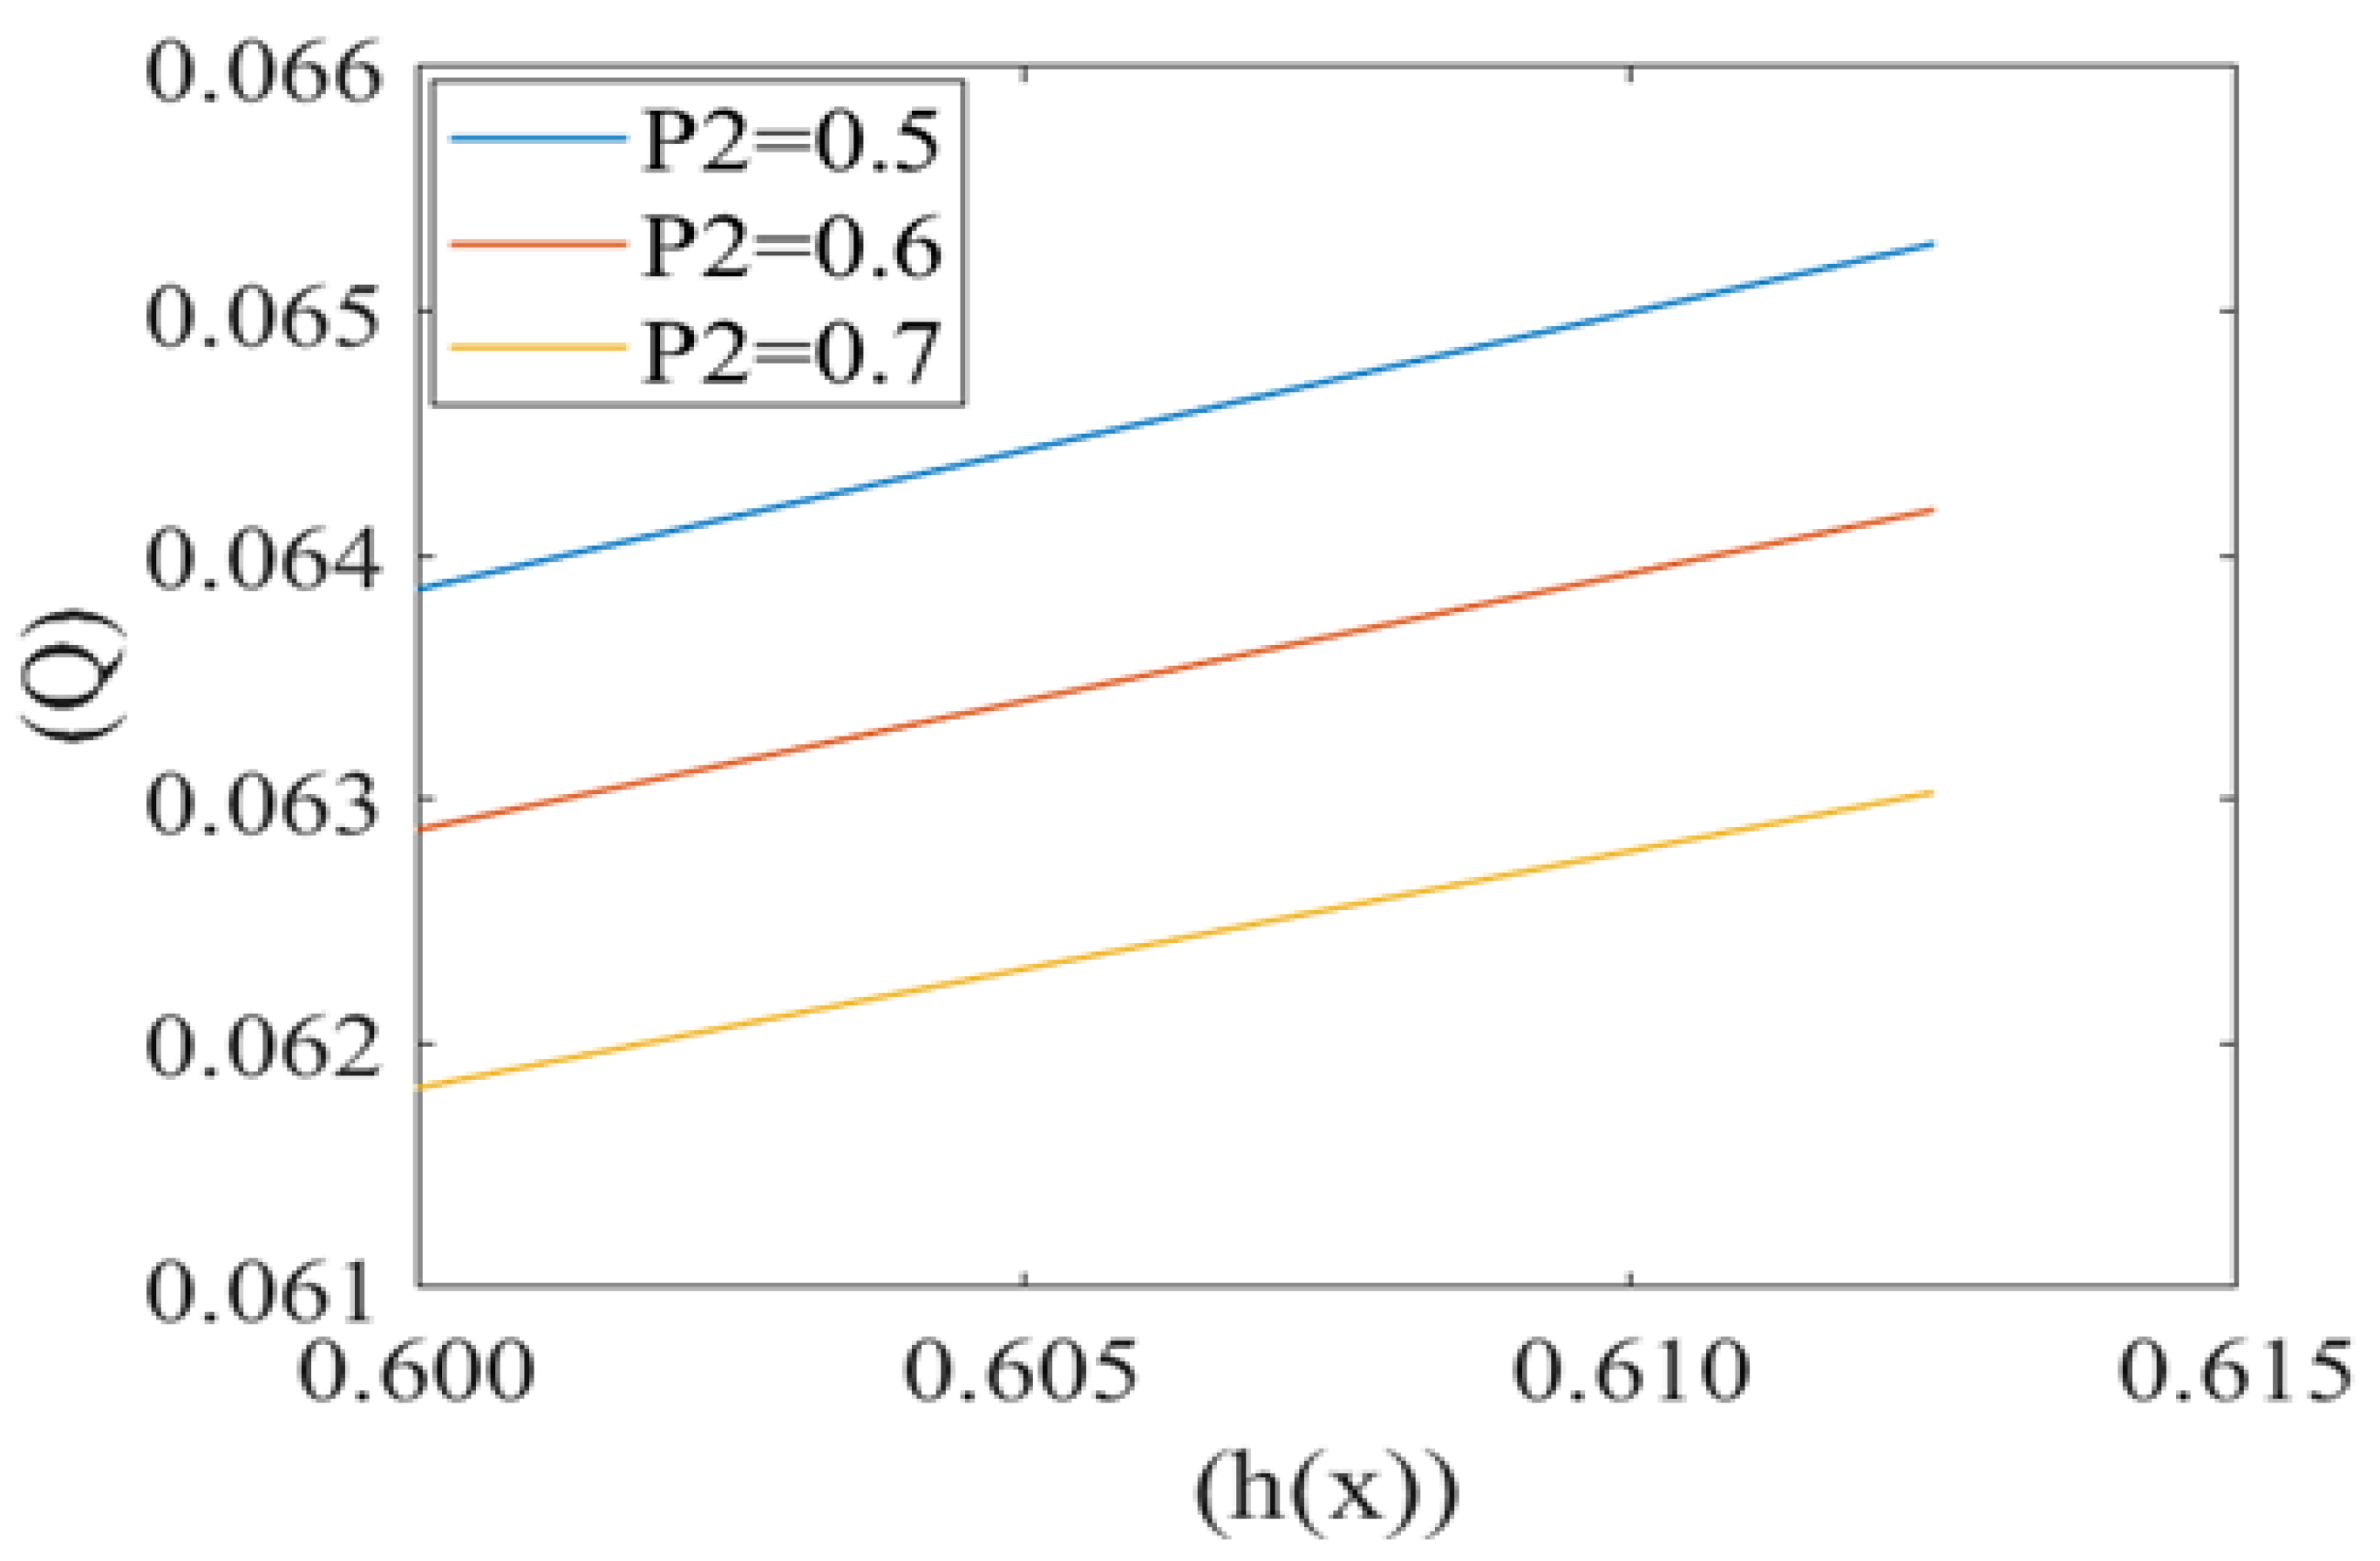
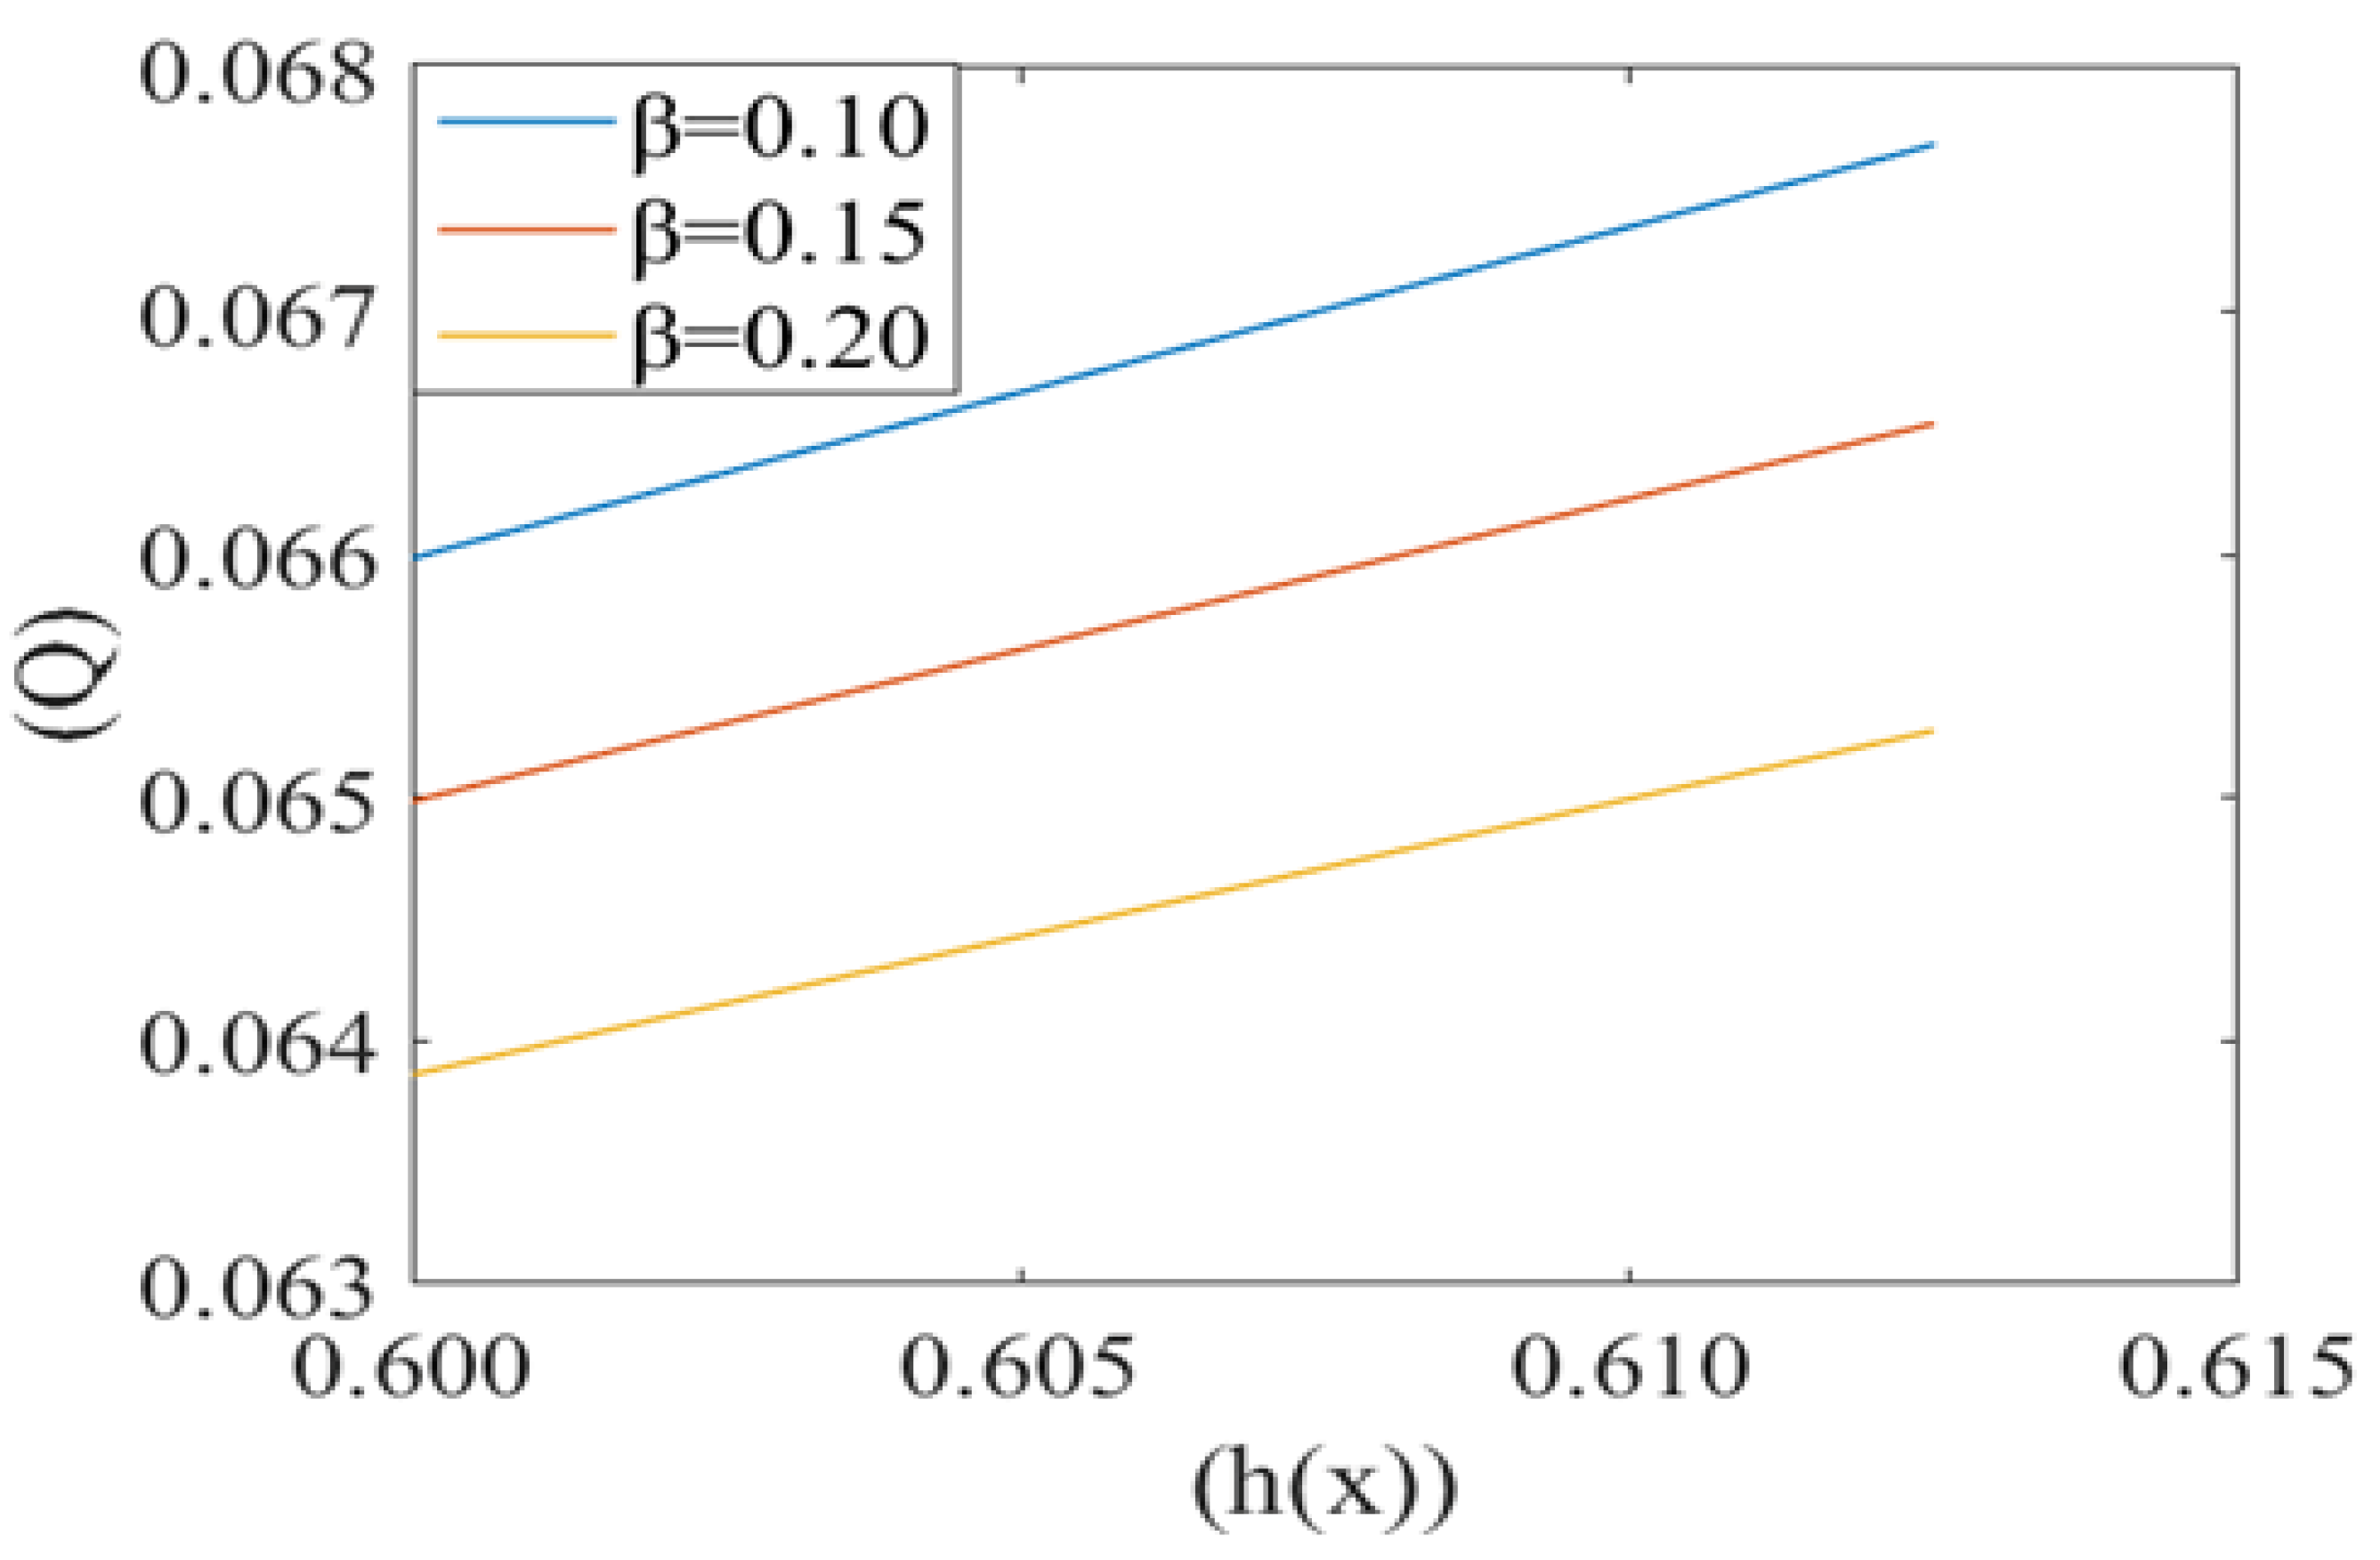
Leak back in microcirculation promotes the flow in the capillary. The above Figure 7, Figure 8 and Figure 9 shows the relationship between leak back (Q) and the height of lubricating film h(x) for different values of mean pressure gradient (i.e., P1 = 0.7, 0.8, 0.9), local pressure (P2 = 0.5, 0.6, 0.7) and cell compliance (β = 0.10, 0.15, 0.20), respectively. Figure 7 shows that the leak back Q increases linearly with increase in the width of lubricating film h(x). Leak back Q attains Maximum value for P1 = 0.7 and minimum value for P1 = 0.9. It shows that leak back decreases with an increase in mean pressure gradient value.
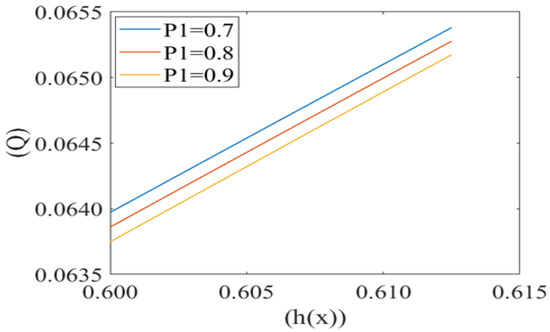
Figure 7.
Variation of flux per unit length in back ward direction (leak back ()) with the height of plasma film h(x) at different values of mean pressure gradient in the capillary (P1).
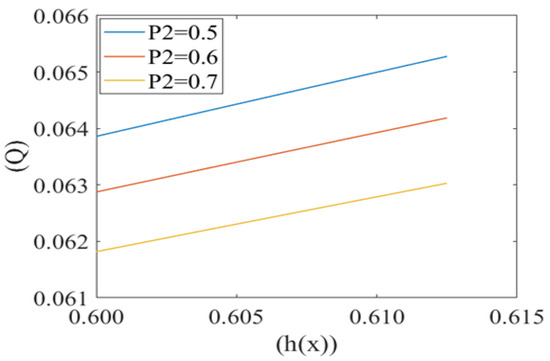
Figure 8.
Variation of flux per unit length in backward direction (leak back ()) with the height of plasma film h(x) at different local pressures (P2) with Re = 0.25, k = 0.1.
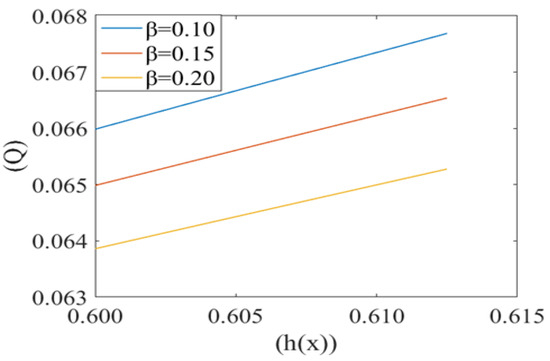
Figure 9.
Variation of flux per unit length in the backward direction (leak back ()) with the height of plasma film h(x) for different values of cell compliance () with Re = 0.25, P1 = 7, P2 = 5, k = 0.1.
Figure 8 shows the same variation for different values of local pressure around the cell in the capillary. It is observed that an increase in local pressure reduces the leak back. Figure 9 captures the variation in leak back Q with respect to the height of the lubricating film h(x) for different values of cell compliance (i.e., β = 0.10, 0.15, 0.20). Interestingly, the leak back is directly proportional to the height of the lubricating film h(x). It is observed that leak back Q increases with an increase in h(x). It is also observed that leak back decrease with an increase in cell compliance β.
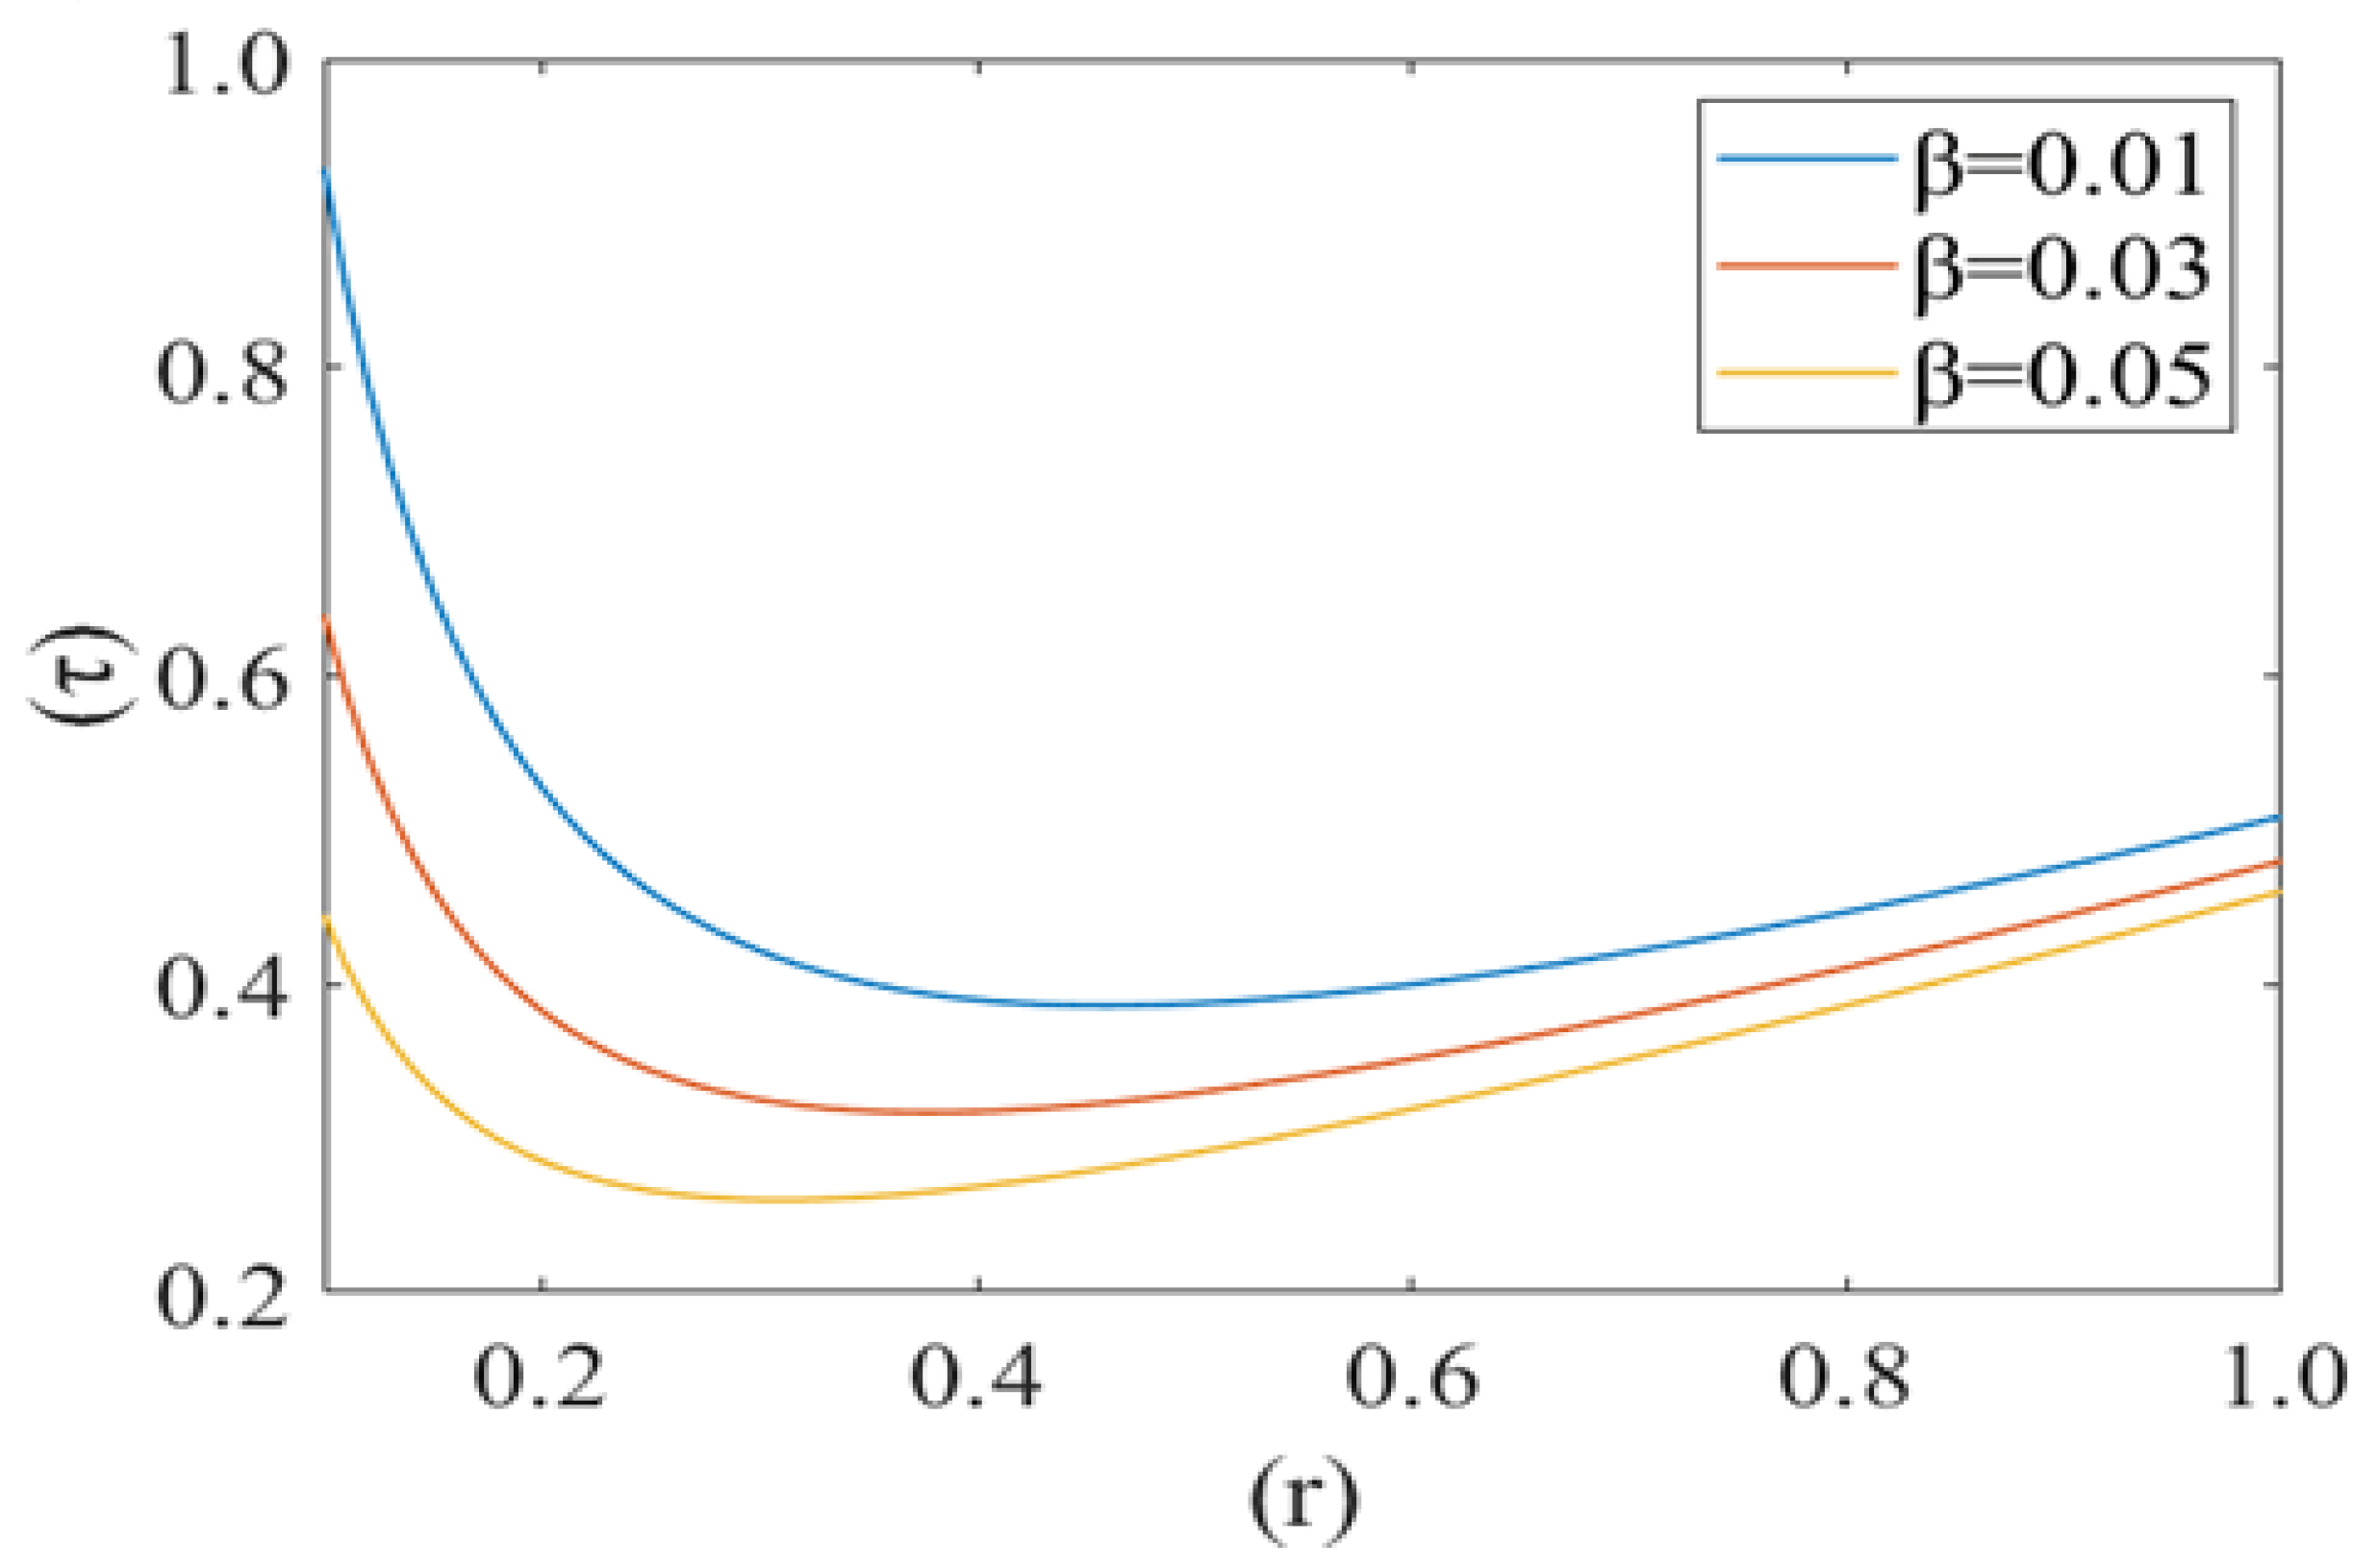
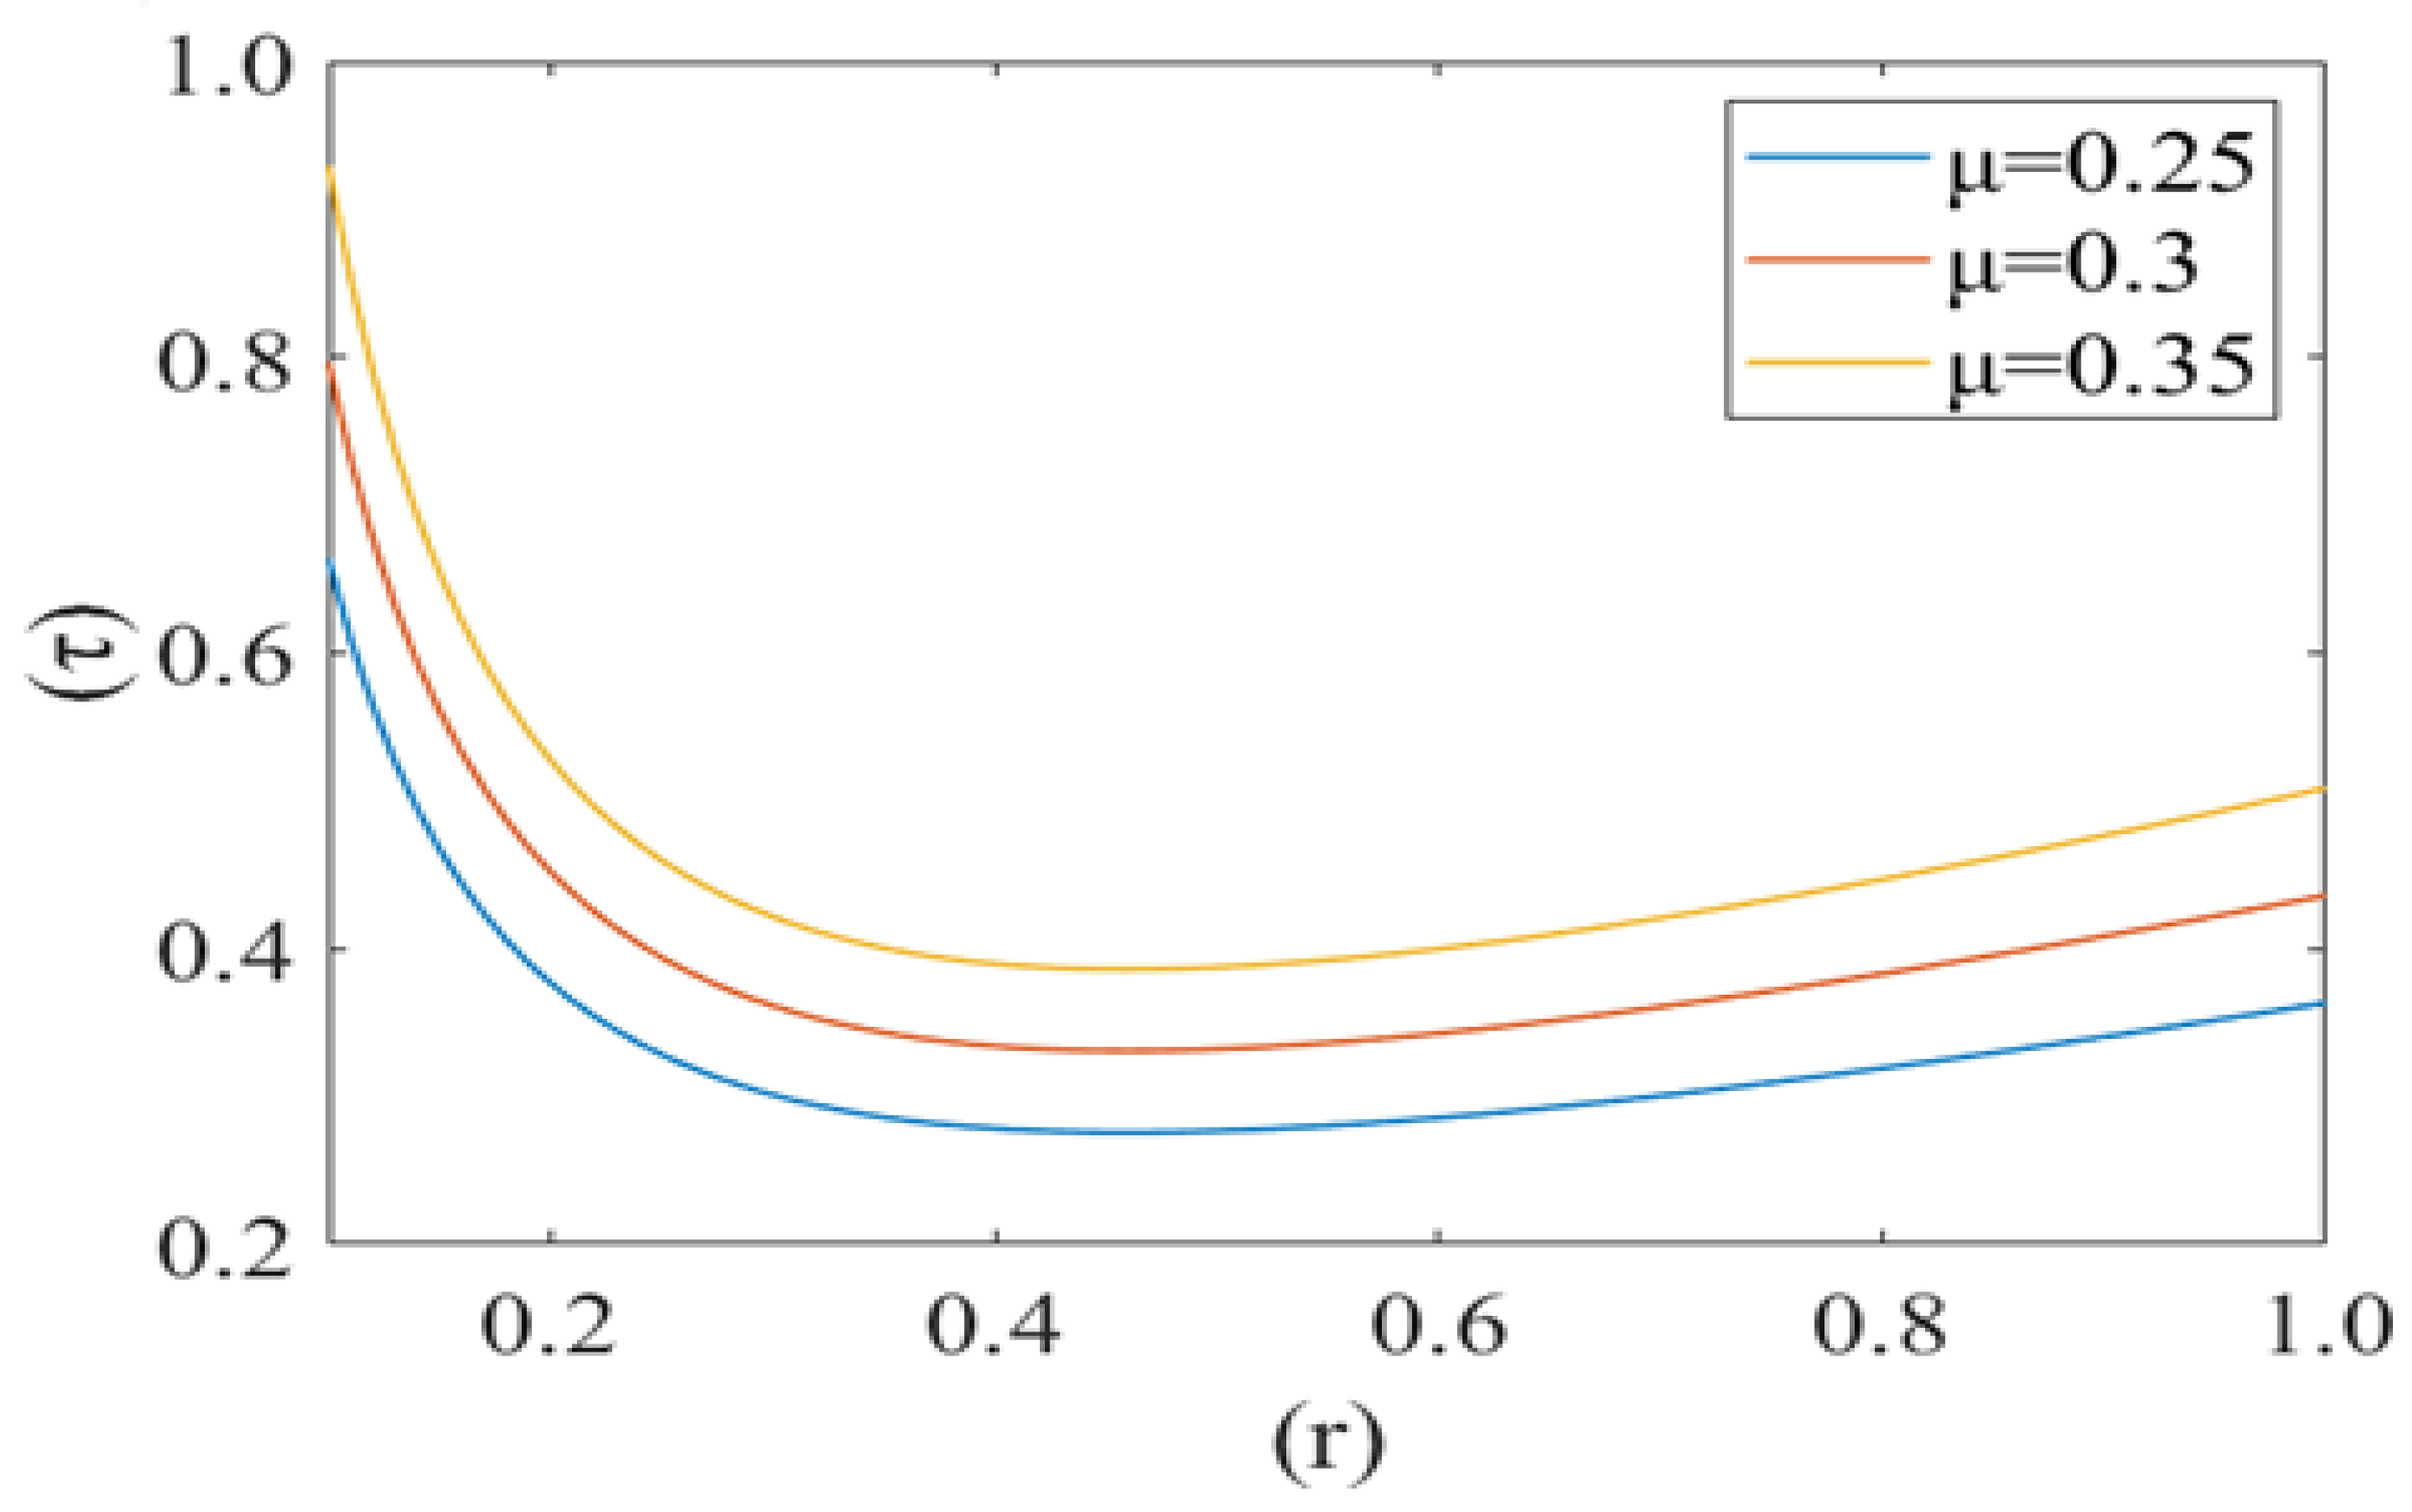
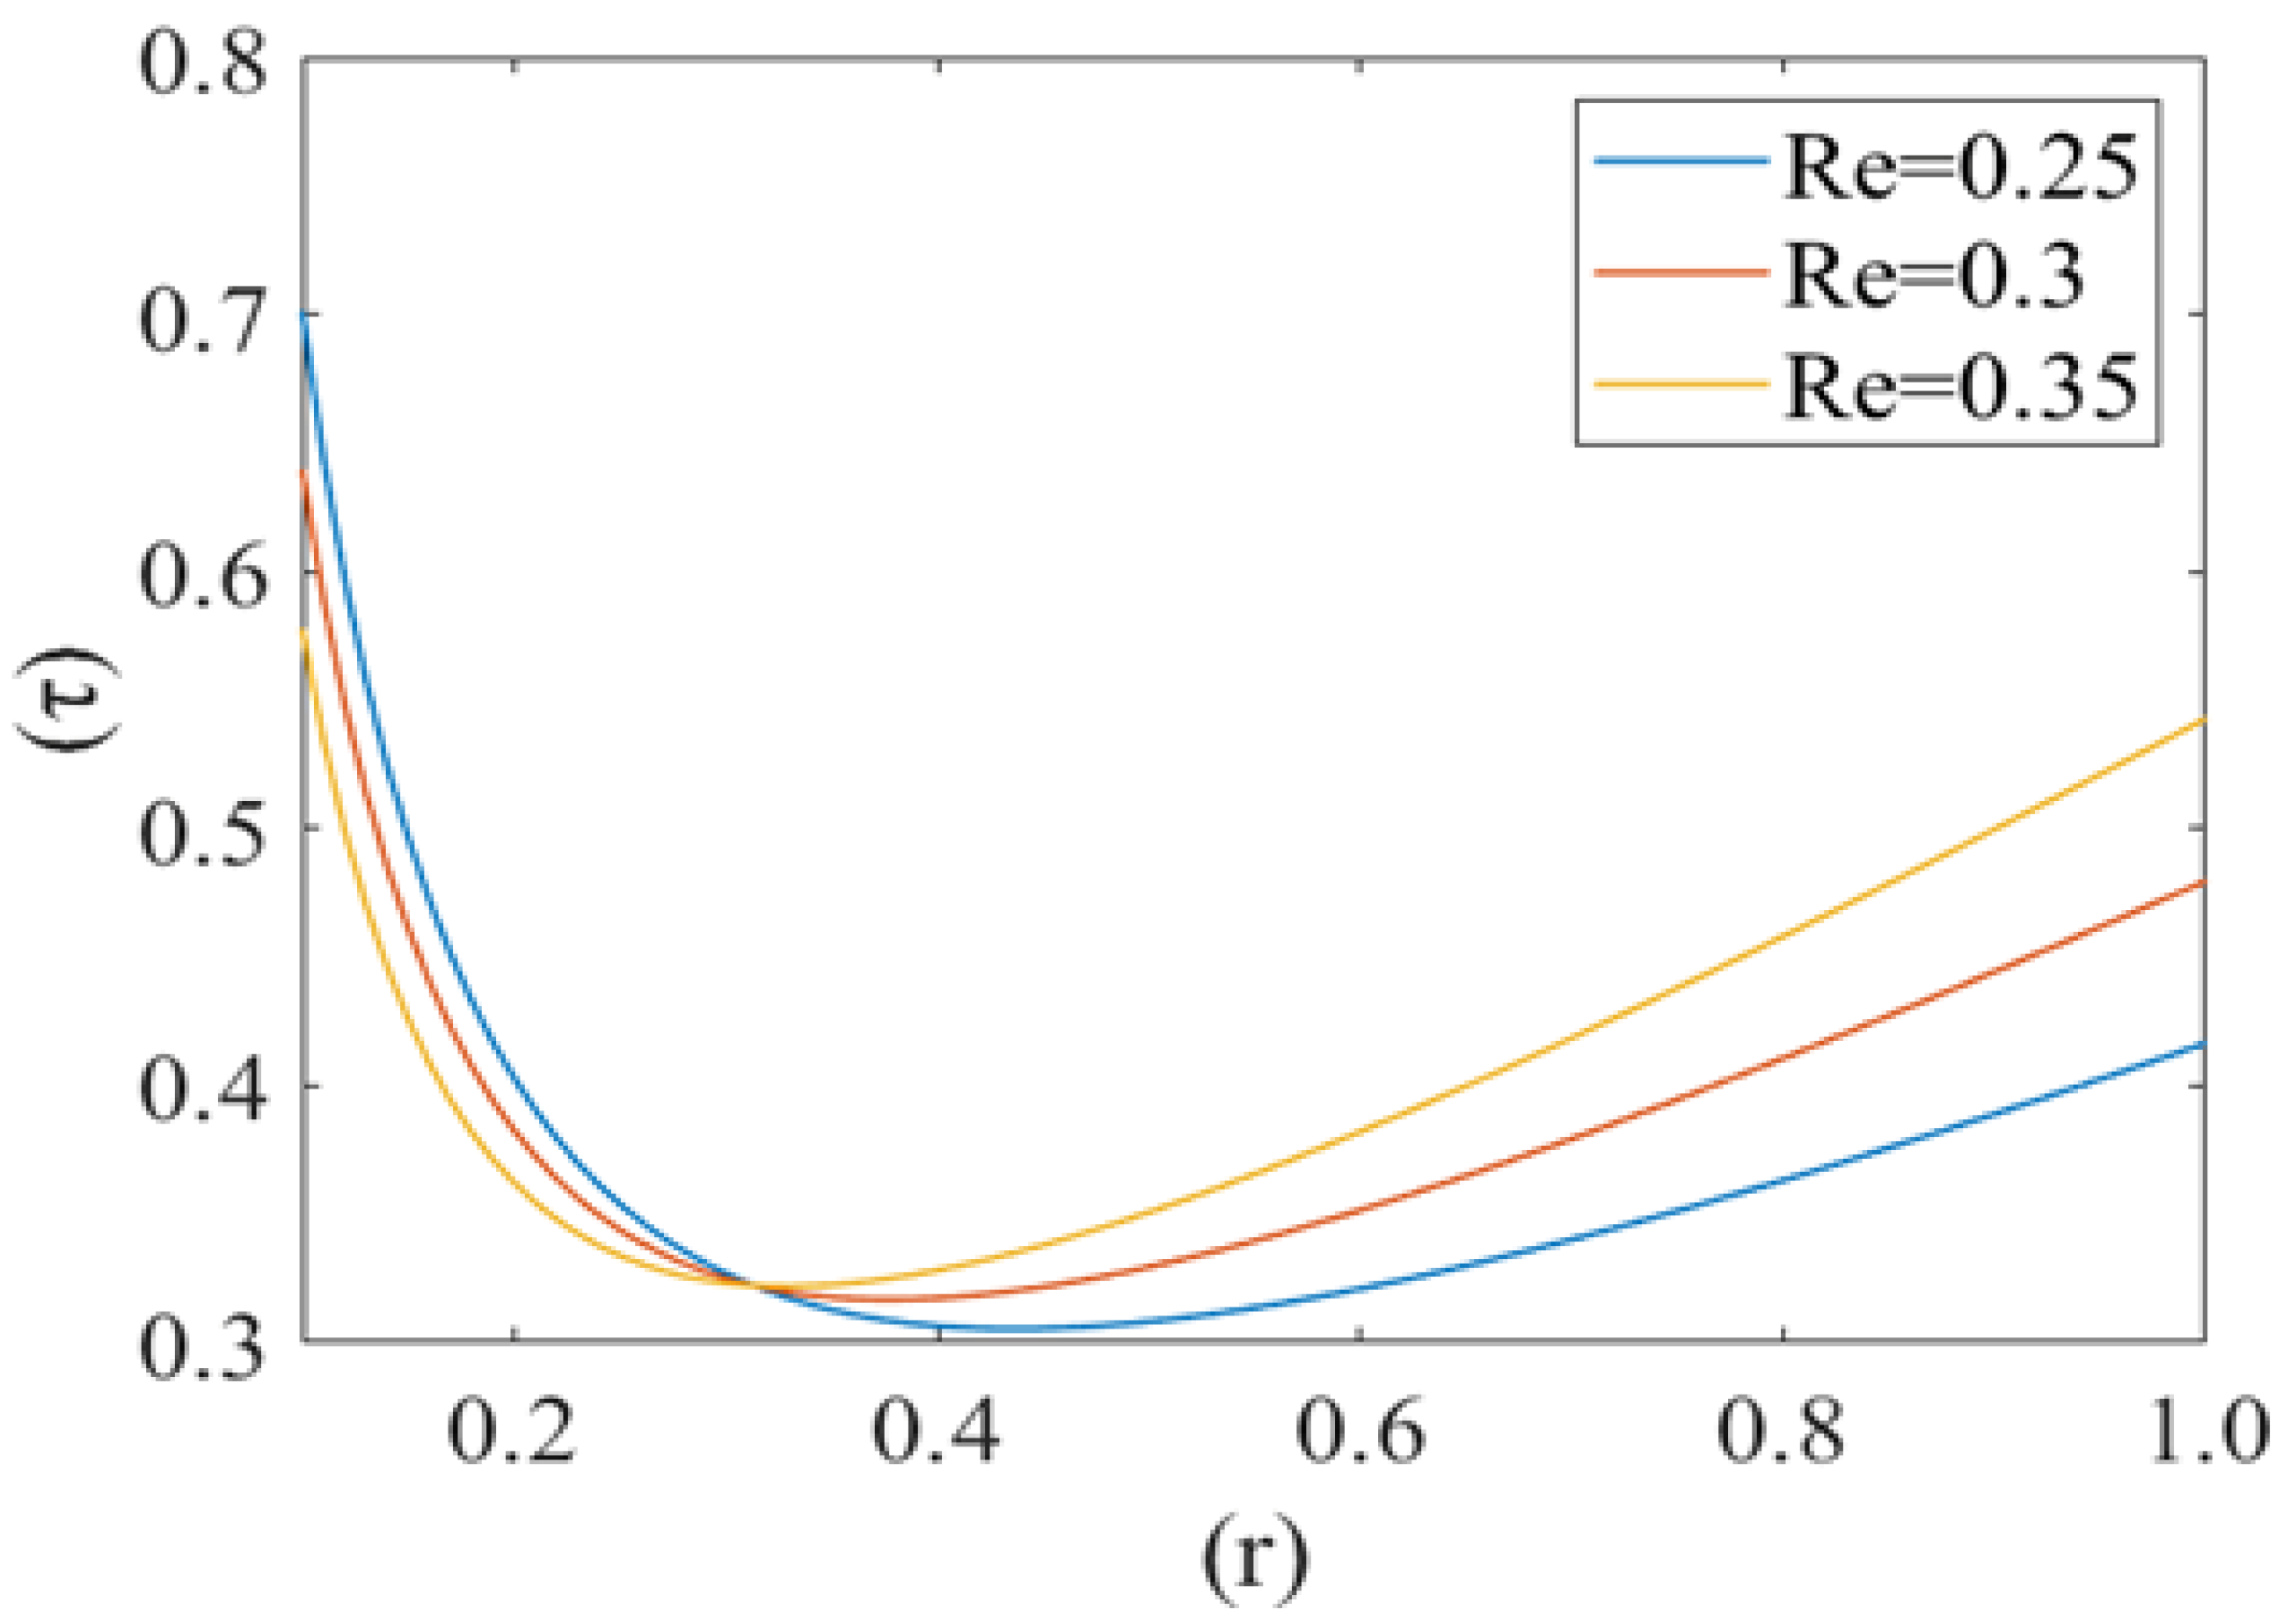
Figure 10, Figure 11 and Figure 12 shows the variation in drag force (resistance in the direction of flow i.e., τ) at the rim of the cell with respect to the cell radius (r) for different values of cell compliance (i.e., β = 0.01, 0.03, 0.05), viscosity (i.e., µ = 0.25, 0.3, 0.35) and Reynolds number (i.e., 0.25, 0.3, 0.35), respectively. Interestingly drag force on the rim of the cell decreases untill a certain value of stressed cell radius and then starts increasing at a different rate. Figure 10 shows the variation in drag force (τ) for different values of cell compliance (β). It is observed that the drag force component decreases with an increase in the cell compliance (β).
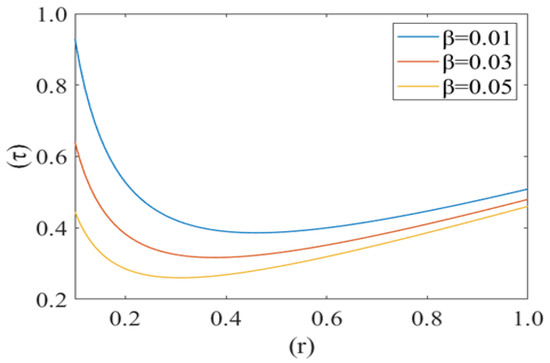
Figure 10.
Drag force () at the rim of the deformed cell with respect to its deformed radius (r) at different cell compliances () with Re = 0.25, P1 = 2, k = 0.1.

Figure 11.
Variation of the drag force () at the rim of the cell with respect to its radius (r) with variation in viscosity () with Re = 0.25, P1 = 2, k = 0.1.
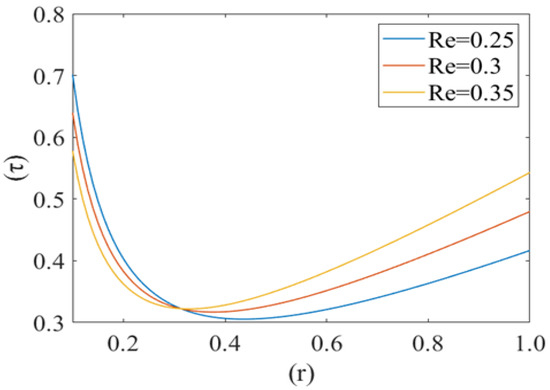
Figure 12.
Variation of the drag force () at the rim of the cell with respect to its radius (r) at different Reynolds numbers (Re) with P1 = 2, k = 0.1.
Figure 11 represents the change in drag force (τ) for different values of viscosity (µ) of the plasma. It is noticed that the drag force component τ increases with an increase in the value of plasma viscosity. In other words, it can be concluded that the higher viscosity of plasma exerts a comparatively higher drag force. Figure 12 shows the variation in the drag force component for different values of Reynolds number (Re). Drag force behaves non-linearly for different values of (Re). It decreases until a fixed value of cell radius and then starts increasing up to the wall of the capillary. Drag force (τ) has a greater value for a comparatively low Reynolds number (Re). Initially it decreases until the critical value of the deformed cell radius (i.e., r = 0.32). After that, it starts to increase with an increase in Reynolds number (Re).
4. Discussion
The mechanics of deformable red blood cells in the capillary (diameter is less than that of the cell) is described here. The red blood cells are a viscoelastic membrane containing incompressible viscous fluid in biconcave shape and exhibit complex behavior. Its structure can easily support an increase in external pressure, transmitted directly to the fluid inside the cytoskeleton. Lubricating film thickness h << r0 (tube radius) is effective in this capillary region. Nonuniform pressure generated by the lubrication layer across the cell influences the mean velocity in these regions. We have taken the effect of cell bending with the parameter of cell compliance. Sickle RBCs are comparatively less deformable (more rigid) and have more viscous cytoplasm than normal RBCs. This study promotes the cell deformability in terms of compliance, which could be the key determinant in pressure driven flow in screening for sickle red blood cells in microcirculation. This model provides insight into the flow behavior of a highly viscous liquid filled membrane in narrow tube to describe the disease condition.
Here, in Figure 2, the less compliant (rigid) cells lead to a decrease in the height of the lubricating film, resulting in a decrease in the fluid velocity. The deformability of the cell in the diseased condition is affected to a greater extent than any other rheological factor [20]. Plasma flows slower in the capillary in the case of SCD, as sickle cells are comparatively stiffer and less compliant (rigid) than normal red blood cells after deoxygenation in the microcirculation [36].
Fluid velocity decreases from the core to near the capillary wall along the concavity of the cell. However, axial fluid velocity has not been affected significantly with the value of k in the capillary region. This can be understood by the heterogeneous characteristic of sickle RBCs (HbSS). These are fractioned into four density groups (I-IV). Fractions I (SS1) and II (SS2) are composed primarily of reticulocytes and discocytes, respectively, with MCHC levels similar to healthy RBCs. They have comparable bulk viscosity, unseparated from healthy blood samples in an oxygenated state hence they are not effective on the basis of curvature. Fractions III (SS3) and IV (SS4) are mainly composed of rigid discocytes and (SS4) with the mean corpuscular haemoglobin concentration (MCHC) values considerably higher than those of healthy RBCs, which results in a significant increase in blood viscosity even in their oxygenated state. These cells are called irreversible sickle cells (ISCs) and have a typical sickle shape, a comparatively large curvature and not affected the flow because of its shape. Because they are not adhesive to endothelia cells of the capillary wall; haematocrit is very low, fluid velocity is relatively slow here, and so cell to cell adhesion also does not happen. There are many studies demonstrating that rigid elongated RBCs (ISCs) do not get stuck in narrow capillaries [37]. From this model, axial velocity decreases with an increase in the value of local pressure around the cell P2. In SCD, as deoxygenated red blood cells are less flexible and plasma is relatively more viscus so for possible flow and an increase the local pressure around the cell [6,38]. Figure 5 shows that the fluid velocity decreases with a decrease in the mean pressure gradient. In SCD, the pressure drop in the flow is directly proportional to the velocity i.e., for decreasing the value of the pressure gradient, velocity drops dramatically [23,39]. Figure 6 shows the mean pressure gradient (P1) of the flow and height of the lubricating film of plasma at different values of cell compliance. P1 decreases (very minutely) around the cell with increases in height of the lubricating film of plasma with increases in rigidity of the cell. Due to the highly viscous medium, suspended erythrocytes undergo varying deformations according to their location in the velocity profile [40] and also changes in red cell flexibility can substantially increase or decrease the vascular resistance in the absence of any haematocrit change [41]. In SCD, red blood cells are less deformable than normal blood cells, hence with an increase in stiffness of the cell in capillary motion, relatively higher mean pressure, vascular resistance happened. Leak back in microcirculation promotes the flow in the capillary. The above results (7)–(9) show the relationship between leak back and the height of lubricating film for different values of mean pressure gradient (P1), local pressure and cell compliance (beta) respectively. Figure 7 shows that the leak back increases linearly with an increase in the width of the lubricating film. It attains relatively less value for the increased mean pressure gradient [42]. In Figure 8 increase in local pressure reduce the leakback because static and dynamic response of RBCs subjected to tensile forces due to structural defects in the lipid bilayer, cytoskeleton and their interaction. [43]. Figure 9 shows the variation in flux per unit length in backward direction leak back w.r.t and the height of the lubricating film for different values of cell compliance (beta). It is shown that the leak back is directly proportional to the height of the lubricating film but decreases with an increase in the value of the cell compliance i.e., less compliant (stiffer) blood cells show more leak back action which can breakdown the lubricating film. It can be concluded that in case of sickle cell disease, flow in the capillary is relatively slower than in healthy condition [44].
Figure 10, Figure 11 and Figure 12 show the variation in drag force (resistance in the direction of flow) at the rim of the cell with respect to the cell radius for different values of cell compliance, viscosity and Reynolds number, respectively. Results show that the drag force on the rim of the cell decreases till a certain value of stressed cell radius and then starts increasing at a comparatively different rate. Figure 10 shows the variation in drag force for different values of cell compliance (beta). It is observed that the drag force component decreases with an increase in the cell compliance. It is clear from the figure that stiff red blood cells experience comparatively higher drag force as compared to healthy red blood cells. Figure 11 represents the change in drag force for different values of viscosity of the plasma. It is shown that higher viscosity of plasma exerts comparatively higher drag force. In the case of sickle cell disease, plasma is more viscous than normal, so it can be concluded that in SCD, sickle cells experience higher viscous resistance (drag force component) on the rim and depress the flow in capillary motion. [44,45]. Figure 12 shows the variation in drag force component for different values of Reynolds number (Re). Drag force behaves non-linearly for different values of Re. It decreases till a fix value of cell radius and then starts increasing up to the wall of capillary. Drag force has greater value for comparatively low Reynolds number, initially it decreases till the critical value of the deformed cell radius (i.e., r = 0.32). Following this, it starts to increase with an increase in Reynolds number due to the shear rate reaches a certain threshold, in their study of shear-induced cell movement in a microchannel [46]. This result can be explained by the effects of the sphere number, relative geometry, and spacing on the flow resistance in the vessel and the fluid flow drag force acting to sweep the sphere off the vessel wall by Chapman et al. [47].
Lubrication theory proposed good agreement to observe the flow pattern. This can be applied to visualize the flow in microfluids and to observe the sickle blood flow pattern. The deterioration of mechanical properties in sickle cells coincide with dehydration and increased viscosity resulting from increased intracellular haemoglobin concentration [15]. The above model and their results can probe deformation of RBC incorporation at physiological flow conditions in microfluidic system holds great potential as a diagnostic tool [21].
5. Conclusions
Effective diagnosis of sickle cell diseases relies on the robust knowledge of cellular and fluid flow-mechanism. This study explores the fluid flow mechanism aspect of the SCD. We have investigated the effect of cell compliance, mean/local pressure difference, Reynold number, viscosity of plasma and intracellular haemoglobin suspended in the RBC in the blood flow through narrow blood vessels. This study suggests that the blood flow velocity decreases significantly with decrease in cell compliance. Reduction in cell compliance results in severe clinical outcomes i.e., vaso-occlusive crises etc. The findings of this paper show significant flow properties of sickle blood in microcirculation. The study of the mechanical properties of the RBCs ensures that the deformability, compliance and local pressure around the red cells in the capillary motion participate major role in blood flow regulation. This study is helpful in identifying similarities and differences between normal and sickle blood and incorporates more realistic representation for sickle blood flow in the aspect of bio-medical engineering. It can provide unique insights with novel possibilities for the design of microfluidics towards effective therapeutic intervention of SCD.
Author Contributions
Conceptualization, P.C.; Formal analysis, P.C.; Funding acquisition, P.C.; Methodology, P.C.; Project administration, P.C.; Resources, R.K.; Software, R.K.; Supervision, S.R.S.; Visualization, P.C.; Writing—original draft, P.C.; Writing—review & editing, P.C. All authors have read and agreed to the published version of the manuscript.
Funding
This research is funded by the Department of Science and Technology (DST), INDIA.
Institutional Review Board Statement
Not applicable.
Informed Consent Statement
Not applicable.
Acknowledgments
The authors would like to thank to the Department of Science and Technology (DST), INDIA for supporting this research under WOS-A Scheme (Project ID: SR/WOA-A/PM-94/2017).
Conflicts of Interest
The authors declare no conflict of interest.
References
- Herrick, J.B. Peculiar elongated and sickle-shaped red blood corpuscles in a case of severe anemia. Arch. Intern. Med. 1910, 6, 517–521. [Google Scholar] [CrossRef]
- Pauling, L.; Itano, H.A.; Singer, S.J.; Wells, I.C. Sickle cell anemia, a molecular disease. Science 1949, 110, 543–548. [Google Scholar] [CrossRef]
- Ingram, V.M. Gene mutations in human hæmoglobin: The chemical difference between normal and sickle cell hæmoglobin. Nature 1957, 180, 326–328. [Google Scholar] [CrossRef]
- Frenette, P.S. Sickle cell vaso-occlusion: Multistep and multicellular paradigm. Curr. Opin. Hematol. 2002, 9, 101–106. [Google Scholar] [CrossRef] [PubMed]
- Sorette, M.P.; Lavenant, M.G.; Clark, M.R. Ektacytometric measurement of sickle cell deformability as a continuous function of oxygen tension. Blood 1987, 69, 1272. [Google Scholar]
- Chien, S.; Usami, S.; Bertles, J.F. Abnormal rheology of oxygenated blood in sickle cell anemia. J. Clin. Investig. 1970, 49, 623–634. [Google Scholar] [CrossRef]
- Klug, P.P.; Lessin, L.S.; Radice, P. Rheological Aspects of Sickle Cell Disease. Arch. Intern. Med. 1974, 133, 577–590. [Google Scholar] [CrossRef]
- Chien, S.; King, R.G.; Kaperonis, A.A.; Usami, S. Viscoelastic properties of sickle cells and hemoglobin. Blood Cells 1982, 8, 53–64. [Google Scholar]
- Liu, Y.; Zhang, L.; Wang, X.; Liu, W.K. Coupling of Navier-Stokes equations with protein molecular dynamics and its application to hemodynamics. Int. J. Numer. Methods Fluids 2004, 46, 1237–1252. [Google Scholar] [CrossRef]
- Ballas, S.K.; Mohandas, N. Sickle red cell microrheology and sickle blood rheology. Microcirculation 2004, 11, 209–225. [Google Scholar] [CrossRef] [PubMed]
- Stuart, J.; Nash, G.B. Red cell deformability and haematological disorders. Blood Rev. 1990, 4, 141–147. [Google Scholar] [CrossRef]
- Evans, E.; Mohandas, N.; Leung, A. Static and dynamic rigidities of normal and sickle erythrocytes. Major influence of cell hemoglobin concentration. J. Clin. Investig. 1984, 73, 477–488. [Google Scholar] [CrossRef] [PubMed]
- Hebbel, R.P.; Yamada, O.; Moldow, C.F.; Jacob, H.S.; White, J.G.; Eaton, J.W. Abnormal adherence of sickle erythrocytes to cultured vascular endothelium. Possible mechanism for microvascular occlusion in sickle cell disease. J. Clin. Investig. 1980, 65, 154–160. [Google Scholar] [CrossRef]
- Mohandas, N.; Evans, E. Adherence of sickle erythrocytes to vascular endothelial cells: Requirement for both cell membrane changes and plasma factors. Blood 1984, 64, 282–287. [Google Scholar] [CrossRef] [PubMed]
- Higgins, J.M.; Eddington, D.T.; Bhatia, S.N.; Mahadevan, L. Sickle cell vasoocclusion and rescue in a microfluidic device. Proc. Natl. Acad. Sci. USA 2007, 104, 20496–20500. [Google Scholar] [CrossRef]
- Secomb, T.W. Red blood cell mechanics and capillary blood rheology. Cell Biophys. 1991, 18, 231–251. [Google Scholar] [CrossRef] [PubMed]
- Fåhræus, R.; Lindqvist, T. The viscosity of the blood in narrow capillary tubes. Am. J. Physiol. Leg. Content 1931, 96, 562–568. [Google Scholar] [CrossRef]
- Natarajan, M.; Udden, M.M.; McIntire, L.V. Adhesion of sickle red blood cells and damage to interleukin-1β stimulated endothelial cells under flow in vitro. Blood 1996, 87, 4845–4852. [Google Scholar] [CrossRef] [PubMed]
- Thomas, H.W. The wall effect in capillary instruments: An improved analysis suitable for application to blood and other particulate suspensions. Biorheology 2017, 1, 41–56. [Google Scholar] [CrossRef]
- Hou, H.W.; Bhagat, A.A.S.; Lee, W.C.; Huang, S.; Han, J.; Lim, C.T. Microfluidic devices for blood fractionation. Micromachines 2011, 2, 319–343. [Google Scholar] [CrossRef]
- Alapan, Y.; Kim, C.; Adhikari, A.; Gray, K.E.; Gurkan-Cavusoglu, E.; Little, J.A.; Gurkan, U.A. Sickle cell disease biochip: A functional red blood cell adhesion assay for monitoring sickle cell disease. Transl. Res. 2016, 173, 74–91. [Google Scholar] [CrossRef]
- Secomb, T.W.; Hsu, R.; Pries, A.R. Motion of red blood cells in a capillary with an endothelial surface layer: Effect of flow velocity. Am. J. Physiol. Hear. Circ. Physiol. 2001, 281, H629–H636. [Google Scholar] [CrossRef] [PubMed]
- Fung, Y.C. Blood flow in the capillary bed. J. Biomech. 1969, 2, 353–372. [Google Scholar] [CrossRef]
- Barnard, A.C.L.; Lopez, L.; Hellums, J.D. Basic theory of blood flow in capillaries. Microvasc. Res. 1968, 1, 23–24. [Google Scholar] [CrossRef]
- Fitzgerald, J.M. Mechanics of red-cell motion through very narrow capillaries. Proc. R. Soc. Lond. Ser. B Biol. Sci. 1969, 174, 193–227. [Google Scholar]
- Zarda, P.R.; Chien, S.; Skalak, R. Elastic deformations of red blood cells. J. Biomech. 1977, 10, 211–221. [Google Scholar] [CrossRef]
- Pedrizzetti, G. Fluid flow in a tube with an elastic membrane insertion. J. Fluid Mech. 1998, 375, 39–64. [Google Scholar] [CrossRef]
- Hsu, R.; Secomb, T.W. Motion of nonaxisymmetric red blood cells in cylindrical capillaries. J. Biomech. Eng. 1989, 111, 147–151. [Google Scholar] [CrossRef] [PubMed]
- Secomb, T.W. Blood Flow in the Microcirculation. Annu. Rev. Fluid Mech. 2017, 49, 443–461. [Google Scholar] [CrossRef]
- Secomb, T.W. Flow-dependent rheological properties of blood in capillaries. Microvasc. Res. 1987, 34, 46–58. [Google Scholar] [CrossRef]
- Secomb, T.W.; Hsu, R. Analysis of red blood cell motion through cylindrical micropores: Effects of cell properties. Biophys. J. 1996, 71, 1095–1101. [Google Scholar] [CrossRef][Green Version]
- McWhirter, J.L.; Noguchi, H.; Gompper, G. Deformation and clustering of red blood cells in microcapillary flows. Soft Matter 2011, 7, 10967–10977. [Google Scholar] [CrossRef]
- Bali, R.; Mishra, S.; Mishra, M. Effect of Deformation of Red Cell on Nutritional Transport in Capillary-Tissue Exchange System. Appl. Math. 2011, 7, 10967–10977. [Google Scholar] [CrossRef][Green Version]
- Bali, R.; Mishra, S.; Dubey, S. A mathematical model for red cell motion in narrow capillary surrounded by tissue. Appl. Math. Comput. 2008, 196, 193–199. [Google Scholar] [CrossRef]
- Gross, J.F.; Ozkaya, N. Flow of axisymmetric red blood cells in narrow capillaries. J. Fluid Mech. 1986, 163, 405–423. [Google Scholar]
- Lomen, D.O.; Gross, J.F. A mathematical model of the effect of oxygen consumption on the resistance to flow of sickle cell blood in capillaries. Math. Biosci. 1977, 37, 63–79. [Google Scholar] [CrossRef]
- Aprelev, A.; Stephenson, W.; Noh, H.; Meier, M.; Ferrone, F.A. The physical foundation of vasoocclusion in sickle cell disease. Biophys. J. 2012, 103, L38–L40. [Google Scholar] [CrossRef][Green Version]
- Forsyth, A.M.; Wan, J.; Ristenpart, W.D.; Stone, H.A. The dynamic behavior of chemically ‘stiffened’ red blood cells in microchannel flows. Microvasc. Res. 2010, 80, 37–43. [Google Scholar] [CrossRef]
- Berger, S.A.; King, W.S. The flow of sickle-cell blood in the capillaries. Biophys. J. 1980, 29, 119–148. [Google Scholar] [CrossRef]
- Bransky, A.; Korin, N.; Nemirovski, Y.; Dinnar, U. Correlation between erythrocytes deformability and size: A study using a microchannel based cell analyzer. Microvasc. Res. 2007, 73, 7–13. [Google Scholar] [CrossRef]
- Greene, R.; Hughes, J.M.; Iliff, L.D.; Pineo, G.F. Red cell flexibility and pressure-flow relations in isolated lungs. J. Appl. Physiol. 1973, 34, 169–175. [Google Scholar] [CrossRef]
- Hariprasad, D.S.; Secomb, T.W. Motion of red blood cells near microvessel walls: Effects of a porous wall layer. J. Fluid Mech. 2012, 705, 195–212. [Google Scholar] [CrossRef]
- Chang, H.Y.; Li, X.; Li, H.; Karniadakis, G.E. MD/DPD Multiscale Framework for Predicting Morphology and Stresses of Red Blood Cells in Health and Disease. PLoS Comput. Biol. 2016, 12, e1005173. [Google Scholar] [CrossRef] [PubMed]
- Huber, D.; Oskooei, A.; Casadevall i Solvas, X.; Demello, A.; Kaigala, G.V. Hydrodynamics in Cell Studies. Chem. Rev. 2018, 118, 2042–2079. [Google Scholar] [CrossRef] [PubMed]
- Raj, A.; Sen, A.K. Entry and passage behavior of biological cells in a constricted compliant microchannel. RSC Adv. 2018, 8, 20884–20893. [Google Scholar] [CrossRef]
- Rupprecht, P.; Golé, L.; Rieu, J.P.; Vézy, C.; Ferrigno, R.; Mertani, H.C.; Riviere, C. A tapered channel microfluidic device for comprehensive cell adhesion analysis, using measurements of detachment kinetics and shear stress-dependent motion. Biomicrofluidics 2012, 6, 014107. [Google Scholar] [CrossRef]
- Chapman, G.B.; Cokelet, G.R. Flow resistance and drag forces due to multiple adherent leukocytes in postcapillary vessels. Biophys. J. 1998, 74, 3292–3301. [Google Scholar] [CrossRef]
Publisher’s Note: MDPI stays neutral with regard to jurisdictional claims in published maps and institutional affiliations. |
© 2021 by the authors. Licensee MDPI, Basel, Switzerland. This article is an open access article distributed under the terms and conditions of the Creative Commons Attribution (CC BY) license (https://creativecommons.org/licenses/by/4.0/).

