Article

Numerical Simulation on Temperature and Moisture Fields Around Cooling Towers Used in Mine Ventilation System

1
Institute of Continuous Media Mechanics of the Ural Branch of the Russian Academy of Sciences, Ac. Koroleva Str. 1, 614013 Perm, Russia
2
Mining Institute of the Ural Branch of the Russian Academy of Sciences, Sibirskaya, 78a, 614007 Perm, Russia
*
Author to whom correspondence should be addressed.
Fluids 2022, 7(10), 317; https://doi.org/10.3390/fluids7100317
Submission received: 24 August 2022 / Revised: 13 September 2022 / Accepted: 26 September 2022 / Published: 28 September 2022
(This article belongs to the Special Issue Fluid Flows in Geotechnical Engineering)

Abstract

:
For heat rejection, small air-cooling towers are widely used in mine ventilation systems. However, the thermal efficiency of the cooling towers can be significantly affected by their geometrical arrangement and crosswind conditions. In certain ambient conditions, heated air coming from an exit of one tower can flow to intakes of other towers, which leads to a reduction in the thermal efficiency of the entire ventilation system. The aim of this study was to investigate the influence of crosswind speed and tower spacing on the temperature and moisture content of intakes of cooling towers. For this purpose, a three-dimensional CFD model of the non-isothermal turbulent flow of moist air around cooling towers is proposed. The model is based on the Reynolds-averaged Navier–Stokes equations with a standard turbulence model which are supplemented by heat transfer and moisture transport equations. The investigation of the effects of the crosswind speed and the tower spacing was carried out for two cooling towers by multiparametric numerical simulation using the CFD model. It was shown that the upstream tower protects the downstream one from the effect of the crosswind. The increase in the crosswind speed causes a rise in temperature and moisture content at the intakes of the downstream tower. The increase in the tower spacing, in general, contributes to a decrease in air temperature at the intakes of the downstream tower. However, at low crosswind speed, the heat transfer at the intakes can rise with the tower spacing due to a reduction in the protection possibilities of the upstream tower. Results of the numerical simulation of airflow around three cooling towers indicated that the increase in the number of cooling towers contributes to a rise in temperature and moisture content at the intakes.

1. Introduction

One of the main components of the mine ventilation system is air-cooling towers, which provide heat sinking from radiators containing hot water. Cooling of water inside air-cooling towers is a complex hydro-aero-thermal process in which a combination of heat and mass transfer effects proceeds between atmospheric air and hot water circulation in the ventilation system. The efficiency of cooling depends on the temperature and the moisture of air drawn into the tower. When the location of cooling towers is designed improperly, a warm plume exiting from one cooling tower may flow to the air intakes of the neighboring one. As a result, the amount of heat taken from hot water is reduced and the thermal performance of cooling towers decreases.
Air-cooling towers are widely used for the rejection of heat generated in various industrial processes such as thermal power plants, metallurgical and chemical productions, and air-conditioning systems [1,2,3]. In the existing literature, there are several studies devoted to the effects of crosswind on the cooling efficiency of air-cooling towers [4]. In [5,6,7,8,9], field measurements and laboratory tests were conducted to evaluate the performance of air-cooling towers under the impact of different wind speeds. However, experimental data obtained in operating cooling towers are affected by a change in environmental conditions, and results of lab-scale tests frequently cannot be directly translated into real conditions. To perform a comprehensive analysis of the influence of crosswind on cooling towers, methods of computational fluid dynamics (CFD) are extensively used. In general, the air is described as incompressible ideal gas whose steady flow is governed by the Reynolds time-averaged Navier–Stokes (RANS) conservation equations along with k–ε or k–ω turbulence models [4,10]. In [11], three-dimensional modeling of temperature and airflow around a natural draft dry-cooling tower was carried out for various wind speeds. It was shown that a CFD model based on the RANS equations adequately describes airflow, and obtained temperature values agreed with field measurements. In further studies, modifications of this model were proposed to enhance the efficiency of a cooling tower under crosswind conditions by designing external and internal fixed windbreak walls [12,13], internal windbreak walls with an asymmetric curved shape [14], partially rotating windbreak walls [15], windbreak walls with cooling enhancement by water distribution [16], external arc curved air flow deflectors [17], the geometry of cross-section [18,19], arrangement of heat exchangers [20], and optimization of flow rate of the circulating cooling water distribution [21]. Moreover, models based on the RANS equations for incompressible flow were successfully applied for the calculation of the adverse influence of crosswind on a natural draft wet-cooling tower [22,23] and development of schemes for embedding into a tower of an air duct [24] or forced ventilation [25,26] to reduce this negative effect. In [27,28], the hydrodynamic model was used for analysis of thermal performance of a natural draft wet-cooling tower improved by split flow plates to produce a dry–wet hybrid zone. In [29], a numerical simulation was conducted to study the influence of diameter of water droplets in the rain zone on the cooling efficiency of a natural draft wet-cooling tower.
In practice, cooling towers are located close to each other; hence, the crosswind effect on the efficiency of a group of cooling towers is of significant importance. In [30], the thermal performance of two adjacent natural draft wet-cooling towers located near plant buildings was investigated for various crosswind speeds and directions. It was shown that crosswind affected the first cooling tower more than the next tower located in the wake of the first. In [10], thermo-flow characteristics of two neighboring natural draft dry-cooling towers were estimated depending on ambient wind conditions. The numerical results also demonstrated that, under crosswind impact, the downstream tower had superior efficiency compared to the upwind tower. In [31], interactions between three short natural draft dry-cooling towers were studied for different wind speed and tower spacing. It was found that the plume of the upwind tower protected outlets of middle and leeward towers by diverting the upcoming wind; however, at low wind speeds, the wake of the upwind tower interfered with the plume produced by downstream towers. An increase in tower spacing led to a reduction in the interaction between cooling towers and a similar level of the heat rejection of each tower. In [32], numerical simulation of interaction of cooling towers included in an air-conditioning system was carried out accounting for crosswind conditions. It was found that a decrease in distance between towers leads to a rise in backflow rate and temperature of inlet flow.
In the present study, CFD simulation of airflow around two and three cooling towers included in a mining ventilation system was conducted taking into account turbulent steady flow of air, heat transfer, and moisture transport. The proposed model is based on the RANS equations combined with a k–ω turbulence model, supplemented by an energy conservation equation and mass balance equation for moisture. Numerical implementation of the model was performed in Comsol Multiphysics® 5.4 software, COMSOL Group, Stockholm, Sweden, 1998–2018. In spite of several studies devoted to numerical simulation of an effect of crosswind on thermal performance of natural draft dry- and wet-cooling towers, some features of air-cooling towers included in a mining ventilation system are taken into account in the present work. These cooling towers have relatively small dimensions with height up to 7 m. Cooling of hot water in the ventilation system is carried out using an axial fan inside the towers. On the industrial site, the towers are located close to each other, which can hinder intake of fresh, environment air. A series of computations were carried out for studying the effect of the distance between cooling towers and crosswind speed on distributions of flow, temperature, and relative humidity fields. On the basis of the obtained numerical results, variations of temperature and moisture content in the air intakes of cooling towers were considered.

2. Numerical Simulation

2.1. Governing Equations

In order to study the effect of crosswind on temperature and moisture around cooling towers, a numerical model of airflow was formulated using the CFD approach. Accordingly, turbulent flow of air with heat transfer was described as a movement of continuous media governed by a set of equations corresponding to conservation laws of mass, momentum, and energy combined with a turbulence model [4,33,34]. The flow around the cooling towers under the constant crosswind speed was assumed to be steady and incompressible.
On the basis of the assumptions, airflow can be simulated using the Reynolds time-averaged Navier–Stokes (RANS) conservation equations [3,35]:
ρ V = 0 ,
ρ V V = p + K + ρ g ,
K = ( μ + μ T ) ( V + ( V ) T ) ,
where V is the velocity, p is the static pressure, ρ is the moist air density, g is the vector of gravitational acceleration, and μ, μT are the molecular and turbulent viscosity. The physical properties of the moist air are estimated according to model for incompressible ideal gas.
The turbulent behavior of flow is described by the k–ω turbulence model with low Reynolds modifications which can predict free shear flow spreading rates [10,36,37]. The k–ω turbulence model is applicable to wall-bounded flow that can occur between two cooling towers. The equations of the model for the turbulence kinetic energy k and the specific dissipation rate ω are written as
ρ ( V ) k = [ ( μ + μ T σ k ) k ] + P k β k ρ ω k ,
ρ ( V ) ω = [ ( μ + μ T σ ω ) ω ] + α ω k P k ρ β ω ω 2 ,
where Pk is the production of the turbulence kinetic energy, and α, σk, σω, βk, and βω are closure coefficients.
The turbulence viscosity μT is determined as
μ T = ρ k ω .
Parameters included in equations of the k–ω turbulence model are given according to [38].
The heat transfer equation in airflow is expressed as follows [39]:
ρ C p V T + q = Q p + Q v d + Q H ,
where T is the air temperature, Cp is the specific heat capacity at constant pressure of moist air, q is the heat flux related to heat conduction, Qp is the heat source caused by pressure variation, Qp is the heat source representing viscous dissipation, and QH is the heat source accounting for the diffusive flux induced by the rate of change of air and vapor in moist air. The heat sources are defined as
Q p = V p ,
Q v d = τ : V ,
Q H = ( C p , v C p , a ) g w T ,
where gw is the vapor flux by diffusion, Cp,v , Cp,a are the specific heat capacity of vapor and air at constant pressure, and τ is the viscous stress tensor.
Thermal properties of moist air are estimated according to the mixture rule under the assumption that moist air is an ideal gas [40].
The density ρ of the moist air is expressed as
ρ = p R T ( M a X a + M v X v ) ,
where Ma and Mv are molar masses of dry air and water vapor, Xa and Xv are molar fractions of dry air and water vapor, and R is the ideal gas constant.
The specific heat capacities Cp,v , Cp,a are determined as
C p = M a M a X a + M v X v X a C p , a + M v M a X a + M v X v X v C p , v .
To compute heat flux q, molecular and turbulent thermal conductivities are used. For estimation of the turbulent thermal conductivities, the Prandtl number is given to be equal 0.85 [4].
The moisture transport equation is expressed as follows [41]:
ρ V ω V + g w = 0 ,
where ωV is the mass fraction of water vapor in air, which is determined as
ω V = M v c v ρ ,
where cv is the concentration. The parameter is estimated as
c v = φ w c s a t
where φw is the relative humidity, and csat is the vapor saturation concentration. The relative humidity φw is determined by solving the moisture transport Equation (17). The vapor saturation concentration is determined as
c s a t = p s a t ( T ) R T ,
where saturation pressure psat is given as follows [42]:
p s a t ( T ) = 610.7 10 7.5 T 273.15 T 35.85 .
The vapor diffusive flux gw is expressed as
g w = ρ D ω V ,
where D is the vapor diffusion coefficient in air.
Equations (1)–(18) allow computing spatial distributions of velocity, temperature, and moisture fields of airflow accounting for its turbulence behavior.

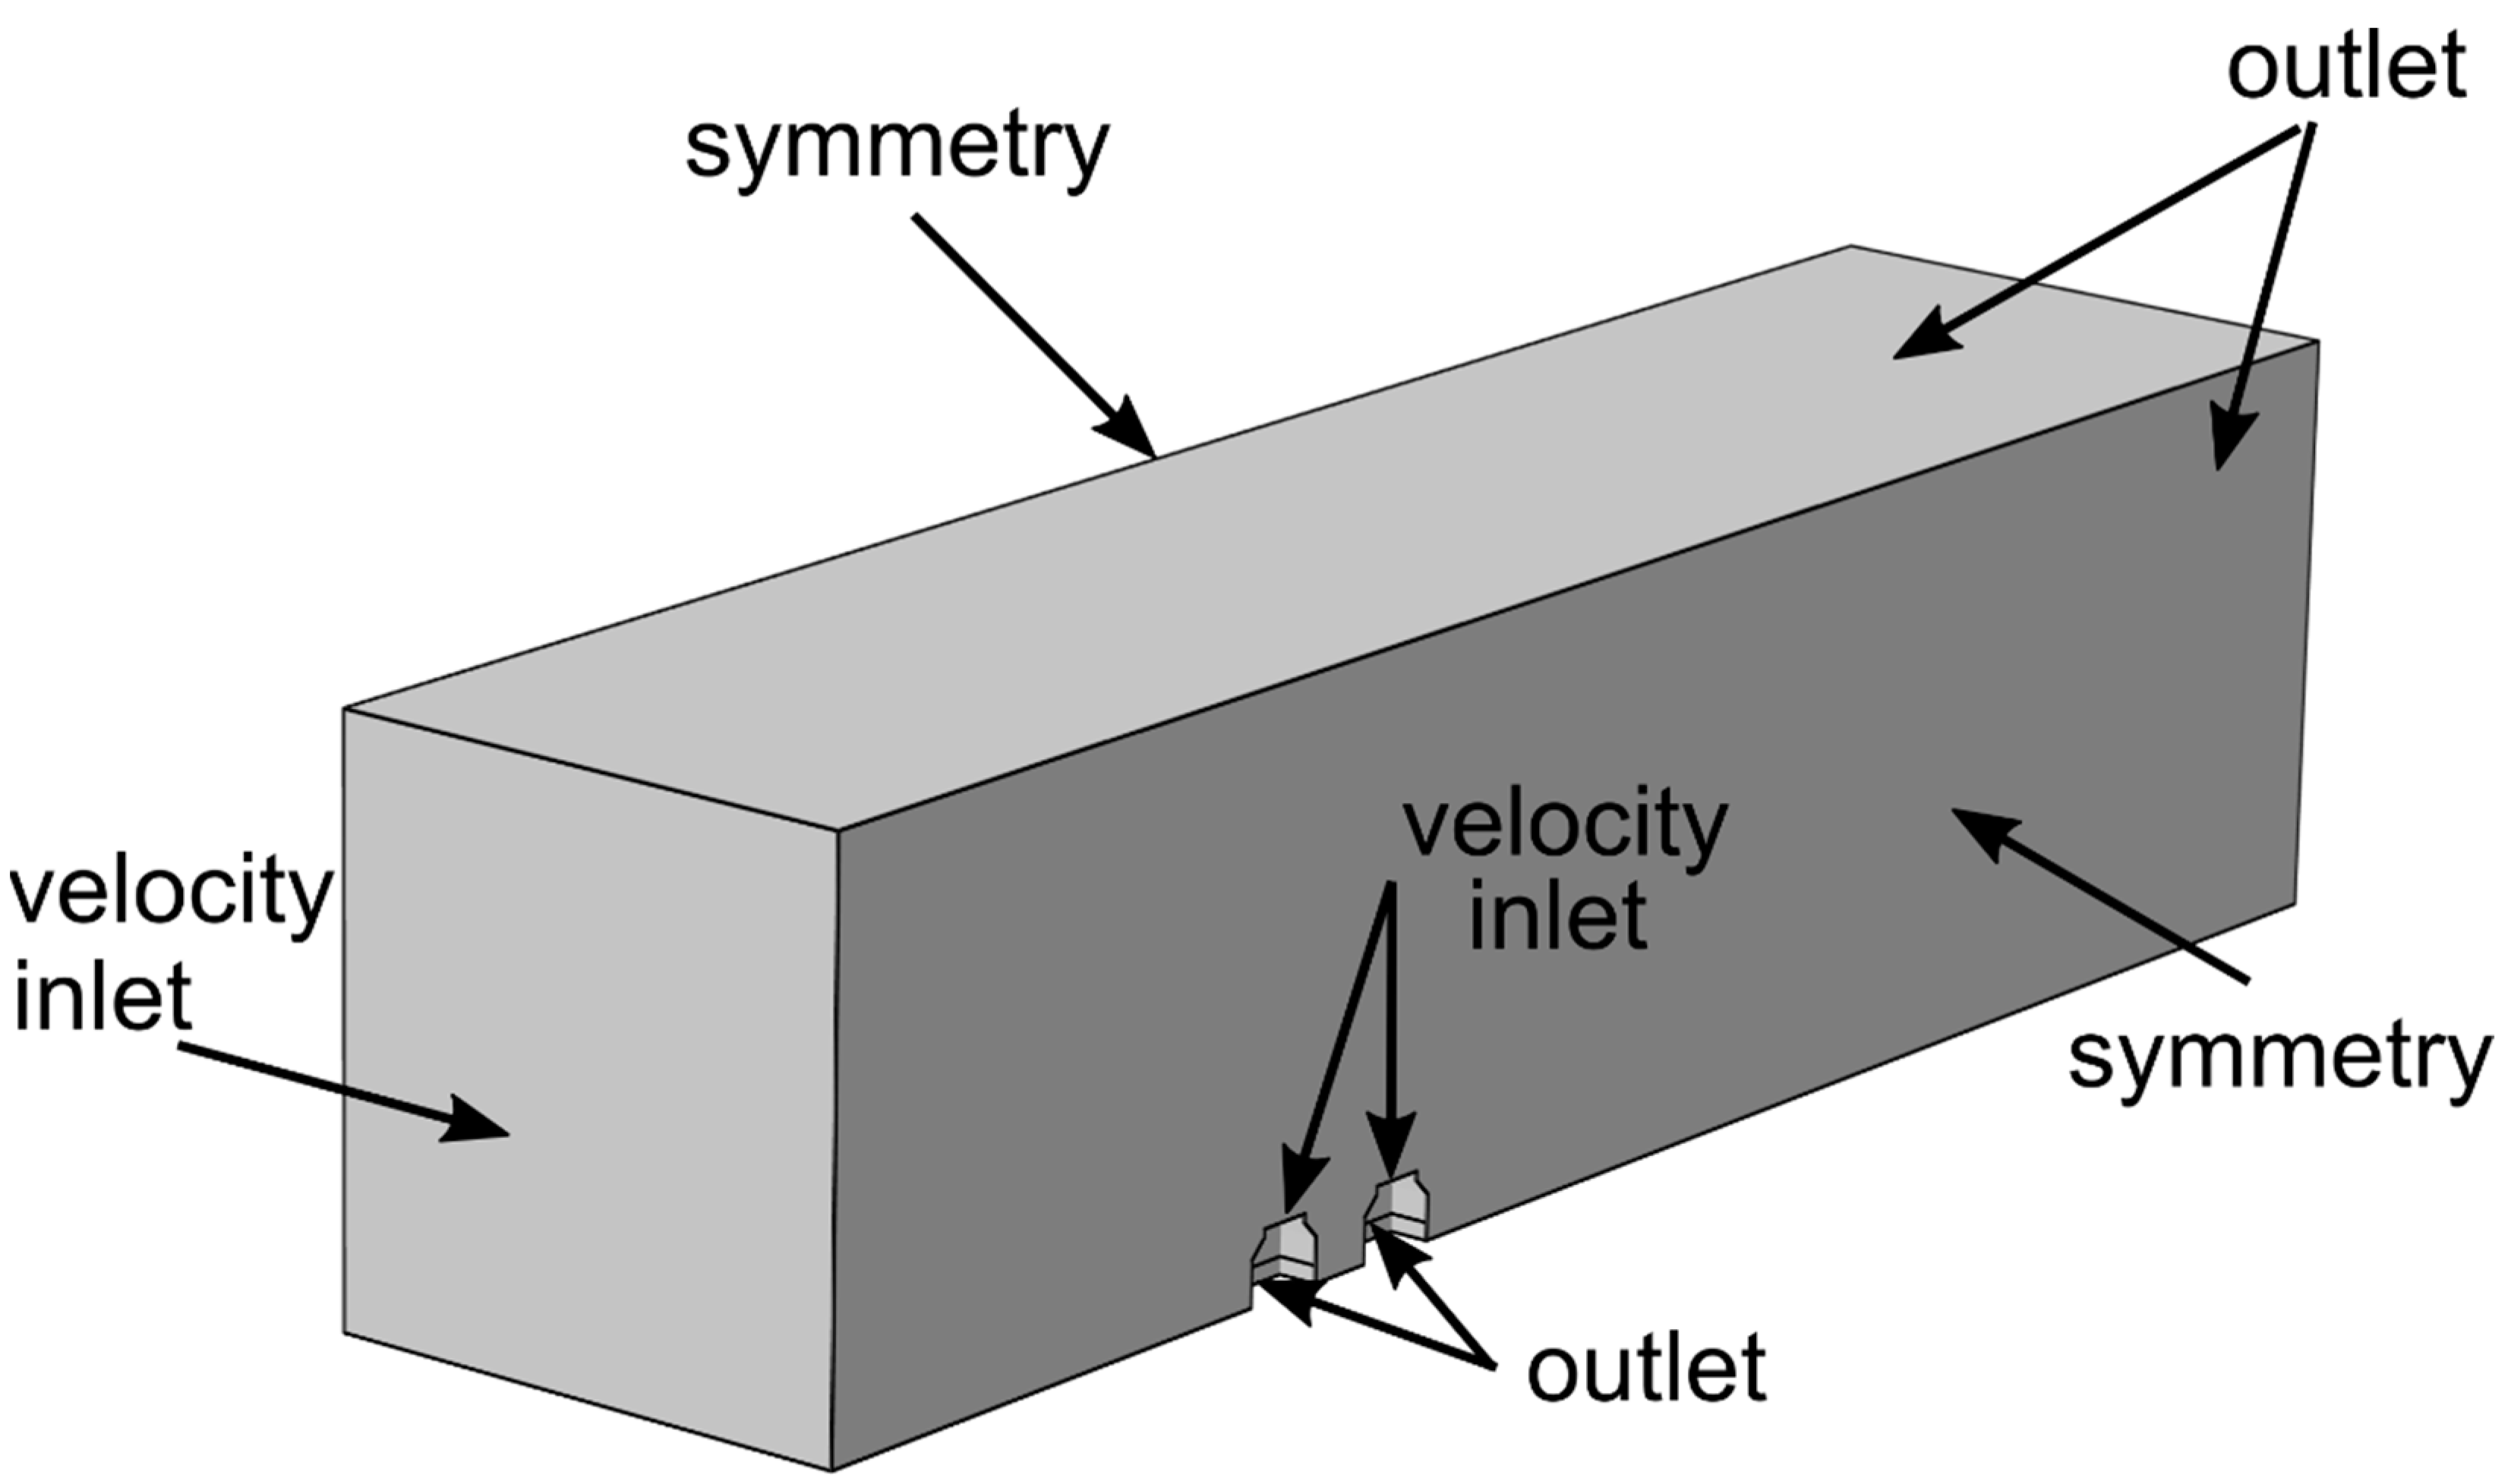
2.2. Geometry of Computational Domain and Boundary Conditions

The geometry of the computational domain is presented in Figure 1. Due to the symmetry of airflow around cooling towers relative to the vertical middle plane, the numerical simulation was limited to only half of the towers. The three-dimensional domain was built according to the technical documentation describing the design of the cooling tower. The height of the tower was 6.57 m. The large cross-section of the tower was a square with a length of 8.7 m. The diameter of the top exit of the tower was 5.49 m. The air intakes with a height of 1.6 m were placed at the bottom part of the towers. In order to avoid effect of the external boundaries of the computational domain on the flow field, the upwind and downstream surfaces were located 50 and 130 m from the first tower and the second tower, and the top boundary was located 42 m from the top exits of the towers. The lateral boundary was located 45 m away.
Boundary conditions for the CFD simulation are given below. On the upwind surface, an inlet condition was given with the crosswind speed Vwind, the temperature Tamb, and the relative humidity φamb of the atmospheric air. The cooling towers were short; thus, the change in crosswind velocity with height on the upwind surface was neglected. As airflow through the cooling towers was governed by an axial fan, it was supposed that the boundary conditions for the cooling tower could be unambiguously defined. On the top exits of the cooling towers, inlet conditions of the heated air were imposed with the speed Vin,t, the temperature Tin,t, and the relative humidity φin,t. On the air intakes of the cooling towers, outlet conditions were set with air volumetric flow rate Qout. On the lateral plane passing through the middle of cooling towers and the opposite lateral plane, the symmetry condition was used. On the top plane and downstream surface, outlet conditions were provided with the zero-gauge pressure. On the lateral surfaces of cooling towers and bottom plane, the no-slip adiabatic wall boundary condition was used.
Parameters used in the boundary conditions are listed in Table 1. These values correspond to engineering measurements conducted in an industrial site of an operating potash mine. A study of airflow around the cooling towers was carried out at different crosswind speeds Vwind, tower spacings, and numbers of towers.

2.3. Computer Implementation of the Model

The computer implementation of the proposed model using Equations (1)–(18) was carried out in Comsol Multiphysics® 5.4 software, COMSOL Group, Stockholm, Sweden, 1998–2018. An advantage of the software is the wide capabilities of a unified physical-based interface that allows the development of coupled models accounting for the interaction between various physical processes.
In the software, the RANS Equations (1) and (2), the k–ω turbulence model (4)–(5), and the heat transfer and moisture transport Equations (7) and (13) were solved numerically using the finite element method provided by the software. To prevent numerical oscillation and improve the stability of the numerical solution, the consistent stabilization methods of streamline diffusion and crosswind diffusion provided by default were applied [43,44].
The computational domain was divided using tetrahedron elements. The elements of the computational mesh were refined near the lateral sides of the cooling towers. With an increase in the distance from the towers, the size of the elements was scaled by a coefficient of 1.05. The maximal size of the element edge was applied to the region between the second cooling tower and its downstream surface. The element size of the computational mesh was determined by conducting of a sequence of computations with a different number of elements for a crosswind speed Vwind of 5 m/s and a distance between two cooling towers of 6.57 m. The considered numbers of elements were 729,840, 948,790, 1,233,430, and 1,603,460. The deviations of the velocity, temperature, and moisture near the top exits of towers and in the space between towers were less than 2% when the number of elements was changed from 1,233,430 to 1,603,460. On the basis of the mesh independency study, the mesh with 1,233,430 elements was chosen for multiparametric numerical simulation. In the mesh, the minimal and maximal edge sizes of elements were less than 10 cm and 1.8 m.

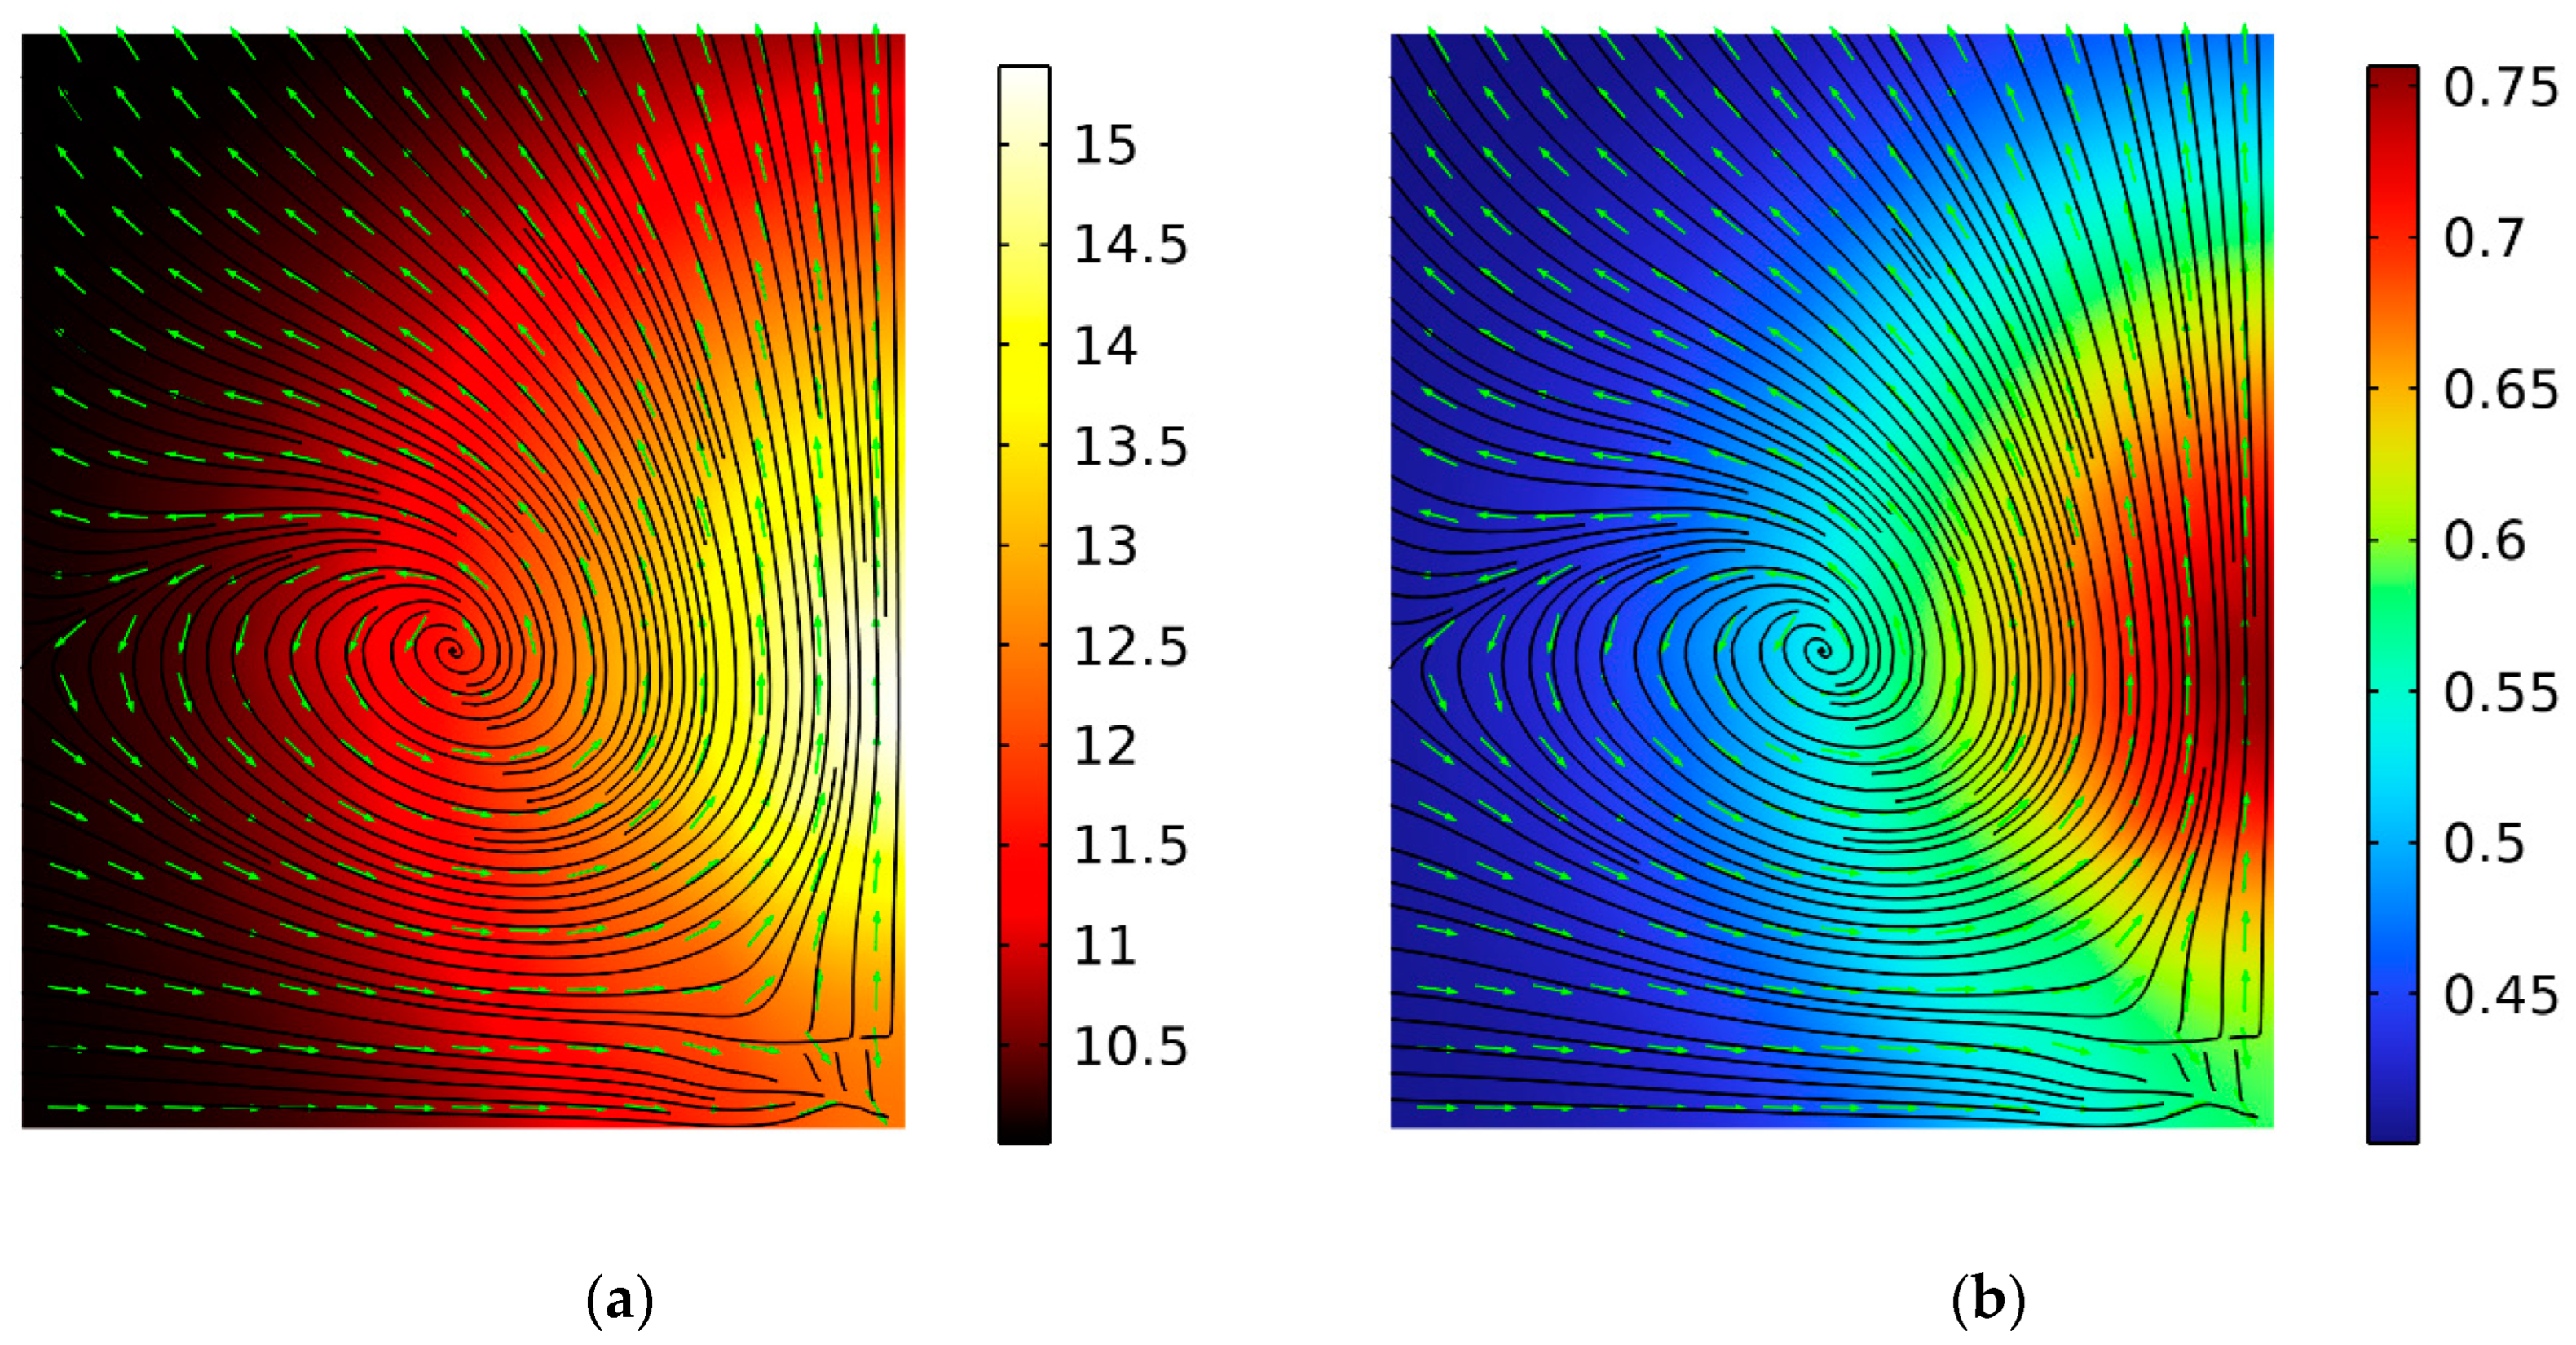
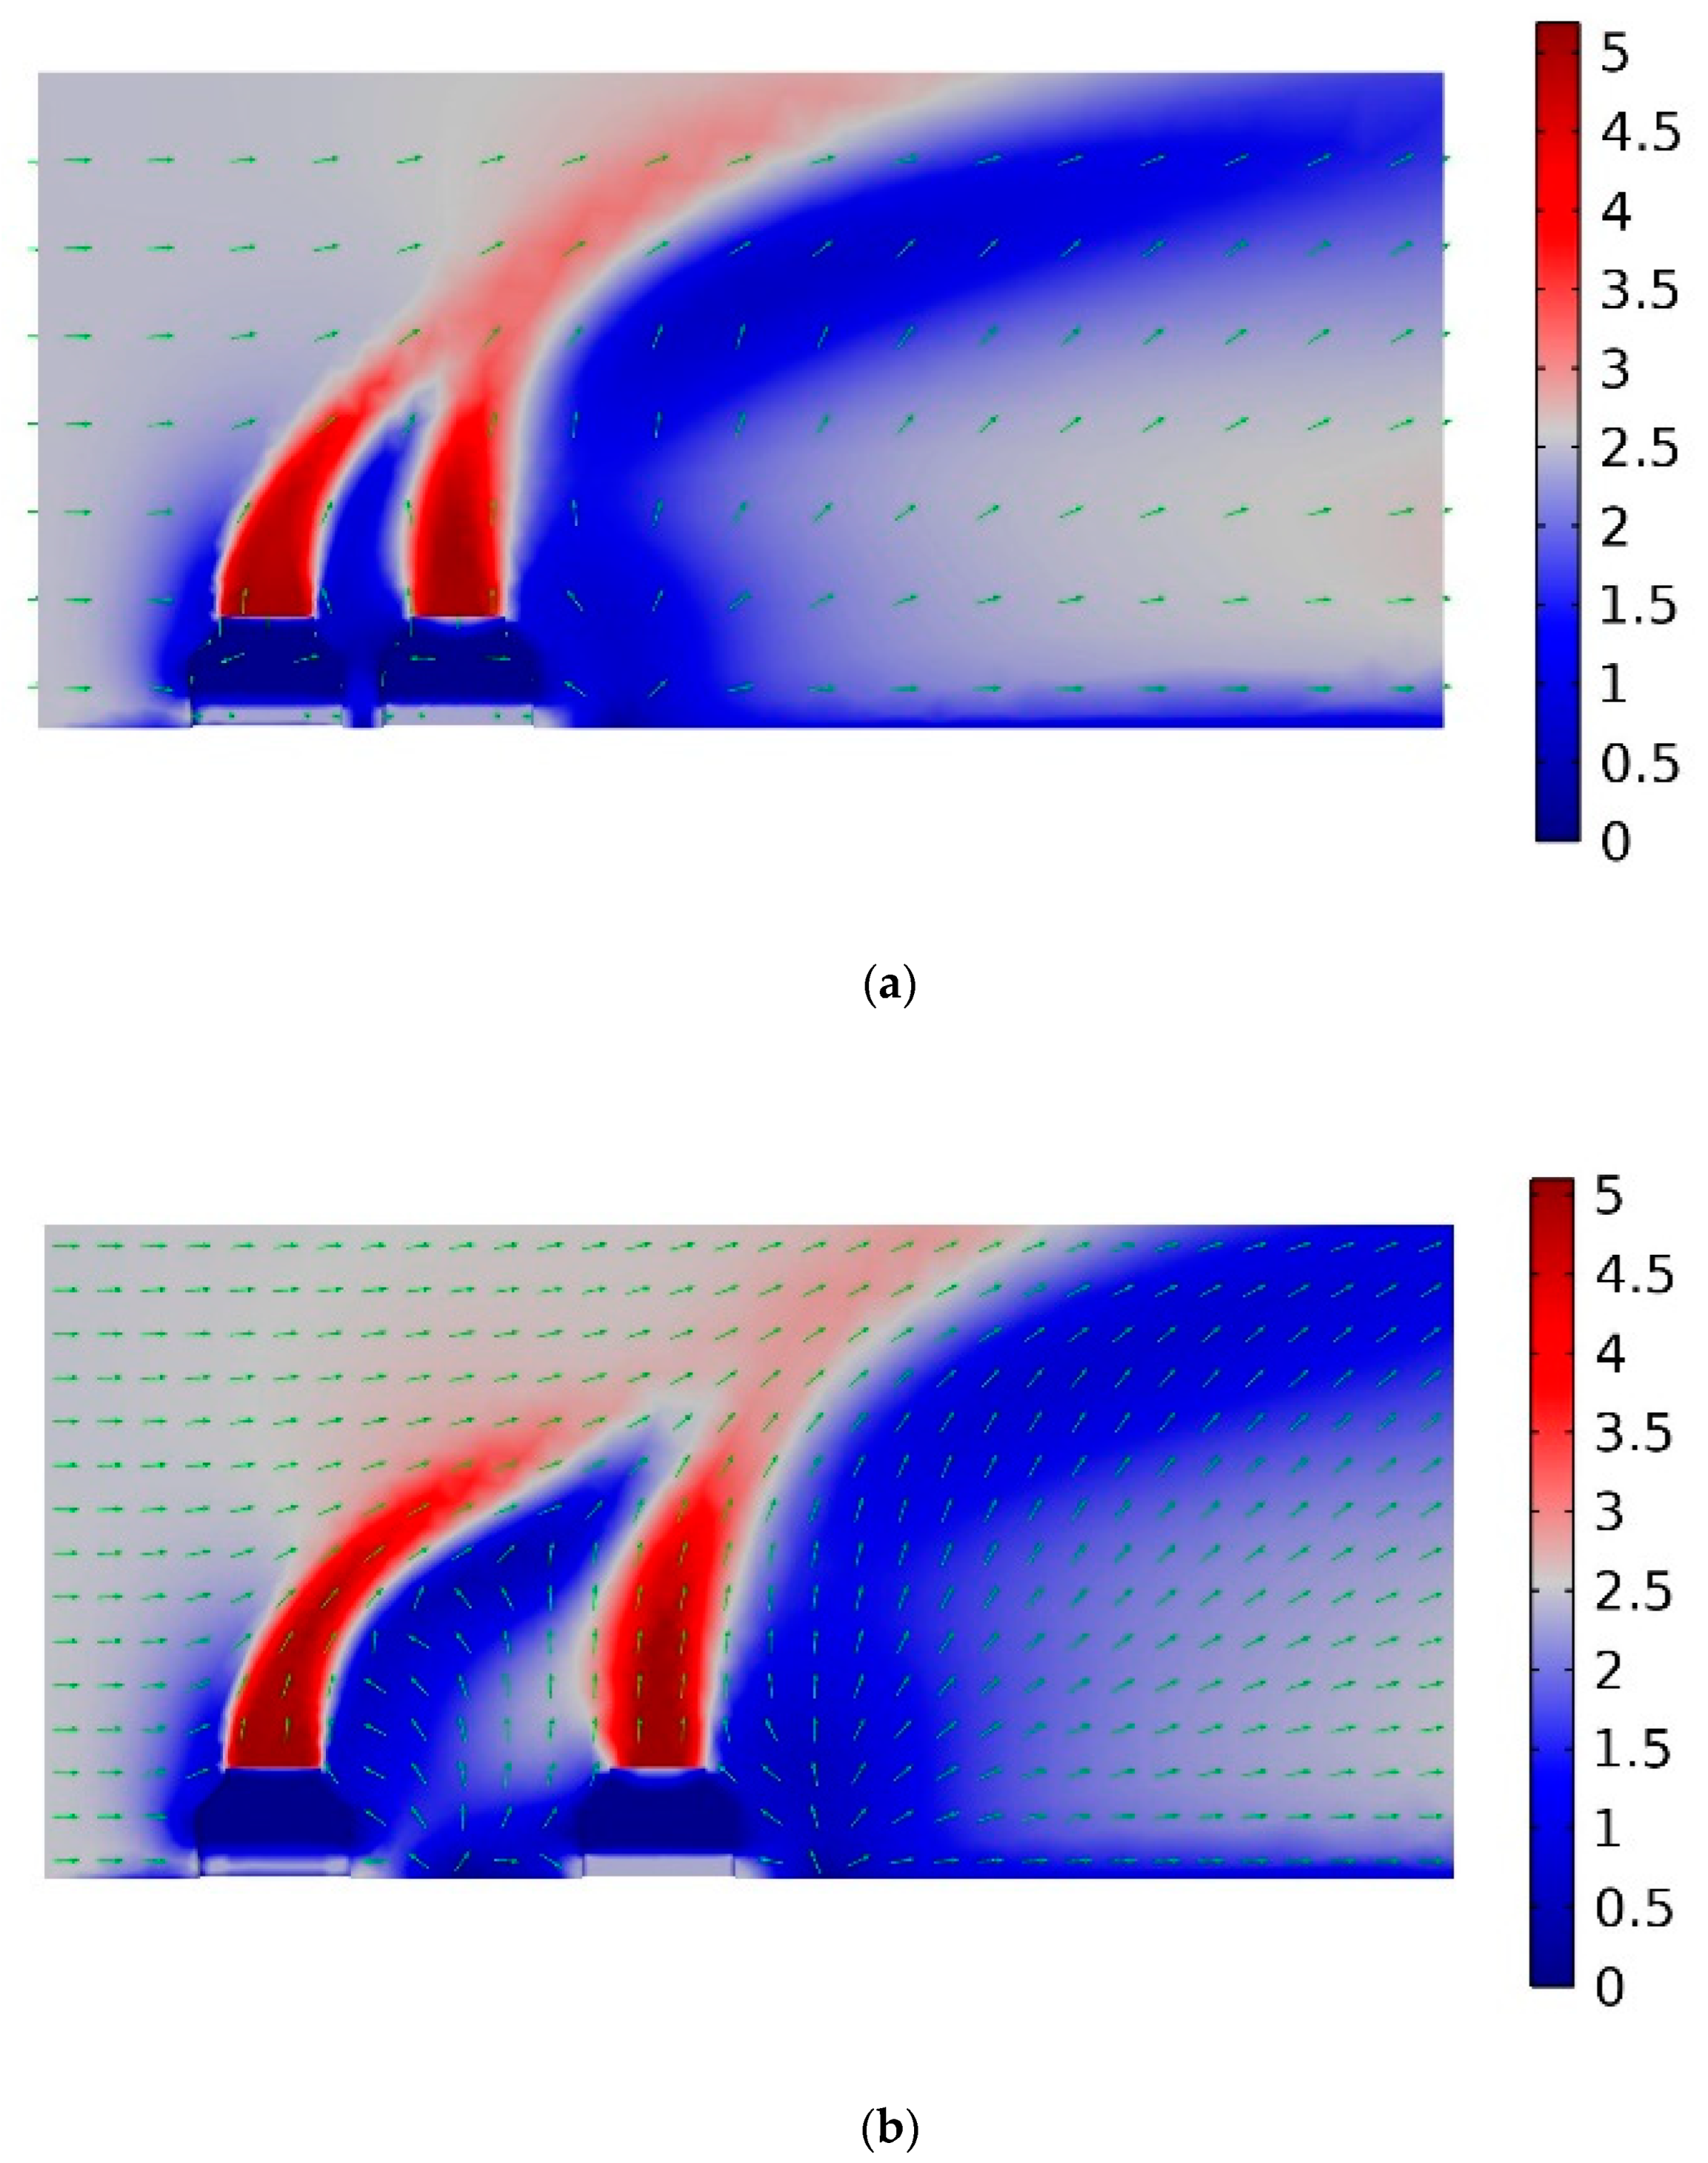
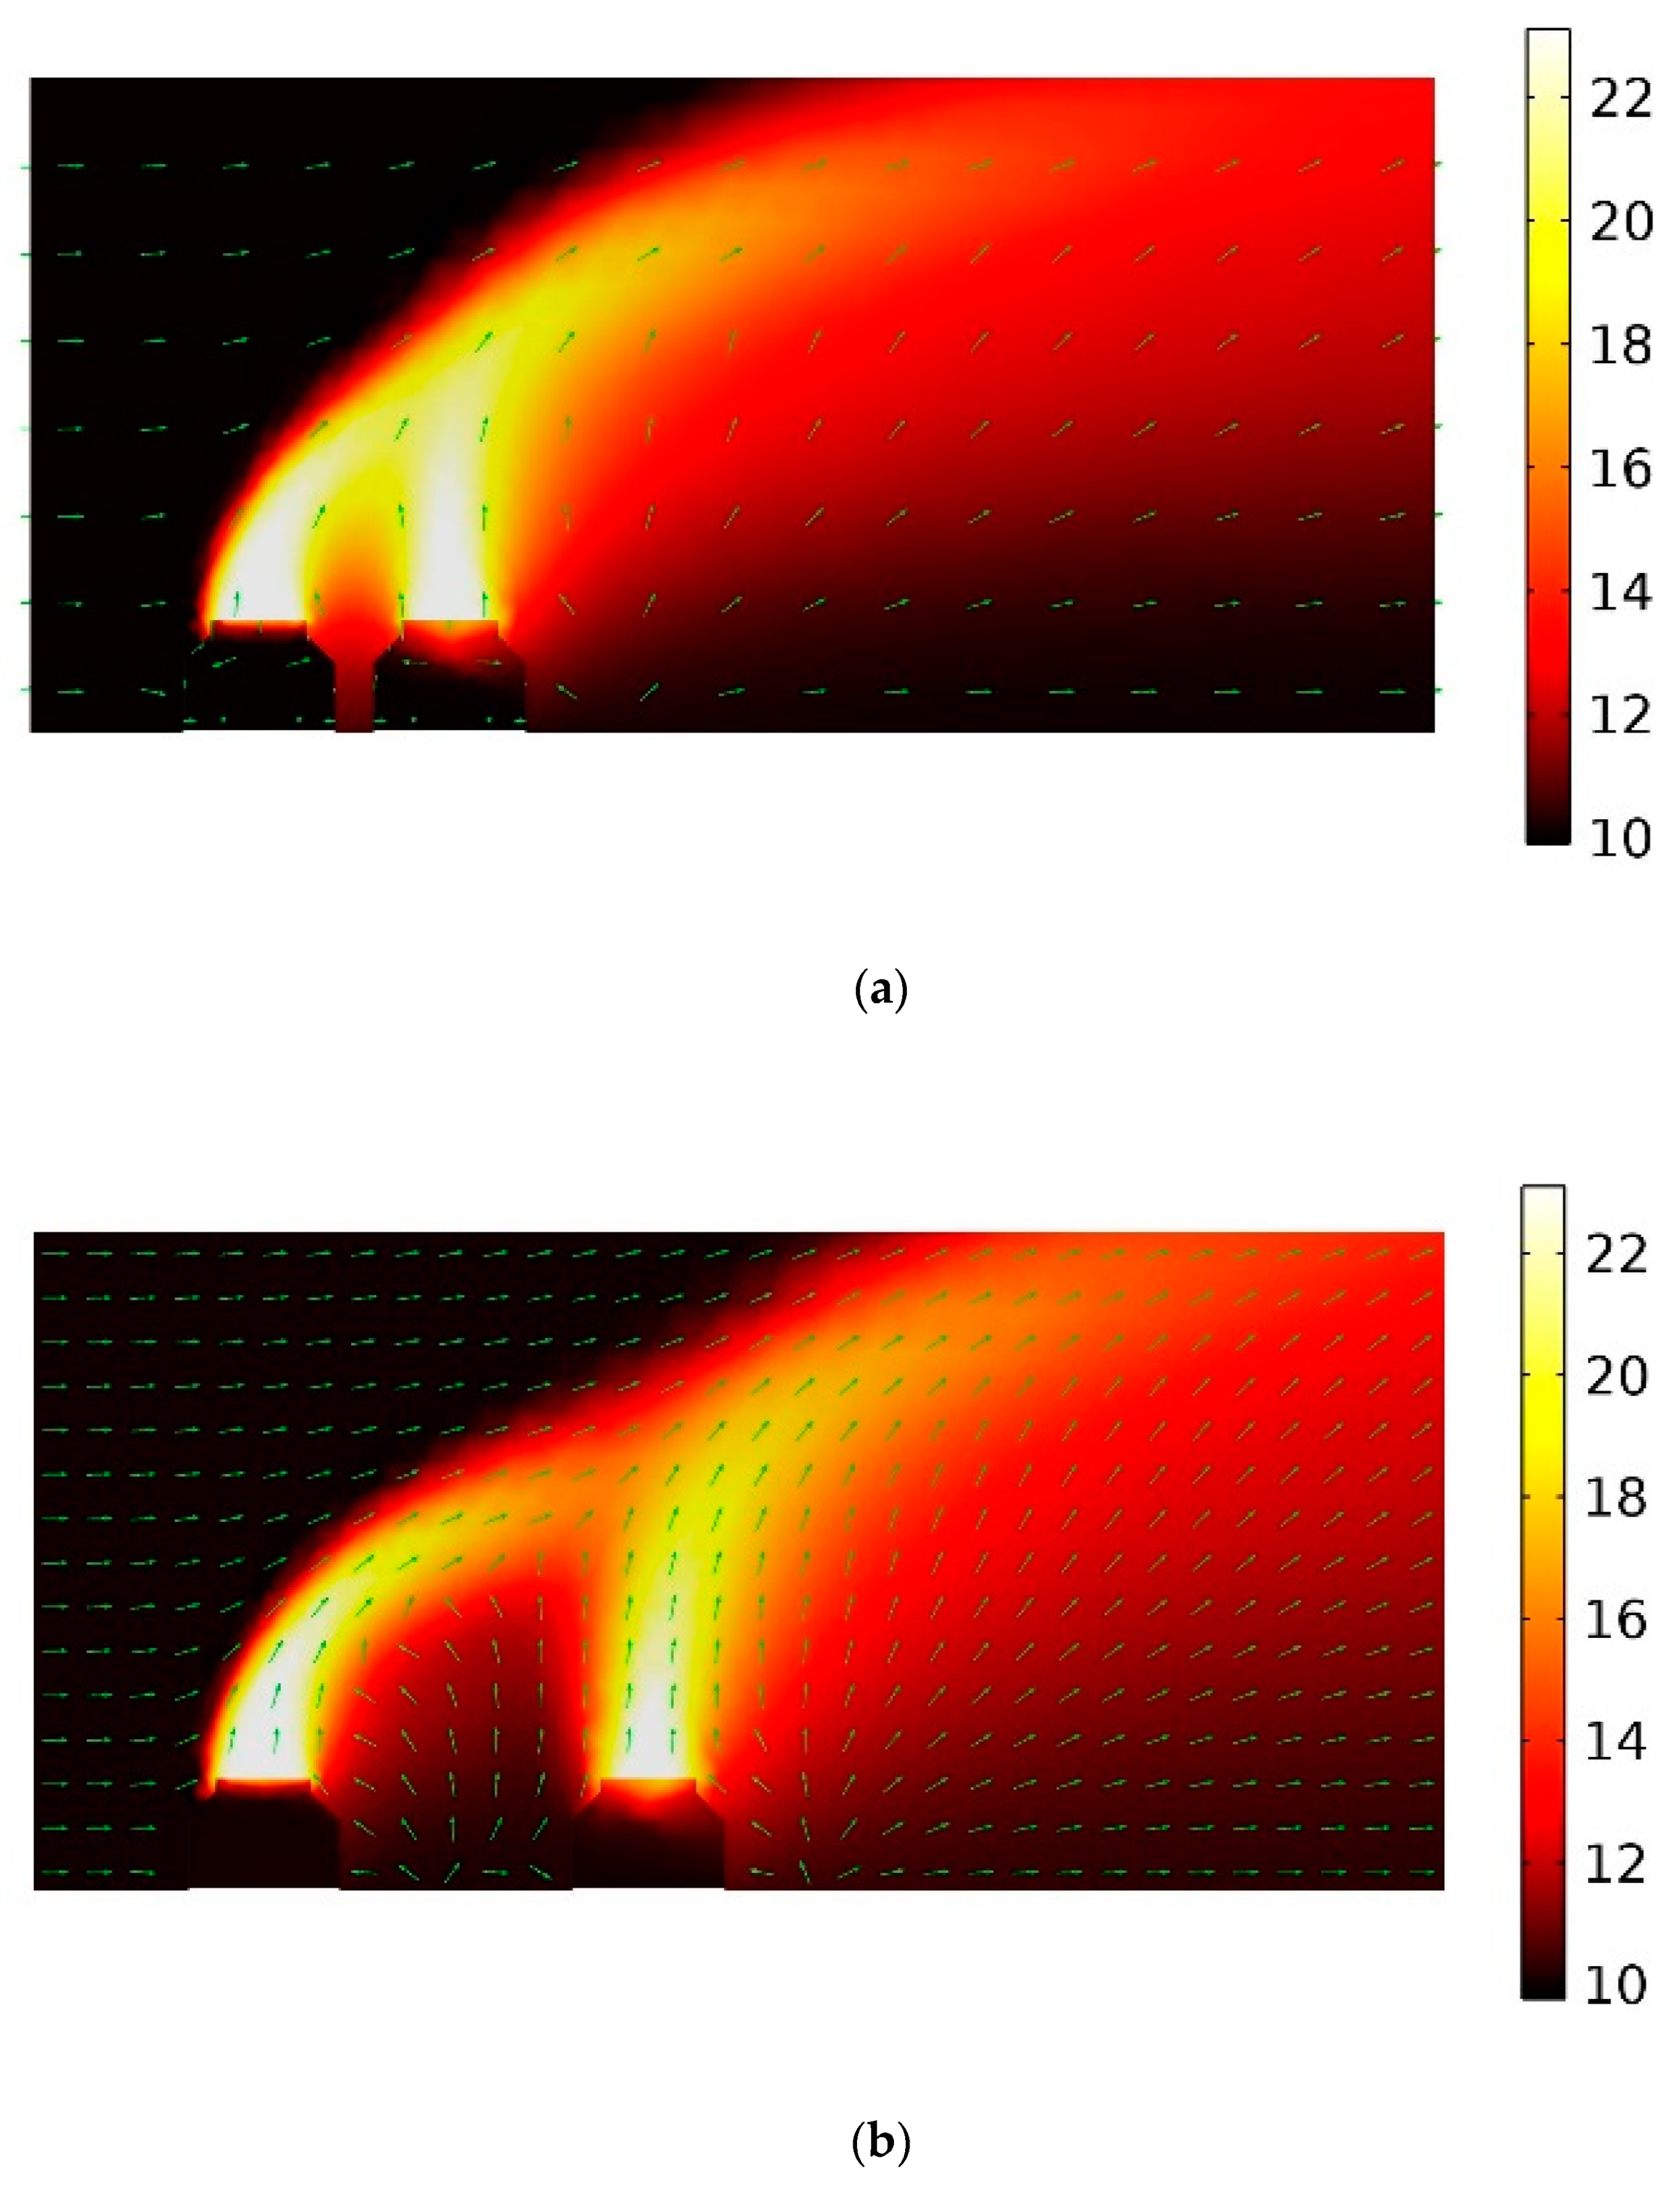
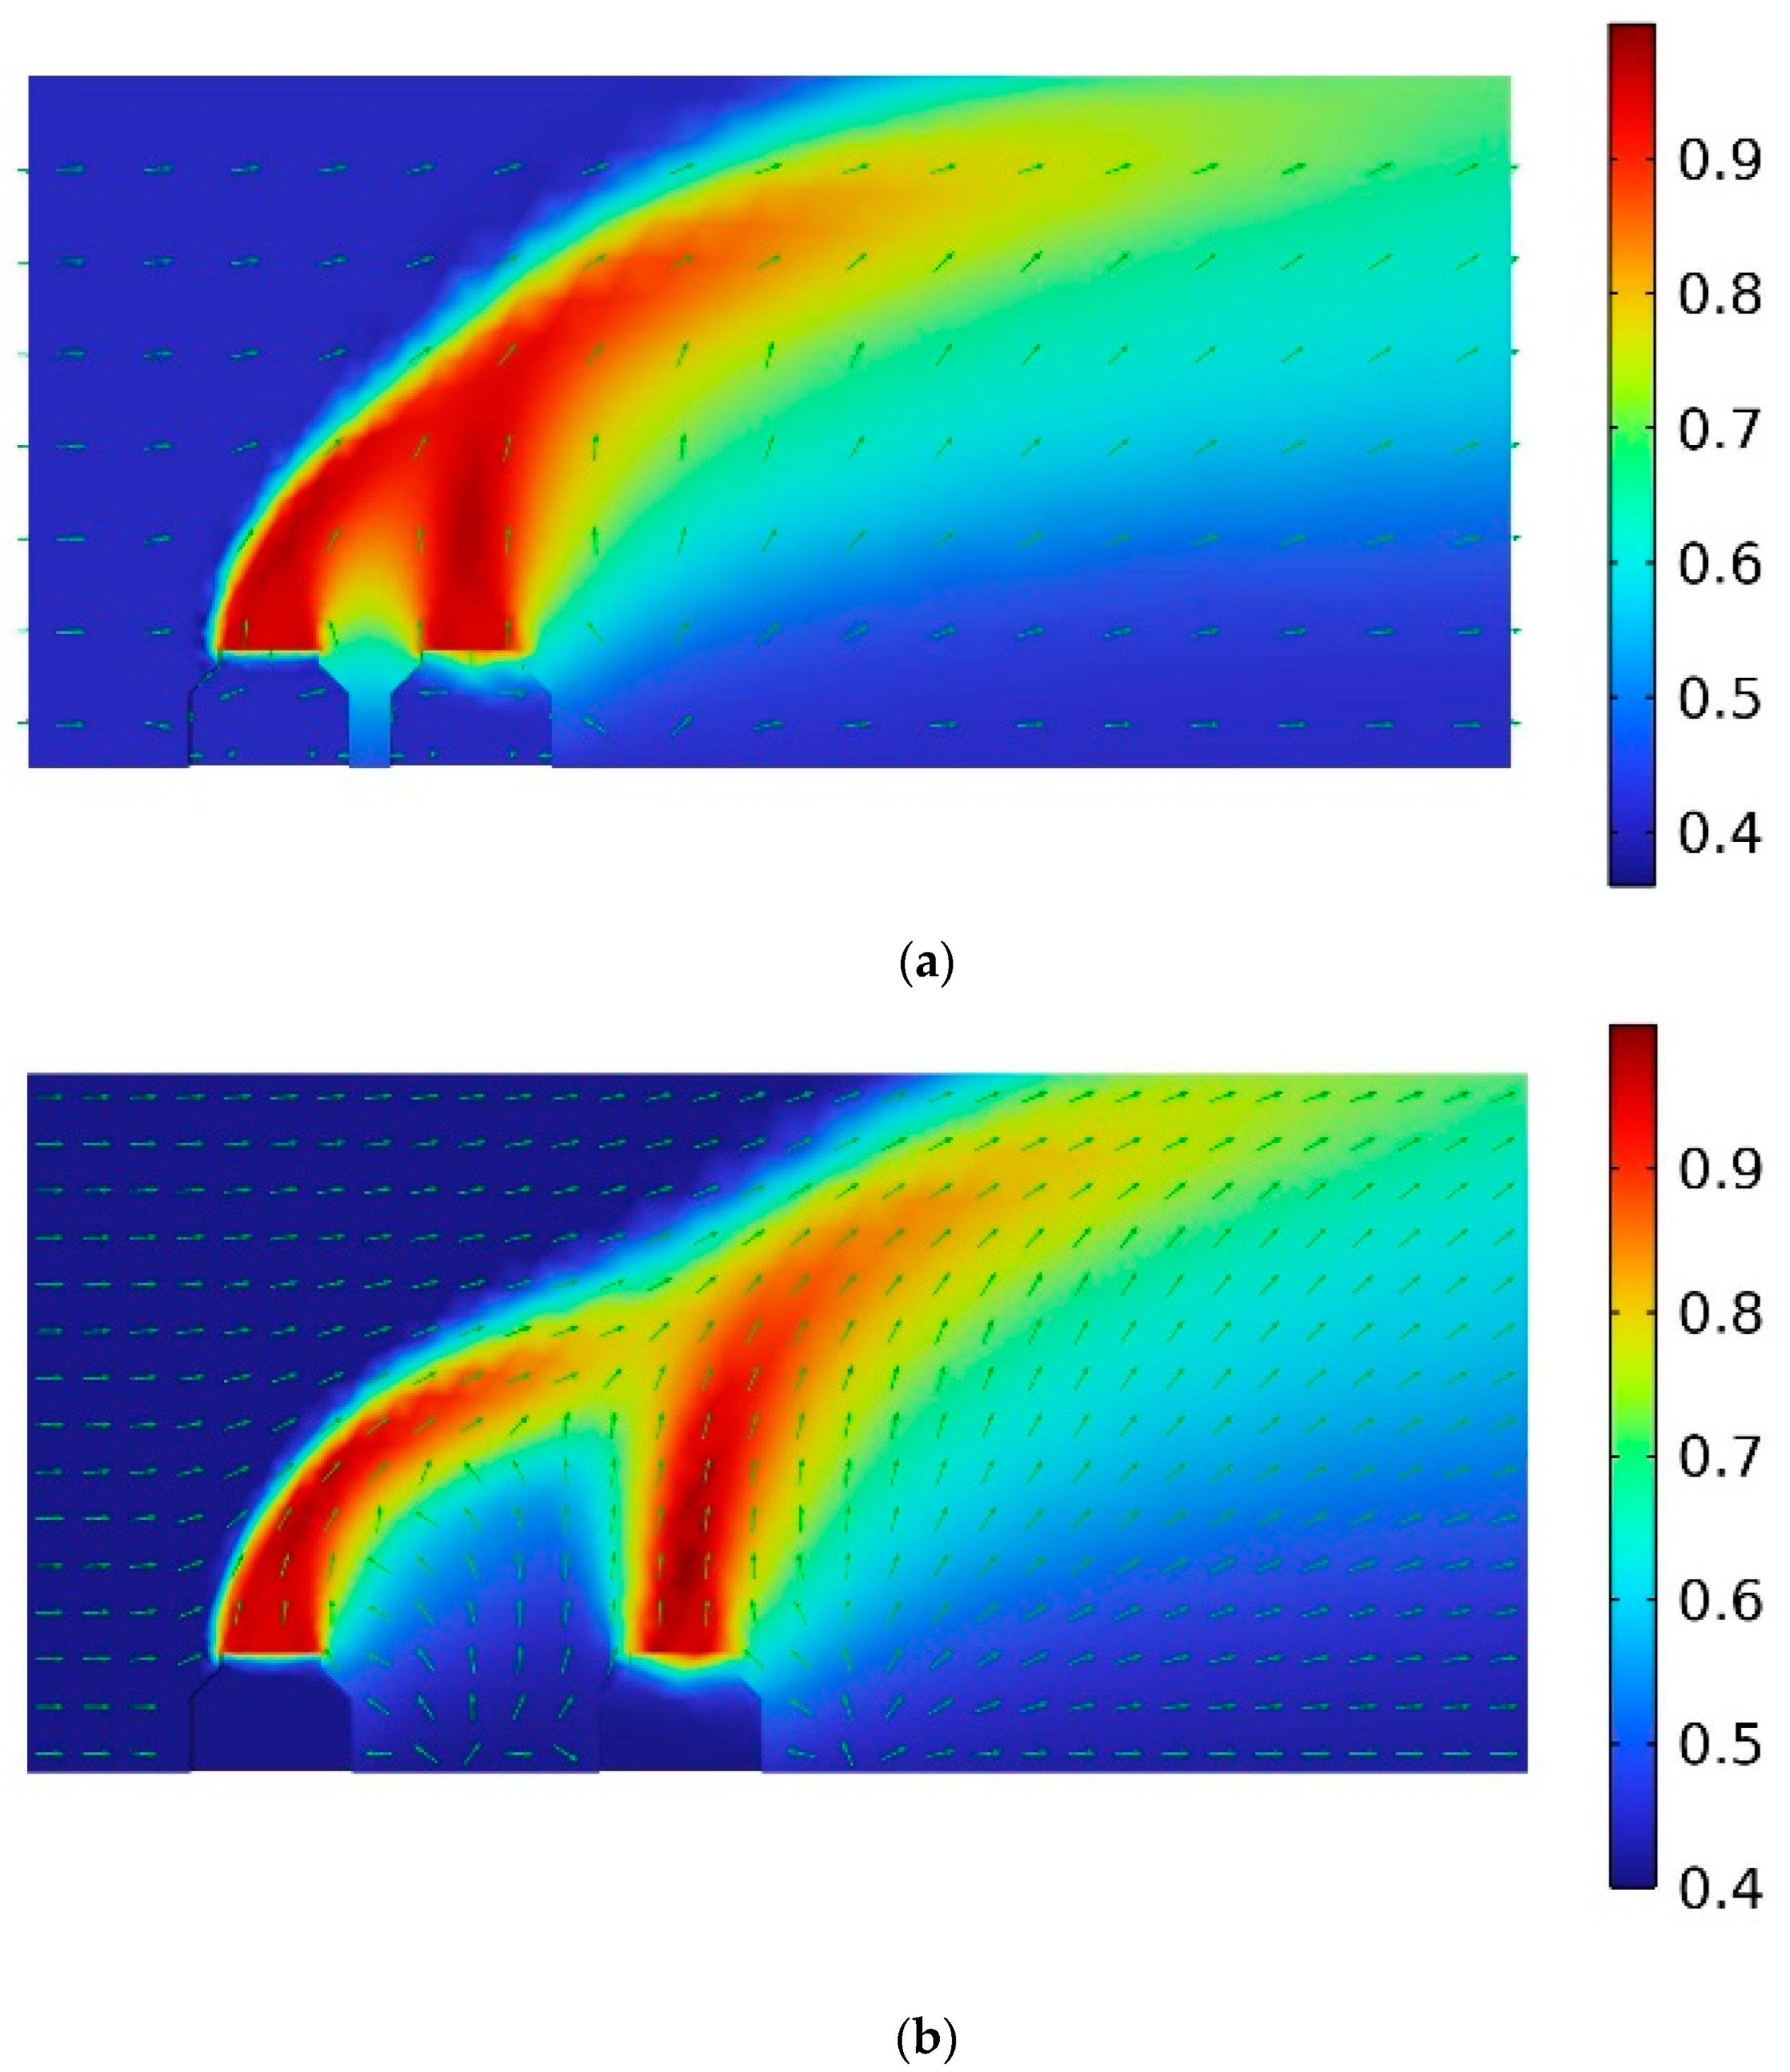
3. Multiparametric Numerical Simulation of Dynamics of Airflow Around Cooling Towers

3.1. Parameters for Variation

The mathematical model of non-isothermal turbulence flow of moist air proposed in Section 2 was applied for analysis of the temperature and moisture fields around the cooling towers depending on crosswind speed and tower spacing.
Numerical simulations were carried out for the following values of the parameters: the crosswind speed Vwind was 2.5 m/s, 5.0 m/s, and 7.5 m/s; the distance between the cooling towers was H/3, H/2, H, 2H, where H = 6.57 m is the height of the cooling towers; the number of the cooling towers was two and three.
For the two cooling towers, multiparametric three-dimensional numerical simulations were conducted for each value of the crosswind speed and the distance between towers. The obtained results were used to estimate the volumetric rate q of the returned flow of heated air, which flowed to the intake of the downstream tower. Further, the upwind and downstream cooling towers were named as the first and the second towers.
The volumetric flow rate q is defined as
q = T o u t , 2 T a m b T i n , t T o u t , 2 Q o u t , t ,
where Qout,t is the volumetric rate of the flow at the intake of the second tower, Tamb is the temperature of the atmospheric air, Tin,t is the temperature of air exiting from the towers, and Tout,2 is the average temperature of air at the intake of the second cooling tower. Thus, if the temperature of air near the intake of the second tower is higher than the temperature of atmospheric air, then the fraction of the returned flow of the heated air produced by the first tower increases.

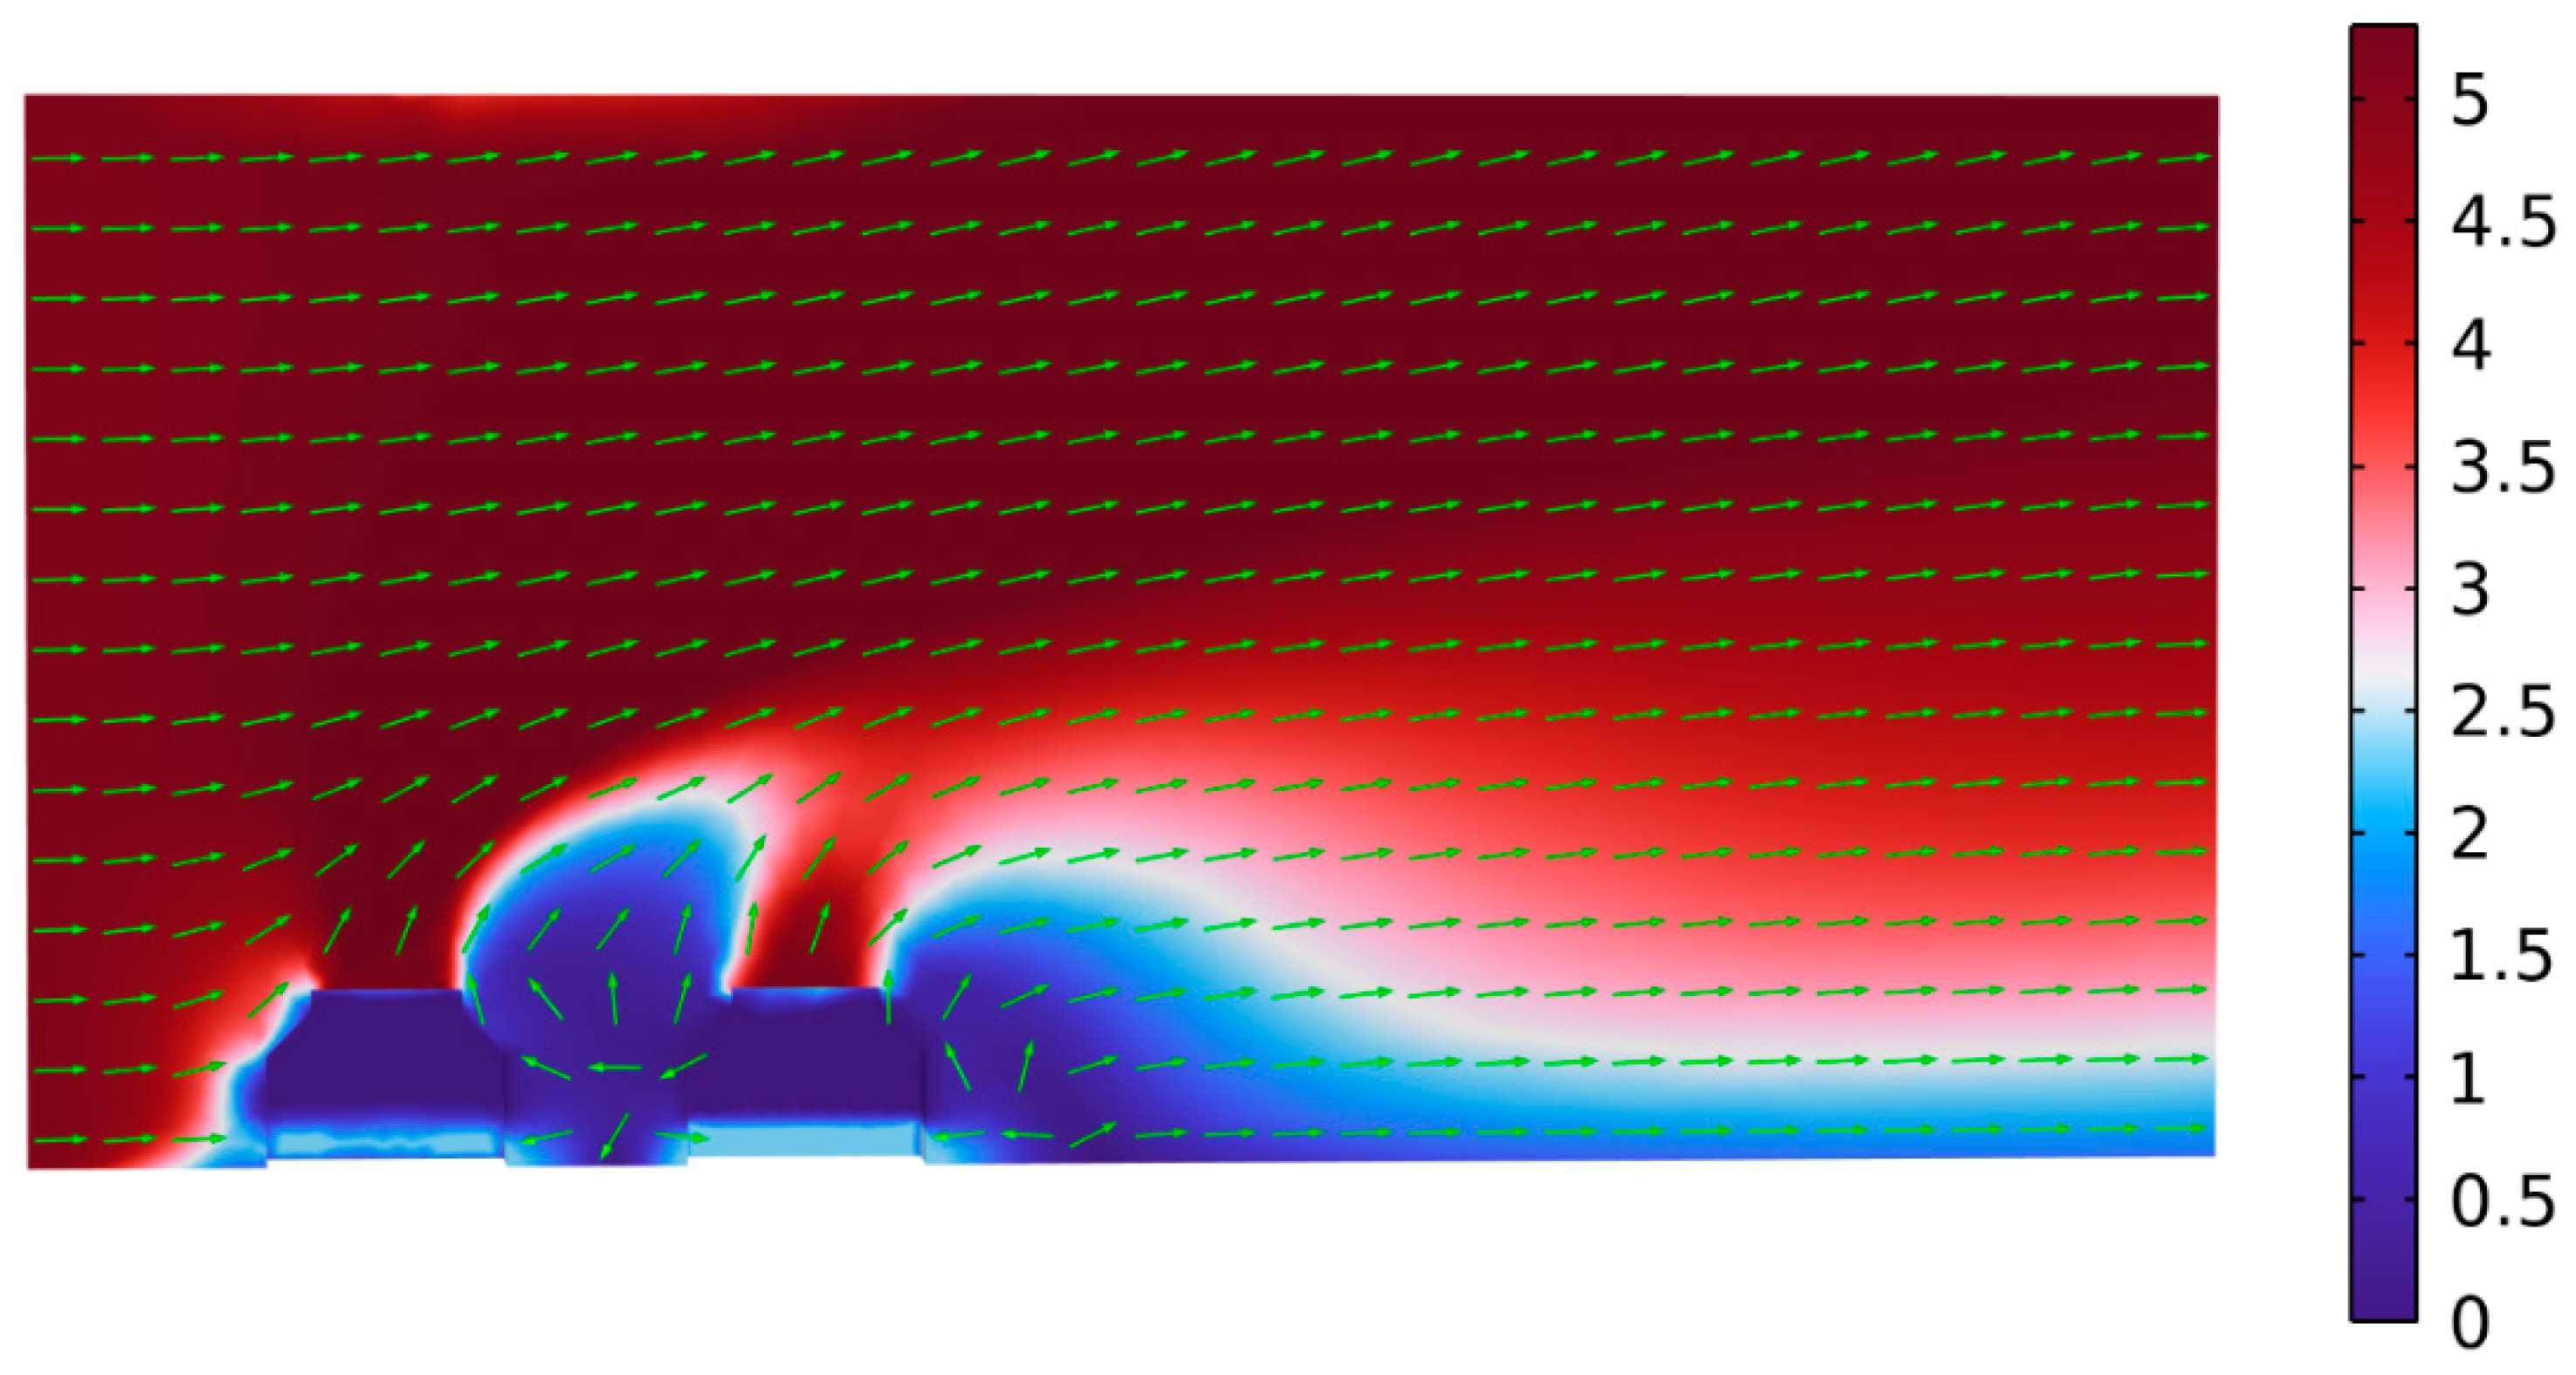
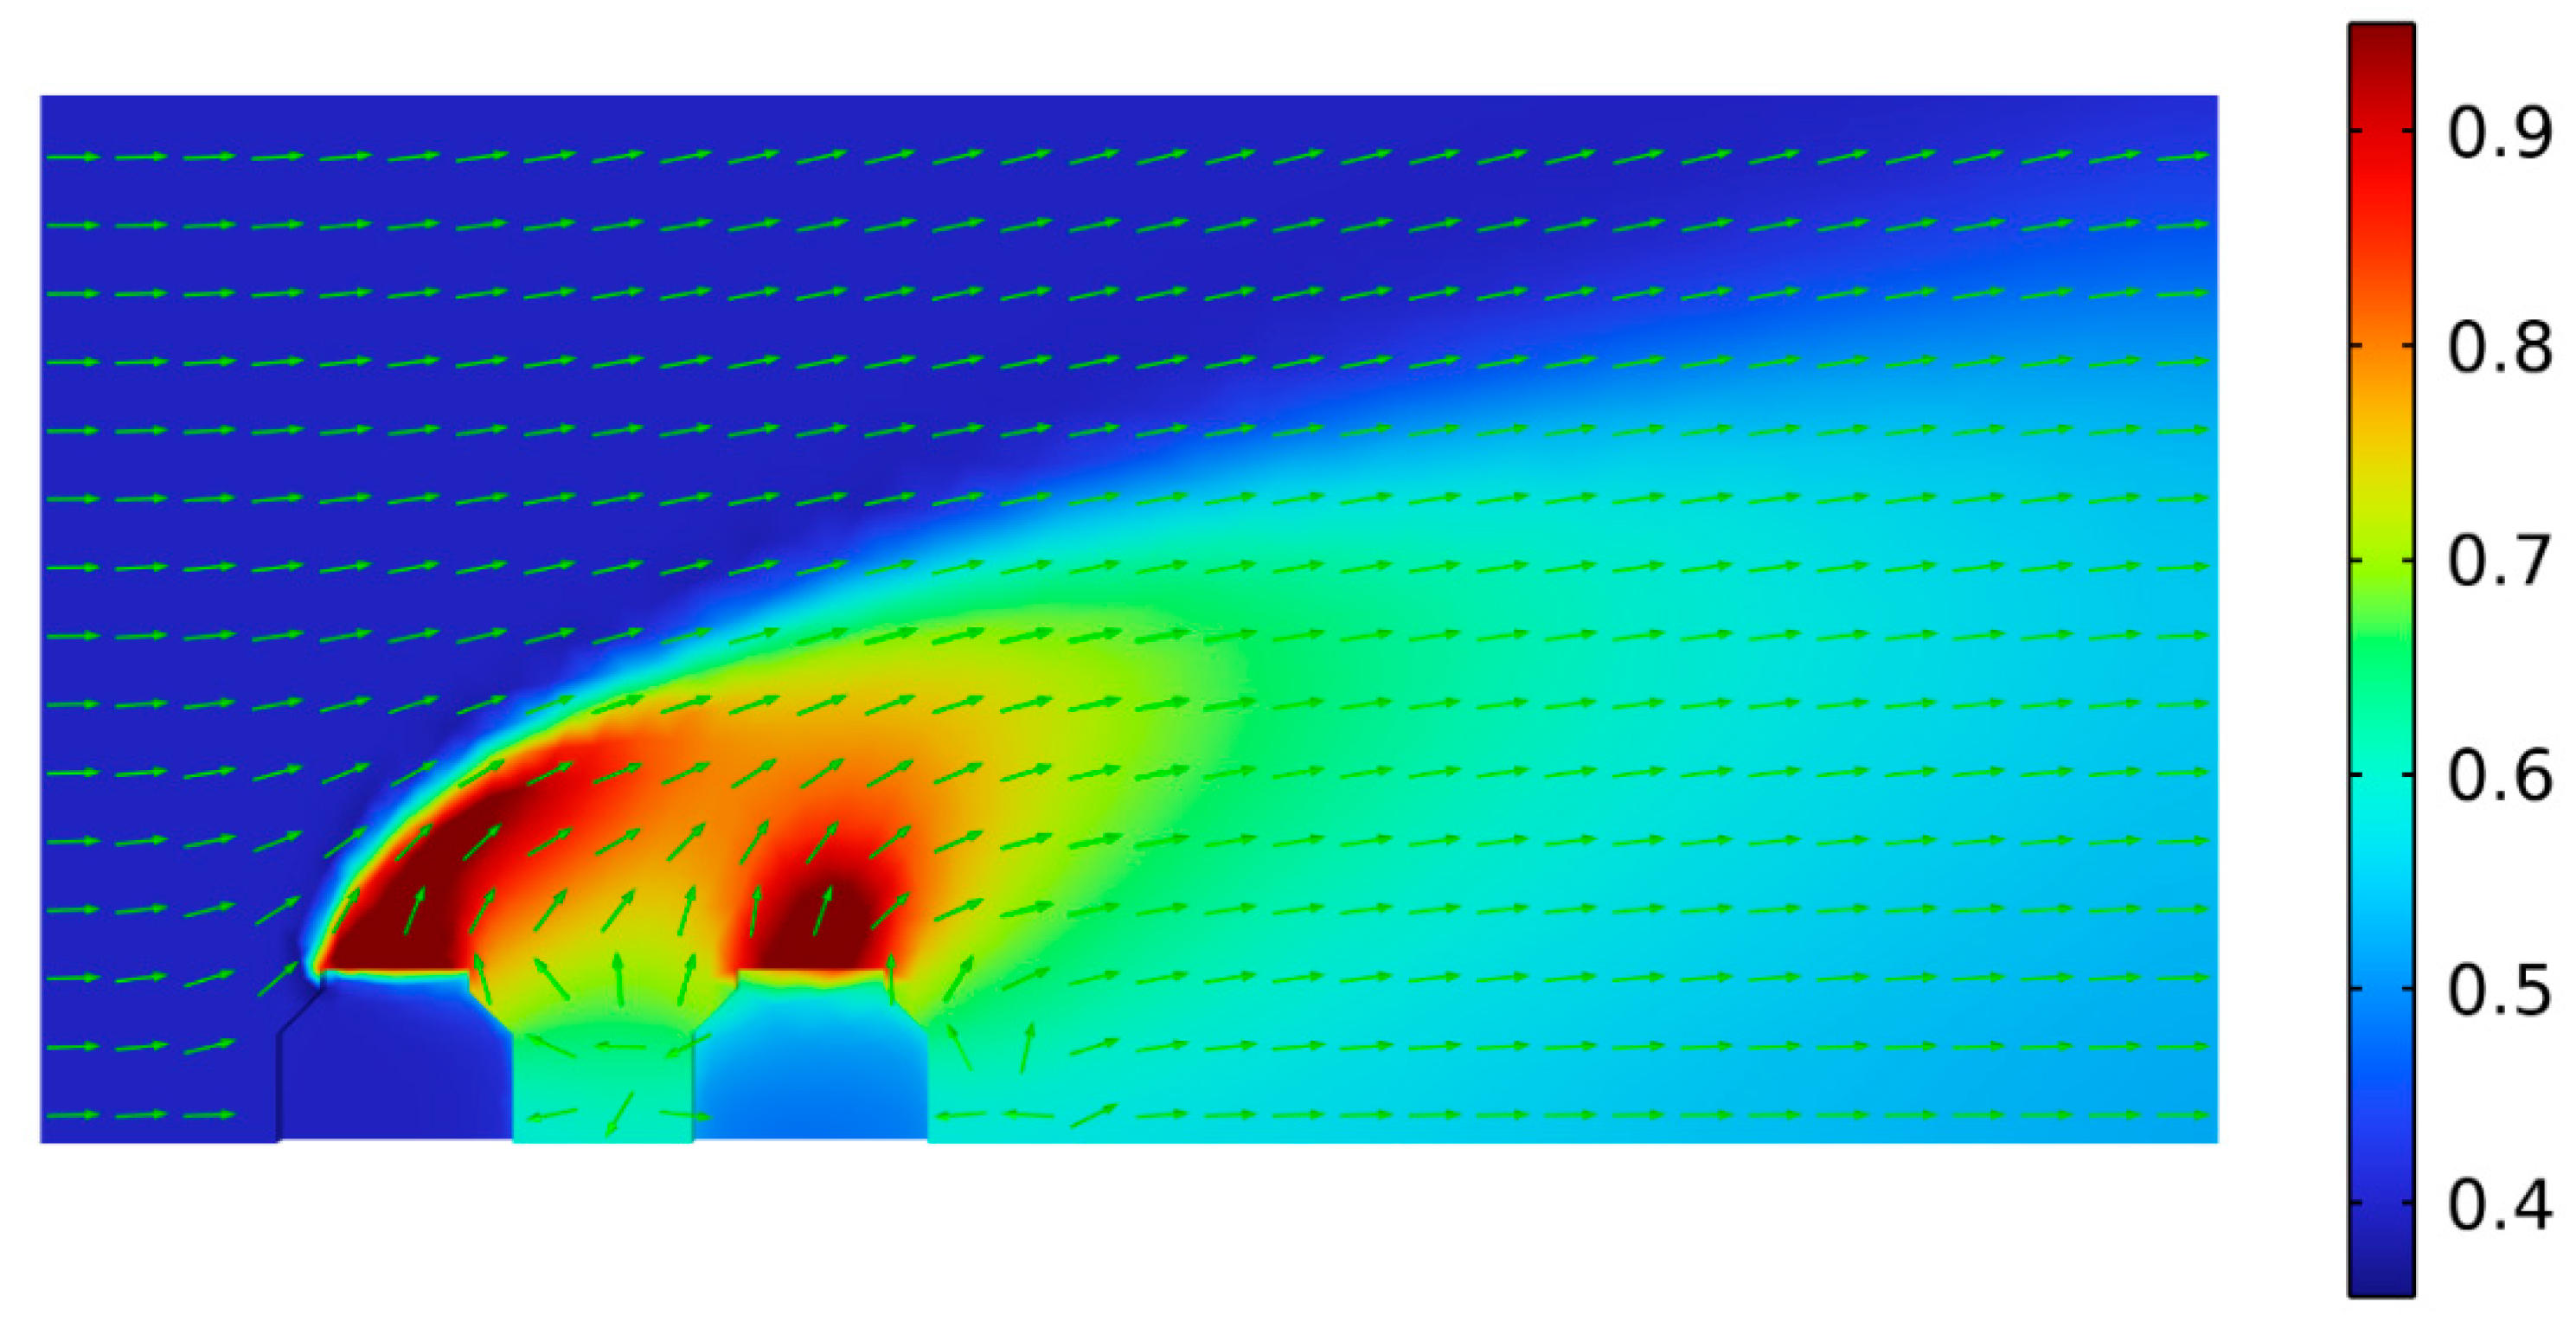
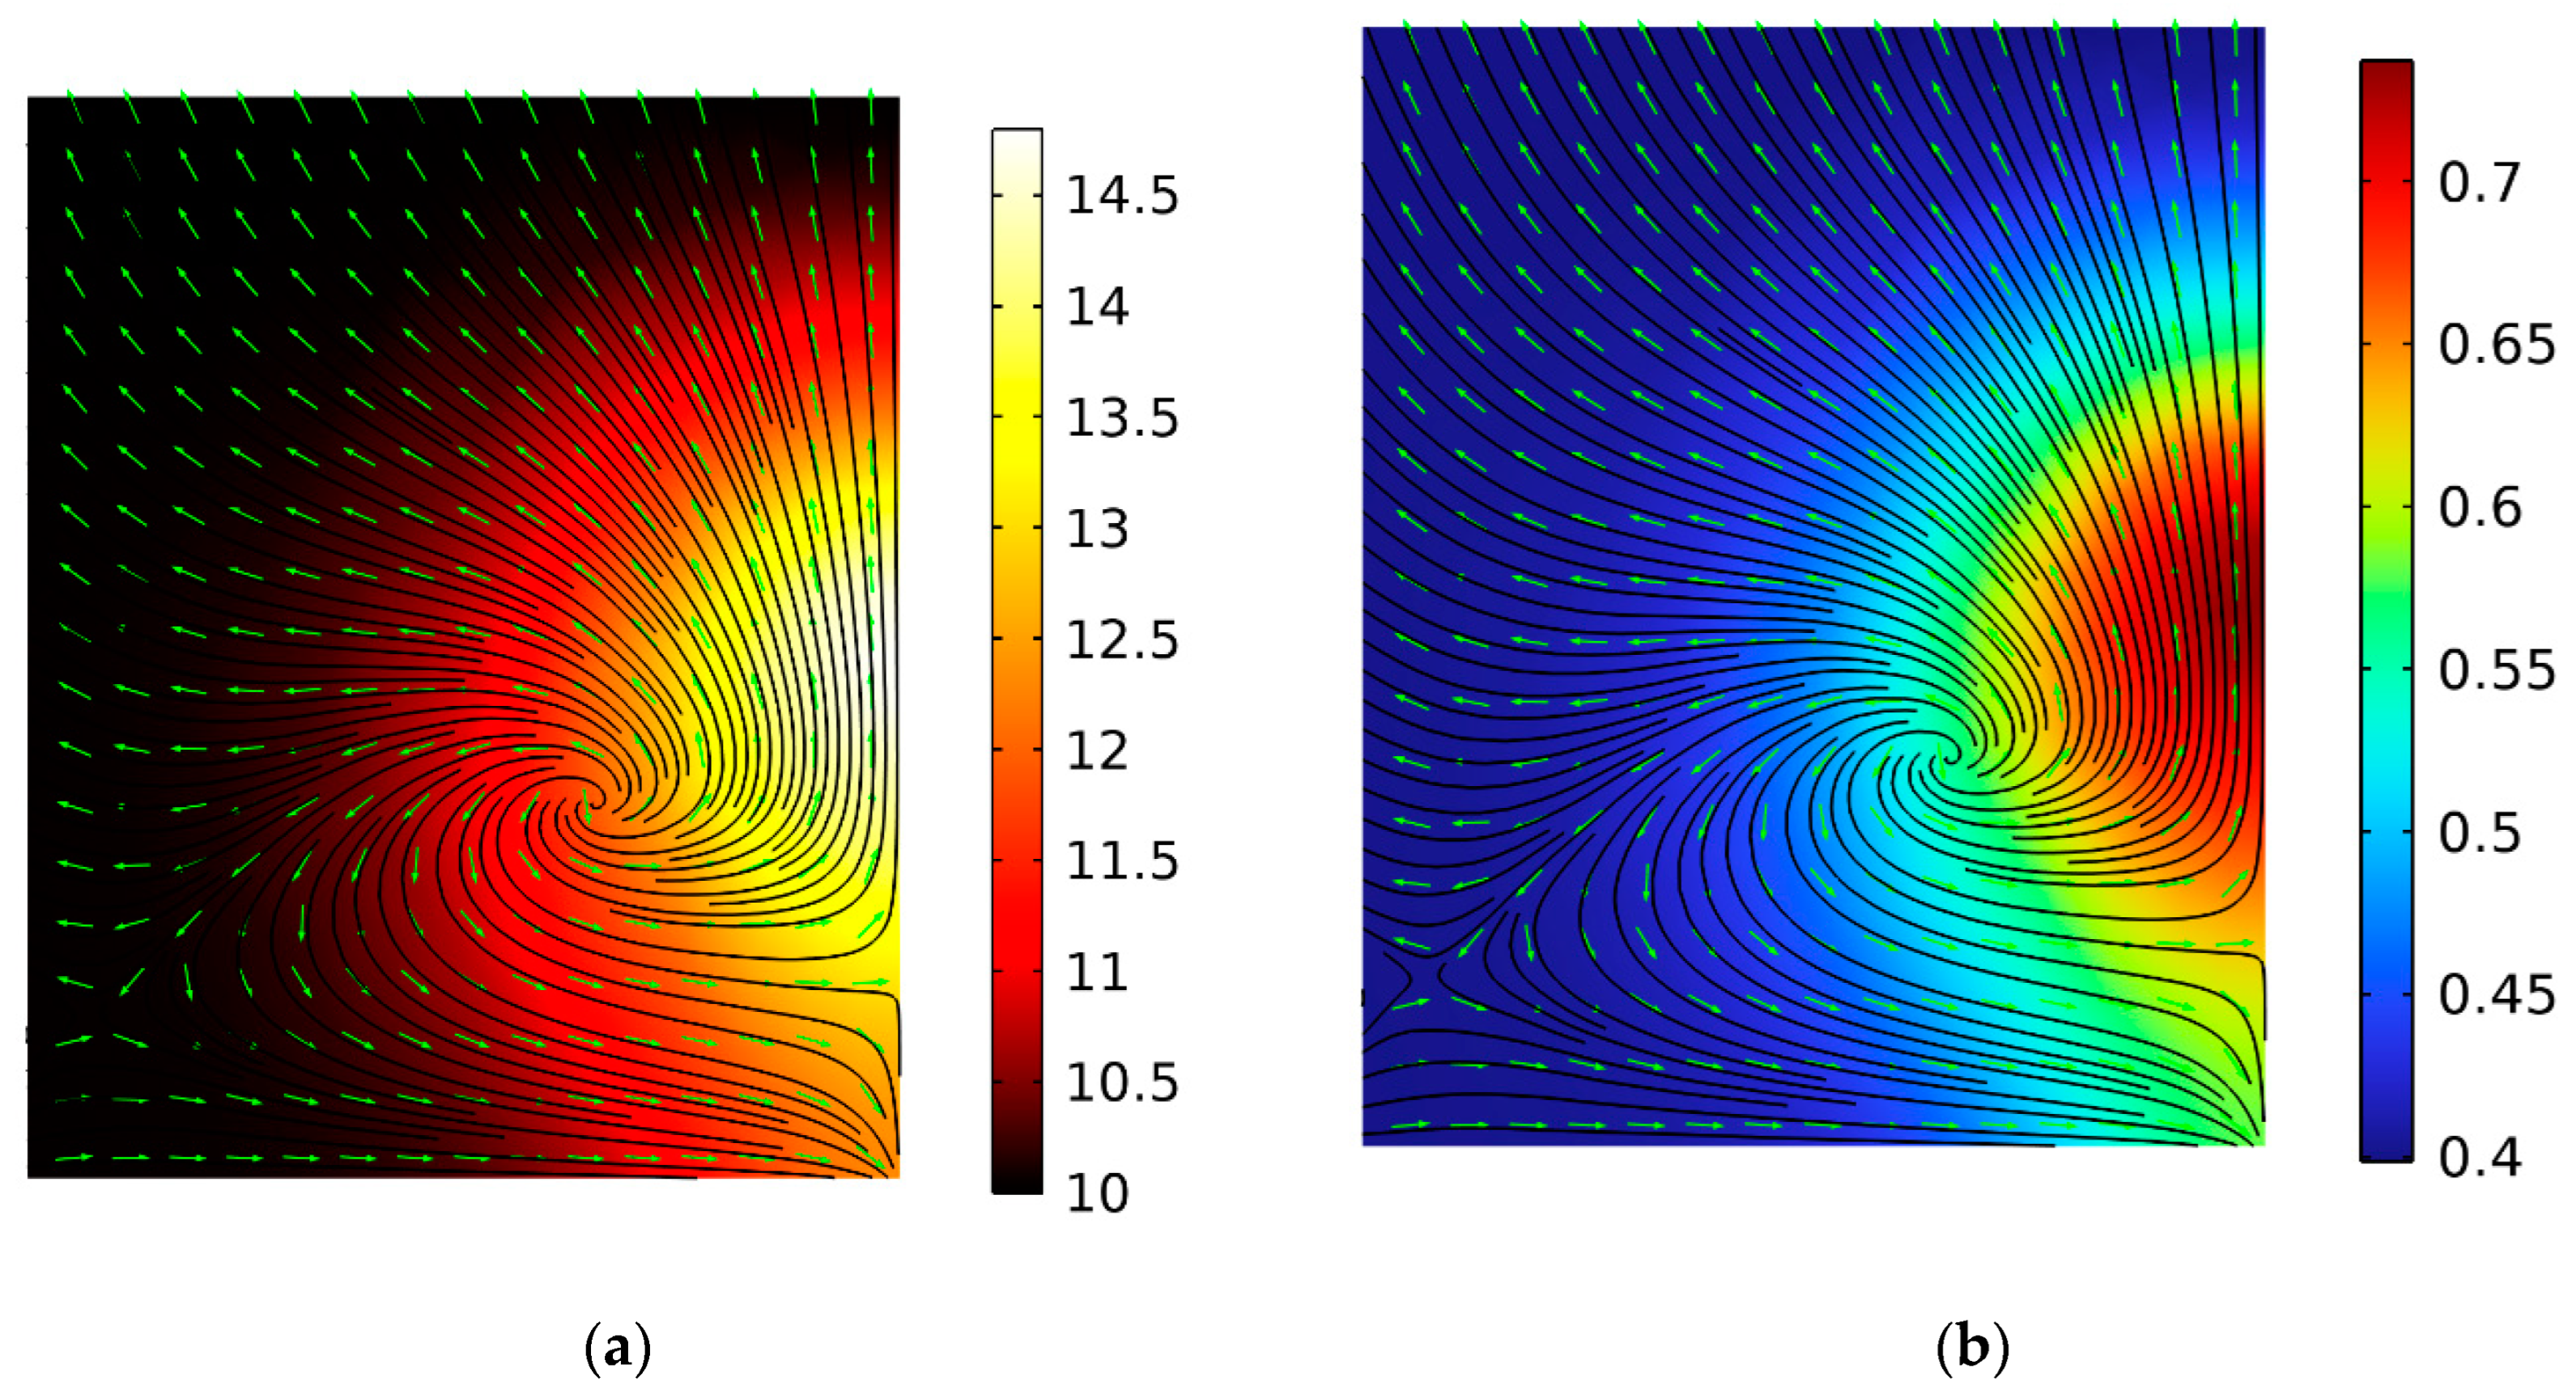
3.2. Simulation of Airflow for Two Cooling Towers

Figure 2, Figure 3 and Figure 4 demonstrate the characteristic distributions of the velocity V, temperature T, and relative humidity φ along the symmetry plane, which were obtained by solving the model using Equations (1)–(18) for the crosswind speed Vwind of 5.0 m/s. Figure 2 shows that the directions of the velocity vectors were affected by the crosswind speed, plumes coming from the top of the towers, and air outflow to the bottom of the towers. When the speed Vin,t of heated air exiting from the cooling towers was close to the crosswind speed Vwind, the velocity V was almost uniform above the towers. At the windward side of the first tower, the leeward side of the second tower, between the cooling towers, and behind the plumes of the towers, low-velocity regions were formed. At the bottom of the cooling towers, air flowed to the intakes of the cooling towers.
From Figure 3, it can be seen that the maximum temperature was reached near the exits of the cooling towers. A region with a high temperature of air was formed under the influence of the flow velocity. The temperature at the windward side of the first tower was close to the atmospheric air temperature. It can be supposed that, in this region, the conductive heat transfer was dominated by the convective one. At the same time, the high-temperature wake produced by the first tower merged with the plume of the second tower, leading to the heating of atmospheric air between towers and behind the leeward side of the second tower.
The relative humidity presented in Figure 4 had a similar qualitative distribution. In front of the windward side of the first tower, the relative humidity of the air remained steady. The maximum value was located near the exit holes of the cooling towers. The airflow induced the transport of moisture produced at the top of the towers into the space between towers and behind the leeward side of the second tower.
Figure 5a shows the temperature distribution, and Figure 5b presents the relative humidity distributions along the horizontal plane at the height of air intakes of the cooling towers. It can be seen that the crosswind freely blew onto the first tower; thus, the temperature and the relative humidity on the lateral side of the tower were close to the temperature and the relative humidity of the atmospheric air. The heated air was transferred by the crosswind from the lateral side of the first tower toward the second tower and in the region between the towers. The effect of the crosswind on the second tower was significantly weaker, which led to accumulation of the heated air. The temperature and the relative humidity on the lateral side of the second tower increased by about 1.8 °C and 14%, respectively, in comparison with the ambient temperature and relative humidity. Between the towers and behind the leeward side of the second tower, low-velocity regions were formed. In these regions, the crosswind influence was minor, with the temperature and the relative humidity reaching the maximum values of 12.7 °C and 61%, respectively.
Figure 6 demonstrates the temperature and the relative distributions along the vertical plane located in the middle of the distance between towers. Figure 7 illustrates the distributions of the same values but along the plane behind the leeward side of the second tower. Both figures display a similar qualitative distribution of the considered values. It can be observed that the air with the highest temperature rose vertically. Away from the cooling towers, large vortexes of the airflow were formed. The positions of the vortex centers were higher than the exits of the towers. The flow circulations indicate that a part of the heated air in regions between the towers and behind the leeward side of the second tower mixed with the atmospheric air and flowed back. Thus, if the mixing is not sufficiently intensive, these circulations could lead to extra convective heat transfer from the wakes of the towers into the windless regions.
Figure 8 demonstrates the variations of the volumetric rate q of the returned flow of heated air at the intake of the second tower depending on the tower spacing. The variations were computed using Equation (19) for the crosswind speed Vwind of 7.5 m/s, 5.0 m/s, and 2.5 m/s and the tower spacing of H/3, H/2, H, and 2H, where H = 6.57 m is the height of the cooling towers. The intakes were considered for only half of the second cooling tower.
The obtained results show that the increase in the crosswind caused a rise in the returned flow rate of the heated air. In the case of the closest distance between the towers (H/3), when the crosswind speed increased from 2.5 m/s (Figure 8a) to 7.5 m/s (Figure 8b), the returned flow rate of the heated air rises more than sevenfold. For the largest distance, the returned flow rate of the heated air was increased sixfold.
Under the crosswind speeds of 7.5 m/s (Figure 8a) and 5 m/s (Figure 8b) the amount of the heated air at the intake of the second tower decreased with the increase in the tower spacing. When the distance between the towers was equal to L and larger, the plot tended to be more horizontal. Thus, the increase in the distance between towers contributed to reducing the influence of the first tower on the second one. The increase in the crosswind speed from 5 m/s to 7.5 m/s led to an increase in the returned flow rate of the heated air by 1.4 times for the distance of H/3, and by 1.63 times for the distance of 2H.
For the crosswind speed of 2.5 m/s, the plot of the returned flow rate had another qualitative character (Figure 8c). When the distance between towers increased from H/3 to H/2, the returned flow rate decreased by 1.25 times. A further increase in the tower spacing led to a rise in the returned flow rate. The increment in the returned flow rate was 0.4% and 15% when the distance increased from H/2 to H and from H to 2H.
An explanation for the change in the plot trend can be found through an analysis of distributions of the velocity (Figure 9) and the temperature field (Figure 10). At the distance between the towers of H/3, the plume coming from the first tower with a speed of 5.1 m/s (Figure 9a) could protect the second tower from the crosswind. As a result, the heated air produced by the second tower rose almost vertically (Figure 10a). When the distance between towers increased to 2H, the protection possibility of the first tower was reduced, and the plume exiting from the second tower deflected more significantly (Figure 9b). This led to more intensive heat transfer toward the region behind the leeward side of the second tower (Figure 10b).
In the case of the small distances of H/3 and H/2 between the towers, the first tower protected the second one from the crosswind. Temperature increased in the region between towers due to the conductive heat transfer. This led to heating of the air intake of the second tower from the windward side. The increase in the distance between the towers led to a weakening of the conductive heat transfer from the first tower to the second one, thus reducing the temperature on the windward intake of the second tower. At the tower spacing of 2H, the effect of the first tower on the crosswind was reduced and the airflow induced the convective heat transfer toward the intake of the second tower from the leeward side.
In addition to temperature, which is included in Equation (19), the thermal efficiency of the cooling towers was significantly affected by the moisture contained in the air on the towers’ intakes. For this reason, variations of the moisture content on the air intakes of the second tower were studied depending on the crosswind speed and the tower spacing. The obtained variations are presented in Figure 11.
From Figure 11, it can be seen that a rise in the crosswind speed led to an increase in the moisture content on the air intakes of the second tower. When the crosswind speed increased from 2.5 m/s (Figure 11c) to 7.5 m/s (Figure 11a), the moisture content increased by 1.317 times for the distance of H/3, by 1.32 times for the distance of H/2, by 1.28 times for the distance of H, and by 1.25 times for the distance of 2H.
For the crosswind speeds of 7.5 m/s (Figure 11a) and 5.0 m/s (Figure 11b), the moisture content monotonically decreased with an increase in the tower spacing. The plots of the moisture content variations shown in Figure 11 had a similar qualitative behavior to the plots of the volumetric rate q of the heated air in Figure 8. The plots decline slowed down starting from the distance H. At the crosswind speed of 7.5 m/s (Figure 11a), a nonlinear decrease in the moisture content was observed within the range of the distances between H/3 and H.
At the crosswind speed of 2.5 m/s (Figure 11c), a dependency of the moisture content on the tower spacing showed behavior similar to the volumetric rate q of the returned flow. In the interval from H/3 to H, the moisture content decreased, after which it increased.
Figure 12 presents the distributions of the relative humidity for the distances between the cooling towers of H/3 and 2H at the crosswind speed of 2.5 m/s. The presented distributions were qualitatively similar to the temperature field shown in Figure 10. When the towers were close to each other (Figure 12a), the moisture accumulated in the air between the towers. As a result, the moisture content increased on the air intake from the windward side of the second tower. If the distance between the towers was 2H (Figure 12b), the first tower only slightly prevented the crosswind effect. The moisture contained in the plumes coming from the towers was transported by the crosswind at the intake from the leeward side of the second tower, whereas the relative humidity in the air between towers tended toward the atmospheric value.

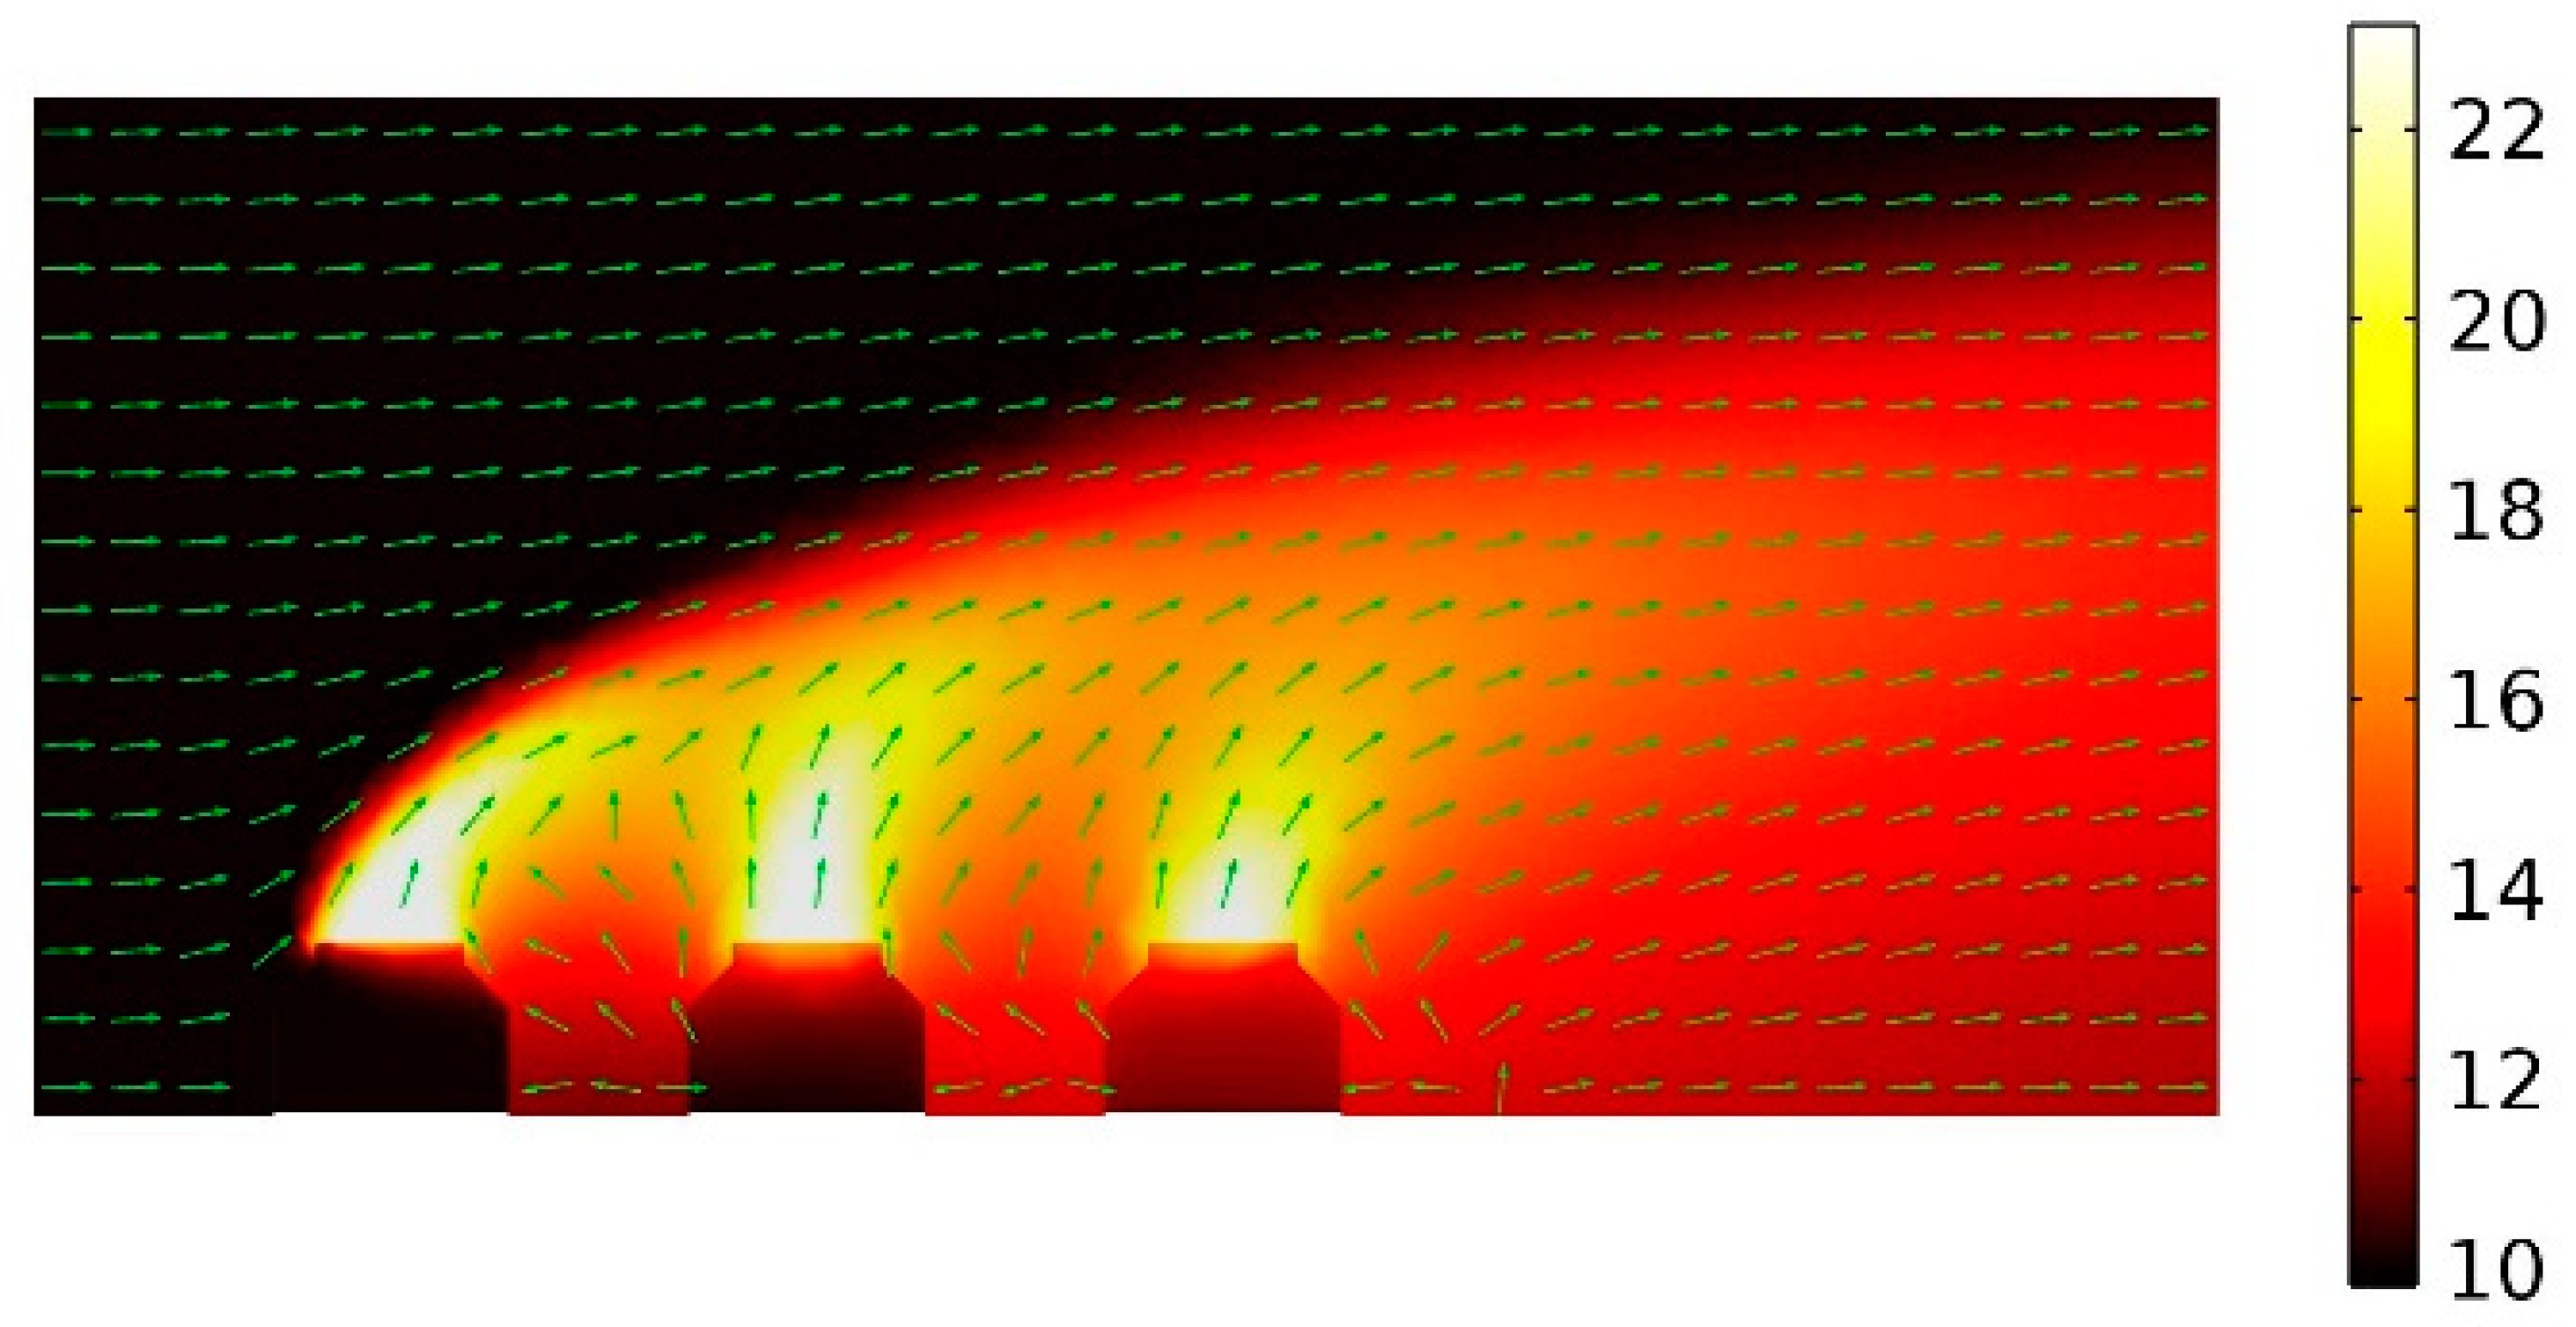
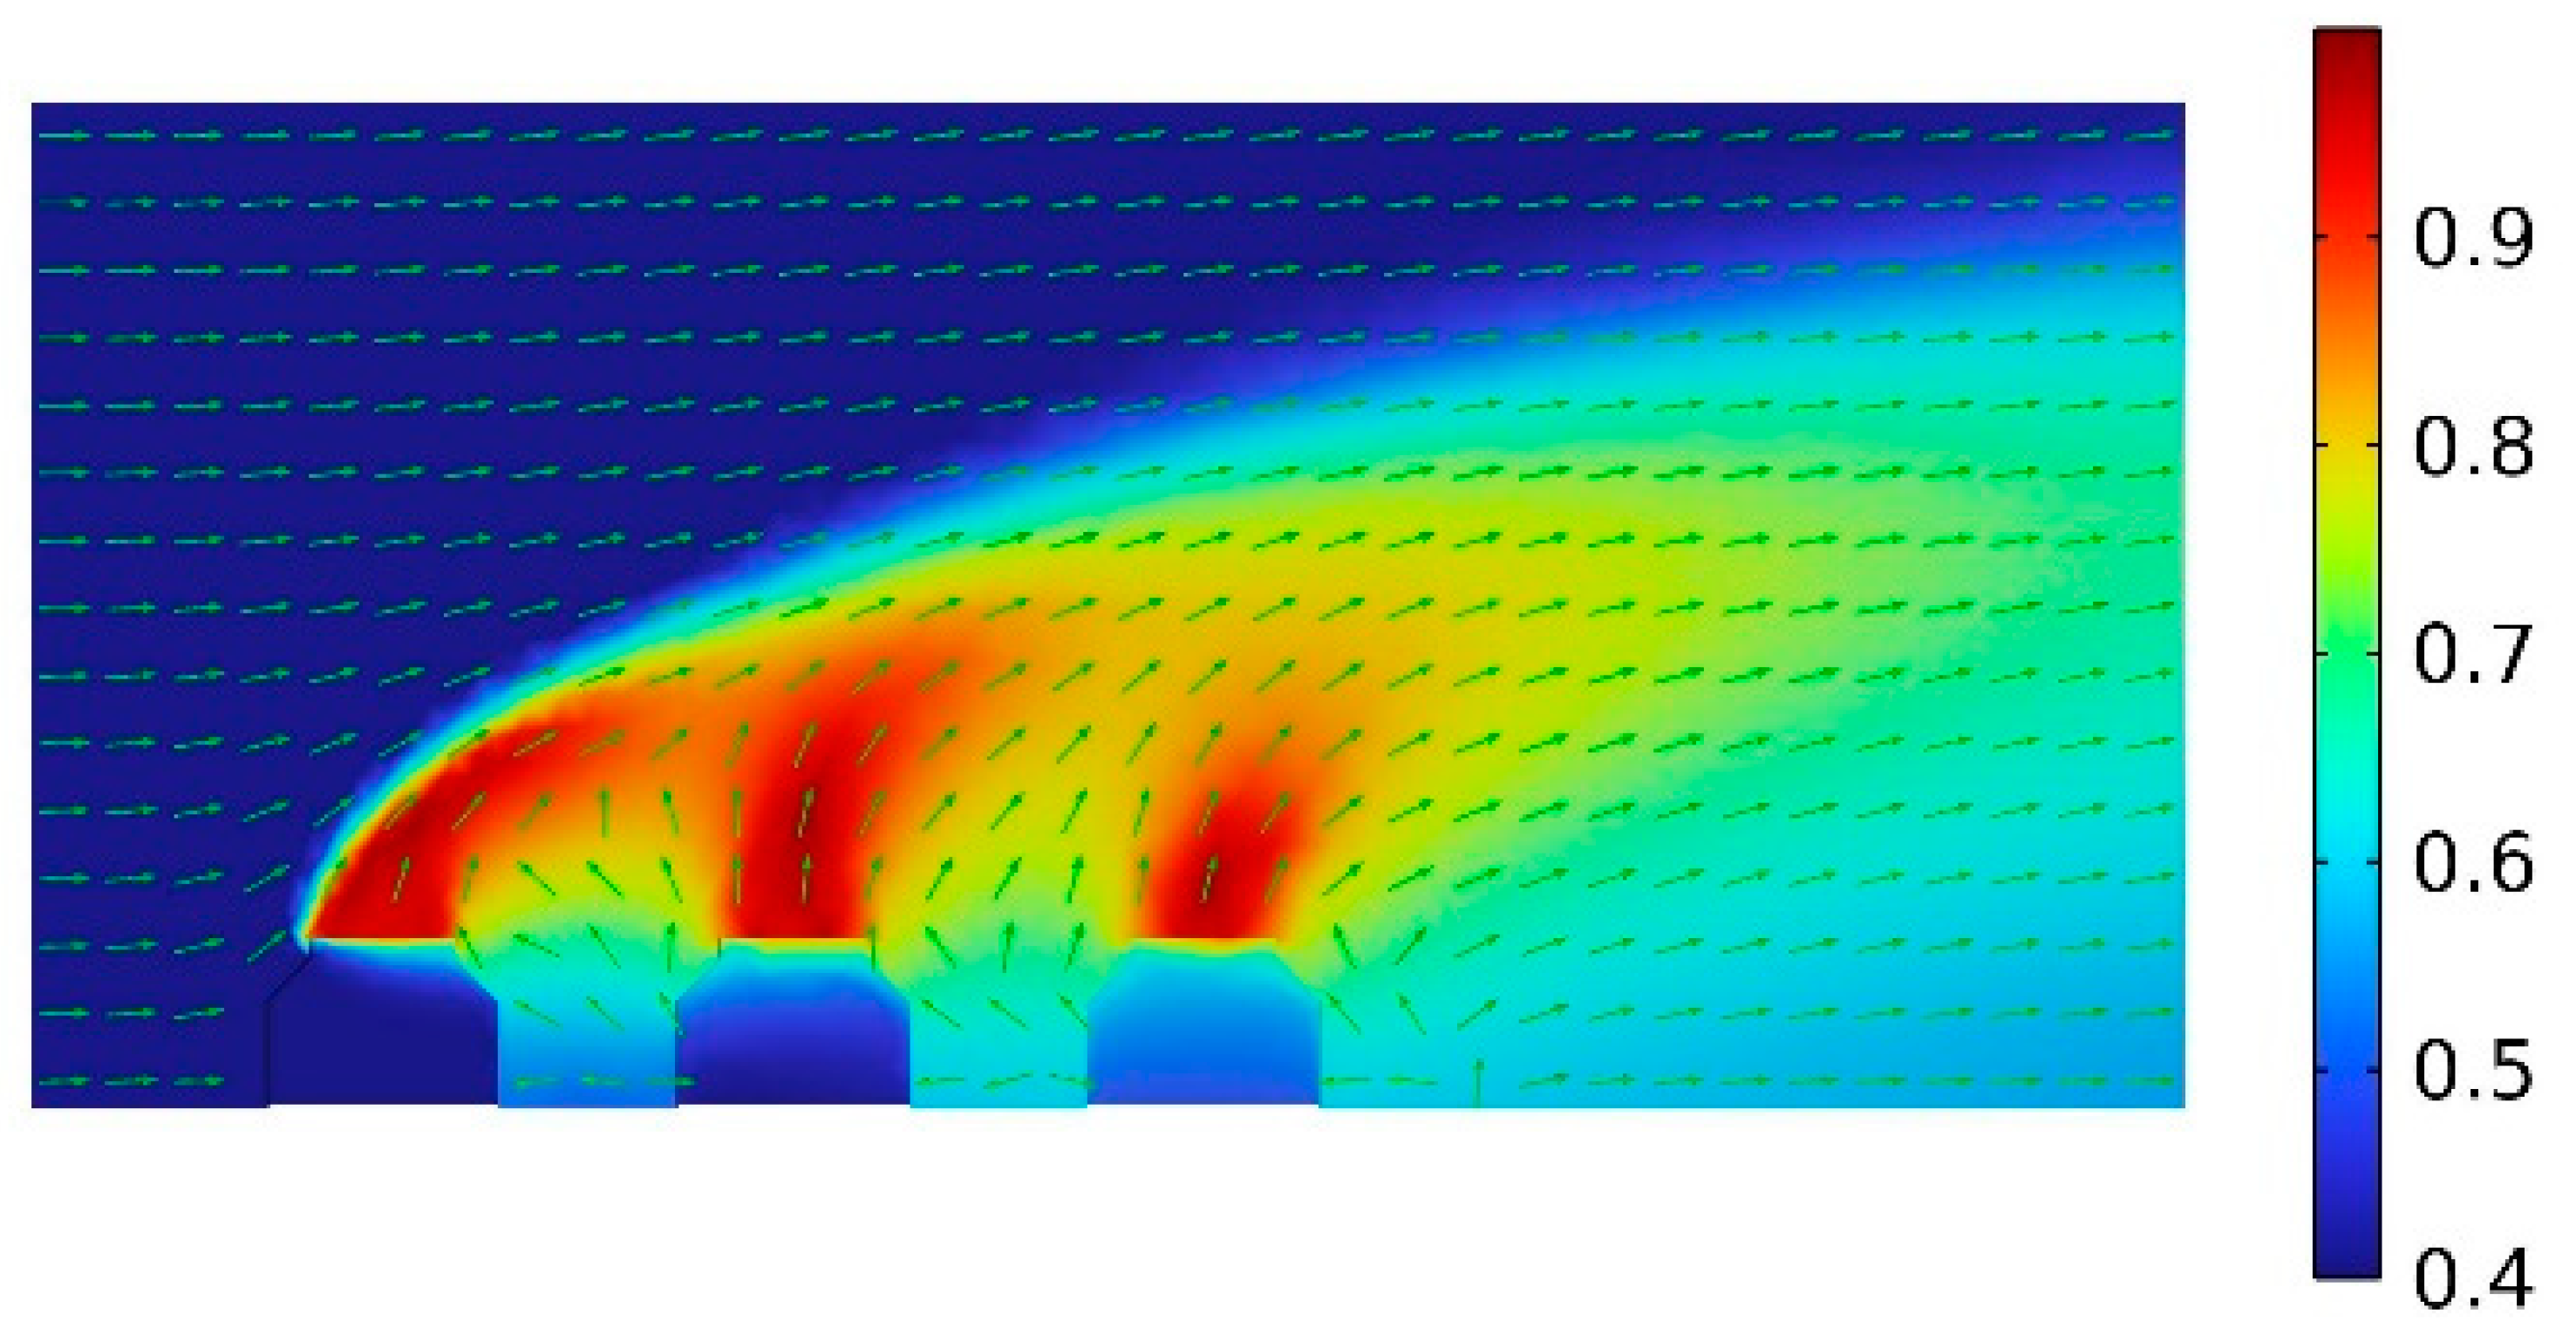
3.3. Simulation of Airflow for Three Cooling Towers

In the case of three cooling towers, distributions of the velocity V, the temperature T, and the relative moisture φ are presented in Figure 13, Figure 14 and Figure 15 along the symmetry plane for the tower spacing of H and the crosswind speed Vwind of 5.0 m/s. The presented distributions had similar qualitative characteristics to the distributions for the two cooling towers shown in Figure 2, Figure 3 and Figure 4. As the velocity of the plumes produced by the towers was close to the crosswind speed, the velocity of the airflow was uniform in most of the domain Figure 13. The direction of the deflections of the plumes coincided with direction of the crosswind. Between the towers and on the leeward side of the third tower, low-velocity regions were formed.
The temperature (Figure 14) and the relative humidity (Figure 15) on the air intakes increased as the flow passed through the towers. On the windward side of the first cooling tower, the temperature and the relative humidity were equal to the atmospheric values. Under the effect of the crosswind, the heated air exiting from the first tower flowed toward the second one, which led to convective heat transfer and moisture transport into the region between towers. The wake from the first tower interfered with the plume coming from the second tower; thus, the amount of the heated air that moved toward the third tower increased. As a result, the temperature and the relative humidity in the region between the second and the third towers increased more significantly.
Table 2 contains values of the volumetric rate q of the returned flow of heated air estimated for the two and three cooling towers for the distance between towers of H and the crosswind speed of 5.0 m/s. The obtained results allow one to conclude that the increase in the number of cooling towers led to a rise in the returned flow rate. When an additional cooling tower is considered from the leeward side of the second cooling tower, the returned flow rate increased by 39%. In comparison to the estimation of the returned flow rate for the second tower in the case of two towers, the estimation of the returned flow rate for the third tower increased by 286% in the case of three towers. The result is in agreement with the distributions presented in Figure 14 and Figure 15. The distributions show that the temperature and the relative humidity of air at the intakes of the third tower were higher than those of the other towers.

4. Conclusions

In this study, three-dimensional numerical simulations of the non-isothermal turbulent flow of moist air around cooling towers were carried out using a CFD model. The proposed model included the RANS equations, the k–ω turbulence model, and heat transfer and moisture transfer equations. Computer implementation of the model was performed using the Comsol Multiphysics® 5.4 software, COMSOL Group, Stockholm, Sweden, 1998–2018. The geometry of the computational domain was built in compliance with the sizes of the cooling towers provided by the technical documentation. The scheme of the boundary conditions took into account the crosswind speed and flow characteristics of heated air coming from the cooling towers. Parameters for the boundary conditions were assigned according to engineering measurements conducted on an industrial site of an operating potash mine.
The results of the multiparametric numerical simulations of aerodynamic behavior around the two cooling towers were analyzed for different crosswind speeds and tower spacing. Above the exits of the towers, a region of air with maximum temperature and relative humidity was formed. In this region, convective heat transfer and moisture transport evolved under the effect of the crosswind and airflow produced by the towers. The crosswind deflected the plume exiting from the upstream tower toward the downstream tower. On the downstream tower, the influence of the crosswind was reduced due to the protection of the upstream tower. Low-velocity regions were formed between the towers and behind the leeward side of the downstream tower. In these regions, high-temperature moist air accumulated due to diffusion and convection processes. For the considered values of the tower spacing, an increase in the crosswind speed induced a rise in the temperature and the moisture content of air at intakes of the downstream tower. Therefore, the crosswind contributed to heat transfer and moisture transport toward the downstream tower. For the crosswind speeds of 5.0 m/s and 7.5 m/s, an increase in the tower spacing led to a decrease in the volumetric flow rate of the heated air at the intakes of the second tower. When the tower distance increased sixfold, the volumetric flow rate at the intakes of the second tower decreased by 7% for the crosswind speed of 5.0 m/s and by 6% for the crosswind speed of 7.5 m/s. However, for the crosswind speed of 2.5 m/s, the increase in the distance between towers could lead to an increase in the temperature and the moisture content at the intakes of the second tower. This may be related to a weaker protection of the downstream tower by the upstream tower with an increase in the distance between them. The crosswind induced a more significant deflection of the plume exiting from the downstream tower. As a result, more heated air flowed to the intake of the downstream tower from the leeward side.
An increase in the number of cooling towers from two to three caused a rise in the temperature and moisture content of air at the intakes. The volumetric flow rate of the heated air at the intakes of downstream towers also significantly increased. In the case of three cooling towers, the flow rate increased by 39% at the intakes of the second tower and by 239% at the intakes of the third tower in comparison with the case of two cooling towers. The volumetric flow rate of the heated air at the intakes of downstream towers also significantly increased in comparison with the case of two cooling towers. In addition, the qualitative characteristics of distributions of the temperature and the relative humidity did not change.

Author Contributions

Conceptualization, O.P. and A.Z.; methodology, M.Z. and A.K.; software, M.Z. and A.K.; validation, M.Z., A.K. and A.Z.; formal analysis, M.Z. and D.O.; investigation, M.Z. and A.K.; resources, O.P.; data curation, D.O.; writing—original draft preparation, M.Z. and A.K.; writing—review and editing, M.Z.; visualization, A.K.; supervision, O.P.; project administration, O.P. and A.Z.; funding acquisition, A.Z. All authors have read and agreed to the published version of the manuscript.

Funding

The research was carried out within the state assignment of Ministry of Science and Higher Education of the Russian Federation (theme No. 122012400263-7).

Institutional Review Board Statement

Not applicable.

Informed Consent Statement

Not applicable.

Conflicts of Interest

The authors declare no conflict of interest.

References

  1. Hill, G.B.; Pring, E.J.; Osborn, P.D. Cooling Towers: Principles and Practice; Butterworth-Heinemann: London, UK; Boston, MA, USA, 1990. [Google Scholar]
  2. García Cutillas, C.; Ruiz Ramírez, J.; Manuel Lucas, M. Optimum design and operation of an HVAC cooling tower for energy and water conservation. Energies 2017, 10, 299. [Google Scholar] [CrossRef]
  3. Zaitsev, A.V.; Levin, L.Y.; Butakov, S.V.; Semin, M.A. Normalization of microclimate in deep potash mines. Gorn. Zhurnal 2018, 8, 97–102. [Google Scholar] [CrossRef]
  4. Li, X.; Gurgenci, H.; Guan, Z.; Wang, X.; Xia, L. A review of the crosswind effect on the natural draft cooling towers. Appl. Therm. Eng. 2019, 150, 250–270. [Google Scholar] [CrossRef]
  5. Li, X.; Gurgenci, H.; Guan, Z.; Wang, X.; Duniam, S. Measurements of crosswind influence on a natural draft dry cooling tower for a solar thermal power plant. Appl. Energy 2017, 206, 1169–1183. [Google Scholar] [CrossRef]
  6. Ruiz, J.; Cutillas, C.G.; Kaiser, A.S.; Ballesta, M.; Zamora, B.; Lucas, M. Experimental study of drift deposition from mechanical draft cooling towers in urban environments. Energy Build. 2016, 125, 181–195. [Google Scholar] [CrossRef]
  7. Dang, Z.; Gao, M.; Long, G.; Zou, J.; He, S.; Sun, F. Crosswind influence on cooling capacity in different zones for high level water collecting wet cooling towers based on field test. J. Wind Eng. Ind. Aerodyn. 2019, 190, 134–142. [Google Scholar] [CrossRef]
  8. Gao, M.; Sun, F.Z.; Turan, A. Experimental study regarding the evolution of temperature profiles inside wet cooling tower under crosswind conditions. Int. J. Therm. Sci. 2014, 86, 284–291. [Google Scholar] [CrossRef]
  9. He, S.; Zhang, G.; Gao, M.; Sun, F.; Huang, X. Wind tunnel test on the flow resistance of U-type water collecting devices for natural draft wet cooling towers. J. Wind Eng. Ind. Aerodyn. 2019, 186, 234–240. [Google Scholar] [CrossRef]
  10. Yang, L.J.; Chen, L.; Du, X.Z.; Yang, Y.P. Effects of ambient winds on the thermo-flow performances of indirect dry cooling system in a power plant. Int. J. Therm. Sci. 2013, 64, 178–187. [Google Scholar] [CrossRef]
  11. Su, M.D.; Tang, G.F.; Fu, S. Numerical simulation of fluid flow and thermal performance of a dry-cooling tower under cross wind condition. J. Wind Eng. Ind. Aerodyn. 1999, 79, 289–306. [Google Scholar] [CrossRef]
  12. Al-Waked, R.; Behnia, M. The performance of natural draft dry cooling towers under crosswind: CFD study. Int. J. Energy Res. 2004, 28, 147–161. [Google Scholar] [CrossRef]
  13. Chen, L.; Yang, L.; Du, X.; Yang, Y. Performance improvement of natural draft dry cooling system by interior and exterior windbreaker configurations. Int. J. Heat Mass Transf. 2016, 96, 42–63. [Google Scholar] [CrossRef]
  14. Shirazi, M.; Jahangiri, A. 3D numerical study using three novel windbreak walls in natural draft dry cooling towers for performance enhancement under various crosswind conditions. Therm. Sci. Eng. Prog. 2021, 25, 100971. [Google Scholar] [CrossRef]
  15. Dong, P.; Li, X. A novel method integrating windbreak walls with water distribution to mitigate the crosswind effects on natural draft dry cooling towers. J. Wind Eng. Ind. Aerodyn. 2020, 205, 104318. [Google Scholar] [CrossRef]
  16. Ma, H.; Si, F.; Zhu, K.; Wang, J. The adoption of windbreak wall partially rotating to improve thermo-flow performance of natural draft dry cooling tower under crosswind. Int. J. Therm. Sci. 2018, 134, 66–88. [Google Scholar] [CrossRef]
  17. Wu, T.; Ge, Z.; Yang, L.; Du, X. Flow deflectors to release the negative defect of natural wind on large scale dry cooling tower. Int. J. Heat Mass Transf. 2019, 128, 248–269. [Google Scholar] [CrossRef]
  18. Goodarzi, M.; Ramezanpour, R. Alternative geometry for cylindrical natural draft cooling tower with higher cooling efficiency under crosswind condition. Energy Convers. Manag. 2014, 77, 243–249. [Google Scholar] [CrossRef]
  19. Liao, H.T.; Yang, L.J.; Du, X.Z.; Yang, Y.P. Influences of height to diameter ratios of dry-cooling tower upon thermo-flow characteristics of indirect dry cooling system. Int. J. Therm. Sci. 2015, 94, 178–192. [Google Scholar] [CrossRef]
  20. Chen, L.; Liao, H.T.; Huang, X.W.; Yang, L.J.; Du, X.Z.; Yang, Y.P. Thermo-flow characteristics of indirect dry cooling system with elliptically arranged heat exchanger bundles around a traditional circular cooling tower. Appl. Therm. Eng. 2017, 121, 419–430. [Google Scholar] [CrossRef]
  21. Li, Z.; Wei, H.; Wu, T.; Du, X. Optimization for Circulating Cooling Water Distribution of in-Direct Dry Cooling System in a Thermal Power Plant under Crosswind Condition with Evolution Strategies Algorithm. Energies 2021, 14, 1167. [Google Scholar] [CrossRef]
  22. Kashani, M.M.; Dobrego, K.V. Influence of flow rotation within a cooling tower on the aerodynamic interaction with crosswind flow. J. Eng. Phys. Thermophys. 2014, 87, 385–393. [Google Scholar] [CrossRef]
  23. Zhao, Y.; Sun, F.; Long, G.; Huang, X.; Huang, W.; Lyv, D. Comparative study on the cooling characteristics of high level water collecting natural draft wet cooling tower and the usual cooling tower. Energy Convers. Manag. 2016, 116, 150–164. [Google Scholar] [CrossRef]
  24. Chen, X.; Sun, F.; Chen, Y.; Gao, M. Novel method for improving the cooling performance of natural draft wet cooling towers. Appl. Therm. Eng. 2019, 147, 562–570. [Google Scholar] [CrossRef]
  25. Zhang, D.; Chen, R.; Zhang, Z.; He, S.; Gao, M. Crosswind influence on heat and mass transfer performance for wet cooling tower equipped with an axial fan. Case Stud. Therm. Eng. 2021, 27, 101259. [Google Scholar] [CrossRef]
  26. Zhang, D.; Wang, N.; Li, J.; Li, J.; He, S.; Gao, M. Effect of forced ventilation on the thermal performance of wet cooling towers. Case Stud. Therm. Eng. 2022, 35, 102116. [Google Scholar] [CrossRef]
  27. Zhang, Z.; Wang, M.; Liu, Y.; Gao, M.; He, S.; Shi, Y. An exploratory research on performance improvement of super-large natural draft wet cooling tower based on the reconstructed dry-wet hybrid rain zone, part 2: Crosswind effects. Int. J. Heat Mass Transf. 2020, 160, 120225. [Google Scholar] [CrossRef]
  28. Zhang, Z.; Wang, M.; Wang, Y.; He, S.; Gao, M. Influences of dry-wet hybrid rain zone on the heat and mass transfer characteristics of wet cooling towers: A case study. Case Stud. Therm. Eng. 2022, 30, 101784. [Google Scholar] [CrossRef]
  29. Jiang, L.; Han, Q.; Wang, N.; Gao, M.; He, S.; Guan, H.; Tan, X. The effects of water droplet diameter distribution in the rain zone on the cooling capacity and water-splashing noise for natural draft wet cooling towers. Int. J. Therm. Sci. 2021, 164, 106875. [Google Scholar] [CrossRef]
  30. Al-Waked, R. Crosswinds effect on the performance of natural draft wet cooling towers. Int. J. Therm. Sci. 2010, 49, 218–224. [Google Scholar] [CrossRef]
  31. Khamooshi, M.; Anderson, T.N.; Nates, R.J. A numerical study on interactions between three short natural draft dry cooling towers in an in-line arrangement. Int. J. Therm. Sci. 2021, 159, 106505. [Google Scholar] [CrossRef]
  32. Xiong, X.; Li, L.; Zhou, X.Q. Numerical Analysis and Optimization Research on Backflow Effect of Cooling Tower. Procedia Eng. 2017, 205, 2003–2010. [Google Scholar] [CrossRef]
  33. Kutateladze, S.S. Fundamentals of the Theory of Heat Transfer; Edward Arnold: London, UK, 1963. [Google Scholar]
  34. Goodarzi, M.A. Proposed stack configuration for dry cooling tower to improve cooling efficiency under crosswind. J. Wind Eng. Ind. Aerodyn. 2010, 98, 858–863. [Google Scholar] [CrossRef]
  35. Anderson, D.A.; Tannehill, J.C.; Pletcher, R.H. Computational Fluid Mechanics and Heat Transfer; Taylor & Francis: Boca Raton, FL, USA, 2016. [Google Scholar]
  36. Wilcox, D.C. Turbulence Modeling for CFD, 2nd ed.; DCW Indus.: La Cañada, CA, USA, 1998. [Google Scholar]
  37. Wilcox, D.C. Formulation of the kw turbulence model revisited. AIAA J. 2008, 46, 2823–2838. [Google Scholar] [CrossRef]
  38. Comsol 5.4 CFD Module User’s Guide. Available online: https://doc.comsol.com/5.4/doc/com.comsol.help.cfd/CFDModuleUsersGuide.pdf (accessed on 25 September 2022).
  39. Bird, R.B.; Stewart, W.E.; Lightfoot, E.N. Transport Phenomena, 2nd ed.; John Wiley & Sons: New York, NY, USA, 2007. [Google Scholar]
  40. Tsilingiris, P.T. Thermophysical and transport properties of humid air at temperature range between 0 and 100 °C. Energy Convers. Manag. 2008, 49, 1098–1110. [Google Scholar] [CrossRef]
  41. Comsol 5.4 Heat Transfer. User’s Guide. Available online: https://doc.comsol.com/5.4/doc/com.comsol.help.heat/HeatTransferModuleUsersGuide.pdf (accessed on 25 September 2022).
  42. Monteith, J.L.; Unsworth, M.H. Principles of Environmental Physics; Edward Arnold: London, UK, 1990. [Google Scholar]
  43. Hughes, T.J.R.; Mallet, M. A New Finite Element Formulation for Computational Fluid Dynamics: III. The Generalized Streamline Operator for Multidimensional Advective-Diffusive System. Comput. Methods Appl. Mech. Eng. 1986, 58, 305–328. [Google Scholar] [CrossRef]
  44. Hauke, G.; Hughes, T.J.R. A Unified Approach to Compressible and Incompressible Flows. Comput. Methods Appl. Mech. Eng. 1994, 113, 389–395. [Google Scholar] [CrossRef]
Figure 1. The geometry scheme of the computational domain.
Fluids 07 00317 g001
Figure 2. The distribution of velocity V (m/s) (magnitude and direction) under a crosswind speed of 5.0 m/s along the symmetry plane.
Fluids 07 00317 g002
Figure 3. The distribution of temperature T (°C) under a crosswind speed of 5.0 m/s along the symmetry plane.
Fluids 07 00317 g003
Figure 4. The distribution of relative humidity φ [1] under a crosswind speed of 5.0 m/s along the symmetry plane.
Fluids 07 00317 g004
Figure 5. (a) Distribution of temperature T (°C) under a crosswind speed of 5.0 m/s along the horizontal plane at the height of air intakes of the cooling towers. (b) Distribution of the relative humidity φ [1] under a crosswind speed of 5.0 m/s along the horizontal plane at the height of air intakes of the cooling towers.
Fluids 07 00317 g005
Figure 6. (a) Distribution of temperature T (°C) under a crosswind speed of 5.0 m/s along the vertical plane passing at the middle of the distance between the towers. (b) Distribution of the relative humidity φ [1] under a crosswind speed of 5.0 m/s along the vertical plane passing at the middle of the distance between the towers.
Fluids 07 00317 g006
Figure 7. (a) Distribution of temperature T (°C) under a crosswind speed of 5.0 m/s along the vertical plane located behind the leeward side of the second tower. (b) Distribution of the relative humidity φ [1] under a crosswind speed of 5.0 m/s along the vertical plane located behind the leeward side of the second tower.
Fluids 07 00317 g007
Figure 8. Variations of the volumetric rate q of returned flow of heated air at the intakes of the second tower depending on the tower spacing computed using Equation (19) for the crosswind speeds of (a) 7.5 m/s, (b) 5.0 m/s, and (c) 2.5 m/s.
Fluids 07 00317 g008
Figure 9. (a) Distribution of velocity V (m/s) (magnitude and direction) under a crosswind speed of 2.5 m/s and a tower spacing of H/3 along the vertical plane passing at the middle of the distance between the towers. (b) Distribution of velocity V (m/s) (magnitude and direction) under a crosswind speed of 2.5 m/s and a tower spacing of 2H along the vertical plane passing at the middle of the distance between the towers.
Fluids 07 00317 g009
Figure 10. (a) Distribution of temperature T (°C) under a crosswind speed of 2.5 m/s and a tower spacing of H/3 along the symmetry plane. (b) Distribution of temperature T (°C) under a crosswind speed of 2.5 m/s and a tower spacing of 2H along the symmetry plane.
Fluids 07 00317 g010
Figure 11. Variations of the moisture content at the intakes of the second tower depending on the tower spacing for the crosswind speeds of (a) 7.5 m/s, (b) 5.0 m/s, and (c) 2.5 m/s.
Fluids 07 00317 g011
Figure 12. (a) Distribution of relative humidity φ [1] under a crosswind speed of 2.5 m/s and a tower spacing of H/3. (b) Distribution of relative humidity φ [1] under a crosswind speed of 2.5 m/s and a tower spacing of 2H along the symmetry plane.
Fluids 07 00317 g012
Figure 13. The distribution of velocity V (m/s) (magnitude and direction) under a crosswind speed of 5.0 m/s along the symmetry plane of the three cooling towers.
Fluids 07 00317 g013
Figure 14. The distribution of temperature T (°C) under a crosswind speed of 5.0 m/s along the symmetry plane of the three cooling towers.
Fluids 07 00317 g014
Figure 15. The distribution of relative humidity φ [1] under a crosswind speed of 5.0 m/s along the symmetry plane of the three cooling towers.
Fluids 07 00317 g015
Table 1. Parameters for boundary conditions.
Tamb(℃)10.0
φamb(%)40
Vin,t(m/s)5.1
Tin,t(℃)23.1
φin,t(%)95
Qout(m3/s)120
Table 2. Volumetric flow rate q (m3/s) of heated air under a crosswind speed of 5.0 m/s and a tower spacing of H in the case of two and three cooling towers.
Intakes of the Second Tower in the Case of Two TowersIntakes of the Second Tower in the Case of Three TowersIntakes of the Third Tower in the Case of Three Towers
10.4714.5829.91
Publisher’s Note: MDPI stays neutral with regard to jurisdictional claims in published maps and institutional affiliations.

