Article

Effect of Geometric Configuration of the Impeller on the Performance of Liquivac Pump: Single Phase Flow (Water)

1
Department of Mechanical Engineering, Teesside University Middlesbrough, Middlesbrough TS1 3BX, UK
2
Tomlinson Hall & Co., Ltd., Billingham TS23 4JA, UK
*
Author to whom correspondence should be addressed.
Fluids 2022, 7(2), 45; https://doi.org/10.3390/fluids7020045
Submission received: 19 December 2021 / Revised: 12 January 2022 / Accepted: 14 January 2022 / Published: 18 January 2022
(This article belongs to the Special Issue Multiphase Flow in Pipes with and without Porous Media)

Abstract

:
Liquivac pumps, with their unique shaped twin start helical rotor, have found utility in various sectors but the major drawback limiting in their global exploitation is their low performance. This paper investigates the study of performance of the Liquivac pump produced by Tomlinson Hall Ltd. Experimental data was used to validate a numerical model developed in Ansys Fluent 20.2 for the Liquivac pump. Four different geometric models of the rotor were tested numerically to find the optimum design using blade number and pitch length as the criteria to achieve improved efficiency. The choice of turbulence model is an important factor in the most accurate prediction with computational fluid dynamics (CFD) simulation. Four different turbulence models were validated with experimental measurements. The realizable K-ε model gave the most accurate performance predictions with a relative deviation of 3.8%. So, the realizable K-ε model was employed for further parametric optimization of the rotor. The results indicate a reasonable improvement in the head and efficiency of the Liquivac pump with a new rotor geometry of four equidistant blades in the front, back and four flights with 30 mm pitch. This is attributed to the most favourable balance between the different losses and most guided and uniform flow inside the rotor channels.

Graphical Abstract

1. Introduction

Liquivac pumps are extensively employed across much of well-known chemical processes, environmental engineering, food and drink producers, and desalination plants. The Liquivac pump can handle both single-phase flow (liquid/gas) and multiphase flow. This pump is one of its kind and its innovative liquid ring vacuum design can accommodate solids of up to 2 mm in diameter when transferring air, liquids, vapours, foams and emulsions. The features that make Liquivac pumps to stand out among other vacuum pumps available in the market are the advantage of isothermal compression, their simple structure and the pioneering liquid-sealing technology [1]. There is no literature available to date on Liquivac liquid ring vacuum pumps. The effective technology employed here also helps in pump priming systems to increase process efficiency and protects larger vacuum pumps from damage.
Due to the unique shape of its impeller (a twin start helical rotor), this pump can find applicability in different flow conditions. A transparent model of a Liquivac pump is shown in Figure 1. This pump can operate with single-phase flows (liquids or gases) and oil-water-air multiphase flow systems.
Liquivac pumps have been in use since 1996 in the UK, but their performance in single phase flows is consistently low. Improving the performance of this pump is the key to boosting its applicability in the field of handling and separation of different fluid flows. The impeller/twin start helical rotor is the core component and power element of this pump and dominant in the fluid flow passage, so its optimization could be considered to improve the performance and stability of the featured pump.
The optimization of pump design for improving performance has been receiving great attention from researchers in recent years. Several researchers have implemented optimization techniques for pump components, especially for the impeller. Kurniawan et al. [2] conducted a study to improve the performance of a centrifugal pump by adding splitter blades on the outer side of the impeller. An increase in the hydraulic efficiency and pump head by 38.66% and 22%, respectively, was observed with the addition of splitters on the outer side of the impeller with 0.5 L increase of the original blades. Kergourlay et al. [3] investigated the effect of the addition of splitter blades on the performance of centrifugal pumps by using simulation and experimental tests. The numerical predictions matched well with the experimental results and a positive effect on the pressure fluctuations was seen, with a decrease towards the canal duct by addition of splitters on the pump. Bcharoudis et al. [4] have studied the flow mechanisms inside the impeller of the centrifugal pump by varying outlet blade angle of impeller. A 7% increase in the pressure head with an increase in the outlet blade angle from 20° to 45° was observed. A numerical analysis on a centrifugal pump handling a viscous fluid revealed an increase in performance of the pump with the increase in the outlet blade angle due to shrinking wake formation at the impeller exit [5].
Recently, CFD simulation techniques are being extensively employed in engineering applications for examining and designing various parts in turbo-machines like turbines and pumps. CFD provides the necessary flexibility to engineering designers to qualitatively and quantitively evaluate the fluid flow within the pump. Kim et al. [6] carried out CFD analysis and used the response surface method for design of the volute and optimization of the impeller. The CFD analysis shows that the pressure head and efficiency are significantly affected by the outlet angle. An increase in the pressure head reaching a value as high as 2.5 m is seen with increase in the outlet angle with a small decrease in efficiency by 0.3%. A detailed study was conducted on prediction of performance in a centrifugal pump by Han et al. [7]. A comparison of both experimental and numerical simulations was completed by varying the blade exit angle and wrap angle to find an optimum impeller design. Numerical simulations were conducted with five different impellers with different blade exit angles (24°, 26°, 28°) and blade wrap angles (122°, 126°, 130°) under 0.6, 0.8, 1.0, 1.2, and 1.5 Qd. The variations of relative velocity, static pressure, and turbulent kinetic energy were simulated. The impeller with blade wrap angle of 126° and exit angle of 24° has shown the best hydraulic performance and efficiency. Therefore, an accurate analysis is essential to optimize the variables that affect the performance of the pump.
An appropriate turbulence model is essential for accurate prediction of the chosen configuration when employing CFD analysis. Researchers have shown a great deal of interest in choosing turbulence models for the realization of accurate numerical simulation results, as all models are not applicable for all the cases and have some constants based on experimental work. Zhang et al. [8] adapted three turbulence models to carry out numerical simulations of an axial flow pump. The results showed a higher error percentage under large flow rate and small flow rate conditions, which would reach 3% or more. Wang et al. [9] investigated the flow fields in a low specific speed centrifugal pump using five different types of turbulence models. In the regions of small flow and design conditions, their numerical simulation agreed well with the experimental results, however, the standard K-ε turbulence model was found to give the most inappropriate predictions in the large flow condition compared to other four adapted turbulence models. A deviation of 47.9% in pump performance and 50% deviation in efficiency were noticed. The results of RNG K-ε turbulence models gave the best fit under large flow conditions, followed by SST K-ω model results. Wang et al. [10] have used standard K-ε, shear stress transfer (SST) K-ω and renormalisation (RNG) K-ε turbulence models to simulate sound fields in a five-stage centrifugal pump equipped with a vane-diffuser. The simulation results match well with the noise characteristics of experimental results. Among these models, the RNG K-ε turbulence model shows the most appropriate match with the experimentally obtained sound characteristics. Song et al. [11] analysed two different types of turbulence models, the K-ε turbulence model with near wall functions and K-ω turbulence model. These turbulence models could explain flow performance closest to the experimental data, with the K-ω model giving the best fit among all adopted models, especially in the near-wall regions. Zhang et al. [12] conducted a study on tip leakage vortex in axial flow pumps simulated with four kinds of turbulence models. The performance predictions based on the SST K-ω model fit well with the experiment results, and the error percentage is about 4.7% under the considered operating conditions, which is better than the others.
Several numerical and experimental investigations have been performed in an attempt to comprehend the flow transport mechanism and improve the performance of multiphase pumps for use in various applications. However, quantitative research using CFD on a pump with an innovative liquid ring vacuum design and twin start helical rotor has not been recorded in the literature till date.
The experimental studies on the multiphase flow pumps are costly as well as time consuming, so the present work focuses on the three-dimensional modeling of a single-phase flow using CFD. A CFD study was conducted for the first time in Liquivac pumps so, choosing an appropriate turbulence model to get accurate results was important. To model the turbulence of the flow fields, four turbulence models, namely the standard K-ε (SKE), renormalisation K-ε (RNG), realizable K-ε (RKE) and standard K-ω with standard wall functions were employed. Different turbulence models are tested to select the most appropriate model for this type of the pump. This investigation aimed to enhance the performance of the pump by improving the geometry of the impeller. The results for the case of a single-phase flow of water are presented.
This paper presents experimental data for single phase flow (water) on the existing design of the twin start helical rotor pump which is used for model validation. The model then modified to perform detailed investigation of the modified rotor geometries using CFD simulation at different operating conditions. The pump was simulated at different flow rates and under different pressure rise conditions. Internal flow fields were investigated using appropriate turbulence models for optimization of the impeller geometry and to improve the performance of Liquivac pumps.

2. The Liquivac Pump

2.1. Working Principle of the Pump

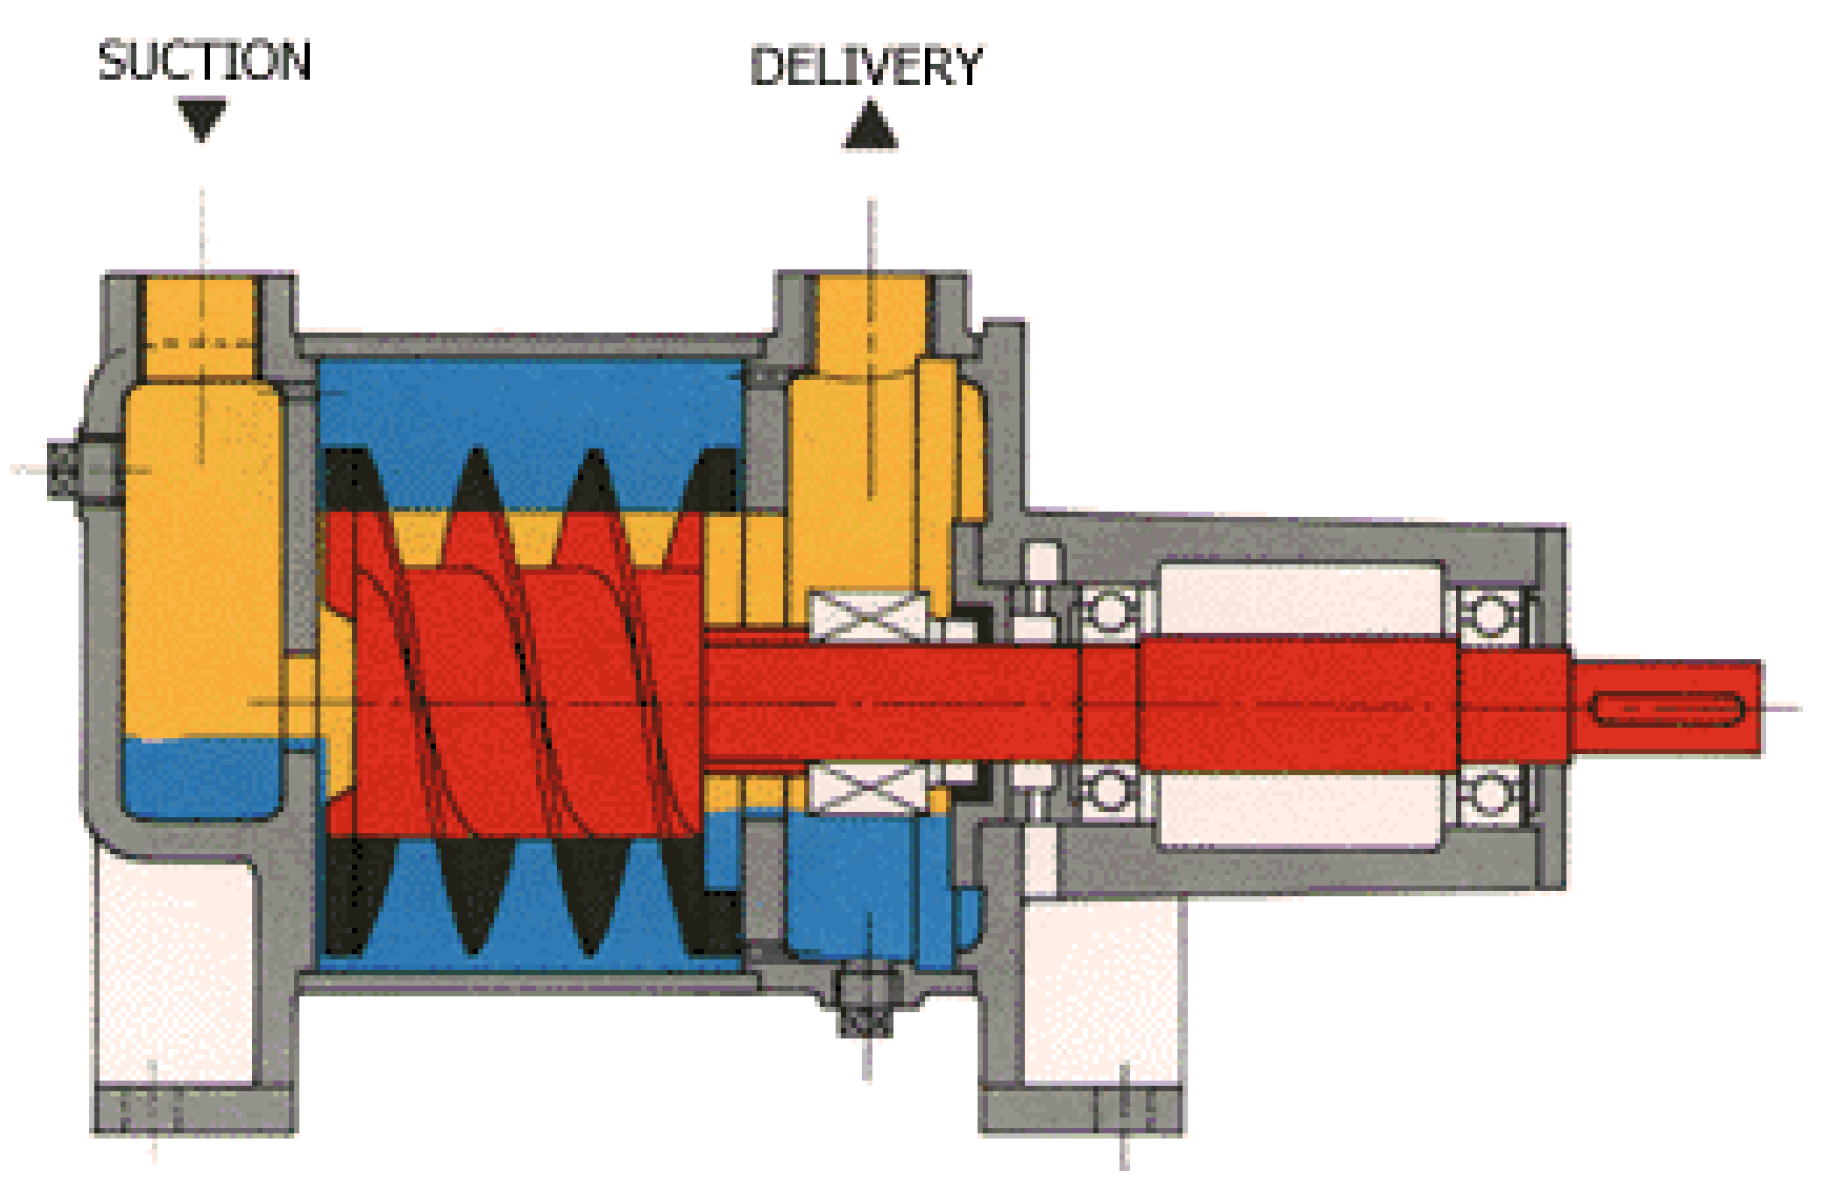
A Liquivac pump consists of a cylindrical outer casing surrounding an eccentrically mounted twin start helical rotor (impeller) assembly, as shown in Figure 2. The pump should be primed with a suitable liquid for the first installation. During the startup, excess liquid will overflow by the discharge port and the balance liquid forms a liquid ring supported by the discharge and suction port plates [13].
The formation of the liquid ring is due to the centrifugal force that seals the top edge of the rotor and the lower side of the rotor boss shown in Figure 3. As a result, a sequence of escalating, crescent shaped cavities are formed from suction to delivery. Air or vapours, liquid, foam, and emulsions entering the suction port is likely to be carried into these chambers and discharged from the outlet port. The large clearance between the rotating and stationary parts allows the pump to handle hard solids up to 2 mm diameter [13].

2.2. Experimental Setup

2.2.1. Liquivac Pump

The pump used for the experimental tests is a Liquivac pump LV20-5 made by Tomlinson Hall Ltd. (Billingham, UK). This pump has a twin start helical rotor at the centre, a casing and has suction and discharge chambers at both ends. A twin start helical rotor is the main component of the pump, also referred to as the impeller. The diameter of the casing is 157 mm. As the geometry of twin start helical rotor is complex, for the better understanding of the readers a detailed view of the rotor is shown in Figure 4. The pump is powered by a 2.2 kW 3- phase motor, current withdrawn is 7.62 A, voltage is about 230 V, and the rotational speed is 2900 rpm.
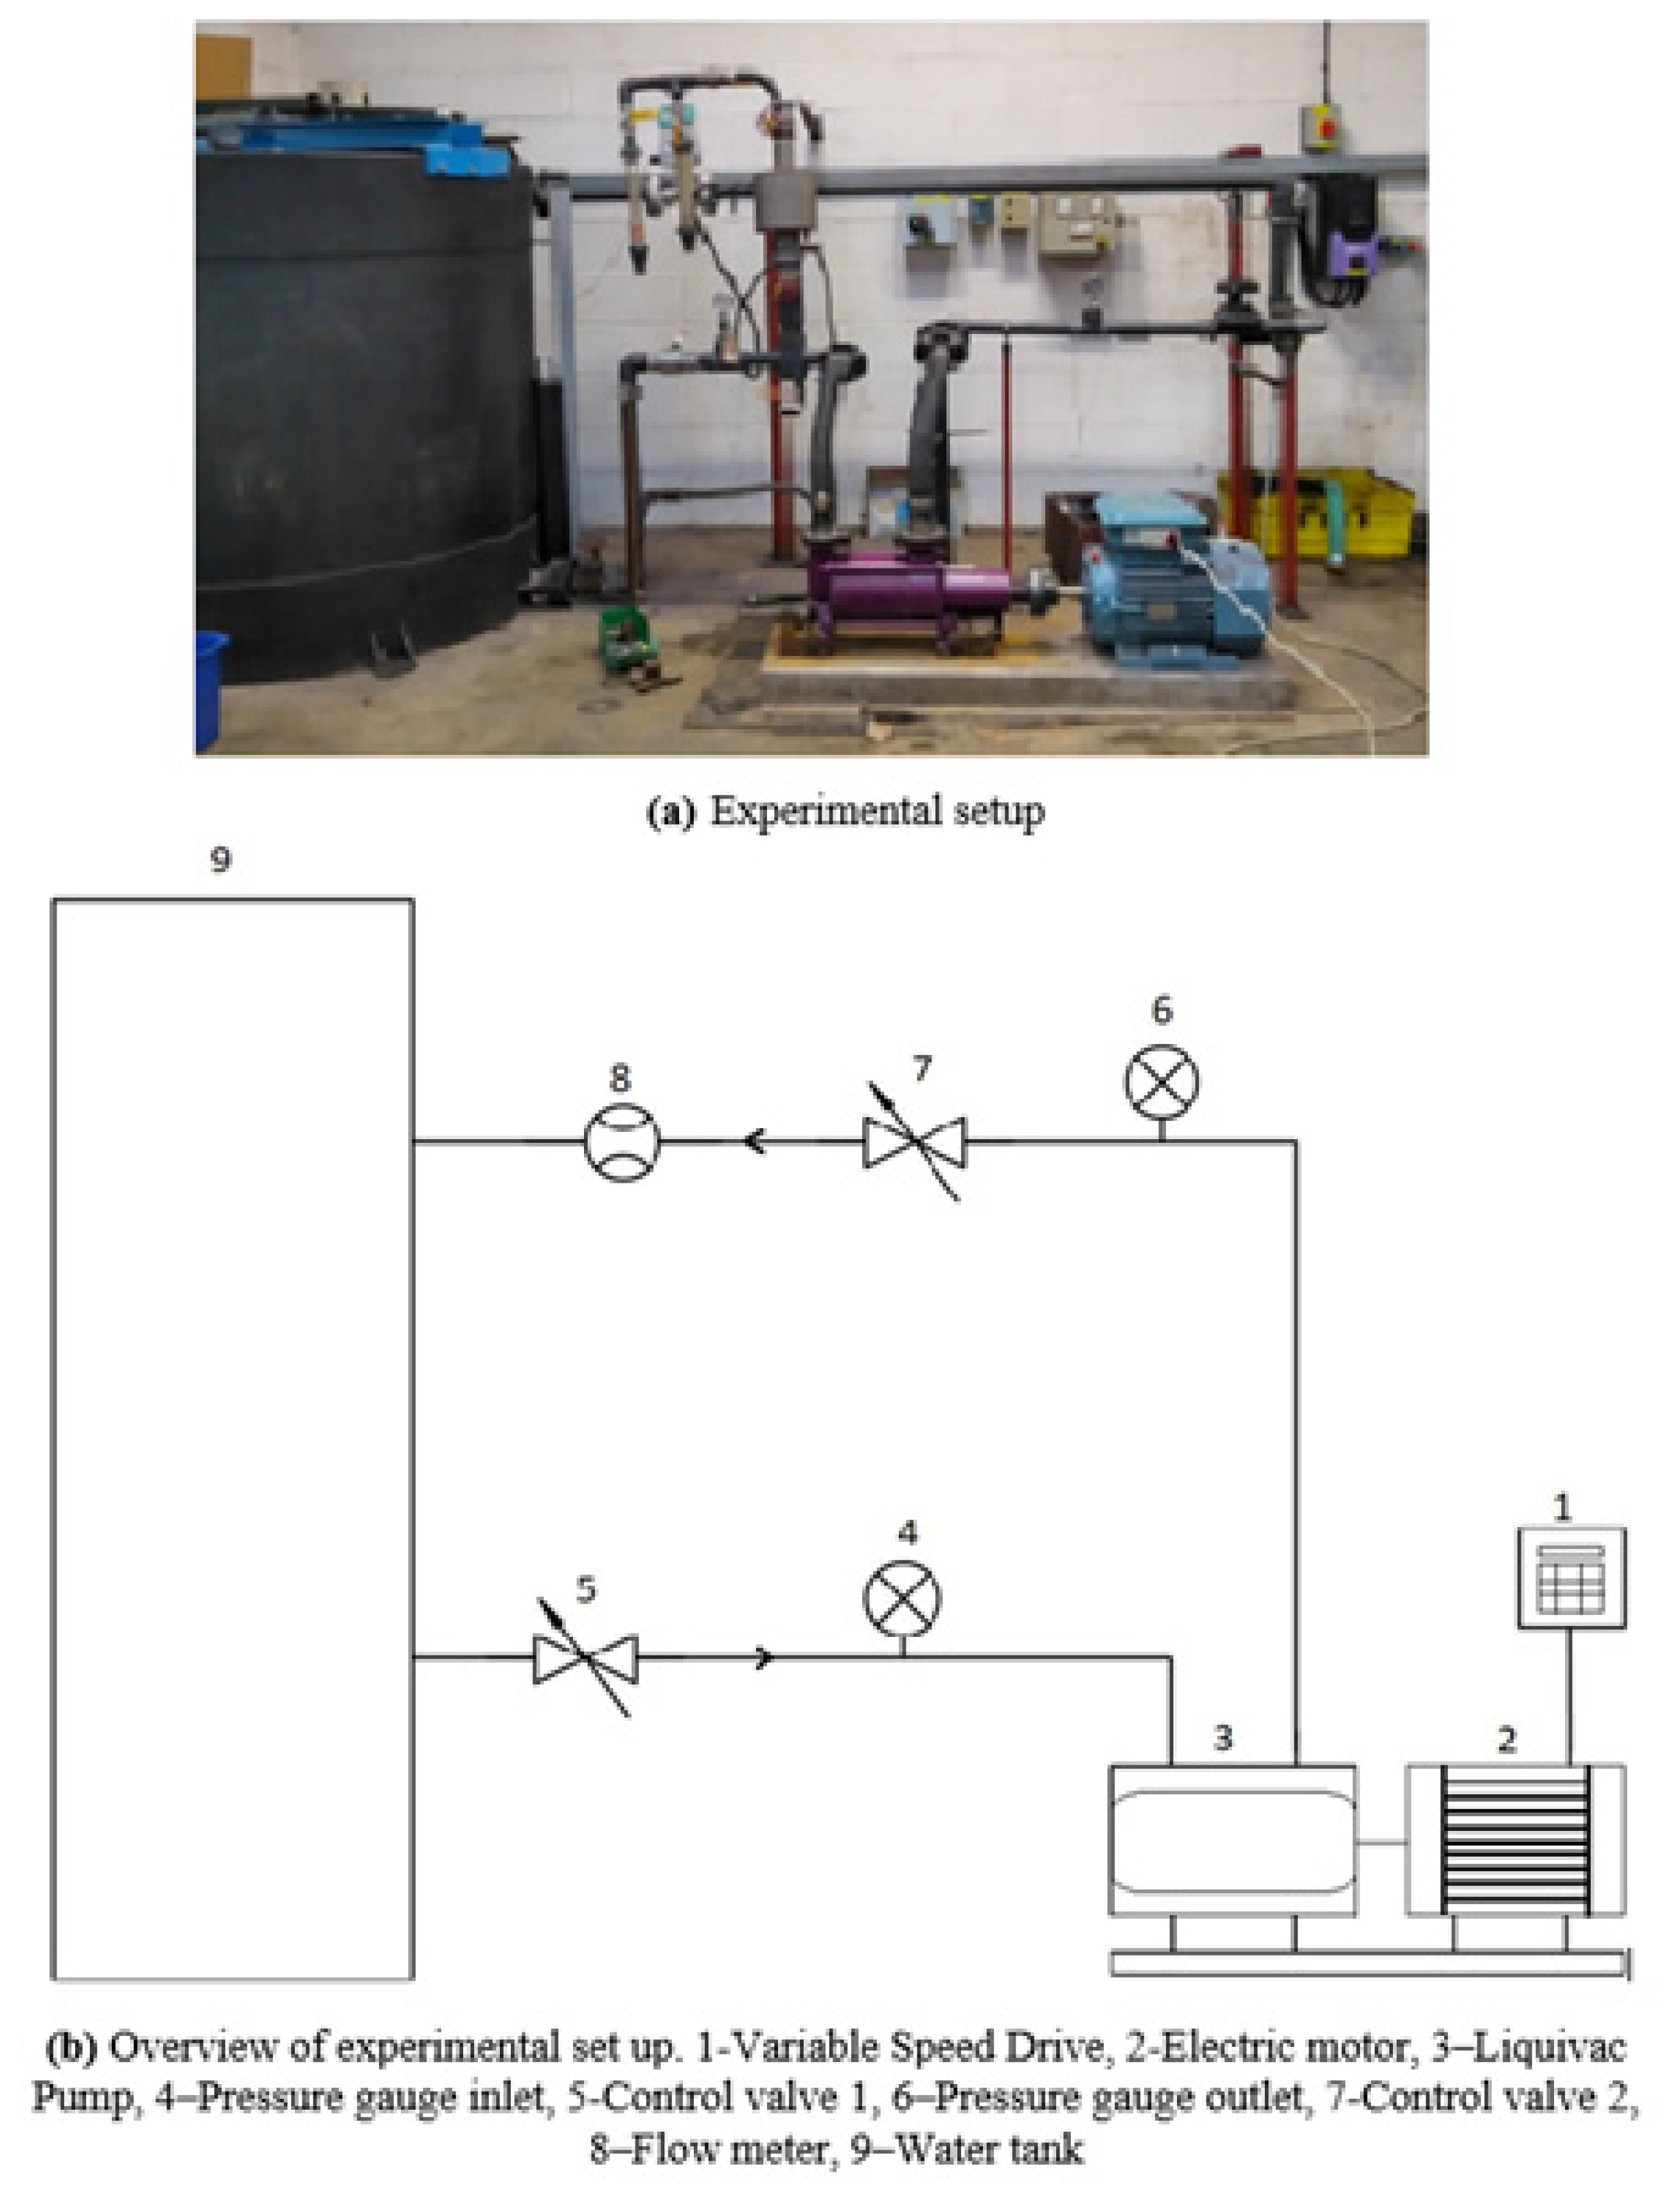
A diagram of the experimental setup is shown in Figure 5 and consists of the variable speed drive (VSD) (1), electric motor (2), Liquivac pump (3), pipeline, pressure gauges (4 and 6), water flow meter (8), control valves (5 and 7) and the water tank (9). The inlet and outlet water pressures of the pump are measured by pressure gauges, and flow rate is measured by an electromagnetic flow meter. The accuracies of the pressure gauge, flow meter and power sensor are ±0.6%, ±0.4%, and ±2%, respectively. The uncertainty in head, and efficiency measurement is ±0.9%, and ±2.3%, respectively. The method for calculation of uncertainty is shown in Equations (1) and (2) respectively [14]:
  e H = ( Δ p p i n l e t ) 2 +   ( Δ p p o u t l e t ) 2    
e η =     ( Δ H H ) 2 +   ( Δ Q Q ) 2 +   ( Δ P o w e r P o w e r ) 2
where e H , e η is the uncertainty in head and efficiency respectively, Δp, ΔQ, Δ P o w e r is the measurement accuracy of pressure gauge, flow meter and power sensor apparatus, respectively.

2.2.2. Test Procedure

The adopted test procedure is as follows: the speed of the Liquivac pump is increased until the operating speed reaches 2900 rpm. Water is allowed to circulate until all the air has been flushed from the system. The inlet valve is left fully open and the outlet valve closed. Thereafter, the outlet valve is opened to allow a low flow rate. After allowing sufficient time for the readings to stabilize, the measurement parameters of flow rate, inlet, and outlet pressure and power consumption are then recorded. The flow is increased in small increments. Finally, the above steps are repeated at different flow rates and the pump data and power consumption recorded. The head, power, and efficiency of the pump were calculated using the following equations:
H p = p o u t l e t p i n l e t ρ g
η p = ρ g Q p H p P i n p u t 100
where p i n l e t and p o u t l e t , are the total pressure at the inlet and outlet of the pump, ρ is the density of the water, g is the acceleration due to gravity, Q p is the flow rate through the pipe (m3/hr) and H p is the head of the pump, P i n p u t is the power input in kW, respectively.

3. Computational Model

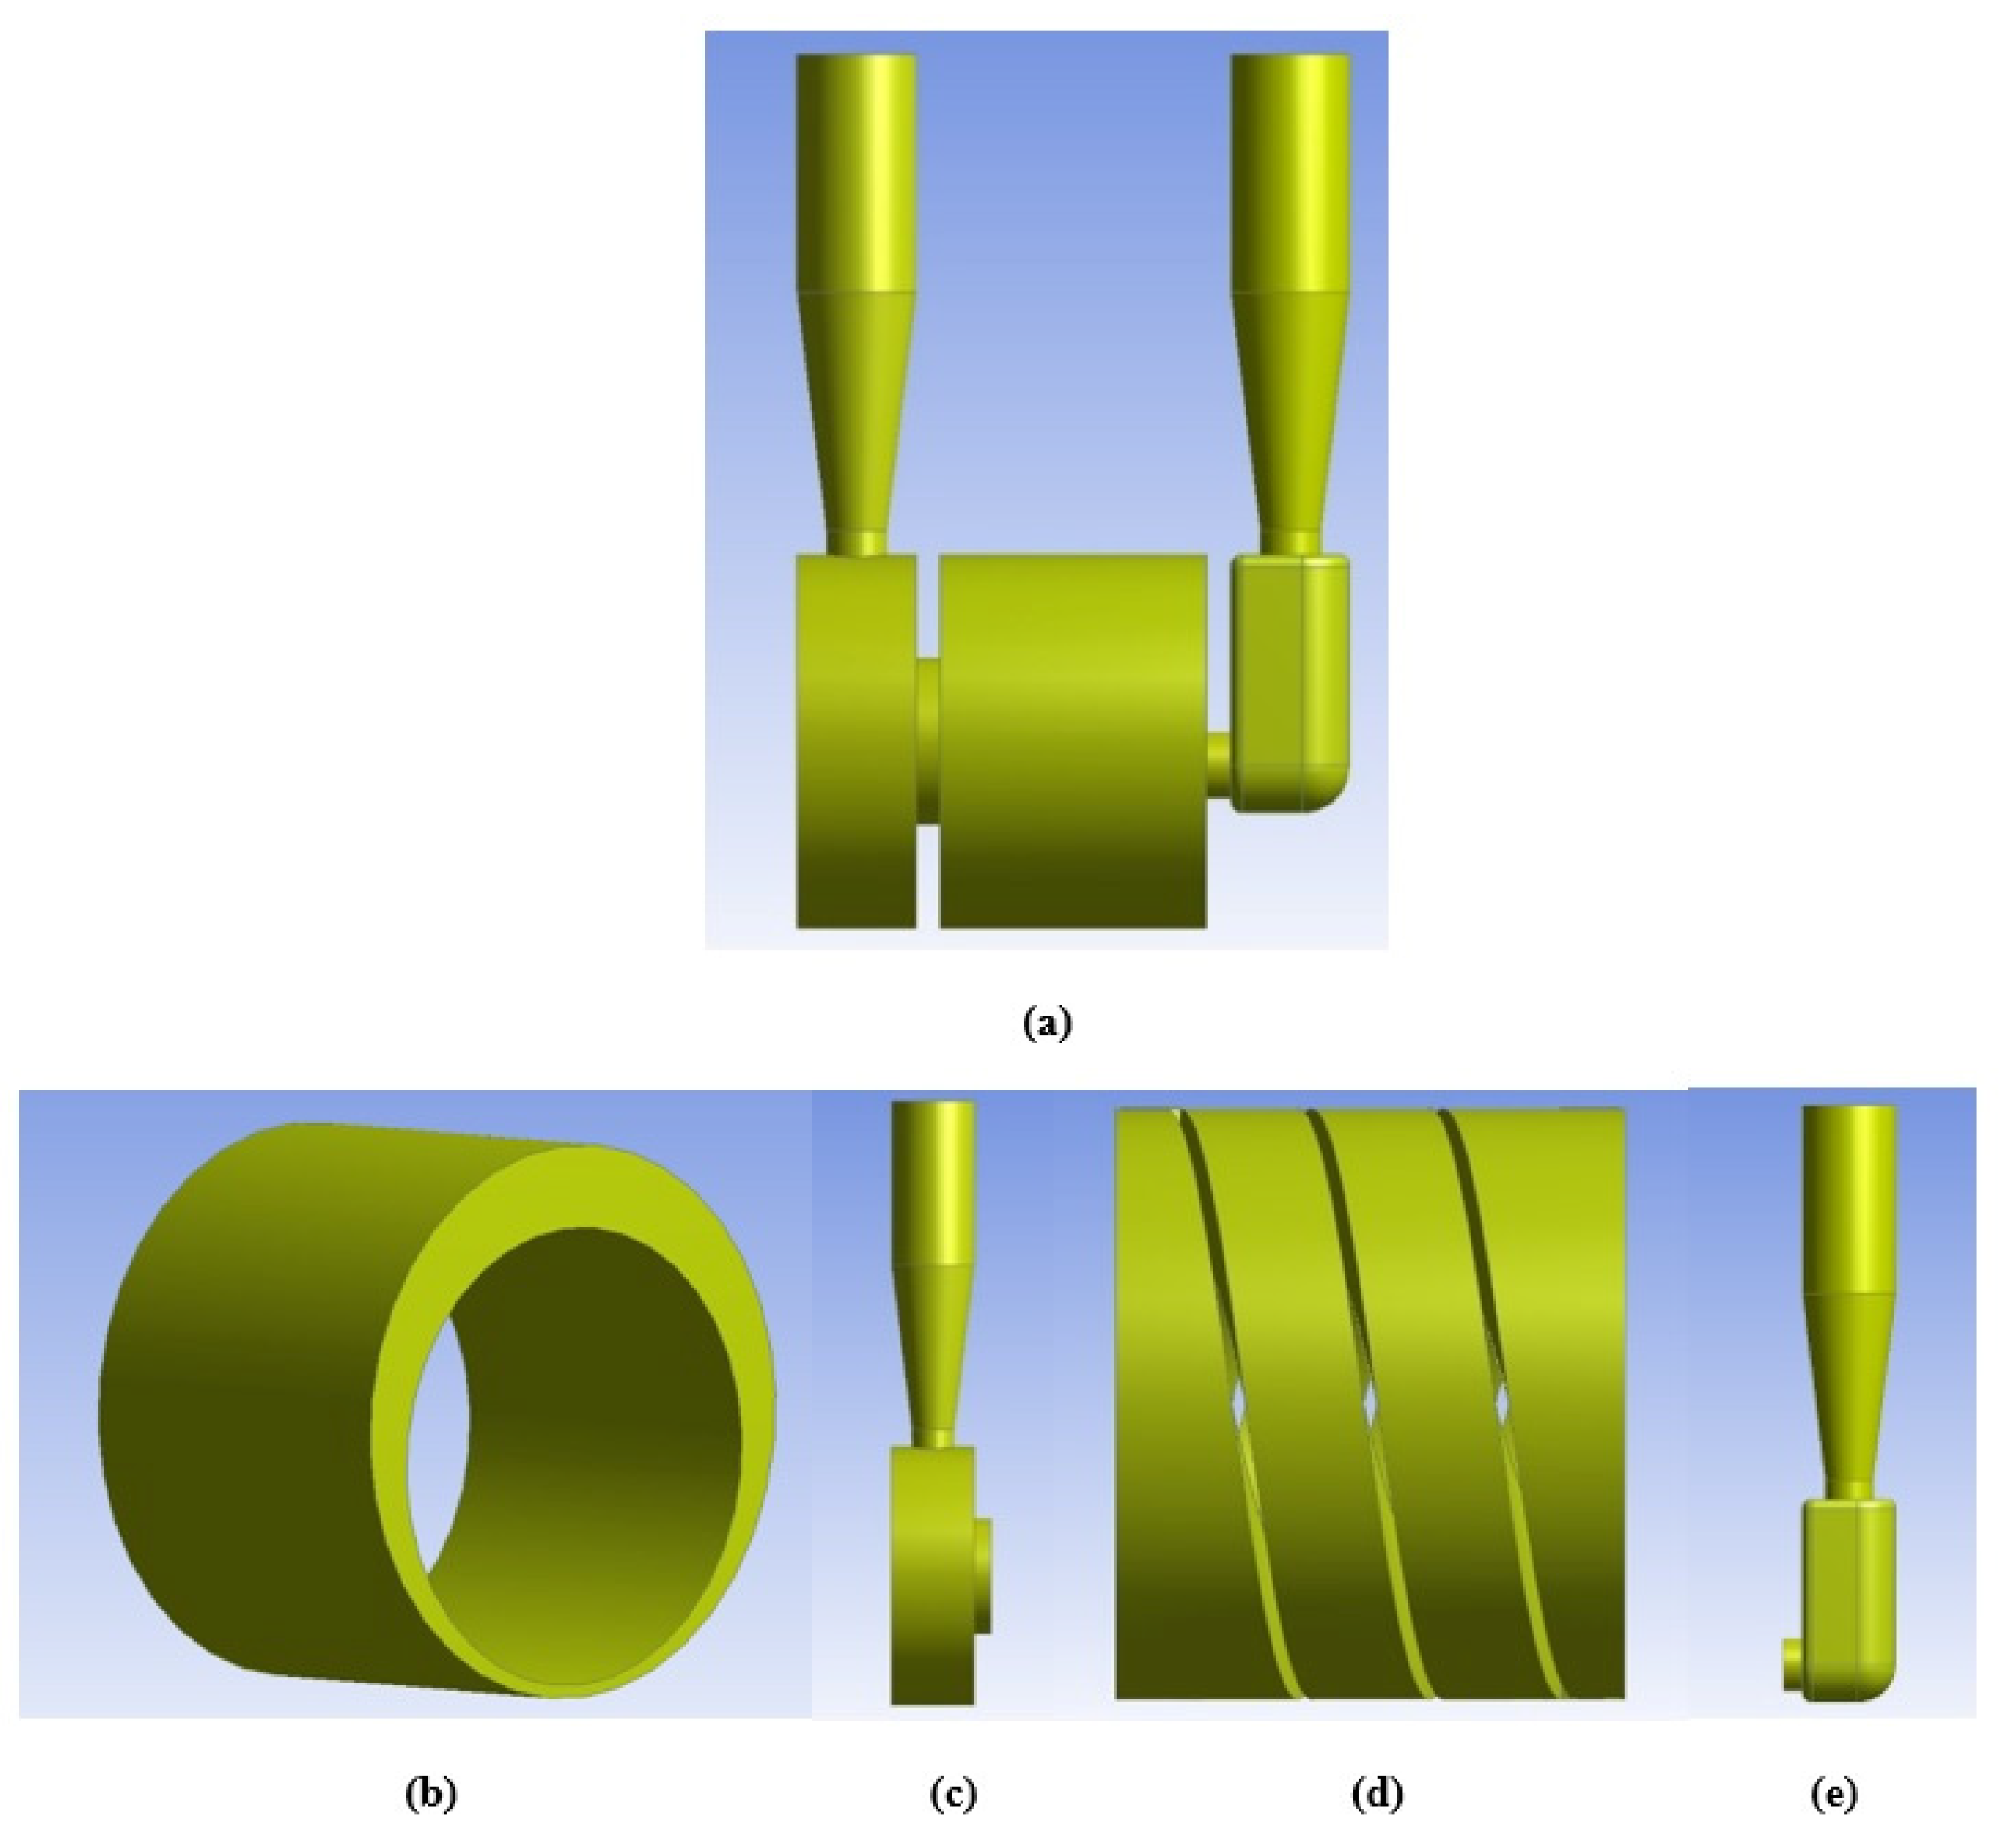
A simulation prototype of the whole pump was modelled like the one used in the experiments and shown in Figure 6a. The computational model of the whole pump incorporates a rotating volume which is a rotor and three fixed volumes consisting of the casing, suction, and discharge chamber as shown in Figure 6b–e. The capacity of the pump in single phase using water is in between 2 to 9 m3 /h, and it operates at 2900 rpm. The maximum pressure head of pump in single phase is 15 m. The performance of the pump in single phase flow of water is low, so this paper is mainly concentrated on single phase analysis to improve its efficiency.

3.1. Mesh Generation

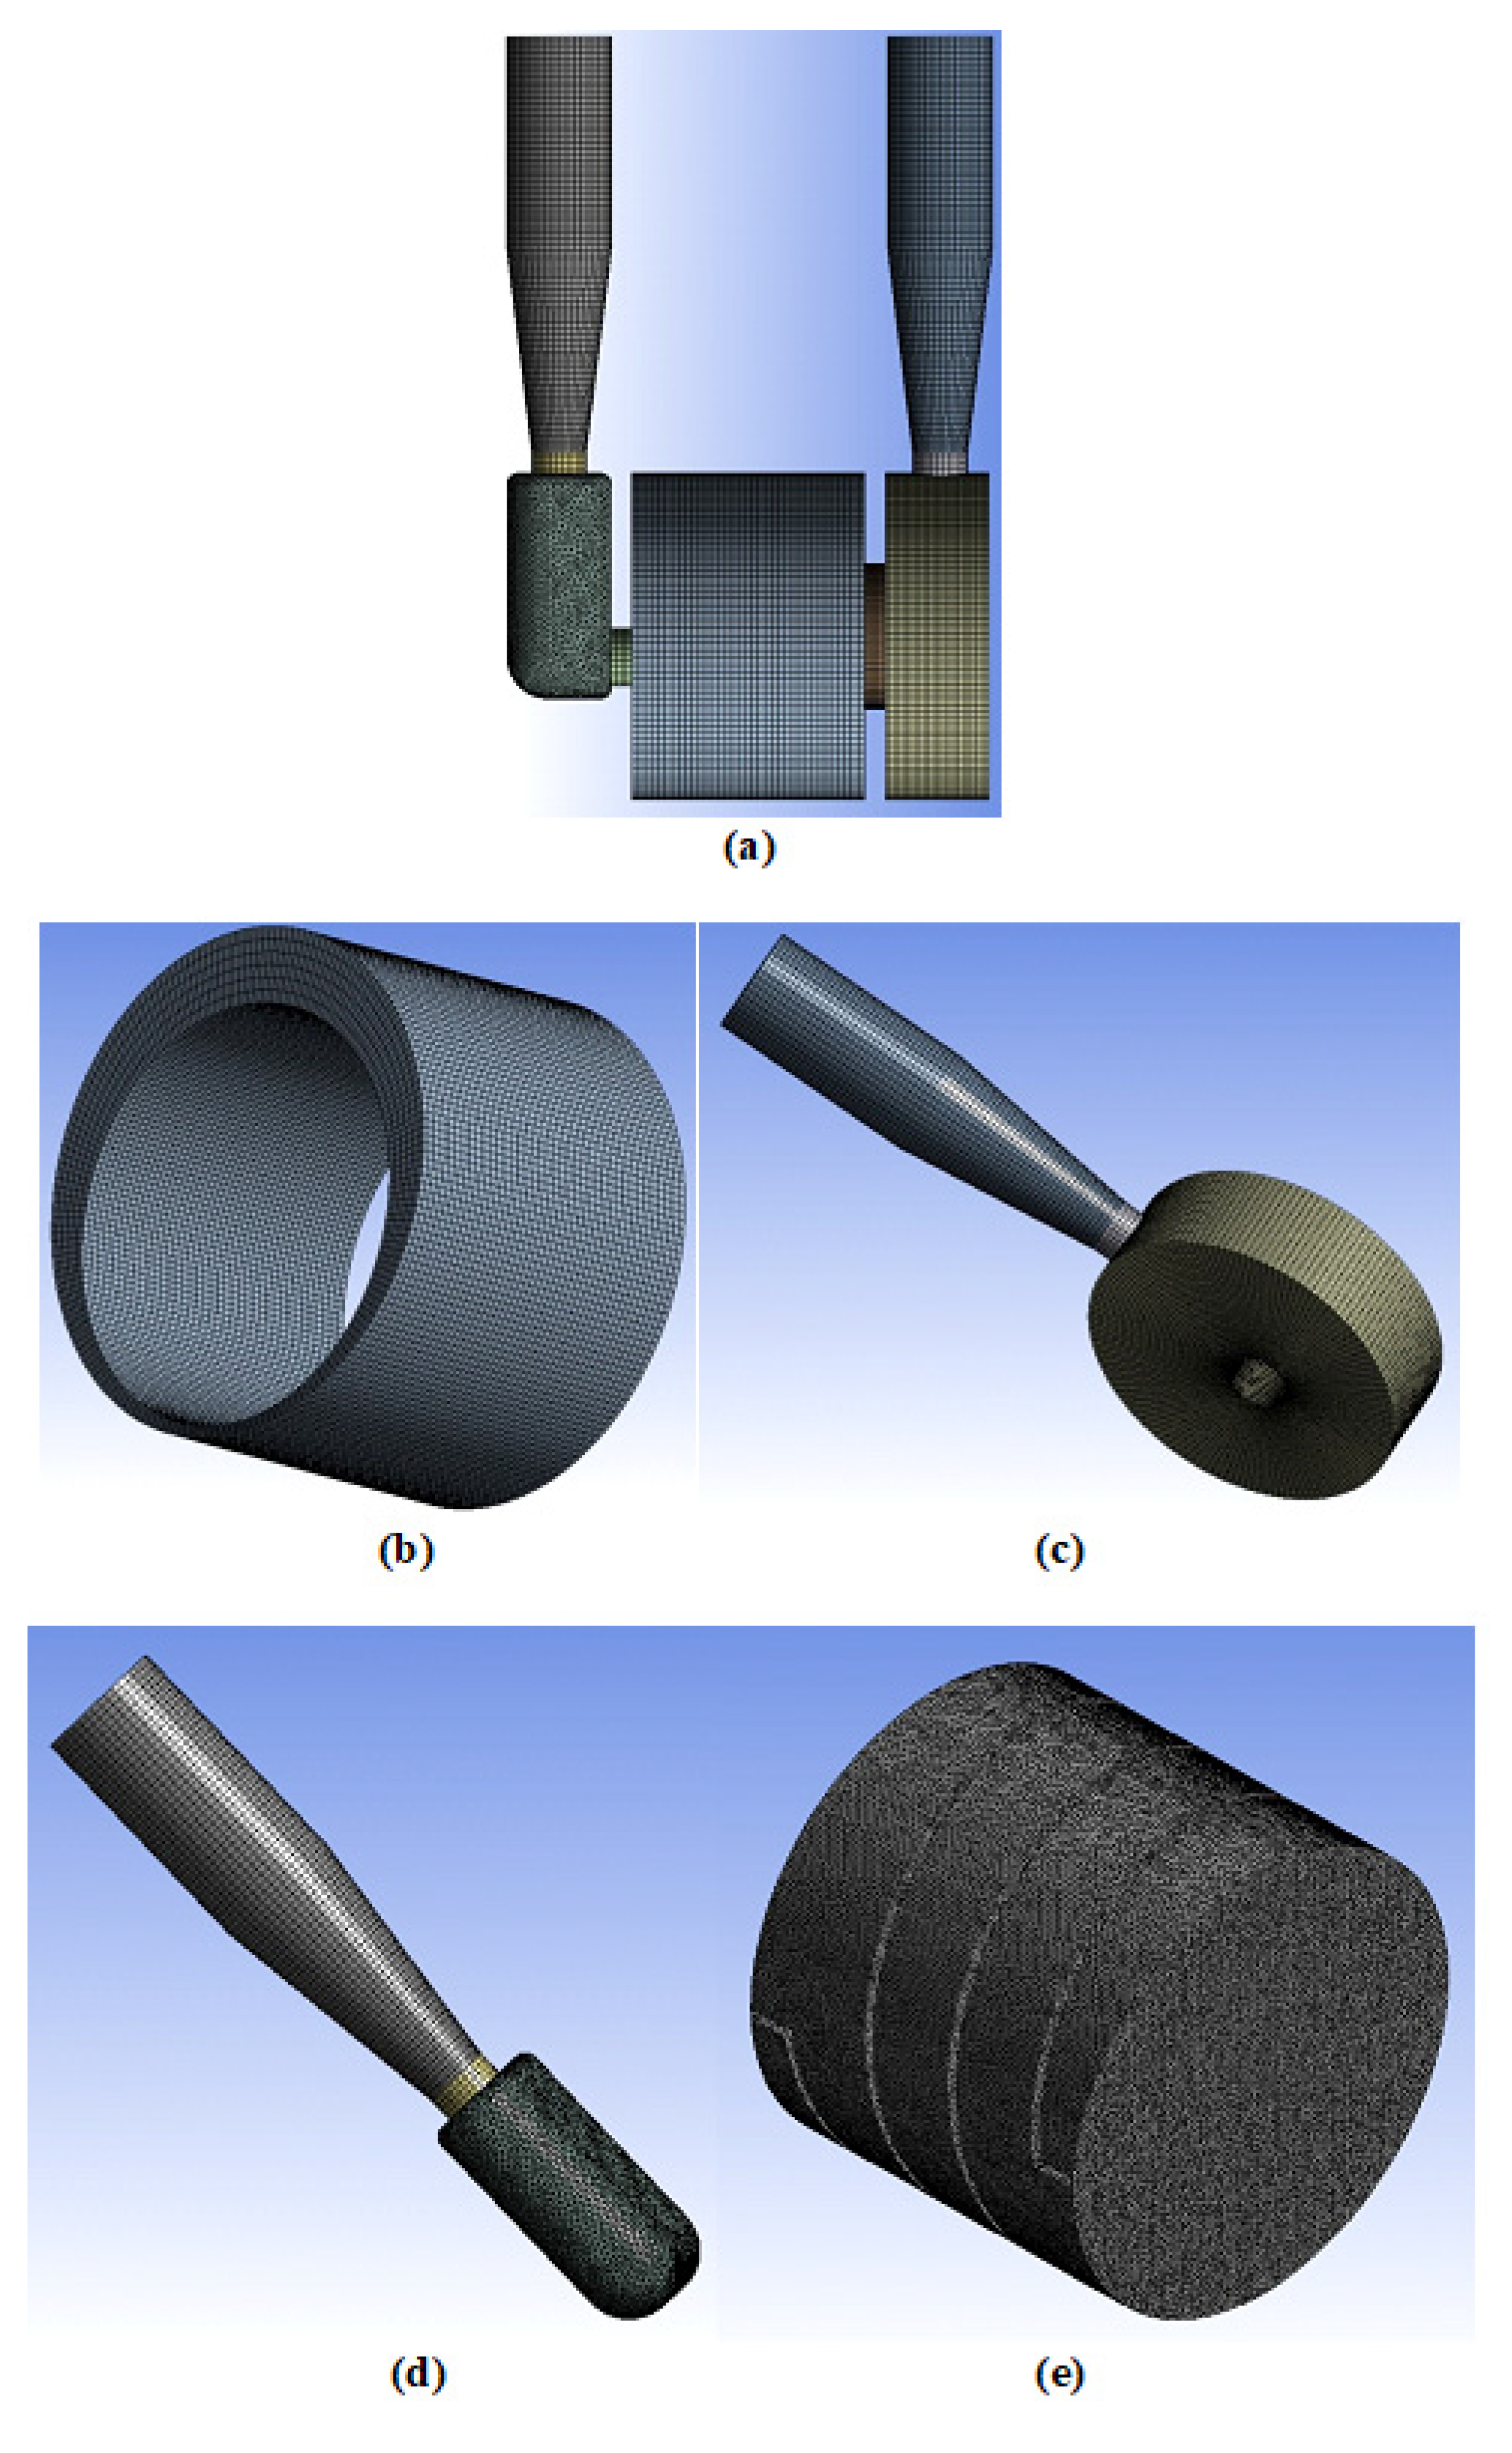
The computational domain of the concerned pump is discretized into a several small parts called elements using the ANSYS meshing tool. To attain the uniformity in the fluid flow, structured meshes were employed to discretize the computational domains of the discharge chamber, water pipes and casing. Taking into consideration the complex structure of the rotor and suction chamber, unstructured meshes were employed for discretisation of their computational domains and to improve flexibility in the fluid flow. Improving the quality of the mesh helps us to reduce the error in the performance prediction. Total number of elements used in CFD analysis was determined by mesh independence checking. It is done by finding the smallest number of elements needed for the CFD analysis without significant difference in numerical result. The computational mesh of the discharge chamber, suction chamber, casing, rotor, and whole pump is shown in Figure 7a–e.

3.2. Mesh Independence Test

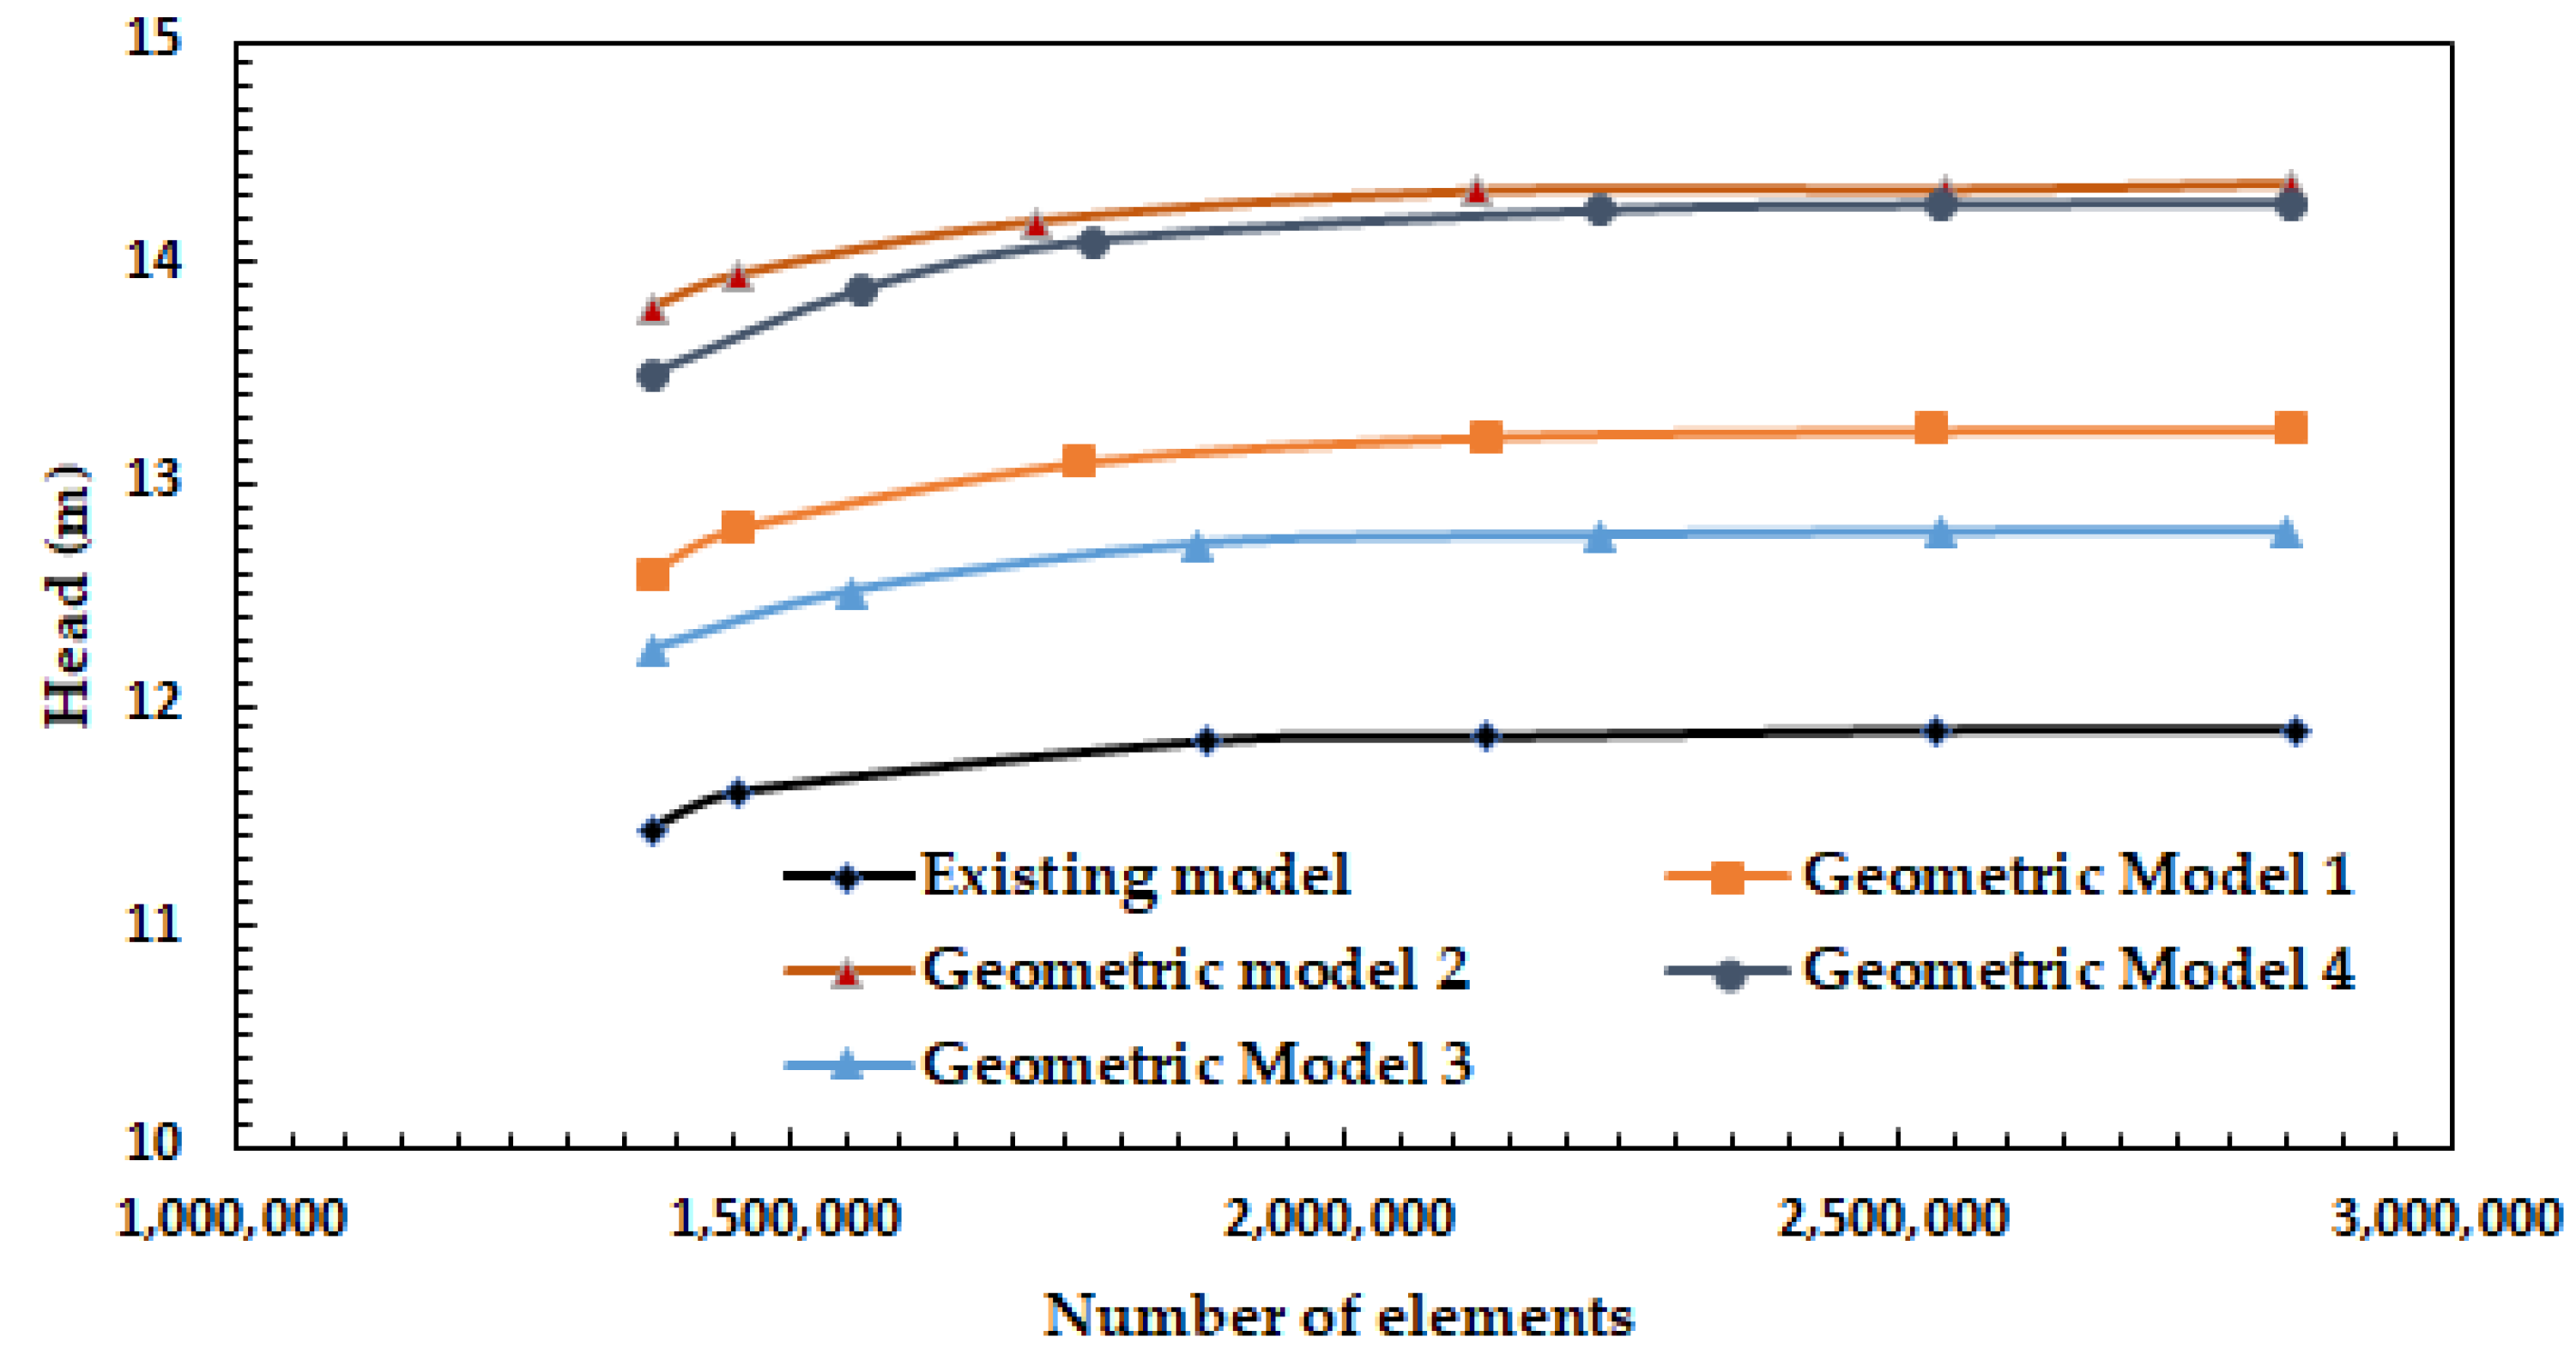
The quality of the computational mesh used is important for more accurate outcomes so mesh independence testing was carried out on the model and an appropriate mesh density was decided. The pump head was calculated for different mesh element cases to verify the mesh independence. The results indicate that with the increase of mesh number, the numerical value of the head shows a steady trend, increasing at first and then changing only slightly with further increase in mesh number and finally the difference between the head values for the last two meshes is below 0.15% i.e., further increasing the mesh numbers will thereafter not have much influence on simulation results, as shown in Figure 8. The total mesh numbers in the existing model and four geometric models of the pump were 2857615, 2854528, 2849827, 2856610, 2854323, separately, so these meshes were used for the further CFD analysis as it is presumed to be capable of predicting accurate results.

3.3. Governing Equations

In CFD, a set of differential equations based on fundamental conservation laws are solved assuming continuum fluid phase. The conservation equation of mass and momentum is employed, and the energy equation is omitted considering isothermal fluid flow domain in this case. Subject to the relative coordinates of the constant angular velocity ω, the three-dimensional, incompressible internal flow in the pump can be expressed in the form of an average time motioned fundamental equation as follows [9]:
u i x i = 0  
u i u j x j = P x i + [ ( μ + μ t ) ( u i x j + τ i j x i ) ] x j + S i
where, x i and x j denote the coordinate components, u i and u j denote the average velocity and P denotes the pressure, μ and μ t being the fluid and turbulence viscosity, respectively and S i being the general source term.

3.4. Turbulence Modelling

The turbulence models used in this research work rely on the Boussinesq hypothesis. According to this hypothesis, the Reynolds stress is directly proportional to the mean strain rate with turbulent viscosity being the proportionality constant considering similar interaction of Reynolds and viscous stresses with the mean flow. Linear eddy viscosity can be adopted to model the turbulent viscosity. The eddy viscosity assumption makes the Reynolds stress tensor obtained of equation averaging proportional to the mean deformation rate tensor. For the present work, the simulation is performed using k-ε turbulence models and K-ω turbulence model. A comparison is also made among the responses of these models:
ρ u i ¯ u j ¯ = μ t ( u i x j + u j x i ) 2 3 ( ρ k + μ t u i x i ) δ i j
The main advantage for this approach is that it is suitable for industrial applications, and the computational cost for finding the turbulent viscosity is relatively low. On the other hand, the disadvantage is the isotropic assumptions of turbulence. All three K-ε models and the K-ω turbulence model (two equation eddy viscosity models) are derived from this hypothesis. Four turbulence models, namely standard K-ε, realizable K-ε, RNG K-ε and standard K-ω models were utilized to model the pump flow and the results compared with the experimentally obtained dataset. Per our studies, the realizable K-ε model appears to be the most accurate model for pump analysis [15].

3.5. Boundary Conditions and Numerical Method

The ANSYS Fluent 20.2 software has been used to solve the three-dimensional, transient unsteady flow fields in the pump. In this CFD model, the transient sliding mesh methodology was employed. Boundary conditions used in this work are shown in Table 1. Flow directions and constant total pressure are defined at the pump inlet, along with mass flow rate being defined at the pump outlet [16]. The pressure at the outlet was calculated depending on the input values from the experiment. All the walls in boundary conditions are specified to be no slip and standard wall function is specified to the adjacent sides of the walls. Different turbulence models, including the standard K-ε, realizable K-ε, RNG K-ε and standard K- ω model was used to model the turbulence in the pump flow. The finite-volume approach was used to solve the governing equations; the convection terms were discretized with second-order central difference scheme. The SIMPLEC algorithm was applied to find the velocity and pressure coupling. As residual value drops less than 10−6 then computation stops. A parallel calculation was performed on an Intel(R) Xeon(R) W-2133 3.60 GHz processor equipped with 128 GB RAM.

Time Step and Period

To analyse the pump under single phase flow of water, the unsteady numerical simulation of the model is carried out. The convergence of a transient unsteady flow analysis for a pump is usually considered to be reached when a quasi-steady solution is obtained. For that several rotor revolutions are required, and performance is calculated. During calculations, one time step is set when the rotor rotates 3°. That is, it takes 120-time steps for the rotor to rotate one circle, so a time step length is equal to 0.0001725 s. To ensure stable unsteady calculation, the rotor totally rotates twelve cycles, and the data of the twelfth circle was adopted for the analysis.

4. Results and Discussion

4.1. Validation of Numerical Simulations

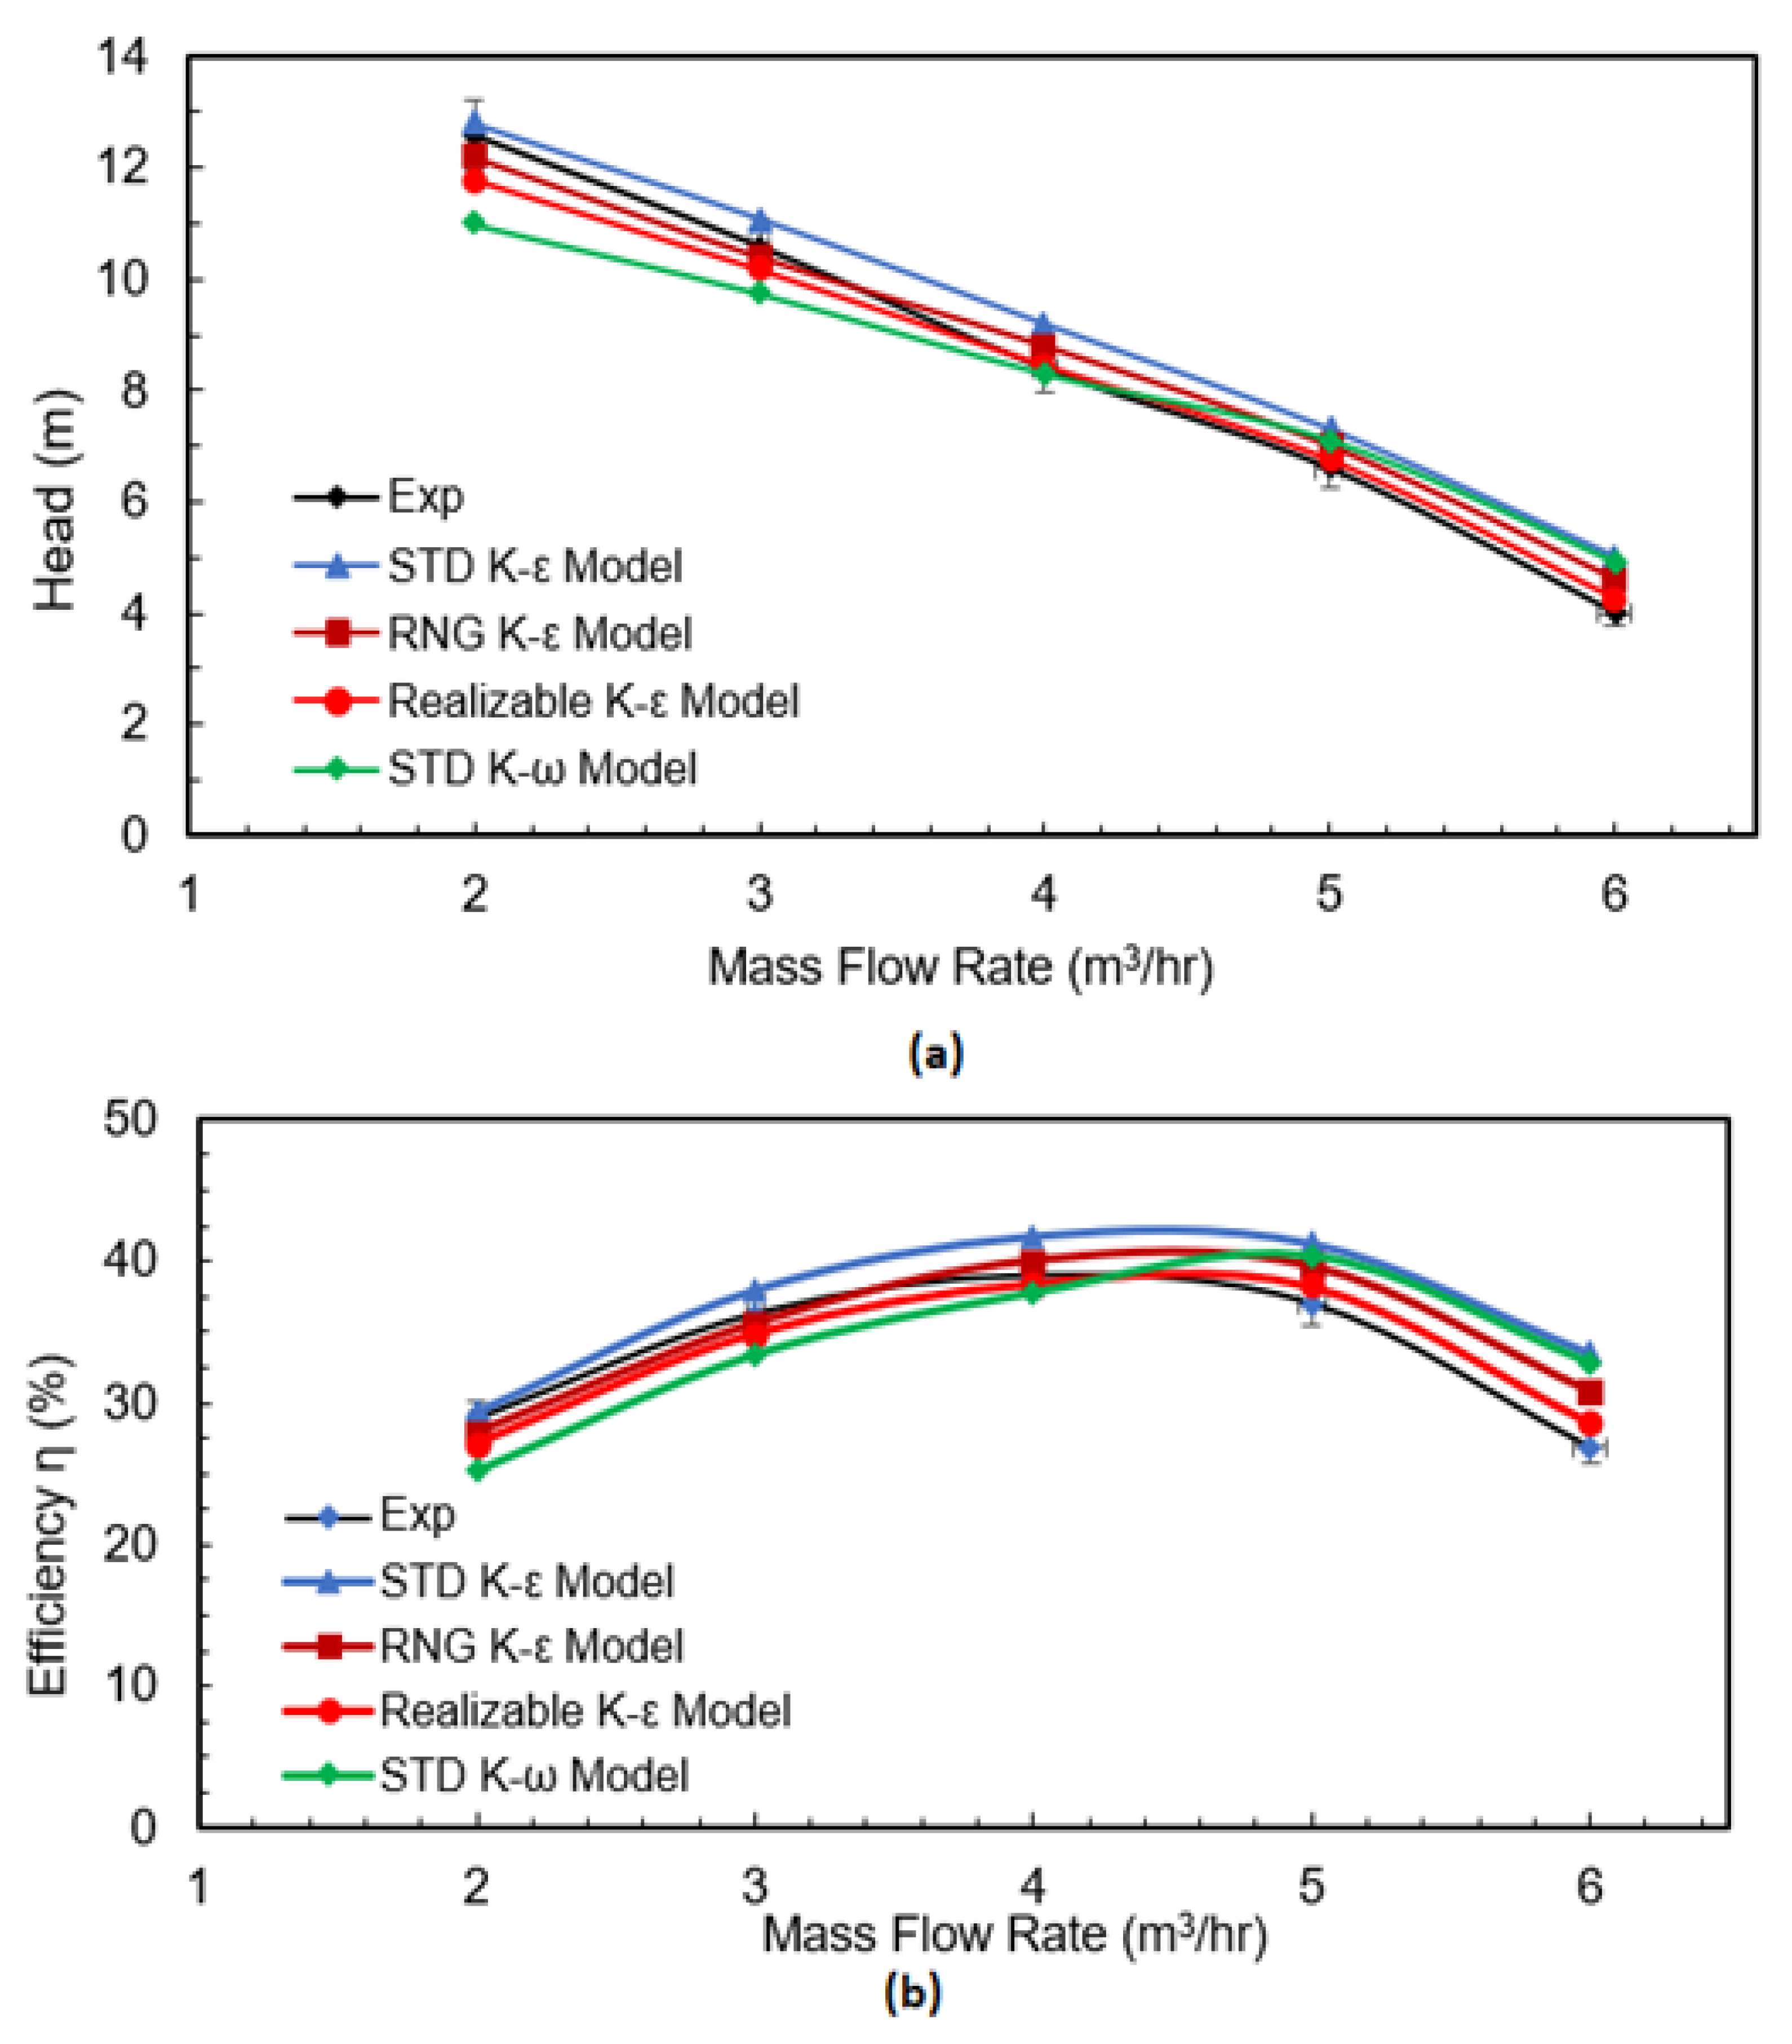
Numerical simulation results obtained of four different turbulence models were compared with experimental data sets and error bars of experimental data as shown in Figure 9. Figure 9a reveals that the head-flow rate curves of these four turbulence models are in good agreement with the experimental results. In both the experimental and computational results with an increase of mass flow rate, pressure head decreased gradually [7]. In head-flow rate curves, mass flow rate of 2 m3/h, the standard K-ω model deviates more and the standard K-ε model deviates the least compared with the experimental results. With the increase in the mass flow rates, the simulation results deviate more and above the experimental results. The pressure head values (in metres) calculated adopting the standard K-ε model was the highest and the realizable K-ε model gave the lowest value under large-flow conditions. Compared to other turbulence models, the realizable K-ε model gives a more accurate pump performance prediction. Figure 9b shows the efficiency-flow rate curves of the four turbulence models Under large flow conditions, the experimental values are less than those provided by the four turbulence models, and the realizable K-ε model shows a minimum. The discrepancy in the calculation of efficiency using the standard K-ω model is the largest and with the realizable K-ε model it is the least. A comparison of the efficiency-flow rate curves of the four turbulence models indicates that the realizable k-ε model is the most efficient.
The numerical simulation approach largely satisfies the engineering requirements. However, the simulated values are usually larger than the experimental values, owing to the omission of the leakage and mechanical losses. During the entire working conditions, the standard K-ε model was found to be operationally easy and robust to achieve convergent results. The standard K-ω model shows more discrepancy in the results compared to the other three turbulence models. Though many earlier studies have employed standard K-ω models for swirling flows in turbomachinery [11] and this model can predict the flow near the wall region and is appropriate for boundary layer problems having variable pressure gradient, however, K-ε models can predict best results far from wall region too. In the present study, the predicted curve based on the realizable k-ε model showed the best agreement with the experimental values. The realizable k-ε model is of relatively recent development and contains additional turbulent dissipation rate equations and turbulent viscosity terms. As a result, it has a superior ability to predict the flow in complex geometries and for flows involving rotation, and for blunt bodies involving recirculation and flow separations.
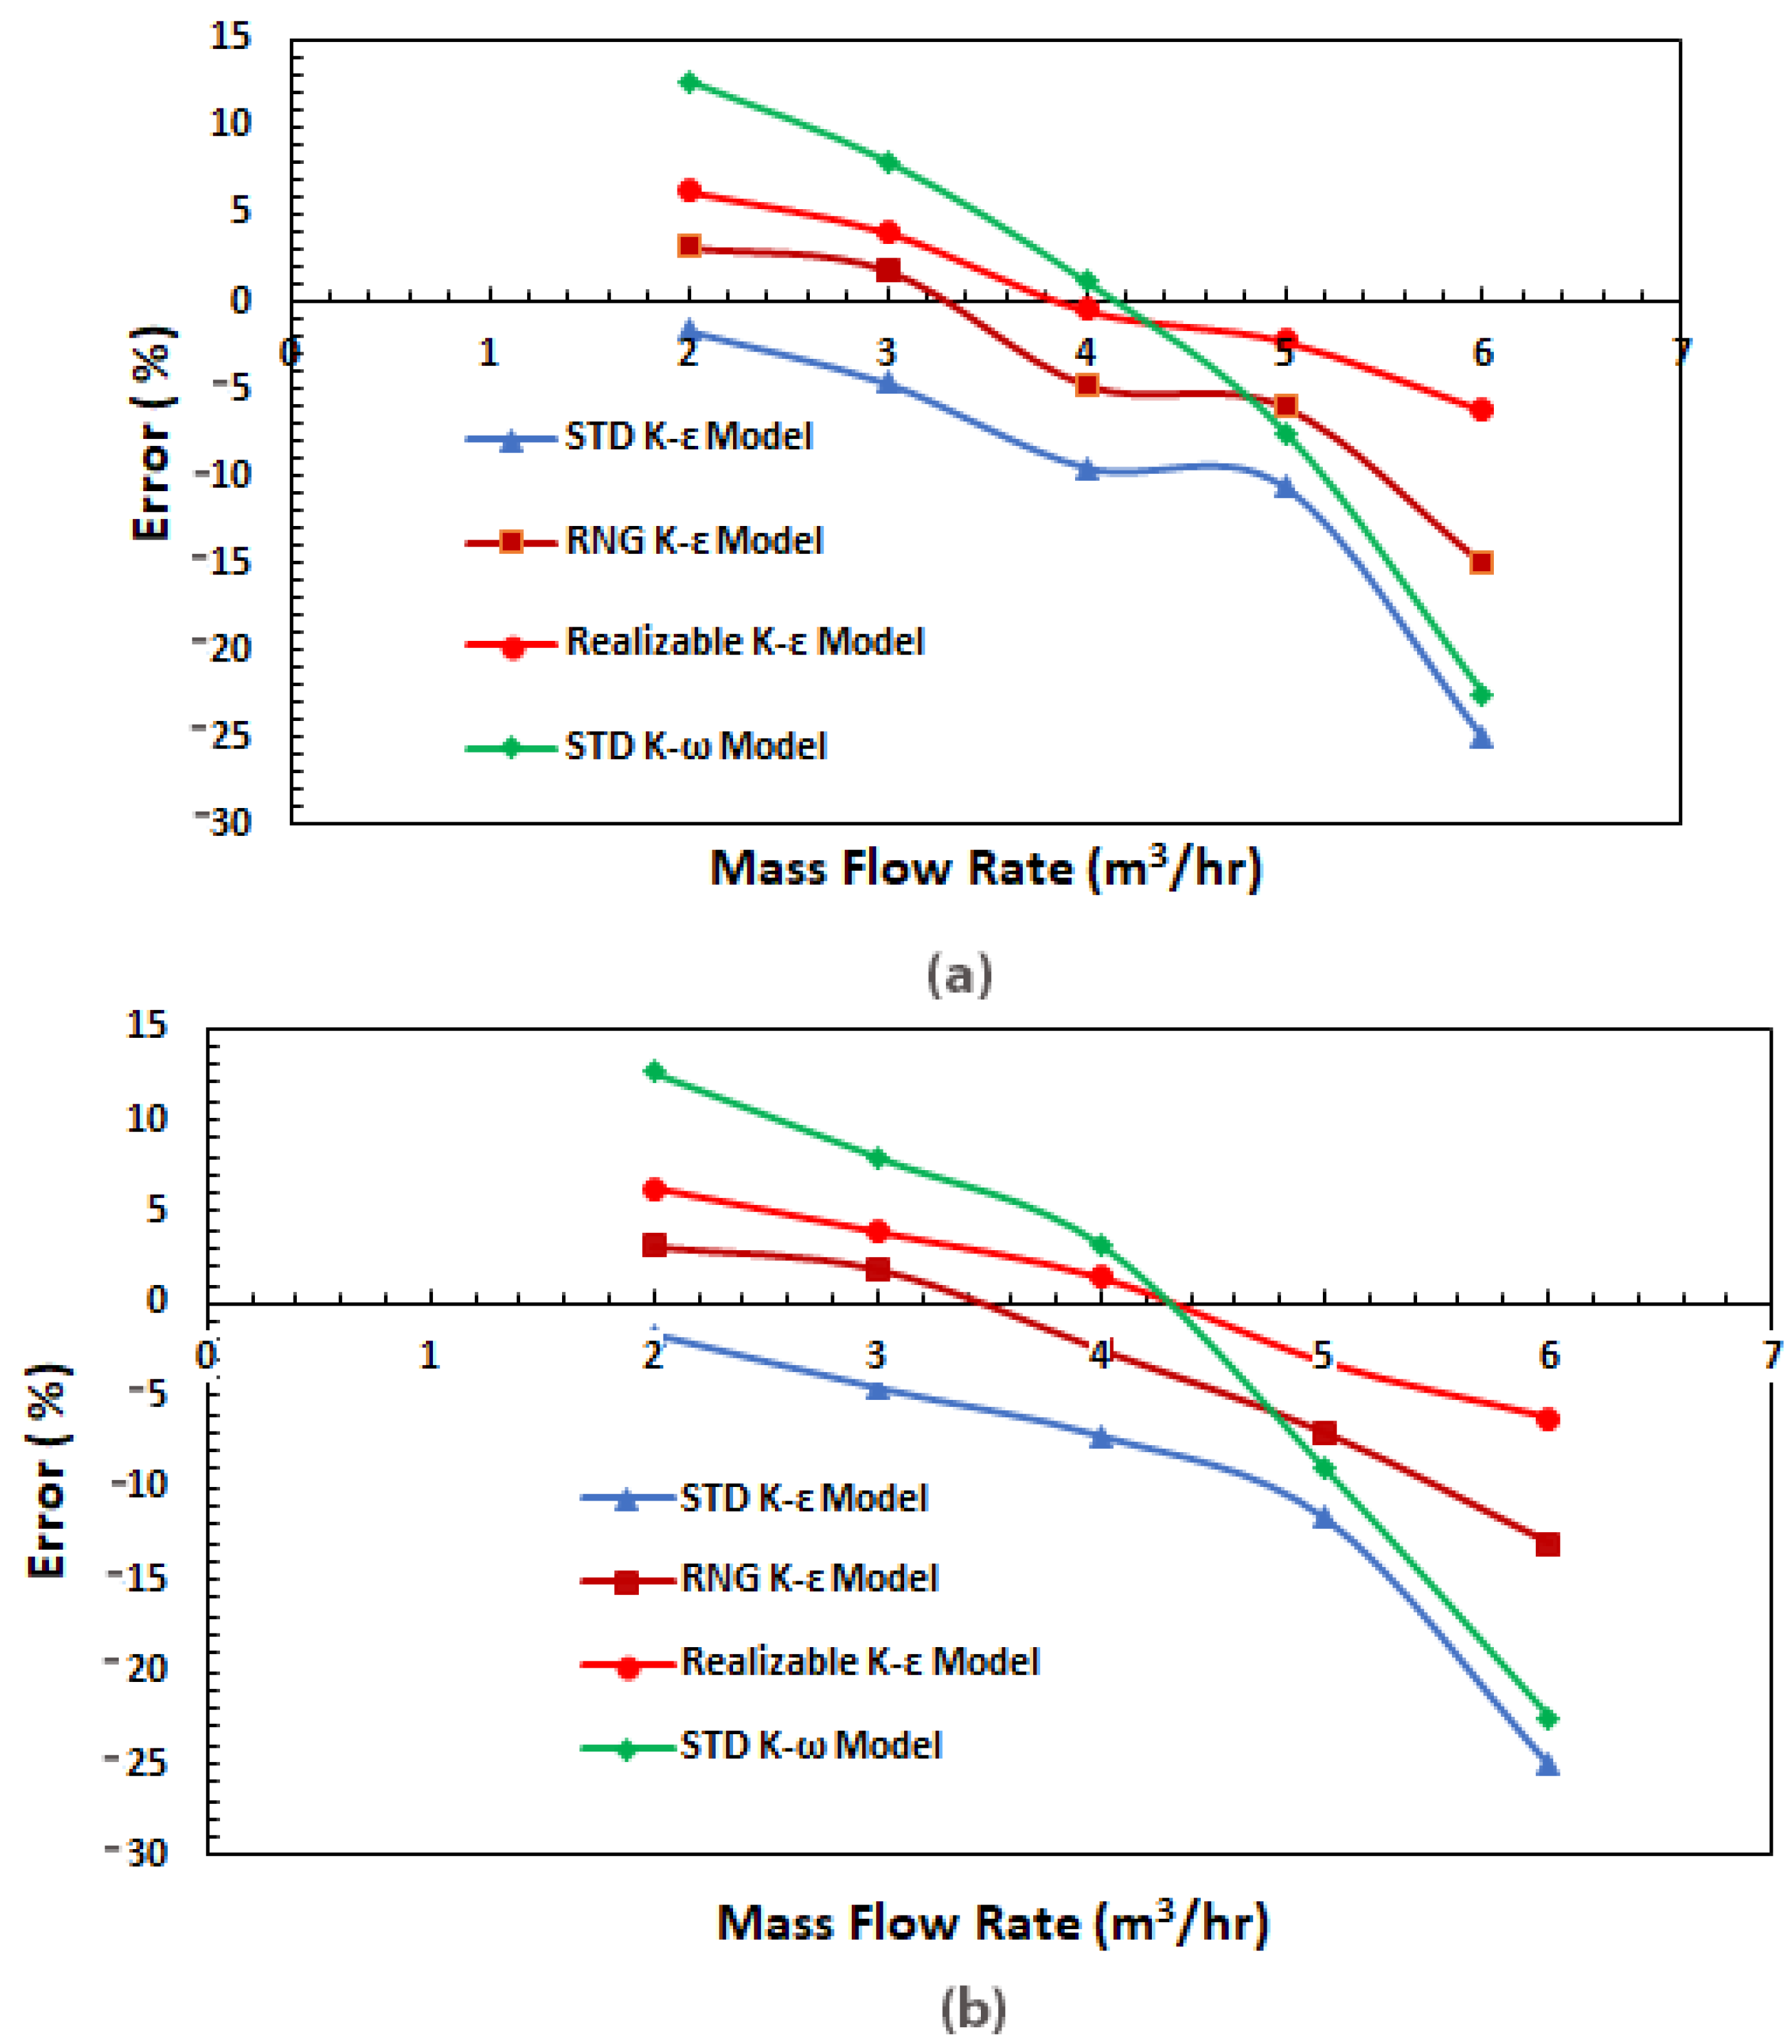
Figure 10a,b illustrate the relative error percentages between the experimental and all four computational test results and the error values can be calculated by using the equation below [17]:
E r r o r = 1 simulation   value test   data
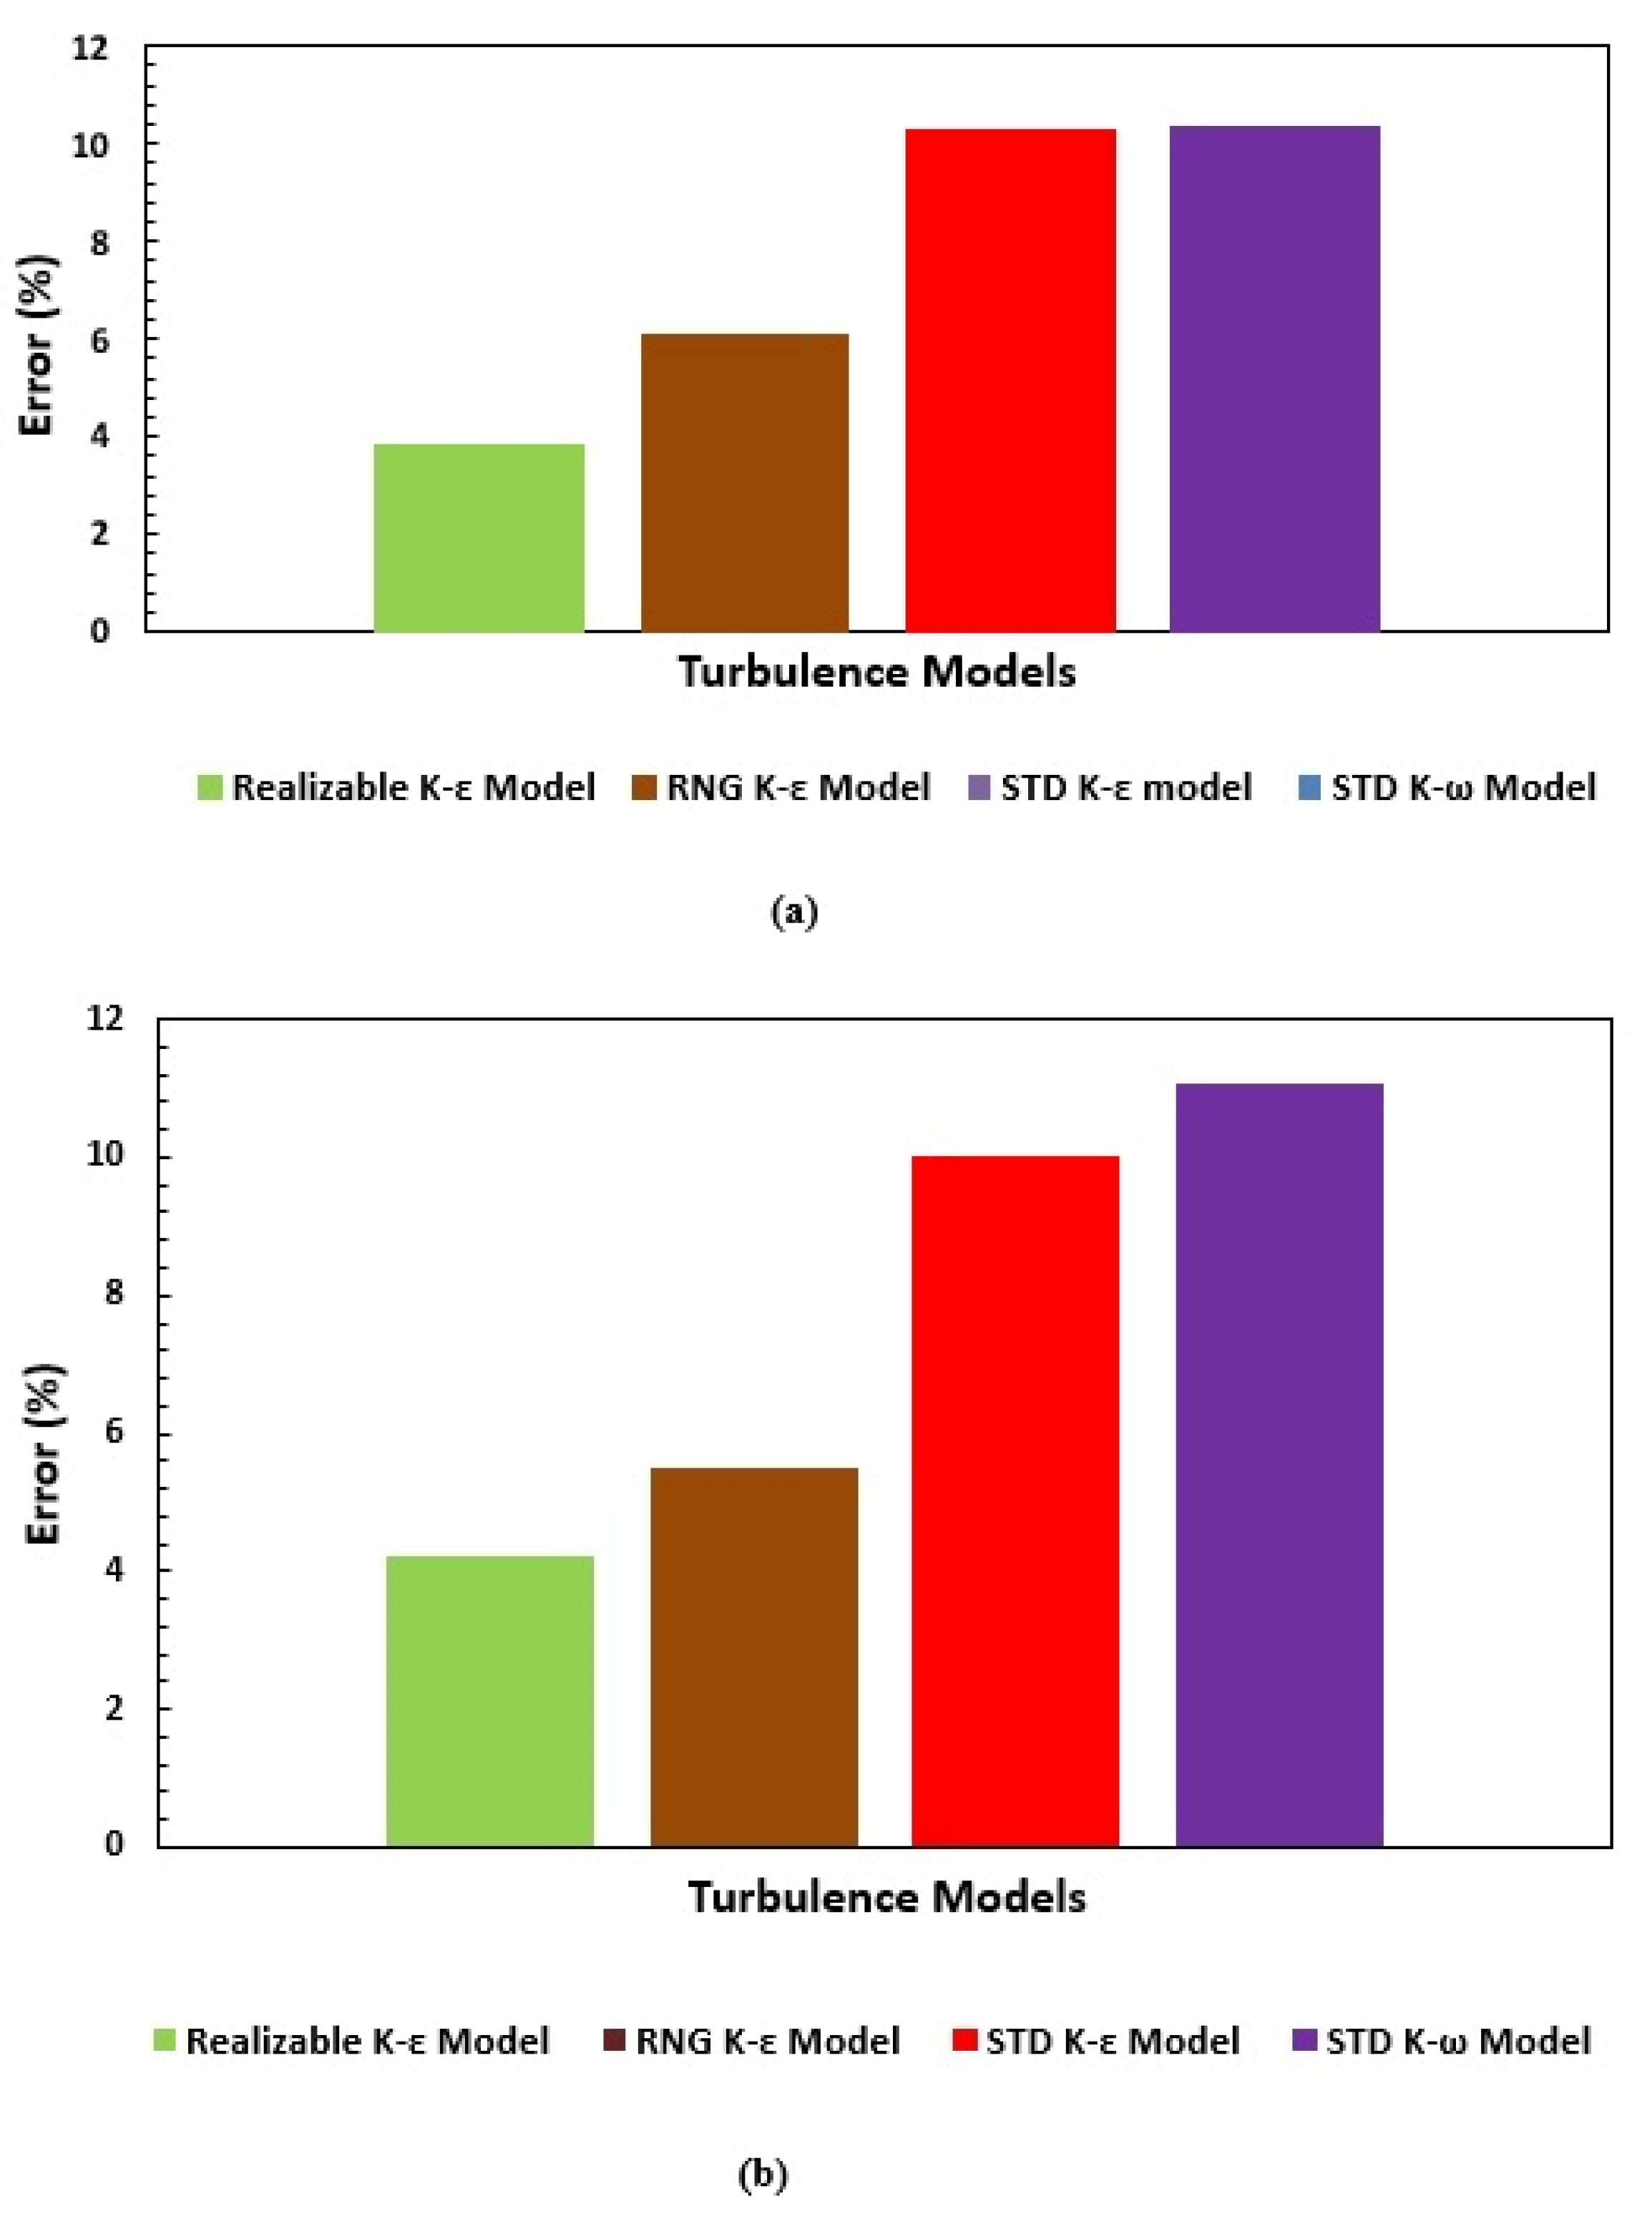
At rated mass flow rates of 3, 4, 5, the calculated error percentages between the four turbulence models and experimental results were small and can give good indication of pump performance, but under large flow conditions, the standard K-ε model gives the worst prediction of pump performance, with a relative deviation of 25%, larger than the experimental results. Out of all the adopted models, the realizable K-ε model presents accurate performance predictions with a relative deviation of less than 1.5 % in head and efficiency under a mass flow rate of 4 m3/hr. Figure 11a, b show the comparison of absolute error for different turbulence models in hydraulic performances of head and efficiency. The overall error percentage with the standard K-ω model was the highest while with the realizable K-ε model it was the lowest, which is about 3.85% and 4.2% head and efficiency, respectively. Among the four turbulence models, calculation accuracy using the realizable K-ε model was thus the finest and the realizable K-ε model is found to be the most appropriate model for the simulation of Liquivac pumps. As different turbulence models give different performance predictions there was a need to perform a thorough analysis to check the applicability of the different turbulence models ahead of choosing a model for performance prediction and internal flow characteristics of the pump.

4.2. Optimization of the Twin Start Helical Rotor (Impeller/Rotor)

The existing Liquivac multiphase flow pumps consist of a twin start helical rotor, suction chamber, discharge chamber, casing, and shaft. The performance of a Liquivac multiphase flow pump depends on the active pump component which is the twin start helical rotor. Active pump component transfers mechanical energy (rotation) to fluid energy (velocity, pressure).
This part of the present research focuses on the optimization of the twin start helical rotor type impeller. The geometry of a twin start helical rotor is highly complex. Geometric features of the rotor were studied in detail and parameterization of twin start helical rotor geometry was performed [18]. The rotation speed and rotor blades, namely front and back blades of the twin start helical rotor and pitch of the flights (helical blades) determine the nominal head.
Existing twin start helical rotors contain two blades in the front side of about 45 mm length and two blades at the back side of about 15 mm length. The two flights are attached in between front blades and back blades. Pitch of the flights is 30 mm. All the blades have 3 mm thickness. For better understanding, detailed geometric parameters and isometric view of the twin start helical rotor is shown in Figure 4a,b, respectively.
The optimization task was accomplished by comparing four geometric models with different geometric blade parameters and finding the best performing geometric model out of them. The first geometric model consists of adding one extra blade to the front side, back side and one extra flight in between the existing flights in addition to the existing one. Three blades in front and back side of the twin start helical rotor were mounted equidistantly. The angle between three blades was set at 120° each. The three flights were built in between the three front and back side blades. Pitch of the flights is 30 mm. Detailed geometric parameters and isometric view of rotor with three equidistant blades are shown in Figure 12.
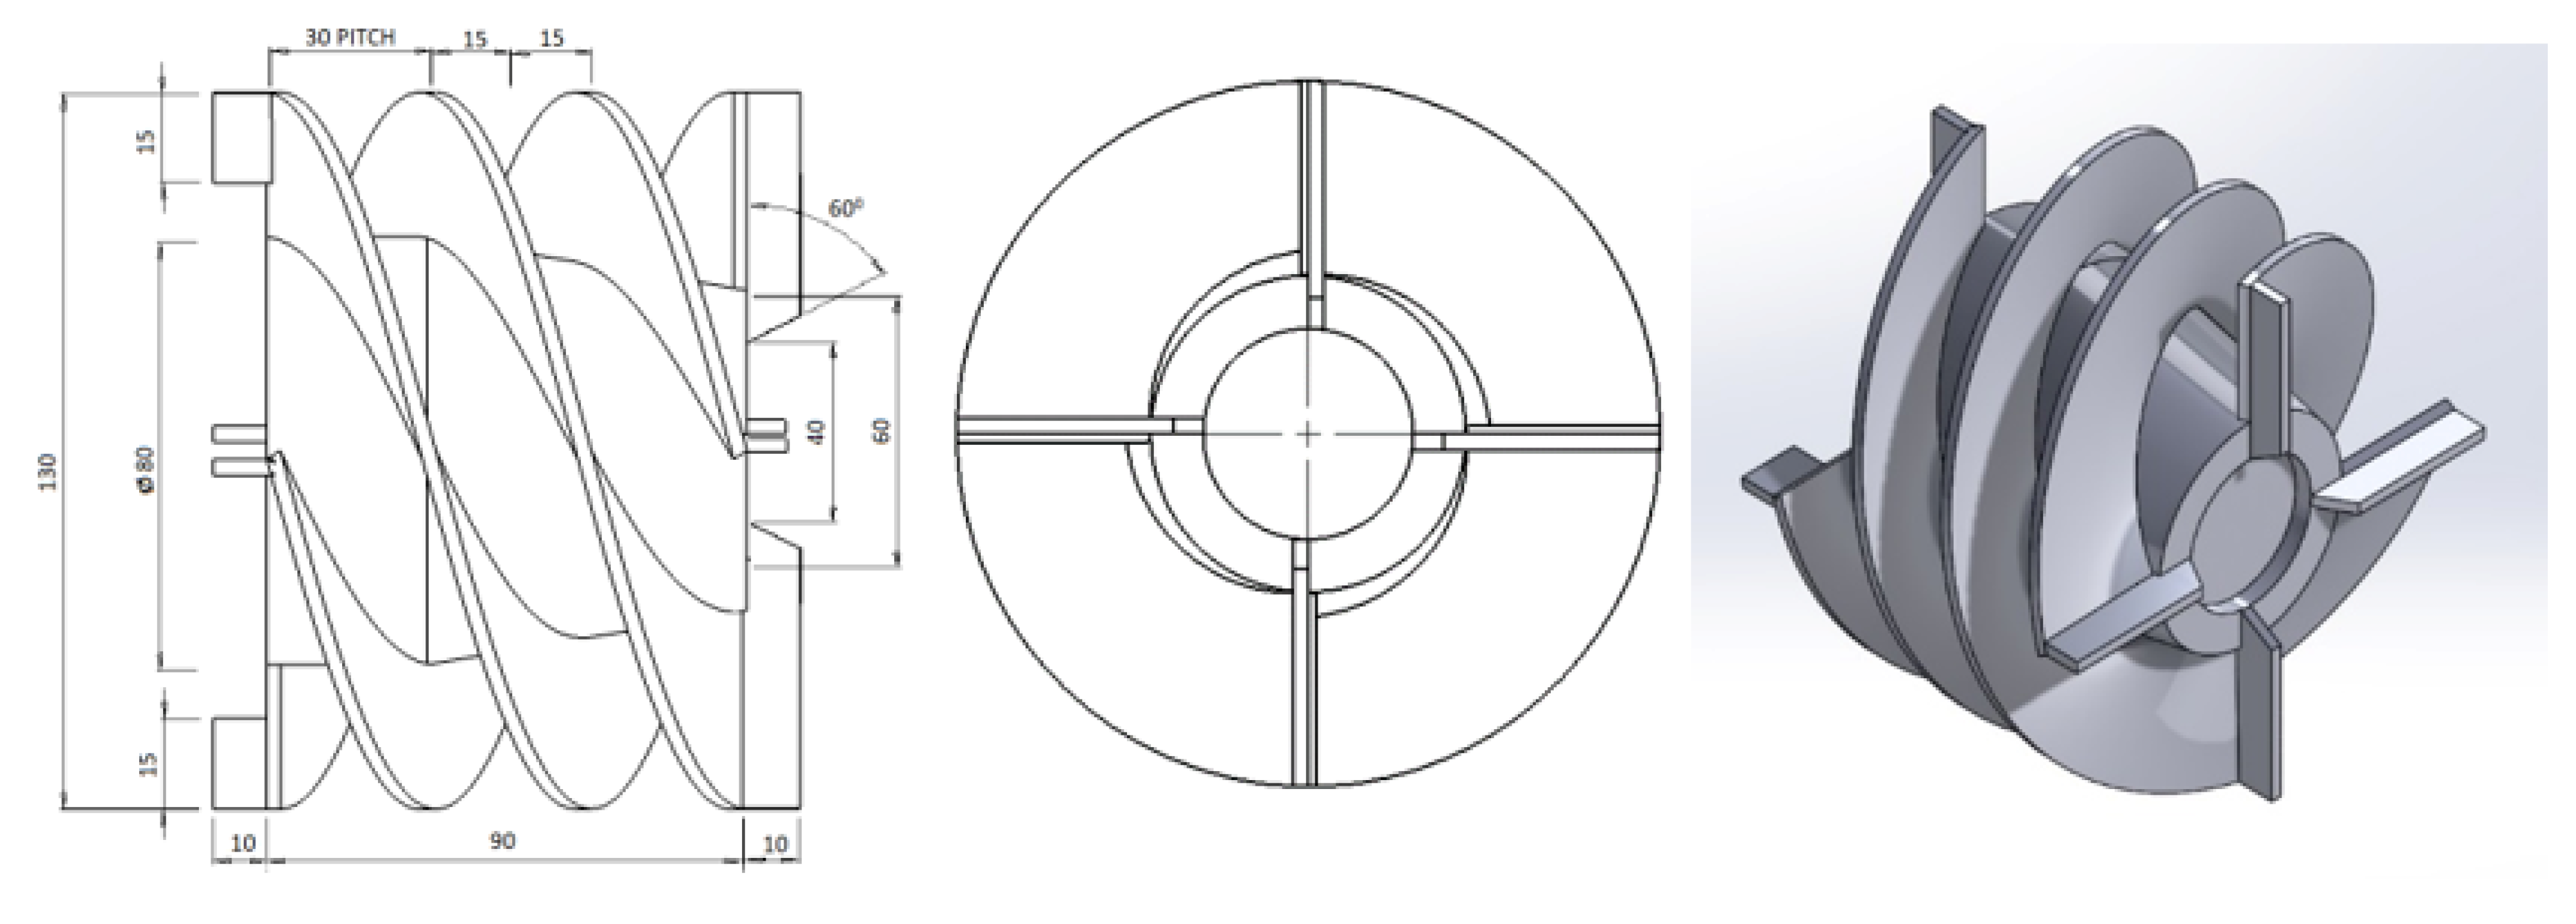
The second model comprises of adding two extra blades to the front side, back side and two extra flights in between the existing flights in addition to the existing one. Four blades in front and back side of the rotor are mounted equidistantly. The angle between the four blades was set at 90° each. The four flights were built in between four front side blades and four back side blades. Pitch of the flights is 30 mm. Detailed geometric parameters and isometric view of the rotor with four equidistant blades is shown in Figure 13.
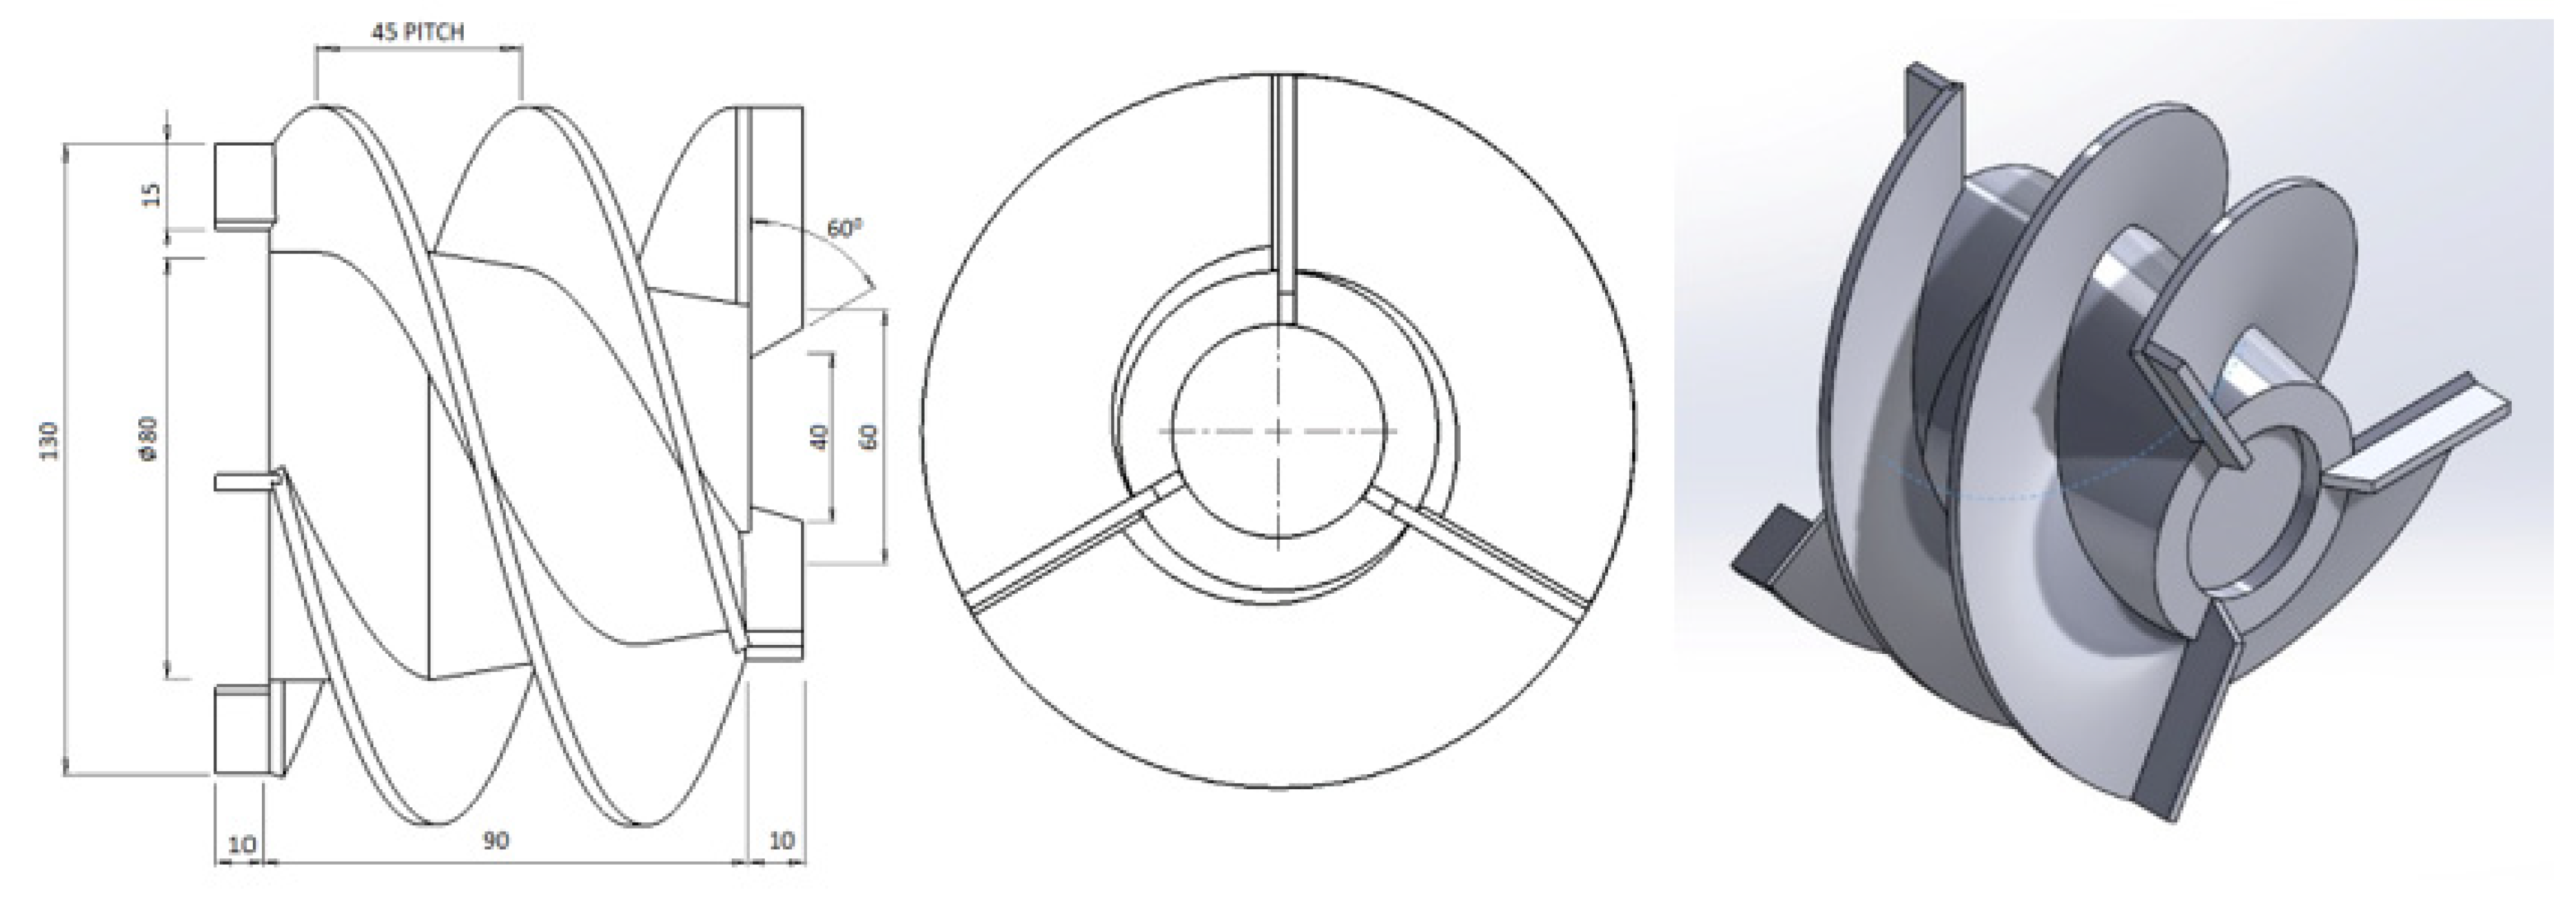
The third model of rotor consists of adding one extra blade to the front side, back side and one extra flight in between the existing flight in addition to the existing one. This model is same as first geometric model except pitch length between the two flights which is 45 mm here and in the first model it was 30 mm. Detailed geometric parameters and isometric view of the rotor with three equidistant blades are shown in Figure 14.
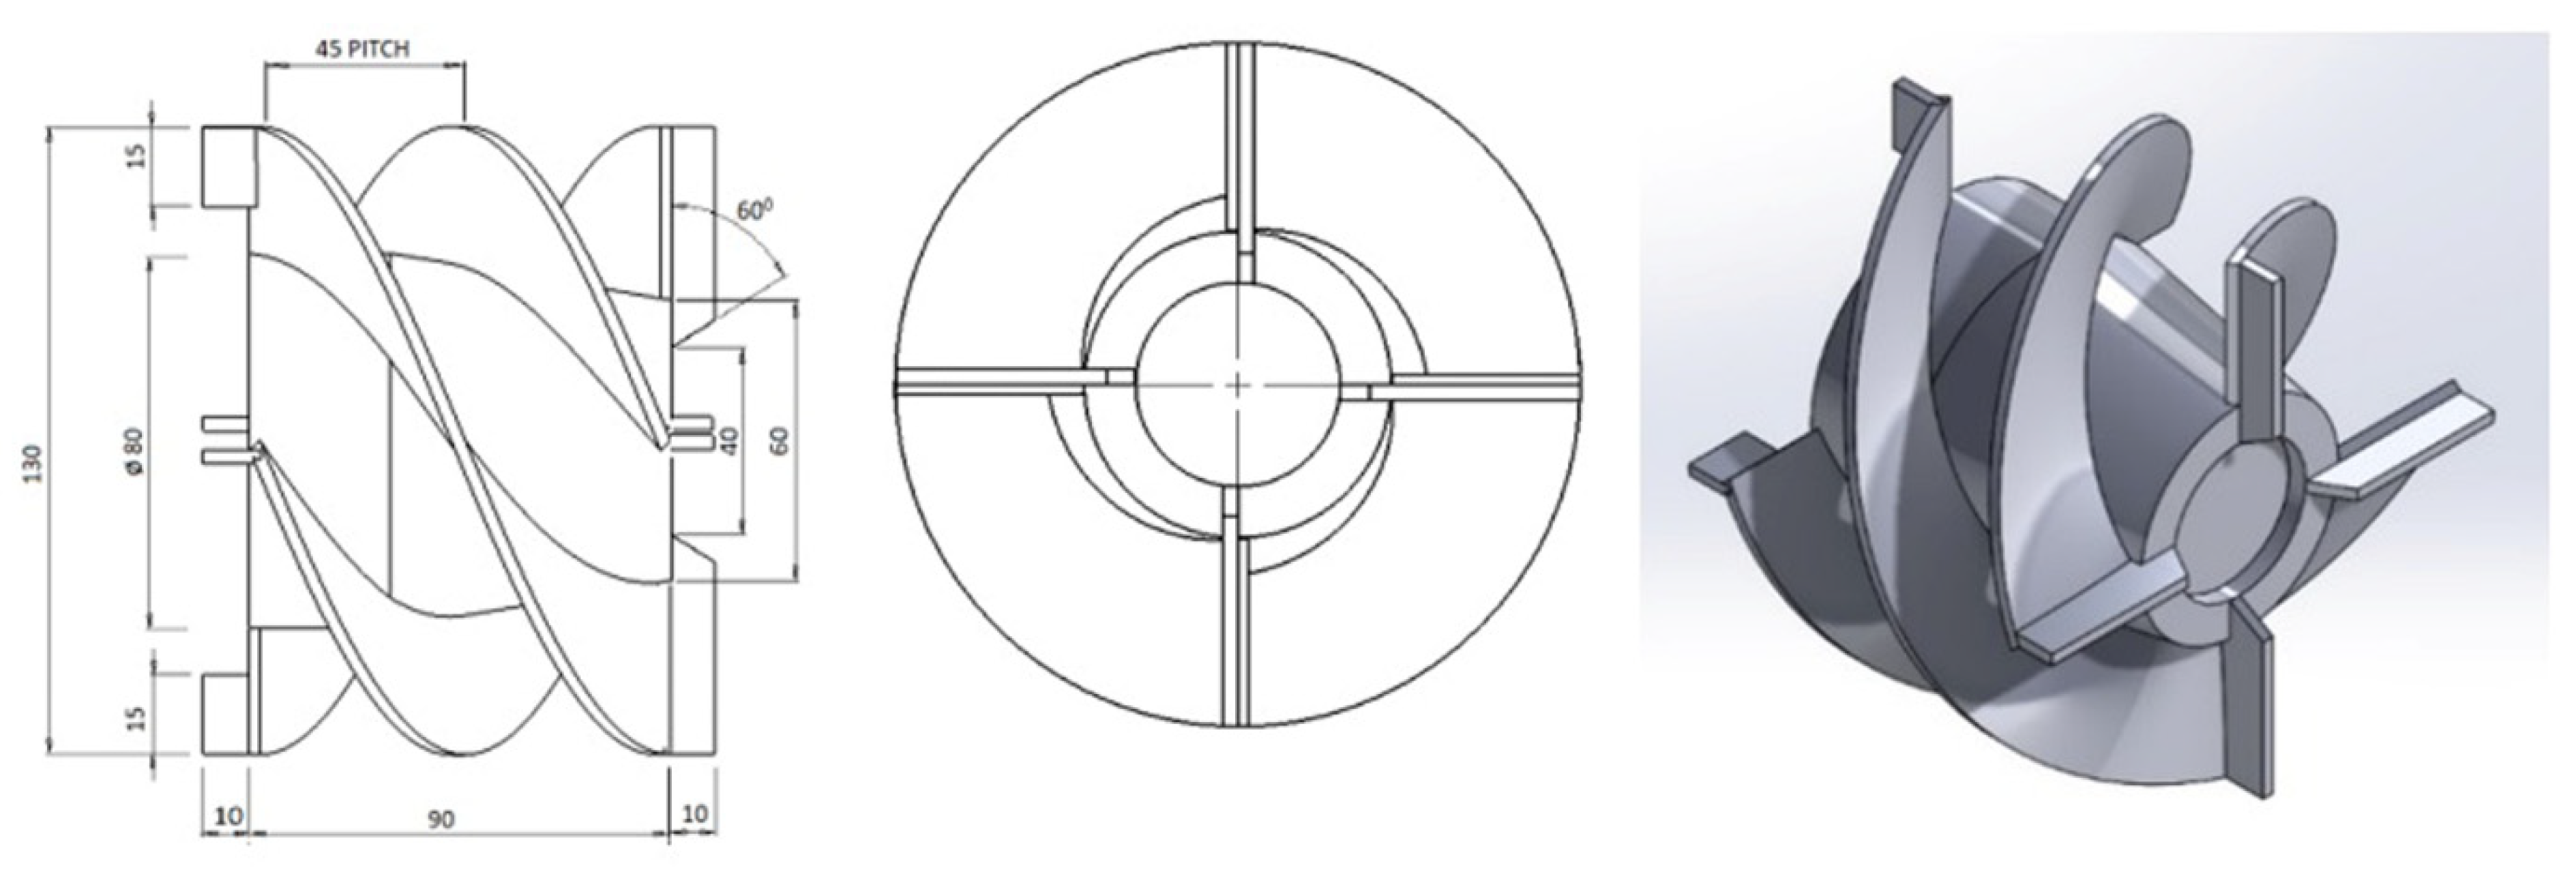
The fourth model comprises of adding two more blades to the front side, back side and two extra flights in between the existing flights in addition to the existing one. This is same as second geometric model except the pitch length between the adjacent flights. Here it is 45 mm and in second model it was 30 mm. Detailed geometric parameters and isometric view of the rotor with four equidistant blades are shown in Figure 15.

4.2.1. Variation of Velocity Magnitude

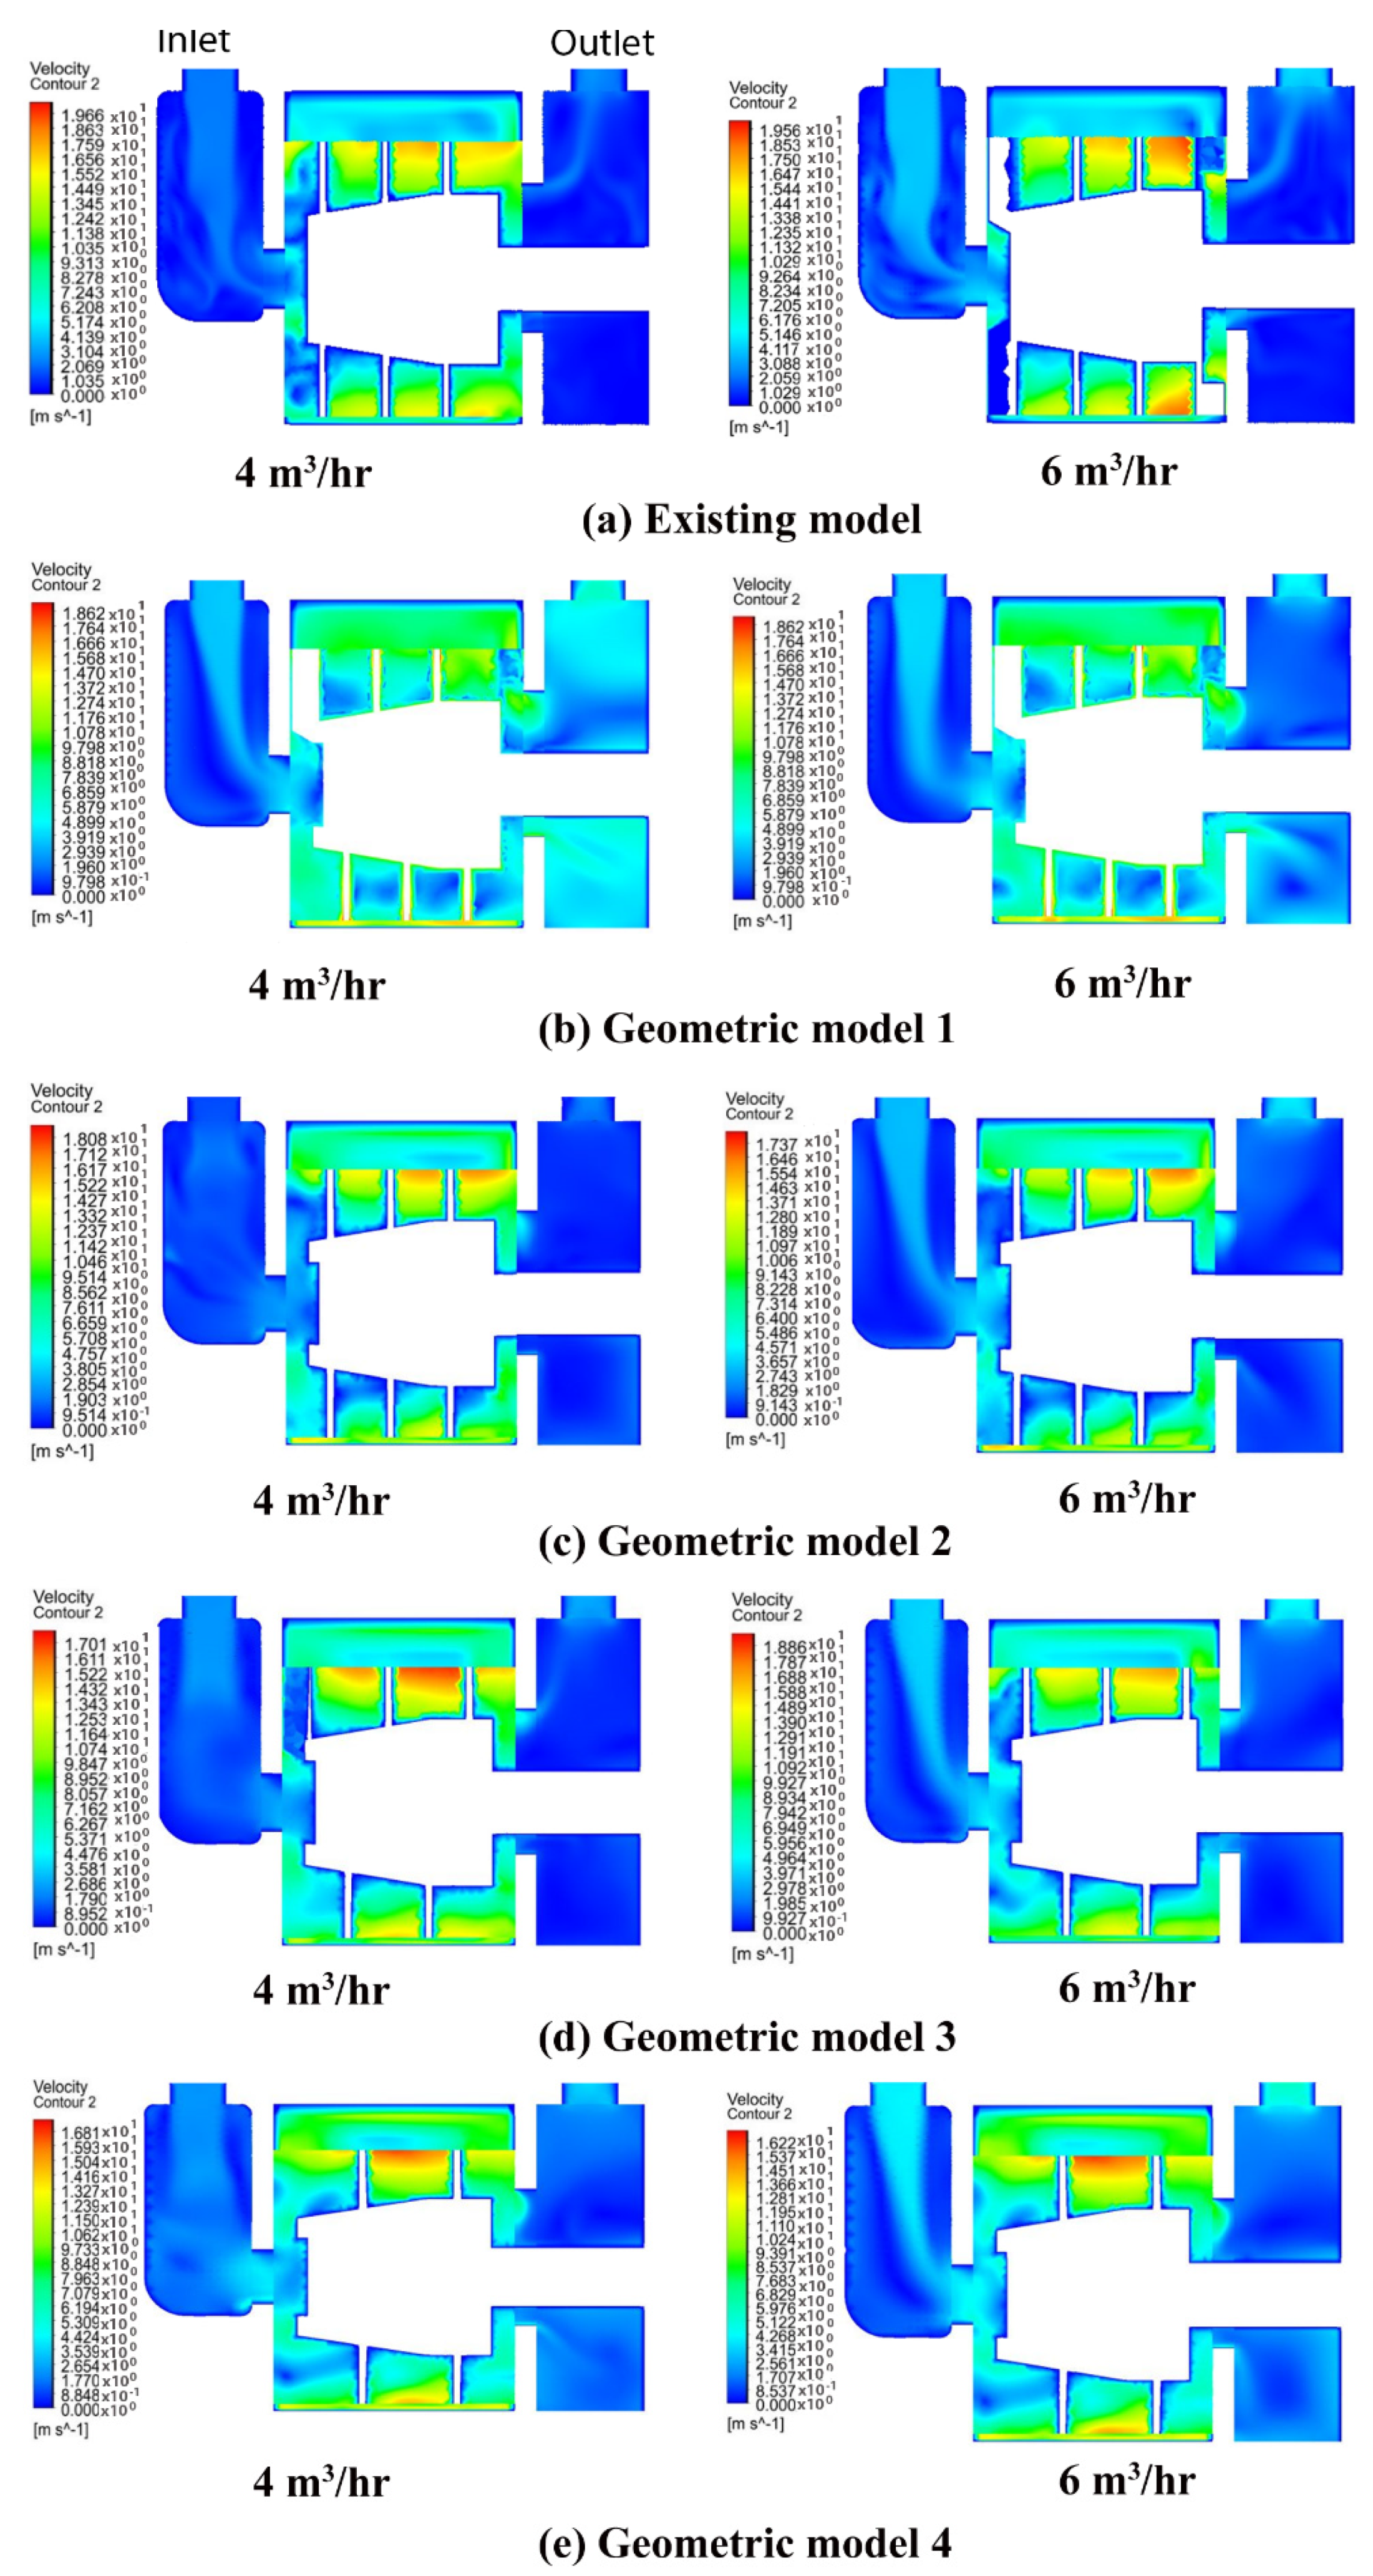
As seen from the previous section, the realizable K-ϵ model was found to be the most appropriate model for simulating the flow characteristic in the pump. Following this, another study on the effect of geometric modification on the pump performance was conducted using the identified appropriate turbulence model (realizable K-ϵ). The CFD analysis simulates the internal flow inside the pump and aids in understanding of more complex phenomena and its evaluation. For better understanding of the flow behaviour, the velocity distribution in the pump at two different flow rates (4 and 6 m3/h) is shown in Figure 16a–e. The asymmetry introduced by the casing and the rotor section of the pump greatly affects the flow in the pump. While it gives a good indication of the flow inside the pump, a strong recirculation zone appears at the rotor and casing close to the rotor exit. The relative velocity was found to be smaller at the eye of the rotor in all cases.
The velocity contours shown in Figure 16a–e clearly indicate the differences in the flow behaviour within the pump with the change in the number of blades. Existing pumps are characterised by a lesser number of blades, so, frictional losses are decreased but there is an increased pitch ratio aiding energy stratification within the channels and thus a jet/wake is formed at the exit of the channel. This causes secondary flow losses and strident non-uniformity at the exit that increases the secondary losses, despite the reduced frictional losses and hence decreasing the efficiency of the pump [19].
In our geometrical modifications with increased number of blades there is an appropriate balance between the increase in the blade frictional losses and the decrease in the energy stratification and jet/wake distribution indicating uniformity of the flow at the channel exit. The case of geometrical impeller model 2 (Figure 16c) shows that the velocity gradient between the rotor and stator is lowest and so, decreased mixing losses. This confirms low Carnot losses (sudden enlargement) compared with other considered geometrical models. Also, a high velocity gradient is observed between the rotor exit and the discharge chamber in all other improvised geometrical models considered, except model 2 which confirms the increased mixing losses. At all flow rates, high relative velocity zones can be found in the casing and rotor section in geometric models 1 and 4 as compared to the other geometric models.

4.2.2. Variation of Static Pressure

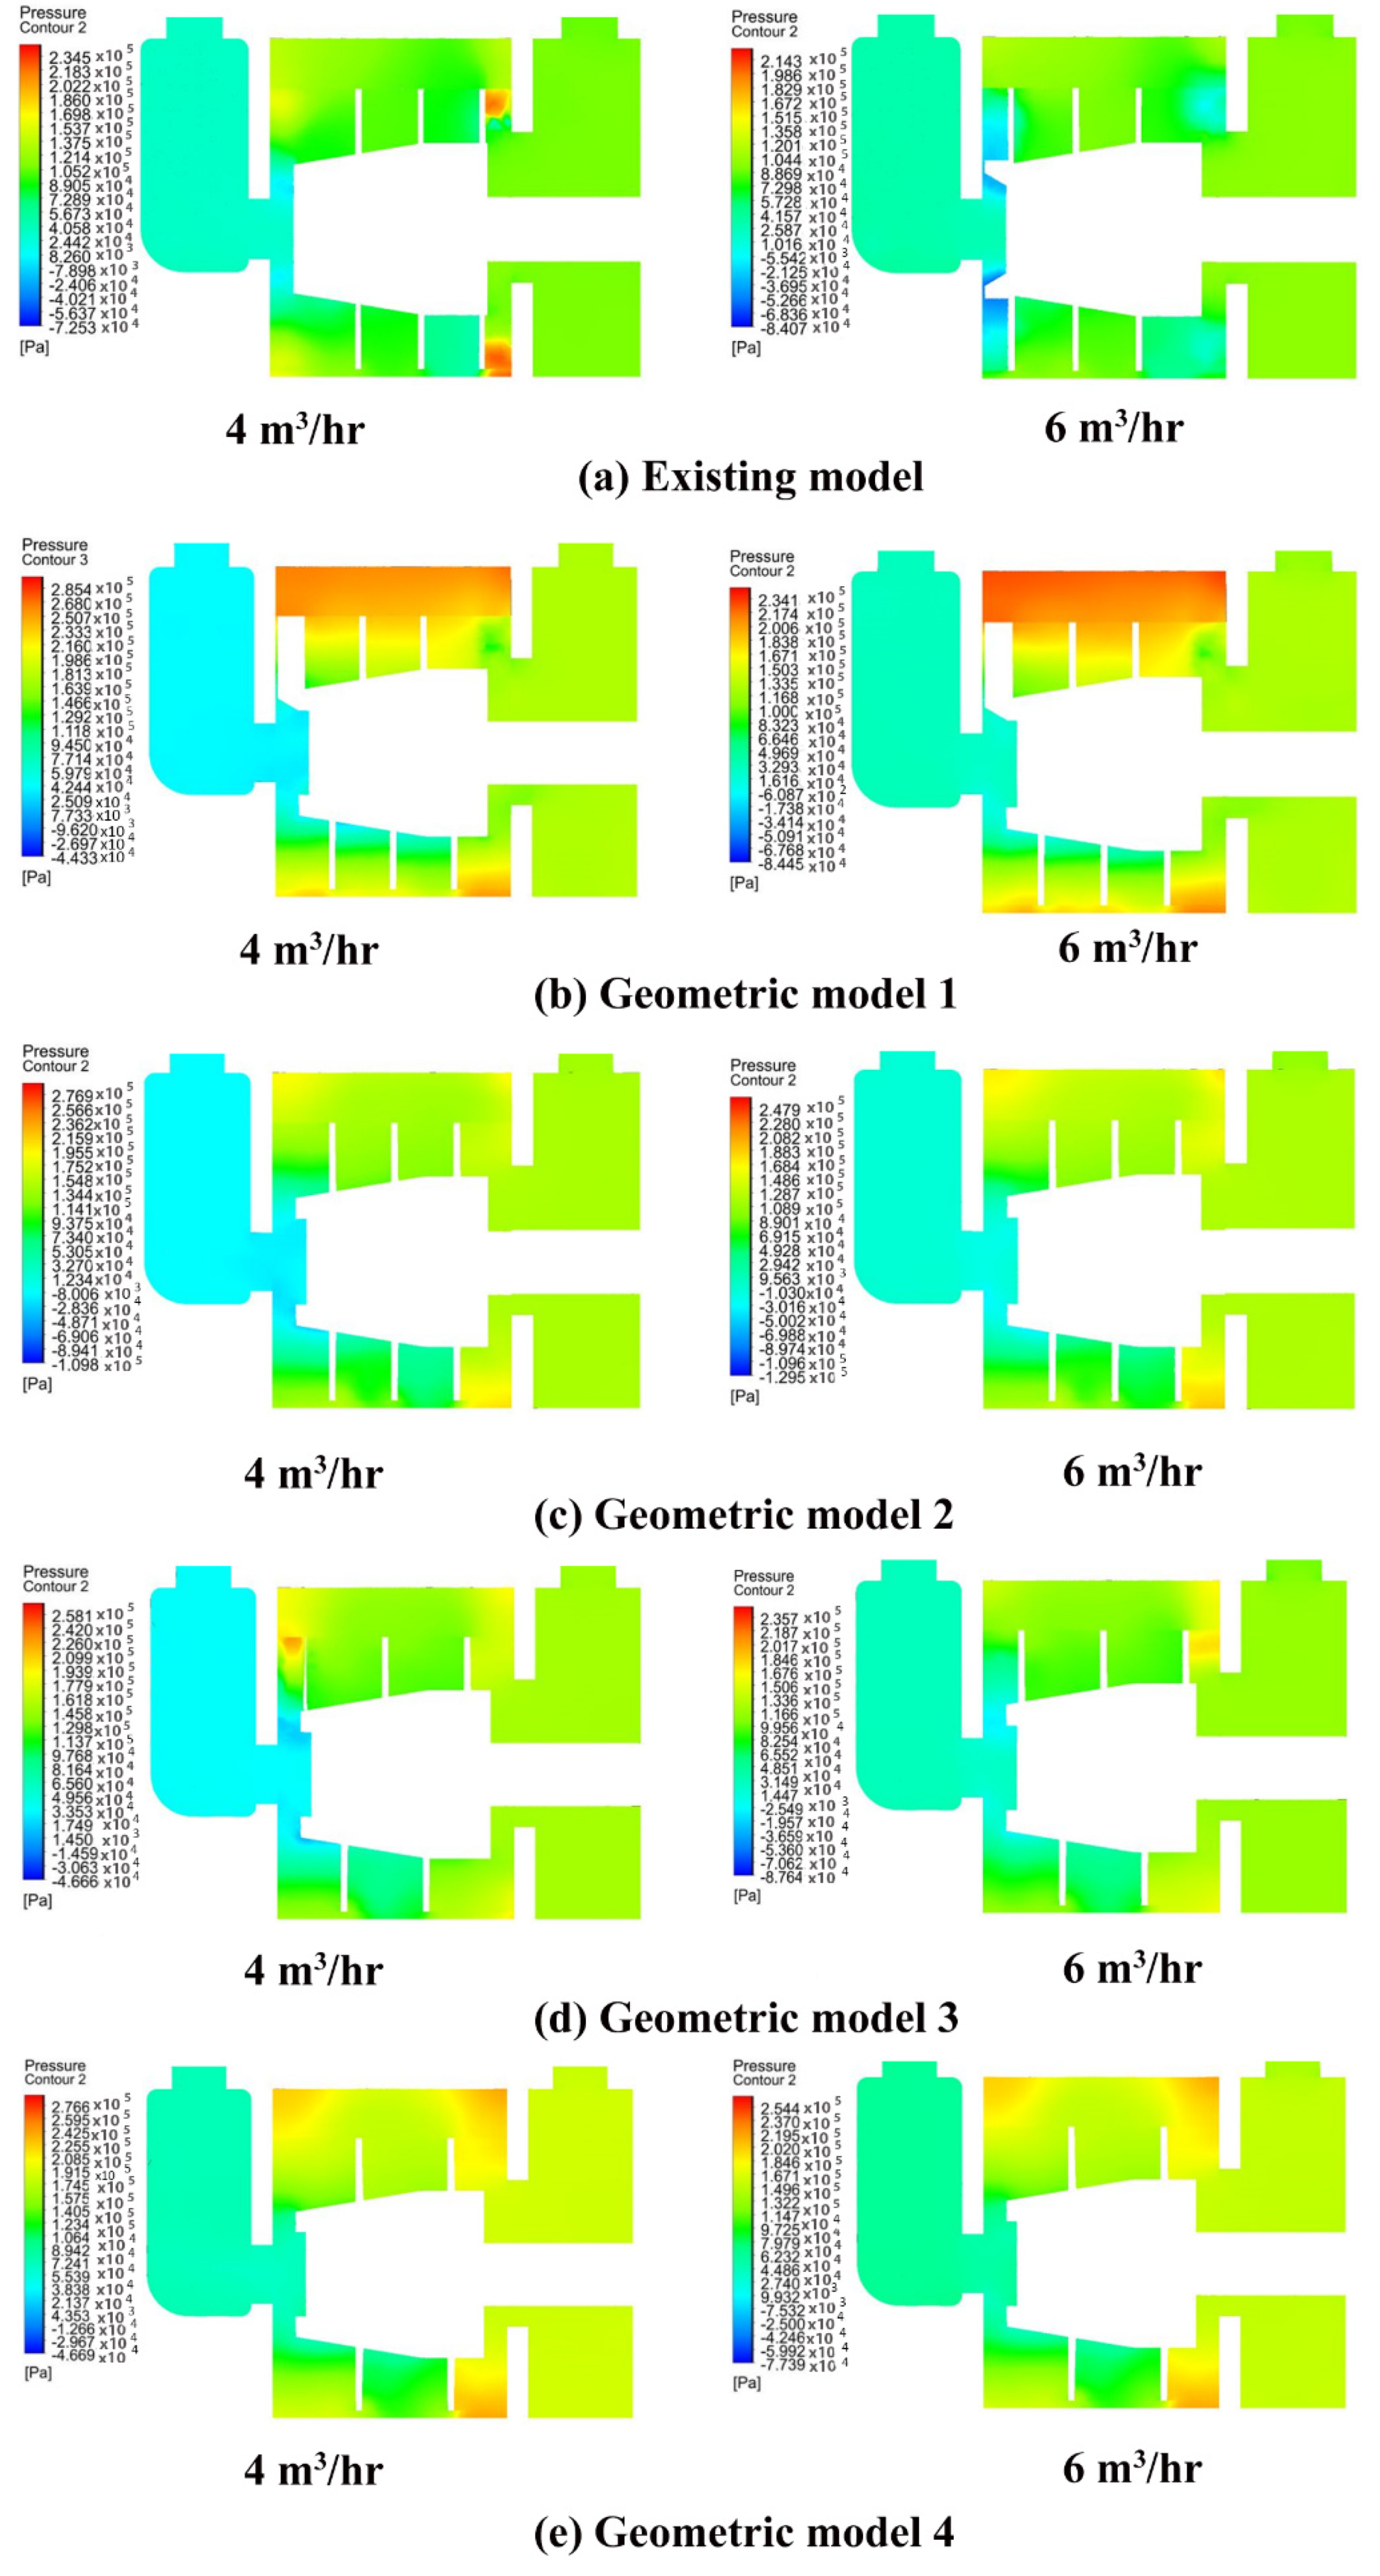
The internal static pressure distribution was calculated in the four different geometric models. Firstly, five different mass flow rates (2, 3, 4, 5 and 6 m3/hr) were simulated with four geometric models. Figure 17a–e depict the static pressure calculated of the four different geometric models under two different flow rate (4 and 6 m3/hr) conditions. The static pressure was found to be lowest at the inlet and highest at the outlet of the pump. It turned out to be greater in the casing section than in the centre of the rotor. When the rotor rotates regularly the casing section always seems to have a high pressure [9] and the lowest pressure was in the eye of the rotor. This is due to the centrifugal force acting on the fluid in between the rotor blades when the rotor starts rotating. This centrifugal force pushes the fluid outwards forming an empty void at the centre of the rotor. This void translates to a low-pressure region at the centre of the rotor that the fluid from the suction chamber tries to balance by quickly flowing into that space. However, this increase of flow considerably decreases the pressure in the rotor section and so a disordered pressure distribution was observed. In all the pump models, an overall increase in static pressure was seen with any increase in the flow rate. For geometric model 3, the lower pressure region extends to a larger area than other three types of the rotors under all flow rate conditions. Under all flow rates, geometric model 2 shows the smallest pressure gradient and smallest lower pressure region compared with other three models, proving that the optimised model 2 is the best. This explains the trend in efficiency as geometrical model 2 (four blades, decreased pitch length and most guided internal flow) with most uniform pressure distribution has the highest efficiency and decreased secondary and mixing losses, whereas geometrical model 1 shows non-uniform pressure distribution and the lowest efficiency of all the improvised geometrical models.

4.2.3. Variation of Turbulent Kinetic Energy

The turbulent kinetic energy distribution is shown in Figure 18a–e. Under low flow rate conditions of 4 m3/h, the scope of the turbulent kinetic energy distribution in geometric model 1 was larger than that of other geometrical models. The velocity had an obvious change when the water flows from the rotor to the casing. The operation of geometric model 1 is not stable. Under a flow rate of 4 m3/h, the turbulent kinetic energy distribution scopes of geometric models 3, and 4 were nearly similar and they were slightly larger than that of geometric model 2. For high flow rate conditions of 6 m3/h, the distribution scope of turbulent kinetic energy was almost similar for geometric models of 2, 3 and 4 and less than geometric model 1. According to the analysis of turbulent kinetic energy, the turbulent intensity of geometric model 2 was less intense than that of other geometric models, so the energy loss of model 2 was less than that of other models, which could ensure the high carrying capacity of this pump.

4.2.4. Variation of Pressure Head and Efficiency

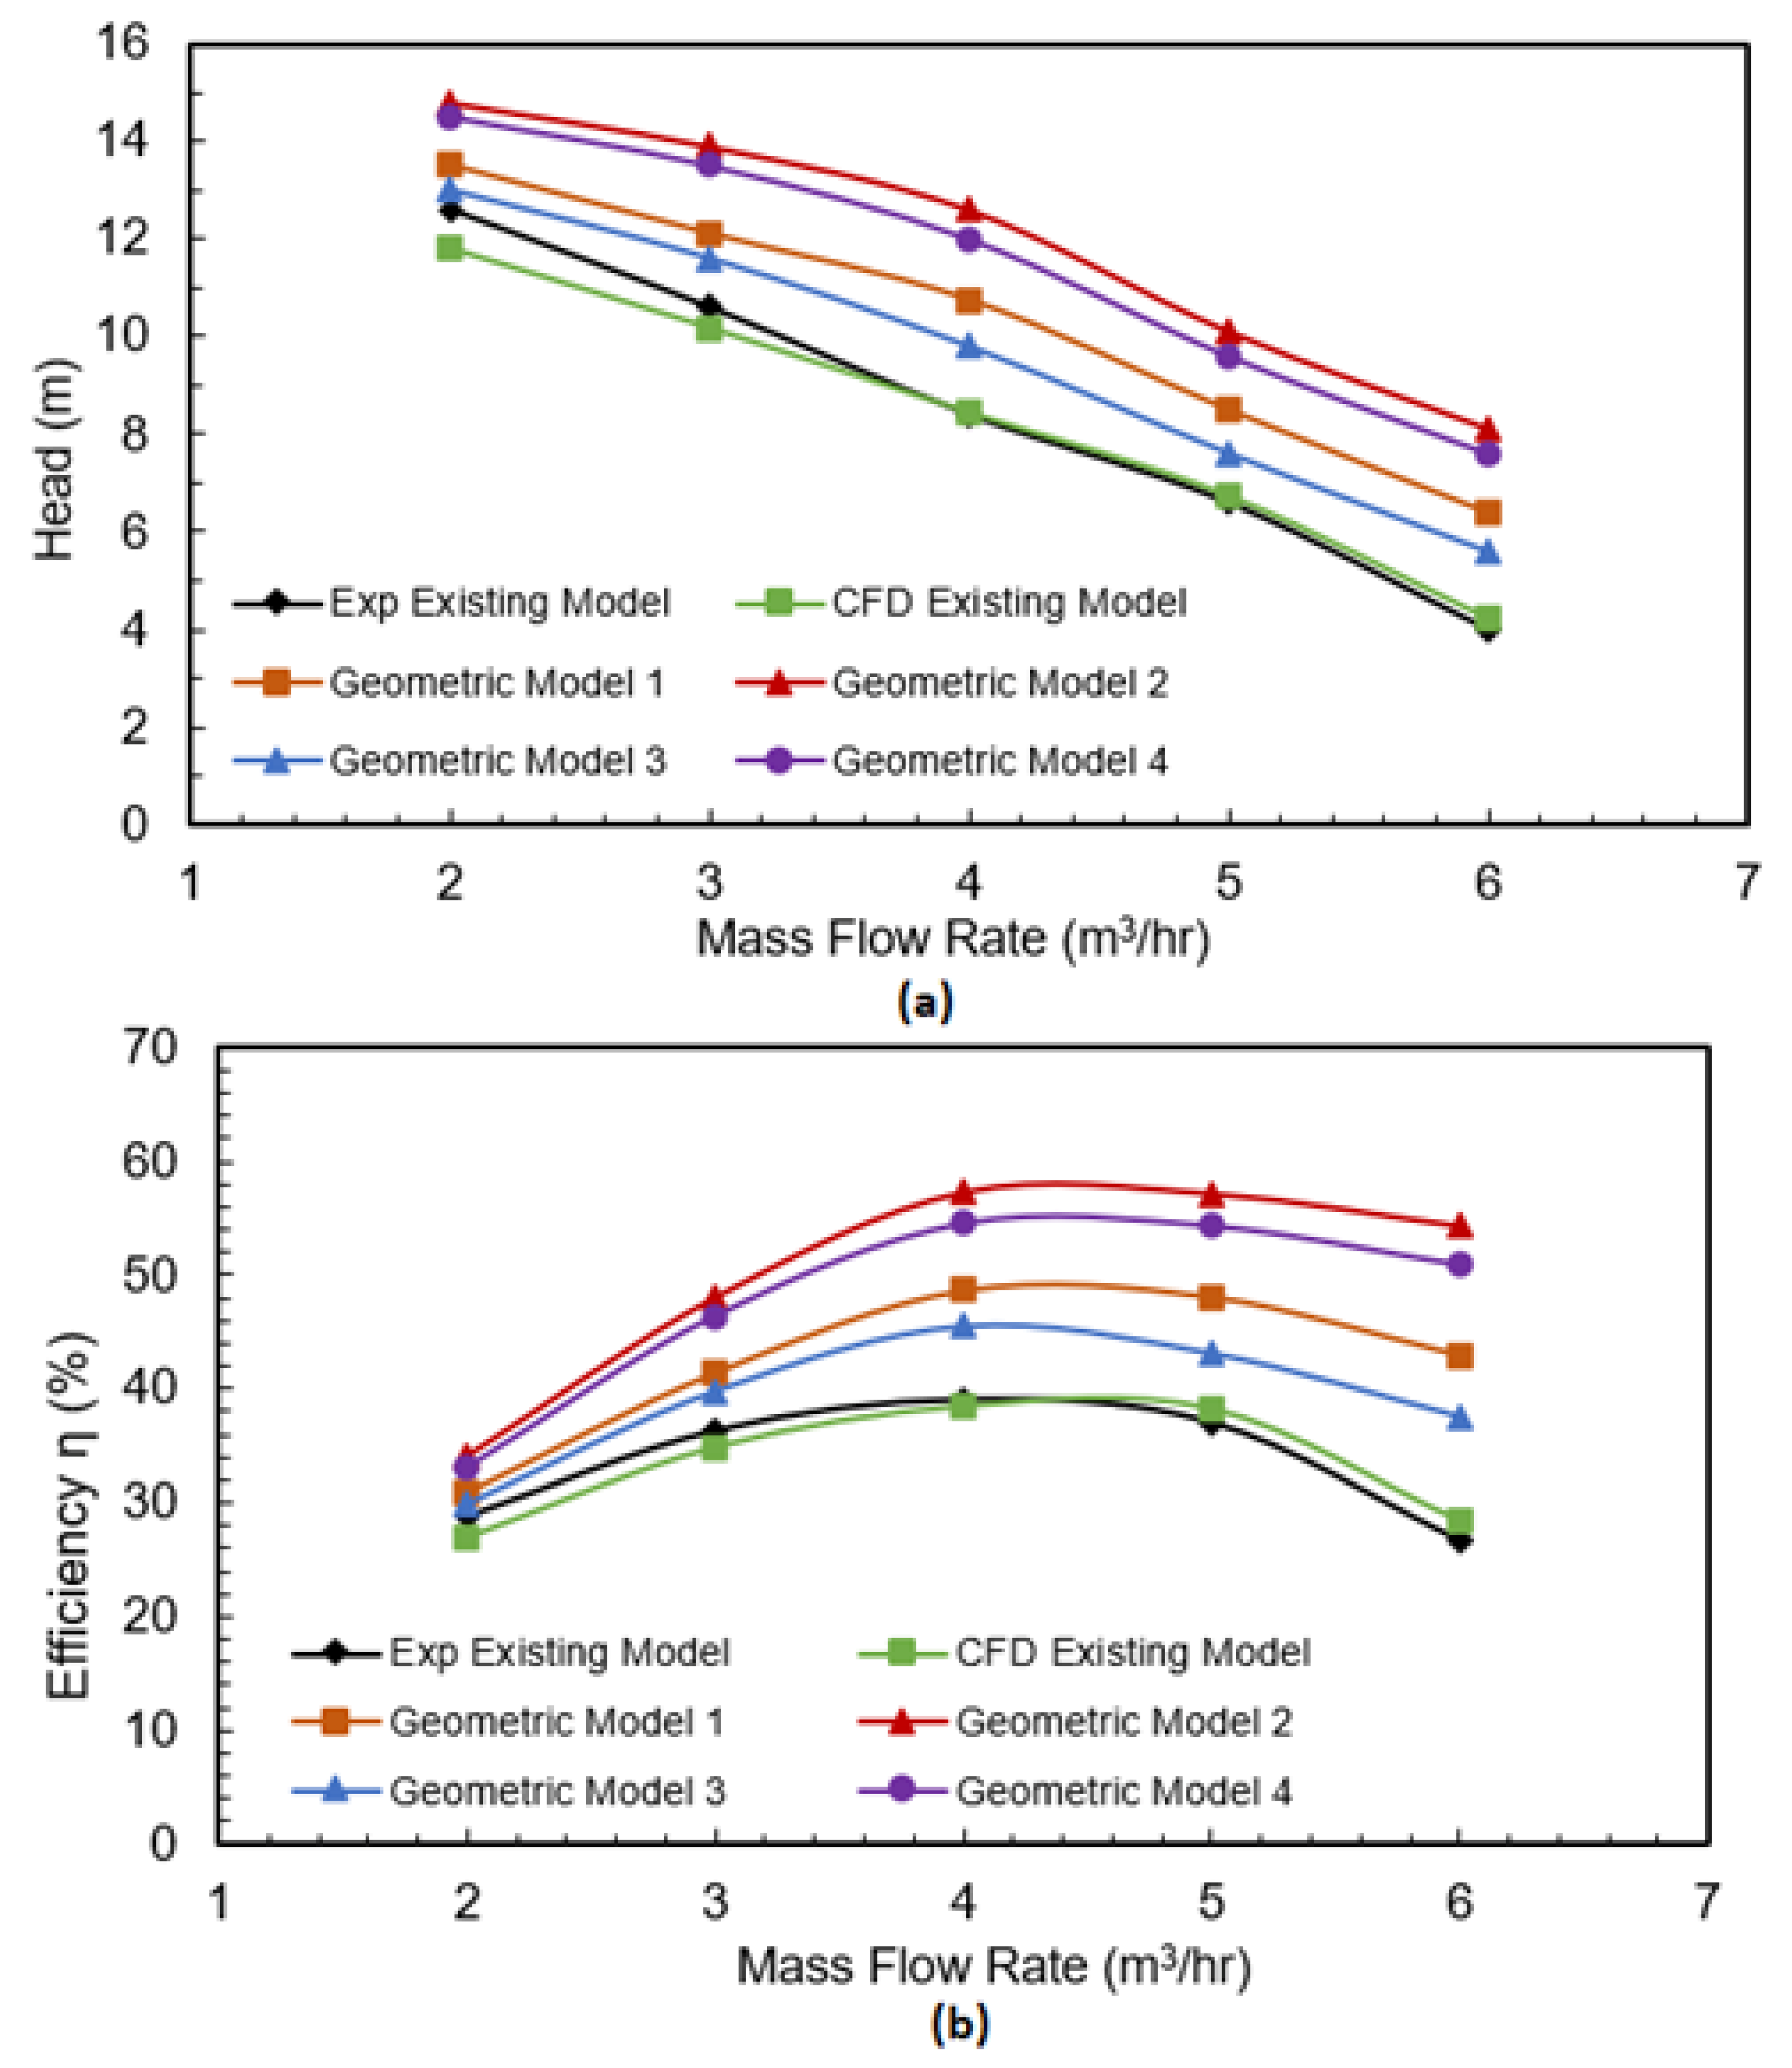
A comparison among the experimental and CFD results of existing model with CFD results of different improvised geometrical models were carried out. Our study indicated that head and efficiency of all the improvised geometric models of twin start helical rotors are higher than that of the original model. The reason being better guided flow inside the channels with reduced energy stratification and reduced jet/wake formation at the exit with increase in the number of blades and decrease in the pitch ratio. Though the increase in the number of blades increases the friction losses, this is compensated by a decrease in the other losses like secondary and mixing losses.
Again, with the increase of flow rate, a gradual decrease is seen in pressure head [7], as exhibited in Figure 19a. The pressure head obtained with geometric model 1 (three blades and pitch length of 30 mm) was found to be higher than the geometric model 3 (three blades and pitch length of 45 mm). Similarly, the head obtained for geometric model 2 (four blades and pitch length of 30 mm) was higher than the geometric model 4 (four blades and pitch length of 45 mm), so as the pitch length of the flights decreases the pressure head increases [20]. A pitch length of 30 mm is proven to be beneficial and helps in more guided inner flow within the Liquivac pump. On comparing the four geometric models, the second geometric pump model with four front and back blades and four flights with 30 mm pitch length is perceived to be the one with best hydraulic performance.
Figure 19 shows the efficiency-flow rate curves of the four different geometric models. The second geometric model was found to yield the highest efficiency out of all the geometrical models considered in this study and is the best case. This is due to its most favourable balance between the different losses (frictional, secondary, and mixing) and most guided and uniform flow inside the rotor channels of the Liquivac pump, as evident from the uniform pressure distribution, velocity contours and less turbulent intensity, so increasing the number of rotor blades in pump has a positive effect on the aspect ratio of the impeller channels and the flow mechanism. The efficiency increases initially and then decreases with the increase of the flow rate. The efficiency attains a maximum value at rated flow rate of 4 m3/h, which can be due to the increasing mixing losses at high flow rates.

5. Conclusions

The inner flow fields and characteristics of a Liquivac multiphase flow pump with different rotor geometric parameters are simulated and predicted using the ANSYS Fluent software. The flow in a Liquivac pump is modelled using four different turbulence models, which are compared and the best turbulence model then adopted for a parametric study. The optimized design of the rotor was comprehensively investigated under different flow conditions and results may be summarised as follows:
-
The simulation and experimental results correlate well in all the four turbulence models with small deviations.
-
Out of all the adopted turbulence models, the realizable K-ε turbulence model can provide superior performance predictions and internal detailed flow features of the pump and is recommended for simulating unsteady flow in Liquivac multiphase pumps.
-
For optimisation of the rotor, four different geometric models were created. All modifications showed superior performance compared to the existing rotor design. This is because with the increase in number of blades and decrease in pitch length there is a decrease in the energy stratification and jet/wake distribution, indicating uniformity of the flow at the channel exit.
-
Our computational study indicates that model 2 with four equidistant blades front, back and four flights in between front and back blades with 30 mm pitch is the best.
-
For the best twin start helical rotor design, the most uniform distribution of static pressure was observed and the smallest pressure gradient and low-pressure region was observed at all mass flow rates compared with other twin start helical rotor designs. Compared with other models, the turbulent kinetic energy distribution scope is best in the model 2 under all flow rate conditions.
-
The head and efficiency obtained for the optimized rotor is greater compared to the existing pumps. With a flow rate of 4 m3/hr the pressure head and efficiency increased by 4.2 m and 18.3% compared to the existing rotor design.

Author Contributions

Conceptualization, F.H. and D.M.; methodology, D.M.; software, D.M.; validation, D.M.; formal analysis, D.M.; investigation, D.M.; resources, T.K.; data curation, D.M.; writing—original draft preparation, D.M.; writing—review and editing, F.H., S.A. and A.P.; visualization, D.M.; supervision, F.H., S.A. and A.P.; project administration, F.H. and T.K.; funding acquisition, F.H. All authors have read and agreed to the published version of the manuscript.

Funding

This research was funded by European Regional Development Fund (ERDF), grant number 34R17P02148.

Institutional Review Board Statement

Not applicable.

Informed Consent Statement

Not applicable.

Data Availability Statement

The data presented in this study are available on request from the corresponding author.

Acknowledgments

This research work has been financially supported by European Regional Development Fund (ERDF) and Tomlinson Hall & Co. Ltd. Their support is greatly acknowledged.

Conflicts of Interest

The authors declare no conflict of interest.

Nomenclature

kTurbulence kinetic energyv tturbulent eddy viscosity
PPressurexicoordinate (i = 1, 2)
QdVolumetric flow rate (m3/h)δijKronecker delta
RKERealizable K-εεdissipation rate of k
RNGRenormalisation K-εμfluid viscosity
RPMRotational speedμtturbulence viscosity
SKEStandard K-ερfluid density(kg/m3)
uiaverage velocity along xi (i = 1, 2)ωspecific rate of dissipation

References

  1. Huang, S.; He, J.; Wang, X.; Qiu, G. Theoretical model for the performance of liquid ring pump based on the actual operating cycle. Int. J. Rotating Mach. 2017, 2017, 3617321. [Google Scholar] [CrossRef]
  2. Kurniawan, K.E.; Santoso, B.; Tjahjana, D.D.D.P. Improvement of centrifugal pump performance through addition of splitter blades on impeller pump. In AIP Conference Proceedings; AIP Publishing LLC: Melville, NY, USA, 2018; Volume 1931, p. 30053. [Google Scholar] [CrossRef]
  3. Kergourlay, G.; Younsi, M.; Bakir, F.; Rey, R. Influence of Splitter Blades on the Flow Field of a Centrifugal Pump: Test-Analysis Comparison. Int. J. Rotating Mach. 2007, 2007, 85024. [Google Scholar] [CrossRef] [Green Version]
  4. Bacharoudis, E.C.; Filios, A.E.; Mentzos, M.D.; Margaris, D.P. Parametric Study of a Centrifugal Pump Impeller by Varying the Outlet Blade Angle. Open Mech. Eng. J. 2008, 2, 75–83. [Google Scholar] [CrossRef]
  5. Fard, M.H.S.; Boyaghchi, F.A. Studies on the influence of various blade outlet angles in a centrifugal pump when handling viscous fluids. Am. J. Appl. Sci. 2007, 4, 718–724. [Google Scholar] [CrossRef]
  6. Kim, J.H.; Oh, K.T.; Pyun, K.B.; Kim, C.K.; Choi, Y.S.; Yoon, J.Y. Design optimization of a centrifugal pump impeller and volute using computational fluid dynamics. IOP Conf. Ser. Earth Environ. Sci. 2012, 15, 32025. [Google Scholar] [CrossRef]
  7. Han, X.; Kang, Y.; Li, D.; Zhao, W. Impeller optimized design of the centrifugal pump: A numerical and experimental investigation. Energies 2018, 11, 1444. [Google Scholar] [CrossRef] [Green Version]
  8. Desheng, Z.; Weidong, S.; Hua, Z.; Jie, Y.; Xingfan, G. Application of different turbulence models for predicting performance of axial flow pump. Trans. Chin. Soc. Agric. Eng. 2012, 28, 66–71. [Google Scholar]
  9. Yong, W.; Wang, W. Applicability of eddy viscosity turbulence models in low specific speed centrifugal pump, IOP Conference Series. Earth Environ. Sci. 2012, 15, 62013. [Google Scholar]
  10. Wang, L.; Liu, H.; Wang, K.; Zhou, L.; Jiang, X.; Li, Y. Numerical Simulation of the Sound Field of a Five-Stage Centrifugal Pump with Different Turbulence Models. Water 2019, 11, 1777. [Google Scholar] [CrossRef] [Green Version]
  11. Song, X.; Wood, H.G.; Day, S.W.; Olsen, D.B. Studies of Turbulence Models in a Computational Fluid Dynamics Model of a Blood Pump. Artif. Organs 2003, 27, 935–937. [Google Scholar] [CrossRef] [PubMed] [Green Version]
  12. Desheng, Z.; Suqing, W.; Weidong, S.; Dazhi, P.; Jie, Y.; Zhang, G. Application and experiment of different turbulence models for simulating tip leakage vortex in axial flow pump. Trans. Chin. Soc. Agric. Eng. 2013, 29, 46–53. [Google Scholar]
  13. Meerakaviyad, D.; Keville, T.; Prakash, A.; Sajid, A.; Hamad, F. Recent progress in multiphase flow simulation through multiphase pumps. Heat Transf. 2020, 49, 2849–2867. [Google Scholar] [CrossRef]
  14. Yang, S.S.; Liu, H.L.; Kong, F.Y.; Dai, C. Experimental, numerical, and theoretical research on impeller diameter influencing centrifugal pump-as-turbine. J. Energy Eng. 2013, 139, 299–307. [Google Scholar] [CrossRef]
  15. Donga, J.; Wanga, X.; Tub, J. Numerical research about the internal flow of steam-jet vacuum pump: Evaluation of turbulence models and determination of the shock-mixing layer. Phys. Procedia 2012, 32, 614–622. [Google Scholar] [CrossRef] [Green Version]
  16. Feng, J.; Benra, F.-K.; Dohmen, H.J. Application of Different Turbulence Models in Unsteady Flow Simulations of a Radial Diffuser Pump. Forsch. Im Ing. 2010, 74, 123–133. [Google Scholar] [CrossRef]
  17. Yang, X.L.; Long, X.P. Numerical investigation on the jet pump performance based on different turbulence models. IOP Conf. Ser. Earth Environ. Sci. 2012, 15, 052019. [Google Scholar] [CrossRef]
  18. Bellary, S.; Hussain, A.; Samad, A.; Kanai, R. Performance Optimization of Centrifugal Pump for Crude Oil Delivery. J. Eng. Res. [TJER] 2018, 15, 88–101. [Google Scholar] [CrossRef] [Green Version]
  19. Elyamin, G.R.; Bassily, M.A.; Khalil, K.Y.; Gomaa, M.S. Effect of impeller blades number on the performance of a centrifugal pump. Alex. Eng. J. 2019, 58, 39–48. [Google Scholar] [CrossRef]
  20. El-Sadi, H.; Esmail, N. The Effects of Screw Geometry on the Pumping Efficiency of Micro-Screw Pump. Can. J. Chem. Eng. 2008, 83, 944–950. [Google Scholar] [CrossRef]
Figure 1. Transparent model of a Liquivac pump.
Fluids 07 00045 g001
Figure 2. Schematic of a Liquivac pump (Reprinted with permission from ref. [13]. Copyright 2021 Wiley).
Fluids 07 00045 g002
Figure 3. Detailed view of a Liquivac pump (Reprinted with permission from ref. [13]. Copyright 2021 Wiley).
Fluids 07 00045 g003
Figure 4. The twin starts helical rotor (a) geometric parameters (b) isometric view.
Fluids 07 00045 g004
Figure 5. Testing Platform (a) Experimental setup (b) Schematic diagram of experimental set up.
Fluids 07 00045 g005
Figure 6. Computational model of (a) whole pump (b) casing (c) discharge chamber with water pipe (d) rotor volume and (e) suction chamber with water pipe.
Fluids 07 00045 g006
Figure 7. Computational mesh of (a) whole pump (b) casing (c) discharge chamber with water pipe (d) suction chamber with water pipe and (e) rotor volume.
Fluids 07 00045 g007
Figure 8. Mesh independence study.
Fluids 07 00045 g008
Figure 9. Comparison of the hydraulic performance between experiments and numerical simulation (a) Head -flow rate (b) Efficiency-flow rate.
Fluids 07 00045 g009
Figure 10. Comparison of error percentage among different turbulence models at varying mass flow rates. (a) Error percentage of head (b) Error percentage of efficiency.
Fluids 07 00045 g010
Figure 11. Comparison of absolute error percentage (a) head and (b) efficiency for different turbulence models.
Fluids 07 00045 g011
Figure 12. The geometric parameters and isometric view of the rotor with three equidistant blades and pitch length 30 mm.
Fluids 07 00045 g012
Figure 13. The geometric parameters and isometric view of the rotor with four equidistant blades and pitch length 30 mm.
Fluids 07 00045 g013
Figure 14. The geometric parameters and isometric view of the rotor with three equidistant blades and pitch length 45 mm.
Fluids 07 00045 g014
Figure 15. The geometric parameters and isometric view of the rotor with four equidistant blades and pitch length 45 mm.
Fluids 07 00045 g015
Figure 16. Variation of velocity in different geometric models (a) Existing model (b) Geometric model 1 (c) Geometric model 2 (d) Geometric model 3 and (e) Geometric model 4.
Fluids 07 00045 g016
Figure 17. Variation of static pressure in different geometric models (a) Existing model (b) Geometric model 1 (c) Geometric model 2 (d) Geometric model 3 and (e) Geometric model 4.
Fluids 07 00045 g017
Figure 18. Variation of turbulent kinetic energy in different geometric models (a) Existing model (b) Geometric model 1 (c) Geometric model 2 (d) Geometric model 3 and (e) Geometric model 4.
Fluids 07 00045 g018
Figure 19. Hydraulic performances of the Liquivac pump with four different geometric models (a) Head-flow rate (b) Efficiency-flow rate.
Fluids 07 00045 g019
Table 1. Boundary conditions and simulation parameters.
N-S Equations SolverANSYS Fluent 20.2
Rotation speed (RPM)2900
Inlet Total Pressure (Pa)
Outlet Mass flow rate (Kg/sec)
WallsNo-slip and smooth
Working fluidWater, ρ = 998.2 kg/m3
Turbulence modelStandard K-ε, Realizable K-ε, RNG K-ε and Standard K-ω
Discretization in space and timeSecond order
Convergence criterionMaximum residual less than 10−6
Publisher’s Note: MDPI stays neutral with regard to jurisdictional claims in published maps and institutional affiliations.