Article

On the Computational Modeling of Inclined Brine Discharges

by
Ilias G. Papakonstantis
* and
Panos N. Papanicolaou
Laboratory of Applied Hydraulics, Department of Water Resources and Environmental Engineering, School of Civil Engineering, National Technical University of Athens, 5 Heroon Polytechniou Street, 15780 Zografou, Greece
*
Author to whom correspondence should be addressed.
Fluids 2022, 7(2), 86; https://doi.org/10.3390/fluids7020086
Submission received: 29 December 2021 / Revised: 9 February 2022 / Accepted: 16 February 2022 / Published: 20 February 2022
(This article belongs to the Collection Feature Paper for Mathematical and Computational Fluid Mechanics)

Abstract

:
In this paper, five computational approaches are used to model bulk flow parameters of inclined round negatively buoyant jets. More specifically, an integral model employing Gaussian distributions for velocity and apparent acceleration of gravity, proposed in earlier study, is implemented with two different entrainment formulae. The remaining three computational approaches include an integral model known as EMA, which takes into consideration the fluid detachment occurring in the inner side of the flow near the terminal height, the widely known commercial model Corjet and analytical solutions that were proposed in a previous study. Predictions are provided for the maximum centerline height and its horizontal position, the terminal height of the upper jet boundary, the horizontal distance to the points where the jet centerline and the upper jet boundary return to the source level, the centerline dilution at the maximum height and the centerline dilution at the return point. Detailed comparisons are made in dimensionless form between the estimations provided by the models and a wide range of experimental data for discharge angles between 15° and 90°. Conclusions are drawn regarding the performance of the five computational approaches.

Graphical Abstract

1. Introduction

Desalination plants are becoming a common solution to the shortage of fresh water especially in coastal areas. Desalination brine is a dense effluent which is commonly disposed into the sea; since desalination brine has a salinity higher than that of the seawater it can cause serious issues to the marine environment (e.g., [1]). A submerged brine discharge is an efficient method in terms of environmental impact [2]. Inclined discharges are commonly applied, as they lead to higher dilution rates than vertical discharges and thus decrease the degradation of the marine ecosystem. The flow rises up to a terminal height and then descends until impinging to the bottom, where spreading of a density current occurs [3].
Many experimental studies have been conducted for the flow of inclined dense jets discharged from a round nozzle with negative buoyancy, and results have been presented for trajectory characteristics and dilution. Zeitoun et al. [4] performed experiments for dense jets with source inclinations 30°, 45° and 60° to the horizontal, and their measurements indicated that the 60° angle provides higher dilution. The dense jet discharged at 60° was investigated by Roberts and Toms [5] and Roberts et al. [6] through experimental measurements for trajectory characteristics and minimum dilution. Cipollina et al. [7] performed experiments for inclinations 30°, 45° and 60° and reported results for jet geometric characteristics. From experimental measurements conducted with light attenuation (LA) and LIF (Laser Induced Fluorescence) techniques in jets discharged at angles between 0° and 75°, Kikkert [8] and Kikkert et al. [9] obtained data for geometric characteristics, concentration field and dilution. They observed buoyancy-driven instabilities in the inner side of the flow. PIV (particle image velocimetry) and LIF experiments were carried out by Shao and Law [10] for discharge angles of 30° and 45°.
Flow visualization experiments for negatively buoyant jets inclined at 45°, 60°, 75°, 80°, 85° and 90° were conducted by Papakonstantis et al. [11] and results were reported for jet geometric characteristics. Further, Papakonstantis et al. [12] obtained data for the concentration field, dilution and geometric characteristics of the jet centerline from concentration measurements in dense jets discharged at 45°, 60° and 75°. Lai and Lee [13] performed LIF and PIV experiments for inclinations between 15° and 60° and measured geometric characteristics, concentration distributions, dilution and velocity. Oliver [14] and Oliver et al. [15] used the LIF technique and presented experimental data for trajectory, concentration distributions and dilution of dense jets discharged at several angles between 15° and 75°. LIF experiments for dense jets inclined at angles between 15° and 85° were also carried out by Abessi and Roberts [16]. Crowe et al. [17] reported experimental results for the velocity field and the geometric characteristics of jets inclined at angles between 15° and 75°. Flow visualization experiments were conducted by Papakonstantis and Tsatsara [18] for dense jets inclined at angles between 15° and 70° and results were presented for geometric characteristics of the upper jet boundary. Data for centerline trajectory characteristics and dilution were obtained by Papakonstantis and Tsatsara [19], from concentration measurements in dense jet flows for discharge angles 35°, 50° and 70°.
Computational modeling has been conducted by several investigators to predict flow parameters of inclined dense jets. CFD (Computational Fluid Dynamics) modeling was performed by Vafeiadou et al. [20] by employing CFX, a commercial CFD software. Using CFX software with k-ε turbulence model, Oliver et al. [21] obtained results for jet flow parameters. They compared the results with the estimations obtained by the analytical solutions of Kikkert et al. [9] and found that the CFD modeling they applied, although more sophisticated, is not more accurate than the analytical solutions of Kikkert et al. [9]. CFD modeling was also employed by Gildeh et al. [22,23] for dense jets discharged at 30° and 45°. Zhang et al. [24,25] carried out large eddy simulation (LES) of dense jets inclined at 45° and 60°.
Simpler computational approaches such as simplified modeling and integral (numerical) modeling have been presented and have been found to provide good estimations of the bulk flow parameters. Christodoulou and Papakonstantis [26] approximated the jet trajectory using a parabolic equation with coefficients obtained from three boundary conditions. Papakonstantis and Christodoulou [27] conducted simplified modeling of inclined dense jets by presenting a fourth-degree polynomial approximation of the jet trajectory with coefficients determined from five boundary conditions for a certain discharge angle. A good agreement with experimental data was found.
For modeling turbulent positively buoyant flows, integral (numerical) models (e.g., [28,29]) are widely used because they are simple and provide very good estimations for the bulk flow parameters. However, in negatively buoyant jets where the buoyancy decelerates the rising fluid, integral modeling applied in positively buoyant jets may be less accurate [30]. To model negatively buoyant jets with integral models, Papanicolaou et al. [30] applied a commonly used formula for the entrainment coefficient [31] which varies with the local Richardson number between two values corresponding to jet-like and plume-like regimes; however, they used a reduced entrainment coefficient for the jet-like regime. In VisJet, Lai and Lee [13] allowed the square of the local densimetric Froude number, which is proportional to the density difference of ambient and jet fluid, to be negative between source and terminal height leading to lower values for the entrainment coefficient than that measured for the jet-like regime. As in negatively buoyant jets, it has been experimentally observed ([9,11,12,15,18,19]) that near the terminal height, fluid is detached and falls towards the bottom, some investigators have attempted to take into account this detrainment in the integral models. Yannopoulos and Bloutsos [32] presented the escaping mass approach (EMA) to account for fluid mass which is detached from the inner side of the flow. Oliver et al. [33] presented an integral model, namely the reduced buoyancy flux (RBF) model, where the buoyancy flux decreases between the source and the terminal height and remains constant only in the downflow. Christodoulou et al. [34] presented a comparative study of integral models in terms of their performance on the prediction of experimental data. Bloutsos and Yannopoulos [35] revisited the EMA approach and presented a detailed comparison of their model predictions with experimental data for inclined negatively buoyant jets and other model results.
Predictions from commercial codes which have been widely used in positively buoyant jets, e.g., Corjet and Visjet, seem to deviate from experimental data concerning negatively buoyant jets [36].
In this paper, five different computational approaches are used to predict bulk flow parameters of inclined round negatively buoyant jets. An integral model [30,37] employing Gaussian distributions for velocity and apparent acceleration of gravity is implemented with two different entrainment formulae. Moreover, predictions for geometric characteristics and dilution by the integral model EMA [32,35] which accounts for the fluid detachment occurring near the terminal height, the commercial model Corjet [38,39] and the analytical solutions of Kikkert et al. [9] are also used. The results are properly normalized and compared to available experimental data for discharge angles between 15° and 90°. The performance of these models is assessed.

2. Analysis

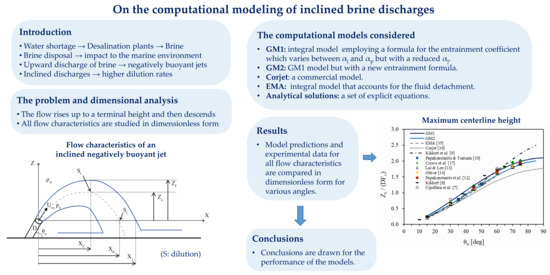
2.1. The Problem Considered and Dimensional Arguments

The jet flow studied herein is shown in Figure 1. Jet fluid with density ρο is discharged from a round nozzle of diameter D into a calm ambient fluid of lower density ρα. The nozzle is inclined at an angle θο to the horizontal and the initial velocity of the flow is Uo. The jet flows upwards to a terminal height of rise, then flows downwards and returns to the source level at some distance from the outlet. The main geometric characteristics are the maximum centerline height Zc located at a horizontal distance XZ from the jet exit, the terminal height of the jet upper boundary Zf and the horizontal distances Xic and Xi to the return points of the centerline and the upper boundary, respectively. The minimum (centerline) dilutions at the maximum height St and the return point Si are also of high interest.
The initial flow parameters, i.e., the volume flux Q, the specific momentum flux M and the specific buoyancy flux B at the source are defined as [31]
Q = U o π D 2 4   ,       M = U o Q   ,       B = g o Q
where g o is the apparent acceleration of gravity at the source, g o = g ρ α ρ o ρ α .
The initial Richardson number (at the source) is
R o = Q | B | 1 / 2 M 5 / 4 = ( π 4 ) 1 / 4 1 F o
F o being the initial densimetric Froude number defined as
F o = U o | g o | D
Absolute values of Β and g o are considered in Equations (2) and (3) because these parameters are negative in dense jets (ρο > ρα).
Dimensional analysis for negatively buoyant jets, presented in previous studies (e.g., [11,12]), has shown that for flows where the Boussinesq approximation is valid and for a specific discharge angle θο, any geometric characteristic, e.g., the height of rise Z, is normalized as
Z D F o = c o n s t a n t
while the dilution S at a certain point of the centerline is normalized as
S F o = c o n s t a n t

2.2. The Computational Models

An integral model presented by Papanicolaou et al. [30] is used herein to predict the flow characteristics of negatively buoyant jets. The model employs Gaussian distributions for the streamwise velocity and apparent acceleration of gravity, i.e., u = u c e r 2 / b 2 and g = g c e r 2 / ( λ b ) 2 , with subscript c denoting centerline values, r being the radial distance from the jet centerline, b the jet velocity width and λ the ratio of the concentration to velocity width. The model, referred as GM1 in the following, consists of the equations
d μ d s = 2 2 π a m 1 / 2
d m d s = 1 + λ 2 2 μ β m s i n   θ
d θ d s = 1 + λ 2 2 μ β m 2 c o s   θ
d β d s = 0
d x d s = c o s   θ
d z d s = s i n   θ
where μ , m , β are the local specific fluxes of mass, momentum and buoyancy, respectively, defined as μ = π b 2 u c , m = π 2 b 2 u c 2 , β = π b 2 u c g c λ 2 / ( 1 + λ 2 ) ; θ is the local angle of the jet centerline to the horizontal; s is the distance along the jet centerline; x and z are the coordinates of the jet (centerline) trajectory; and α is the local entrainment coefficient.
The parameter λ is assumed equal to 1.20 as in several models, e.g., [38], and the entrainment coefficient α is obtained from the following equation [31]
a = a j ( a j a p ) ( R R p ) 2
where a j , a p are the entrainment coefficients of the jet regime and plume regime, respectively, R p is the Richardson number for the plume-regime and R is the local Richardson number defined as in Equation (2) but with the local flow parameters instead of the initial ones, under the restriction R R p where R p = 0.56 . Papanicolaou and List [40] proposed the coefficients a j = 0.0545 and a p = 0.0875 . Papanicolaou et al. [30] employed a reduced value for the jet entrainment coefficient a j = 0.03 to provide predictions of the geometric characteristics of inclined negatively buoyant jets in accordance to experimental data available at that time. Herein, the same model as in Papanicolaou et al. [30] is implemented but with a slightly lower jet entrainment coefficient a j = 0.025 (Papakonstantis [37]). The same value was obtained by Lai and Lee [13] for the local entrainment coefficient α in the ascending branch of the flow of a 60° inclined dense jet. The model is numerically solved using the Runge–Kutta fourth-order method assuming the initial conditions μ = Q ,   m = M ,   β = Β ,   θ = θ o at a distance s o = 3.28D from the nozzle.
From the numerical solution, the parameters μ ,   m ,   θ , β ,   x ,   z are obtained. The velocity width is calculated as b = μ / 2 π m and the visual width from the centerline to the upper boundary is assumed equal to 1.5 λ b [12,37]. Thus, the coordinates of the upper jet boundary are calculated from the following equations [37]:
x u p = x 1.5 λ b s i n ( θ )
z u p = z + 1.5 λ b c o s ( θ )
The maximum centerline height Ζc is the maximum value obtained for z and the corresponding abscissa x is the distance ΧZ. The terminal height is estimated as Z f = Z c + 1.5 λ b [12]. Papanicolaou et al. [30] assumed a maximum value of jet width at the region of the maximum height for θο > 60°, as the jet width b increases at this region unduly because the momentum decreases significantly. Similarly, in this study the jet width at the maximum height for θο > 60° is assumed equal to 0.27DFo, a value that ensures a monotonic increase in the jet width along the jet trajectory [37]. The horizontal distance Xic occurs at the point where z = 0 , while the horizontal distance to the upper boundary Xi occurs at z u p = 0 . The minimum (centerline) dilution S is calculated as
S = μ Q λ 2 ( 1 + λ 2 )
while the cross-sectional average dilution is
S a v e = μ Q
The dilution can also be defined in terms of density differences, e.g., Save = (ρο ρα)/(ρave ρα), and thus the density of the jet fluid can be determined.
The previous model will be also implemented using a different entrainment formula. Papanicolaou and Stamoulis [41] presented a new formula for the entrainment coefficient which was analytically derived from the equations of motion for the vertical buoyant jet assuming top-hat distributions for velocity and apparent acceleration of gravity. Following the same work but for Gaussian distributions, the following equation is obtained for the local entrainment coefficient (see Appendix A)
a = C p 2 2 π ( 1 + 1 + λ 2 4 · R 2 C p )
where C p = 0.254 [31] and the parameter λ in this model is assumed equal to 1.06, a value that corresponds to the plume regime [40]. In Equation (17), the square of the local Richardson number is estimated according to Equation (A6) and is negative between the source and the terminal height. The Gaussian model that employs Equation (17) for the entrainment coefficient will be referred to in the following as GM2.
The commercial software Corjet, widely known for modeling buoyant jet flows, is also used for comparison; its predictions presented in the next section are those reported by Jirka [39].
The aforementioned models assume that the buoyancy flux is preserved. For comparison purposes, a typical model where the buoyancy flux decreases as a consequence of the detachment of mass from the main jet flow is also used. For this, the EMA model proposed by Yannopoulos and Bloutsos [32] is considered and its predictions shown in the following are those reported by Bloutsos and Yannopoulos [35]. Finally, estimations of the flow characteristics are obtained from the analytical solutions of Kikkert et al. [9] using a Microsoft Excel spreadsheet.
As the inclination angle approaches the vertical, there is significant interaction between the upflow and downflow, resulting in a complex flow field. The models used in this study do not account for this interaction. Next, the results of the computational approaches are presented in dimensionless form along with experimental data for several jet inclinations. Both data and computational predictions concern small density differences between the discharged fluid and the ambient (Boussinesq approximation is valid).

3. Results and Discussion

3.1. Vertical Distances

In Figure 2, the predictions of the models and analytical solutions for the maximum centerline height are presented in dimensionless form for discharge angles between 15° and 90°. Experimental data for the maximum centerline height have also been plotted in the same figure for comparison. The Corjet model underestimates the maximum centerline height for angles θο ≥ 45°. The analytical solutions by Kikkert et al. [9] provide accurate predictions but start to deviate from the angle of 70° up to the vertical discharge. On the other hand, the GM1 model (with αj = 0.025) satisfactorily predicts the maximum centerline height for the whole range of angles. Both the GM2 and EMA models provide lower predictions than GM1, which satisfactorily agree with the data for angles up to 75°, taking into consideration that the data have a reasonable scatter.
Similar observations are obtained for the terminal height of the upper jet boundary, as seen in Figure 3. The Corjet model underestimates the data, except for θο = 90°; it is noted that the line shown corresponds to a visual upper boundary of concentration c/cmax = 25% while slightly higher values are obtained for the visual boundary at which c/cmax = 3% [39]. The analytical solutions of Kikkert et al. [9], the EMA model and GM1 model provide close results for angles 30° ≤ θο ≤ 60°. For the EMA model, results were reported [35] only for angles up to 75°. The GM2 model underestimates most data and shows an increase in the terminal height after the angle of 80° which is probably due to false estimation of the jet width at such high discharge angles. It seems that only the GM1 model satisfactorily predicts the variation of the terminal height of rise, both qualitatively and quantitatively, for the whole range of discharge angles considered. It is noted that for the extreme case of θο = 90°, the terminal height of the GM1 model shown in Figure 3 has been assumed to be equal to that predicted for the maximum centerline height, since no jet width can be defined at this position where the momentum vanishes.

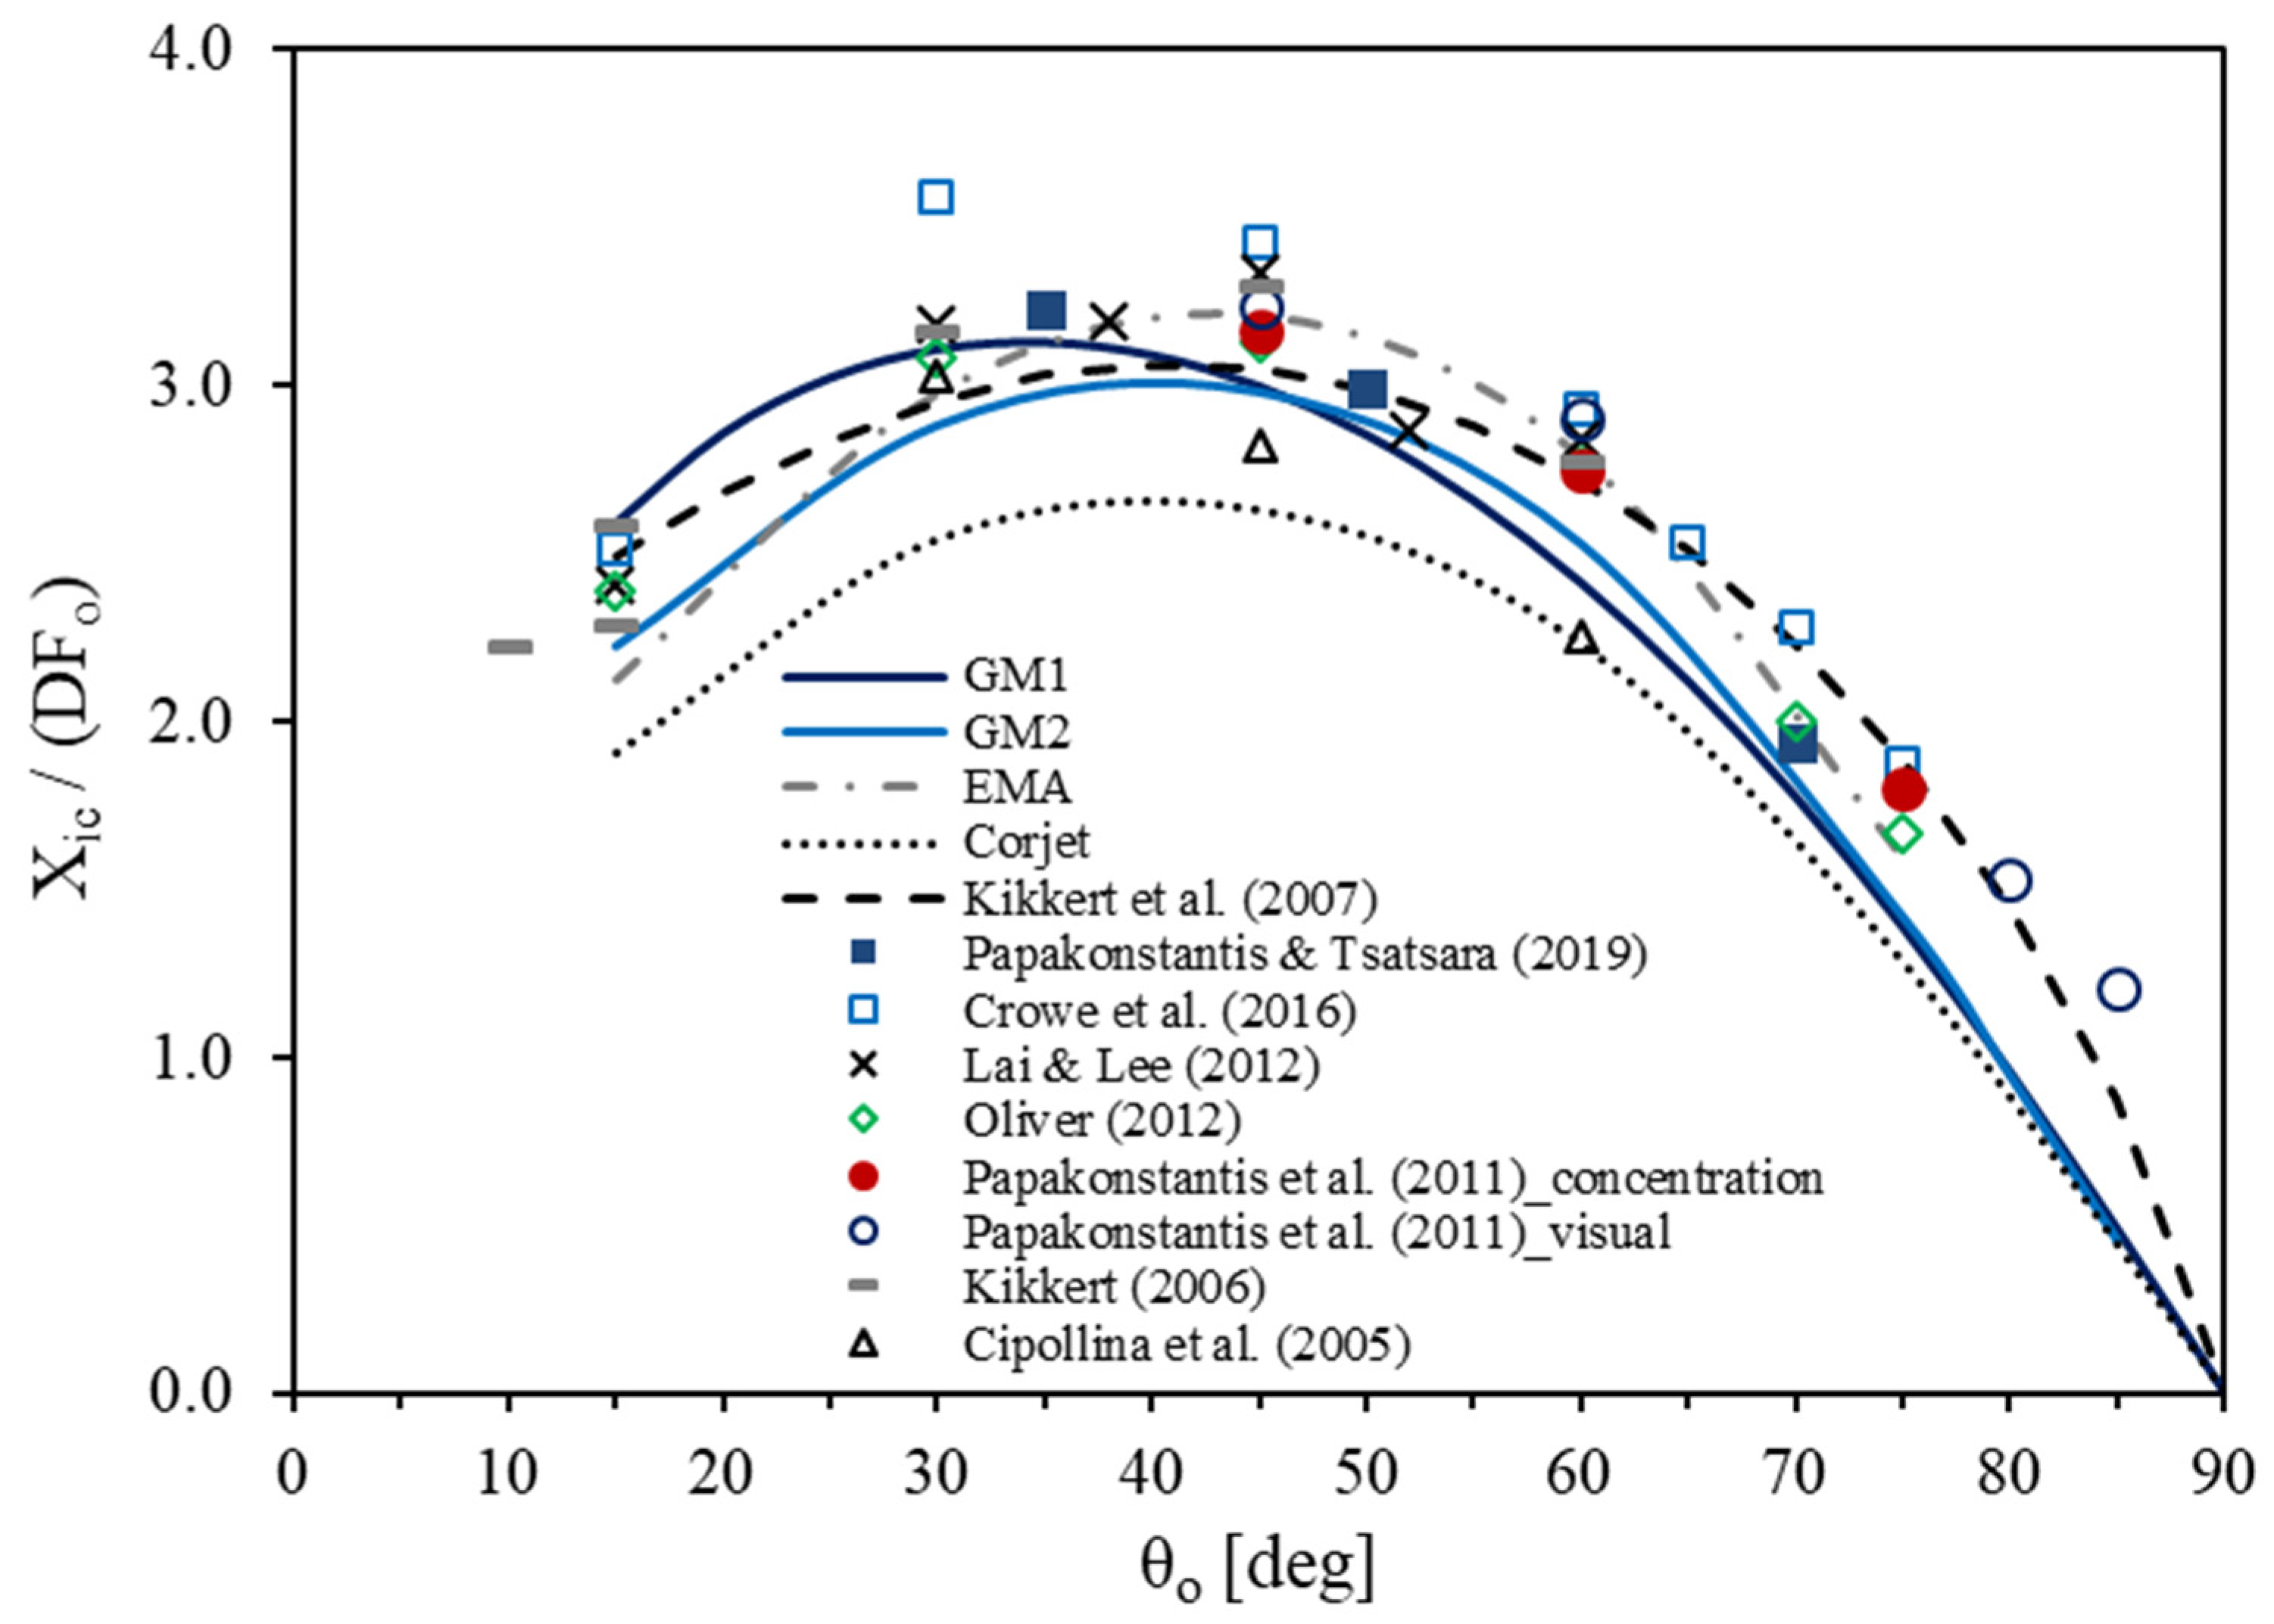
3.2. Horizontal Distances

For the horizontal location of the maximum height of rise, the predictions of the models show different behavior (Figure 4). All models present a maximum at about 45°, except for the GM1 model which maximizes at 35° with a slightly lower value at 45°. The analytical solutions of Kikkert et al. [9] overestimate most data for angles higher than 60°, whereas the GM1 model works well for 15° ≤ θο ≤ 45° but slightly underestimates the measured distances for discharge angles higher than 60°. For angles between 45° and 75°, the GM1 and GM2 models give similar results, with GM2 being somewhat better as it provides slightly higher results. The EMA model slightly underestimates most data at angles from 15° to 45°, but in general provides good predictions for angles between 15° and 75°. The Corjet model considerably underestimates the horizontal distance to the maximum height for 15° < θο < 70°.
Regarding the horizontal distance to the centerline return point, as seen in Figure 5, the Corjet model underestimates most data. The GM1 and GM2 models provide similar predictions for angles higher than 45°, underestimating data after 75°; for the angles 30°, 35° and 38° the GM1 model seems to be somewhat better. The differences between predictions of models GM1 and GM2 for the distances Xic and XZ can be attributed to the different entrainment formulae employed. The GM1 model employs a lower entrainment coefficient at the starting point s o if compared to the GM2 model, where the entrainment coefficient gradually decreases in the rising flow. This may explain why the GM1 model predicts higher horizontal distances than GM2 in small discharge angles; in higher angles the decrease in α in GM2 model may be more intense; thus, the two models provide similar predictions. The analytical solutions by Kikkert et al. [9] provide good results for most angles. The EMA model predicts satisfactorily the data for the whole range of angles between 15° and 75°. All models show a maximum at about 45°, except for GM1 which takes its maximum at about 35°, but the difference with the value at 45° is small, equal to about 4%.
For the horizontal distance to the point where the upper jet boundary returns to the source level, it is seen in Figure 6 that the data of Oliver [14] and Papakonstantis and Tsatara [18] are well-predicted by the EMA model. The lowest predictions are provided by the analytical solutions of Kikkert et al. [9] which agree only with the data of Zeitoun et al. [4]. Models GM1 and GM2 give similar distances within the range of data; GM1 gives higher distances from 15° to 45°, whereas the distances obtained by GM2 are higher than those of GM1 for angles between 45° and 75°.

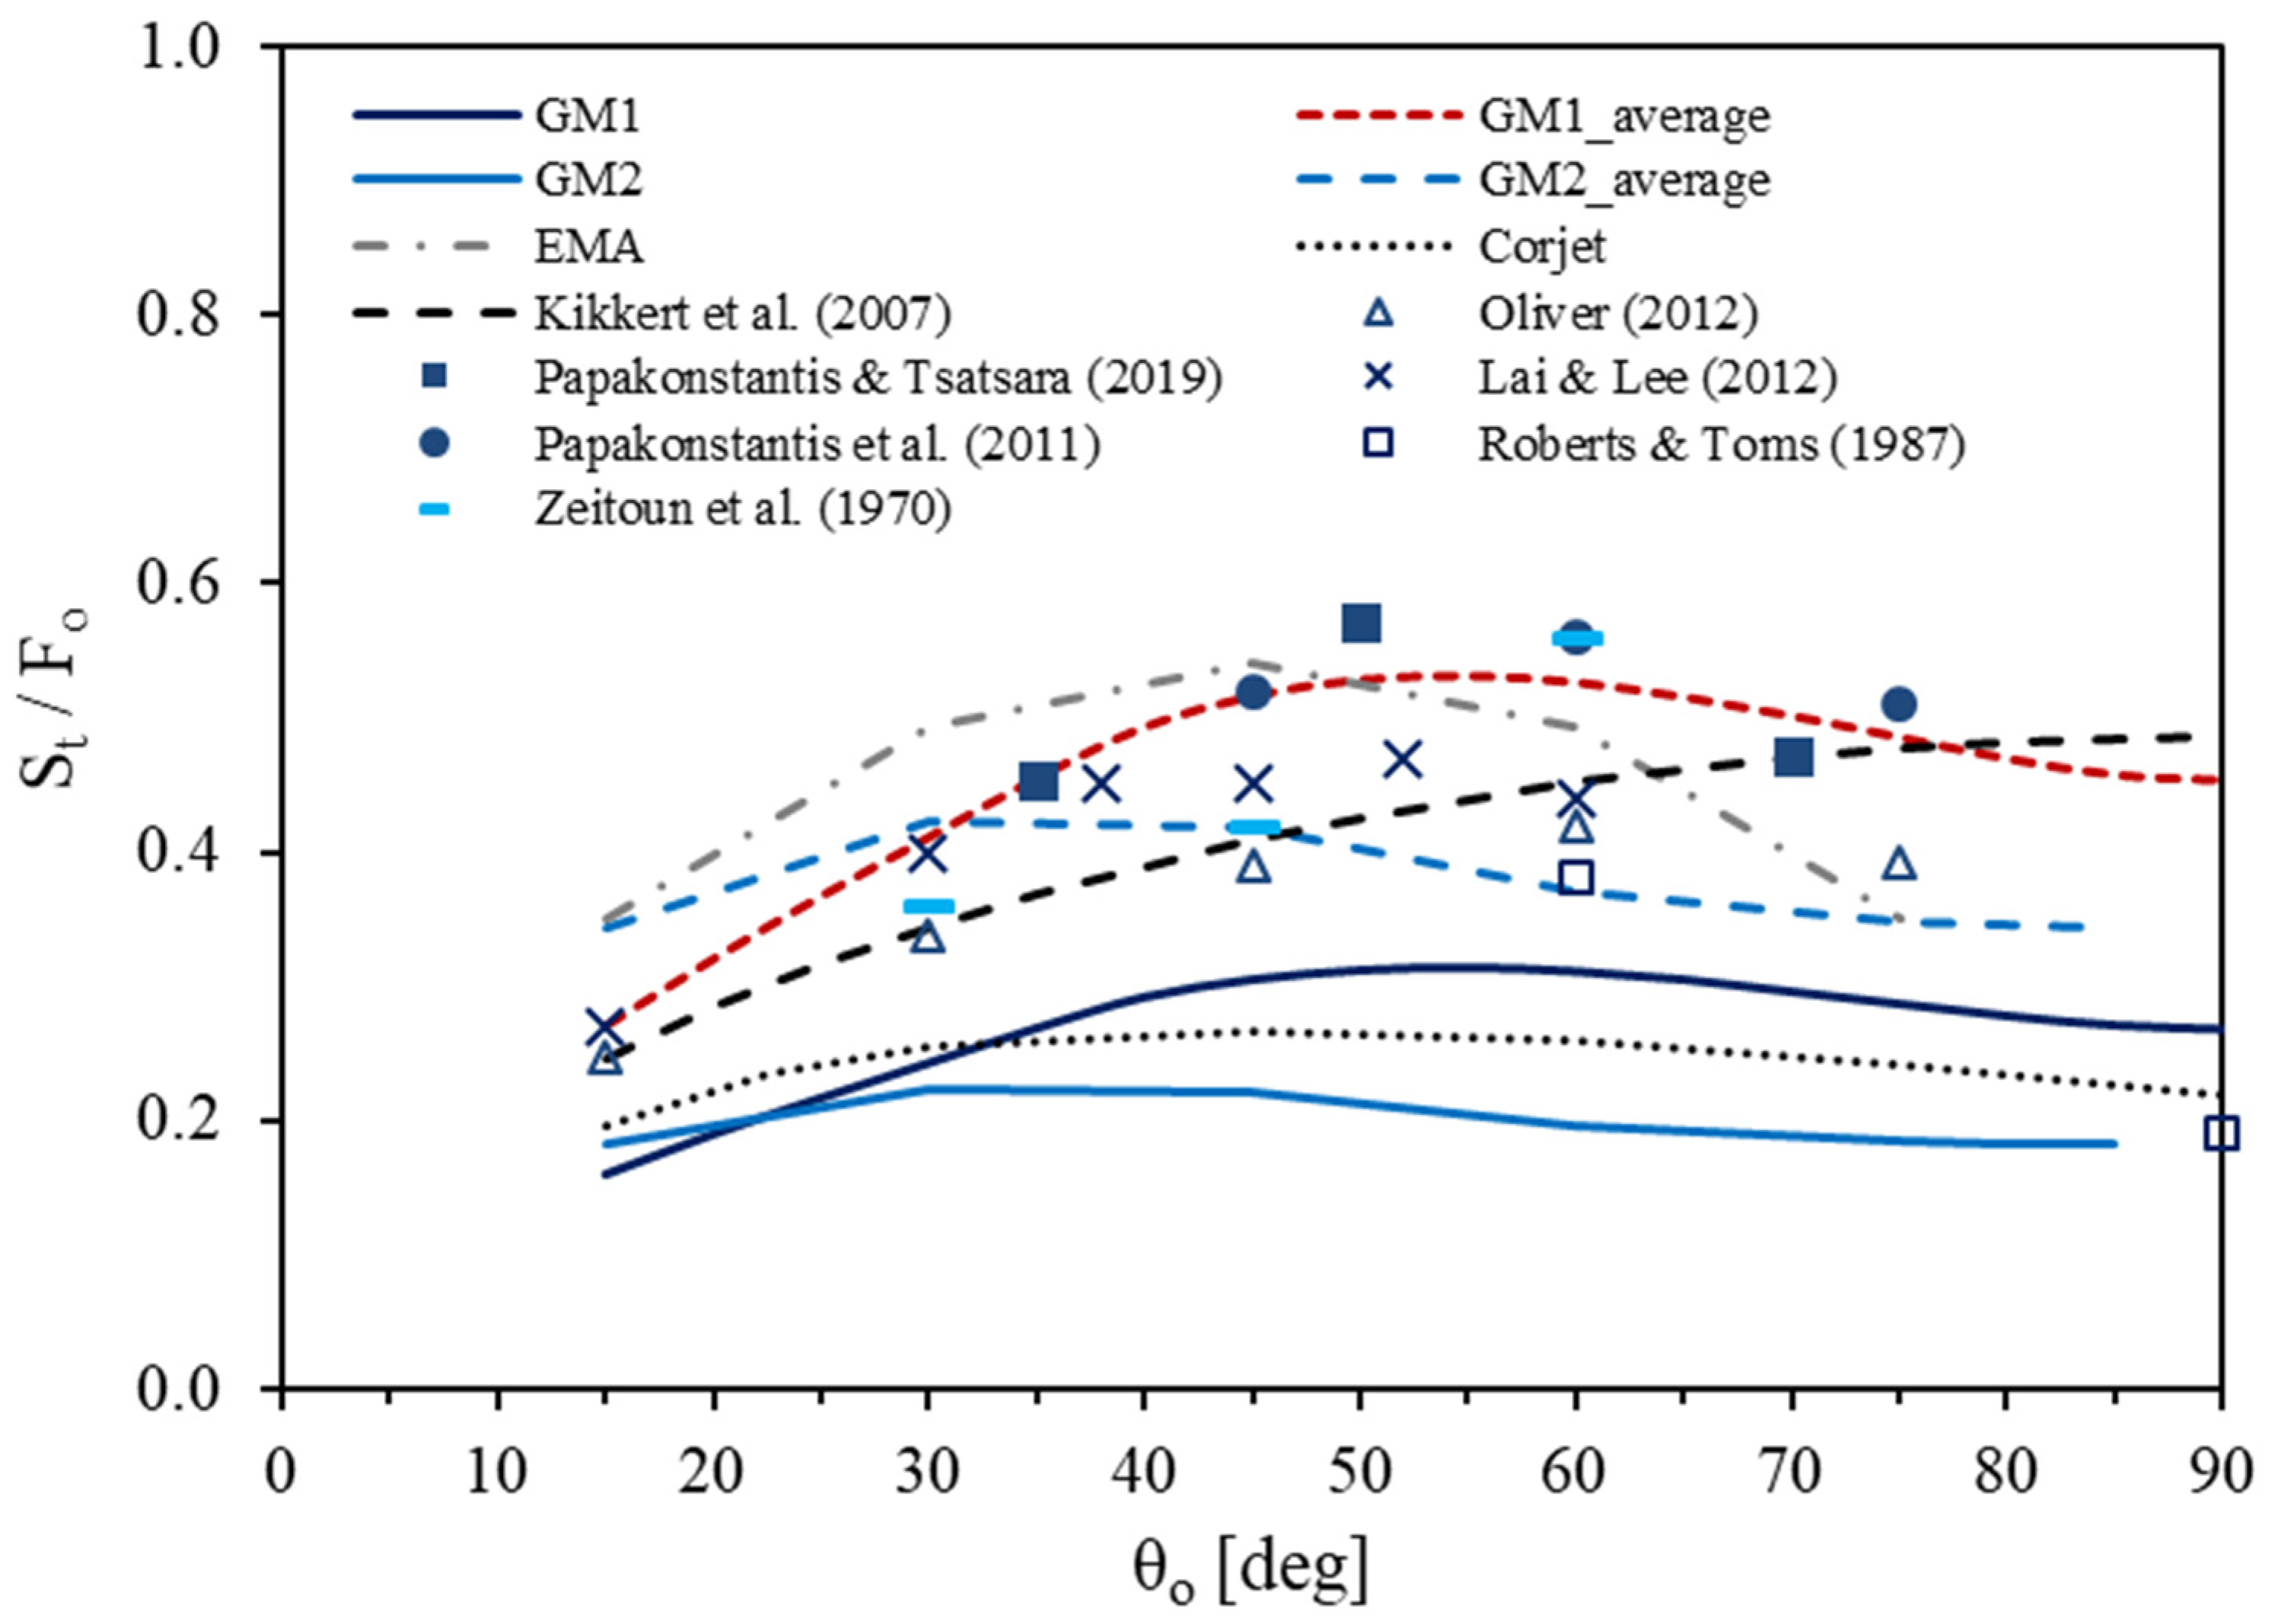
3.3. Minimum Dilution

A parameter of high importance is the dilution. As seen in Figure 7, the minimum dilution at the maximum centerline height is significantly underestimated by the Corjet model and both the GM1 and GM2 models for θο < 90°. Taking into consideration that the experimental data show a considerable scatter, the analytical solutions of Kikkert et al. [9] seem to provide somewhat conservative predictions and show a monotonic increase with the discharge angle, in contrast to the experimental data showing no significant variation for angles between 45° and 75°. The EMA model overestimates the dilution for angles 15° ≤ θο < 45° and agrees well with the data for angles between 45° and 75°. However, it shows a maximum at 45° and its variation with the discharge angle does not seem to follow the trend of the experimental data. Assuming the average dilution at the cross section instead of the centerline dilution, the GM2 model improves but still deviates from experimental data, while the GM1 model predicts satisfactorily the measured (minimum) dilution and follows the trend of the experimental data with a maximum near 60° and no noticeable variation between 45° and 75°.
As far as the minimum dilution at the return point is concerned, as seen in Figure 8, the analytical solutions and the GM2 model provide a continuous increase in the dilution with the discharge angle, which does not agree with the measurements, showing no considerable variation for angles 45°, 60° and 75° to the horizontal. Again, the Corjet and GM1 models considerably underestimate the dilution, except for the angle of 15°, but they qualitatively follow the variation of the dilution with the discharge angle. Assuming the average dilutions at the cross section, the Corjet, GM2 and GM1 models provide higher results. However, the Corjet model still underestimates most data and the GM2 model significantly overestimates the (minimum) dilution for angles higher than 60°, whereas the GM1 model provides good results and agrees qualitatively with the experimentally observed variation of the dilution with the discharge angle. The EMA model provides similar results to the average dilutions of the GM1 model but shows a constant increase in the dilution with the discharge angle.
From Figure 7 and Figure 8, it is seen that although the predicted dilutions of the GM1 model are much lower than the experimental data, the cross-sectional average dilution provides a good estimation in both cases. This can be attributed to the fluid detachment occurring near and beyond the position of the maximum height. Previous experimental studies, e.g., [8,12,15,19], have shown that the vertical profile of concentration deviates from the Gaussian distribution in the part downwards the centerline because of the fluid detachment; thus, the jet cross section becomes wider. Hence, the assumption of the symmetrical Gaussian concentration profile that is much narrower than the measured one produces higher concentration in order to satisfy tracer conservation equation, thus leading to higher concentration (lower dilution) at the jet centerline.
It is noted that the models considered herein concern the free jet flow and do not account for any effect from the bottom. Consistently, the experimental data for the horizontal distances and dilution at the return point (except from those reported in [5,6]) concern the region where the flow returns at the discharge level and not the region where the flow impinges on the bottom.

4. Conclusions

Five computational approaches, namely four integral models and a set of analytical solutions, were used to provide estimations for the geometric characteristics of the centerline and upper boundary of the jet flow as well as for the minimum dilutions at the maximum height and the return point. After detailed comparison between the computed results and experimental data, conclusions were drawn for the performance of the computational approaches.
The GM1 model provides good predictions for both the maximum centerline height and the terminal height of the upper jet boundary. Regarding the horizontal distances to the maximum height and the return points of the centerline and the upper boundary of the jet, the GM1 model does not show a maximum at about 45° as indicated by the experimental data, but provides reasonable estimations of the horizontal distances, with underestimation appearing in most cases for angles higher than 70°. It is remarkable that although the model underestimates the minimum dilution at both the maximum height and the return point, its predictions for the cross-sectional average dilutions agree with the experimental data.
The GM2 model gives good estimations of the maximum centerline height but underestimates the terminal height of the upper boundary. For horizontal distances, it provides almost the same results with those of the GM1 model for angles higher than 45°; for angles between 15° and 45° the GM2 provides lower predictions than the GM1 model, which is attributed to the different entrainment formula employed. The GM2 model considerably underestimates the minimum dilution at the maximum height and most data for the minimum dilution at the return point for discharge angles θο ≥ 30°.
The EMA model provides good predictions for both the vertical and horizontal distances for inclinations 15° ≤ θο ≤ 75°. However, this model does not predict the variation of the minimum dilution at the terminal height with the discharge angle. It provides estimations near the experimental data for the minimum dilution at the return point but indicates a monotonic increase in the dilution with the discharge angle, although the experimental data show similar but slightly lower values for 75° than 60°.
The analytical solutions by Kikkert et al. [9] satisfactorily predict the maximum centerline height and its horizontal location, the terminal height of the upper boundary of the jet for angles up to 60°. The horizontal distance to the return point is well-predicted up to 80°. They underestimate some of the data for the minimum dilution at the maximum height and the return point but provide reasonable estimations. However, the predictions show an increase in the dilutions with the discharge angle, a trend that does not agree with the experimental data.
Finally, the Corjet model underestimates both the geometric characteristics and the minimum dilution in most cases, but qualitatively follows the variation of most flow characteristics with the discharge angle.

Author Contributions

Conceptualization, I.G.P. and P.N.P.; methodology, I.G.P. and P.N.P.; software, I.G.P. and P.N.P.; validation, I.G.P. and P.N.P.; formal analysis, I.G.P.; investigation, I.G.P.; data curation, I.G.P.; writing—original draft preparation, I.G.P.; writing—review and editing, I.G.P. and P.N.P.; visualization, I.G.P. All authors have read and agreed to the published version of the manuscript.

Funding

This research received no external funding.

Institutional Review Board Statement

Not applicable.

Informed Consent Statement

Not applicable.

Data Availability Statement

Data are contained in dimensionless form within the article and are also available upon request.

Conflicts of Interest

The authors declare no conflict of interest.

Appendix A. Derivation of the Entrainment Coefficient Function in Round Buoyant Jets

Using Gaussian distributions for the velocity and apparent gravity profiles, the entrainment equations of round vertical buoyant jets are written as
d μ d z = 2 2 π a m 1 / 2 ,     d m d z = 1 + λ 2 2 μ β m ,     d β d z = 0
where z is the elevation above the source; α is the local entrainment coefficient; μ, m and β are the local specific (per unit mass) mass, momentum and buoyancy fluxes, respectively; and λ = bc/b is the ratio of the 1/e widths of tracer concentration (or apparent gravity) and velocity distributions.
Following the procedure presented by Papanicolaou and Stamoulis [41] we can integrate the momentum equation by substituting m1/2 = μ/(zCp), Cp being the constant jet width parameter proposed by List and Imberger [42] and evaluated by Papanicolaou and List [40], in the rhs obtaining
m M = [ 1 + 3 8 ( 1 + λ 2 ) C p ( z l M ) 2 ] 2 / 3
From Equation (A2) and the momentum equation, after some algebra we obtain
μ Q = C p R o ( z l M ) [ 1 + 3 8 ( 1 + λ 2 ) C p ( z l M ) 2 ] 1 / 3
Substituting the momentum and volume fluxes from Equations (A2) and (A3) into continuity equation, one can obtain the buoyant jet entrainment coefficient as follows:
a = 1 2 π m d μ d z = C p 2 π { 1 + 1 2 C p ( z l M ) 2 [ 1 + 3 4 C p ( z l M ) 2 ] 1 }
where lM = M3/4/B1/2 is a momentum length scale [31]. The local Richardson number defined as R = μβ1/2/m5/4 upon substitution from Equations (A2) and (A3) becomes
R = C p ( z l M ) [ 1 + 3 8 ( 1 + λ 2 ) C p ( z l M ) 2 ] 1 / 2
Hence, from Equations (A4) and (A5), the entrainment coefficient in terms of the local Richardson number can be written as
a = C p 2 2 π ( 1 + 1 + λ 2 4 · R 2 C p )   where   R 2 = μ 2 β m 5 / 2
This can be used as the entrainment equation, which is a function of the local Richardson number R both in positively and in negatively buoyant jets, keeping the sign of buoyancy flux. Thus, in negatively buoyant jets, R2 is a negative number, leading to a reduced entrainment coefficient, if compared to that of a pure jet a = C p / ( 2 2 π ) .

References

  1. Lattemann, S.; Höpner, T. Environmental impact and impact assessment of seawater desalination. Desalination 2008, 220, 1–15. [Google Scholar] [CrossRef]
  2. Ahmad, N.; Baddour, R.E. A review of sources, effects, disposal methods, and regulations of brine into marine environments. Ocean. Coast. Manag. 2014, 87, 1–7. [Google Scholar] [CrossRef]
  3. Papakonstantis, I.G.; Christodoulou, G.C. Spreading of round dense jets impinging on a horizontal bottom. J. Hydro-Environ. Res. 2010, 4, 289–300. [Google Scholar] [CrossRef]
  4. Zeitoun, M.A.; McIlhenny, W.F.; Reid, R.O. Conceptual Designs of Outfall Systems for Desalting Plants; Res. and Devel. Progress Report No 550; Office of Saline Water, US Dept of Interior: Washington, DC, USA, 1970.
  5. Roberts, P.J.W.; Toms, G. Inclined dense jets in flowing current. J. Hydraul. Eng. 1987, 113, 323–341. [Google Scholar] [CrossRef]
  6. Roberts, P.J.W.; Ferrier, A.; Daviero, G. Mixing in inclined dense jets. J. Hydraul. Eng. 1997, 123, 693–699. [Google Scholar] [CrossRef]
  7. Cipollina, A.; Brucato, A.; Grisafi, F.; Nicosia, S. Bench-scale investigation of inclined dense jets. J. Hydraul. Eng. 2005, 131, 1017–1022. [Google Scholar] [CrossRef]
  8. Kikkert, G.A. Buoyant jets with two and three-dimensional trajectories. Ph.D. Thesis, University of Canterbury, Christchurch, New Zealand, 2006. [Google Scholar]
  9. Kikkert, G.A.; Davidson, M.J.; Nokes, R.I. Inclined negatively buoyant discharges. J. Hydraul. Eng. 2007, 133, 545–554. [Google Scholar] [CrossRef]
  10. Shao, D.; Law, A.W.K. Mixing and boundary interactions of 30° and 45° inclined dense jets. Environ. Fluid Mech. 2010, 10, 521–553. [Google Scholar] [CrossRef]
  11. Papakonstantis, I.G.; Christodoulou, G.C.; Papanicolaou, P.N. Inclined negatively buoyant jets 1: Geometrical characteristics. J. Hydraul. Res. 2011, 49, 3–12. [Google Scholar] [CrossRef]
  12. Papakonstantis, I.G.; Christodoulou, G.C.; Papanicolaou, P.N. Inclined negatively buoyant jets 2: Concentration measurements. J. Hydraul. Res. 2011, 49, 13–22. [Google Scholar] [CrossRef]
  13. Lai, C.C.K.; Lee, J.H.W. Mixing of inclined dense jets in stationary ambient. J. Hydro-Environ. Res. 2012, 6, 9–28. [Google Scholar] [CrossRef]
  14. Oliver, C.J. Near field mixing of negatively buoyant jets. Ph.D. Thesis, University of Canterbury, Christchurch, New Zealand, 2012. [Google Scholar]
  15. Oliver, C.J.; Davidson, M.J.; Nokes, R.I. Removing the boundary influence on negatively buoyant jets. Environ. Fluid Mech. 2013, 13, 625–648. [Google Scholar] [CrossRef]
  16. Abessi, O.; Roberts, P.J.W. Effect of nozzle orientation on dense jets in stagnant environments. J. Hydraul. Eng. 2015, 141. [Google Scholar] [CrossRef]
  17. Crowe, A.T.; Davidson, M.J.; Nokes, R.I. Velocity measurements in inclined negatively buoyant jets. Environ. Fluid Mech. 2016, 16, 503–520. [Google Scholar] [CrossRef]
  18. Papakonstantis, I.G.; Tsatsara, E.I. Trajectory Characteristics of Inclined Turbulent Dense Jets. Environ. Process. 2018, 5, 539–554. [Google Scholar] [CrossRef]
  19. Papakonstantis, I.G.; Tsatsara, E.I. Mixing Characteristics of Inclined Turbulent Dense Jets. Environ. Process. 2019, 6, 525–541. [Google Scholar] [CrossRef]
  20. Vafeiadou, P.; Papakonstantis, I.; Christodoulou, G. Numerical simulation of inclined negatively buoyant jets. In Proceedings of the 9th International Conference on Environmental Science and Technology, Rhodes, Greece, 1–3 September 2005; pp. A1537–A1542. [Google Scholar]
  21. Oliver, C.J.; Davidson, M.J.; Nokes, R.I. k-ε Predictions of the initial mixing of desalination discharges. Environ. Fluid Mech. 2008, 8, 617–625. [Google Scholar] [CrossRef]
  22. Kheirkhah Gildeh, H.; Mohammadian, A.; Nistor, I.; Qiblawey, H. Numerical modeling of 30∘ and 45∘ inclined dense turbulent jets in stationary ambient. Environ. Fluid Mech. 2015, 15, 537–562. [Google Scholar] [CrossRef]
  23. Kheirkhah Gildeh, H.; Mohammadian, A.; Nistor, I.; Qiblawey, H.; Yan, X. CFD modeling and analysis of the behavior of 30° and 45° inclined dense jets-New numerical insights. J. Appl. Water Eng. Res. 2016, 4, 112–127. [Google Scholar] [CrossRef]
  24. Zhang, S.; Jiang, B.; Law, A.W.K.; Zhao, B. Large eddy simulations of 45° inclined dense jets. Environ. Fluid Mech. 2016, 16, 101–121. [Google Scholar] [CrossRef]
  25. Zhang, S.; Law, A.W.K.; Jiang, M. Large eddy simulations of 45° and 60° inclined dense jets with bottom impact. J. Hydro-Environ. Res. 2017, 15, 54–66. [Google Scholar] [CrossRef]
  26. Christodoulou, G.C.; Papakonstantis, I.G. Simplified estimates of trajectory of inclined negatively buoyant jets. In Proceedings of the Environmental Hydraulics-Proceedings of the 6th International Symposium on Environmental Hydraulics, Athens, Greece, 23–25 June 2010; Christodoulou, G.C., Stamou, A.I., Eds.; Taylor & Francis Group: London, UK; Volume 1, pp. 165–170. [Google Scholar]
  27. Papakonstantis, I.G.; Christodoulou, G.C. Simplified modelling of inclined turbulent dense jets. Fluids 2020, 5, 204. [Google Scholar] [CrossRef]
  28. Angelidis, P.B. A numerical model for the mixing of an inclined submerged heated plane water jet in calm fluid. Int. J. Heat Mass Transf. 2002, 45, 2567–2575. [Google Scholar] [CrossRef]
  29. Yannopoulos, P.C. An improved integral model for plane and round turbulent buoyant jets. J. Fluid Mech. 2006, 547, 267–296. [Google Scholar] [CrossRef]
  30. Papanicolaou, P.N.; Papakonstantis, I.G.; Christodoulou, G.C. On the entrainment coefficient in negatively buoyant jets. J. Fluid Mech. 2008, 614, 447–470. [Google Scholar] [CrossRef]
  31. Fischer, H.B.; List, E.J.; Koh, R.C.Y.; Imberger, J.; Brooks, N.H. Mixing in Inland and Coastal Waters; Academic Press: Cambridge, MA, USA, 1979. [Google Scholar]
  32. Yannopoulos, P.C.; Bloutsos, A.A. Escaping mass approach for inclined plane and round buoyant jets. J. Fluid Mech. 2012, 695, 81–111. [Google Scholar] [CrossRef]
  33. Oliver, C.J.; Davidson, M.J.; Nokes, R.I. Predicting the near-field mixing of desalination discharges in a stationary environment. Desalination 2013, 309, 148–155. [Google Scholar] [CrossRef]
  34. Christodoulou, G.C.; Yannopoulos, P.C.; Papakonstantis, I.G.; Bloutsos, A.A. A Comparison of Integral Models for Negatively Buoyant Jets. In Proceedings of the 7th International Symposium on Environmental Hydraulics, Singapore, 7–9 January 2014. [Google Scholar]
  35. Bloutsos, A.A.; Yannopoulos, P.C. Revisiting mean flow and mixing properties of negatively round buoyant jets using the escaping mass approach (EMA). Fluids 2020, 5, 131. [Google Scholar] [CrossRef]
  36. Palomar, P.; Lara, J.L.; Losada, I.J. Near field brine discharge modeling part 2: Validation of commercial tools. Desalination 2012, 290, 28–42. [Google Scholar] [CrossRef]
  37. Papakonstantis, I.G. Turbulent round negatively buoyant jets at an angle in a calm homogeneous ambient. Doctoral Thesis, School of Civil Engineering, National Technical University of Athens, Athens, Greece, 2009. (In Greek). [Google Scholar]
  38. Jirka, G.H. Integral Model for Turbulent Buoyant Jets in Unbounded Stratified Flows. Part I: Single Round Jet. Environ. Fluid Mech. 2004, 4, 1–56. [Google Scholar] [CrossRef]
  39. Jirka, G.H. Improved Discharge Configurations for Brine Effluents from Desalination Plants. J. Hydraul. Eng. 2008, 134, 116–120. [Google Scholar] [CrossRef] [Green Version]
  40. Papanicolaou, P.; List, E.J. Investigations of round vertical turbulent buoyant jets. J. Fluid Mech. 1988, 195, 341–391. [Google Scholar] [CrossRef]
  41. Papanicolaou, P.N.; Stamoulis, G.C. Vertical round buoyant jets and fountains in a linearly, density-stratified fluid. Fluids 2020, 5, 232. [Google Scholar] [CrossRef]
  42. List, E.J.; Imberger, J. Turbulent Entrainment in Buoyant Jets and Plumes. J. Hydraul. Div. 1973, 99, 1461–1474. [Google Scholar] [CrossRef]
Figure 1. Flow characteristics of an inclined round negatively buoyant jet.
Fluids 07 00086 g001
Figure 2. Predictions for the dimensionless maximum centerline height against experimental data for several inclination angles [7,8,9,12,13,14,17,19,35,39].
Fluids 07 00086 g002
Figure 3. Predictions for the dimensionless terminal height of the upper jet boundary against experimental data for several inclination angles [4,7,8,9,11,13,14,18,35,39].
Fluids 07 00086 g003
Figure 4. Predictions for the dimensionless horizontal distance to the maximum height against experimental data for several inclination angles [7,8,9,11,13,14,17,18,35,39].
Fluids 07 00086 g004
Figure 5. Predictions for the dimensionless horizontal distance to the centerline return point against experimental data for several inclination angles [7,8,9,12,13,14,17,19,35,39].
Fluids 07 00086 g005
Figure 6. Predictions for the dimensionless horizontal distance to the return point of the upper jet boundary against experimental data for several inclination angles [4,9,11,14,18,35].
Fluids 07 00086 g006
Figure 7. Predictions for the normalized minimum dilution at the terminal height against experimental data for several inclination angles [4,5,9,12,13,14,19,35,39].
Fluids 07 00086 g007
Figure 8. Predictions for the normalized minimum dilution at the centerline return point against experimental data for several inclination angles [5,6,9,12,13,14,19,35,39].
Fluids 07 00086 g008
Publisher’s Note: MDPI stays neutral with regard to jurisdictional claims in published maps and institutional affiliations.

