Article

Effect of Plasma Actuator on Velocity and Temperature Profiles of High Aspect Ratio Rectangular Jet

1
School of Environment and Society, Tokyo Institute of Technology, Tokyo 152-8550, Japan
2
DENSO Corporation, Kariya 448-8661, Japan
*
Author to whom correspondence should be addressed.
Fluids 2022, 7(8), 281; https://doi.org/10.3390/fluids7080281
Submission received: 18 July 2022 / Revised: 11 August 2022 / Accepted: 13 August 2022 / Published: 16 August 2022
(This article belongs to the Special Issue Turbulent Flow)

Abstract

:
The turbulence jet centerline velocity and temperature decay intensely along the centerline flow direction. Thus, improving it could benefit engineering applications, such as air conditioners. However, active flow control techniques with high-aspect-ratio jets, especially for controlling the temperature, have not been widely investigated. This paper presents the velocity and temperature performance of a high-aspect-ratio rectangular jet controlled by two dielectric barrier discharge plasma actuators located on the longer sides of the nozzle and controlled by high-voltage and high-frequency pulse-width modulation sinusoidal waves. The scanning method was used to cover 362 cases as combinations of working parameters (modular frequency vs. duty vs. phase difference) for the velocity and temperature performances of the jets. Results show that plasma actuators can control both velocity and temperature distribution with minor input power compared with the rectangular jet’s kinetic energy and heat flux. The velocity increased up to 4% and decreased to 11%, measured at the interest position where x / h = 70 on the centerline. There were a 5% increase and a 4% decrease compared to the temperature-based case. Distinctive velocity and temperature distributions were observed under noteworthy cases, indicating the potential of the actuator to create various flow features without installing new hardware on the flow.

1. Introduction

Turbulence jets are used in various industrial applications, including air conditioners, combustion, and fuel ejectors. Numerous studies have been conducted on jet properties and their applications, such as a textbook by Rajaratnam [1], the work of Shakouchi regarding the jet flow engineering fundamental [2], the influence of nozzle-exit shape on the performance of the jet by Deo et al. [3] and so on. Improving jet flow characteristics, such as mixing, spreading, and noise emission, are beneficial for various engineering applications. The definition sketch for a rectangular jet is shown in Figure 1.
The aspect ratio of the rectangular jet is AR = B/h, as shown in Figure 1. If AR > 5, the jet is classified as a high-aspect-ratio rectangular jet or slender jet. The efflux and centerline velocities are U 0 and U m 0 , respectively, and the variation of U m 0 / U 0 with x / h is shown schematically in Figure 1, where x is the longitudinal distance from the nozzle. Rectangular air jets can be divided into three main zones: Zone 1 (line OA), the initial core zone; Zone 2 (line AB), the transition zone; and Zone 3 (line BC), the fully developed zone. Zone 3 is the most critical zone for evaluating jet performance. Flow visualization techniques are used to observe the jet mixes violently with the surrounding fluid creating turbulence, and the jet width becomes thicker and thicker.
Generally, there are two methods for controlling the turbulence jet: passive control and active control. The passive control technique promotes a permanent change in flow; therefore, it is adequate for the stationary application of jets. In addition, active flow control favors more flexibility in controlling the jet flow to fit various working conditions. The plasma actuator (PA) is known for its ability to actively control the flow by the induced wind caused by plasma discharge in the near-wall region. These techniques have been described in several previous studies. Corke et al. [4] conducted phased-plasma arrays for unsteady flow control. Their results indicated that using a two-frequency phased-plasma array can affect the mean and unsteady flow development by increasing the actuation velocities compared to a single-frequency, single-phase plasma approach. Benard et al. [5] established an active control device for a circular jet composed of two plasma actuators combined with a passive diffuser to improve the mixing of the free shear layer significantly. This resulted in the enhancement of jet spreading, shorter potential core, and increased turbulence kinetic energy of the jet. Riherd and Roy [6] archived actuation velocities of several meters per second using eight PAs in a channel follow. The actuators were effectively working as a pump for small flows; it was also found that the maximum pressure increased linearly with the number of actuators. Castellanos et al. [7] used a plasma-actuator array employed to produce pairs of counter-rotating, stream-wise-aligned vortices embedded in a turbulent boundary layer over a flat plate to study the effect of streamwise plasma vortex generators on the convective heat transfer of a turbulent boundary layer. It was discovered that the stationary of the plasma-induced vortices remained steady far downstream, lowering the convective heat transfer. Rizzetta et al. [8] explored different shapes of the plasma actuator, namely standard and serpentine. They found that standard and serpentine actuators performed equally well in LES simulations. The pulsed mode is superior to continuous plasma actuation at lower power consumption. Plasma actuators can also be used to create a novel device, such as the fan-shaped dielectric barrier discharge (DBD) plasma reactor developed by Portugal [9]. It achieved a better ozone distribution in a closed environment than in an ordinary reactor by plasma actuation-induced suction and vortical structures. Research on improving the characteristic of the PA was conducted by Wojewodka [10] to achieve the highest induced velocity of 5.22 m/s by the surface ac-DBD plasma actuator with Kapton compared to those of Teflon and Glass Reinforced Epoxy. Different maximum velocities were obtained with an active plate electrode and sawtooth electrode by increasing the actuation voltage by Moreau [11]. Furthermore, a new type of stair-shaped dielectric barrier discharge layer was explored by Rodrigues et al. [12] to improve the power conversion efficiency up to 5 times more efficiently than conventional actuators.
Compared with other actuators, Plasma Actuator as a flow-controlling device is simple in terms of construction (as it is only made from copper tape, dielectric tape, and acrylic plate). It only uses a small amount of power compared with the main flow’s kinetic energy and heat flux. The control signal can easily be changed to achieve various effects without installing new hardware in the flow. Considering the advantages of using the actuator, it is promising to utilize it for controlling a high-aspect-ratio rectangular jet, especially for Air-conditioning applications. However, few studies have been conducted on DBD plasma actuators with high-aspect-ratio jets, particularly for controlling the temperature of the jet. Therefore, the Plasma Actuator is chosen for this research to actively control a high-aspect-ratio rectangular jet for use in an air conditioner system by flow visualization, velocity measurement, and temperature measurement.

2. Experimental Apparatus and Procedure

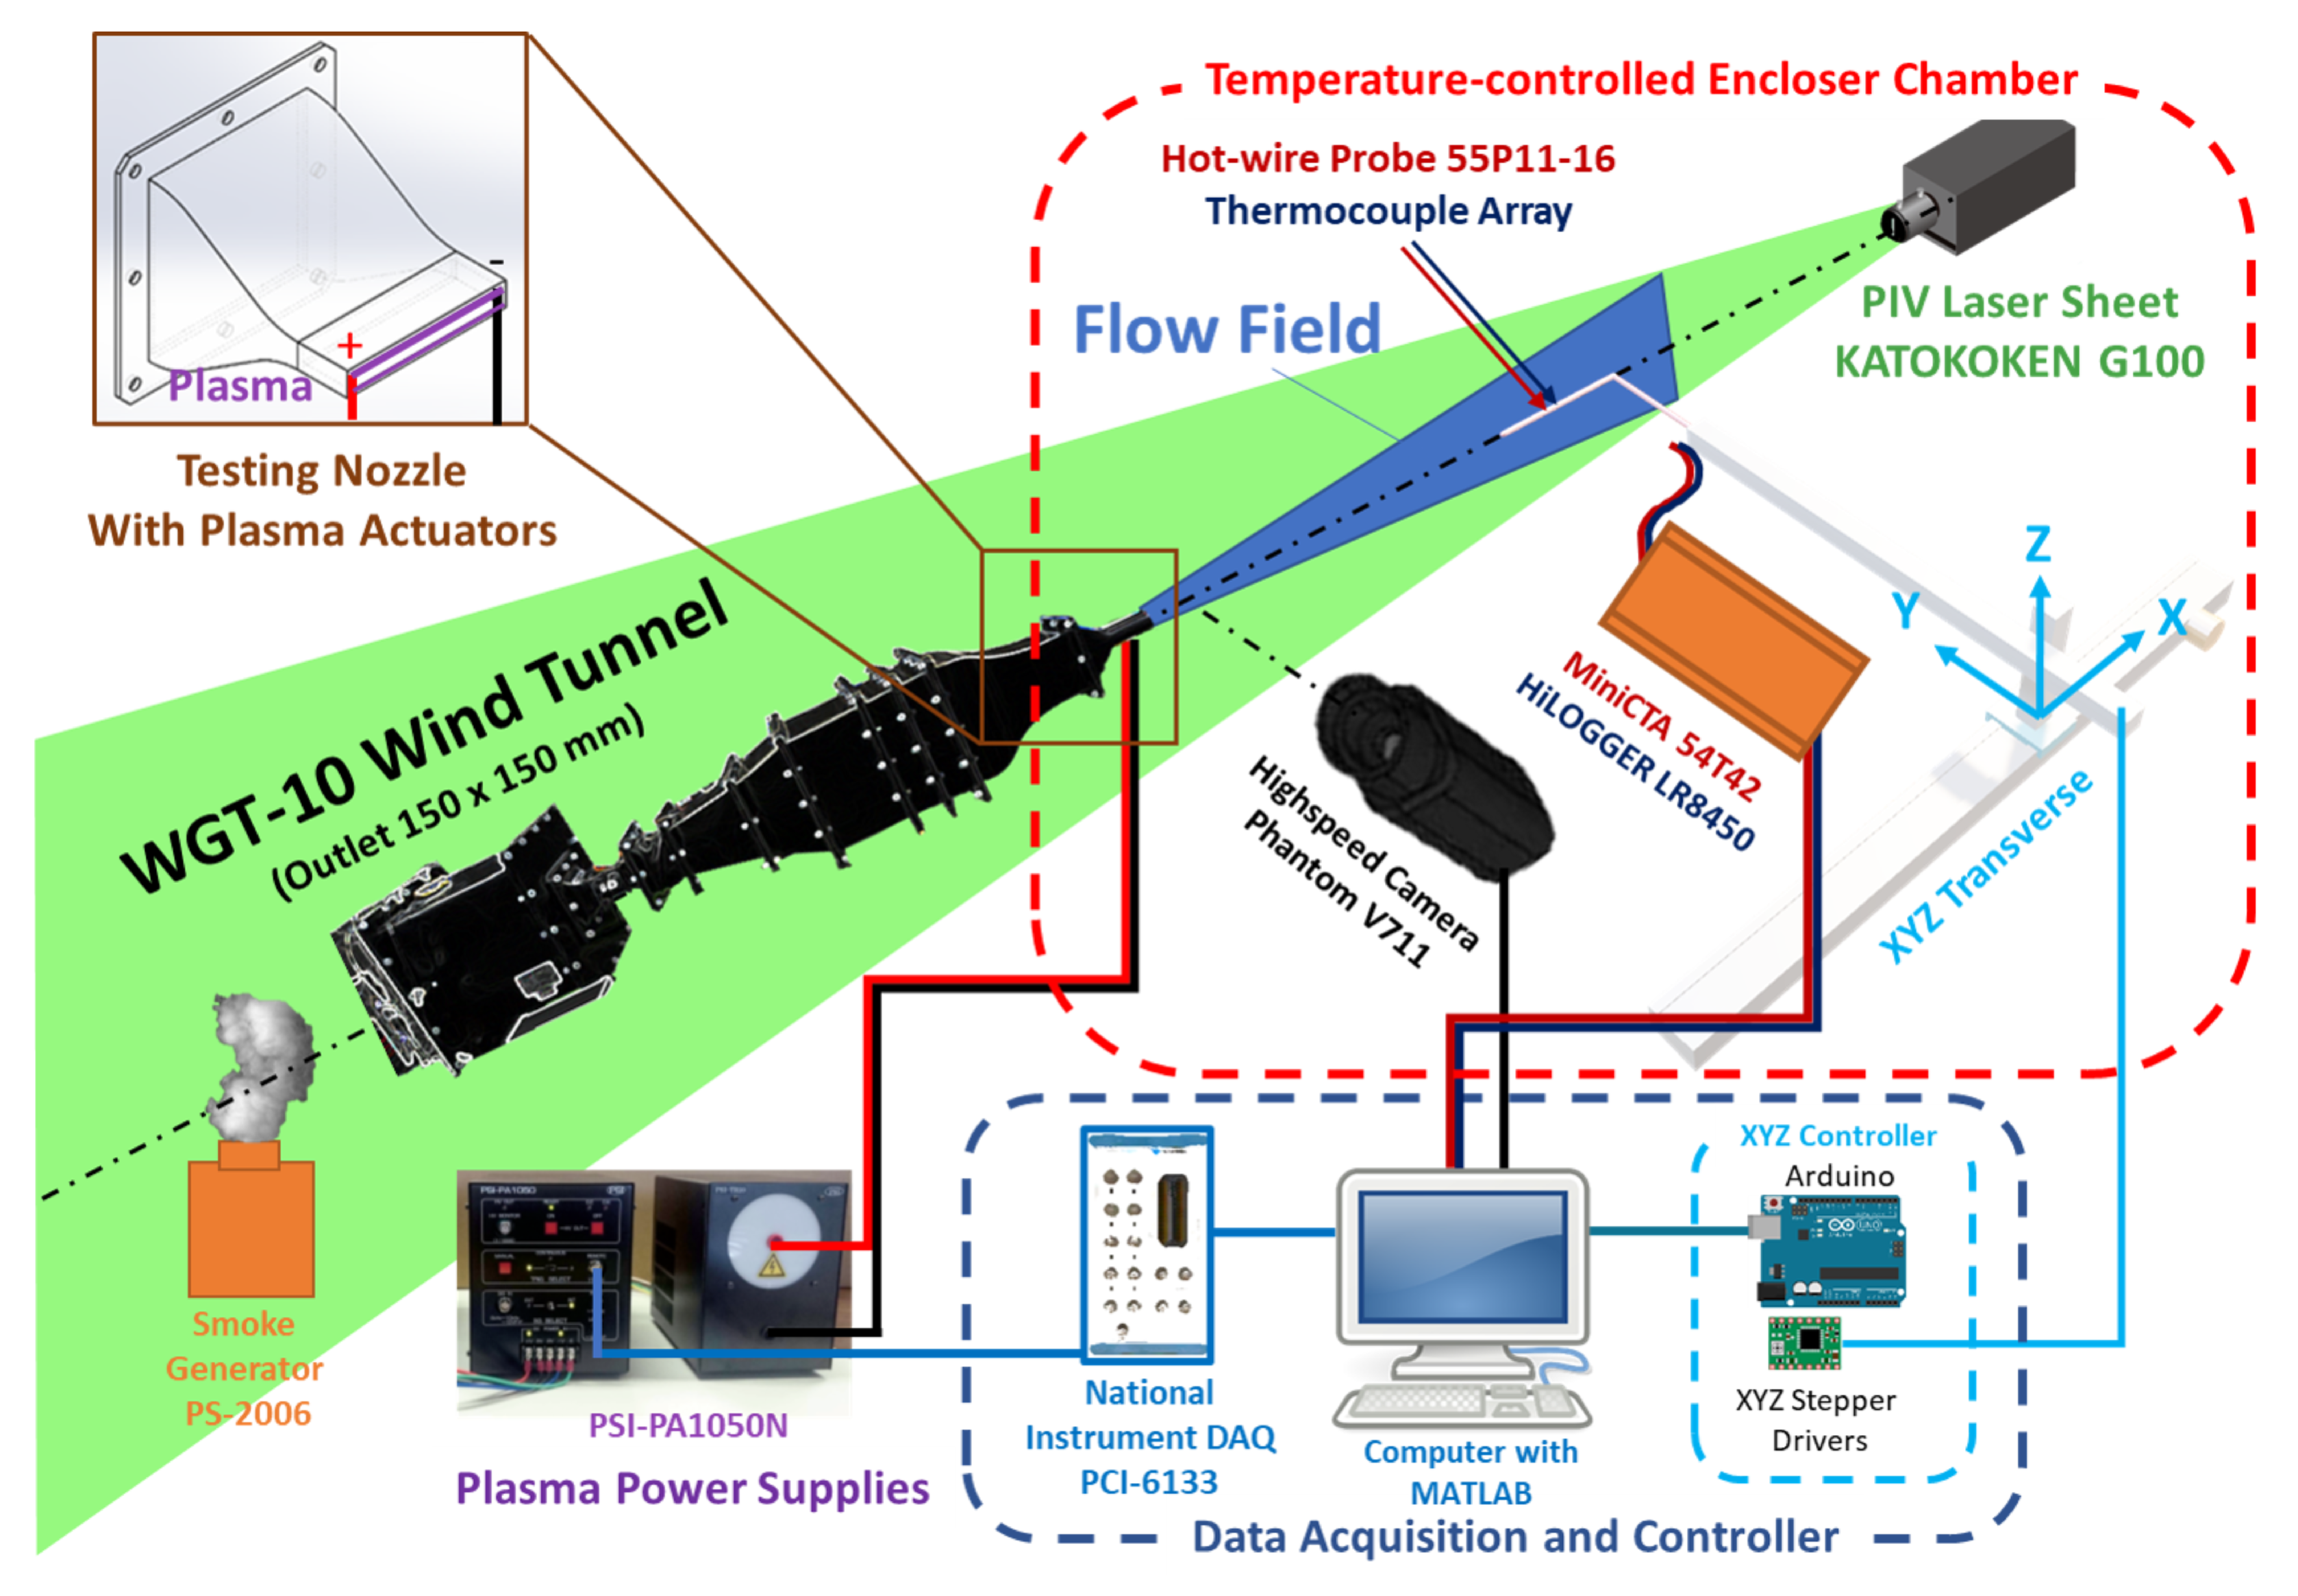
2.1. Apparatus, Velocity Measurement, Temperature Measurement, and Visualization

The experimental setup is illustrated in Figure 2. The experimental system consists of several subsystems. An open-channel wind tunnel Tsukubarika Seiki Co., Ltd, Ibaraki, Japan WGT-10 generated airflow at an initial velocity U 0 = 4.5 m/s measured at the nozzle exit. A high-aspect-ratio rectangular jet A R = B / h = 20 (B = 150 mm and h = 7.5 mm) was attached to the end of the wind tunnel for the experiments using a 3D printed adapter. With this setup, the Reynolds number of the high-aspect-ratio rectangular jet is 2150; as the experiments have shown, if Re exceeds 2000, the jet flow will be turbulent [13]. Plasma actuators (PAs) were implemented on the nozzle to control the turbulence jet flow actively. The high-aspect-ratio rectangular jet performance was evaluated by measuring the velocity and temperature centerline decay under different plasma actuator operating conditions.
A mini hot-wired constant-temperature anemometer (Dantec Dynamics 54T42) measured velocity. In this setup, the velocity measurement experiment was conducted using a 55P11 hot-wire probe mounted on a 55H21 probe support operating at a 20 kHz sampling rate within 15 s for each measurement. The raw velocity voltage data were collected using a data acquisition device (National Instrument DAQ PCI-6133). The hot-wire assembly was attached to a controlled XYZ transverse system. This transverse system was powered by an Arduino UNO board that acted as a microcontroller plus stepper motor drivers to control three stepper motors, allowing it to move precisely along the X, Y, and Z axes with a precision of ±0.02 mm. A PC, the brain of the operation with Matlab installed, collected the data through the DAQ device and output measuring point XYZ coordinates to the transverse system. The origin of the coordinate system where (x0,y0,z0) = (0,0,0) is an identical coordinate system to that in Figure 1 which (x) is the streamwise direction, (y) is the spanwise direction, and (z) is the lateral direction.
An array of 19 thermocouples (TCTG022, MISUMI) was installed in the same XYZ transverse system to measure the temperature of the rectangular jet. The channel arrangement details are shown in Figure 3. The temperature data were recorded using a Hioki Model LR8450 connected to a PC to acquire the data at the sampling rate of the thermocouple was 10 Hz in 30 s for each measurement. In addition to the temperature-measuring equipment, an enclosure chamber (1400 mm × 2140 mm × 1980 mm) made of vinyl-covered thermal insulation sheets was used to create a controlled temperature environment for the test. The chamber was equipped with 12 ceramic heaters (600 W MISUMI MCHNN2) to heat air. A dual-element thermocouple was installed on top of the nozzle to provide the controlling signal to a proportional-integral-derivative (PID) control unit (OMRON E5EC) and the ambient temperature of the chamber to the data logger. Two solid relays, OMRON G3PJ, received the control signal from the PID control and then drove the ceramic heaters to heat the enclosure to the desired ambient temperature with a precision of ±1 ° C. The wind tunnel inlet installed a circulator chiller YAMATO SCIENCE CF800 and a custom-made radiator to cool the air feeding to the rectangular outlet. A schematic of the experiment is shown in Figure 4.
Next, the PIV laser sheet (G100, KATOKOKEN CO 100 MW) was used to visualize the flow. A smoke generator seeding system (PS-2006, DAINICHI) was required to inject proper seeding particles into the flow. The laser sheet then illuminated these particles and a high-speed camera Phantom V711 by Vision Research captured video for analysis.

2.2. High Aspect Ratio Rectangular Jet Control by Plasma Actuators Experiment Setup

The DBD plasma actuators are comprised of two copper tape electrodes and two dielectric sheets of Polyamide film. The plasma actuator was constructed by pasting the materials onto the surface of an acrylic plate. The structure of the single DBD plasma actuator is shown in Figure 5. The procedure for making the plasma actuator was described by Fukagata et al. [14].
A high voltage, high-frequency power source (PSI Co., Ltd., Tokyo, Japan) is required to power the plasma actuator. PSI-PA1050N generates a sinusoidal waveform V p p = 0–6 kV and f b = 15–25 kHz. Pulse-width modulation generated by a National Instrument PCI-6133 (PWM signal 5V, duty cycle: 0–100%) was used to control the plasma power supply to generate a high-voltage, high-frequency pulse-width modulation sinusoidal wave. In addition, the controlling signal was monitored by an oscilloscope to make a precise adjustment to the working condition of the plasma actuator determined by the following parameters: V p p peak-to-peak voltage, f b base frequency, f m modular frequency, and θ phase difference between the upper and lower PA. Details of the waveforms are shown in Figure 6.
A 3D model of an adapter was printed using the 3D printer AirWolf AXIOM Dual extruders to constrain the flow from the wind tunnel outlet to the rectangular jet outlet (Figure 7). A scale of 101% to tackle the problem of ABS shrinkage was sufficient to produce appropriate nozzles. The nozzle interior was sanded with 120, 200, 400, and 800 sandpapers. Subsequently, the painting process of filler primer, spot putty, and painting was used to achieve a smooth inner surface inside the adapter with a surface roughness of approximately 11 ± 1 μ mm. The nozzle assembly is constructed using four components. Parts (a) and (b) (Figure 8) were laser-cut from an acrylic board to obtain the designed shape; subsequently, PAs were attached to the surface of the parts (a) facing inside the nozzle; parts (c) and (d) indicated in Figure 7 were made using a 3D printer from ABS to complete the nozzle assembly. A high-aspect-ratio rectangular nozzle with plasma actuator assembly is shown in Figure 9. High-frequency, high-voltage signals were fed to the two plasma actuators located on the tips of the nozzle with the settings mentioned in the single DBD plasma actuator experiment (Figure 6).
Details of the experimental conditions are listed in Table 1. The effect of the plasma actuator on the high-aspect-ratio rectangular jet was examined by changing three key parameters: modular frequency (0 Hz, 50 Hz, 100 Hz, …, 1000 Hz), duty cycle (0, 0.1, 0.2, …, 1), and θ (0 and π ). Consequently, changing these parameters yielded 362 working conditions for the plasma actuator. A point in the centerline x = 525 mm ( x / h = 70) in the fully developed region was chosen to observe the velocity and temperature performance of the jet under different PA working conditions. This location was selected because it is where the driver is in the automobile; the flow velocity and temperature at this location are crucial for the thermal comfort of the driver and passengers. Higher velocity and lower absolute temperature are preferable for the automobile air-conditioning application at locations far from the outlet. The procedures used to evaluate the effect of plasma actuators on rectangular jets for both velocity and temperature are identical. First, on the centerline of the jet where x / h = 70, the hot-wire probe for measuring the velocity and the thermocouple array for measuring the temperature were positioned. Then, the velocity and temperature data were obtained after changing the multiple PA working conditions. After obtaining the data, exceptional cases were selected based on the values of the data (higher than average and lower than average velocities and temperature). The centerline velocity, centerline temperature, and cut section temperature were measured for these cases to examine the effect of the plasma actuator on the rectangular jet in detail. The normalized temperature τ x y z was used to evaluate all the temperature results between all measurement points as:
τ x y z = T x y z T a T 0 T a
where T x y z is the temperature measured at a point in space, T a is the ambient temperature inside the temperature-controlled chamber, and T 0 is the temperature at the outlet of the nozzle, where ( x 0 , y 0 , z 0 ) = (0,0,0). Looking at Equation (1), the normalized temperature is inversely proportional to the absolute temperature. Starting from this point of the manuscript, “increase the temperature” means “increase the normalized temperature” and vice versa.

3. Results and Discussion

3.1. Plasma Actuator Effect on High Aspect Ratio Rectangular Jet Velocity

The operating images of the nozzle with the PA are shown in Figure 10 with the ON and OFF events. Kelvin–Helmholtz instability vortexes were observed as in the base case. These vortexes, known as initial vortexes, break down at the end of the potential core region. As shown in the figure, the PAs can actively control the flow by generating pair of spanwise vortexes when the PA is operating during “ON” events. When compared to the base case, it can be observed that the periodic “pumping” effect on the airflow as the modular frequency f m with duty is applied to the PAs. The width of the jet changed when the plasma actuator was ON and operated under different working conditions. These actuators can overdrive the natural vortex generation frequency of the rectangular jets. The PA working condition once again determines the size of the vortex ring generated by the PA.
Figure 11 shows velocity distribution along the y and z axes at different locations to give an overview of the base case. It also verifies that the laboratory coordination established by the transverse system corresponds with the rectangular jet coordination system. Velocity measurements were conducted at x / h = 70 under various working conditions of the plasma actuator. For a better comparison between a large number of cases, the surface plot and heat scatter plot results using the same set of data (velocity vs. modular frequency vs. duty) for θ = 0 and θ = π are shown in Figure 12 and Figure 13, respectively. These plots confirm that the plasma actuator modifies the velocity at the measured point. Although θ = 0 can both increase and decrease the velocity, θ = π only shows a tendency to reduce the velocity. There is a clear tendency when θ = 0; when f m is in the range of 50–200 Hz, PAs improve the velocity compared with the base case with PAs turning off. At the measuring point where x / h = 70, the velocity was 4% higher (Case A) and 11% lower (Case B) across all tested cases than in the base case. In contrast, when θ = π , a significant decrease in velocity can be seen in the same area where the velocity is increased when θ = 0 (from f m = 50–200). Another point from this graph is that the modular frequency substantially affects the velocity more than the duty cycle in both major cases. For example, when f m = 500 Hz and θ = π , changing the duty from 0.1 to 0.9 yields almost the same color on the heat scatter plot.
For further examination, two cases with the most significant effect on rectangular jet flow were selected. One case had a high-velocity performance when θ = 0, and the other had a low-velocity performance when θ = π was measured to acquire the centerline velocity. For cases where the plasma actuator was operating, the measurements started at x / h = 5 to maintain a safe distance from the plasma to protect the measuring equipment. The two cases are: case A— f m = 150 Hz, d u t y = 0.5, θ = 0, and case B— f m = 50 Hz, d u t y = 0.7, θ = π ; the details are listed in Table 2.
The velocity decay of the jet centerline in this zone can be calculated using Equation (2). The centerline velocity compared with the theoretical and base cases are illustrated in Figure 14. K 1 is an empirical constant derived from centerline experiment data. Similar work to find K 1 can be obtained from the work of Shepelev [15], Gortler and Tollmein [16], Heskestad [17], and Kotsovinos [18]. In this study, K 1 = 2.05 was found using the least square method to fit the model with experimental data. The equations for the velocity used in the centerline velocity equation assume that the jet is supplied from a virtual origin. The addition of the term, x 0 , to the distance from the outlet corrects the influence of the outlet size on the jet geometry. However, as reported by Goodfellow [19], it can be neglected by many researchers for practical use in experimental comparisons.
U m 0 U 0 = K 1 h x ,
where,
  • U m 0 —Centerline velocity at x;
  • U 0 —Average velocity at outlet where ( x 0 , y 0 , z 0 ) = (0,0,0);
  • h—Height of rectangular nozzle; and
  • K 1 —Centerline velocity decay constant.
From x / h = 0 to x / h = 30, these cases perform worse than the base case with a shorter potential core; in particular, for case B, the normalized velocity at this point is 30% less than that of the base case. After x / h = 30, case A performed better, resulting in an increased offset velocity profile from the base case, and case B vastly decreased compared with the base case. Figure 15 shows the turbulence intensity along the centerline. The turbulence intensity is related to the mixing phenomena in the flow. As seen from the base case, the maximum mixing on the centerline happened at x / h = 10, and the intensity gradually decreased and stabilized at 16%. Case A turbulence intensity peaked at the exact location as the base case. After that, the profile trended similarly to the base case when PAs were off. In contrast, the evolution of turbulence intensity profile changed entirely when PAs operated at phase difference in case B. While other cases got their peaks turbulence intensity, case B got its low. After x / h = 30, the turbulence intensity increased rapidly, whereas the other cases decreased and then reached the maximum turbulence intensity at 30%. As a result, PAs can introduce turbulence intensity to the flow when working in the phase difference mode at a particular frequency.
Plasma Actuators can influence the distribution in the oy and oz direction, as shown in Figure 16. In case A, velocity profiles along the z-axis were improved at all measured locations; the y profiles were decreased at x / h equaled 5 and 10 and had positive offsets at x / h = 30, 50, and 70. In the case of B, the velocity profiles in the z-direction performed better than other cases from x / h = 5, 10, and 30, whereas the profiles in the y-direction performed worse than others. The jet width was expanded in the oz direction and constrained in the oy direction, indicating the conversion of kinetic energy from one direction to the other. The cross-section of a rectangular jet evolves downstream with its major and minor axis rotated at angles compared to jet geometry. This phenomenon is called axis-switching. Consequently, plasma actuators operating at different conditions can change the profile to increase or decrease the centerline velocity of high-aspect-ratio rectangular jets.
An energy analysis of the plasma actuator and a high-aspect-ratio rectangular jet was conducted to clarify whether the effect of the PA on the velocity was caused by the injection of kinetic energy or the result of the flow manipulation. This could be achieved by calculating the ratio of the plasma actuator mechanical power (PA kinetic energy flux) to the rectangular jet kinetic energy flux. First, the kinetic energy flux of the rectangular jet was calculated using Equation (3):
ϕ k = 1 2 m ˙ U 0 2 = 1 2 ( ρ U 0 A ) U 0 2 ,
where,
ϕ k —Rectangular jet’s kinetic energy flux;
m ˙ —Mass flow rate;
ρ —Density of air;
A—Rectangular jet exit area; and
U 0 —Initial velocity at the jet exit.
Secondly, the power consumption and kinetic energy flux of a single DBD Plasma Actuator were obtained by the shunt resistor method refer to Tang et al. [20] and Ashpis et al. [21]. Voltage and current were measured to calculate the power consumption of the Plasma Actuator at d u t y = 1. The results are illustrated in Figure 17. After that, the power consumption of a Plasma Actuator was calculated using Equation (4):
W e l e c = f b t * = 0 t * = 1 V ( t ) I ( t ) d t ,
where,
W e l e c —Plasma actuator’s electrical power consumption;
f b —Base frequency;
V ( t ) —Voltage at each point in the period;
I ( t ) —Current at each point in the period; and
t * —The normalized t represents a single period.
The mechanical power of the plasma actuator can be calculated based on the velocity profile of a single PA, operating with d u t y = 1, no free stream flow, and no external force, using Equation (5). Under these conditions, the momentum should theoretically be conserved in all velocity profiles. The plasma actuator velocity profile at x = 60 mm (Figure 18) was used to calculate the PA mechanical power.
W m e c h = 1 2 ρ L y = 0 y = U 3 ( y ) d y ,
where,
W m e c h —Plasma actuator’s mechanical power;
ρ —Density of air;
L—Length of the Plasma Actuator;
U ( y ) —Velocity according to y coordinate at each point.
In this study, two PAs were used under the influence of the duty cycle. Therefore, the power consumption and kinetic energy flux for each case equaled the variables of a single DBD plasma actuator multiple by ( 2 × d u t y ) to obtain the results. The power analysis results for all cases are described in Table 3. The ratio of mechanical power to the power consumed by the plasma actuator as W m e c h W e l e c determines the conversion efficiency. This value was found to be 0.001%. It means most of the electric power was turned into heat energy. The ratio of W m e c h ϕ k as the PA mechanical power (also known as PA kinetic energy flux) to the rectangular jet kinetic energy flux implies the power of the control input is influenced by a change in the kinetic energy in the form of velocity. The results show that for high-velocity performance in case A, the energy required to perform the active control technique is 0.048%, which is even smaller than that for case B. Case B, which has a lower velocity performance, has a higher value of energy requirement at 0.067%. Therefore, the plasma actuator can perform velocity control with only a minor amount of power compared to the kinetic energy flux of the flow.

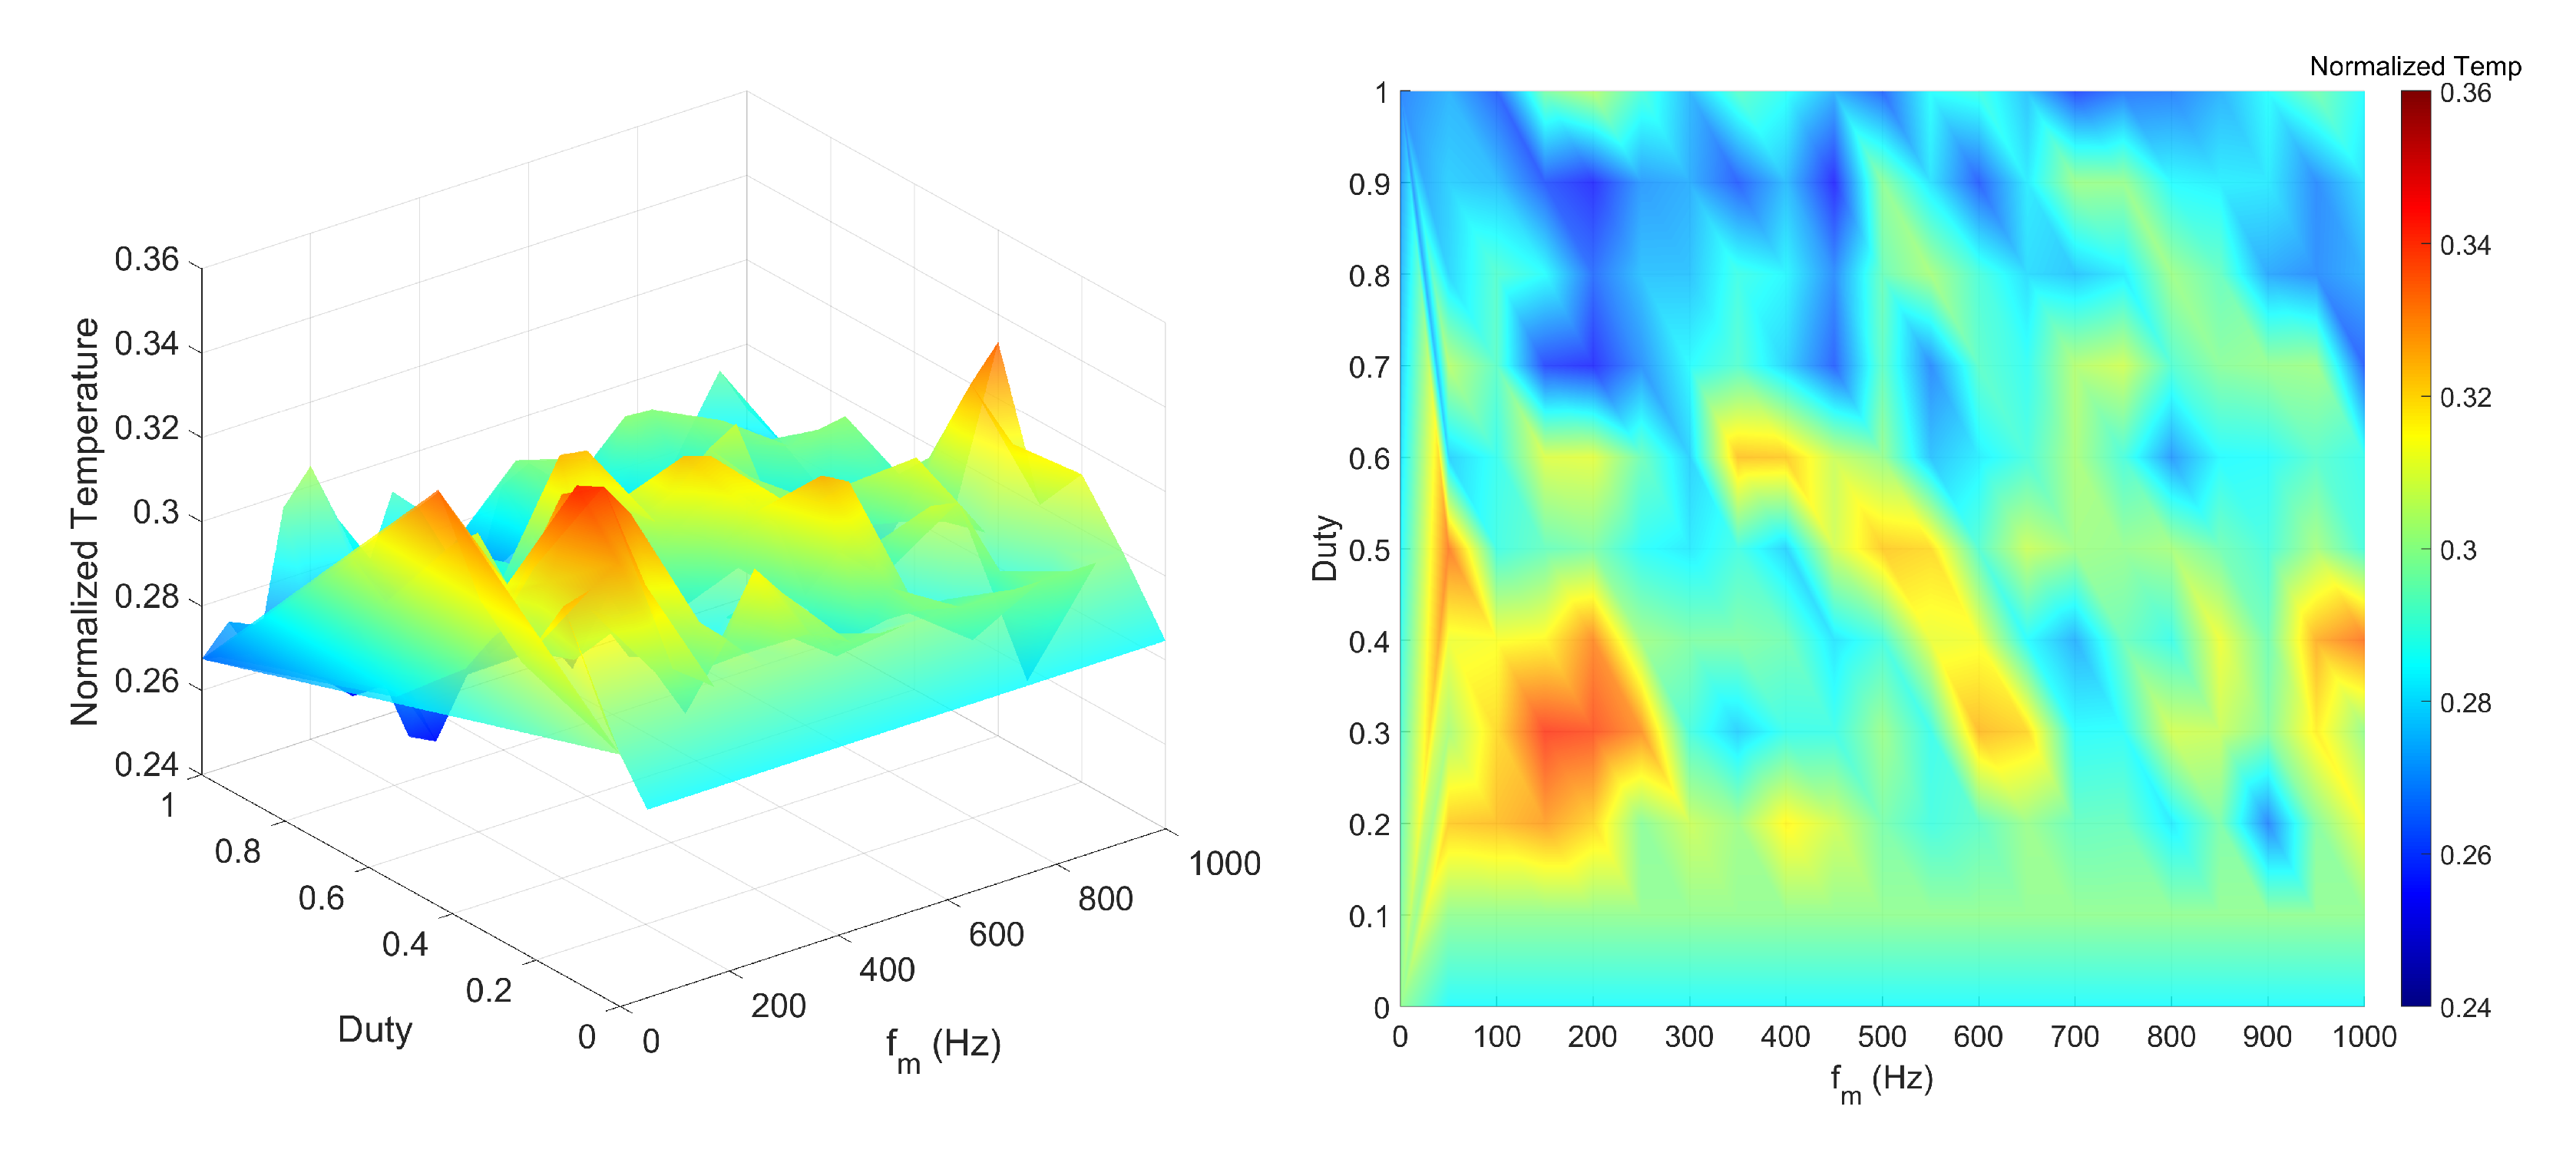
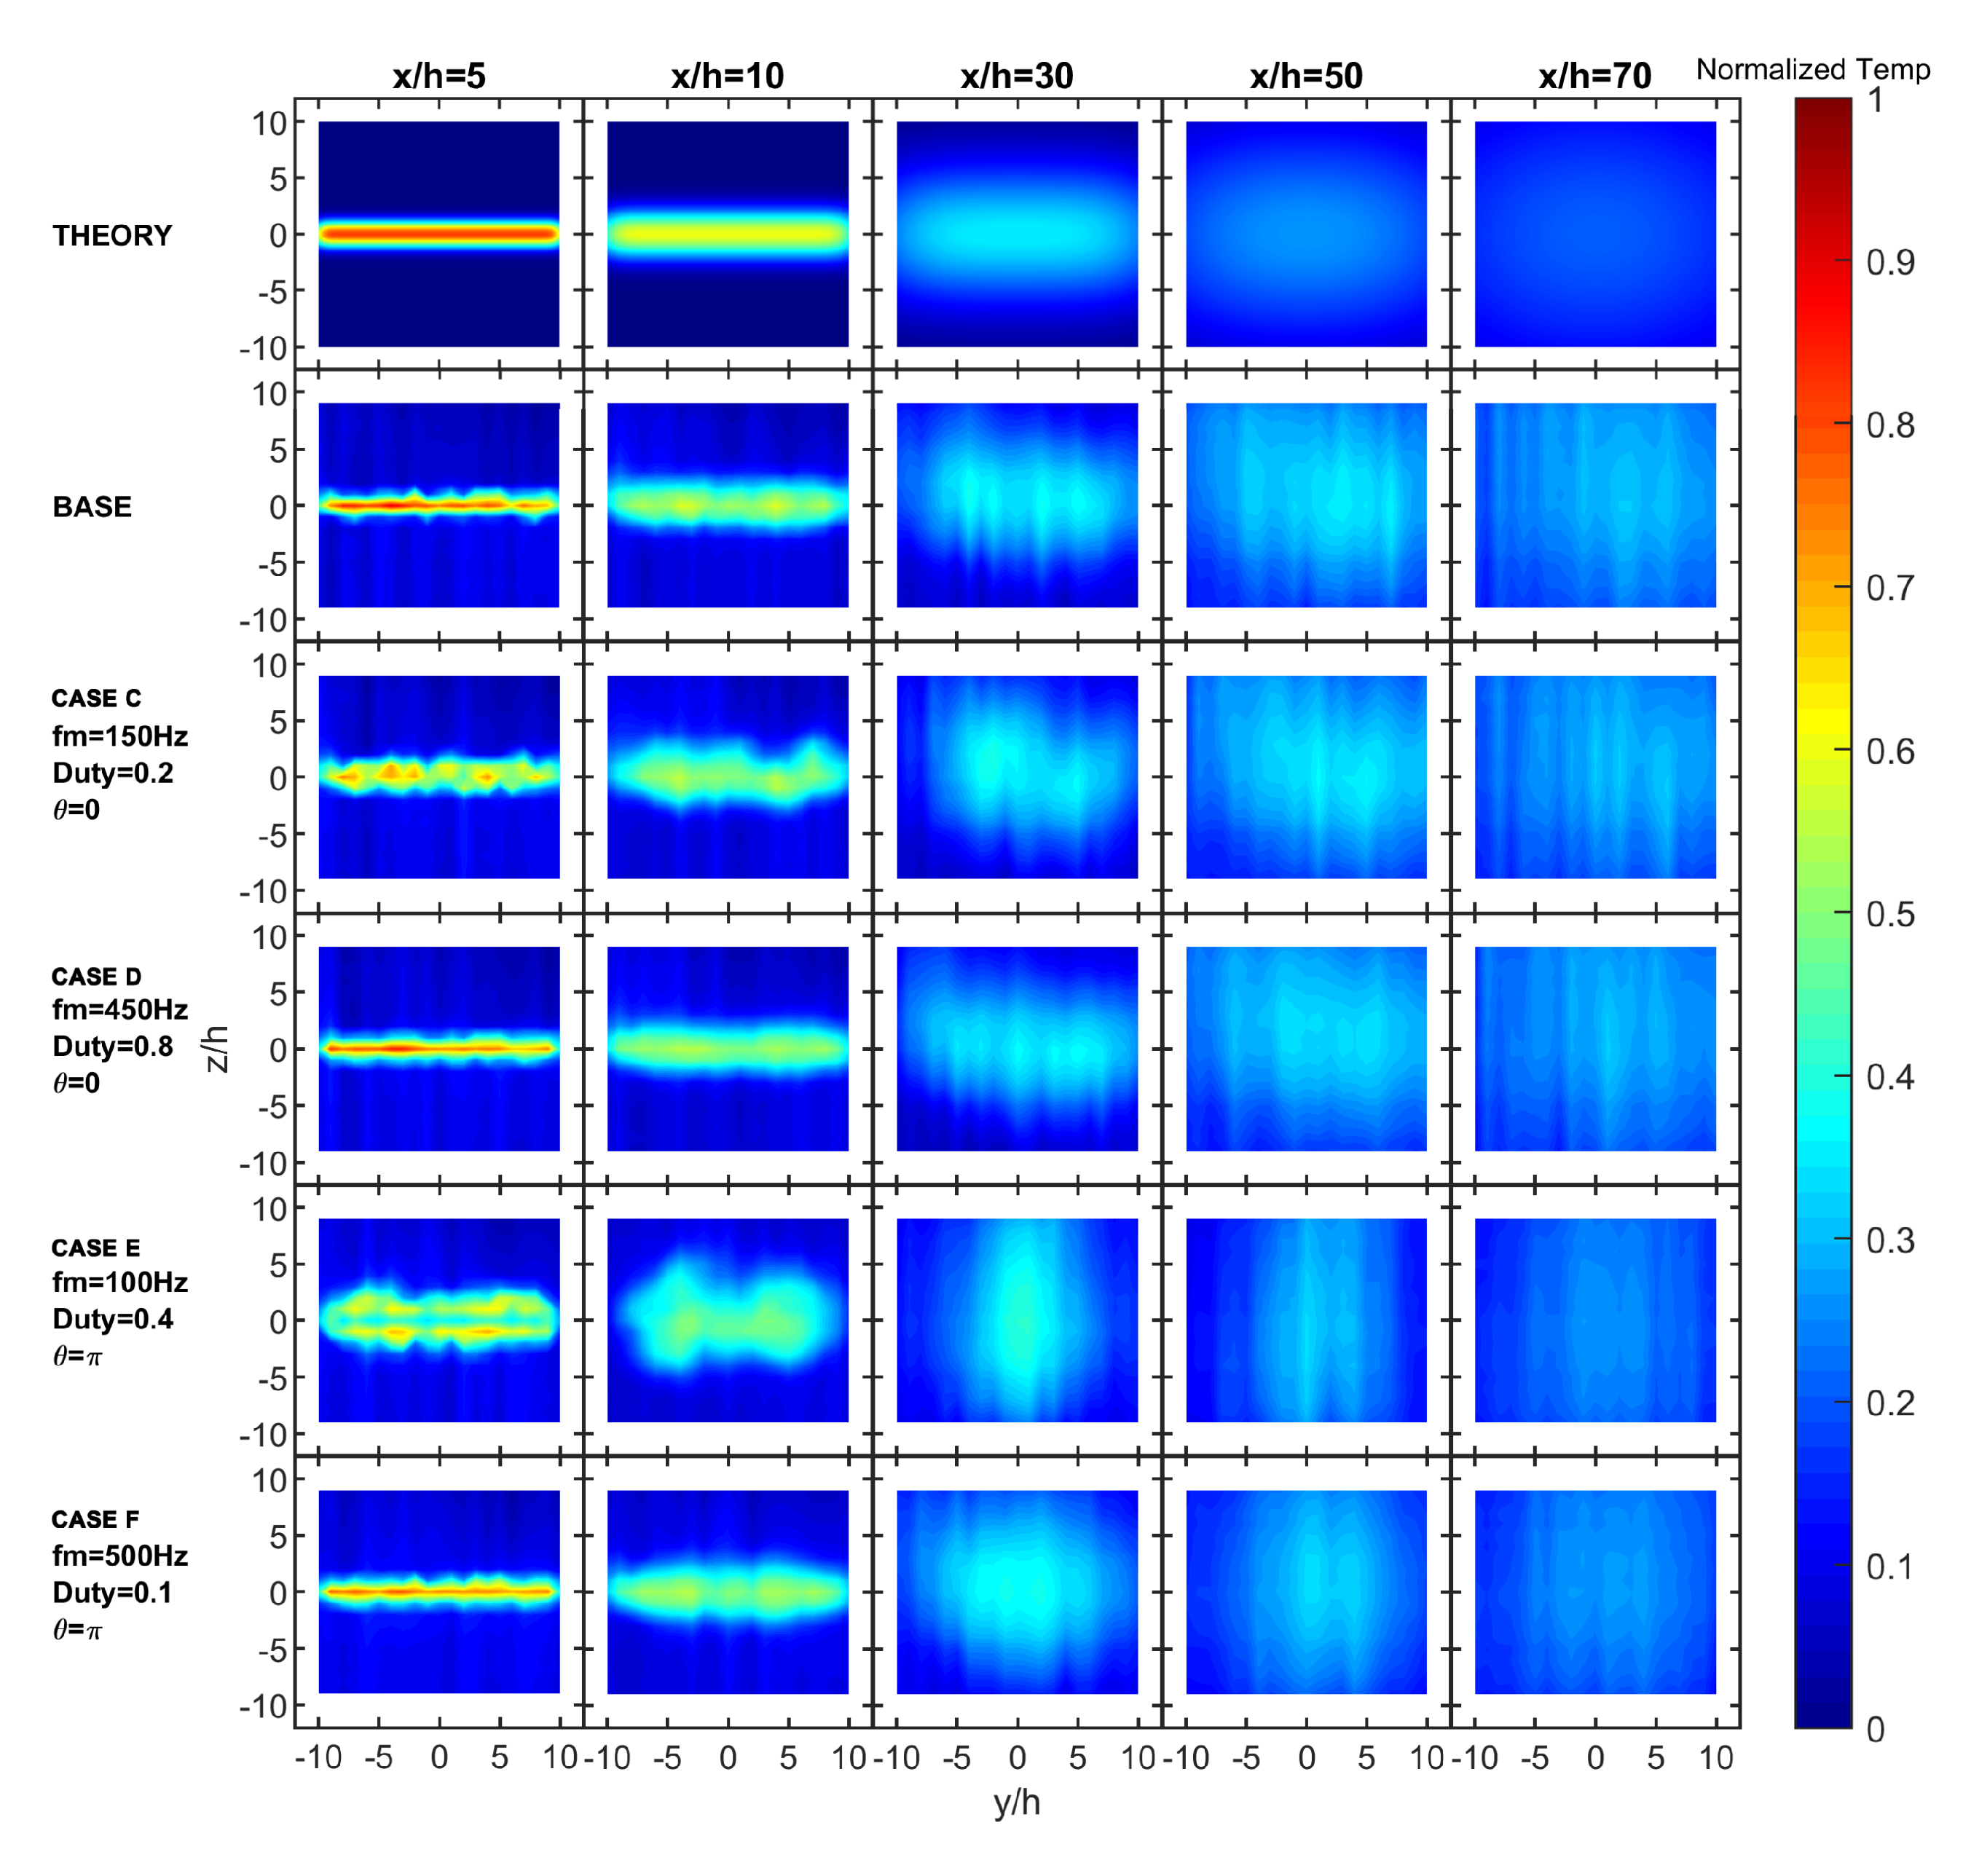
3.2. Plasma Actuator Effect on High Aspect Ratio Rectangular Jet Temperature

The scanning method was also applied for temperature evaluation using the same logic. The surface plot and heat scatter plot results using the same set of data (normalized temperature vs. modular frequency vs. duty) for θ = 0 and θ = π are shown in Figure 19 and Figure 20, respectively. Even though the same scanning method was used for temperature and velocity measured at the same point on the centerline where x / h = 70, there was no correlation in these surface plots and contour plots for velocity and temperature. In this context, duty seems to have a more substantial influence on the temperature than the modular frequency f m , unlike the previous velocity analysis. The duty from 0.1 to 0.5 generally results in better temperature, and having the duty from 0.6 to 0.9 has the opposite effect.
Four cases were chosen for further examinations: two cases (C and D) with a 5% higher and 3.5% lower temperature performance compared to the base case, while θ = 0, and another two cases (E and F) having 4% higher and 4% lower temperature performance compared to the base case, while θ = π . The details of these cases are listed in Table 2. The temperature contour plots on the xz cut section where y / h = 0 in these cases are illustrated in Figure 21. The theoretical distribution was calculated based on Shepelev [22] and Goodfellow [19]. It can be done by curve fitting the experimental data to find the empirical constant c = 0.1253 and then computing the velocity using Equation (6) to yield the temperature at any given point in space using Equation (7). In these two equations, the term “ erf ” represents the mathematical error function.
U x y z = U 0 2 erf B 0 z c x + erf B 0 + z c x ,
U x y z ( T x y z T a ) U 0 ( T 0 T a ) = 1 4 erf 1 + P r 2 y + A 0 c x erf 1 + P r 2 y A 0 c x X erf 1 + P r 2 z + B 0 c x erf 1 + P r 2 z B 0 c x ,
where,
  • U x y z —Velocity at any given point in space with ( x , y , z ) coordinate;
  • U 0 —Average velocity at outlet where ( x 0 , y 0 , z 0 ) = (0,0,0);
  • T x y z —Temperature at any given point in space with ( x , y , z ) coordinate;
  • T a —Ambient temperature;
  • T 0 —Average temperature at outlet where ( x 0 , y 0 , z 0 ) = (0,0,0);
  • A 0 —Half length of nozzle width;
  • B 0 —Half length of nozzle height;
  • P r —Prandtl number;
  • c—Empirical constant.
When comparing these cases with the theoretical and base cases, it can be observed that the plasma actuator changes the temperature jet width and temperature distribution. In particular, the jet was spread in Case E. In the near outlet region, where x / h = 5 to 10, the jet has a wide distribution across the y-axis. From x / h = 20 to x / h = 40, the temperature distribution was denser than in the other cases, which means that most thermal interactions occurred in this general area. As a rule of thermal conservation, this intense thermal interaction creates a stronger mixing effect. This area mixed air at lower thermal energy with higher thermal energy. This resulted in a higher temperature near the outlet and a lower temperature in the far region after intensive mixing.
For better visualization and comparison, the normalized centerline temperature for these cases and the theoretical distribution were extracted from the same data set, as shown in Figure 22. It can be concluded that PAs also affect changing the temperature distribution in the xz plane and the yz cut sections. The diverging and converging jet width effects occur in all jet domains. Reasons for this phenomenon are out of this research’s scope and will be further studied in future research. Furthermore, the axis-switching effect can be observed in case E, where x / h = 30, and the jet’s axis is rotated by 90 ° compared with the theoretical and base-case temperatures. By combining Figure 21 and Figure 22, this general area where x / h = 20 to 40 has a high normalized temperature focused on a smaller area because of the earlier axis-switching effect.
The centerline temperature is shown in Figure 23. The temperature was normalized and compared with the theoretical work of Koestel [23] in Equation (8) and Abramovich [24] in Equation (9). Two empirical coefficients at K 2 = 4.134 and a = 0.0988 were determined by fitting these models to the experimental data using the nonlinear least-squares method.
τ m 0 = 0.83 K 2 h x ,
τ m 0 = 1.04 a x B 0 + 0.41 ,
where,
  • τ m 0 —Normalized centerline temperature at x;
  • B 0 —Half length of nozzle height;
  • K 2 —Centerline temperature decay constant [23];
  • a—Temperature decay constant [24].
When applying the plasma actuator, the potential temperature core becomes shorter than the base case and decays faster. However, after the distance from the nozzle of x / h = 30, the temperature became higher than the base case. Furthermore, considering case E when f m = 100 Hz, duty = 0.4, and θ = π , in the region near the outlet x / h < 20, the centerline velocity performs worse than the base case. However, when it reaches the region 20 x / h 40, there is a significant increment compared to the theory, base case, and other cases. This region is also where the axis-switching phenomena are described in the previous discussion.
Generally, the plasma generated by an Alternating Current (AC) driven DBD plasma actuator is non-thermal plasma in which heavy species have temperatures close to the ambient temperature while the electron temperature is much higher [25]. The energy in this type of plasma is mainly stored in the electrons and consequently does not contribute to the gas’s heating [26]. The ratio of Q k Q p a heat flux of the rectangular jet in the experiment to the heat flux of the plasma actuator was calculated to clarify whether the effect of the PA on the temperature was caused by the injection of thermal energy or it was the result of the flow manipulation. The heat flux of the rectangular jet was calculated using Equation (10). The heat flux of the plasma actuator was calculated using Equation (11), assuming that the total energy input was equal to the kinetic energy plus thermal energy.
Q k = m ˙ C p Δ t = ( ρ U 0 A ) C p Δ t ,
where,
Q k —Heat flux of the rectangular jet;
m ˙ —Mass flow rate;
ρ —Density of air;
A—Rectangular jet exit area;
U 0 —Initial velocity at the jet exit;
C p —Specific heat of air at the experiment condition;
Δ t —Temperature difference between the outlet and ambient temperature.
Q p a = W e l e c W m e c h ,
where,
Q p a —Heat flux of plasma actuator;
The heat-flux results are presented in Table 3. The two cases C and F show that only a small amount of energy compared to the heat flux of the flow (0.726% and 0.363% for cases C and F, respectively) can achieve 5% and 4% lower absolute temperatures (or higher normalized temperatures), respectively. Therefore, it can be concluded that flow manipulation caused a change in the jet temperature. Consequently, the thermal effect of the plasma actuator only affects small and local regions where the plasma exists and does not contribute to airflow heating in a considerably larger area.

4. Conclusions

As a high-aspect-ratio rectangular jet is essential for various engineering applications, controlling this jet using an active flow control technique using plasma actuators opens new possibilities. The combination of modular frequency, duty, and phase difference determines the working condition of the plasma actuators and has different effects on the flow features. The PA can affect the initial vortex and overdrive the natural vortex generation frequency and size.
With 362 tested cases, it is known that the timing of the induced wind as a modular frequency has a substantial effect on the velocity of the rectangular jet compared with duty. It can increase or decrease the velocity at a certain point and change the profile of the centerline velocity. However, changing the duty cycle influences the temperature better than the modular frequency. It can also affect the temperature at a particular point, centerline temperature profile, and temperature distribution across cut sections.
It was also found that under specific conditions, the plasma actuator can cause the axis-switching phenomenon to occur at a location closer to the rectangular nozzle outlet (Case E), where x / h = 20–30. It results in a “thick” distribution of the high normalized temperature in this identical area.
If this technology is improved, it could open the opportunity to implement it in controlling air conditioner outlets for air conditioning applications because Plasma Actuator is a simple flow-control device that requires minor power input. By optimizing the operating conditions, further performance targeted at a 10% improvement (as can be seen x / h = 27 while comparing the centerline temperature between the base case and case E) could be achieved in the future concerning the velocity and temperature of the jet. The patterns of the plasma actuator will also be included for consideration to improve the performance of the rectangular jet.

Author Contributions

Conceptualization, A.V.P. and K.I.; methodology, A.V.P. and K.I.; validation, A.V.P., K.I., M.S. (Miyuki Saito) and M.S. (Masaharu Sakai); formal analysis, A.V.P.; investigation, A.V.P.; resources, A.V.P., K.I., M.S. (Miyuki Saito) and M.S. (Masaharu Sakai); data curation, A.V.P.; visualization, A.V.P. and K.I.; supervision, K.I.; project administration, K.I., M.S. (Miyuki Saito) and M.S. (Masaharu Sakai); funding acquisition, K.I., M.S. (Miyuki Saito) and M.S. (Masaharu Sakai); writing—original draft preparation, A.V.P.; writing—review and editing, K.I., M.S. (Miyuki Saito) and M.S. (Masaharu Sakai). All authors have read and agreed to the published version of the manuscript.

Funding

This research received no external funding.

Institutional Review Board Statement

Not applicable.

Informed Consent Statement

Not applicable.

Data Availability Statement

Not applicable.

Conflicts of Interest

The authors declare no conflict of interest.

Abbreviations

The following abbreviations are used in this manuscript:
PAPlasma Actuator
DBDDielectric Barrier Discharge
ARAspect Ratio
PIDProportional–Integral–Derivative
ACAlternative Current

References

  1. Rajaratnam, N. Turbulent Jets; Elsevier: Amsterdam, The Netherlands, 1976; Chapter 13; p. 267. [Google Scholar]
  2. Shakouchi, T. Jet Flow Engineering: Fundamentals and Application; Morikita Publishing Co., Ltd.: Tokyo, Japan, 2004. [Google Scholar]
  3. Deo, R.C.; Mi, J.; Nathan, G.J. The influence of nozzle-exit geometric profile on statistical properties of a turbulent plane jet. Exp. Therm. Fluid Sci. 2007, 32, 545–559. [Google Scholar] [CrossRef]
  4. Corke, T.C.; Enloe, C.L.; Wilkinson, S.P. Dielectric barrier discharge plasma actuators for flow control. Annu. Rev. Fluid Mech. 2010, 42, 505–529. [Google Scholar] [CrossRef]
  5. Benard, N.; Bonnet, J.P.; Touchard, G.; Moreau, E. Flow Control by Dielectric Barrier Discharge Actuators: Jet Mixing Enhancement. AIAA J. 2008, 46, 2293–2305. [Google Scholar] [CrossRef]
  6. Riherd, M.; Roy, S. Measurements and simulations of a channel flow powered by plasma actuators. J. Appl. Phys. 2012, 112, 053303. [Google Scholar] [CrossRef]
  7. Castellanos, R.; Michelis, T.; Discetti, S.; Ianiro, A.; Kotsonis, M. Reducing turbulent convective heat transfer with streamwise plasma vortex generators. Exp. Therm. Fluid Sci. 2022, 134, 110596. [Google Scholar] [CrossRef]
  8. Rizzetta, D.P.; Visbal, M.R. Numerical investigation of plasma-based control for low-Reynolds-number airfoil flows. AIAA J. 2011, 49, 411–425. [Google Scholar] [CrossRef]
  9. Portugal, S.; Choudhury, B.; Lilley, A.; Charters, C.; Porrello, C.; Lin, J.; Roy, S. A fan-shaped plasma reactor for mixing enhancement in a closed chamber. J. Phys. D Appl. Phys. 2020, 53, 22LT01. [Google Scholar] [CrossRef]
  10. Wojewodka, M.M.; White, C.; Kontis, K. Effect of permittivity and frequency on induced velocity in ac-DBD surface and channel plasma actuators. Sens. Actuators A Phys. 2020, 303, 111831. [Google Scholar] [CrossRef]
  11. Moreau, E.; Cazour, J.; Benard, N. Influence of the air-exposed active electrode shape on the electrical, optical and mechanical characteristics of a surface dielectric barrier discharge plasma actuator. J. Electrost. 2018, 93, 146–153. [Google Scholar] [CrossRef]
  12. Rodrigues, F.; Mushyam, A.; Pascoa, J.; Trancossi, M. A new plasma actuator configuration for improved efficiency: The stair-shaped dielectric barrier discharge actuator. J. Phys. D Appl. Phys. 2019, 52, 385201. [Google Scholar] [CrossRef]
  13. List, E. Turbulent jets and plumes. Annu. Rev. Fluid Mech. 1982, 14, 189–212. [Google Scholar] [CrossRef]
  14. Fukagata, K.; Yamada, S.; Ishikawa, H. Plasma actuators: Fundamentals and research trends. J. Jpn. Soc. Fluid Mech. 2010, 29, 243–250. [Google Scholar]
  15. Shepelev, I. Supply ventilation jets and fountains. In Proceedings of the Academy of Construction and Architecture of the USSR, Moscow, Russia, 14–17 November 1961; Volume 4. [Google Scholar]
  16. Kraemer, K. Die Potentialströmung in der Umgebung von Freistrahlen. Z. Flugwiss 1971, 19, 93–104. [Google Scholar]
  17. Heskestad, G. Hot-wire measurements in a plane turbulent jet. Trans. ASME J. Appl. Mech. 1965, 32, 721–731. [Google Scholar] [CrossRef]
  18. Kotsovinos, N.E.; List, E.J. Plane turbulent buoyant jets. Part 1. Integral properties. J. Fluid Mech. 1977, 81, 25–44. [Google Scholar] [CrossRef]
  19. Goodfellow, H.D.; Kosonen, R. Industrial Ventilation Design Guidebook: Volume 1: Fundamentals; Academic Press: Cambridge, MA, USA, 2020. [Google Scholar]
  20. Tang, A.; Vaddi, R.; Mamishev, A.; Novosselov, I. Empirical relations for discharge current and momentum injection in dielectric barrier discharge plasma actuators. J. Phys. D Appl. Phys. 2021, 54, 245204. [Google Scholar] [CrossRef]
  21. Ashpis, D.; Laun, M.; Griebeler, E. Progress toward accurate measurement of dielectric barrier discharge plasma actuator power. AIAA J. 2017, 55, 2254–2268. [Google Scholar] [CrossRef] [PubMed]
  22. Shepelev, I.; Gelman, N. Universal equations for velocity and temperature computation along the ventilation jets, supplied from rectangular outlets. Water Supply. Sanit. Tech. 1966. [Google Scholar]
  23. Koestel, A. Pathsof Horizontally Projected Heated and Chilled Airjets. ASHVE J. 1955, 27, 55. [Google Scholar]
  24. Abramovich, G. Free Turbulent Jets of Liquids and Gases; Gosẽnergoizdat: Moscow, Russia, 1948; p. 288. [Google Scholar]
  25. Jakob, H.; Kim, M.K. Feasibility Study on the Use of Non-Thermal Plasma for a Cold Radio Blackout Experiment. In Proceedings of the AIAA Scitech 2020 Forum, Orlando, FL, USA, 6–10 January 2020; p. 2150. [Google Scholar] [CrossRef]
  26. Moreau, E. Airflow control by non-thermal plasma actuators. J. Phys. D Appl. Phys. 2007, 40, 605. [Google Scholar] [CrossRef]
Figure 1. Sketch of a rectangular jet. B: nozzle width, h: nozzle height, x , y , z : distance from a suitable origin, U 0 : the velocity efflux, U m 0 : centerline velocities of cut sections. Adapted with permission from Ref. [1] 1976 Elsevier Science & Technology Journals.
Fluids 07 00281 g001
Figure 2. Overview of the experiment setup.
Fluids 07 00281 g002
Figure 3. The thermocouple array consists of 19 thermocouples used to measure the temperature of flow. CH10* was located in the middle of the array.
Fluids 07 00281 g003
Figure 4. Temperature-controlled enclosure chamber schematic.
Fluids 07 00281 g004
Figure 5. Single DBD plasma actuator configuration.
Fluids 07 00281 g005
Figure 6. High-voltage high-frequency pulse-width modulation sinusoidal Wave. The signal is amplified by the high voltage plasma power supply. Whereas: V p p —peak to peak voltage, T O N —ON time of plasma actuator, T—time per phase, D u t y —Duty of the PWN signal, f b —base frequency generated by the plasma power supply, f m —modular frequency, T d i f f —Time difference between the upper PA and lower PA signal, θ —Phase difference between the upper PA and lower PA signal.
Fluids 07 00281 g006
Figure 7. 3D design of rectangular nozzle (7.5 mm × 150 mm) AR = 20 assembly with plasma actuators. Parts (a), (b), (c), and (d) to construct the assembly are indicated in the right-side exploded view.
Fluids 07 00281 g007
Figure 8. Parts (a) and (b) to construct the nozzle outlet.
Fluids 07 00281 g008
Figure 9. Full installation of an operating nozzle and plasma actuators onto the wind tunnel.
Fluids 07 00281 g009
Figure 10. Images of flow visualized by PIV laser sheet and high-speed camera (Side view).
Fluids 07 00281 g010
Figure 11. Velocity profiles along the y and z axes at different locations.
Fluids 07 00281 g011
Figure 12. Surface plot and heat scatter plot ( f m vs. d u t y vs. v e l o c i t y ) while θ = 0 at centerline where x / h = 70.
Fluids 07 00281 g012
Figure 13. Surface plot and heat scatter plot ( f m vs. d u t y vs. v e l o c i t y ) while θ = π at centerline where x / h = 70.
Fluids 07 00281 g013
Figure 14. Comparison between centerline velocities of different cases.
Fluids 07 00281 g014
Figure 15. Comparison of centerline turbulence intensity between cases.
Fluids 07 00281 g015
Figure 16. Velocity distribution along the oy and oz directions at different locations.
Fluids 07 00281 g016
Figure 17. Voltage and current applied to a Plasma Actuator used in the experiments, where d u t y = 1.
Fluids 07 00281 g017
Figure 18. Velocity profile of a Plasma Actuator at a distance of 60 mm from the covered electrode.
Fluids 07 00281 g018
Figure 19. Surface plot and heat scatter plot ( f m vs. d u t y vs. Normalized Temperature) while θ = 0 at centerline where x / h = 70.
Fluids 07 00281 g019
Figure 20. Surface plot and heat scatter plot ( f m vs. d u t y vs. Normalized Temperature) while θ = π at centerline where x / h = 70.
Fluids 07 00281 g020
Figure 21. Normalized temperature contour plot on xz cut section where y / h = 0 for different cases.
Fluids 07 00281 g021
Figure 22. Normalized temperature contour plot on yz cut section where x / h = 5, 10, 30, 50, and 70 for different cases.
Fluids 07 00281 g022
Figure 23. Comparison of centerline temperature between cases.
Fluids 07 00281 g023
Table 1. Details of velocity and temperature experiment conditions for testing the effect of plasma actuators on the rectangular jet.
SymbolDescriptionValueUnit
BNozzle width150mm
hNozzle height7.5mm
U 0 Outlet velocity4.5m/s
T a Controlled ambient temperature (average)40 ° C
T 0 Controlled nozzle temperature (average)12 ° C
V p p Peak-to-peak voltage of PA controlling signal6kV
f b Base frequency of PA controlling signal15kHz
f m Modular frequency voltage of PA controlling signal0–1000, 50 each stepHz
d u t y Duty of PA controlling signal0–1, 0.1 each step
θ Phase difference between upper and lower PA0 and π
Table 2. Denoted cases regarding Modular Frequency, Duty, and Phase Difference.
No.Case NameDescription f m d u t y θ
1BaseBase case---
2Case AHigh Velocity150 Hz0.50
3Case BLow Velocity50 Hz0.7 π
4Case CHigh Normalized Temperature150 Hz0.20
5Case DLow Normalized Temperature450 Hz0.80
6Case ELow Normalized Temperature100 Hz0.4 π
7Case FHigh Normalized Temperature500 Hz0.1 π
Table 3. Power analysis for all cases.
CaseDescription ϕ k ( W ) W elec ( W ) W mech ( W ) Q k ( W ) Q pa ( W ) W mech ϕ k ( % ) Q k Q pa ( % )
Single PA--3.1582.985 × 10 5 -3.158--
AHigh velocity6.253 × 10 2 3.1582.985 × 10 5 174.03.1580.047731.815
BLow velocity6.253 × 10 2 4.4214.179 × 10 5 174.04.4210.066822.541
CHigh Normalized Temperature6.253 × 10 2 1.2631.194 × 10 5 174.01.2630.019090.726
DLow Normalized Temperature6.253 × 10 2 5.0524.776 × 10 5 174.05.0520.076372.904
ELow Normalized Temperature6.253 × 10 2 2.5262.388 × 10 5 174.02.5260.038191.452
FHigh Normalized Temperature6.253 × 10 2 0.6325.970 × 10 6 174.00.6320.009550.363
Publisher’s Note: MDPI stays neutral with regard to jurisdictional claims in published maps and institutional affiliations.

