Abstract
Supercritical fluid reactive deposition is an environmentally friendly technique for the synthesis of supported mono- or bimetallic nanoparticles. Experimental results show that the adsorption of a precursor on a substrate is the crucial process step that controls the loading and the size of the deposited metal nanoparticles. In this review, an overview of experimental and modeling work is given and selected experimental data were correlated with the following adsorption isotherm models: Henry, Freundlich, Langmuir, Toth, and Langmuir–Freundlich equations. As a result, in the case of precursors with a low CO2 solubility and therewith low uptake, the adsorption behavior can be described with sufficient accuracy by the Henry approach. Furthermore, the Freundlich and Langmuir equations enable sufficiently accurate descriptions of the experimental data. In the end, strategies for overcoming the knowledge gaps for essential future research directions are suggested.
1. Introduction
Müller et al. pointed out that nano-structured materials (NSM) which are based on noble metal nanoparticles and metal oxides play an important role in various fields of catalysis and gas sensing [1]. These materials are characterized by unique properties such as high specific surface areas, leading to an enhanced energetic state and thus higher catalytic activity and reactivity [2]. In particular, the synthesis of supported mono- or bimetallic nanoparticles (NPs) by supercritical fluids (SCF) based particle formation processes is a broad field of promising applications.
Note that, according to Darr and Poliakoff, a useful definition of an SCF is “any substance, the temperature and pressure of which are higher than their critical values, and which has a density close to or higher than its critical density” [3]. Thus, throughout this manuscript, we use the prefix “sc” to signify this supercritical state (e.g., scCO2).
It has been pointed out in various publications that the supercritical fluid reactive deposition (SFRD) process enables the deposition of high dispersions of NPs on porous substrates [4,5,6,7]. In brief, the SFRD process involves three steps:
- Dissolution of the precursor in scCO2.
- Adsorption/desorption of the precursor on the surface of a substrate surface from the scCO2 mixture.
- Conversion of the precursor to its metallic form.
Numerous experimental results published by a large number of authors demonstrate that supported mono- or bimetallic NPs prepared by SFRD exhibit a catalytic behavior much higher than reference samples prepared by conventional methods, cf. overviews given in [2,5,6,7].
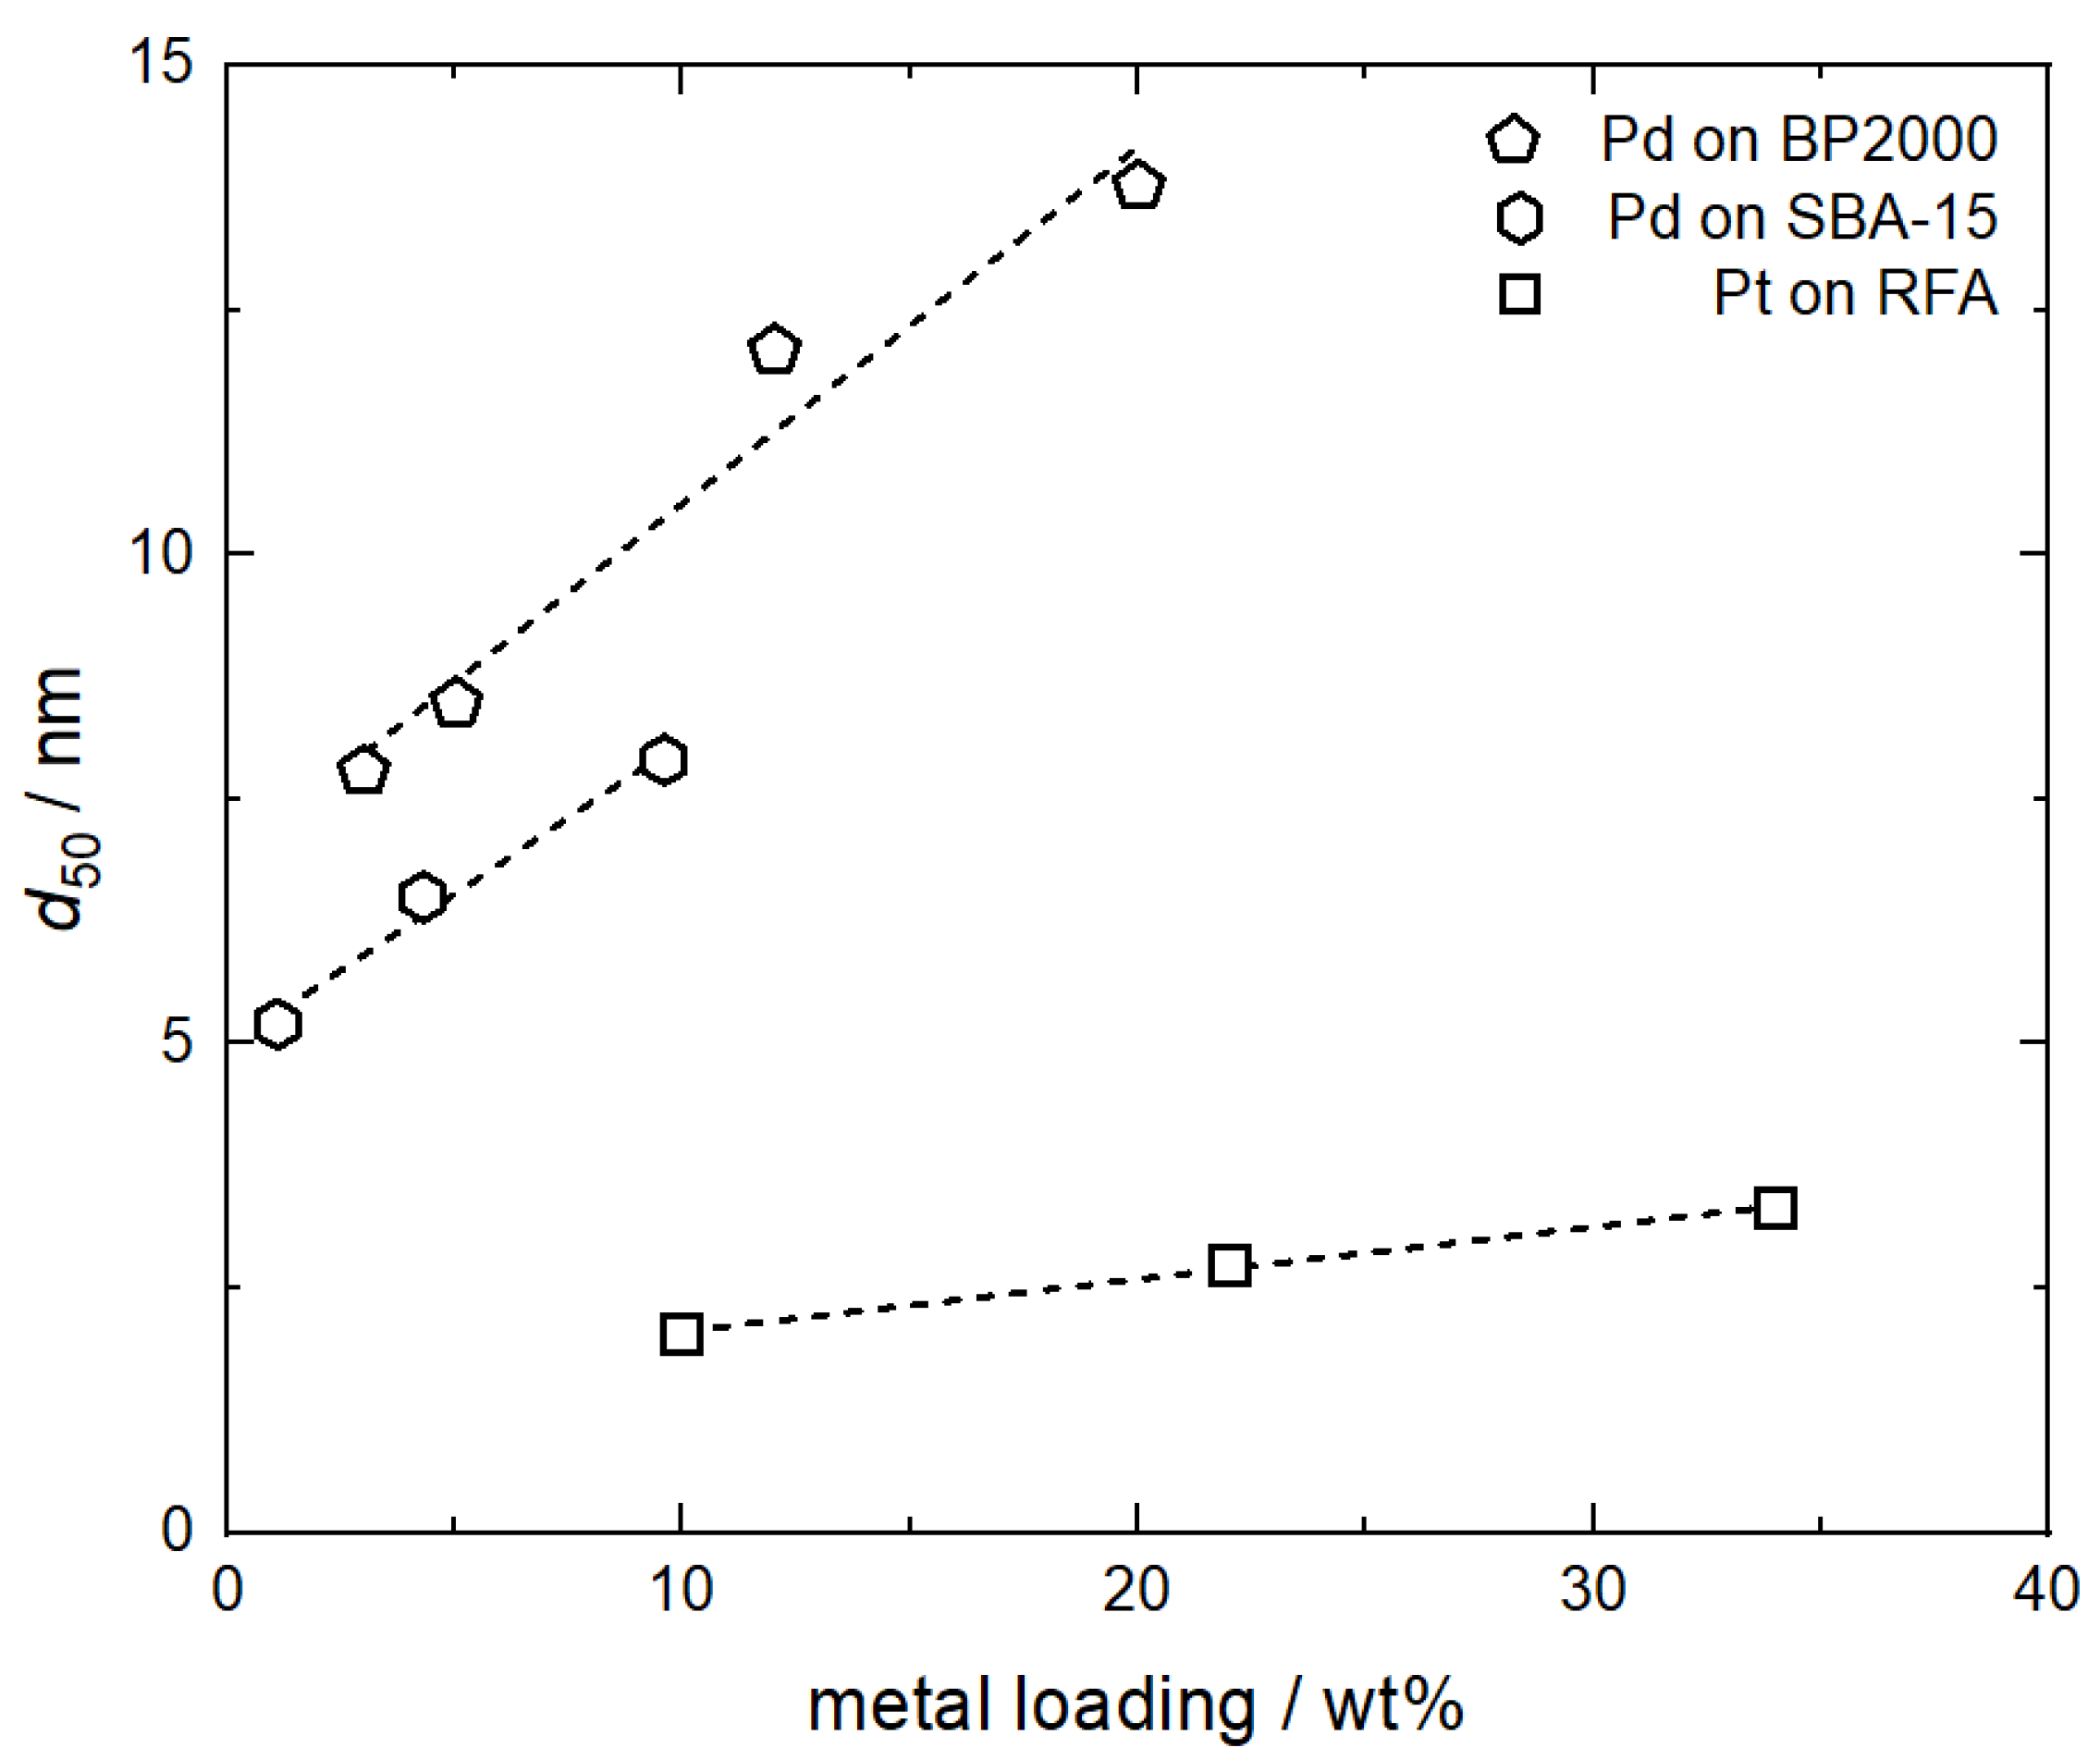
This superior catalytic activity and reactivity is mainly caused by the fact that the SFRD technique leads to highly dispersed metallic NPs and their size is significantly influenced by the adsorption/desorption behavior [6,7]. In terms of particle size, the adsorption behavior of the precursor used is the key step since the precursor uptake controls the metal loading. The relationship between metal loading and the size of Pt and Pd particles is illustrated in Figure 1. Obviously, a strong influence of the loading on the particle size is observed. In the case of both Pt and Pd NPs, the mean particle sizes (d50) increase monotonically with the loading. The d50 value of the Pt NPs deposited on resorcinol–formaldehyde aerogel (RFA) increases from 2.0 to 3.3 nm at an increase in Pt content from 10 to 34 wt%. Larger Pd NPs were obtained on mesoporous silica (SBA-15); here, the PS increases from 5.2 nm at 1.1 wt% to 7.9 nm at 9.6 wt%. Similarly, the d50 of the Pd NPs increases from 7.8 nm at 3 wt% Pd to 13.8 nm at 20 wt% on carbon black (BP2000) [8,9,10]. The linear correlation between particle size and metal loading is not unexpected due to more extensive particle growth and/or coalescence that would occur due to the higher concentration of metal atoms on the substrate surface.

Figure 1.
Influence of metal loading on mean particle size; experimental data taken from [8,9,10]. The dashed lines are a guide for the eye.
Thus, the results shown in Figure 1 demonstrate that knowledge and control of the adsorption process are essential to adjusting the desired metal amount and the size of the metal NPs deposited on the substrate because both properties determine the catalytic activity and reactivity of the material. Nevertheless, until today, only a very limited number of research groups are engaged in this topic. Therefore, there is a need for additional experimental adsorption data which enables an improved understanding of the relationship between adsorption conditions and the obtained product properties (e.g., catalytic activity and selectivity). Furthermore, for the design of adsorption processes and the identification of the best operating conditions, it is essential to understand the complex nature of the adsorption and desorption thermodynamics and kinetics of the scCO2/solute/substrate system.
1.1. Fundamentals
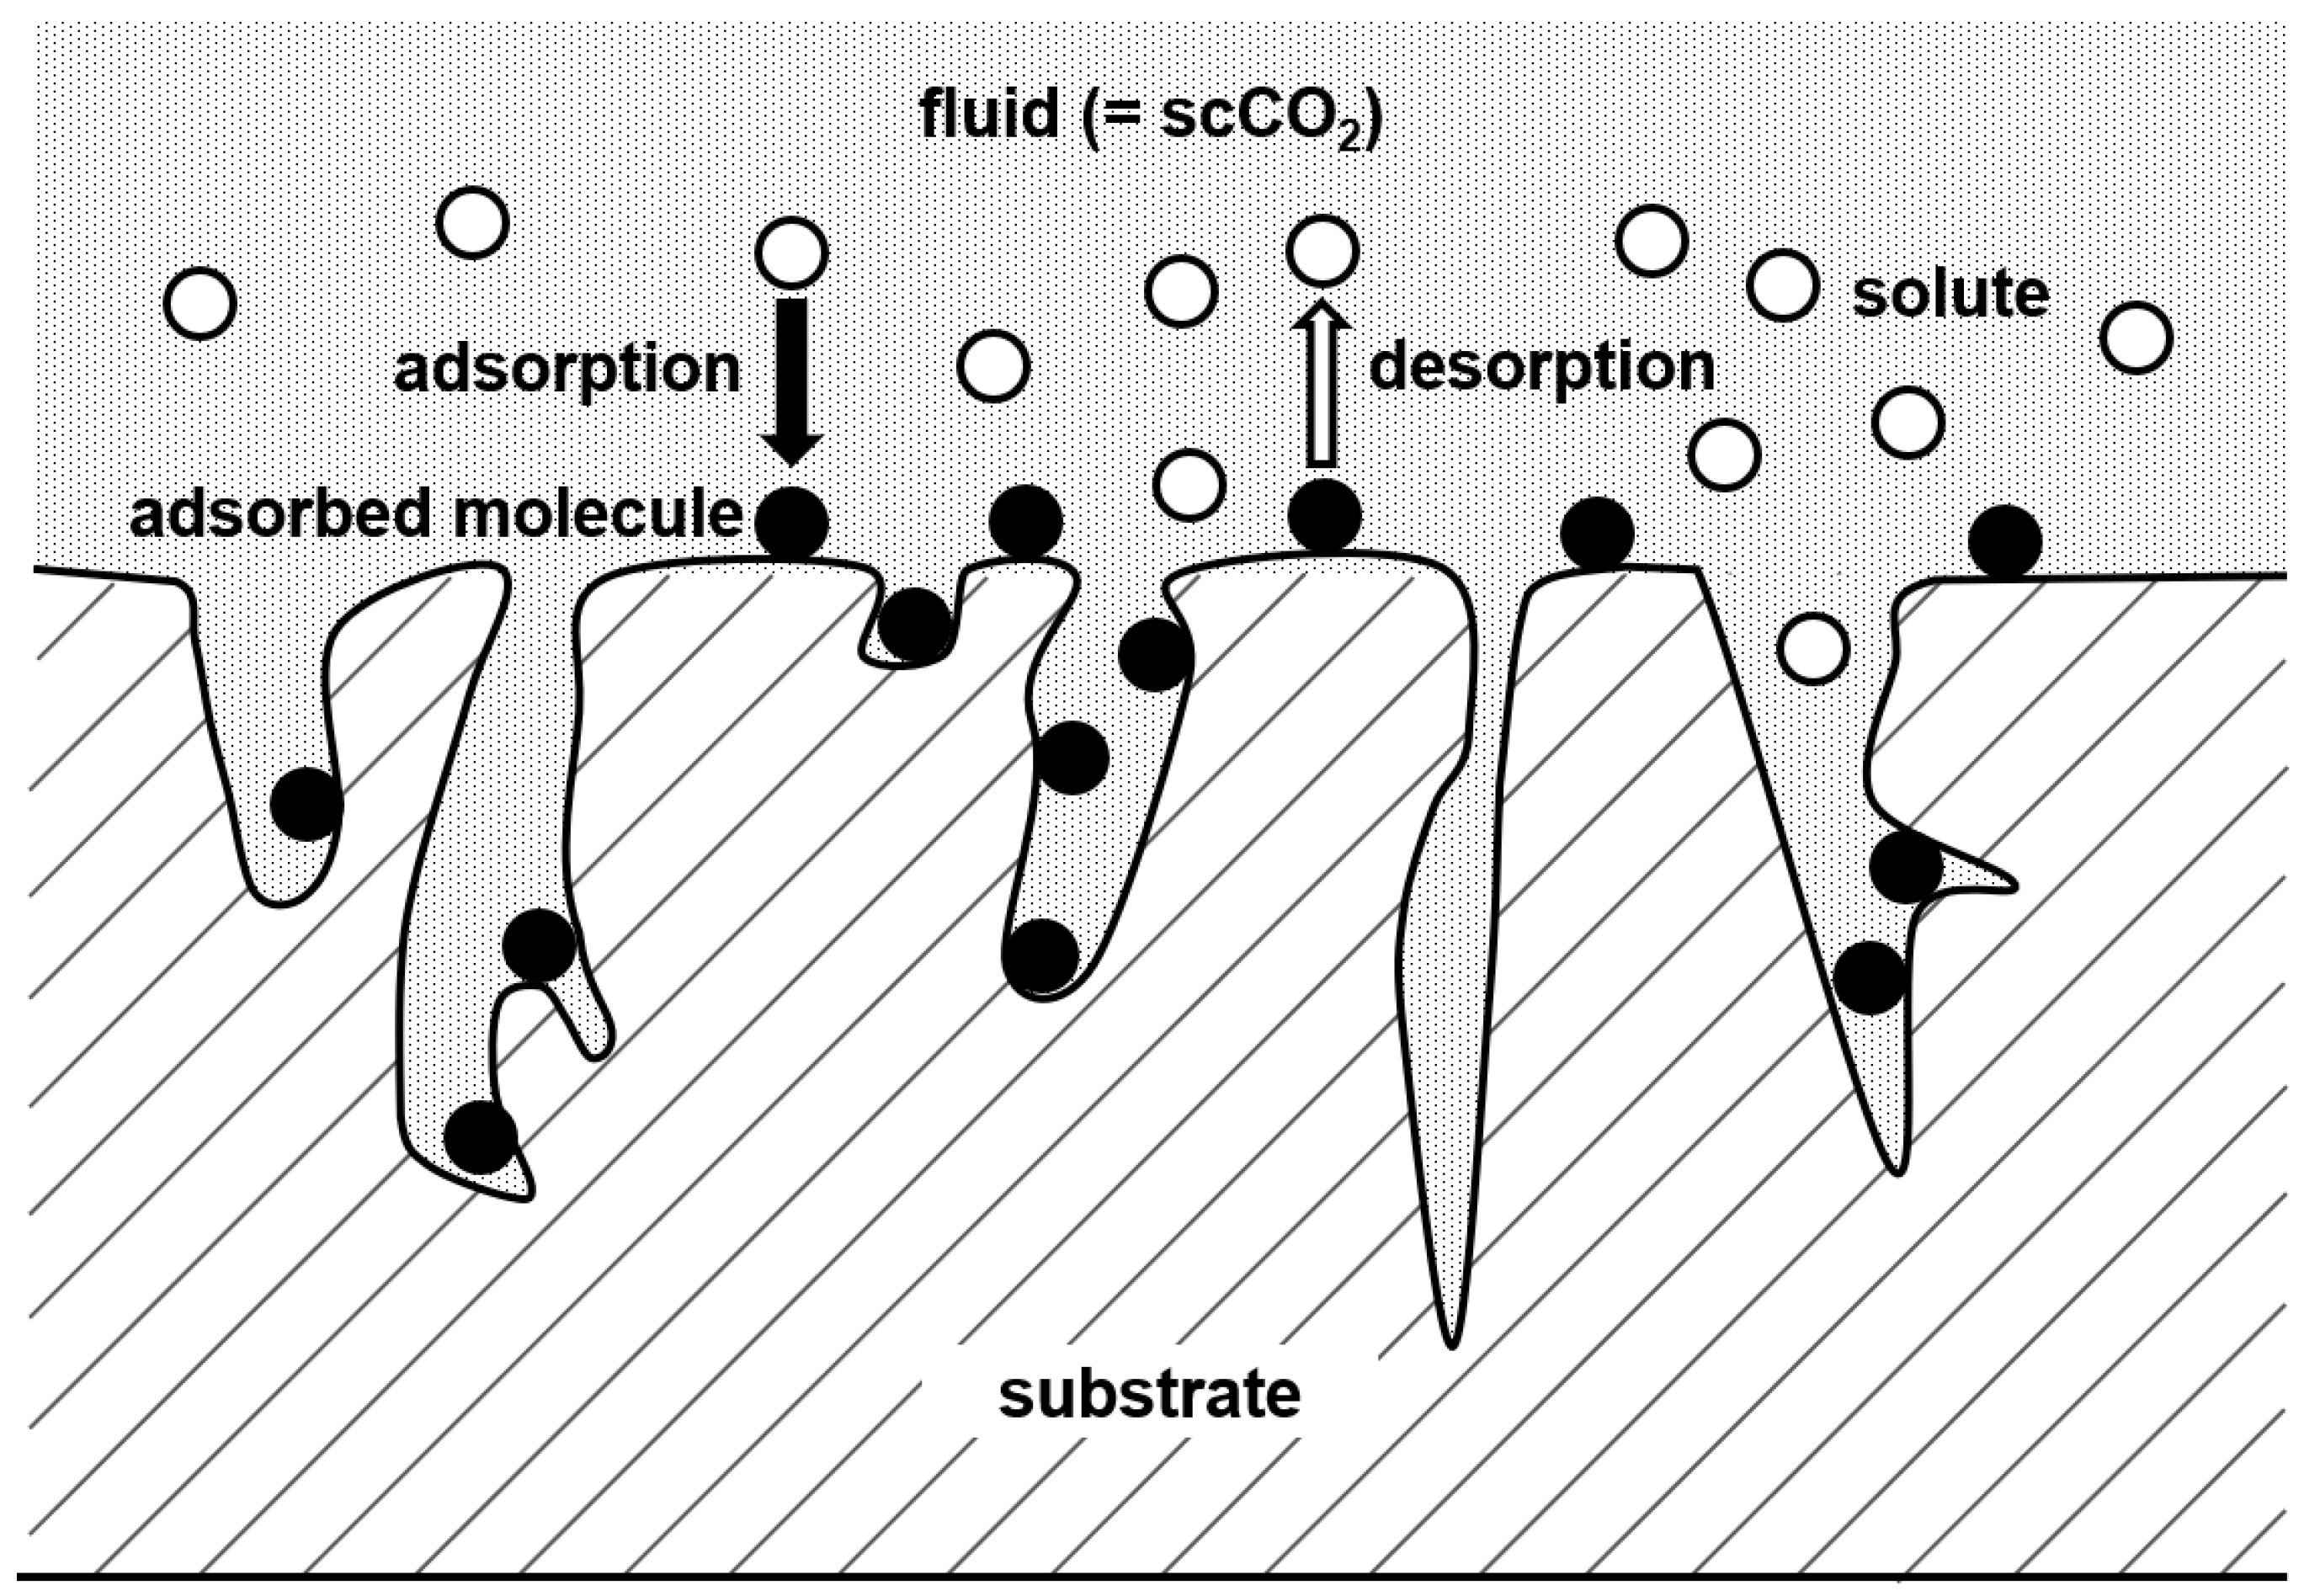
According to Brunner and Johannsen, adsorption is a process in which atoms, molecules, or ions from a fluid phase attach themselves to the surface of a second phase [11]. In the case of fluid/substrate systems, adsorption takes place in the vicinity of the solid surface and inside the porous structure. The interaction forces between the solid surface and the solute in the fluid phase determine the adsorption equilibrium of molecules from the fluid phase. Thus, adsorption as a phenomenon can be described as phase equilibrium between the solute in the fluid phase and the solid surface, i.e., the substrate and the adsorbed molecules (cf. Figure 2). Thus, the adsorption of precursors from the SCF phase to the porous substrate can be summarized in four consecutive steps:

Figure 2.
Adsorption at the surface of a substrate.
- Mass transfer of precursor from bulk SCF phase to the surface of the substrate.
- Diffusion into the pores.
- Adsorption onto the substrate’s surface in the pores.
- Surface diffusion.
As described below, adsorption can be either physical (physisorption) or chemical (chemisorption).
The basic principles of the SFRD can be simplified and summarized as follows: a supercritical fluid, mainly scCO2 is used to dissolve a metal precursor, followed by molecular adsorption of the precursor onto a suitable substrate, and precursor reduction to its metal form. Due to its low critical temperature (304 K), CO2 has been used industrially in a variety of processes such as coffee and tea decaffeination and the extraction of heat-sensitive substances for more than 100 years. Furthermore, CO2 is nonflammable, nontoxic, inexpensive, and can act as a solvent, reaction medium as well as a separation medium in various SCF-based particle formation processes. A short overview of the different concepts that are currently employed in the formation of submicron particles can be found in the literature [12].
The results of a large number of experimental investigations published in the literature show that the SFRD technique enables the synthesis of highly dispersed metallic NPs and that their size is significantly influenced by the adsorption/desorption behavior [2,6]. However, until today, only a very limited number of research groups are engaged in this topic. The results of the different investigations indicate that the solubility of the precursor in the scCO2 phase is an important parameter since the extent of adsorption is a competition between the strength of the intermolecular forces between scCO2 and the precursor and the bonding forces between the precursor and the substrate surface [6].
The paper is organized as follows: first, we introduce the basic fundamentals underlying the use of adsorption processes with particular emphasis on the adsorption/desorption and solubility behavior of metal precursors in scCO2. Based on this, experimental methods for the determination of adsorption data are discussed in brief. Thereafter, different adsorption isotherm models are presented and discussed in detail. Then, the basic principles of high-pressure adsorption data for pure fluids are discussed shortly. Subsequently, experimental adsorption data for two selected precursors are correlated with the following adsorption isotherm models: Freundlich, Langmuir, Toth, and Langmuir–Freundlich equations. Based on this comparison, the most effective models are used to describe all the available experimental data. Subsequently, an overview of applicable experimental data, including the models used in this review to describe the experimental data, on the deposition of precursors on porous substrates from scCO2 is provided. Note that in the case of precursors with low solubility in CO2, the linear uptake behavior can be described with sufficient accuracy by the Henry approach. The main results are presented graphically and discussed in detail. Furthermore, the challenges that need to be overcome for an improved understanding of the relationship between process conditions, i.e., precursor concentration in CO2, pressure, temperature, and received precursor uptake, are stated. Based on a critical analysis and evaluation of the current status, strategies for overcoming the knowledge gaps for essential future research directions are suggested.
1.2. Adsorption
Adsorption is the selective transfer of certain components, named solutes, from a fluid phase or mixture to the surface of an insoluble substrate. When such a surface is exposed to a fluid phase, molecules in the fluid phase diffuse to the surface (including its pores if it is a porous substrate), where they either are held there physically by weak van der Waals intermolecular forces or chemically bond with the solid surface [7,13]. When adsorption is caused by van der Waals forces, it is referred to as physical adsorption or physisorption, whereas it is called chemical adsorption or chemisorption if a chemical bond is formed between the adsorbed molecules and the substrate. According to Ertl, traditionally one distinguishes between weak (=physisorption) and strong (=chemisorption) adsorption, whereby adsorption energy of 40 kJ·mol−1 can be considered as a rough borderline [14].
1.2.1. Physisorption
Physisorption from a pure fluid phase occurs when the intermolecular attractive forces between the substrate and the pure fluid or solute molecules are greater than those between the solute molecules themselves. Thus, the equilibrium between gas and substrate will generally not be confined to the first monolayer but may also include the formation of multilayers and finally complete condensation. For this reason, physisorption is an exothermic process and is therefore accompanied by the dissipation of heat. The change in the enthalpy of adsorption, ΔH, accompanying physical adsorption is given by
Since an adsorption process occurs spontaneously, the change in Gibbs free energy, ΔG, is negative for a given temperature T. The entropy change ΔS is necessarily negative since the adsorbed state is more ordered than the un-adsorbed (free) state due to a loss of at least one degree of freedom. Thus, from Equation (1), we infer that the change in ΔH is always negative, i.e., exothermic for physical adsorption. Therefore, an increase in adsorption temperature results in a decrease in uptake. It is important to note that adsorption above the critical temperature of a fluid is characterized as supercritical adsorption. This means that for gases above the critical temperature, adsorption is confined to a monolayer since condensation of a second layer on the adsorbed layer is not possible [4]. In opposition thereto, multilayer adsorption may occur at subcritical temperatures.
1.2.2. Chemisorption
In chemisorption, the intermolecular forces involved lead to the formation of chemical bonds. Thus, chemisorption involves the transfer of electrons between the adsorbed molecules and the substrate. Because chemisorption occurs through the chemical bonding of the adsorbed molecules with the surface of the substrate, it often occurs at temperatures above the critical temperature of the adsorbed molecules. As with most chemical reactions, chemical adsorption requires activation energy. Additionally, the chemisorbed species are more localized on the surface compared to physisorption, and the movement of adsorbed molecules at the surface is more restricted.
1.3. Solubility of Solids in SCF
Solubility is the most important parameter which influences the effectiveness of most of the supercritical fluid processes since solubility can have a direct influence on the rate, yield, design, and economy of the process. Depending on the process of interest, either a high solubility or extremely low solubility may be desired. For example, in supercritical extraction processes, a high solubility is required while a low solubility is requested for CO2/organic solvent mixtures used in the supercritical antisolvent precipitation processes. In such particle formation, i.e., precipitation processes, the nucleation rate depends on the square of solubility and is also a strong function of supersaturation, which in addition depends on the solubility [12]. With regard to the SFRD process, an insufficient solubility of the precursor limits the practical applicability. In addition, as discussed later in detail, solubility affects the uptake in adsorption processes and the size of the synthesized particles.
CO2 is a nonpolar molecule, with a small polarity due to the presence of a quadrupole moment. Thus, for a deeper understanding of the solubility behavior of a precursor in scCO2, one must consider that scCO2 has solvent properties similar to n-hexane [3]. This means that if a solid substance shows a high solubility in n-hexane, it will probably also have a high solubility in scCO2 and vice versa. Therefore, molecules with strongly polar groups (e.g., –COOH) are less soluble in scCO2.
Fluorinated compounds are an exception because they show a significantly higher scCO2 solubility compared with their nonfluorinated counterpart. Laintz et al. show that the solubility of copper and nickel precursors in pure scCO2, due to the addition of fluorine to the ligand, can be increased by almost three orders of magnitude [15]. Furthermore, the solubility of precursors such as Co(acac)3 in scCO2 can be improved through the addition of small amounts of entrainers or co-solvents such as alcohols (e.g., acetone, methanol, or ethanol) or organic solvents. However, in this case, caution must be taken during the measurement and analysis of the results of adsorption experiments since adsorption thermodynamics becomes quite complicated due to the addition of one more component [5]. As a rule, it should be ensured that the experiments are performed in the homogeneous fluid phase because the presence of a CO2-rich or a liquid organic-rich phase would cause partitioning of the solute and affect the experimental data [16].
One of the most commonly used models, which correlates the solubility of a solid in an SCF to the density of the pure solvent, has been proposed by Stahl et al. and by Kumar and Johnston [17,18]:
In Equation (2), y2 (mol·mol−1) is the solubility equilibrium of the solute (i.e., the dissolved solid), 𝜌1 (mol·dm−3) is the pure SCF density, a (mol·mol−1) and b (dm3·mol−1) are constants which are characteristic for the specific binary system and vary with temperature. This model establishes a linear relationship between the natural logarithms of solubility and solvent density. For example, at a given temperature the solubility increases with density and vice versa. In addition, for a given density, the solubility increases with temperature. However, it must be taken into account that this approach is only strictly valid in the range of 0.3 < (𝜌1/𝜌c,1) < 2 and depends on the specific binary system; thus, 𝜌c,1 is the critical density of the pure solvent.
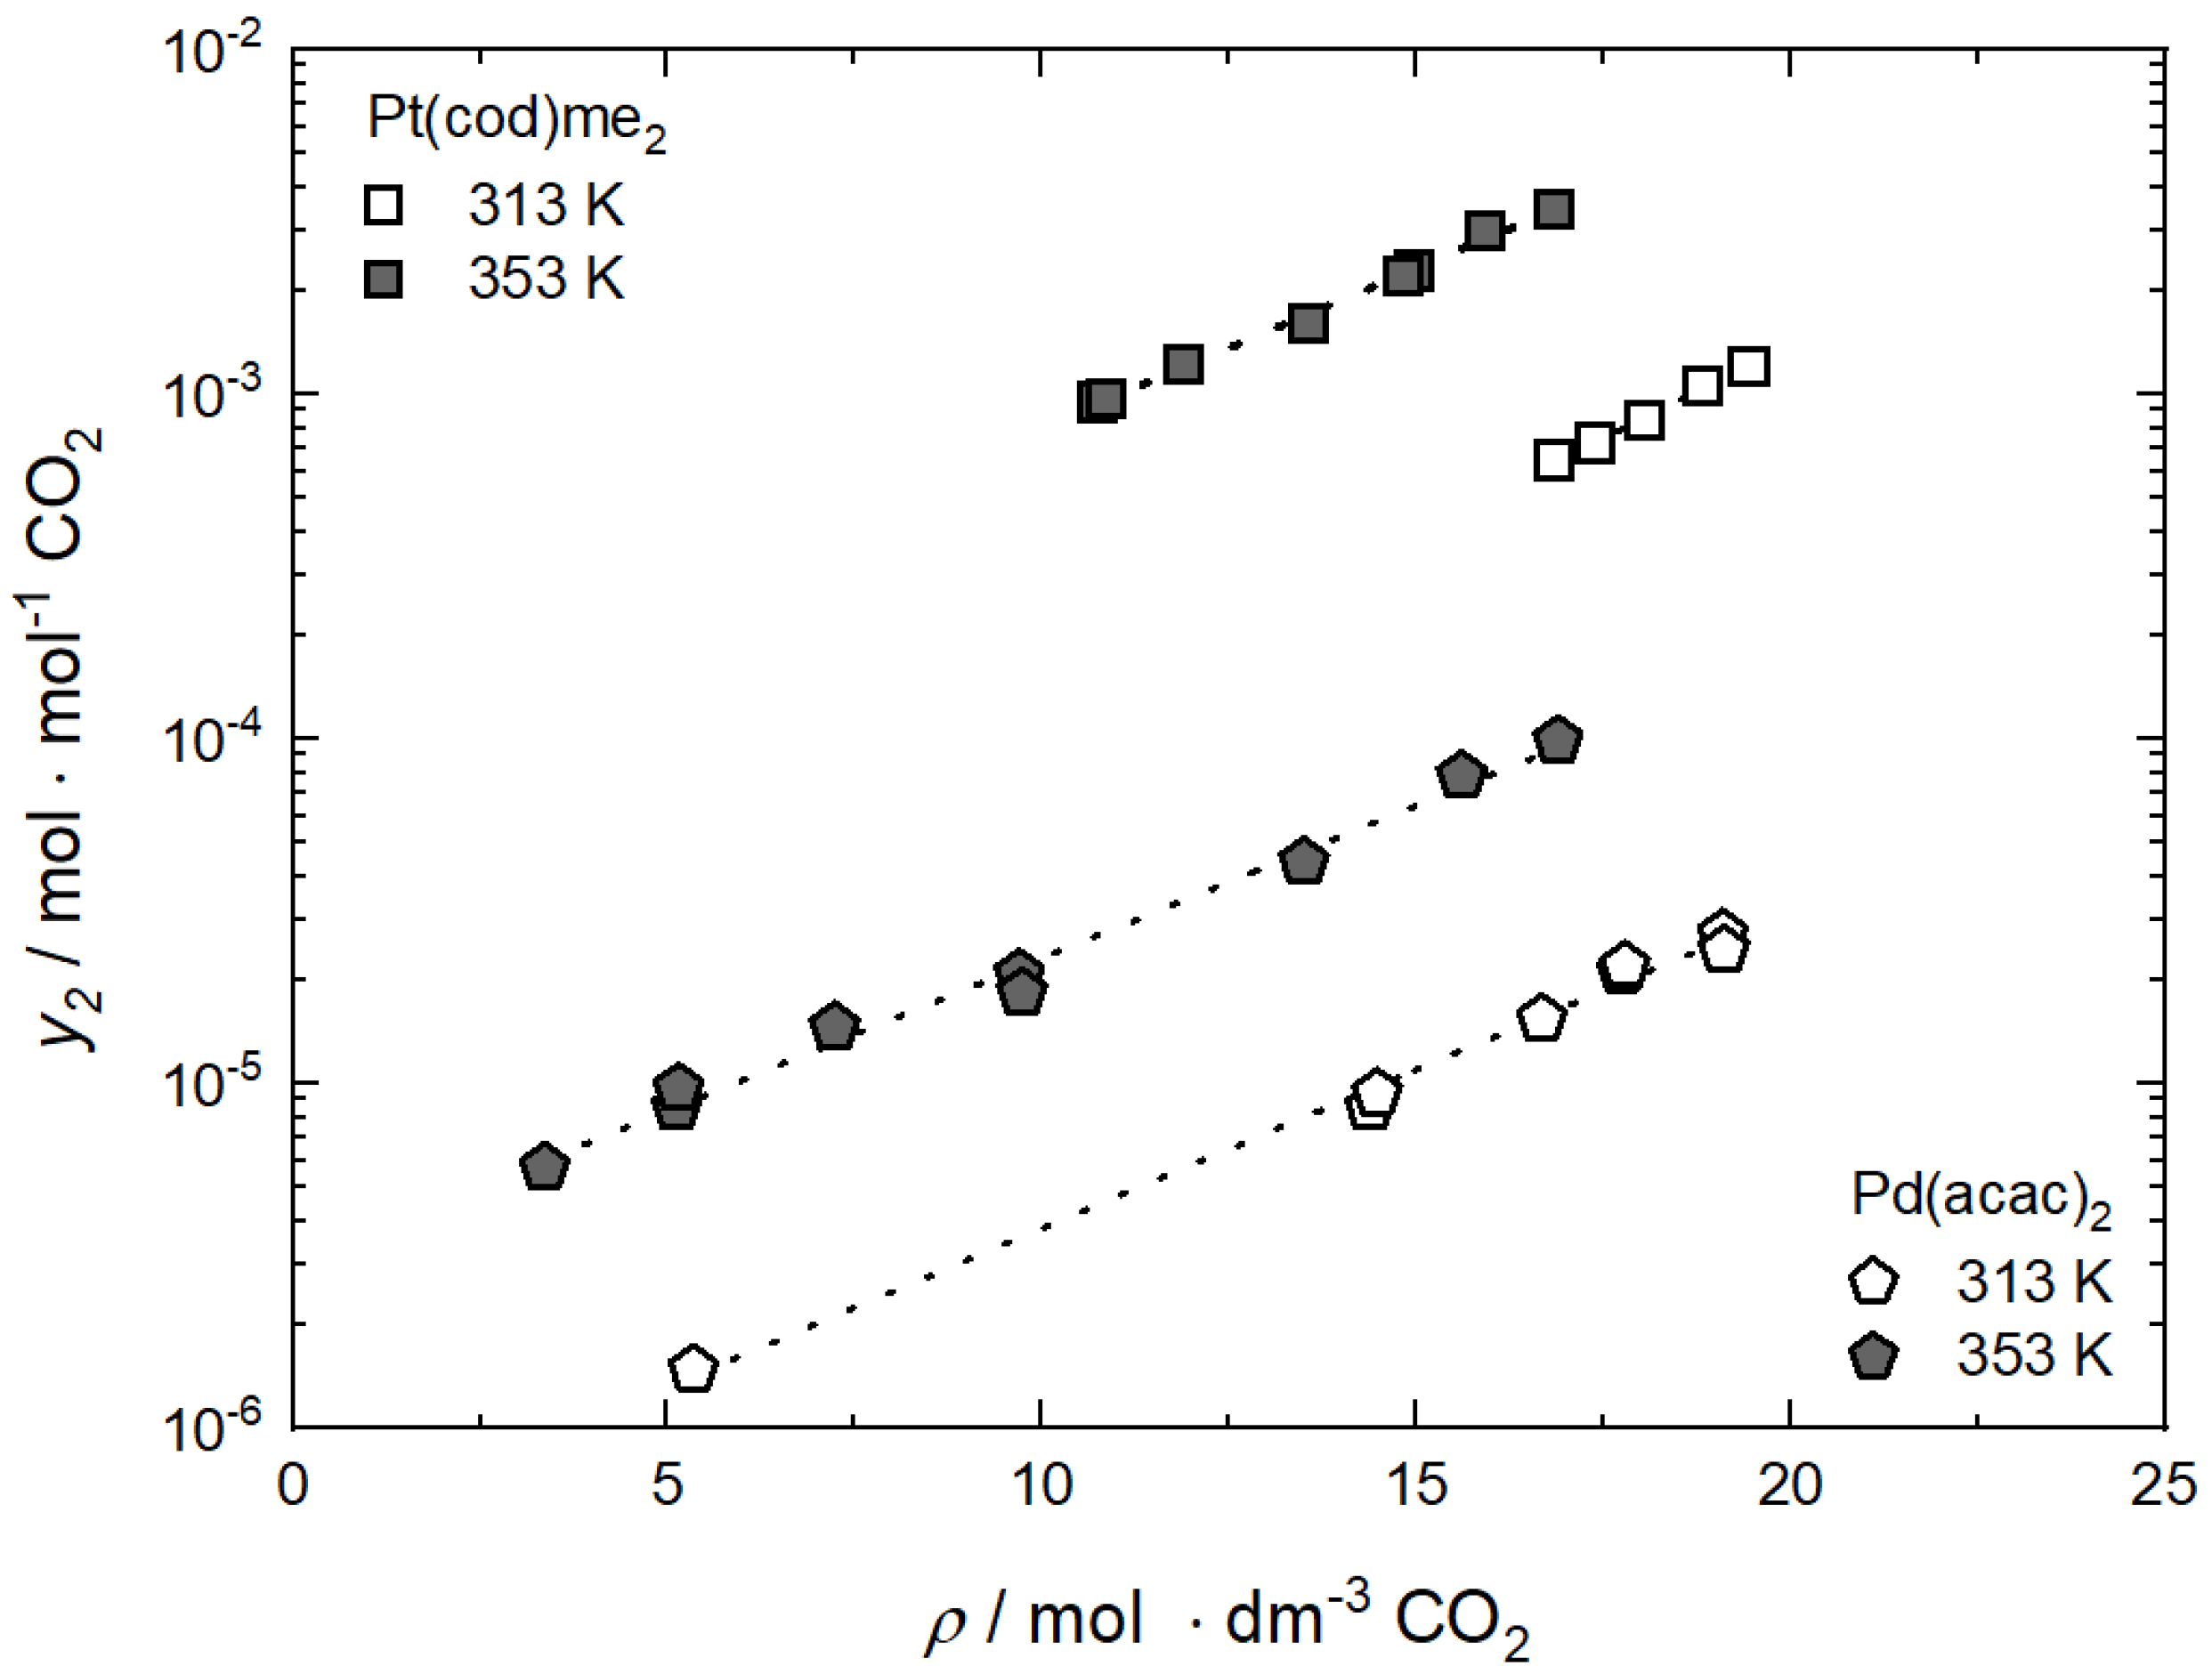
For illustration purposes, the influence of temperature and solvent’s density on the solubility of the two precursors Pt(cod)me2 and Pd(acac)2 in scCO2 is depicted in Figure 3 [19,20]. It is obvious that the solubility of Pt(cod)me2 in scCO2 is substantially higher than that of Pd(acac)2. At 353 K and a density of 17 mol·dm−3 the solubility of Pt(cod)me2 in scCO2 (3.43·10−3 mol·mol−1) is by a factor of 44 higher than for Pd(acac)2 in CO2. The experimental data show trends which are similar to those observed for a large number of solutes in the supercritical region. The lines depicted in Figure 3 confirm the linear relationship between the logarithmic solubility and the solvent’s density for both temperatures. Obviously, at a constant temperature, the solubility of the solute increases almost linearly with the solvent’s density, and hence its ability to dissolve solids. Figure 3 also shows the pronounced temperature effect on the solubility; the solubility increases with temperature at a constant density, indicating the endothermic dissolving of a pure solid into the SCF.

Figure 3.
Solubility y2 of Pt(cod)me2 and Pd(acac)2 in CO2 versus density 𝜌 of CO2 at 313 K and 353 K; experimental data taken from [19,20]. The dashed lines represent the correlation using Equation (2).
Such a result can be explained by the phase behavior of dilute solutions of nonvolatile solutes in supercritical solvents after the initial solubility decrease follows a sharp isothermal increase in solubility that is slightly above the solvent’s critical pressure (7.4 MPa in case of CO2). This is followed by the so-called retrograde region, where an isobaric increase in temperature results in a decrease in solubility and finally the attainment of a solubility plateau at high pressure.
The retrograde region is bordered by the lower (pl) and upper (pu) “crossover pressure”. Mathematically, the criterion for the crossover pressure is given by Equation (3):
At pressures below pl and above pu, the solubility increases with temperature, i.e., (𝜕y2/𝜕T)p > 0 in accordance with the solids’ sublimation pressure. In opposition thereto at pressures between pl and pu, the solubility decreases with increasing temperature, i.e., (𝜕y2/𝜕T)p < 0) which is caused by the rapid decrease in solvent density. Thus, at pl and pu the reverse effects of solids sublimation pressure and solvent density on solid solubility balance each other. In other words, the crossover pressure can be defined as the pressure where the slope of the plot of solubility vs. temperature at constant pressure changes its sign.
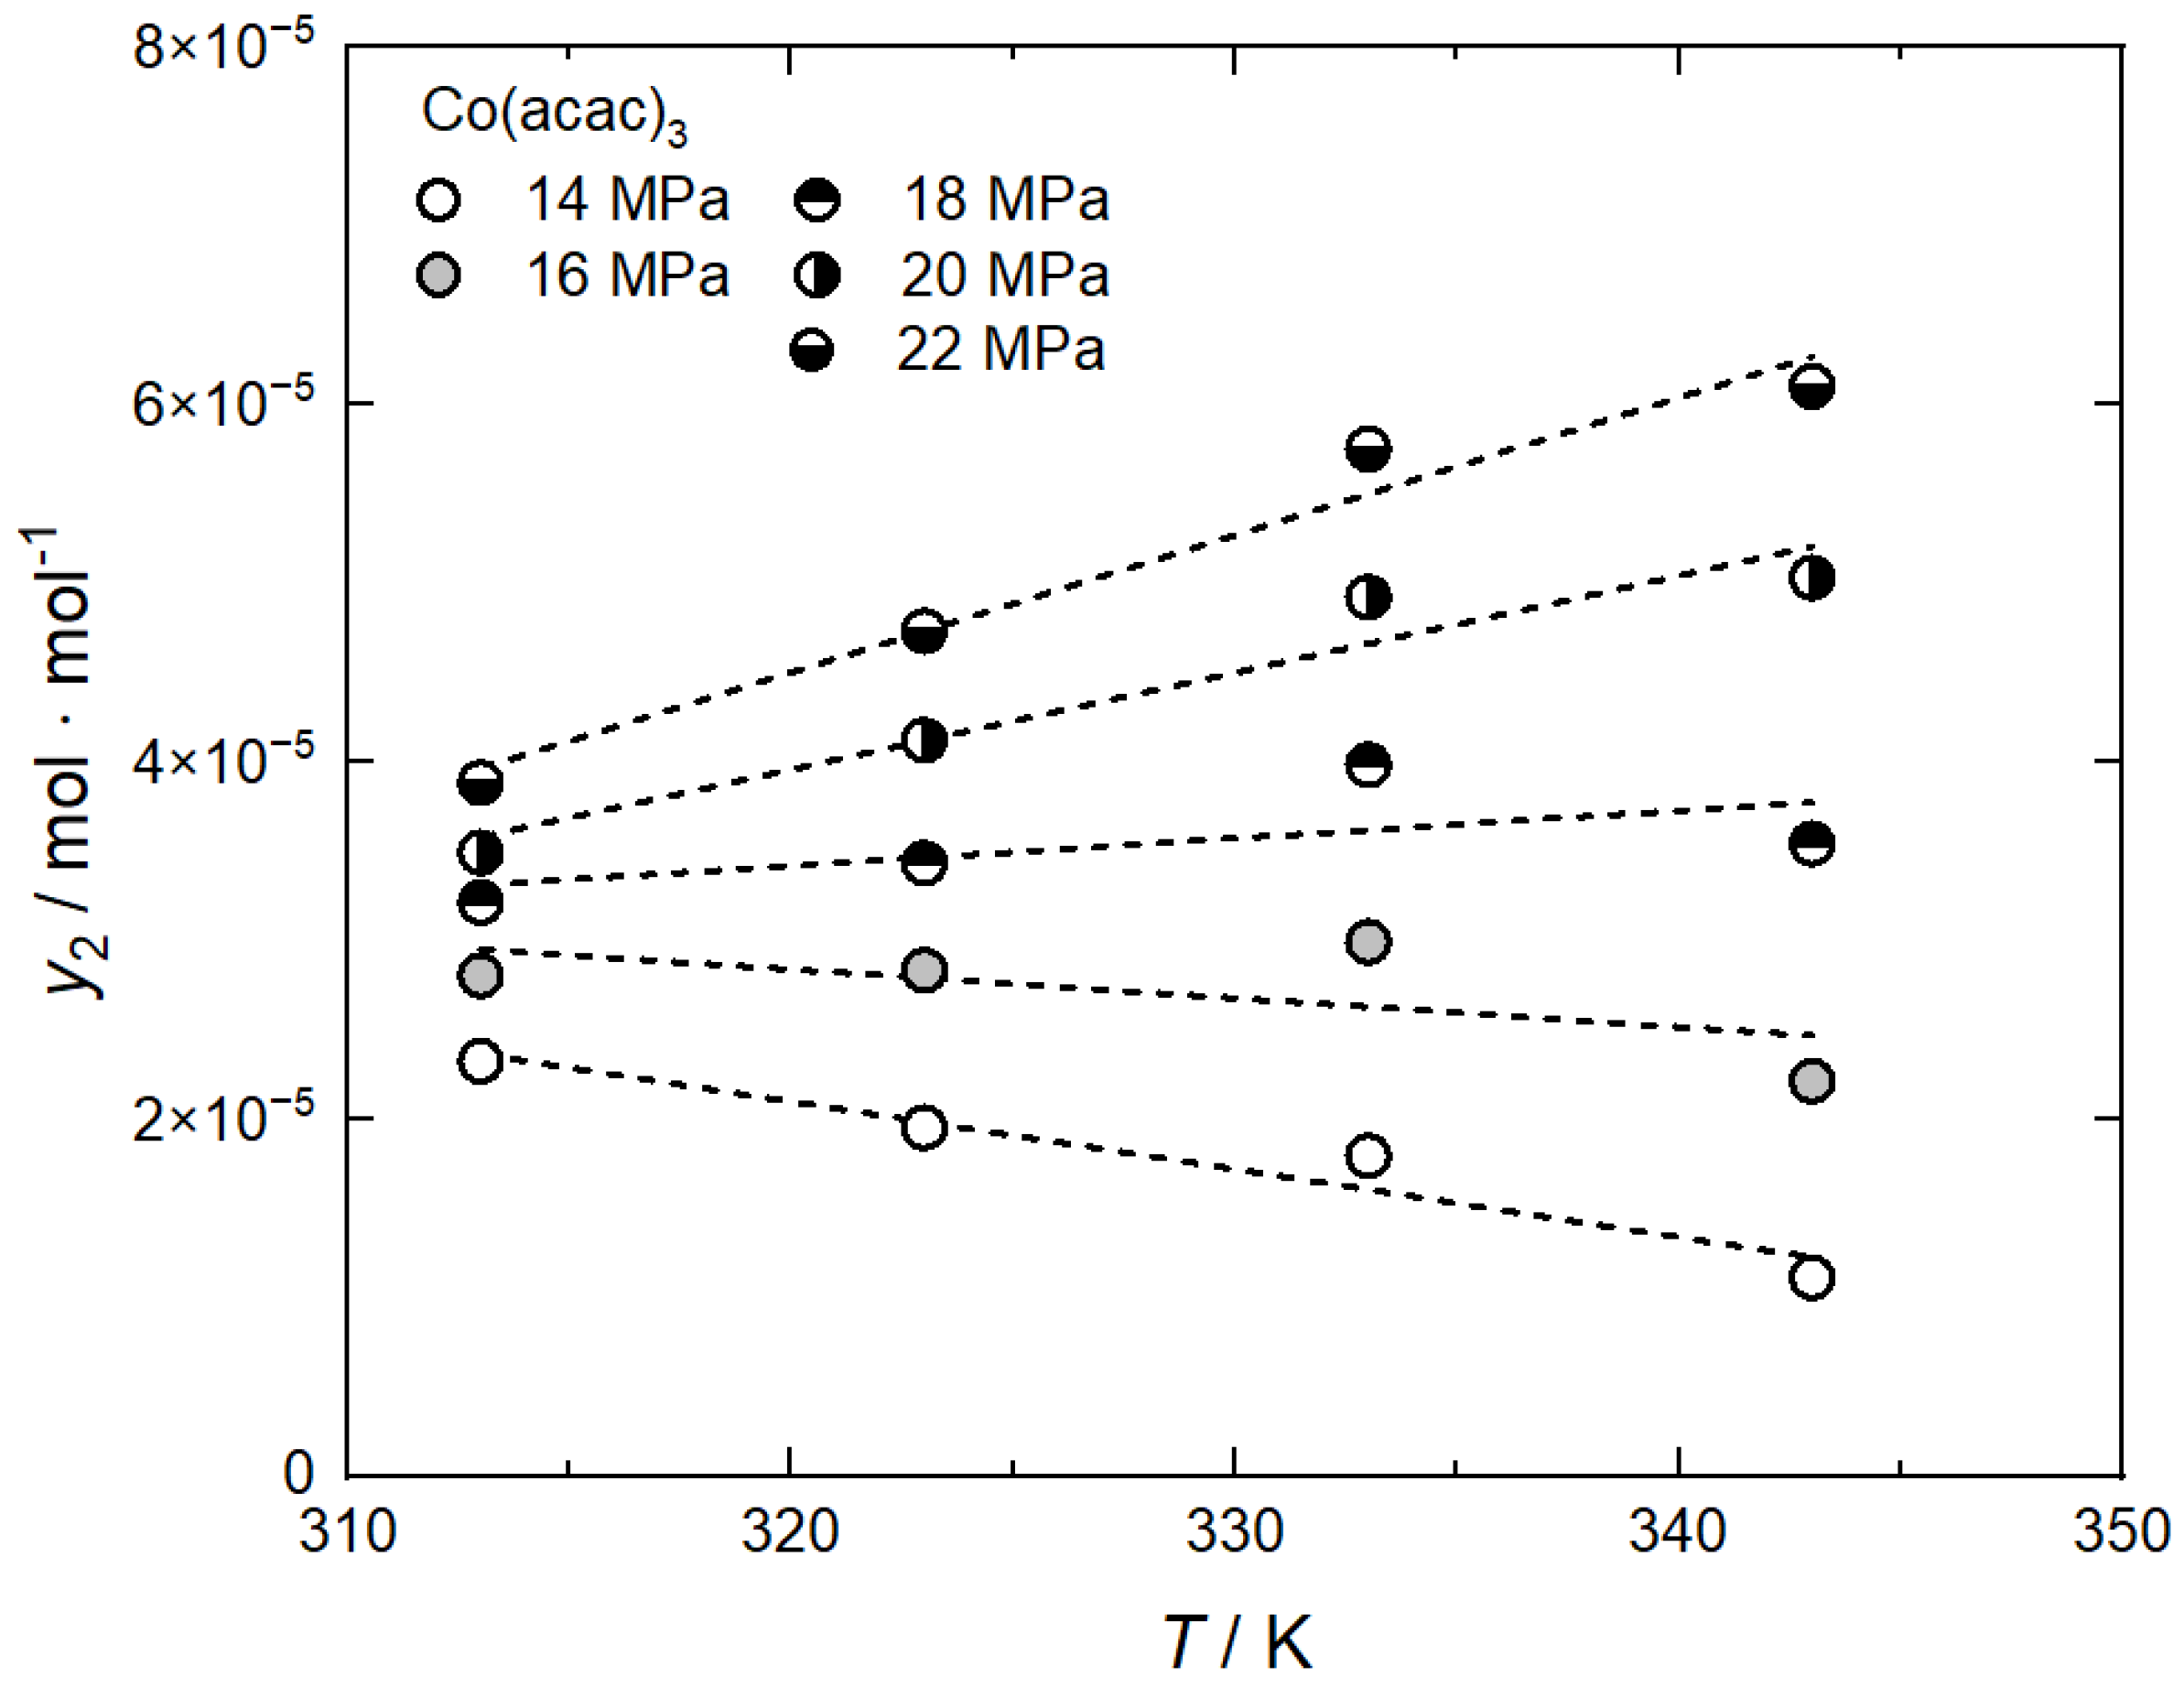
Literature data for the system CO2/Co(acac)3 show that at pressures of 14 MPa and 16 MPa, the solubility of Co(acac)3 in CO2 decreases with increasing temperature. At higher pressures of 18, 20, and 22 MPa the opposite behavior is observed as a consequence of the retrograde behavior (Haruki et al. [21]). This behavior is illustrated in Figure 4, which shows that, in the case of this system, the crossover pressure was found to be around 17 MPa. Thus, if adsorption experiments are performed at pressures below 17 MPa, one will expect that the uptake should increase when the temperature increases, i.e., endothermic adsorption behavior will occur. Similar behavior is observed for the solubility of Ru(acac)3 in scCO2. For this system, the crossover pressure is shifted to a higher pressure in the range between 18 MPa and 20 MPa (Yoda et al. [22], Caputo et al. [23]).

Figure 4.
Solubility behavior of Co(acac)3 in scCO2; experimental data taken from [21]; the dashed lines are a guide for the eye.
The molecular mechanisms which underlie the phase behavior depicted in Figure 3 and Figure 4 have been the focus of much recent and ongoing research. The topic is beyond the scope of this review; therefore, more details about the different concepts used for the description of the solubility of solids in SCFs and experimental solubility data can be found in various, partly extensive, articles [24,25,26,27,28,29,30,31,32,33].
2. Adsorption Isotherms
The equilibrium between a gas and a solid surface can be described by the function Φ (p,T), where Φ is the uptake or amount adsorbed (mol gas·g−1 solid), p is the pressure, and T is the temperature. Such a gas-solid equilibrium is strongly affected by the interactions of the gas molecules with the solid surface and by the interactions between the adsorbed gas molecules [14,34]. Usually, Φ is measured at a constant temperature so that a plot of Φ versus p at constant temperature provides the adsorption isotherm for pure gas. In the case of gas mixtures, p is generally replaced by the partial pressures of the single compounds in the gas phase. For liquid or supercritical fluid systems, p is replaced by the concentration of the solute in the liquid or supercritical fluid phase.
The influence of the temperature on the amount adsorbed can be explained by the principle of Le Chatelier. As discussed above in Section 1.2.1, physisorption is analogous to condensation and is, therefore, accompanied by the dissipation of heat, and thus it is an exothermic process.
2.1. Experimental Methods for the Determination of Adsorption Isotherms
As described in numerous publications in detail, adsorption isotherms can be measured by using the following different techniques:
- Batch adsorption.
- Frontal or pulse analysis chromatography.
In the case of the batch technique, a certain amount of substrate is contacted with a supercritical fluid solution containing the dissolved precursor of interest in a high-pressure vessel. The precursor diffuses into the pores and adsorb on the surface of the substrate. After a certain period, the system reaches the adsorption equilibrium where the concentration of the precursor in the fluid phase does not change over time anymore. Measurement of the uptake of the substrate and the fluid phase concentration at equilibrium gives a single point on the adsorption isotherm. Carrying out experiments with different starting concentrations of the precursor enables the creation of the whole adsorption isotherm.
In the case of the frontal or pulse analysis chromatography technique, a stepwise change in the concentration of the solute is imposed at the inlet of the adsorbed bed. The response of this bed to the stepwise change is monitored to obtain a so-called “breakthrough curve”. The analysis of these breakthrough curves enables the construction of the adsorption isotherm. More details about these techniques can be found in the literature, e.g., [7]. This is a shortened and slightly modified version of chapter 6.5.1 in Ref. [7]. Copyright © 2021 Elsevier B.V. All rights reserved.
2.2. Adsorption Isotherm Models
The need to correlate adsorption data using an analytical isotherm equation arises in many technical applications such as exhaust gas cleaning, extraction, or wastewater treatment. Therefore, a large number of models have been developed to describe mathematically the various adsorption isotherms. In general, either at a constant pressure or temperature and a certain precursor concentration, the uptake is strongly influenced by the interaction forces between the solid surface and precursor molecules in the fluid phase. In all the isotherms, the precursor uptake increases with increasing precursor concentration in scCO2 either linear or nonlinear. Linear behavior is typical for precursors with a low scCO2 solubility (approximately y2 < 10−4 mol·mol−1) and can be described with sufficient accuracy by the Henry approach (cf. Equation (4)). Among the existing theoretical adsorption models, Henry, Freundlich, Langmuir, Toth, and Langmuir–Freundlich equations were selected to fit the experimental adsorption data. For reasons of simplicity, the units of the fitting parameters of the equations discussed below can be found in Tables 2, 3, 5–11 and Table A1, Table A2, Table A3, Table A4, Table A5, Table A6, Table A7, Table A8, Table A9, Table A10, Table A11, Table A12, Table A13, Table A14, Table A15, Table A16, Table A17, Table A18, Table A19, Table A20, Table A21 and Table A22.
2.2.1. Henry
The simplest form of an adsorption isotherm is a linear equation. In this case, the uptake of the substrate q (mol·kg−1) is proportional to the concentration c (mol·m−3) of the component in the fluid phase (Equation (4)) with a constant adsorption coefficient kH.
Although in most cases the adsorption isotherms will be linear only in small ranges, i.e., at sufficiently low solute concentrations, this linear approach can be used as a first approximation. For the nonlinear behavior of the adsorption equilibrium, a number of well-known equations have been developed, which are described below.
2.2.2. Freundlich
The Freundlich equation is one of the most commonly used adsorption isotherms, although a solid theoretical basis is lacking. This popular model is generally valid in the higher range of solute concentration, but the model fails in the correct description of the Henry law behavior. The Freundlich model considers, in contrast to the Langmuir model described below, the heterogeneity of the surface and can be used for multilayer adsorption. Furthermore, the Freundlich isotherm is able to describe both nonideal and reversible adsorption.
Therefore, kF is the adsorption capacity, and nF is a measure of the adsorption intensity or surface heterogeneity [35]. Note that, for nF = 1, the Freundlich equation is reduced to the Henry approach.
2.2.3. Langmuir
Another commonly used model for correlating adsorption isotherms is the Langmuir isotherm model [36]. Based on the kinetic gas theory, Langmuir developed this model in 1918 to describe the dynamic equilibrium between adsorption and desorption on homogeneous surfaces. This concept is mainly used to describe adsorption in microporous materials. The Langmuir isotherm is given by
In Equation (6), qm is the maximum adsorption capacity, and kL is the equilibrium constant which is related to the enthalpy of adsorption through the Van’t Hoff equation. Note that the qm·kL value is a measure of the relative affinity of the precursor toward the surface of the substrate. It should be noted that small qm·kL values indicate weak adsorption of the precursor onto the substrate [37].
2.2.4. Toth
The Toth equation, which is an extended Langmuir model, is used because it enables the correct description of the adsorption behavior at low and high pressures and has a simple equation form [38,39,40]. The Toth equation has three adjustable parameters and is a useful tool for describing the adsorption equilibrium on heterogeneous systems and multilayer adsorption. This equation can be represented by
where qm, kT and nT are the characteristic parameters of the Toth model, representing the maximum adsorption capacity, the equilibrium constant and surface heterogeneity, respectively. The parameter nT (0 < nT < 1) characterizes the fluid/substrate system heterogeneity. The lower the value of nT, the more heterogeneous the system. Note that for nT = 1, the Toth equation is reduced to the Langmuir equation.
2.2.5. Langmuir–Freundlich
In order to eliminate the problem of a continuous increase in the uptake with an increase in concentration in the Freundlich equation, the Langmuir–Freundlich or Sips equation was proposed [41]:
This equation has three characteristic parameters (qm, kLF, nLF) and possesses a finite saturation limit when the concentration is sufficiently high, which cannot be described by the Freundlich equation. Similar to the Toth approach, the Langmuir–Freundlich model is reduced to the Langmuir equation for nLF = 1.
It is worth noticing that until today, the temperature and density dependence of the individual parameters of different adsorption isotherms has not been established due to partly insufficient data.
3. Systems Investigated
3.1. Adsorption of Pure SCFs
High-pressure adsorption data for pure fluids provide information on the properties of the adsorbed molecules and the structure of the substrate. In recent years, high-pressure adsorption has often been applied in industrial separation, purification, and gas storage processes. Among others, one important commercial application is the adsorption of methane during natural gas storage. Another promising application of high-pressure adsorption is the effective biogas storage technology [42]. Adsorption studies in the literature have been focused mainly on technically important gases such as Ar, He, Kr, Xe, N2, O2, CO2, CH4, C2H6, and C3H8. In these studies, activated carbon was often used as a substrate [43,44].
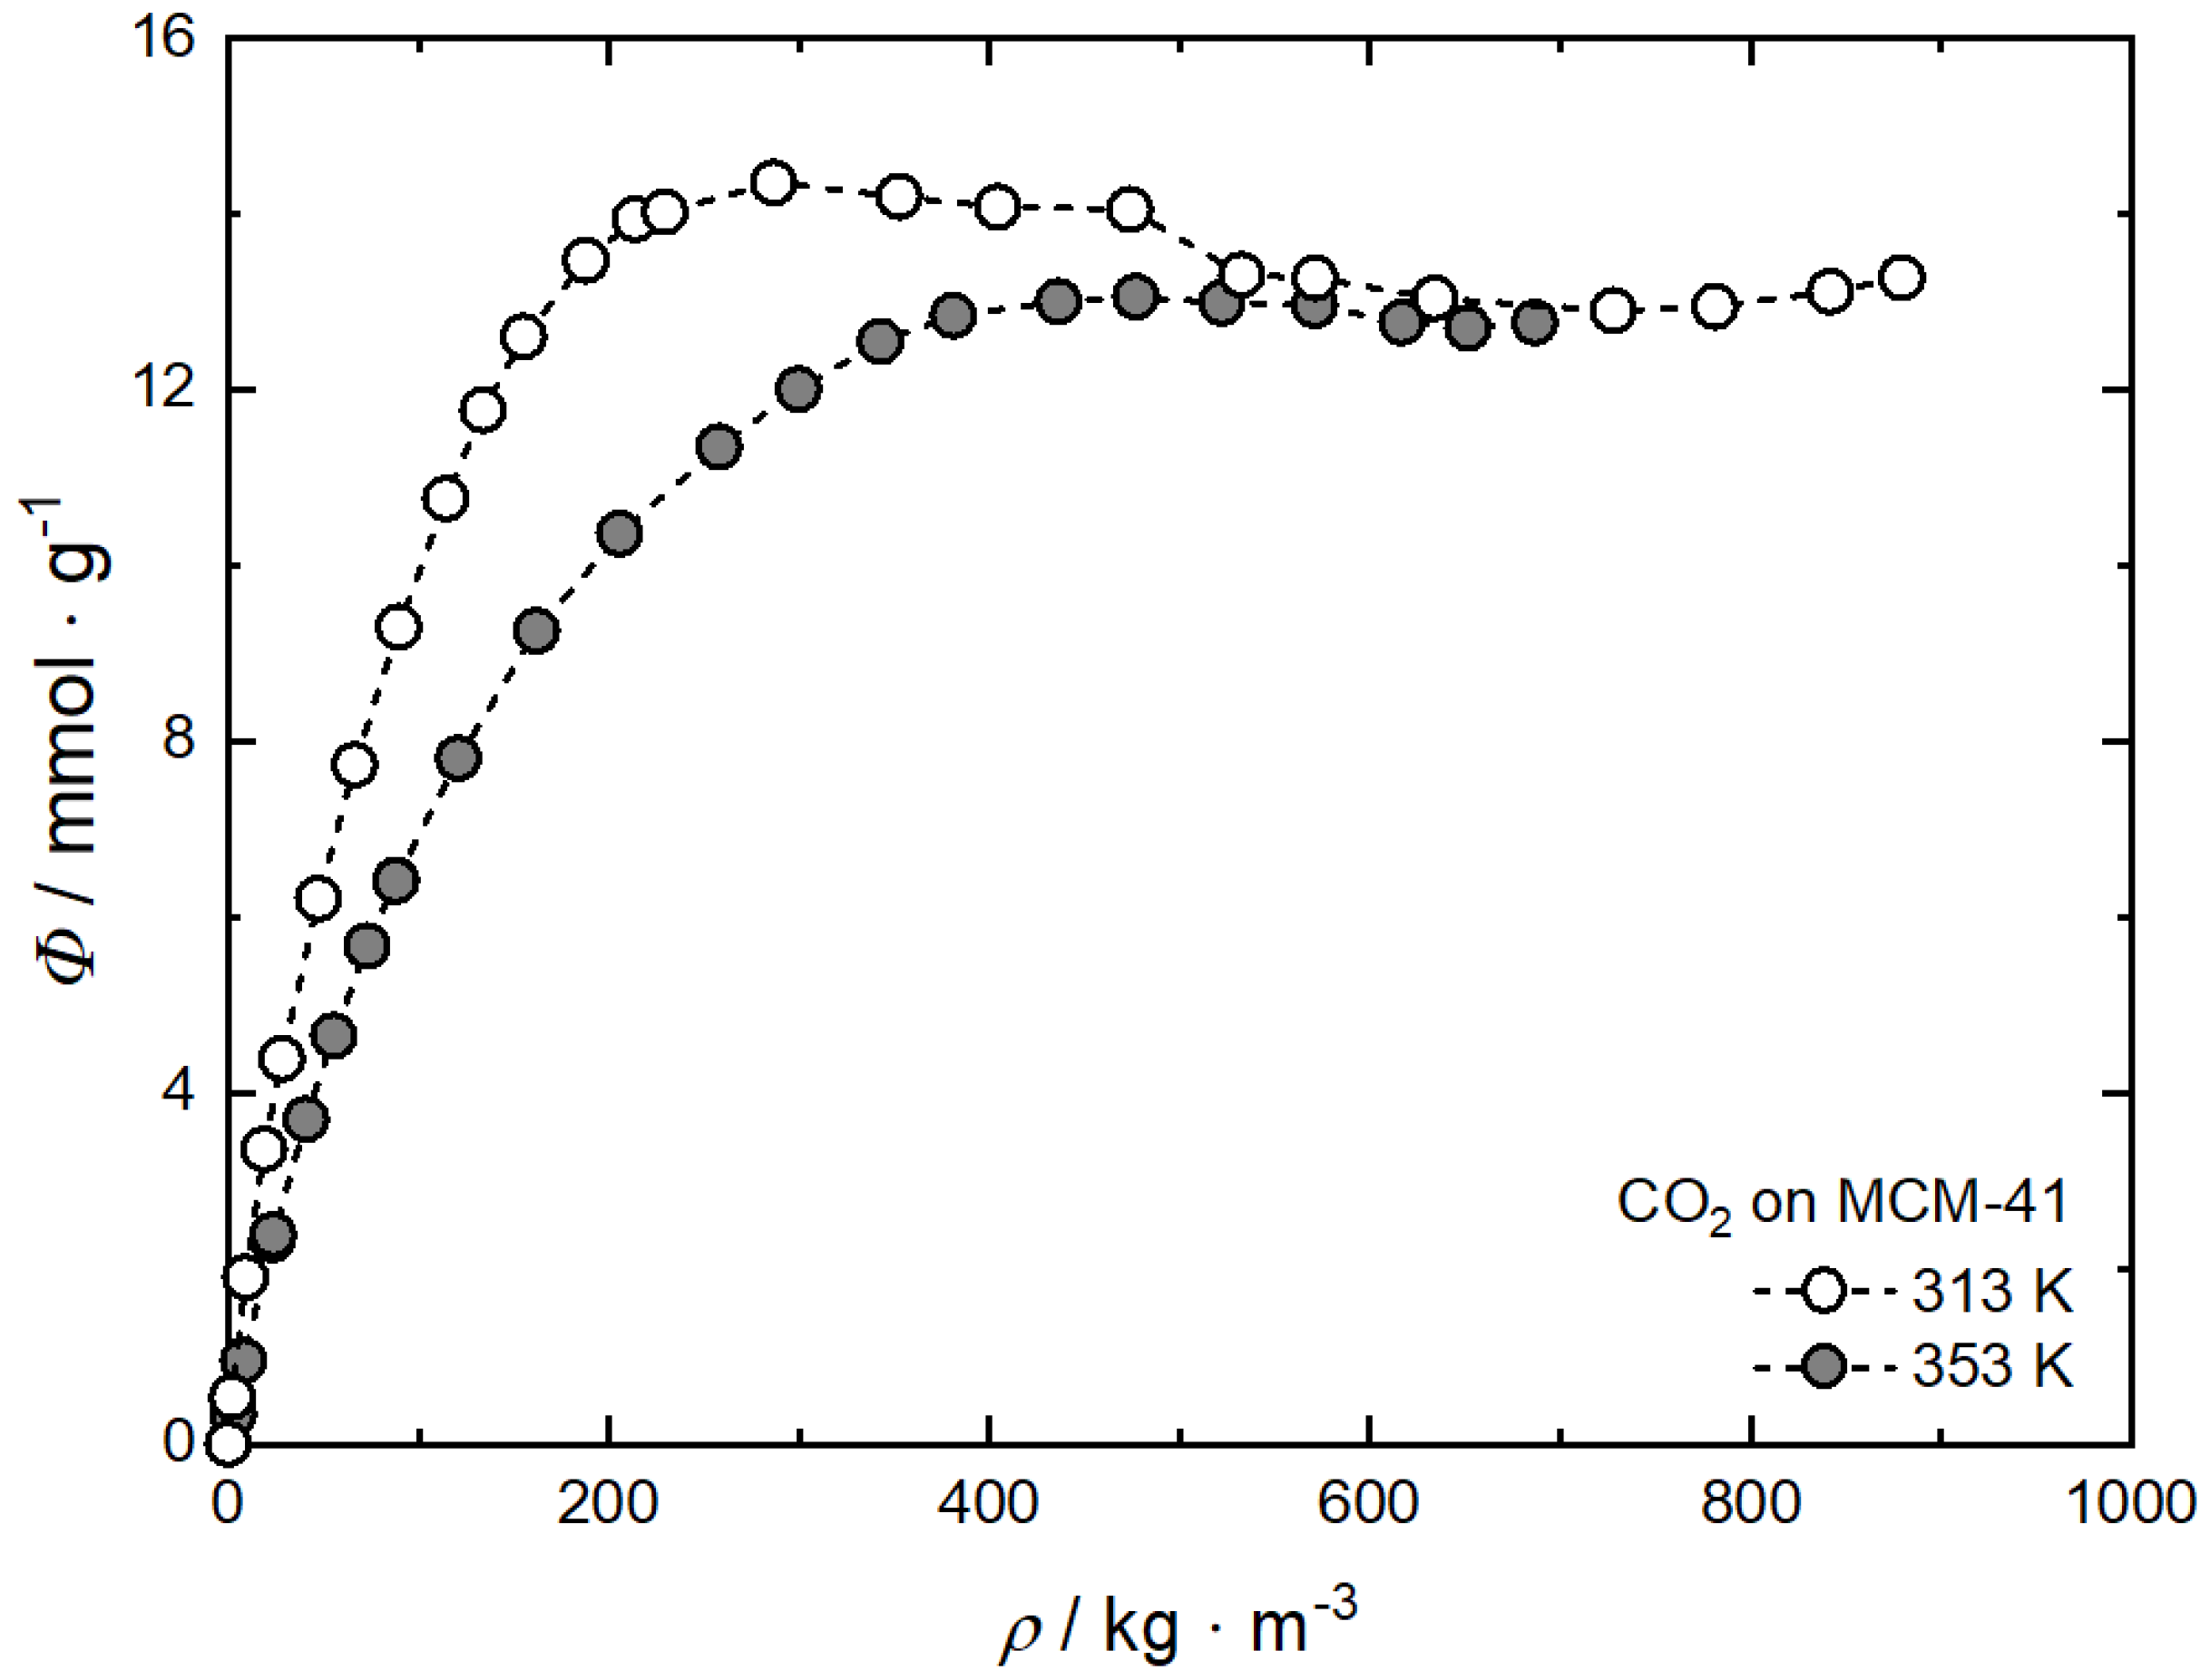
It is important to note that the adsorption of an SCF on the surface of substrates (see Figure 2) is denoted as supercritical adsorption and is different in nature from the adsorption of gases under subcritical conditions. Another important issue is that CO2 (or other gases) adsorption measurements are carried out often using gravimetric methods [34,45]. These experiments can only provide information about the excess amount adsorbed since this method is not able to measure the adsorbed volume of CO2 which cannot be neglected under supercritical conditions [5,7]. The typical shape of high-pressure excess adsorption isotherms is characterized by an increase with increasing pressure up to an uptake maximum that is followed by a decrease with increasing pressure. To determine the absolute from the excess amount adsorbed, different approaches which are discussed in detail in [46,47,48,49] can be used. The approach proposed by Menon [46] is often used to calculate the absolute amount adsorbed, nabs, from experimental determined nex data. This method is based on the fact that at supercritical temperatures and high pressures, and thus above the adsorption maximum, nex decreases linearly with increasing CO2 density. More details about the calculation method can be found in [34,45]. As a result of these calculations, Langmuir-like functions were obtained at supercritical temperatures. The influence of CO2 density on the absolute amount adsorbed, i.e., the uptake on MCM-41 is shown in Figure 5. Likewise, for reasons of clarity, only the data for 313 K and 353 K are depicted.

Figure 5.
Adsorption isotherms of CO2 on MCM-41 at 313 K and 353 K; experimental data are taken from [45], and the dashed lines are a guide for the eye.
It is obvious that the uptake increases with increasing CO2 density up to a maximum that is followed by saturation uptake which is reached at higher densities with increasing temperature [45]. Thus, the maximum of the 313 K isotherm at 287 kg·m−3 is shifted to a higher density of 473 kg·m−3 and therewith pressure at 353 K. In addition, at 313 K the maximum uptake (ca. 14.4 mmol·g−1) is slightly higher than at 353 K (ca. 13.1 mmol·g−1) while the saturation uptake (ca. 12.8 mmol·g−1) is similar for both temperatures at CO2 densities higher than 600 kg·m−3.
Furthermore, the analysis of various experimental studies shows that supercritical adsorption can produce up to two-to-five-layer adsorption over a wide range of densities [50]. Another special feature of supercritical adsorption is that the SCF cannot condense on flat surfaces. It is expected that these effects will also influence the adsorption or desorption of solutes on or from surfaces. The reason for this is increased competition for free adsorption sites and/or increased local solvent power.
3.2. Adsorption of Solutes from Supercritical Fluids
Until today, adsorption/desorption studies in the literature have been focused mainly on soil remediation, on the removal of harmful substances (such as toluene, benzene, nitroaromatic compounds, ethyl benzene, and heavy molecular weight organics), food such as coffee aroma compounds (ethylacetate, furfural, and terpenes), and model drugs (e.g., salycilic acid and benzoic acid) [4,7]. A detailed overview of adsorption isotherm data for drugs and drug-like compounds is given in the review article written by Gurikov and Smirnova [51].
Fundamental knowledge of the thermodynamics of the adsorption of solutes from supercritical fluids onto surfaces is important for a wide range of applications which involve SCFs. The deposition of thin metal films onto different surfaces and the incorporation of metallic nanoparticles into a wide range of inorganic and organic substrates for microelectronic, optical, and especially catalytic applications is a promising approach but also a complex process. An important part of such deposition processes is the diffusion and adsorption of the solute onto the surface of the substrate (cf. Figure 2). In opposition to conventional adsorption processes in which the temperature is the only significant parameter apart from solute concentration, the solute concentration in the fluid and both the temperature and the density of the supercritical fluid influence the adsorption equilibria and thus the course of the adsorption isotherm. At given process conditions, i.e., constant pressure and temperature, the adsorption isotherm data of a specific precursor/scCO2/substrate system provide an understanding of the difference in the affinities or strength of interaction between the individual precursor molecules, the precursor and the fluid and equally between the precursor as well as CO2 and the substrate. Thus, it must also be taken into account that the adsorption of precursor molecules takes place simultaneously with the adsorption of CO2 molecules; thus, two competing processes must be considered. Moreover, from an engineering point of view, such adsorption data indicate the amount of precursor and therewith metal that can be deposited on/into the substrate.
Furthermore, these experimental data should be fitted to a suitable equation which enables a sufficiently accurate description of the adsorption behavior. For a first overview, we initially used Equations (5)–(8) to fit selected experimental adsorption data by applying a nonlinear regression method. The selection criterion was that, in addition to a high number of experimental data, a system with a low (Ru(cod)(tmhd)2) and one with a high (Pt(cod)me2) precursor uptake but similar precursor solubility in scCO2 (9.22·10−4 mol·mol−1, 1.62·10−3 mol·mol−1 at 20 MPa and 353 K [19,52]) should be taken into account. The correlation parameter R2 was used to find the approach with the best fit to the experimental data and the values obtained are summarized in Table 1. Note that R2 = 1 corresponds to a perfect fit, due to unavoidable experimental errors, R2 is always less than unity. The experimental adsorption data from the literature discussed below were digitized from figures from the respective literature using the software Origin 2022b.

Table 1.
Correlation parameters R2 for selected adsorption isotherm equations.
Table 1 shows that the two-parametric Langmuir model has similar or only slightly lower correlation parameters R2 when compared to the three-parametric models according to Toth and Langmuir–Freundlich. Therefore, for further investigations, the Freundlich and the Langmuir approach were selected because they are simpler and require less experimental data than the two three-parametric models. However, if the adsorption isotherm shows a linear behavior, the Henry approach was applied.
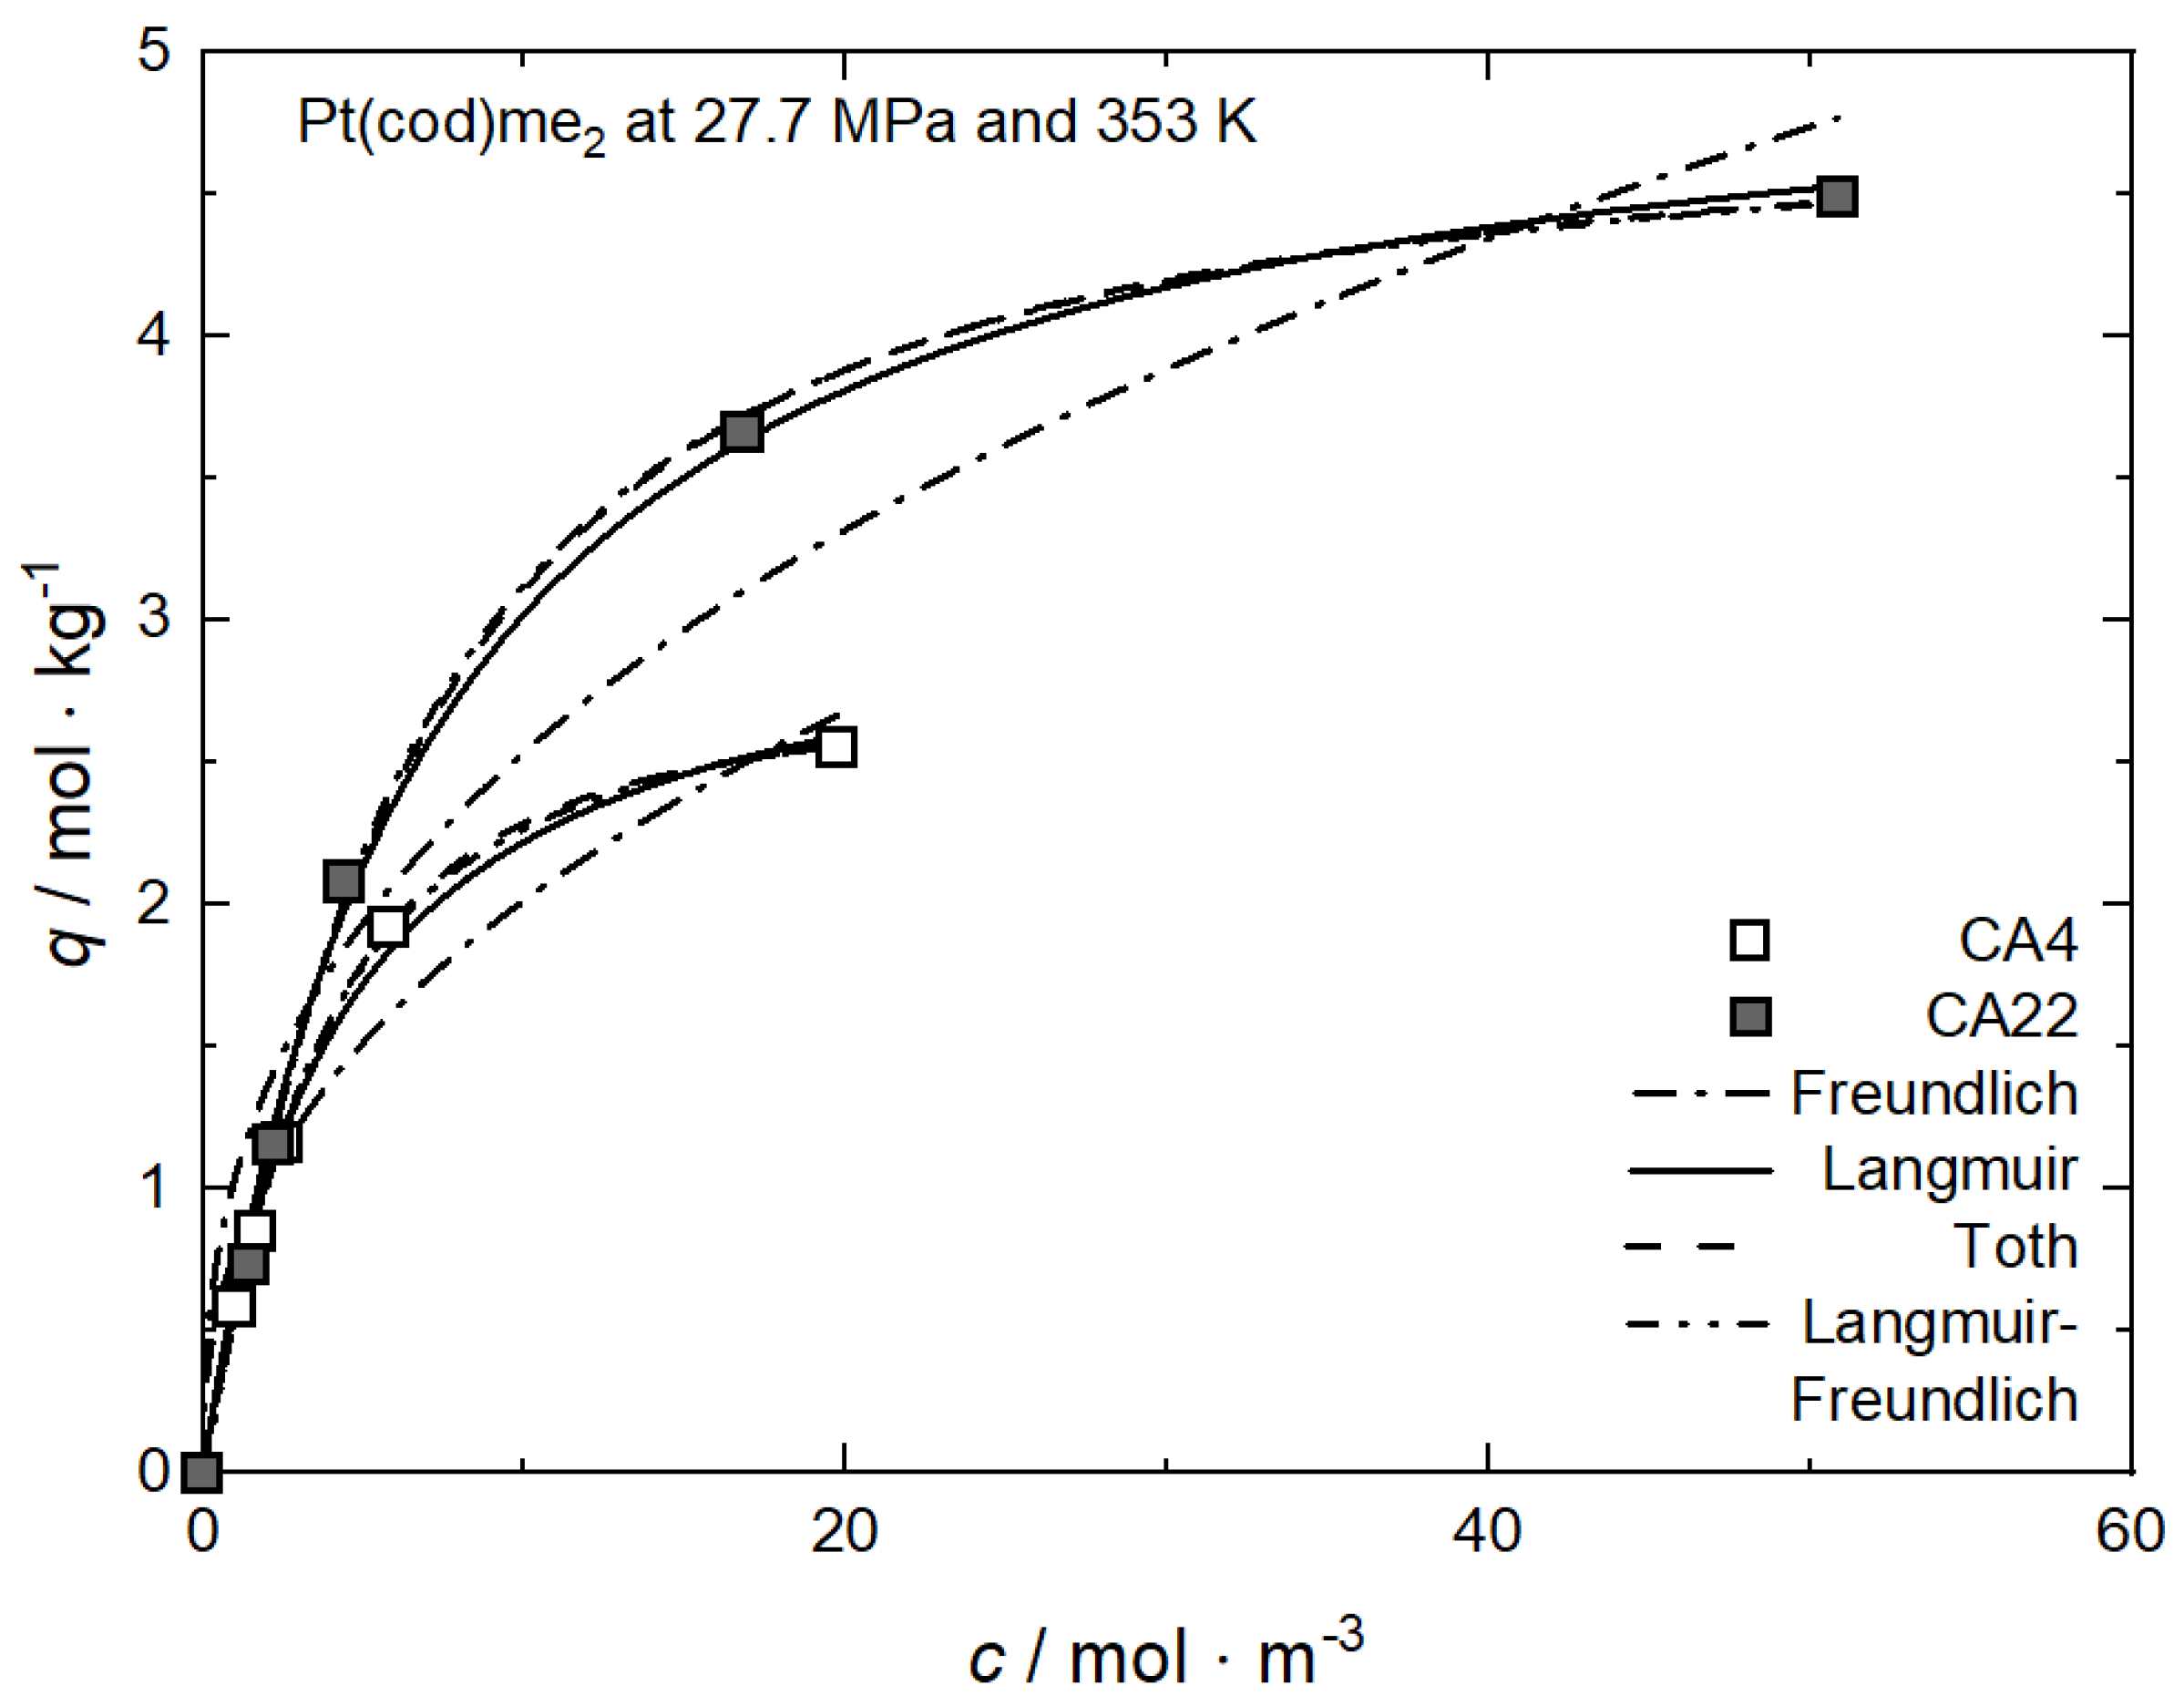
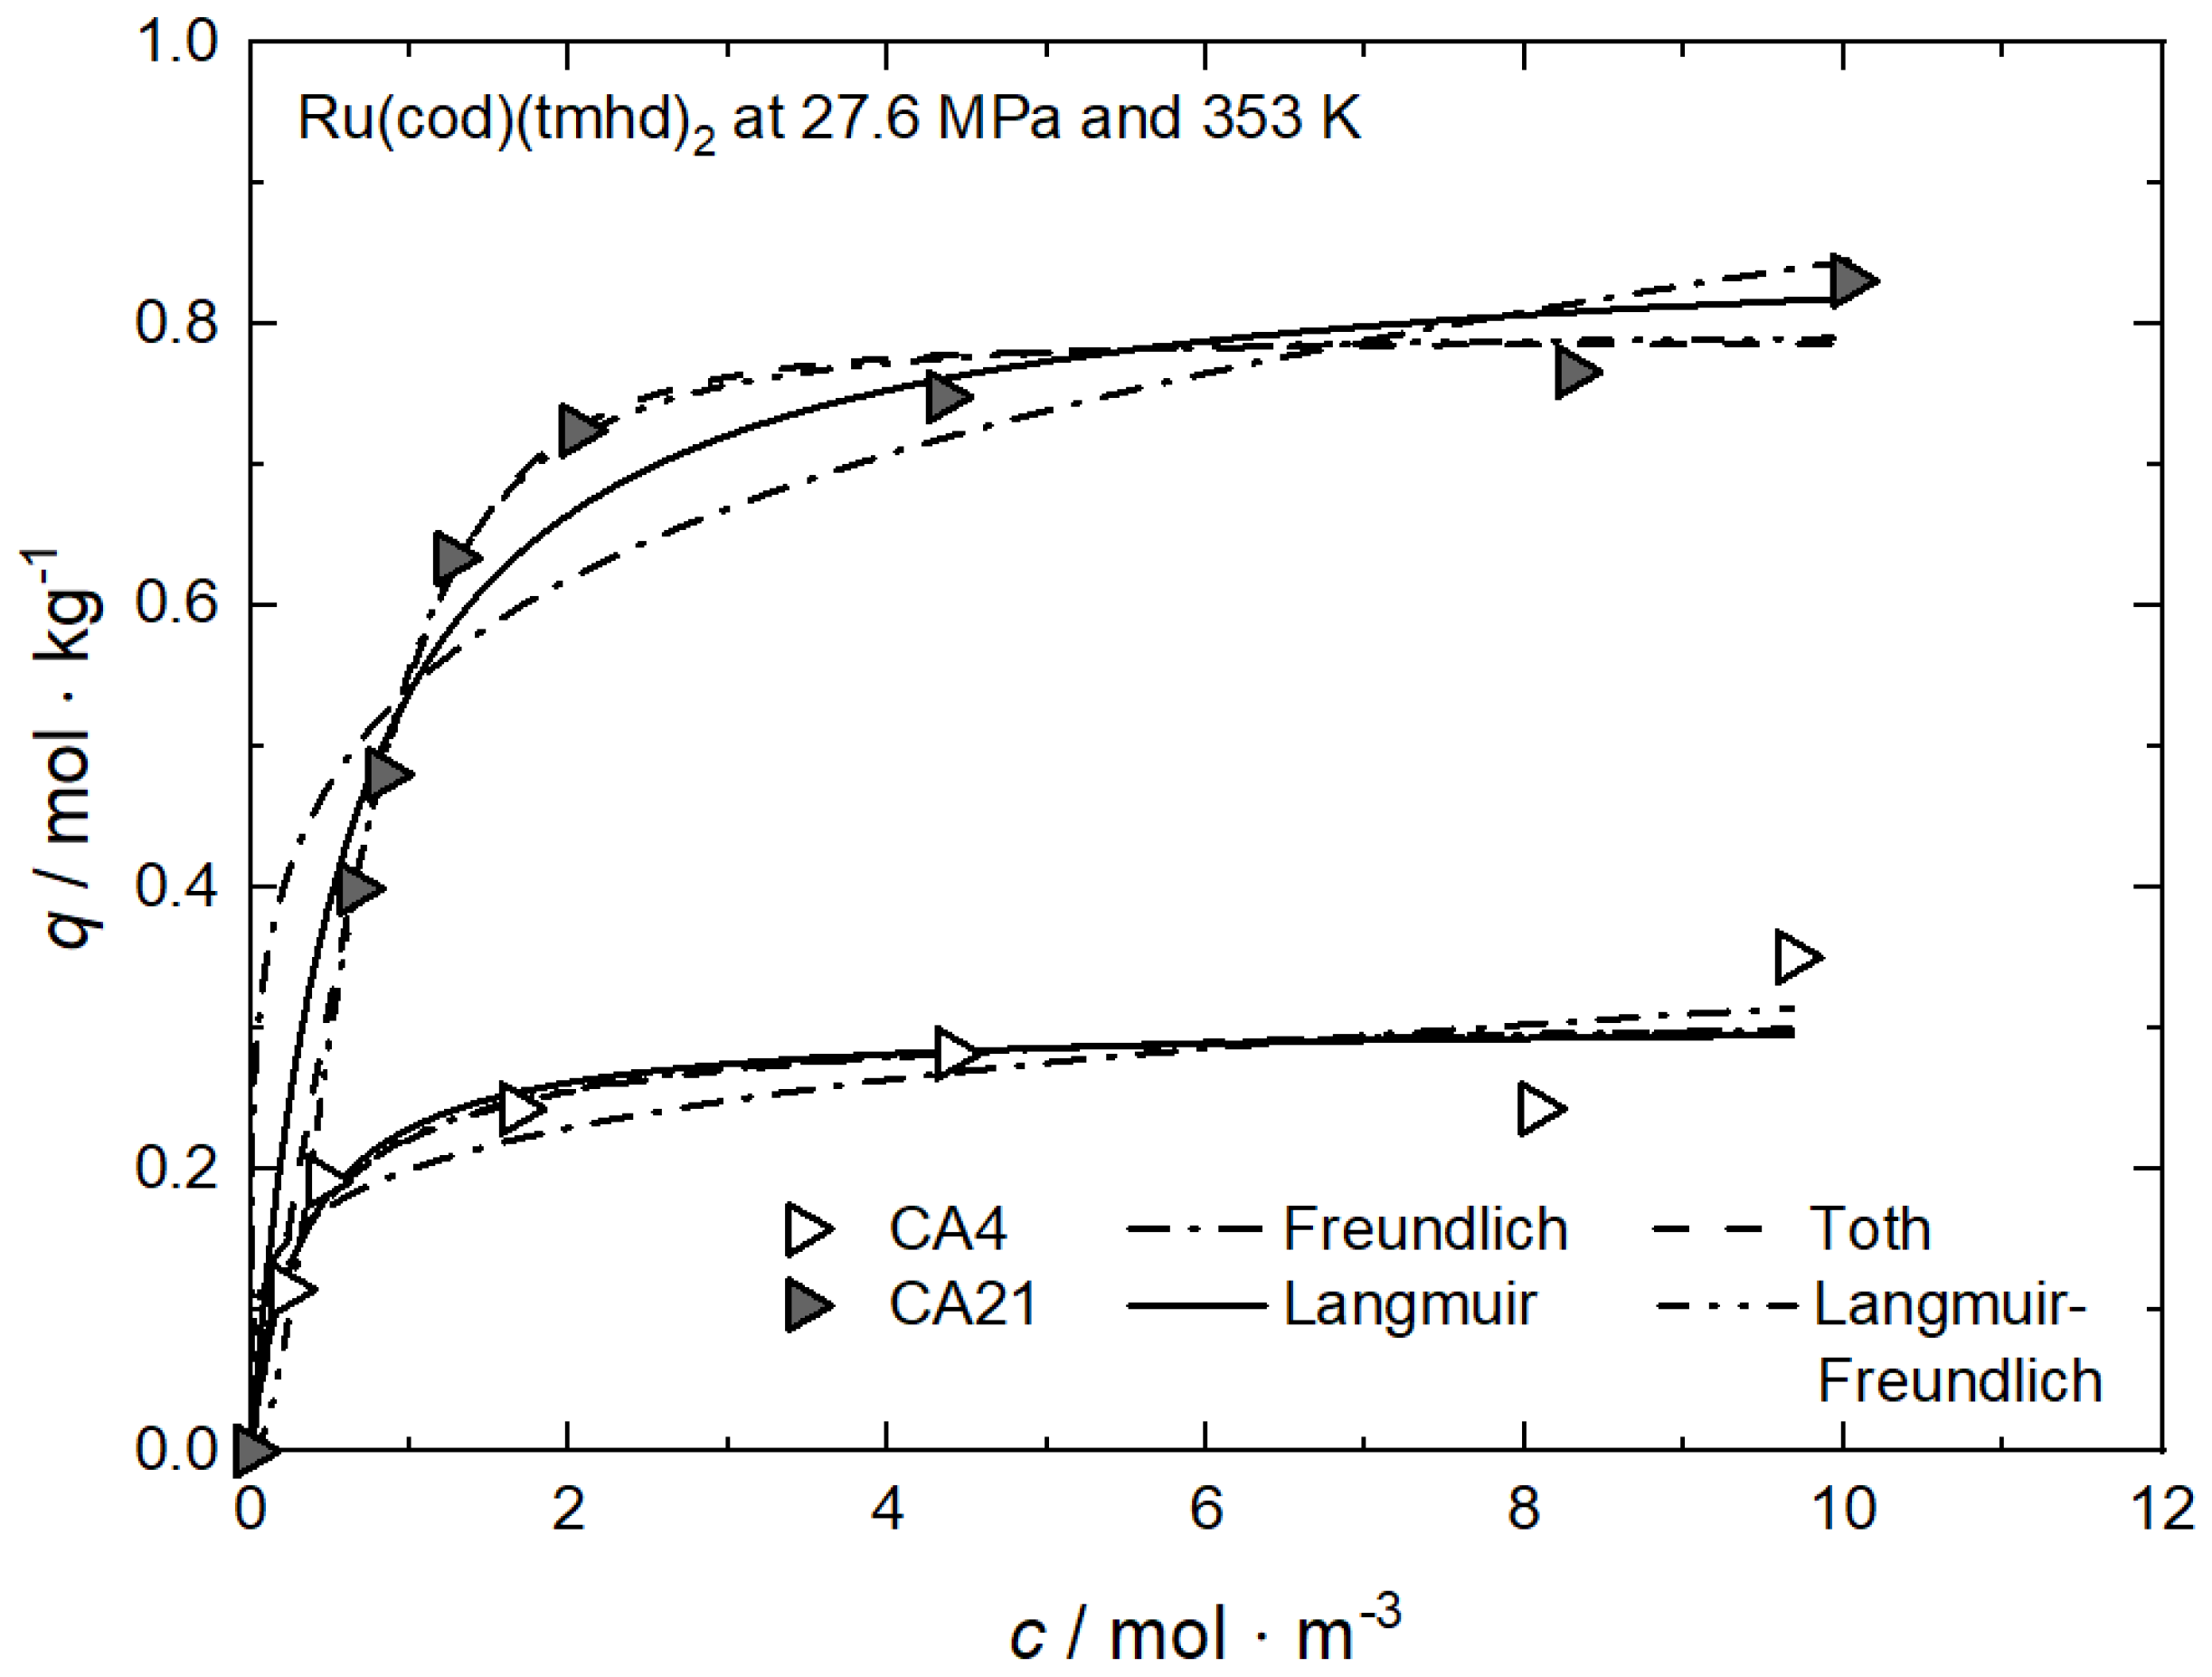
Figure 1, Figure 6 and Figure 7 and show the experimental and the calculated adsorption isotherms for Pt(cod)me2 on CA4 and on CA22 and for Ru(cod)(tmhd)2 on CA4 and on CA21 at 27.7/27.6 MPa and 353 K. In general, it can be stated that for these four investigated systems, the course of the adsorption is similar. The initial slopes are steep, which indicates strong adsorption. For all system holds, the precursor uptake increases nonlinearly with increasing precursor concentrations in scCO2. In the case of Pt(cod)me2 on CA4, a maximum uptake of about 2.5 mol·kg−1 is reached at a precursor concentration of 20 mol·m−3, while for Pt(cod)me2 on CA22, a maximum uptake of around 4.5 mol·kg−1 at a precursor concentration of 50 mol·m−3 is achieved. The maximum adsorption capacities, qm, listed in Table 2 indicate that Pt(cod)me2 has a higher affinity for CA22 than for CA4 which is in good agreement with the experimental results depicted in Figure 6.

Figure 6.
Uptake of Pt(cod)me2 at 27.7 MPa and 353 K on different substrates; experimental data taken from [37].

Figure 7.
Uptake of Ru(cod)(tmhd)2 at 27.6 MPa and 353 K on different substrates; experimental data taken from [53].
Several authors have suggested, that the essential characteristics of a Langmuir isotherm can be expressed in terms of a dimensionless constant, commonly known as separation factor or equilibrium parameter RL which is defined by [54,55,56,57]
where kL (m3·mol−1) refers to the Langmuir constant and cmax denotes the highest measured precursor concentration in CO2 (mol·m−3). In general, RL < 1 indicates that adsorption is favorable; i.e., the lower the RL value, the higher the affinity of the precursor to the substrate. From the kL values listed in Table 2, it follows that the RL value for Pt(cod)me2 on CA22 (0.122) is lower than on CA4 (0.171).

Table 2.
Adsorption isotherm parameters for Pt(cod)me2 from scCO2 solution at 27.7 MPa and 353 K on different substrates [37].
Table 2.
Adsorption isotherm parameters for Pt(cod)me2 from scCO2 solution at 27.7 MPa and 353 K on different substrates [37].
| Equation | Parameter | Unit | CA4 | CA22 |
|---|---|---|---|---|
| Freundlich | kF | m3·kg−1 | 0.78177 | 1.03861 |
| nF | — | 0.41135 | 0.38798 | |
| R2 | — | 0.95267 | 0.94207 | |
| Langmuir | qm | mol·kg−1 | 3.12599 | 5.15837 |
| kL | m3·mol−1 | 0.24573 | 0.14155 | |
| R2 | — | 0.99615 | 0.99759 | |
| Toth | qm | mol·kg−1 | 2.75572 | 4.82953 |
| kT | m3·mol−1 | 0.21820 | 0.13126 | |
| nT | — | 1.47625 | 1.22547 | |
| R2 | — | 0.99931 | 0.99833 | |
| Langmuir- | qm | mol·kg−1 | 2.86290 | 4.85206 |
| Freundlich | kLF | m3·mol−1 | 0.30515 | 0.16831 |
| nLF | — | 1.19725 | 1.14528 | |
| R2 | — | 0.99860 | 0.99894 |
However, the opposite trend is observed in the case of the system Ru(cod)(tmhd)2 on CA4 and on CA21. Based on a critical analysis of the systems investigated, it can be concluded that this approach is applicable to only a few systems. In contrast, the qm·kL approach is able to reproduce the experimentally determined trends correctly.
Significantly lower uptake values were obtained for Ru(cod)(tmhd)2 on CA4 with 0.31 mol·kg−1 and 0.87 mol·kg−1 on CA21 at a precursor concentration of 10 mol·m−3. It is obvious that there exists a significantly lower affinity of both precursors to CA4 than to CA21 and CA22.
It is mentioned in Section 2.2.3 that the qm·kL value is a measure of the relative affinity of the precursor toward the surface of the substrate. From Table 3 follows that the qm·kL value for Ru(cod)(tmhd)2 on CA21 (1.421 m3·kg−1) is significantly higher than that on CA4 (0.917 m3·kg−1). This indicates, in accordance with the results shown in Figure 7, a higher affinity of Ru(cod)(tmhd)2 to CA21 than to CA4.

Table 3.
Adsorption isotherm parameters for Ru(cod)(tmhd)2 from scCO2 solution at 27.6 MPa and 353 K on different substrates [53].
Table 4 summarizes the available experimental data on the adsorption of a single precursor from scCO2 onto various substrates, with a focus on the synthesis of supported monometallic NPs. Furthermore, the models used in this review for the description of the various adsorption isotherm data are also listed.
For the synthesis of supported bimetallic NPs and the control of metal loading and particle size, the knowledge of the binary adsorption isotherms is crucial. However, presently, only results from Bozbag et al. for the binary adsorption of Pt(cod)me2 and CuDI6 on CA at 10.6 MPa and 308 K are published in the literature [58]. In this investigation, the binary adsorption isotherms were modeled by applying an extended Langmuir equation and the ideal adsorbed solution theory (IAST) using the respective single solute isotherm parameters alone. Thus, the model is based on the assumption that the solution shows ideal behavior which means that no interaction between the adsorbed precursor molecule and the surface of the substrate is considered.

Table 4.
Summary of experimental adsorption data from literature considered and models applied within this review (ǂ experiments conducted with co-solvent).
Table 4.
Summary of experimental adsorption data from literature considered and models applied within this review (ǂ experiments conducted with co-solvent).
| Precursor | Substrate | p/MPa | T/K | Model | Ref. |
|---|---|---|---|---|---|
| AgNO3 ǂ | SBA-15 | 13.4 | 308 | Freundlich, Langmuir | [59] |
| 20.7 | 323 | ||||
| 25.6 | 333 | ||||
| Co(acac)3 ǂ | MCM-41 | 12.5 | 333 | Henry, Freundlich, Langmuir | [60] |
| 15 | 313, 333, 353 | ||||
| 20 | 333 | ||||
| CuDI6 | CA, RFA, SA | 10.6 | 308 | Freundlich, Langmuir | [61] |
| CA | 17.8 | 328 | |||
| Pd(acac)2 | BP2000 | 20 | 333 | Henry | [8] |
| Pd(hfac)2 | SBA-15 | 8.5 | 313 | Freundlich, Langmuir, Toth, Langmuir-Freundlich | [9] |
| Pt(cod)me2 | BP2000 | 20 | 333 | Freundlich, Langmuir | [8] |
| Pt(cod)me2 | CA | 10.6 | 308 | Freundlich, Langmuir | [58] |
| Pt(cod)me2 | CA4 | 27.7 | 353 | Freundlich, Langmuir, Toth, Langmuir-Freundlich | [37] |
| Pt(cod)me2 | CA22 | 27.7 | 353 | Freundlich, Langmuir, Toth, Langmuir-Freundlich | [37] |
| Pt(cod)me2 | RFA | 10.7, 20.7 | 308 | Freundlich | [10] |
| Rh(acac)3 ǂ | MCM-41 | 15.0 | 313, 333, 353 | Henry, Freundlich, Langmuir | [62] |
| MSU-H | |||||
| HMS | |||||
| Ru(acac)3 | SA | 18.0 | 313, 353 | Henry | [23] |
| Ru(cod)(tmhd)2 | CA4, CA21 | 27.6 | 353 | Freundlich, Langmuir, Toth, Langmuir-Freundlich | [53] |
| Ru(cod)(tmhd)2 | CA22 | 19.3 | 333, 343, 353 | Freundlich | [63] |
| 27.6 | 353 | ||||
| RuCp2 | AC | 11, 14, 17 | 333 | Henry, Freundlich, Langmuir | [64] |
| MCM-48 | |||||
| Ni(acac)2 | CA | 30 | 333 | Henry, Freundlich, Langmuir | [65] |
3.3. Discussion
In the systems considered here, where precursor adsorption takes place from the binary CO2/precursor mixture onto a substrate, the adsorption of the CO2 molecules needs to be considered as well. Thus, to achieve an improved understanding of how the adsorption process is influenced by pressure, temperature, and CO2 density, detailed knowledge of the strength of the intermolecular forces between CO2 and precursor, i.e., solubility, CO2 and substrate, precursor, and substrate as well as the competitive adsorption of pure CO2 and precursor onto the surface of the substrate, which has until now not been considered in detail yet, is required. Note: at equilibrium, the amount of adsorbed precursor depends on the concentration of the precursor in CO2 under given process conditions.
The discussion about the influence of temperature and pressure on the equilibrium precursor uptake that follows claims that, under the given process conditions, the solubility of the precursor in CO2 is below the solubility equilibrium. However, when adsorption experiments are conducted under saturated conditions (an excess of the precursor is available), opposite tendencies may be observed.
3.3.1. Effect of Pressure
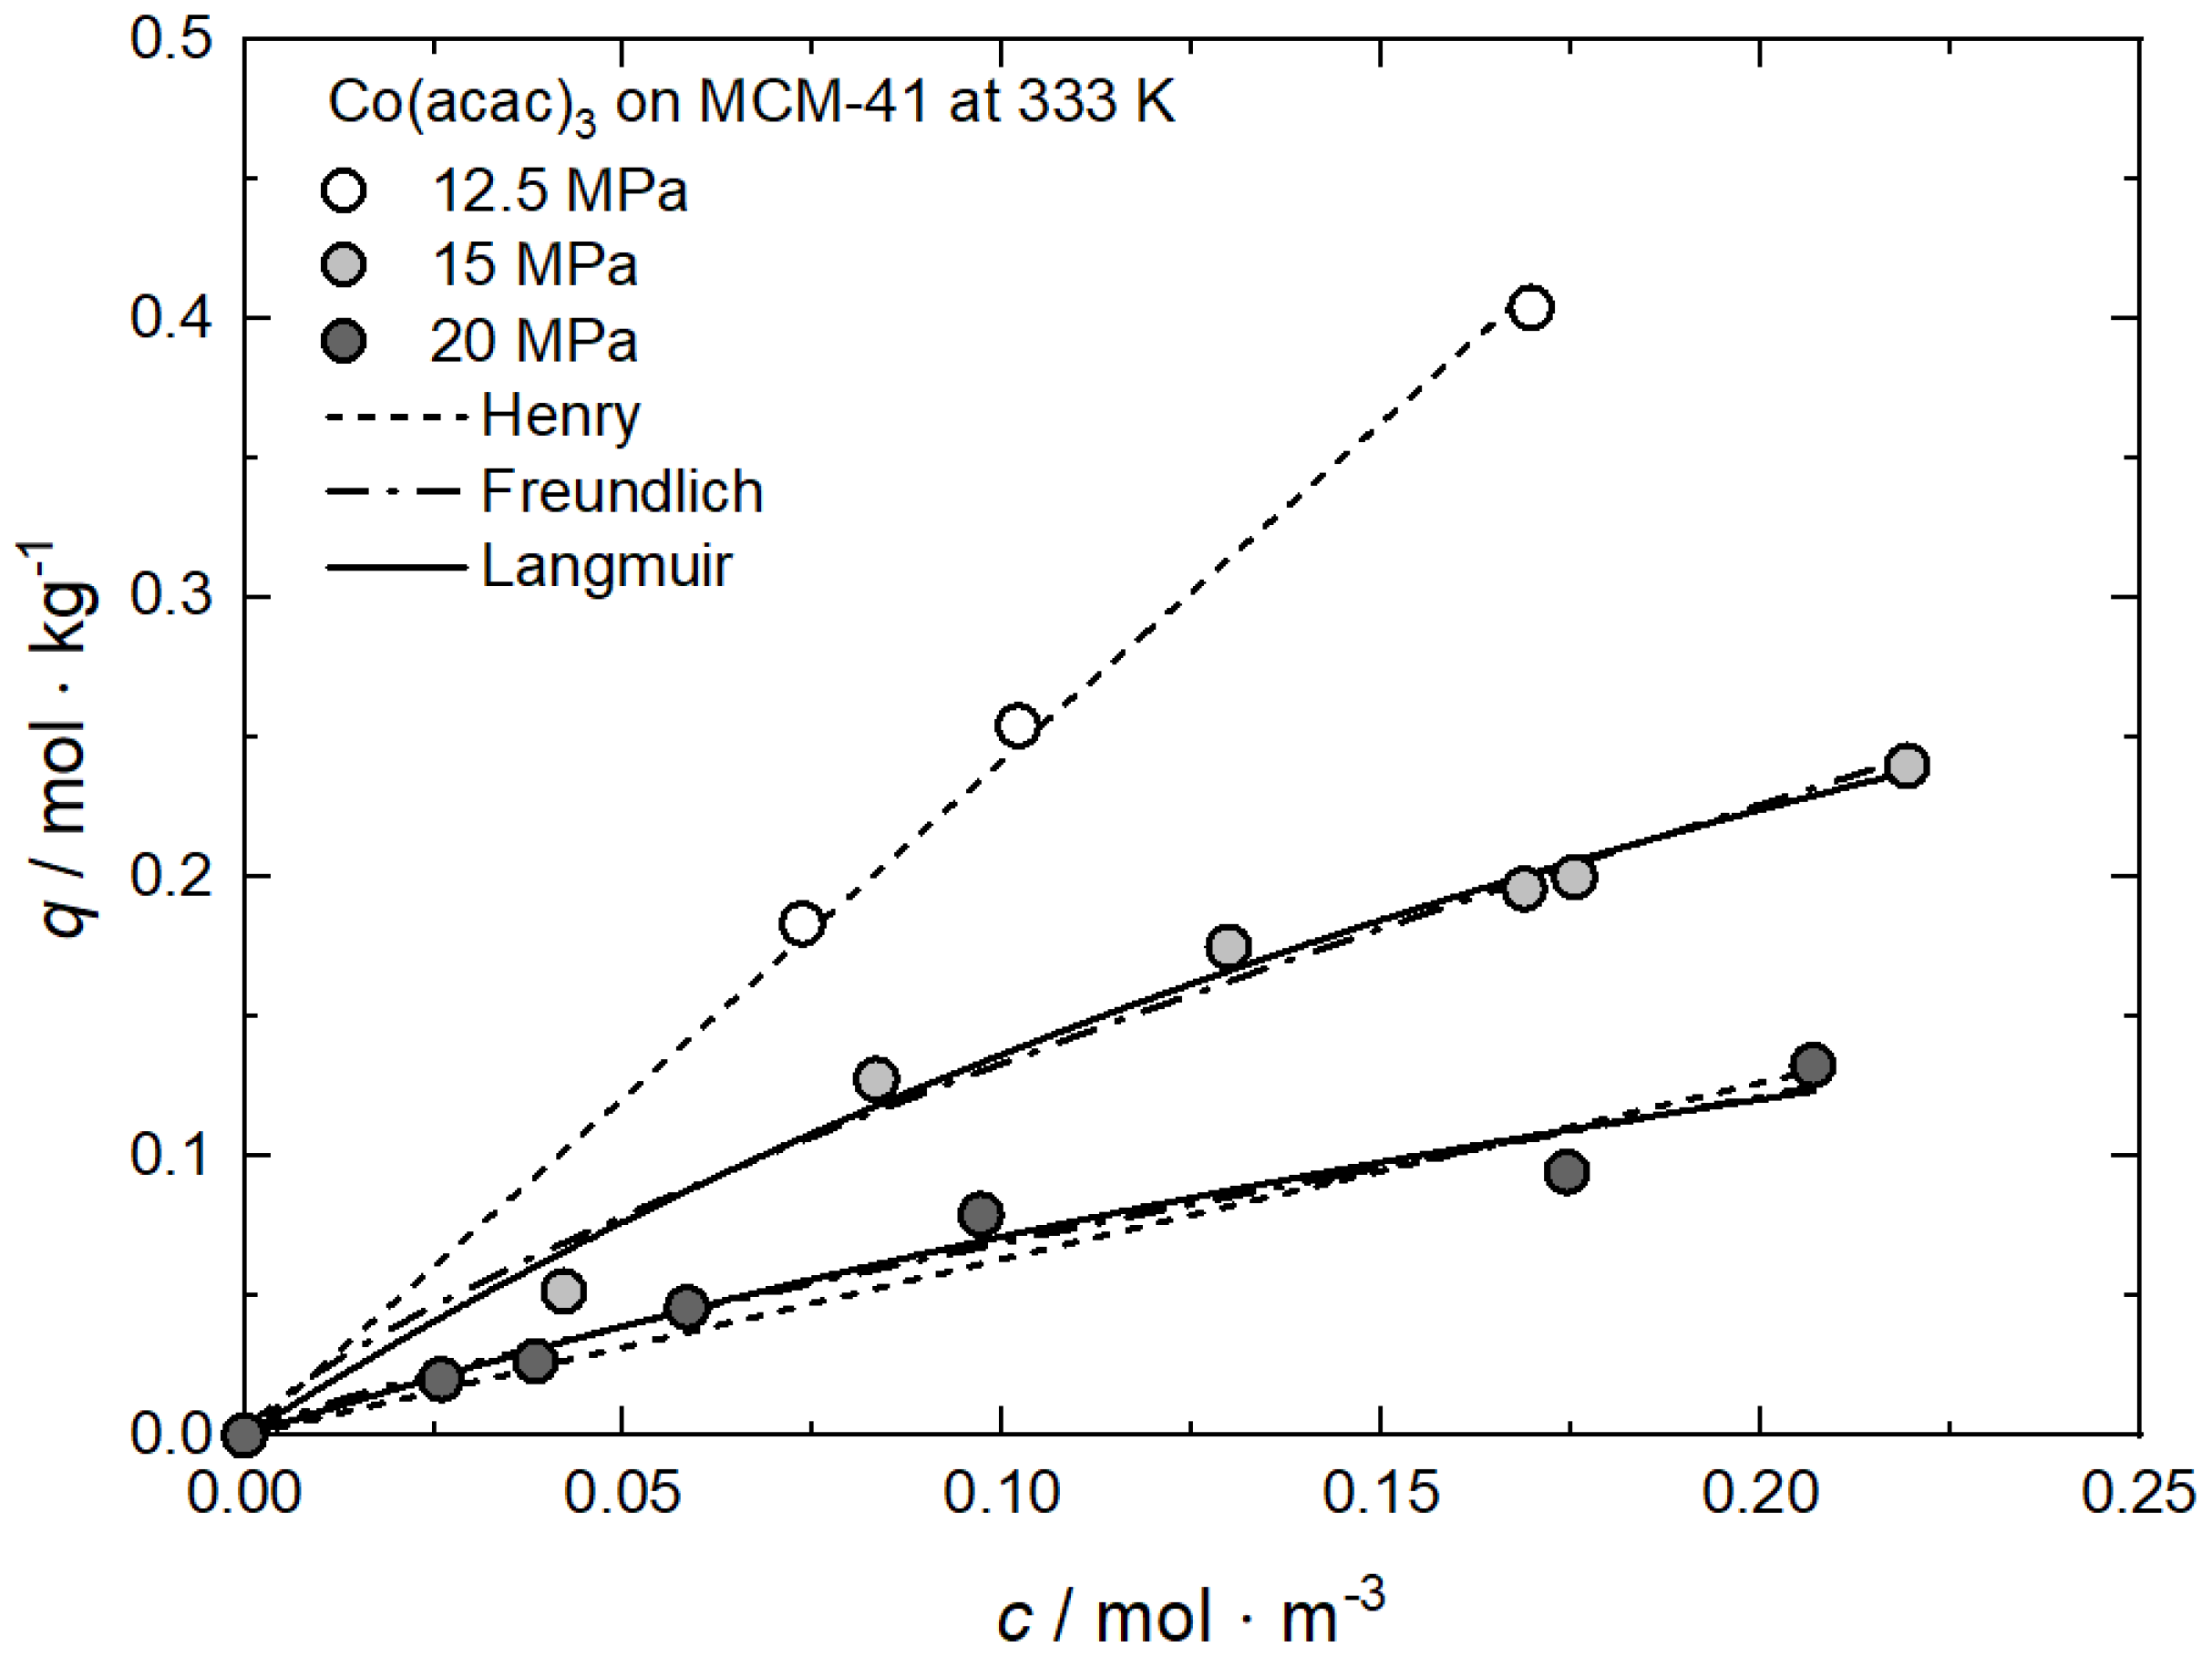
At constant temperature, the influence of pressure on the uptake can simply be explained by the CO2 density dependence of the precursor solubility (cf. Equation (2)). Increasing pressure results in an increase in CO2 density, which causes an increase in the solubility equilibrium of the precursor in CO2 (cf. Equation (2) and Figure 3) and thus depletion of the adsorbed phase and therewith lower precursor uptake. In other words, the enhancing interaction between the precursor molecules and CO2 when the pressure increases leads to a decrease in precursor uptake. These findings are in agreement with numerous results reported in the literature [60,63,64]. The adsorption isotherms for Co(acac)3 on MCM-41 at 333 K and for pressures of 12.5, 15, and 20 MPa are presented in Figure 8 exemplarily. The individual constants of the different models were found by nonlinear regression and the values received are summarized in Table 5.

Figure 8.
Uptake of Co(acac)3 on MCM-41 at 333 K and different pressures; experimental data taken from [60].

Table 5.
Adsorption isotherm parameters for Co(acac)3 from scCO2 solution on MCM-41 at 333 K and different pressures [60].
Additional results for the comparison between experimental and calculated adsorption data at different pressures for RuCp2 on MCM-48 and AC at 333 K [64], for Ru(cod)(tmhd)2 on CA22 at 353 K [63] and for Pt(cod)me2 on RFA at 308 K [10] are depicted in Appendix A in Figure A1, Figure A2, Figure A3 and Figure A4 and Table A1, Table A2, Table A3 and Table A4.
3.3.2. Effect of Temperature at Constant Pressure
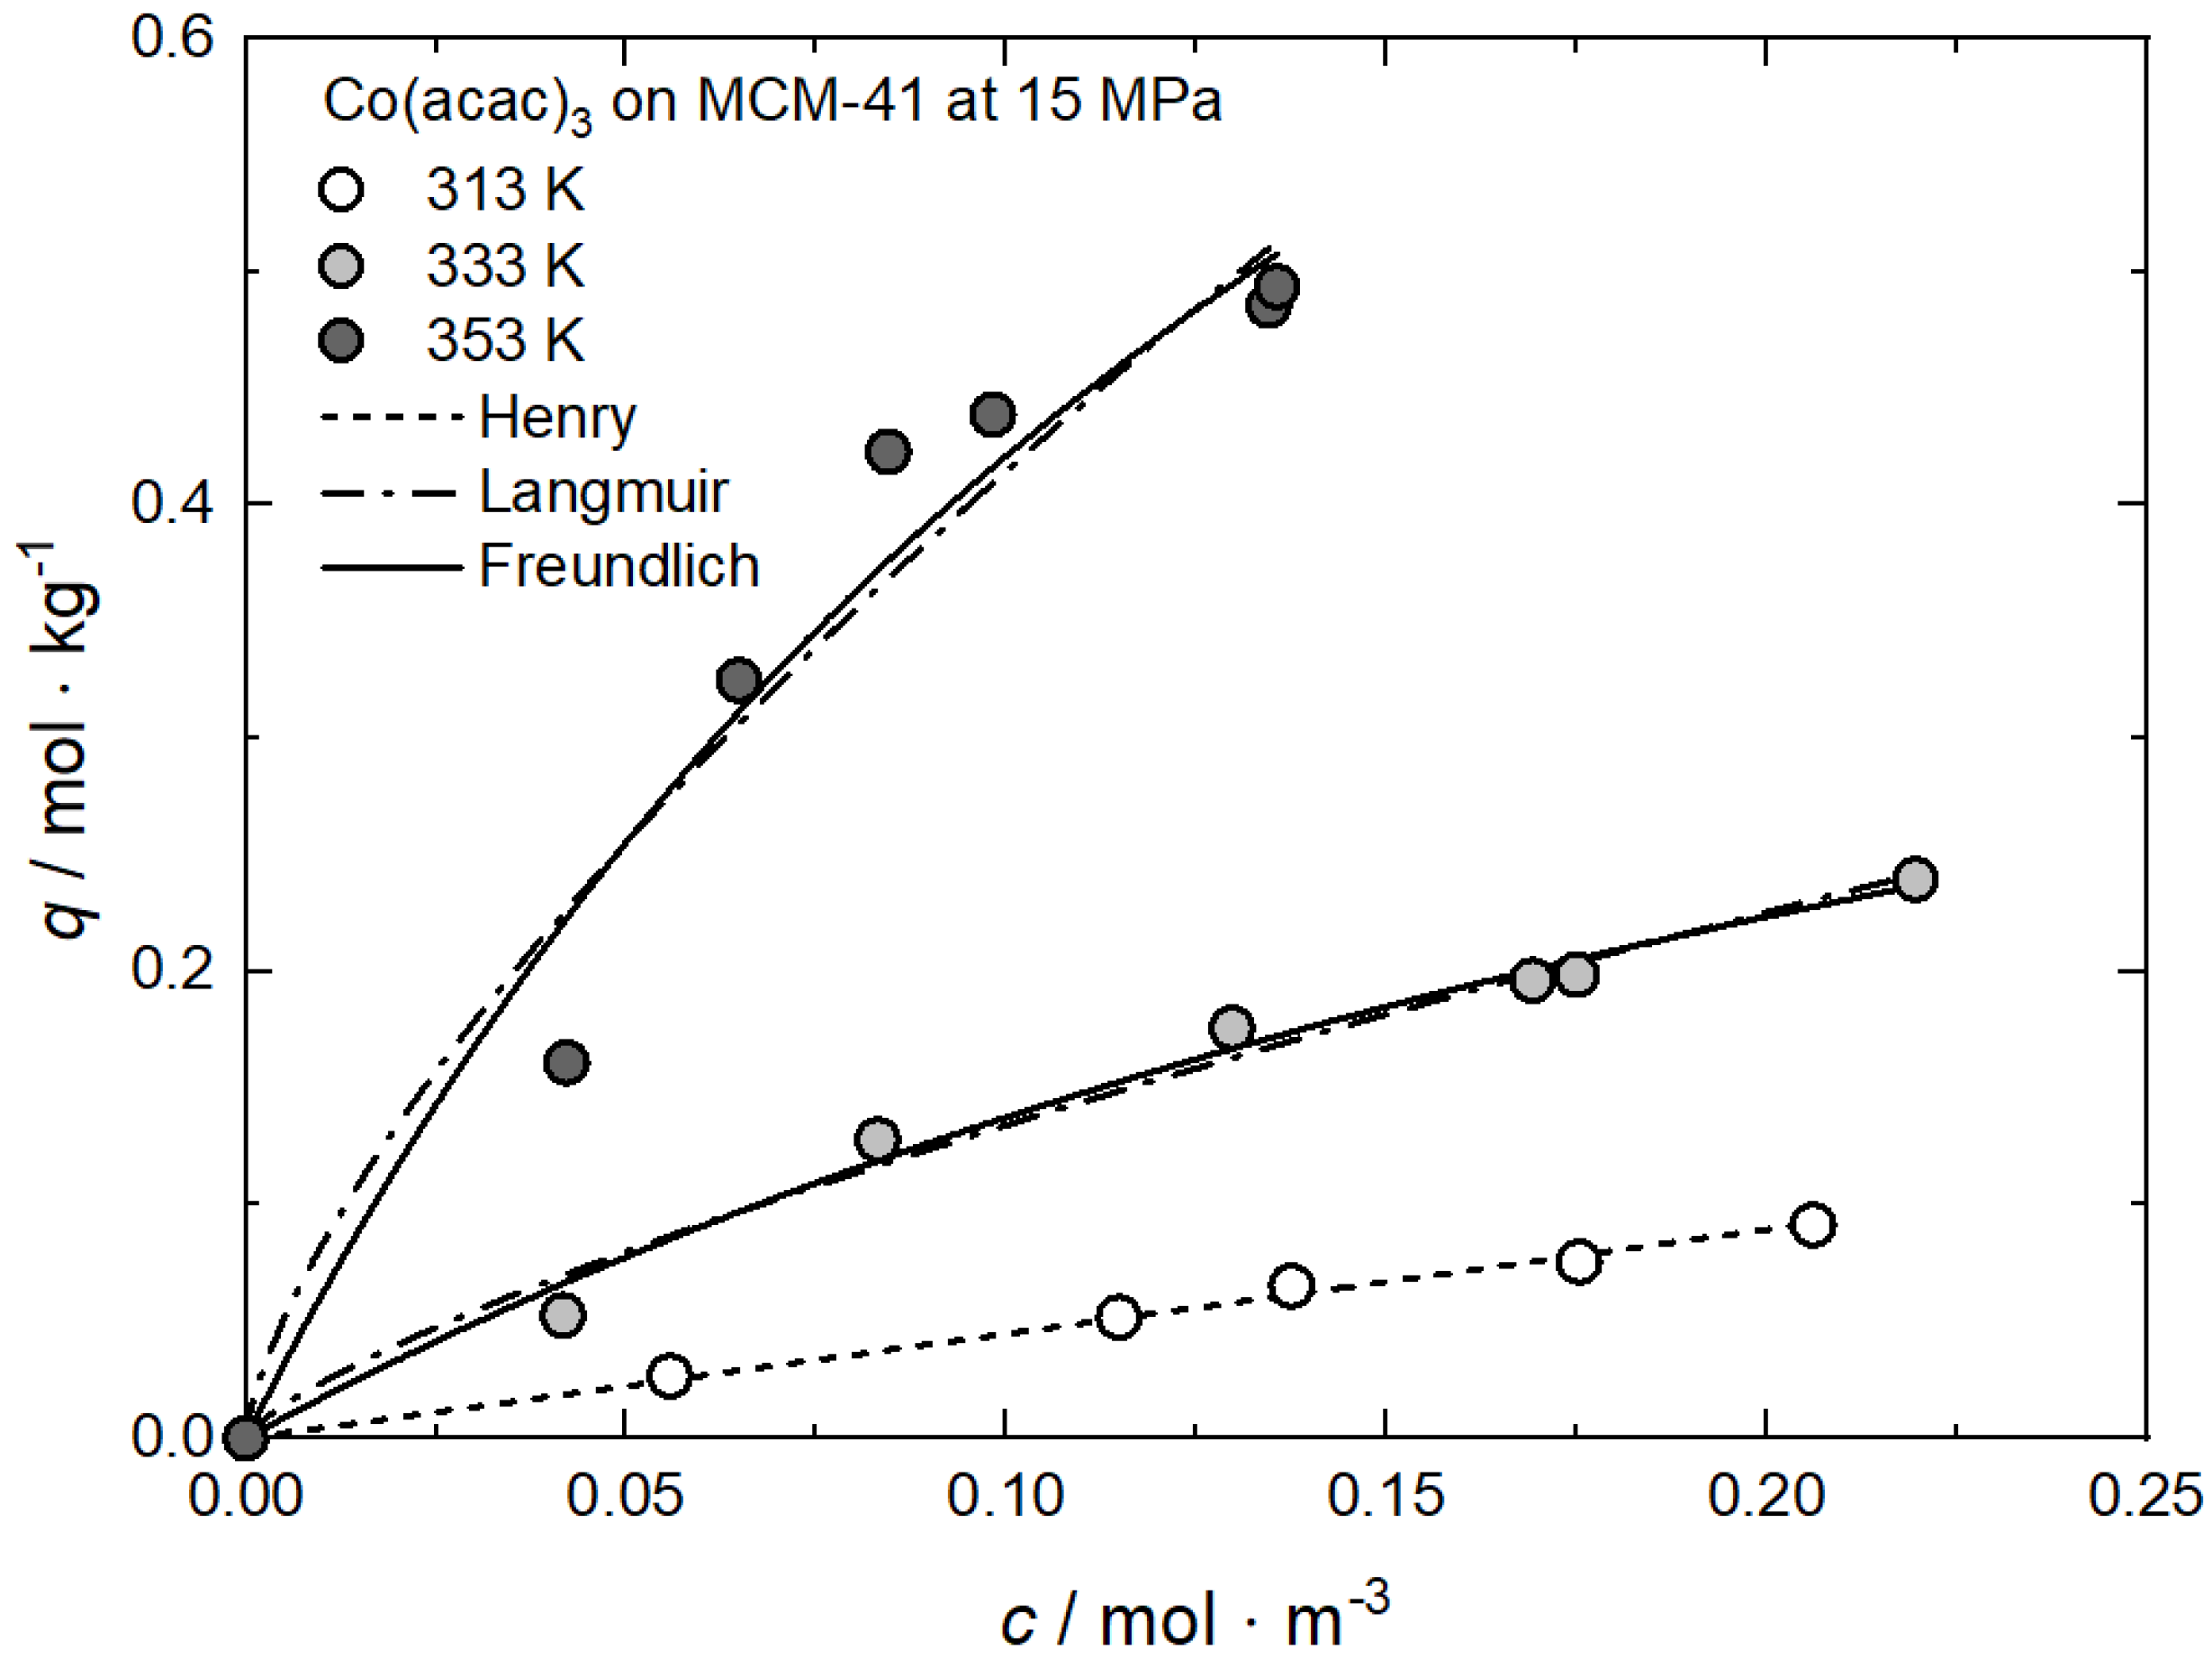
In opposition to the influence of the pressure, the effect of the temperature on the precursor uptake at a certain concentration is somehow more complex. In order to understand the experimental trends, it is necessary to verify whether the experiments were conducted inside or outside the retrograde region (cf. Section 1.3). Inside this region and under constant pressure, the solubility equilibrium of the precursor decreases with increasing temperature, while, outside, the opposite behavior is observed. Note that the experimental results discussed below and depicted in Figure 9 were conducted inside the retrograde region (cf. Figure 4) [23,60,62]. This is demonstrated in Figure 9 by the system Co(acac)3 on MCM-41 at 15 MPa and temperatures of 313, 333, and 353 K [60].

Figure 9.
Uptake of Co(acac)3 on MCM-41 at 15 MPa and different temperatures; experimental data taken from [60].
It is interesting to note that the equilibrium uptake is higher at 353 K than at 333 K and 313 K. This behavior was somewhat unexpected because usually adsorption is enhanced by lower temperatures (e.g., Equation (1)). However, such a result can be explained in the following way: due to the solubility decrease in the retrograde region, the precursor uptake increases with increasing temperature, indicating endothermic behavior. The values for the individual constants of the used adsorption models are summarized in Table 6.

Table 6.
Adsorption isotherm parameters for Co(acac)3 from scCO2 solution on MCM-41 at 15 MPa and different temperatures [60].
3.3.3. Effect of Temperature at Constant Density
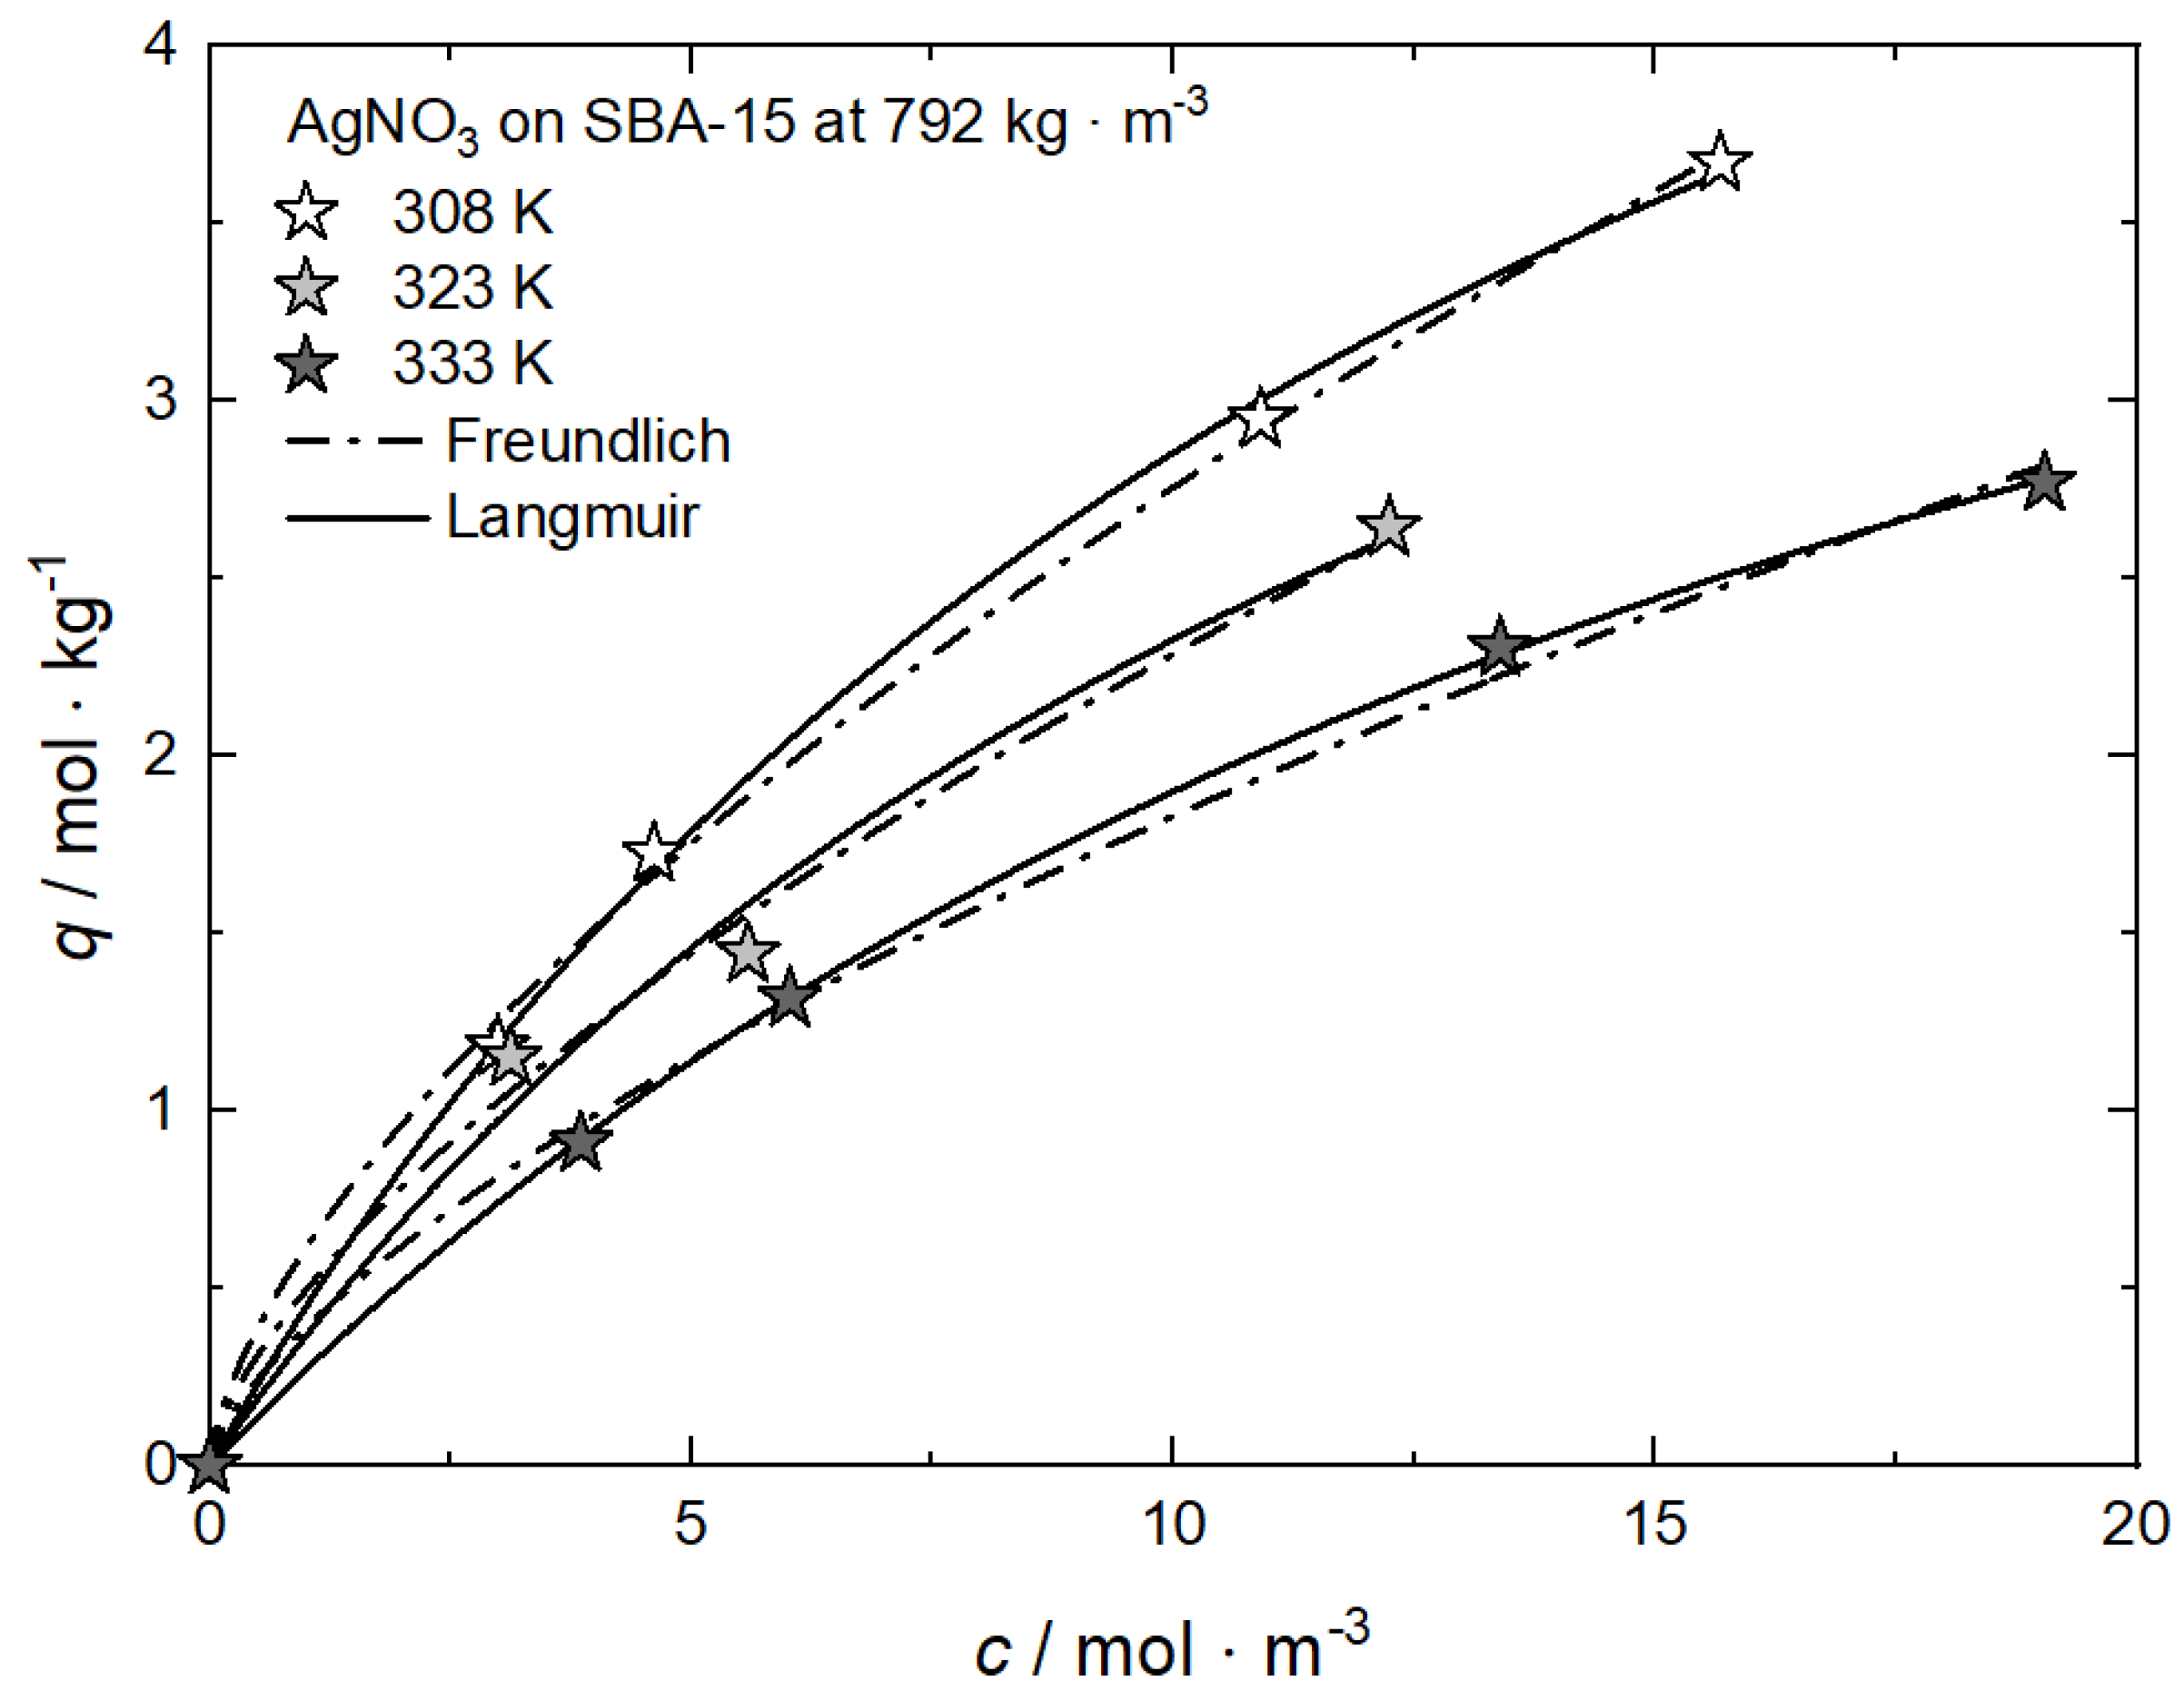
On the other hand, at a constant CO2 density, an increasing temperature leads to a higher precursor amount in the CO2 phase (cf. Figure 3) which causes a lower precursor uptake [9]. Such a decrease in the uptake with increasing temperature indicates that the adsorption under isochoric conditions is an exothermic process (cf. Equation (1)). This behavior is shown in Figure 10 for AgNO3 on SBA-15 at 792 kg·m−3 [59] and is in accordance with experimental results from pure CO2 adsorption [34,45]. The values for the individual constants of the used adsorption models are summarized in Table 7.

Figure 10.
Uptake of AgNO3 on SBA-15 at 𝜌 = 792 kg·m−3 and different temperatures; experimental data taken from [59].

Table 7.
Adsorption isotherm parameters for AgNO3 from scCO2 solution on SBA-15 at 𝜌 = 792 kg·m−3 and different temperatures [59].
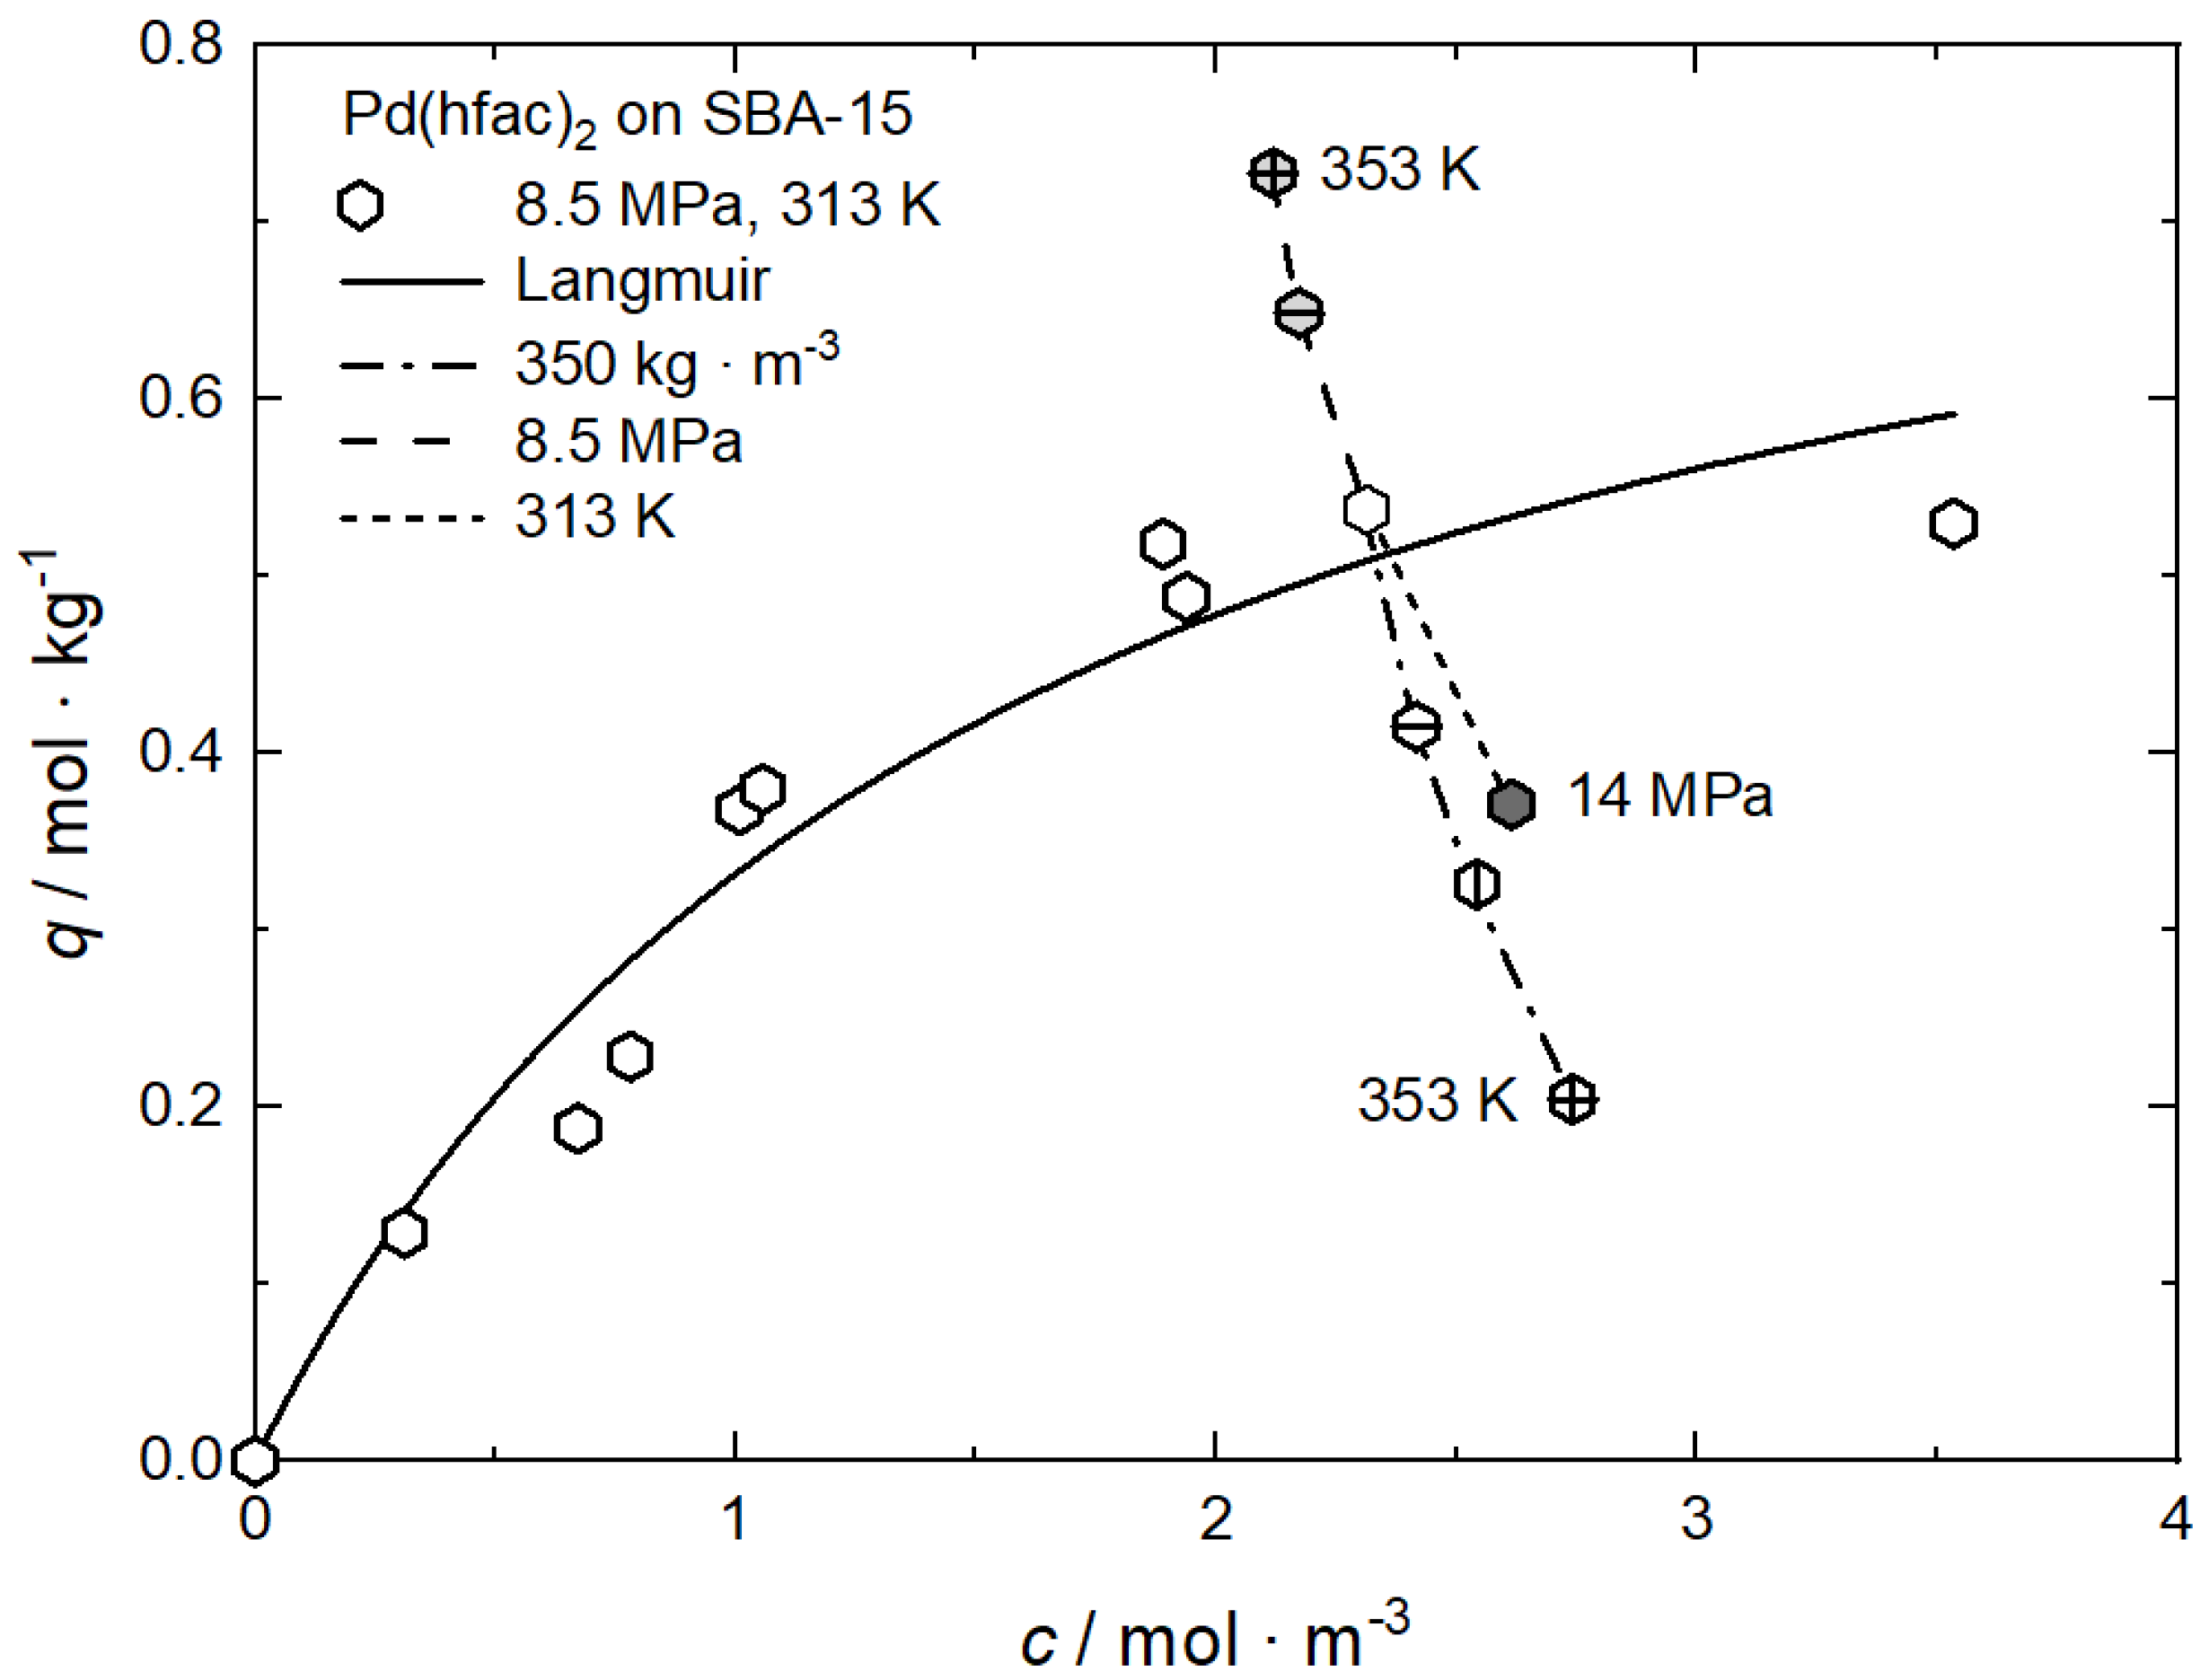
Tenerio et al. investigated systematically the influence of pressure, temperature, and therewith density on the adsorption of Pd(hfac)2 on SBA-15 at pressures between 8.5 MPa and 14 MPa and in the temperature range from 313 K to 353 K, resulting in a CO2 density range from 170 kg·m−3 to 760 kg·m−3 [9]. The experimental data at 8.5 MPa and 313 K were fitted to the Freundlich and Langmuir models and the individual constants for these approaches are summarized in Table 8. Obviously, the best result was obtained when the Langmuir model is used. Figure 11 shows the experimental data together with the Langmuir adsorption isotherm.

Table 8.
Adsorption isotherm parameters for Pd(hfac)2 from scCO2 solution on SBA-15 at 8.5 MPa and 313 K [9].

Figure 11.
Uptake of Pd(hfac)2 on SBA-15 at different pressures, temperatures, and density conditions; experimental data taken from [9].
Based on these experimental results, the following trends are observed: At a pressure of 8.5 MPa, increasing the temperature from 313 K to 353 K leads to an increase in the Pd(hfac)2 uptake from 0.54 to 0.73 mol·kg−1. This behavior indicates that the experiments were conducted in the retrograde region. At a constant temperature of 313 K, increasing pressure from 8.5 to 14 MPa causes a decrease in the precursor uptake from 0.54 to 0.37 mol·kg−1. Furthermore, at a constant density of 350 kg·m−3, an increase in the temperature from 313 K to 353 K results in a decrease in the precursor uptake from 0.54 to 0.20 mol·kg−1.
A deeper analysis of the experimental results discussed above shows, that the solubility of the precursor in scCO2 is the important parameter that controls the precursor uptake in the following way: an increasing density either caused by increasing pressure at constant temperature or decreasing temperature at constant pressure leads to a higher solubility of the precursor in scCO2 which results in a lower uptake. On the other hand, inside the retrograde region, a different behavior is observed: at constant pressure and increasing temperature, the solubility decreases, which causes an increase in uptake.
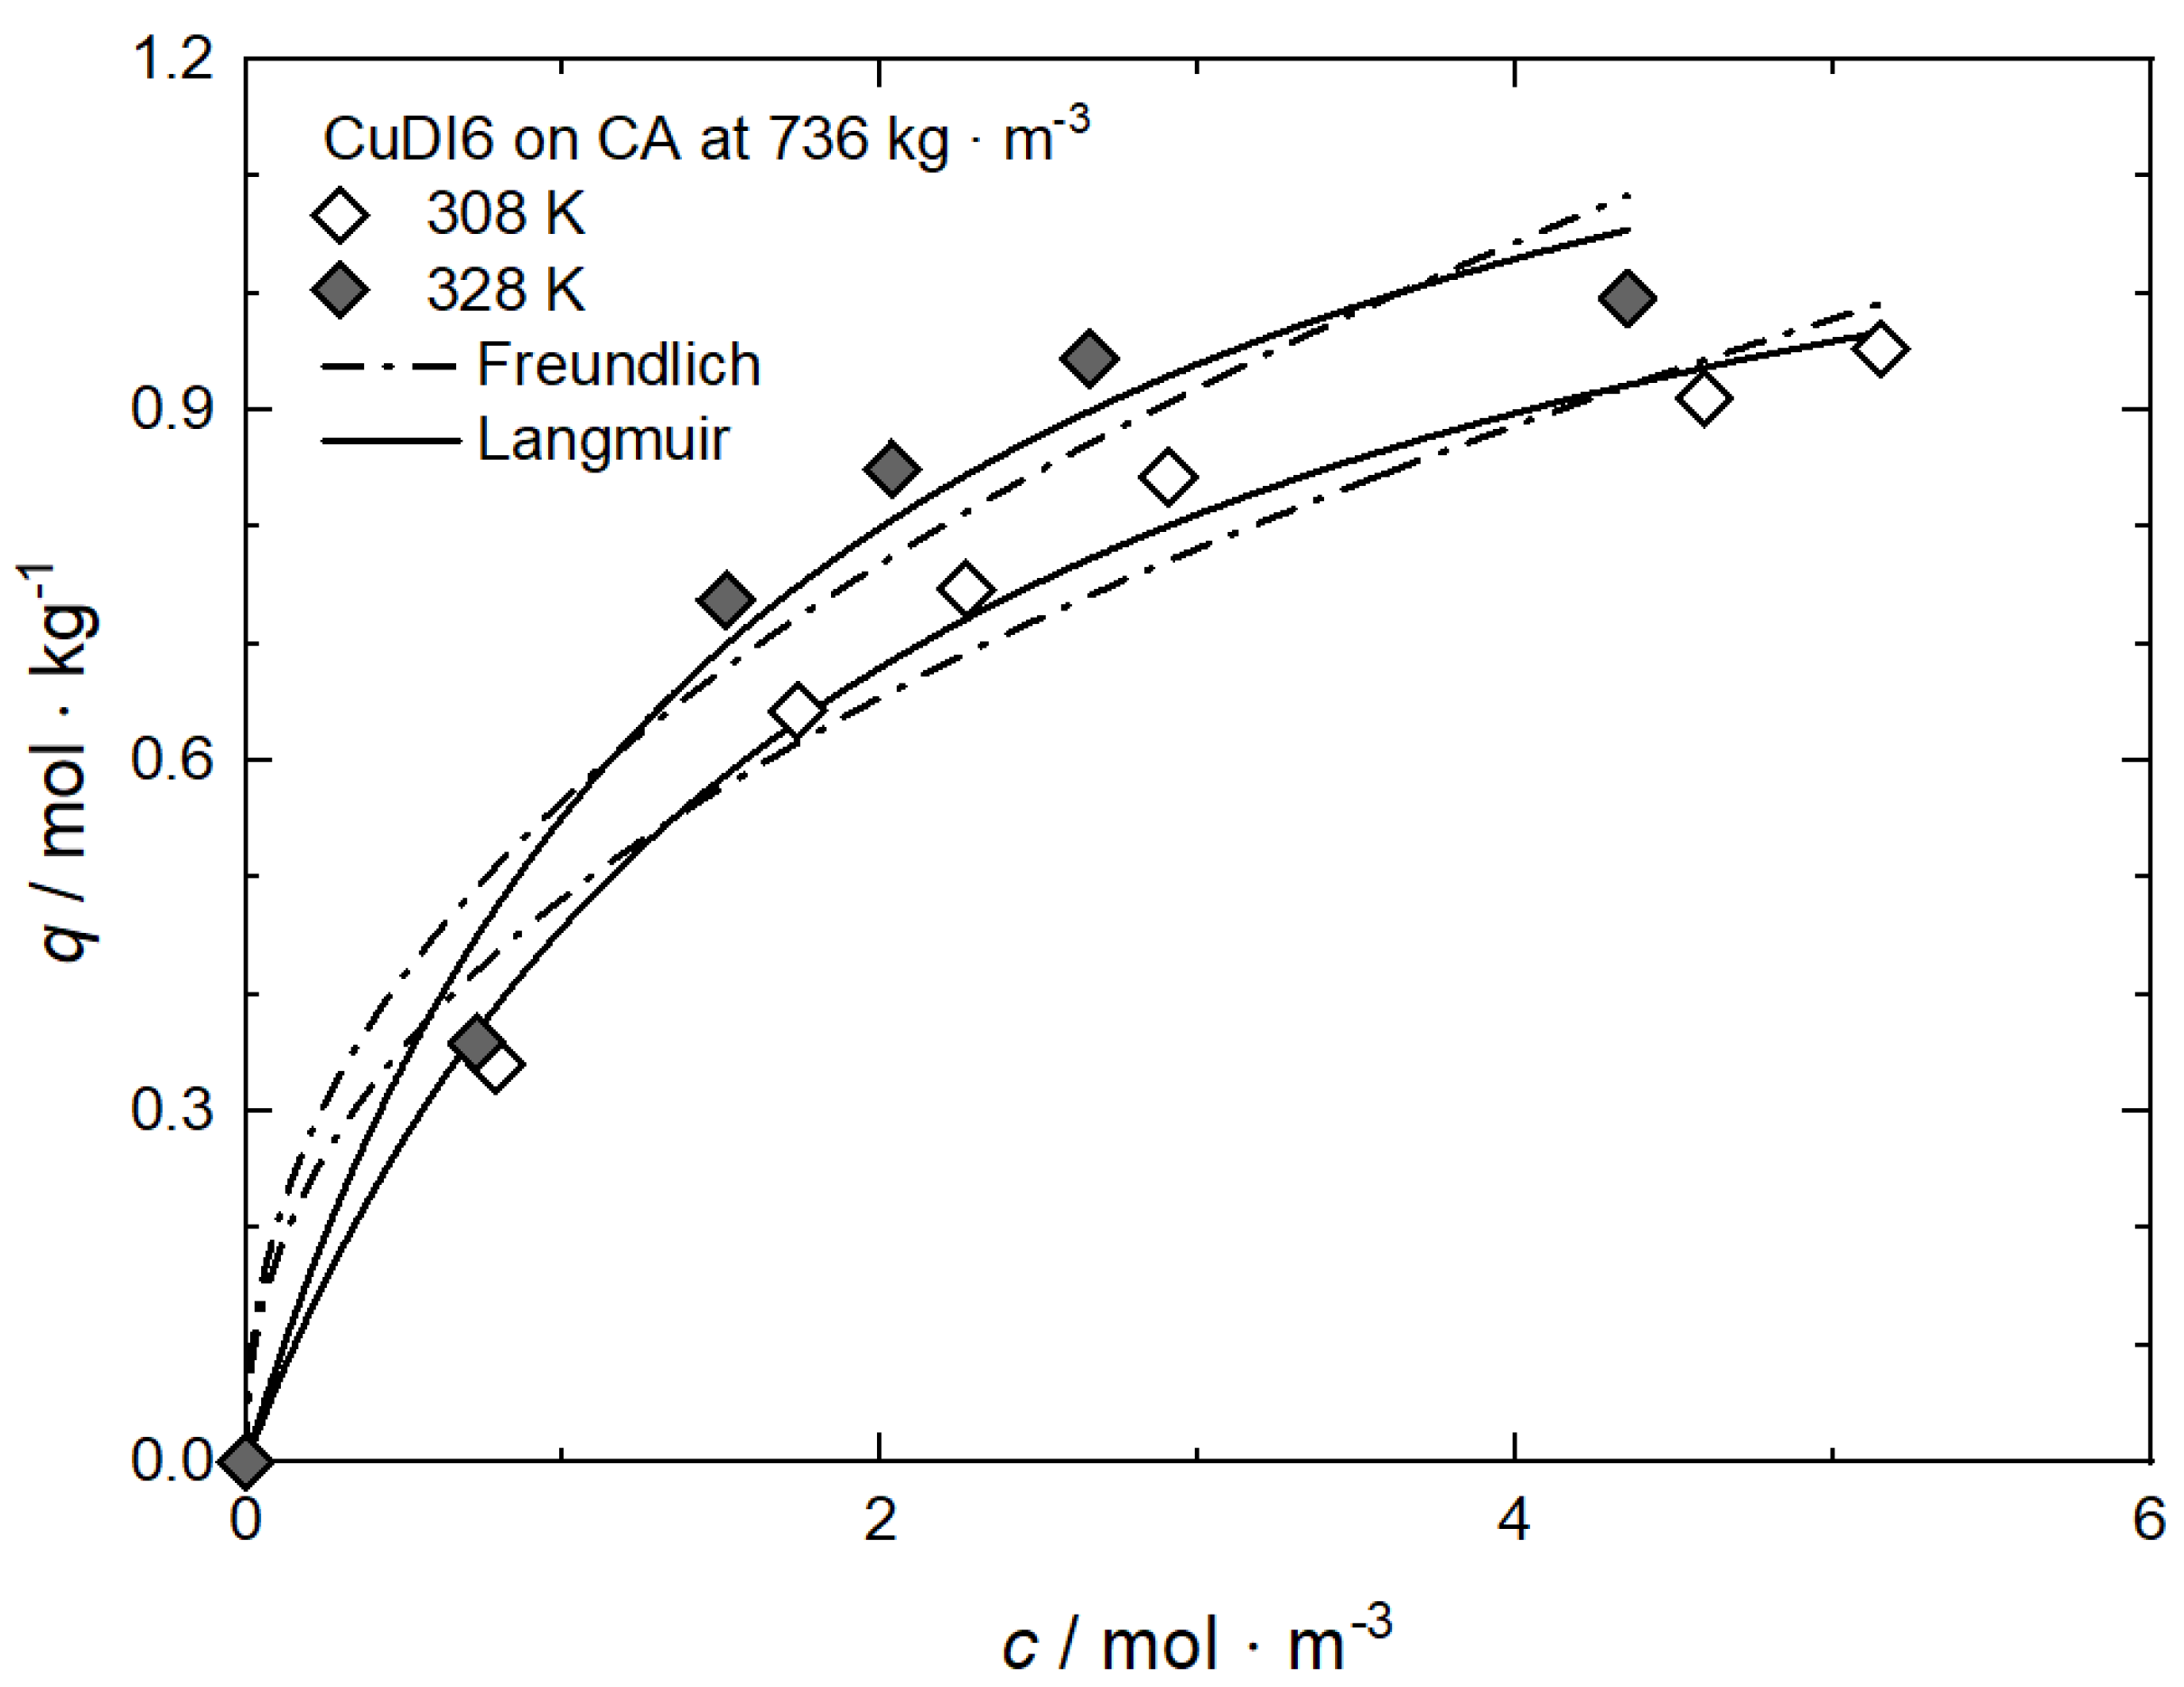
In opposition to the results from experiments performed at a constant density published by Xu et al. and Tenorio et al. [9,59], results published by Bozbag et al. [61] for CuDI6 on CA at 736 kg·m−3 and different temperatures show the reverse trend, i.e., the uptake increases with increasing temperature at constant density and a given precursor concentration (cf. Figure 12). Such behavior is contrary to the exothermic character of adsorption (cf. Equation (1)) and therewith indicating endothermic behavior. Bozbag et al. explained this behavior by asserting that, under the given process conditions, pure CO2 adsorption must also be taken into account.

Figure 12.
Uptake of CuDI6 on CA at 𝜌 = 736 kg·m−3 and different temperatures; experimental data taken from [61].
From the Langmuir model parameters given in Table 9 follows that the corresponding qm·kL values are 0.896 for 328 K and 0.702 for 308 K which means that the relative affinity of CuDI6 toward the surface of CA is ranked in the following order: 328 K > 308 K.

Table 9.
Adsorption isotherm parameters for CuDI6 on CA at 𝜌 = 736 kg·m−3 and different temperatures [61].
Humayun and Tomasko [66] and others [34,45] studied the adsorption of CO2 on substrates with different surface areas. Adsorption experiments performed with MCM-41 show that at temperatures in the range from 313 K to 353 K and CO2 densities below 473 kg·m−3 the CO2 uptake decreases with increasing temperature. In opposition thereto, at higher densities, no temperature dependence of the uptake (ca. 12.8 mmol·g−1) is observed (cf. Figure 5). Thus, it is obvious that under these conditions, CO2 adsorption is far from negligible. From this follows that the adsorption of pure CO2 molecules occurs simultaneously with the adsorption of the precursor molecules and therewith a competition of both processes takes place and should be considered. According to Bozbag et al., it seems that the competitive adsorption between the CO2 and CuDI6 is responsible for the increased CuDI6 uptake with increasing temperature [61].
Additional results for the comparison between experimental and calculated adsorption data at different temperatures for Rh(acac)3 on SA at 18 MPa [23], for Rh(acac)3 on HSU-H, HMS, and MCM-41 at 15 MPa [62], and for Ru(cod)(tmhd)2 on CA22 at 19.3 MPa [63] are depicted in Appendix B in Figure A5, Figure A6, Figure A7, Figure A8 and Figure A9 and Table A5, Table A6, Table A7, Table A8 and Table A9. Note that in opposition to the systems described above, no clear influence of the temperature on the uptake was found for Ru(cod)(tmhd)2 on CA at 19.3 MPa.
3.3.4. Effect of Substrate Properties
In general, a higher precursor uptake is usually expected for the substrate with the higher specific surface area, as long as the substrates show similar chemical properties, and the pores are large enough to accommodate the precursor molecules. Furthermore, at constant pressure or temperature and a certain precursor concentration, the uptake is strongly influenced by the interaction forces between the solid surface and precursor molecules in the fluid phase.
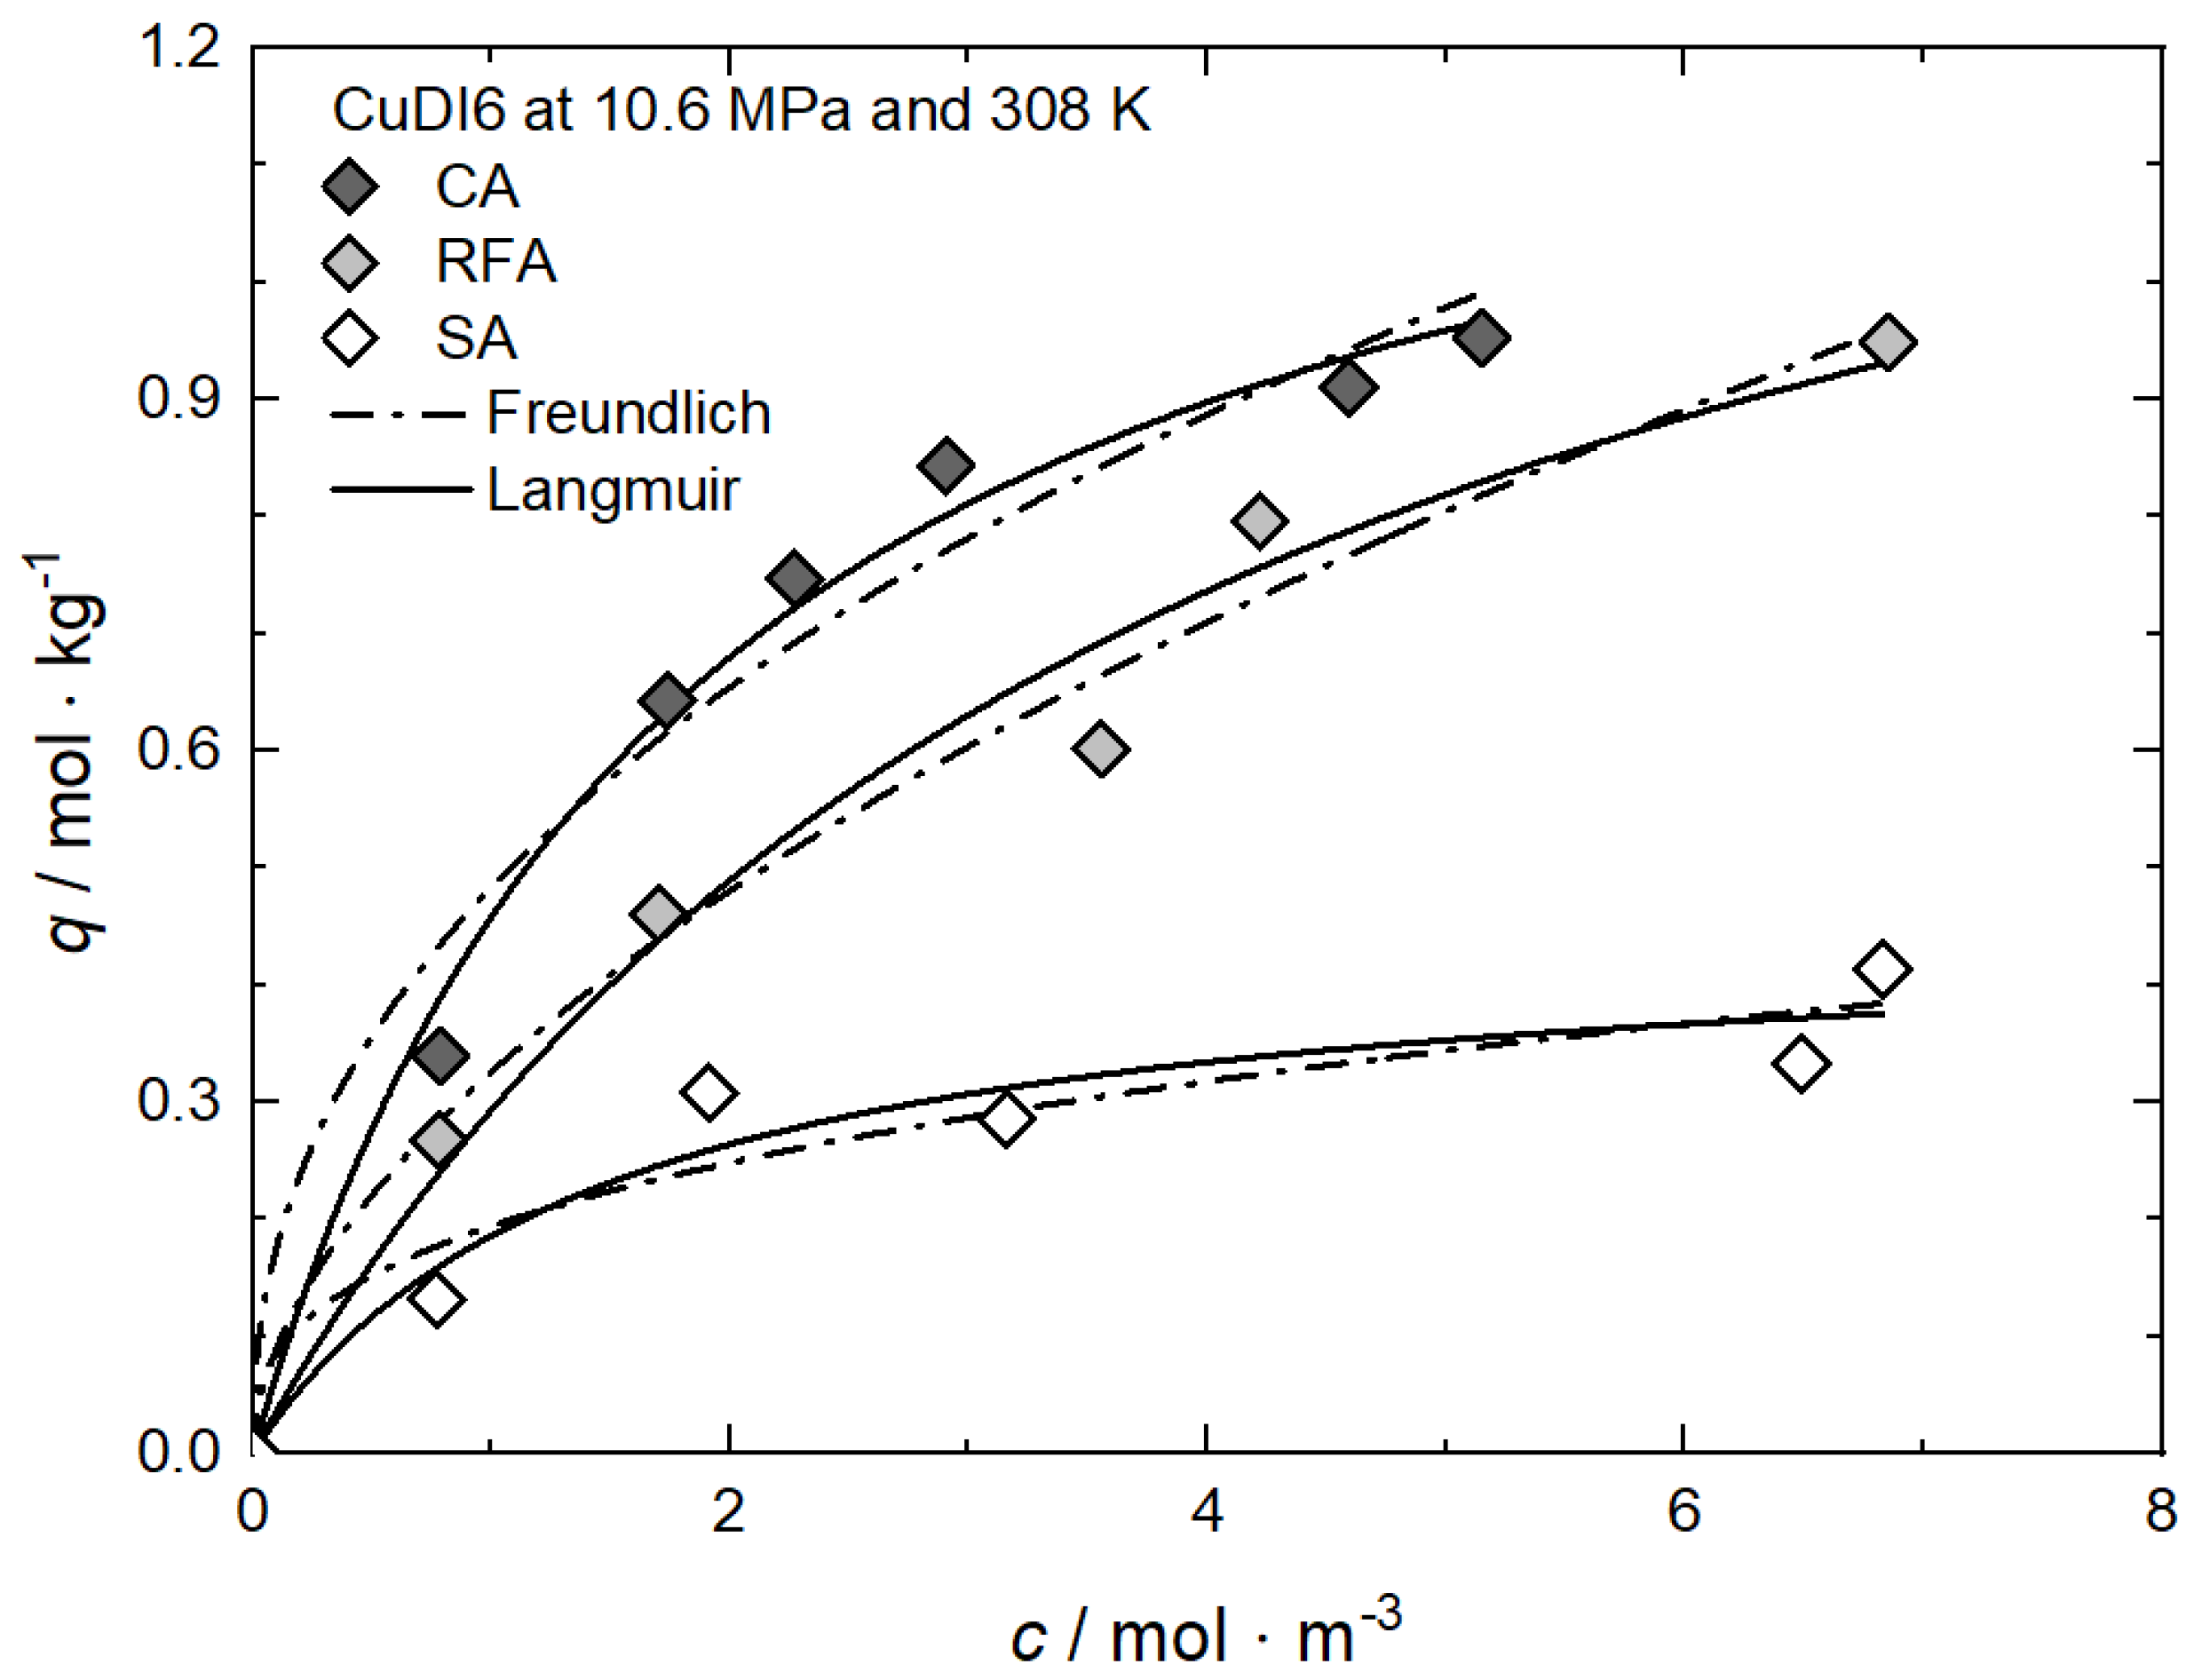
Figure 13 shows the adsorption isotherms for CuDI6 at 10.6 MPa and 308 K on carbon, resorcinol–formaldehyde, and silica aerogels (CA, RFA, and SA) [61]. In all cases, the CuDI6 uptake increases nonlinearly with increasing precursor concentration in scCO2. It is obvious that at a given precursor concentration, CA has the highest, and SA has the lowest, uptake. The differences in the slopes and absolute values of the individual isotherms are caused by the different strengths of the attractive interactions between the precursor and the surface of the different substrates. Obviously, the attractive interactions between CuDI6 and CA are the strongest since the same uptake is reached at lower precursor concentrations compared to those of RFA and SA.

Figure 13.
Uptake of CuDI6 at 10.6 MPa and 308 K on different substrates; experimental data taken from [61].
Freundlich and Langmuir’s parameters were obtained using nonlinear regression to the experimental data, and the parameters received are reported in Table 10. In the case of CA and SA, the best fit was received when the Langmuir model was used, while for RFA, the Freundlich model gives the best result. From the qm·kL values, we can infer that the CuDI6 affinity towards the different substrates increases in the following order: SA (0.315) < RFA (0.366) < CA (0.702). This is in accordance with the experimental results depicted in Figure 13. Furthermore, from these results, we infer that the uptake of the hydrophobic substrate (CA) is higher than that of the intermediate (RFA) and that of the hydrophilic (SA). Obviously, the adsorption capacity or the precursor uptake is strongly influenced by the hydrophobicity of the various substrates and therewith by the different surface chemistry of the three aerogels.
Additional results for the comparison between experimental and calculated adsorption data on different substrates for Rh(acac)3 at 15 MPa and 313 K, 333 K and 353 K [62], for RuCp2 at 11, 14, and 17 MPa and 333 K [64] and for Pt(cod)me2 at 10.6/10.7 MPa and 308 K [10,58] are depicted in Appendix C, Figure A10, Figure A11, Figure A12, Figure A13, Figure A14, Figure A15 and Figure A16 and Table A10, Table A11, Table A12, Table A13, Table A14, Table A15 and Table A16.

Table 10.
Adsorption isotherm parameters for CuDI6 from scCO2 solution at 10.6 MPa and 308 K on different substrates [61].
Table 10.
Adsorption isotherm parameters for CuDI6 from scCO2 solution at 10.6 MPa and 308 K on different substrates [61].
| Equation | Parameter | Unit | CA | RFA | SA |
|---|---|---|---|---|---|
| Freundlich | kF | m3·kg−1 | 0.48303 | 0.32565 | 0.19427 |
| nF | — | 0.43875 | 0.56222 | 0.35535 | |
| R2 | — | 0.96593 | 0.98164 | 0.90195 | |
| Langmuir | qm | mol·kg−1 | 1.32029 | 1.48445 | 0.45510 |
| kL | m3·mol−1 | 0.53138 | 0.24626 | 0.69156 | |
| R2 | — | 0.99033 | 0.97634 | 0.92557 |
In summary, it can be stated that reliable results from systematic investigations about the influence of the substrate surface characteristics (hydrophobic or hydrophilic) and the pore properties (size and volume) on the precursor uptake capacity are rare.
3.3.5. Effect of Precursor Properties
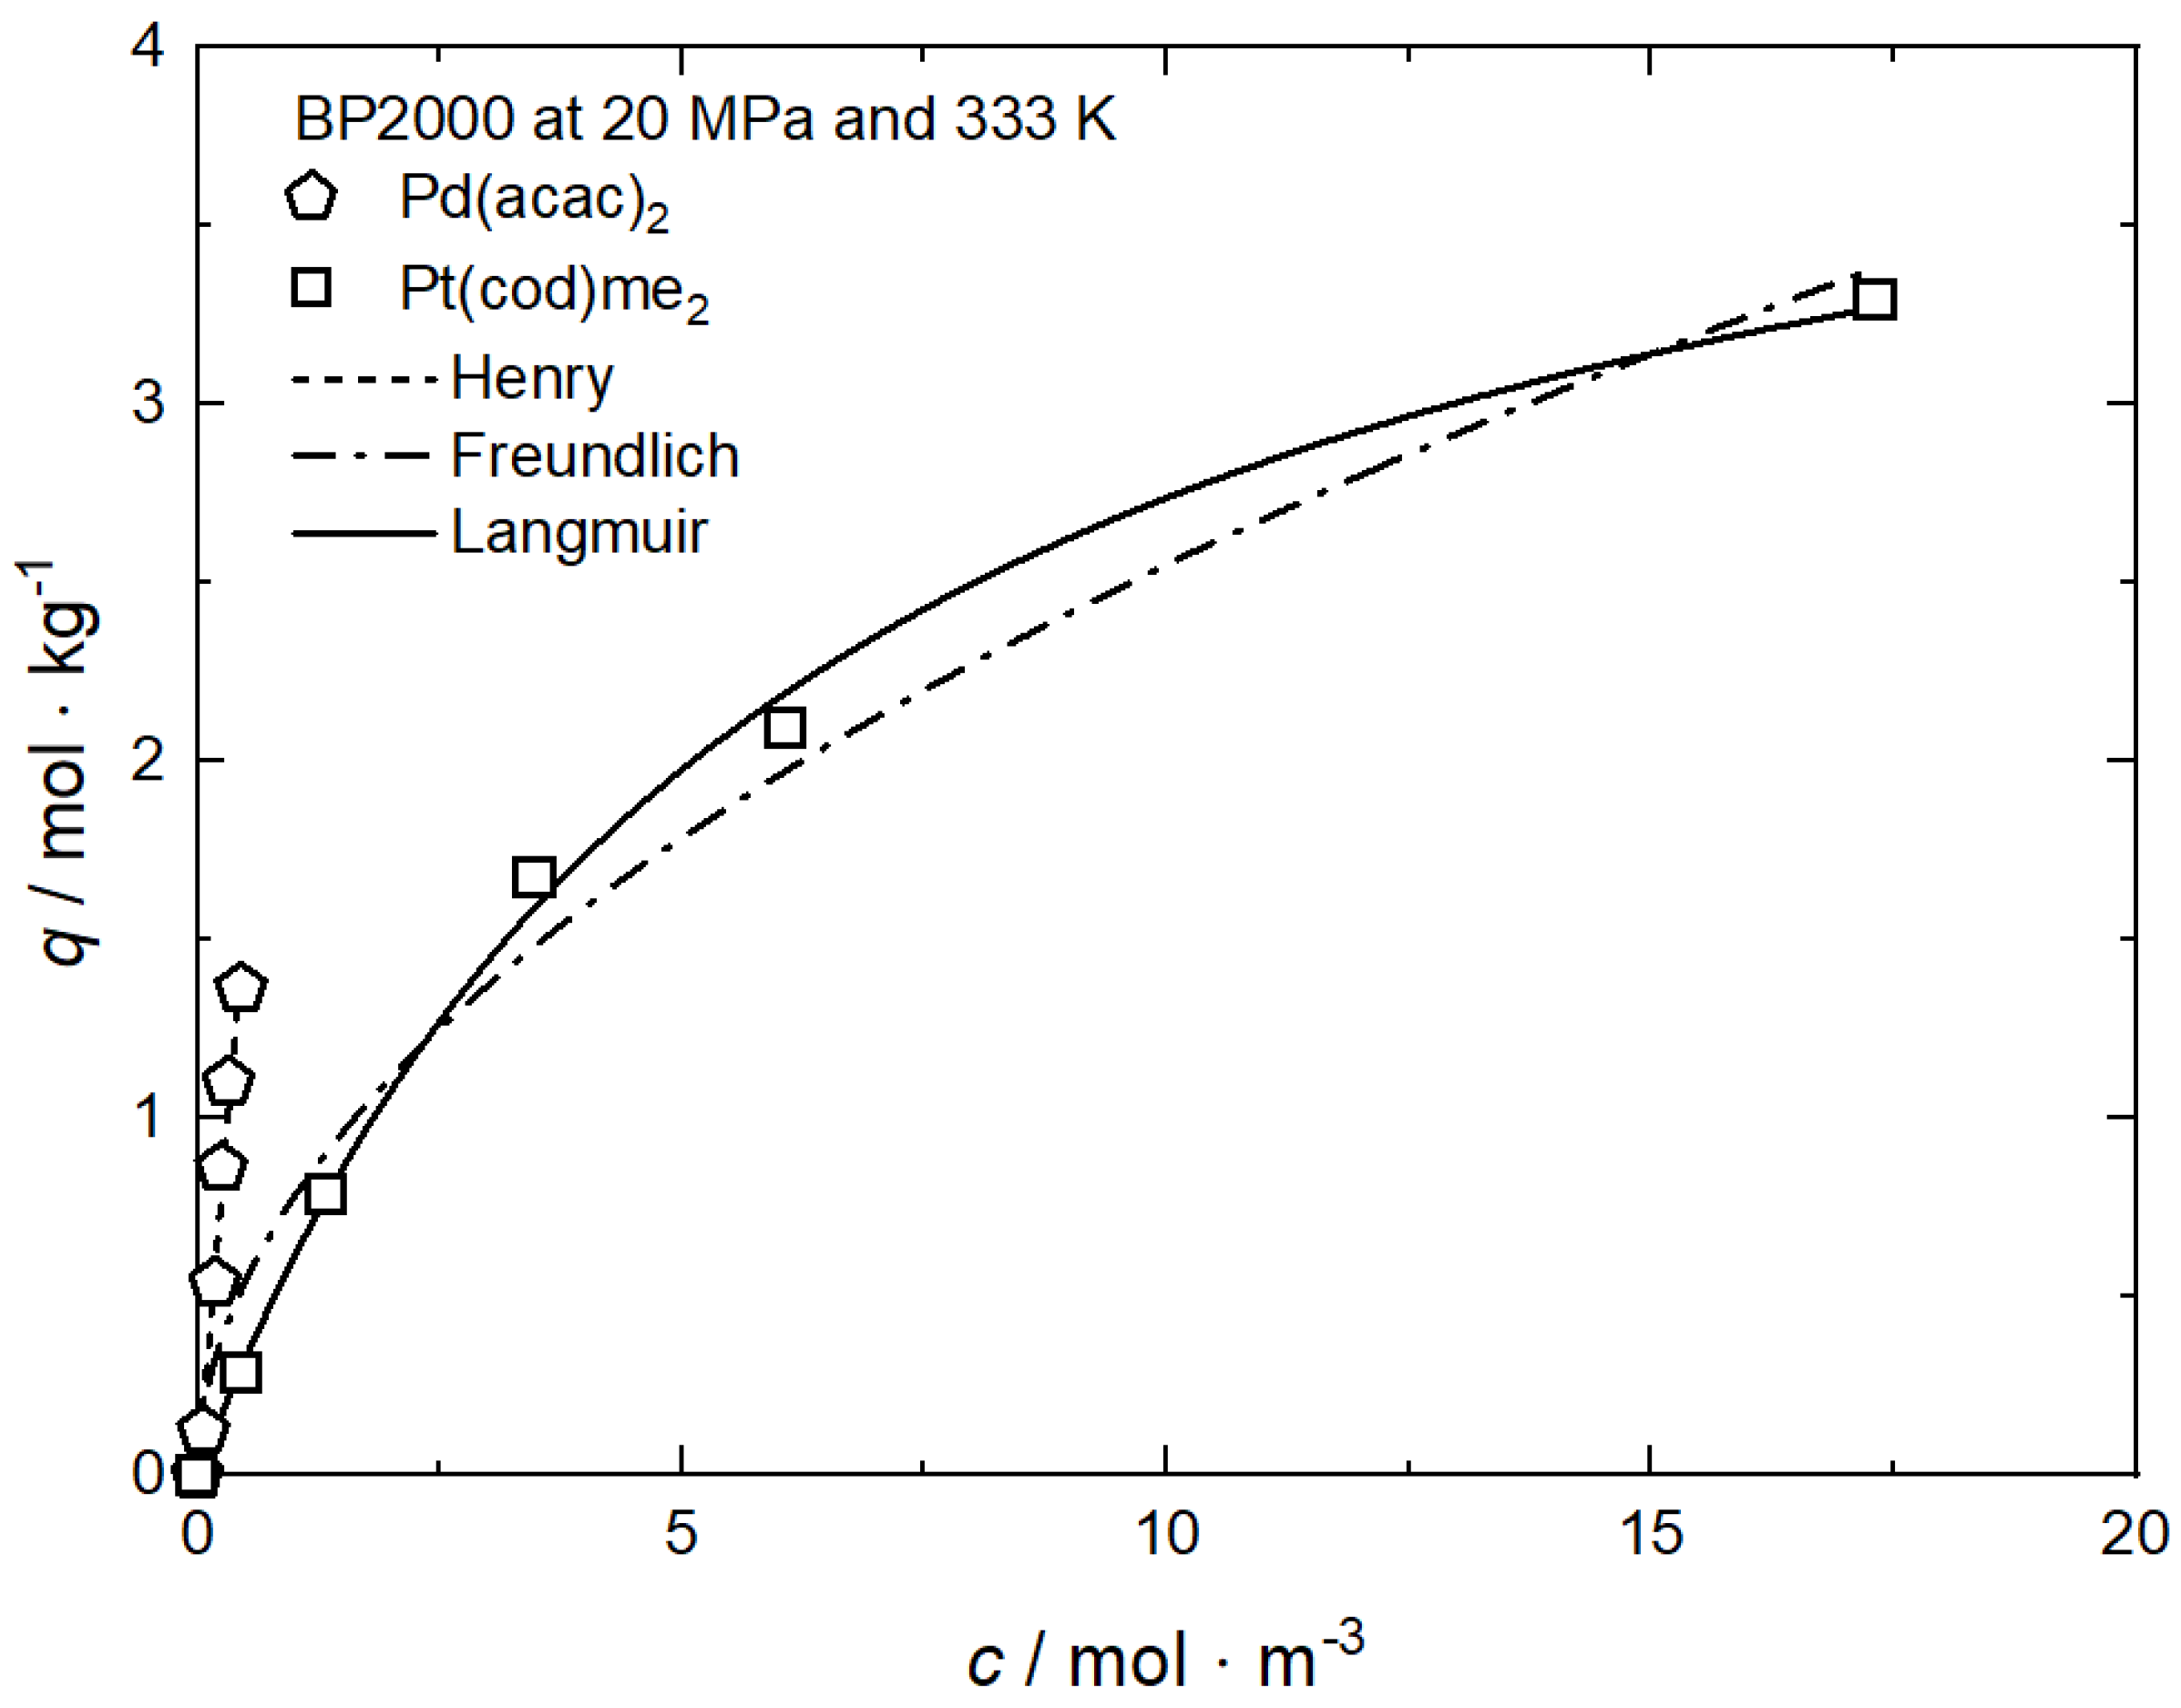
The uptake curves of Pd(acac)2 and Pt(cod)me2 on BP2000 at 20 MPa and 333 K are depicted in Figure 14 [8] and the values for the individual constants of the used adsorption models are summarized in Table 11. It is obvious that there are significant differences between the two isotherms. The adsorption isotherm for Pt(cod)me2 system is nonlinear while the isotherm for Pd(acac)2 is linear. Such linear behavior is typical for precursors with a low scCO2 solubility (y2 < 10−4 mol·mol−1) and can be described accurately by the Henry approach (cf. Equation (4)). Furthermore, these results demonstrate that the same precursor uptake requires a higher amount of Pt(cod)me2 in CO2 than of Pd(acac)2 in CO2. In other words, at precursor concentrations below 0.5 mol·m−3, the uptake of Pd(acac)2 on BP2000 is higher than the uptake of Pt(cod)me2 at the same precursor concentration in scCO2 and indicative of a stronger precursor/substrate interaction for Pd(acac)2/BP2000 than for Pt(cod)me2/BP2000. Since the solubility of Pt(cod)me2 in scCO2 is about forty times higher than the solubility of Pd(acac)2 scCO2 (cf. Figure 3), the concentration range of Pd(acac)2 in the CO2 phase is significantly shortened compared to Pt(cod)me2. Thus, this different behavior is most probably caused by the substantially higher concentrations of Pt(cod)me2 in the scCO2 phase than of Pd(acac)2.

Figure 14.
Uptake of different precursors on BP2000 at 20 MPa and 333 K; experimental data taken from [8].

Table 11.
Adsorption isotherm parameters for different precursors from scCO2 solution on BP2000 at 20 MPa and 333 K [8].
Additional results for the comparison between experimental and calculated adsorption data with different precursors at 10.6 MPa and 308 K on CA [58], at 27.6/27.7 MPa and 353 K on CA4 [37,53], and on CA22 [37,63], and at 15 MPa and 313, 333 and 353 K on MCM-41 [60,62] are depicted in Appendix D, Figure A17, Figure A18, Figure A19 and Figure A20 and Table A17, Table A18, Table A19 and Table A20 and in Appendix E, Figure A21 and Figure A22 and Table A21 and Table A22.
3.3.6. Interim Statement
As mentioned in the introduction, such results as those shown in Figure 6, Figure 7, Figure 8, Figure 9, Figure 10, Figure 11, Figure 12, Figure 13 and Figure 14 and Appendix A, Appendix B, Appendix C, Appendix D and Appendix E are of great technical importance for the synthesis of supported noble metal catalysts because they allow the precise control of the desired metal content via SFRD. Thus, from an engineer’s point of view, it should be possible to answer the following question “Which precursor concentration in scCO2 is necessary to obtain the desired noble metal loading (e.g., 1 wt% Pd or Pt on BP2000)?”. This question could be answered by assuming that
- The adsorbed amount of either Pd(acac)2 or Pt(cod)me2 is completely reduced to its metal form.
- The organic ligands are completely hydrogenated.
- The hydrogenated ligands are completely miscible with scCO2 and form a single homogeneous phase.
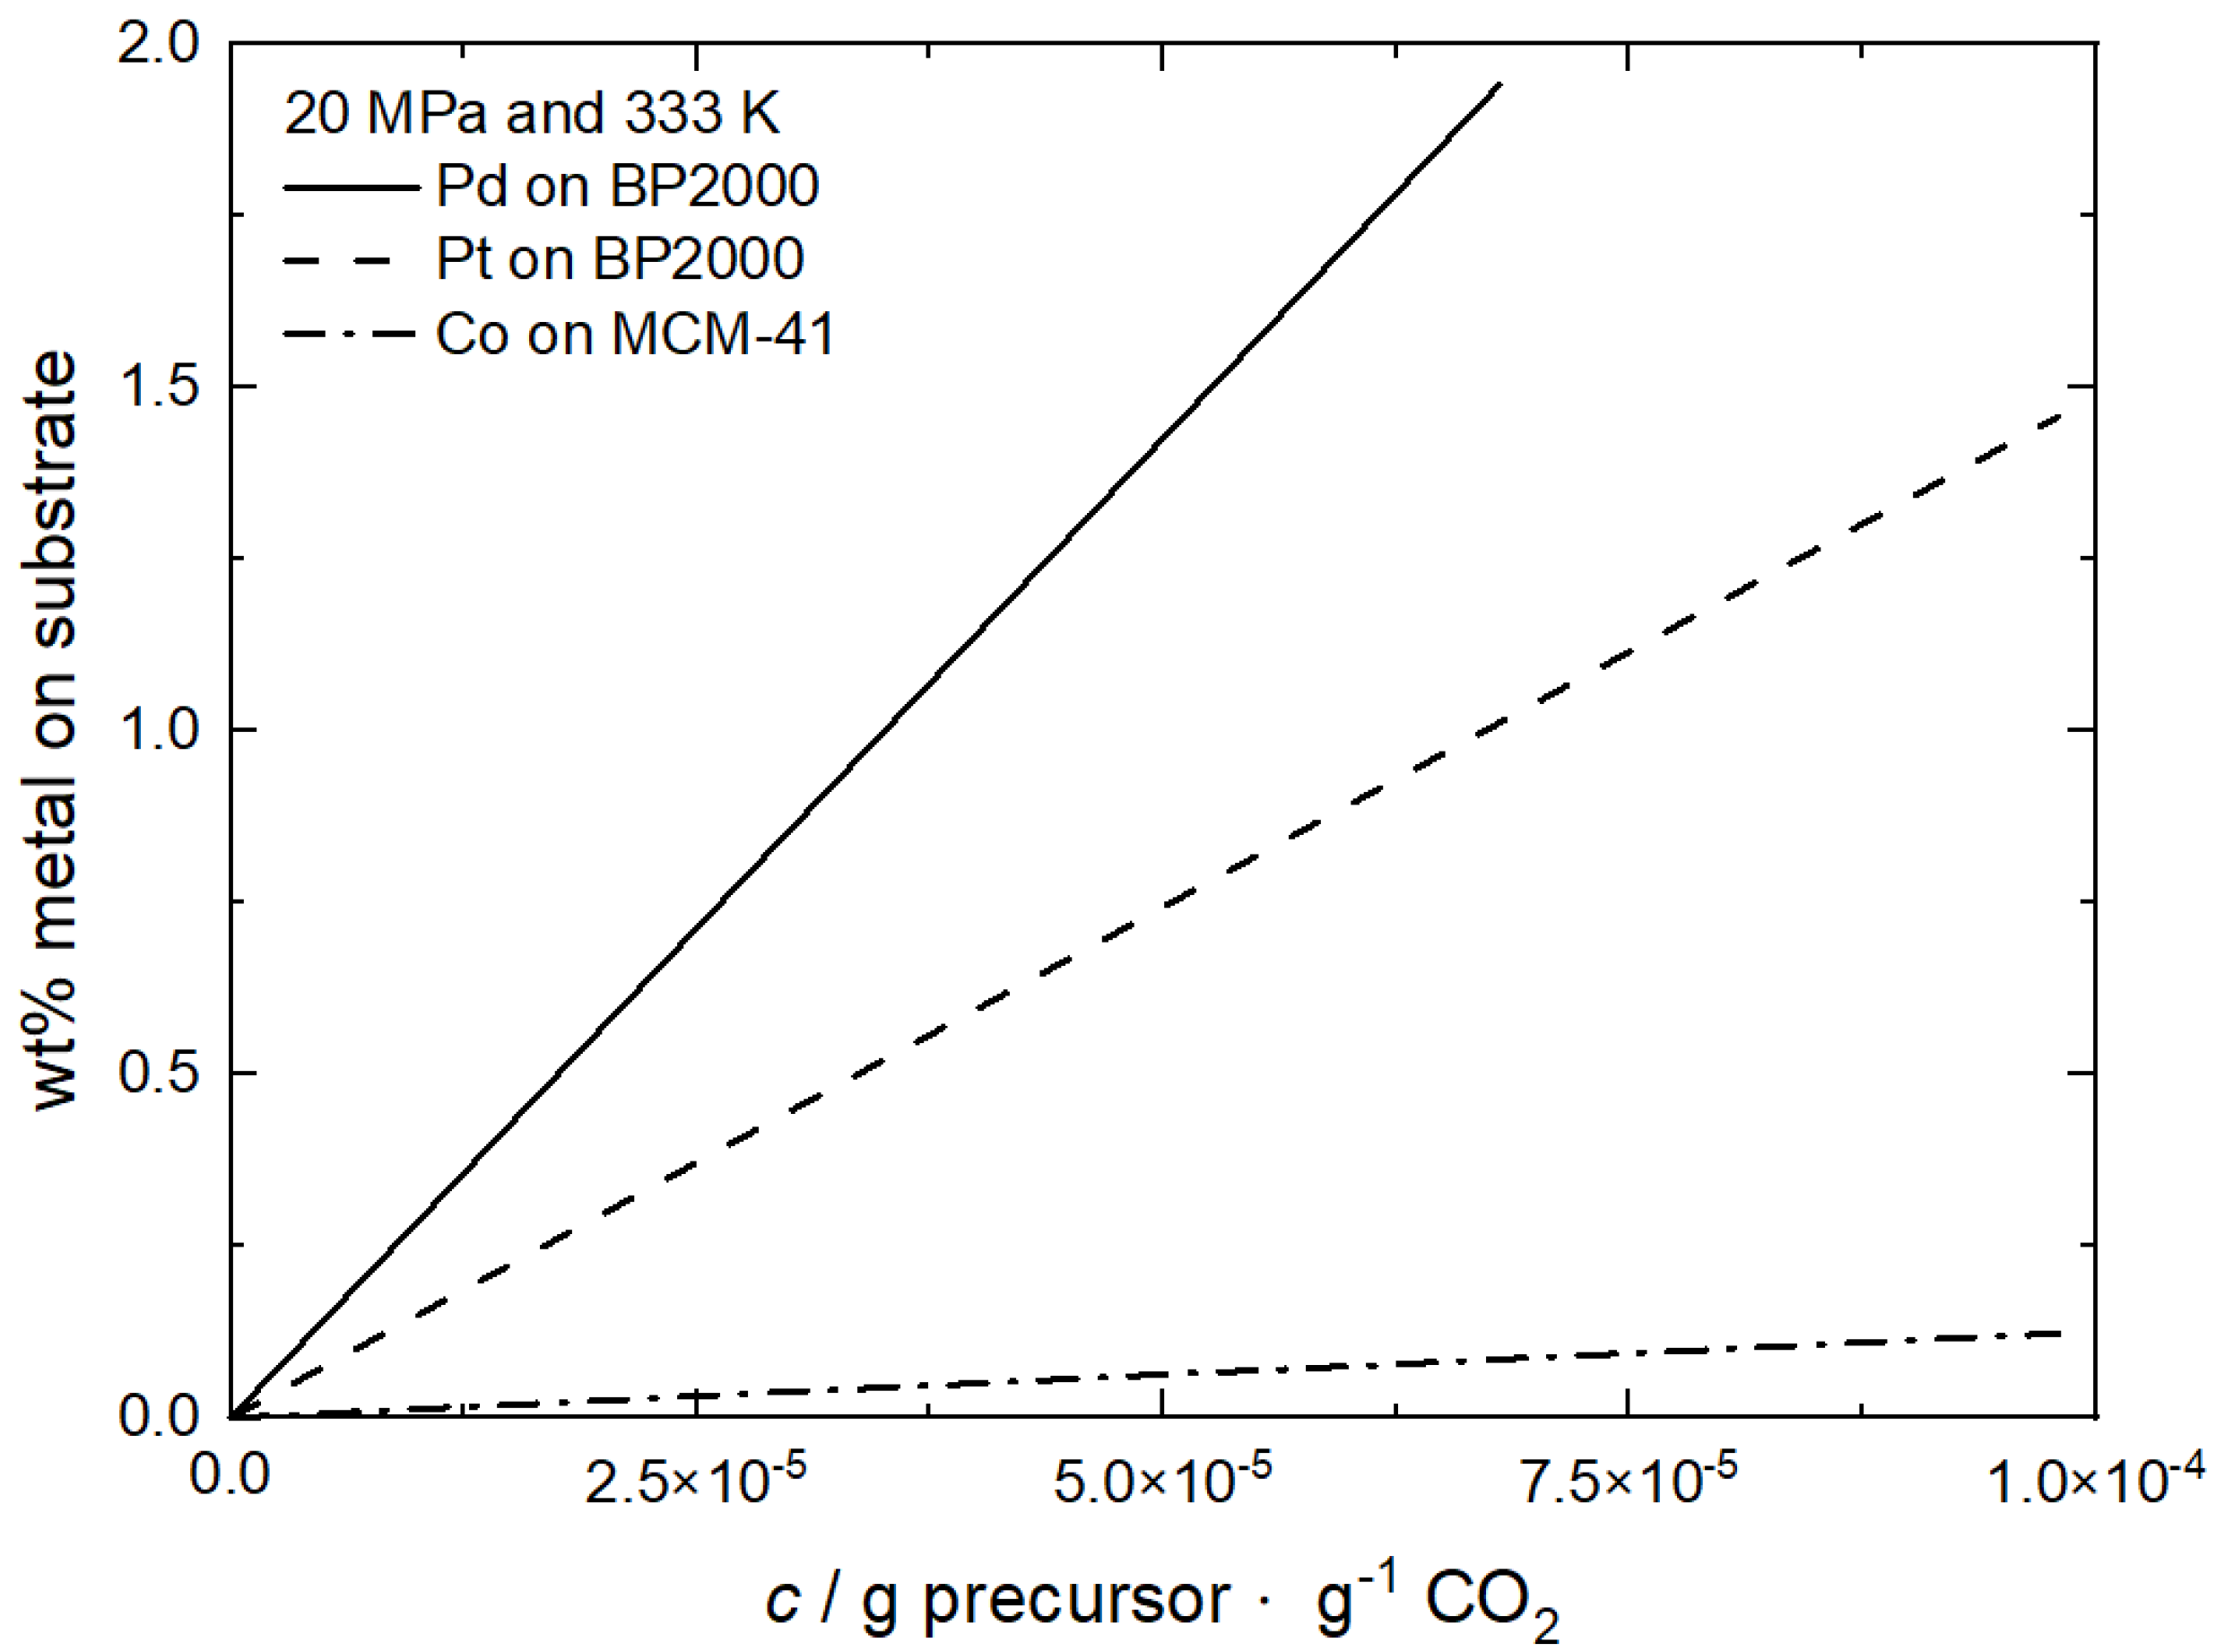
As can be seen from Figure 15, the metal loading increases always monotonically with the precursor concentration in the CO2 phase and the synthesis of a catalyst with 1 wt% Pd or Pt loading requires a Pd(acac)2 concentration of 4·10−5 g·g−1 CO2 and a Pt(cod)me2 concentration of 7·10−5 g·g−1 CO2 prior to the reduction process. On the other hand, Figure 15 shows that a Co loading not higher than 0.13 wt% at a precursor concentration of 1·10−4 g·g−1 can be achieved, which is too low for technical applications.

Figure 15.
Pd and Pt loading on BP2000 and Co loading on MCM-41 at 20 MPa and 333 K; data taken from [8,60]. For reasons of clarity, only the linear regressions are depicted.
With regard to applications in the fields of catalysis and gas sensing and the question of which metal content can be achieved with a given precursor and substrate, the following observations can be made:
Based on the experimental data considered and the given process conditions (cf. Table 4), the following findings are discussed below and summarized in Table 12. Extremely high Pt loadings up to 50 wt% on CA22 and 27 wt% on CA4 can be achieved. Similar high Ag loadings up to 25 wt% and significantly lower Ru loadings up to 1.5 wt% and Co loadings lower than 0.5 wt% were obtained. Furthermore, a considerable influence of the substrate on metal loading is observed for both Pt and Ru. In the case of CA21, a Ru loading up to 1.5, and for CA4 up to 0.5 wt%, was achieved. It is worth noticing that in the case of the different Ru precursors used (Ru(acac)3, Ru(cod)(tmhd)2, and RuCp2), no significant influence of the ligands on the metal loading was observed. Independent from the precursor used, Ru loadings in the range from 0.5 up to 1.5 wt% were obtained. In opposition thereto, using Pd(acac)2 results in a Pd loading up to 5 wt%, while Pd(hfac)2 leads to a lower Pd loading up to 1.2 wt%. The results of further adsorption experiments show that for Ni and Rh, similar metal loadings up to 1.5 wt% resp. 1.2 wt% were achieved, while lower Cu loadings up to 0.7 wt% were also achieved.

Table 12.
Metal loadings on different substrates obtained from the adsorption experiments listed in Table 4.
For catalytic applications, e.g., CO or NO oxidation, typical Pt and Pd loadings are in the range of 1 to 2 wt% [67,68] while Pt based catalysts used for polymer electrolyte membrane fuel cells have high Pt loadings (up to 46.5 wt% Pt) due to the slow kinetics of the oxygen reduction reaction [6]. Thus, for such applications the adsorption data available in literature enable the selection of the ideal process parameters.
In case of another important catalytic reaction, the Fischer-Tropsch synthesis, a Co loading of 5 wt% is the rule [69]. Obviously, the available adsorption equilibria data are far outside the range that is important for application since it is limited to Co loadings lower than 0.5 wt% (cf. Table 12). Among others, such loadings are caused by the low solubility of Co(acac)3 in CO2 (<10−4) [21]. However, such a low solubility can be significantly improved by the addition of an adequate amount of co-solvent such as methanol.
Carbon nanotubes supported with PtRu, PtCu, PtAu, PtPd and PtNi were used for methanol electro oxidation reaction [70]. Lin et al. showed that bimetallic PtRu (Pt 4.1 wt%; Ru 2.3 wt%) electrocatalysts show an exhibited higher activity than that of the pure Pt catalyst [71]. Applying carbon supported nanoparticles of Pt with non-noble transition metals, such as Cu, Ni, Fe and Co showed an increased oxygen reduction reaction activity and reduces significantly the costs of these catalysts [72]. Thus, the examples presented above show that there is an enormous need for reliable experimental adsorption data for the pure non-noble metals as well as for the respective binary systems.
3.4. Summary Modeling Results
From an engineering point of view, an adequate thermodynamic model for the representation of experimental adsorption isotherms with sufficient accuracy is essential for the precise design and optimization of supercritical adsorption processes.
Therefore, in this work, beside the one-parameter Henry model, the Langmuir and Freundlich model as two-parameter adsorption isotherms are used. The Langmuir isotherm can be applied to monolayer adsorption on homogeneous sites, whereas the Freundlich isotherm enables the description of multilayer adsorption on heterogeneous sites. In selected cases, two more complex adsorption models such as Toth and Langmuir-Freundlich which involve three parameters are used for the description of adsorption isotherms. One should consider, that from a mathematical perspective, applying the Toth and Langmuir-Freundlich equations require a higher number of experimental data compared to the Henry, Freundlich and Langmuir equation.
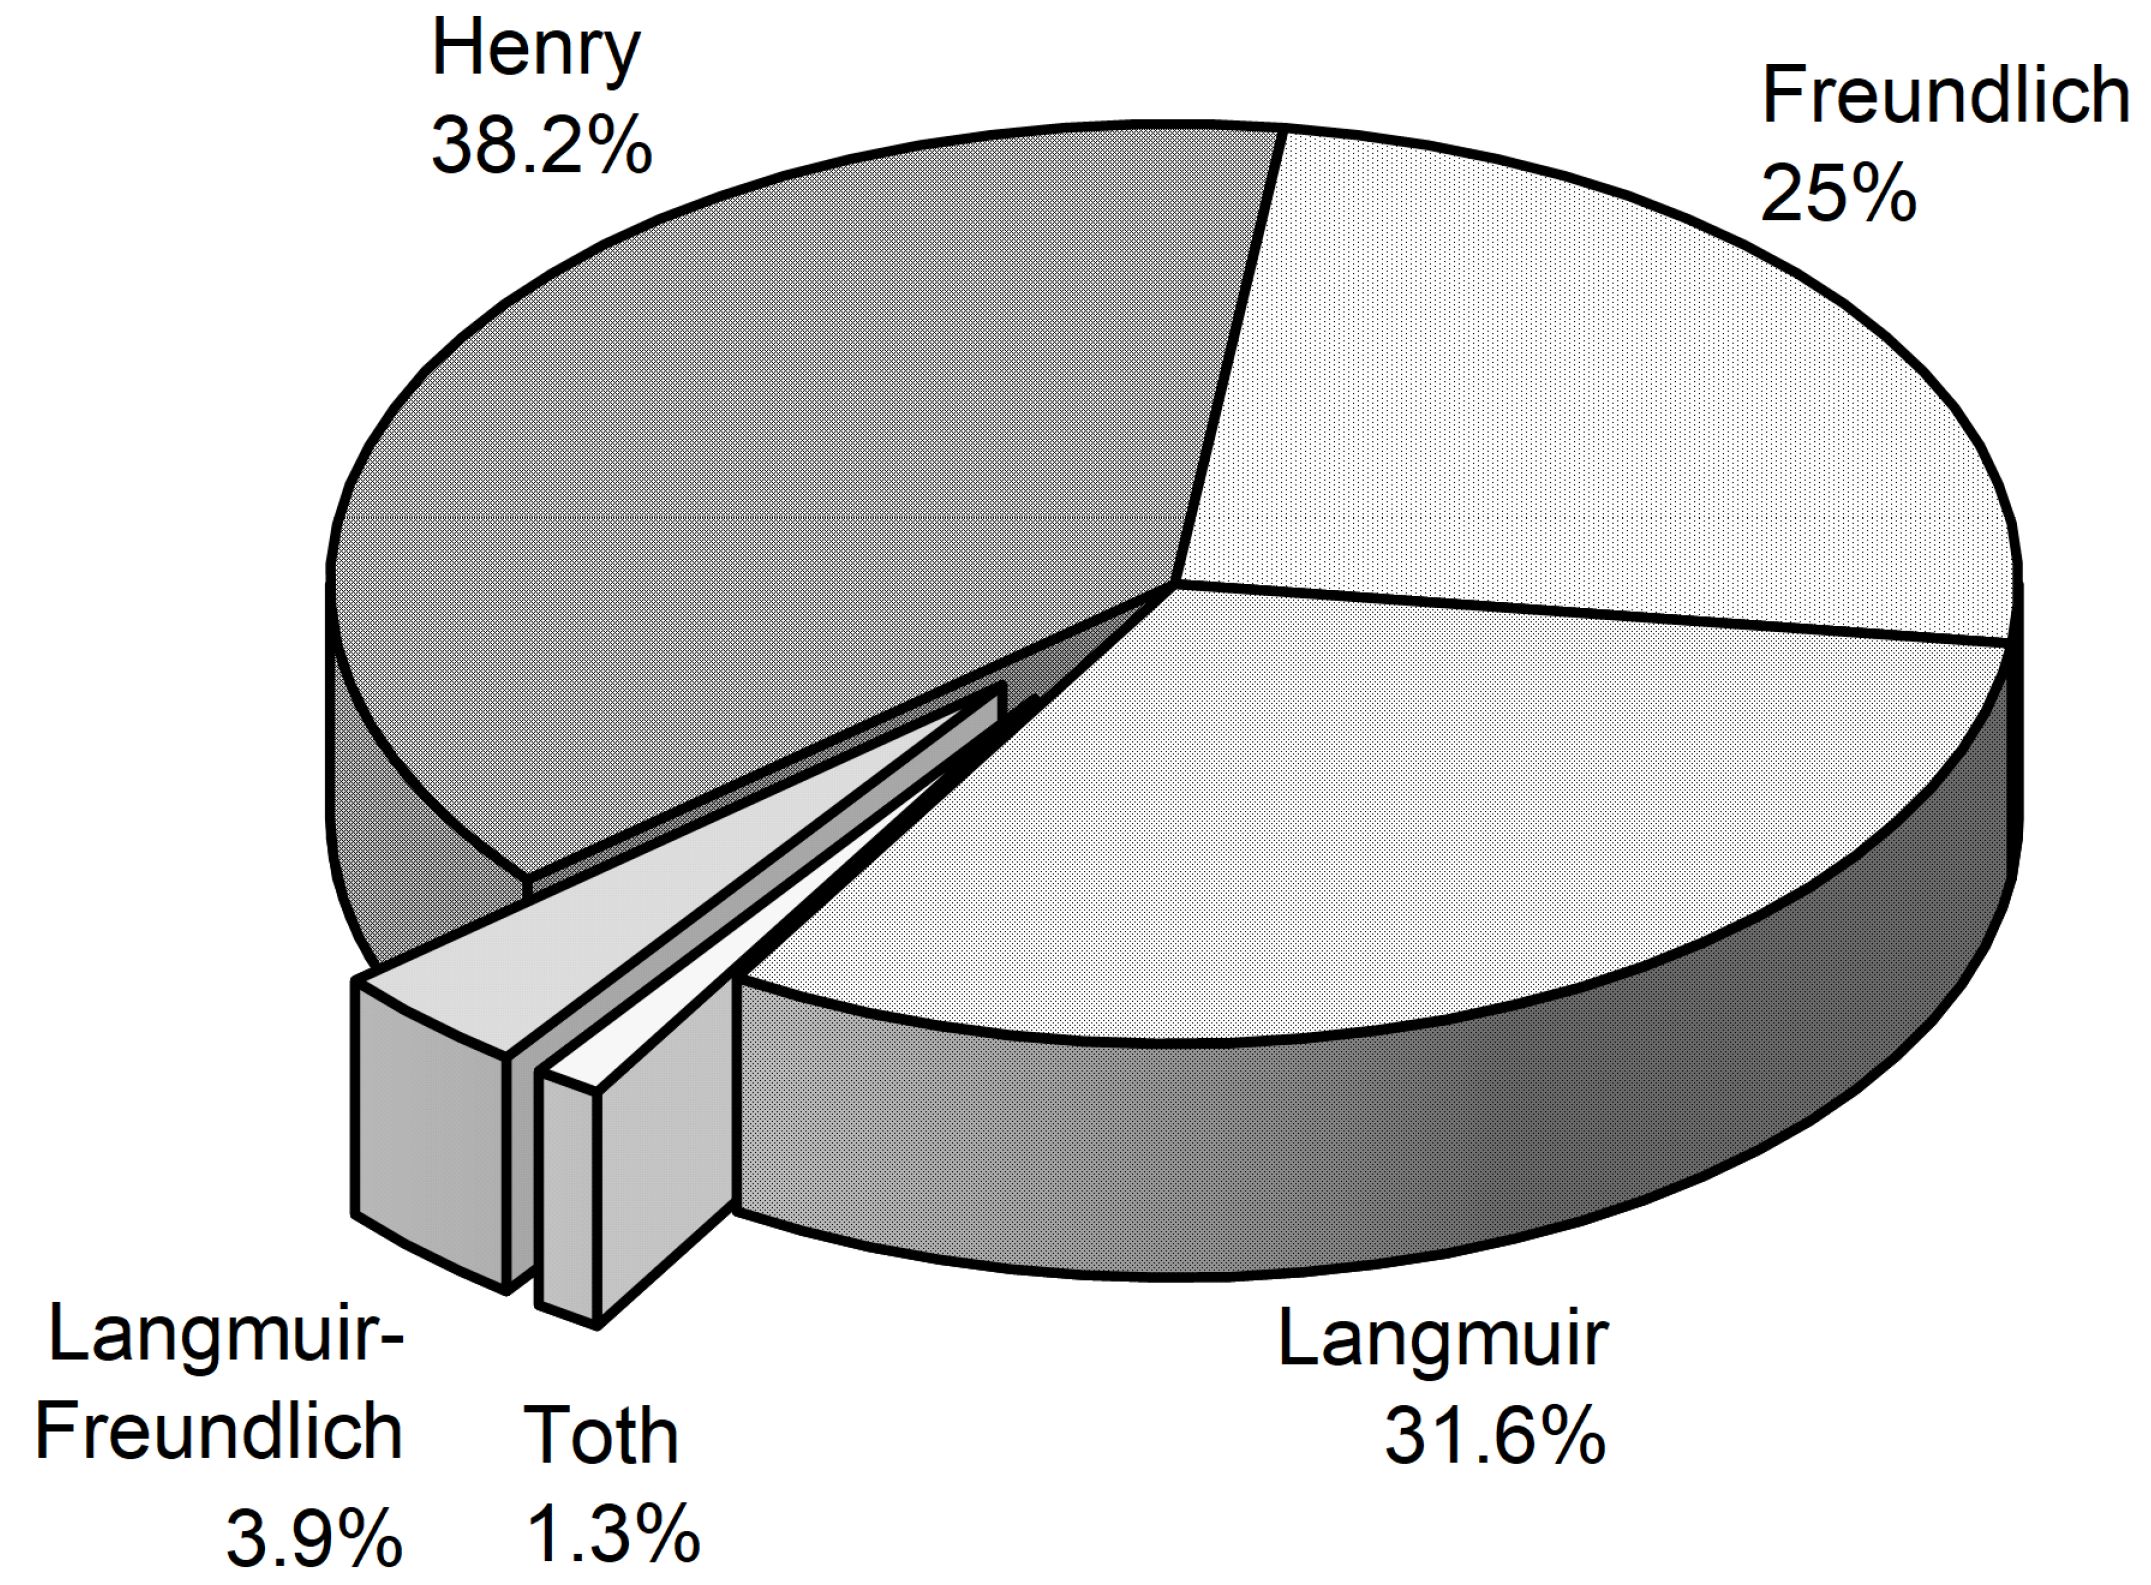
Based on the R2 values listed in Table 2, Table 3, Table 5, Table 6, Table 7, Table 8, Table 9, Table 10 and Table 11 and Table A1, Table A2, Table A3, Table A4, Table A5, Table A6, Table A7, Table A8, Table A9, Table A10, Table A11, Table A12, Table A13, Table A14, Table A15, Table A16, Table A17, Table A18, Table A19, Table A20, Table A21 and Table A22, the model that provides the best fit to the experimental adsorption data for each system was determined and the result is represented graphically in Figure 16. Thereby the percentage represents the share of the best fit in relation to the total number of adsorption isotherms considered in this review. Obviously, the simple Henry model allows the best description of the experimental data for most of the systems studied (38%), followed by the Langmuir model with a similar amount of 32%. A share of 25% was determined for the Freundlich model, while the two three-parameter models Langmuir-Freundlich (3.9%) and Toth (1.3%) are of minor importance. From Figure 16 follows that the Freundlich isotherm can be successfully applied to systems consisting of precursors on various substrates with different surface and pore properties. However, the model is only useful for limited solute concentrations and temperature ranges (e.g., see Ref. [7]).

Figure 16.
Percentage of the models which gave the best fit to the experimental adsorption data.
The reason that the results of the majority of adsorption studies can be described with sufficient accuracy with the Henry approach is due to the fact that these precursors show a very low solubility in CO2. At 16 MPa and 333 K, the solubility of Pd(acac)2, which shows the typical Henry behavior, is 2·10−5 mol·mol−1 [20] and for Co(acac)3 3·10−5 mol·mol−1 [21]. In contrast thereto, at these conditions the solubility of Ru(cod)(tmhd)2 and of Pt(cod)me2, which show the typical Langmuir-like behavior, is 7·10−4 mol·mol−1 [52] and 8·10−4 mol·mol−1 [19], and are thus about a factor of 40 higher than for Pd(acac)2. Nevertheless, in summary, most of the available experimental data (56.6%) have been successfully described with the common two-parameter models Freundlich and Langmuir.
4. Knowledge Gaps and Needs
The determination of the best process conditions for the synthesis of supported metal NPs via the SFRD process requires detailed knowledge of the strength of the intermolecular interaction between CO2 ⟷ CO2, precursor ⟷ precursor, CO2 ⟷ precursor, CO2 ⟷ substrate, precursor ⟷ substrate as well as the competitive adsorption of CO2 and the precursor onto the surface of the substrate under certain process conditions. The following considerations show that the results of pure CO2 adsorption experiments combined with results from precursor uptakes received from SFRD experiments enable a first rough estimation of the strength of the interaction forces.
Former results of SFRD experiments, which were performed at 15.5 MPa, 353 K, and 𝜌 = 473 kg·m−3, showed that a Pt(cod)me2 uptake of 0.57 mmol·g−1 on MCM-41 is attained [73]. From the results depicted in Figure 5, it follows that a CO2 uptake of 13 mmol·g−1 on MCM-41 is attained. Thus, the adsorbed amount of CO2 on a molar basis is 22 times higher than that of Pt(cod)me2 on MCM-41. A similar result has been reported by Tenorio et al. for Pd(hfac)2 on SBA-15 [9]. These findings indicate that for such systems, the intermolecular interaction between CO2 and the substrate surface is stronger than between the precursor and the substrate’s surface. Thus, the solubility of the respective precursor in CO2 and therewith the intermolecular interaction between the precursor and CO2 molecules is one key parameter that controls the precursor uptake. With regard to economic aspects, a broader knowledge of the ligand’s influence on the solubility in CO2 is important since the mass ratios between the ligands and the pure metal determine the precursor’s metal content [2]. Therefore, knowledge of both the solubility of the precursor in CO2 and the adsorption behavior of the precursor on the substrate is essential for the determination of the best process conditions. However, it must be considered that these conclusions are based on results obtained from the binary system’s CO2/precursor and CO2/substrate. Thus, it must be taken into account that in the ternary system CO2/precursor/substrate, the CO2 uptake could be lower than in the binary system CO2/substrate since precursor molecules might occupy binding sites.
In addition, systematic studies on the influence of substrates with different surface characteristics and pore properties on the adsorption behavior of precursor and CO2 are barely available in the literature. Thus, to answer the question “Is there a competition between CO2 and precursor adsorption on the surface of the substrate material?”, additional experimental studies and theoretical investigations of the adsorption equilibria of precursors on substrates from scCO2 have to be carried out. In addition to this, it has to be identified if there are preferred interaction sites at the surface of the substrate for the adsorption of the precursor and/or CO2.
Since adsorption isotherm data for two (or more) precursors from scCO2 solutions on substrates are extremely rare, there is a need for intensive experimental and theoretical studies on both the thermodynamics and the kinetics of the adsorption behavior. Note that studies on the kinetics of adsorption of precursors on porous substrates and surfaces from supercritical solutions are very rare. Thus, investigations of the adsorption kinetics are crucial for determining whether the system has reached adsorption equilibrium or not.
Last but not least, molecular modeling could also be very beneficial for understanding the CO2/precursor/substrate interactions.
5. Conclusions
This review summarizes available equilibrium adsorption isotherm data of precursors from scCO2 solution on substrates and the corresponding process conditions, i.e., pressure, temperature, and density. Such an isotherm reflects the difference between the strength of interaction of the precursor to the substrate and to scCO2. A detailed analysis of the experimental results shows that the solubility of the precursors in scCO2 is one of the key parameters that control the precursor’s uptake. In addition, knowledge of the precursor adsorption behavior enables us to influence the size of the supported metal NPs, their size distribution, and their homogeneity and thus to control and tune the catalytic activity of these materials.
Based on the available experimental results, the influence of temperature and pressure on the precursor uptake can be summarized as follows: At an isothermal increase in pressure and therewith density, the solubility of the precursor in the CO2 phase increases, and therefore the uptake decreases. On the other hand, at a constant CO2 density, the uptake decreases with increasing temperature due to the higher precursor solubility in the CO2 phase. Note that a decrease in the uptake with temperature indicates that the adsorption under isochoric conditions is an exothermic process. On the contrary, if the experiments are conducted inside the retrograde region, in which the solubility of the precursor decreases with increasing temperature, the equilibrium uptake increases with increasing temperature at a fixed density or pressure, indicating endothermic behavior.
Fitting the experimental adsorption data with the appropriate adsorption isotherm model allows a deeper understanding of the adsorption behavior in such CO2/precursor/substrate systems and the design and optimization of the supercritical adsorption processes. The comparison between numerous experiments and different model-calculated adsorption isotherms shows that the two-parametric Langmuir model has similar high or only slightly lower correlation parameters when compared to the three-parametric models according to Toth and Langmuir–Freundlich. The Henry approach, which contains one parameter, was used if the adsorption isotherm shows a linear behavior but, of course, its application is limited to low solute concentrations.
For industrial applications such as catalysis and gas sensing, it is important to point out that reliable experimental data for the adsorption behavior of two (or more) precursors from scCO2 on a substrate are needed. This is also valid for the modeling of binary adsorption isotherm data. Furthermore, there is a need for improved and extended knowledge of the phase behavior, i.e., solubility, of precursors and their mixtures in scCO2 as well as the underlying thermodynamics and kinetics of single and binary adsorption behavior.
Author Contributions
M.T.: conceptualization, methodology, investigation, visualization, supervision, project administration, funding acquisition; M.C.: Software; M.T. and M.C.: validation, formal analysis, resources, data curation, writing—original draft preparation, writing—review and editing. All authors have read and agreed to the published version of the manuscript.
Funding
Funding by the Deutsche Forschungsgemeinschaft (DFG, German Research Foundation) Project ID 426888090-SFB 1441 (“TrackAct”) Project C1 is gratefully acknowledged.
Data Availability Statement
Not applicable.
Conflicts of Interest
The authors declare no conflict of interest.
Abbreviations
| acac | acetylacetonate |
| Cp | cyclopentadienyl |
| DI6 | bis(1,1,1,3,5,5,6,6,6-nonafluorohexane-2,4-diiminate) |
| hfac | hexafluoroacetylacetonate |
| cod | 1,5-cyclooctadiene |
| me | methyl |
| tmhd | 2,2,6,6-tetramethyl-3,5-heptanedionato |
| AC | activated carbon |
| BP | carbon black |
| CA | carbon aerogel |
| MCM, MSU-H, HMS, SBA | mesoporous silica |
| RFA | resorcinol–formaldehyde aerogel |
| SA | silica aerogel |
Appendix A. Comparison between Experimental and Calculated Data for Adsorption Isotherms: Pressure Influence

Figure A1.
Uptake of RuCp2 on MCM-48 at 333 K and different pressures; experimental data taken from [64].
Figure A1.
Uptake of RuCp2 on MCM-48 at 333 K and different pressures; experimental data taken from [64].
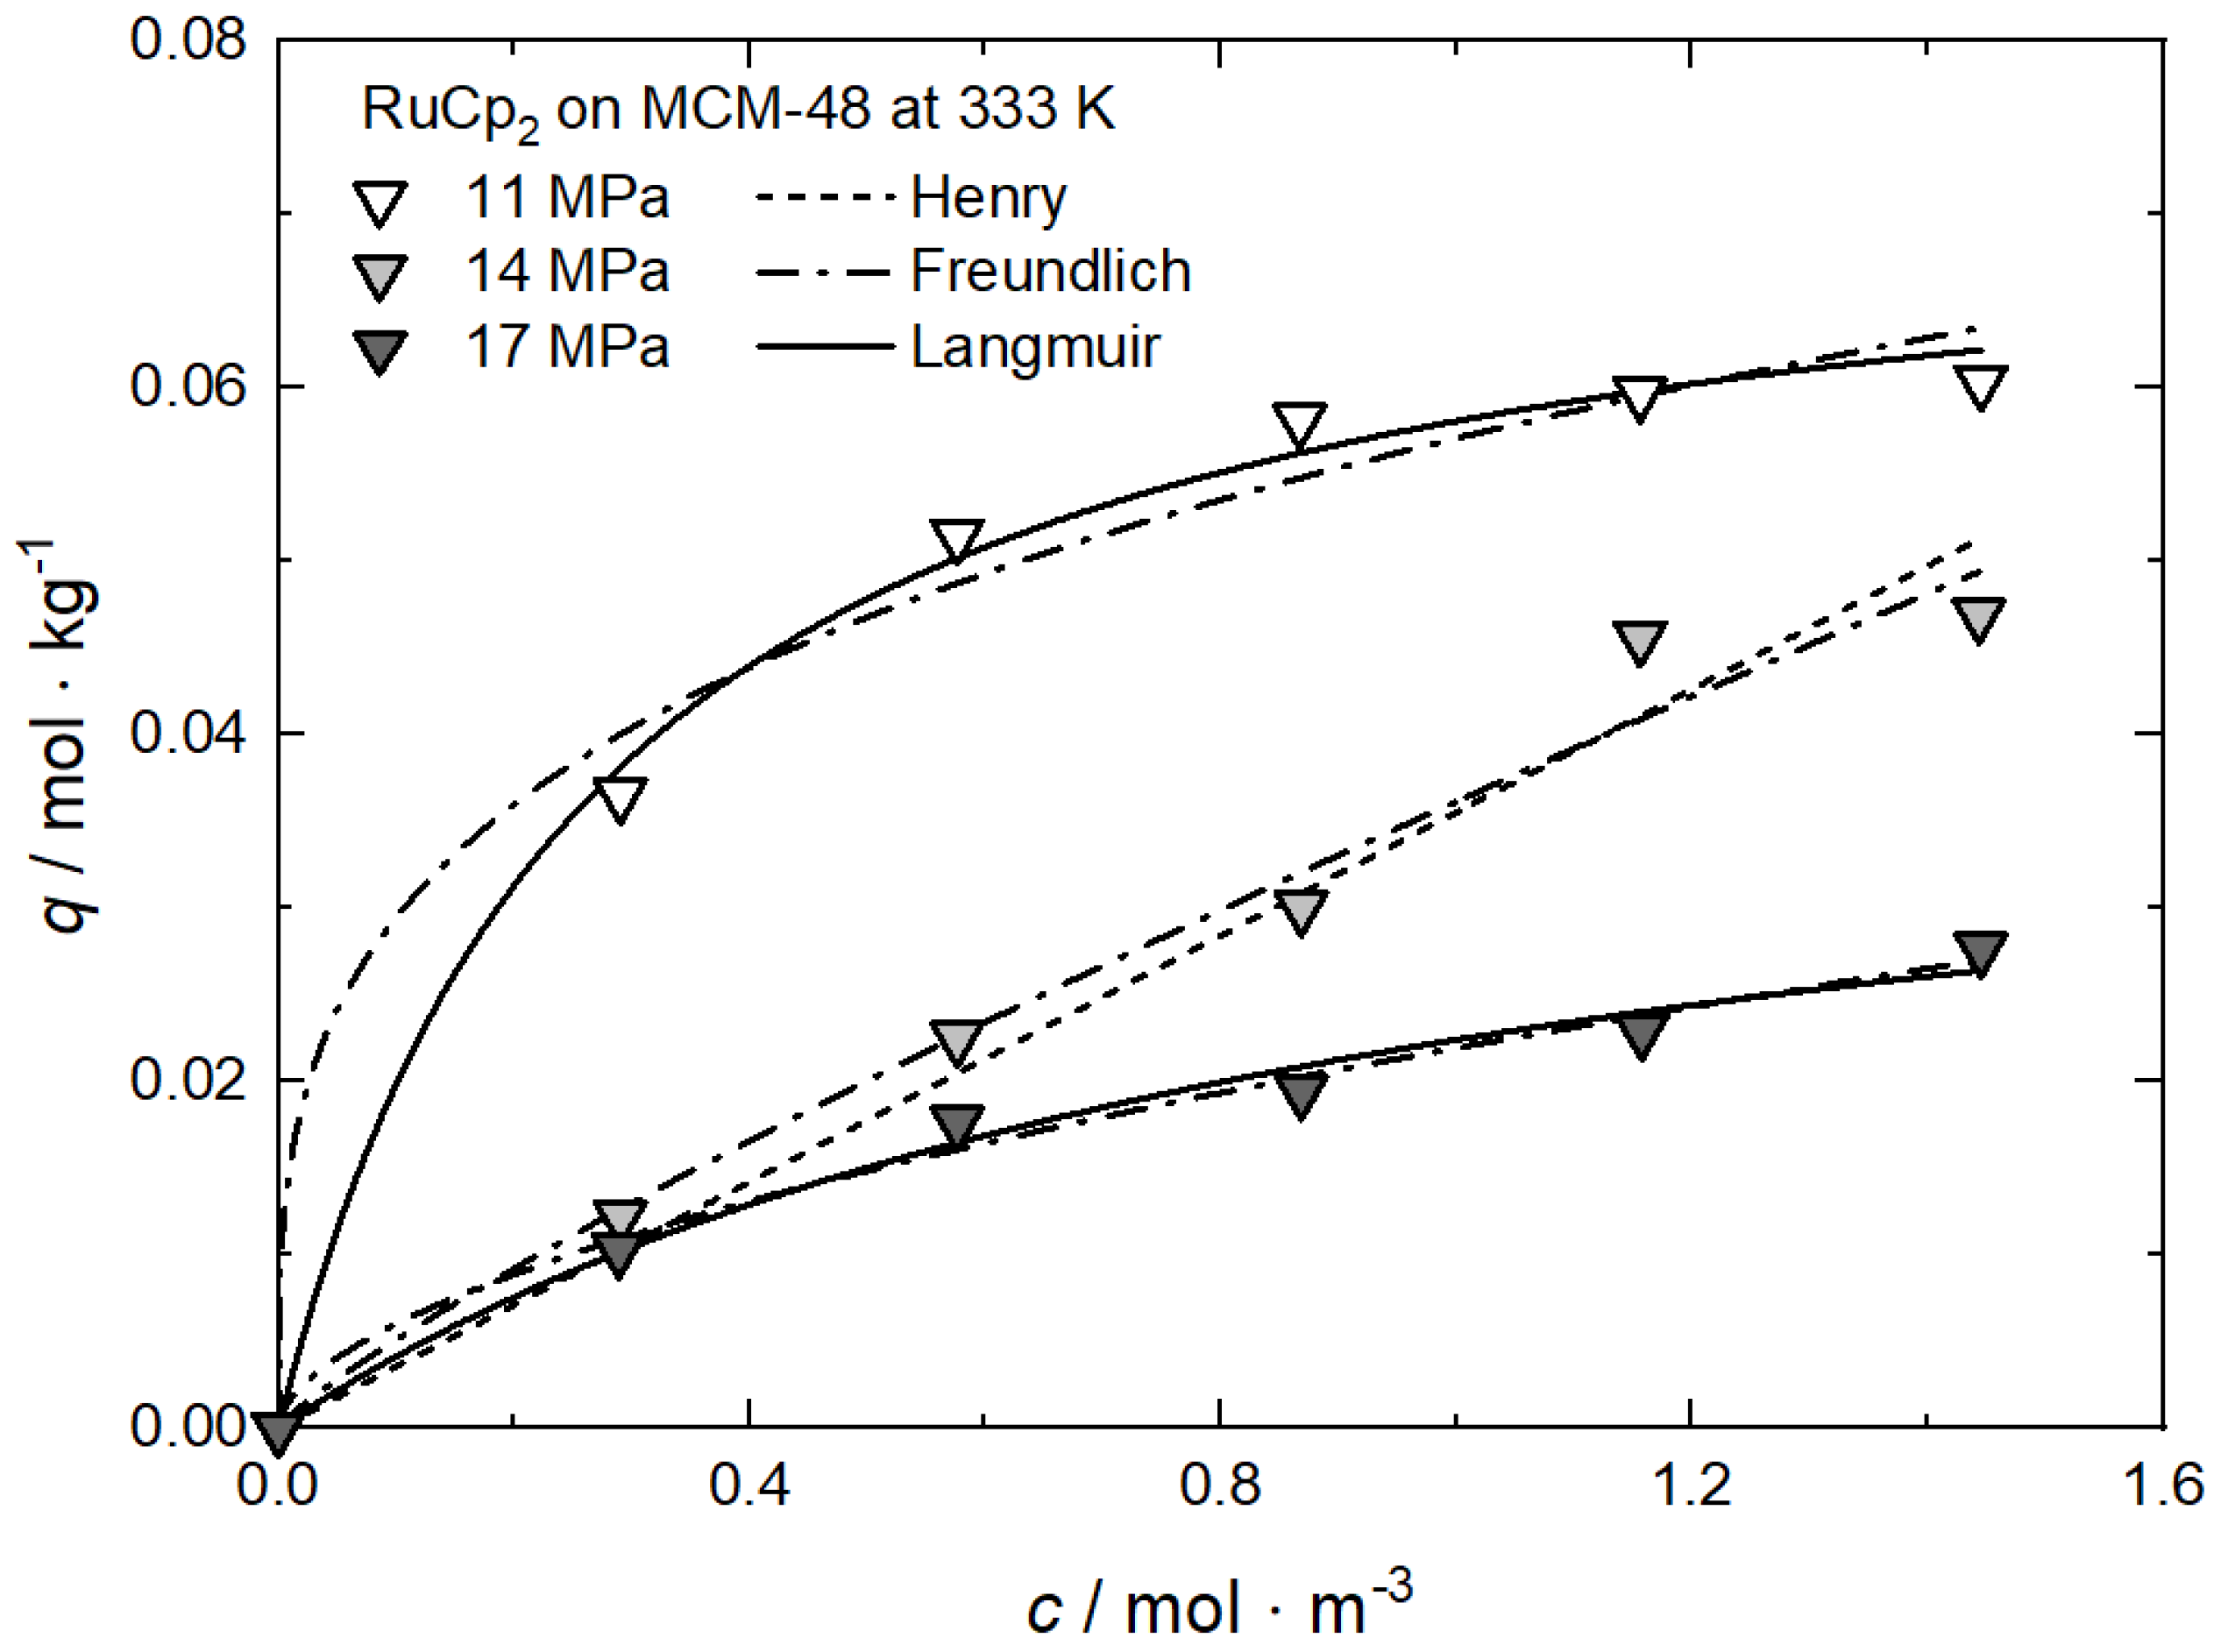

Table A1.
Adsorption isotherm parameters for RuCp2 from scCO2 on MCM-48 solution at 333 K and different pressures [64].
Table A1.
Adsorption isotherm parameters for RuCp2 from scCO2 on MCM-48 solution at 333 K and different pressures [64].
| Equation | Parameter | Unit | 11 MPa | 14 MPa | 17 MPa |
|---|---|---|---|---|---|
| Henry | kH | m3·kg−1 | — | 0.03552 | — |
| R2 | — | — | 0.97211 | — | |
| Freundlich | kF | m3·kg−1 | 0.05708 | 0.03614 | 0.02193 |
| nF | — | 0.28731 | 0.85081 | 0.56304 | |
| R2 | — | 0.98154 | 0.97637 | 0.98778 | |
| Langmuir | qm | mol·kg−1 | 0.07390 | — | 0.04400 |
| kL | m3·mol−1 | 3.66984 | — | 1.03703 | |
| R2 | — | 0.99487 | — | 0.98406 |

Figure A2.
Uptake of RuCp2 on AC at 333 K and different pressures; experimental data taken from [64].
Figure A2.
Uptake of RuCp2 on AC at 333 K and different pressures; experimental data taken from [64].
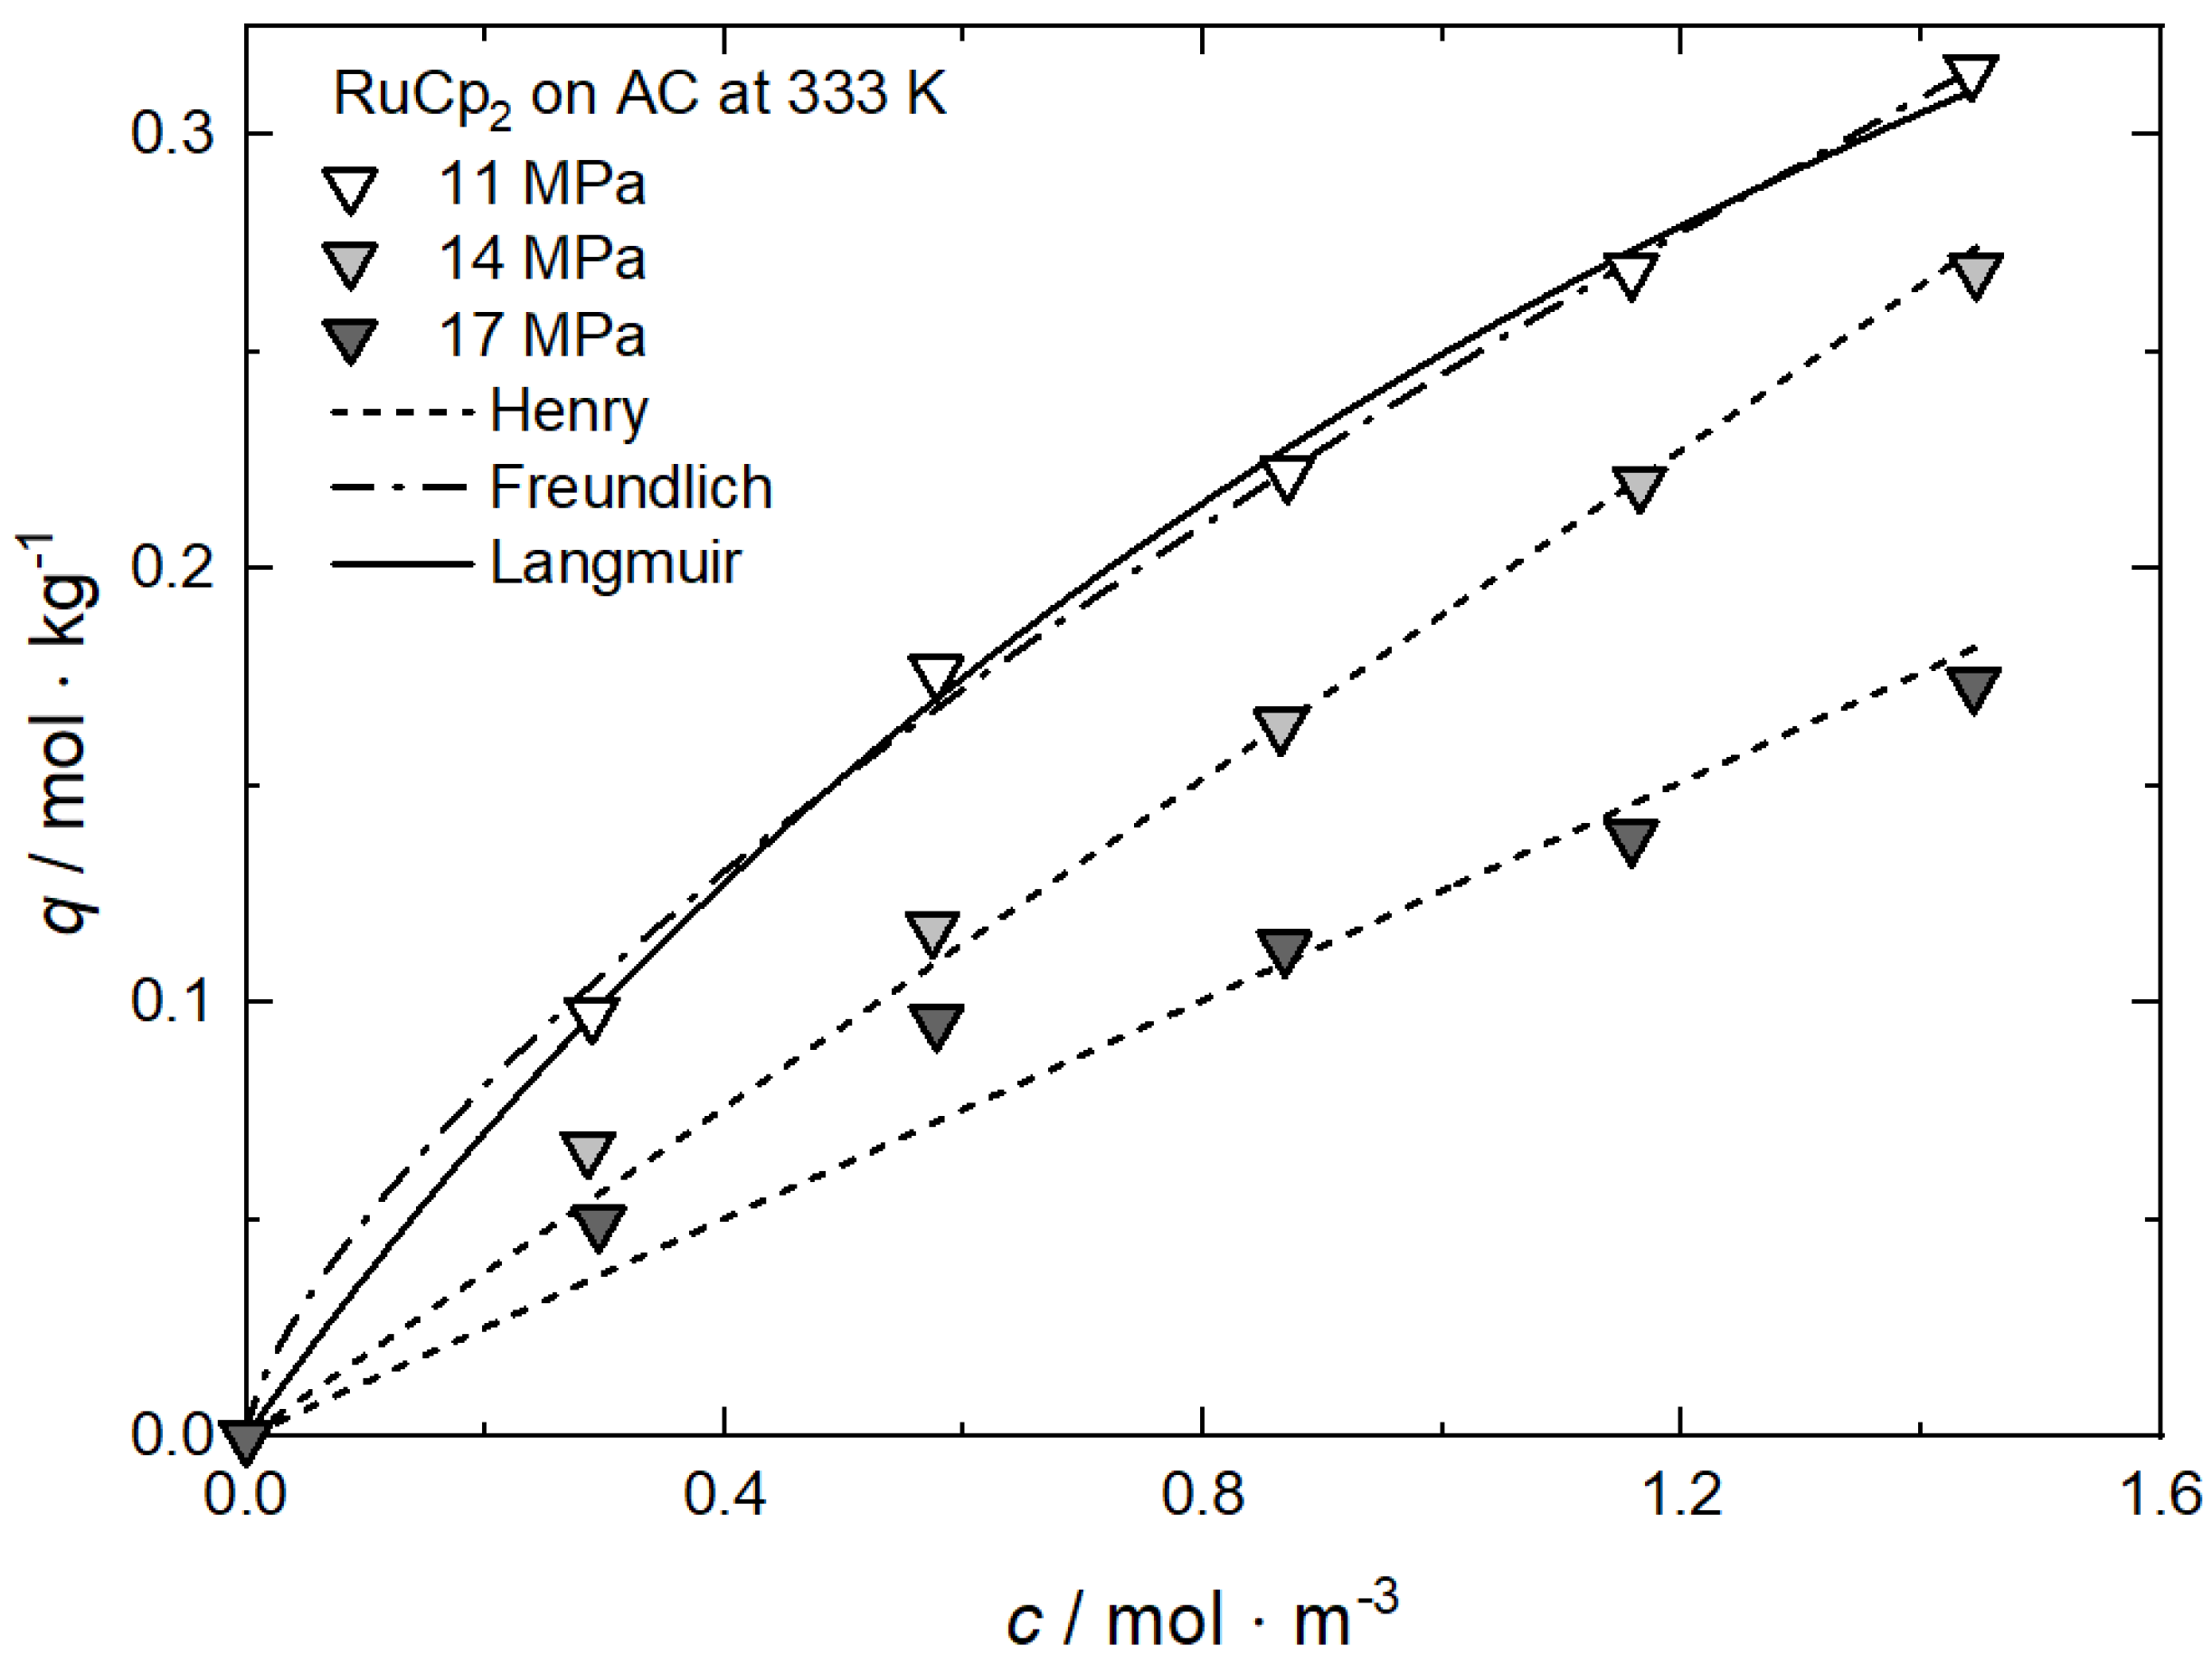

Table A2.
Adsorption isotherm parameters for RuCp2 on AC from scCO2 solution at 333 K and different pressures [64].
Table A2.
Adsorption isotherm parameters for RuCp2 on AC from scCO2 solution at 333 K and different pressures [64].
| Equation | Parameter | Unit | 11 MPa | 14 MPa | 17 MPa |
|---|---|---|---|---|---|
| Henry | kH | m3·kg−1 | — | 0.18965 | 0.12586 |
| R2 | — | — | 0.99485 | 0.95812 | |
| Freundlich | kF | m3·kg−1 | 0.24499 | — | — |
| nF | — | 0.68800 | — | — | |
| R2 | — | 0.99773 | — | — | |
| Langmuir | qm | mol·kg−1 | 0.68825 | — | — |
| kL | m3·mol−1 | 0.56918 | — | — | |
| R2 | — | 0.99793 | — | — |

Figure A3.
Uptake of Ru(cod)(tmhd)2 on CA22 at 353 K and different pressures; experimental data taken from [63].
Figure A3.
Uptake of Ru(cod)(tmhd)2 on CA22 at 353 K and different pressures; experimental data taken from [63].
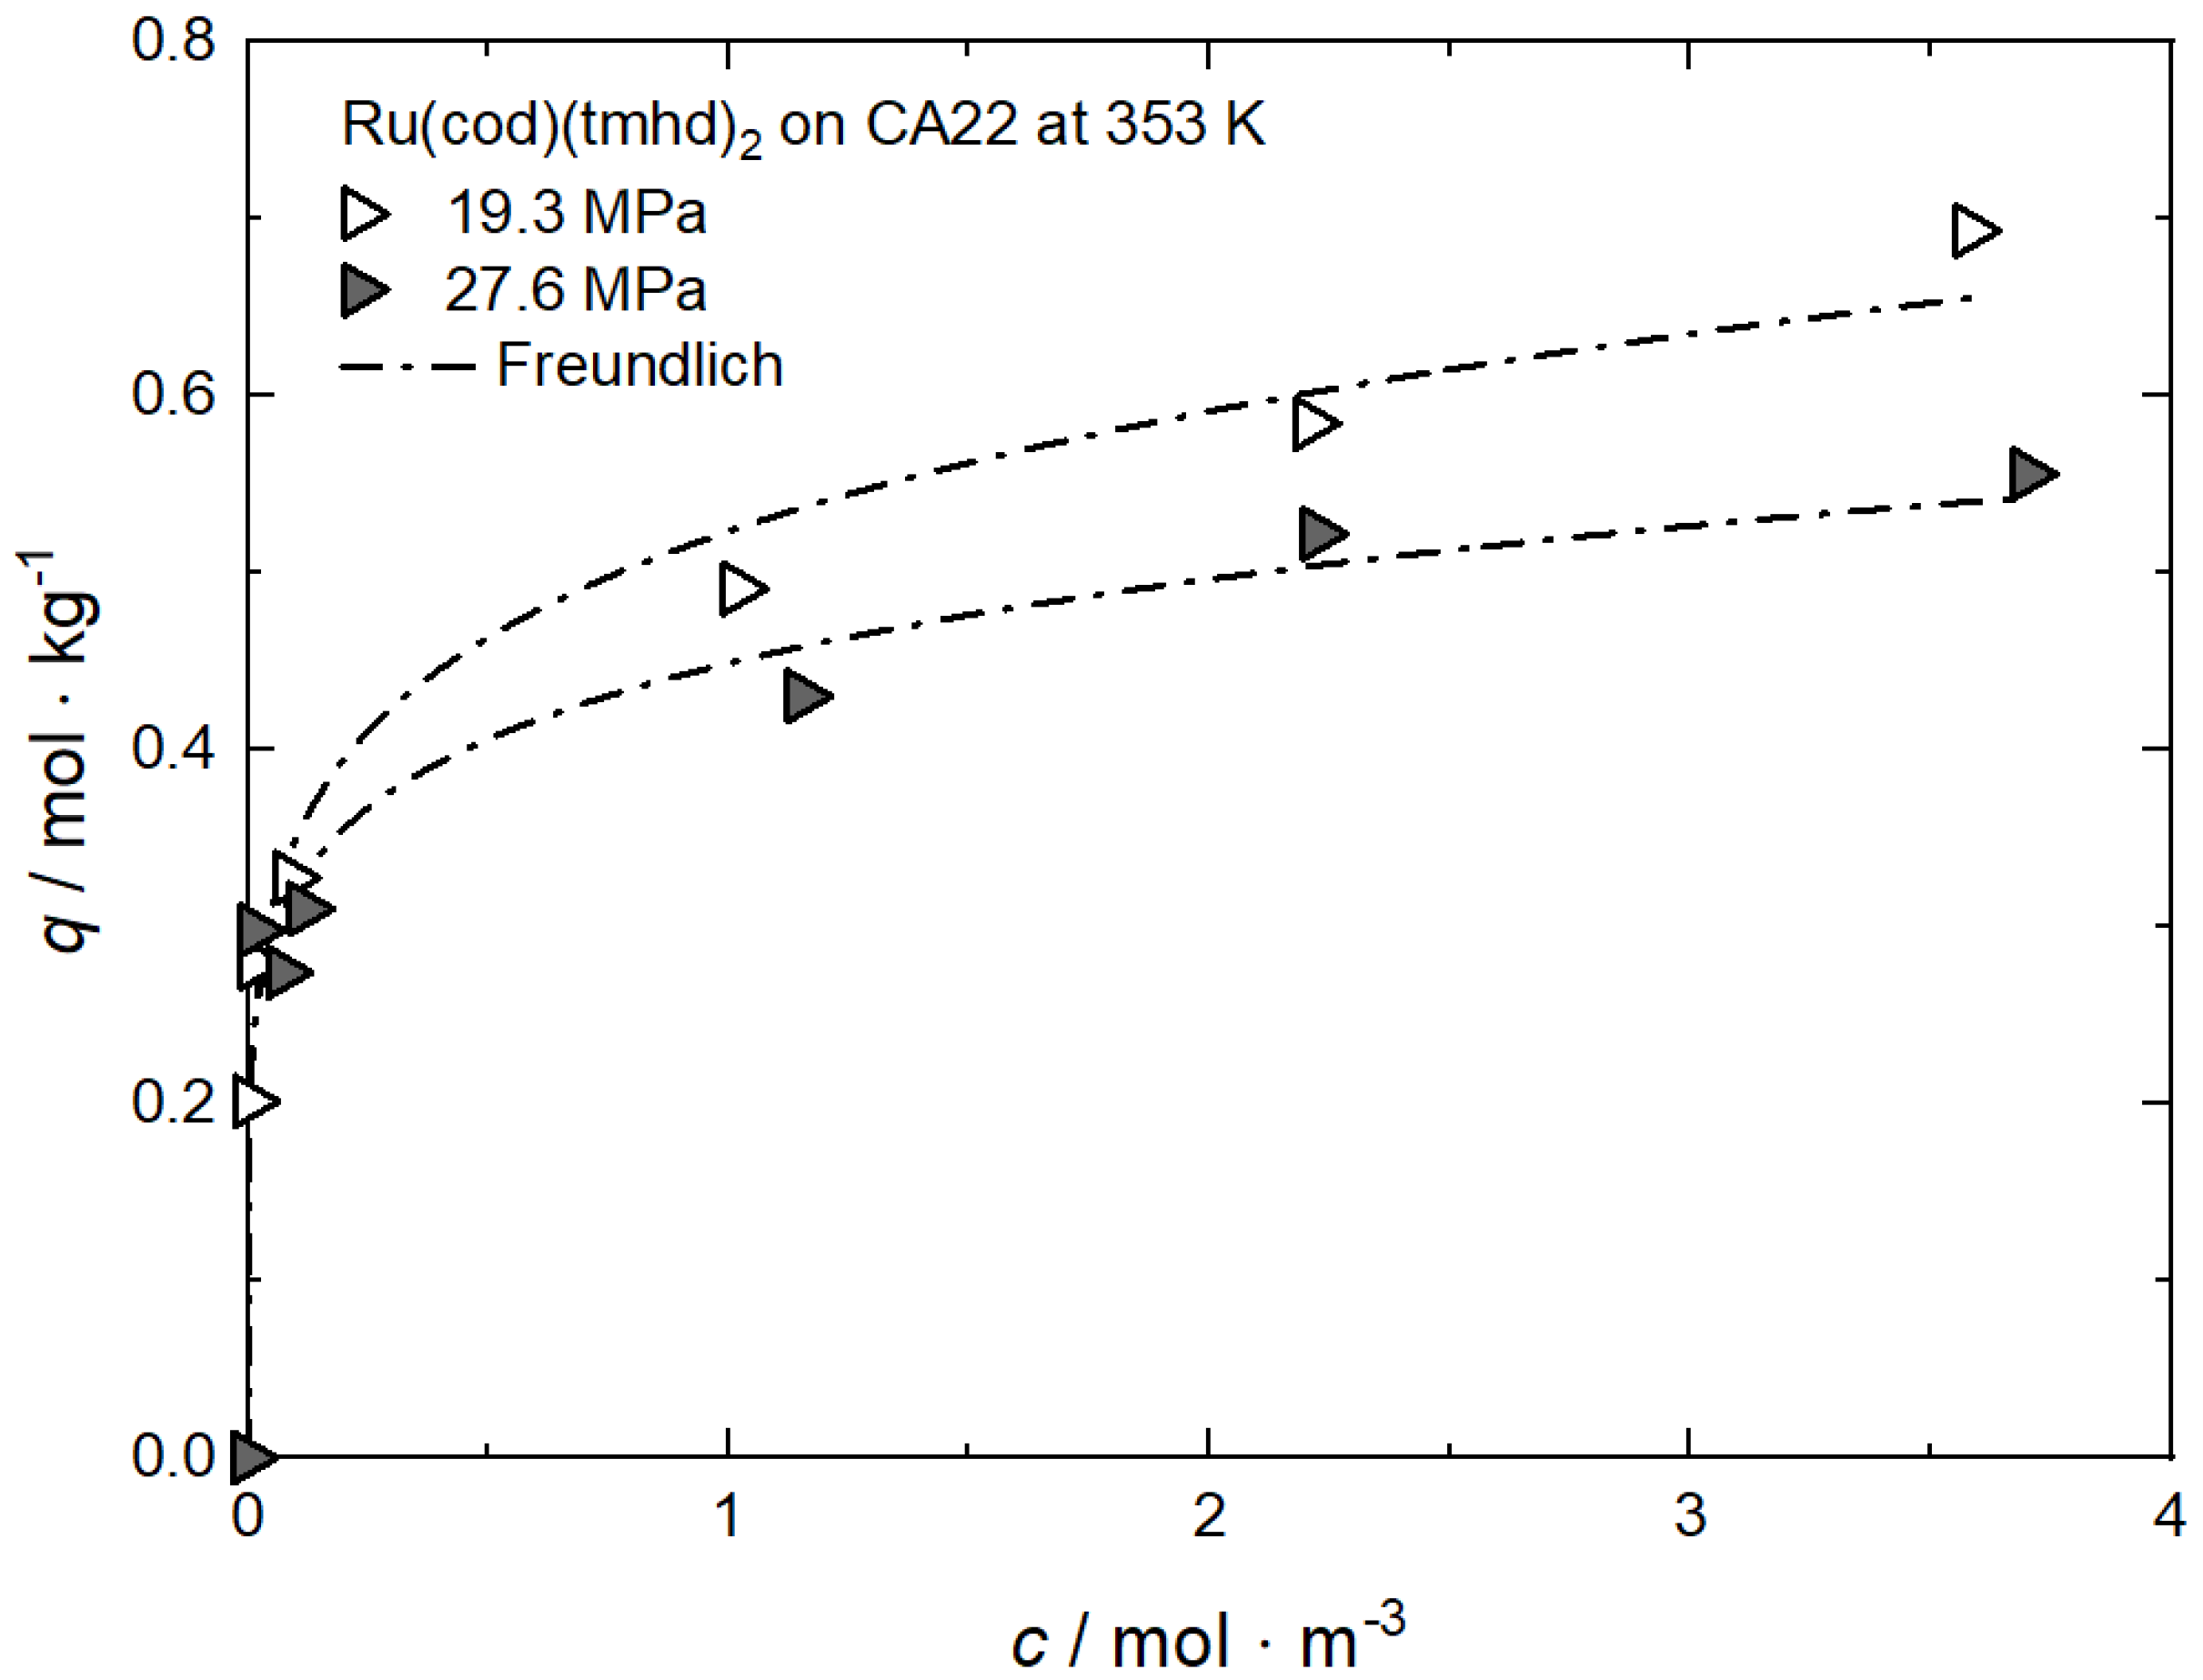

Table A3.
Adsorption isotherm parameters for Ru(cod)(tmhd)2 from scCO2 solution on CA22 at 353 K and different pressures [63].
Table A3.
Adsorption isotherm parameters for Ru(cod)(tmhd)2 from scCO2 solution on CA22 at 353 K and different pressures [63].
| Equation | Parameter | Unit | 19.3 MPa | 27.6 MPa |
|---|---|---|---|---|
| Freundlich | kF | m3·kg−1 | 0.52354 | 0.44892 |
| nF | — | 0.17569 | 0.14513 | |
| R2 | — | 0.98612 | 0.96893 |

Figure A4.
Uptake of Pt(cod)me2 on RFA at 308 K and different pressures; experimental data taken from [10].
Figure A4.
Uptake of Pt(cod)me2 on RFA at 308 K and different pressures; experimental data taken from [10].
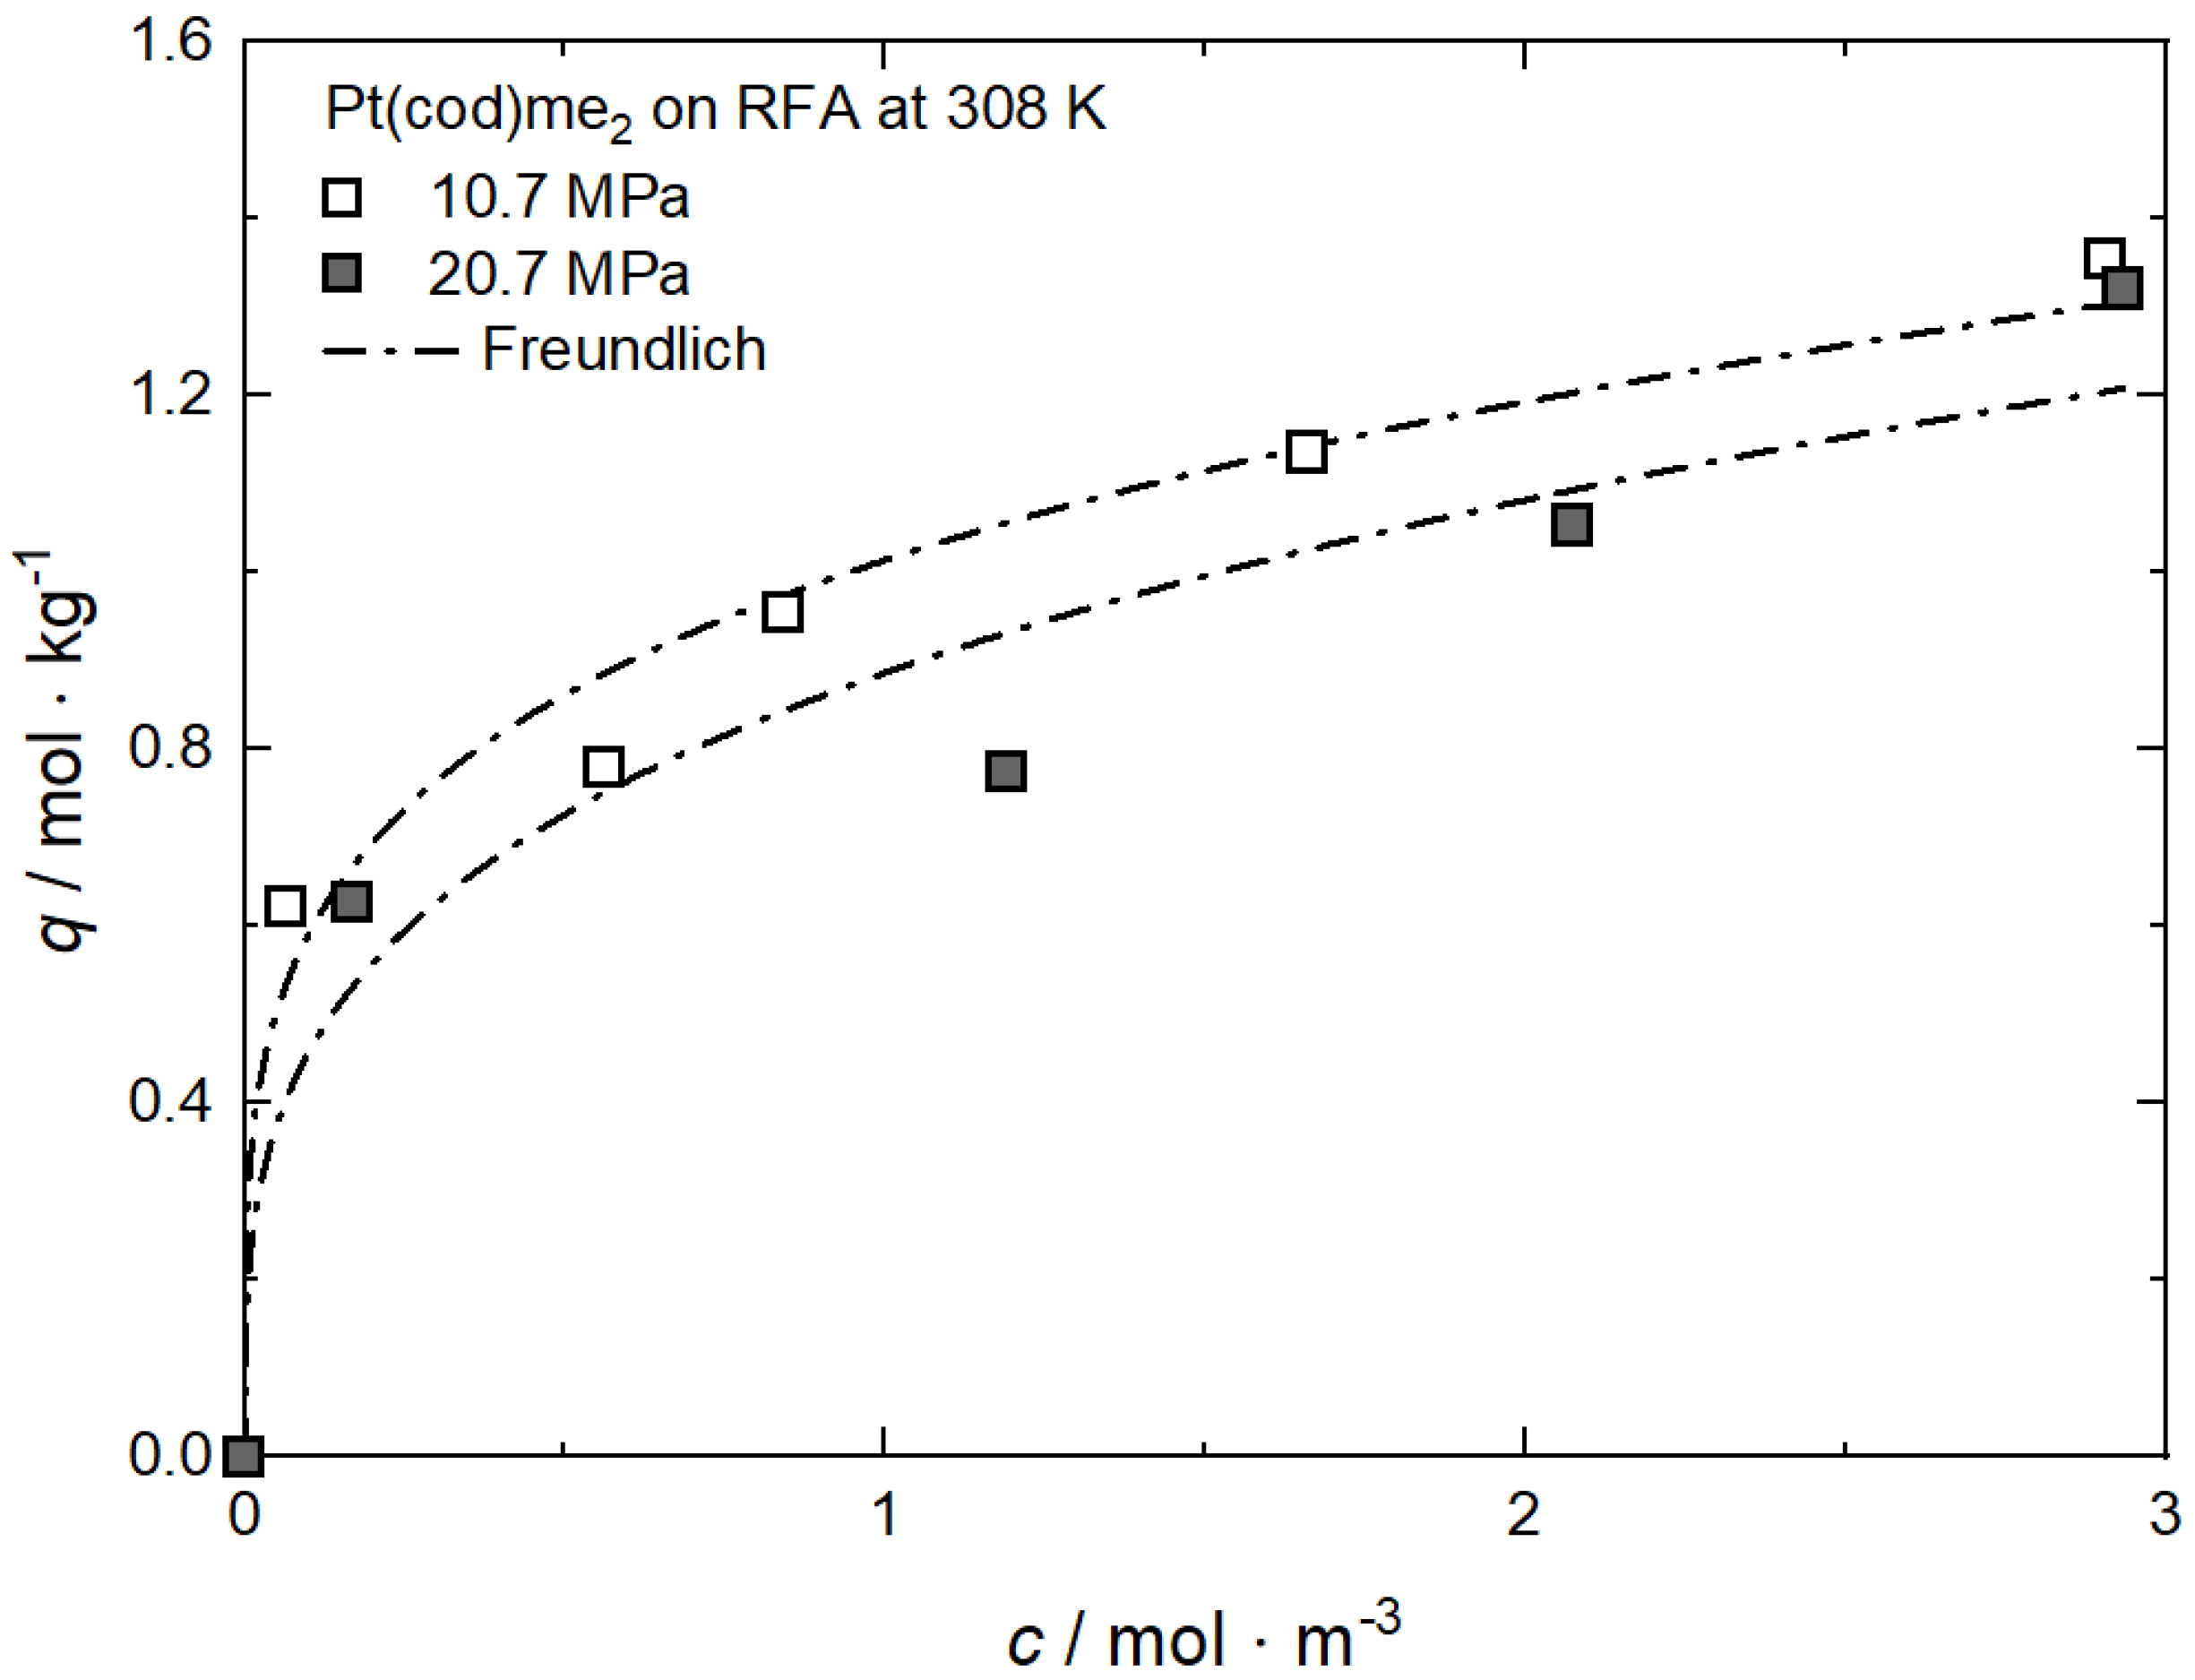

Table A4.
Adsorption isotherm parameters for Pt(cod)me2 from scCO2 solution on RFA at 308 K and different pressures [10].
Table A4.
Adsorption isotherm parameters for Pt(cod)me2 from scCO2 solution on RFA at 308 K and different pressures [10].
| Equation | Parameter | Unit | 10.7 MPa | 20.7 MPa |
|---|---|---|---|---|
| Freundlich | kF | m3·kg−1 | 1.01382 | 0.88633 |
| nF | — | 0.23476 | 0.28767 | |
| R2 | — | 0.97509 | 0.93544 |
Appendix B. Comparison between Experimental and Calculated Data for Adsorption Isotherms: Temperature Influence

Figure A5.
Uptake of Ru(acac)3 on SA at 18 MPa and different temperatures; experimental data taken from [23].
Figure A5.
Uptake of Ru(acac)3 on SA at 18 MPa and different temperatures; experimental data taken from [23].
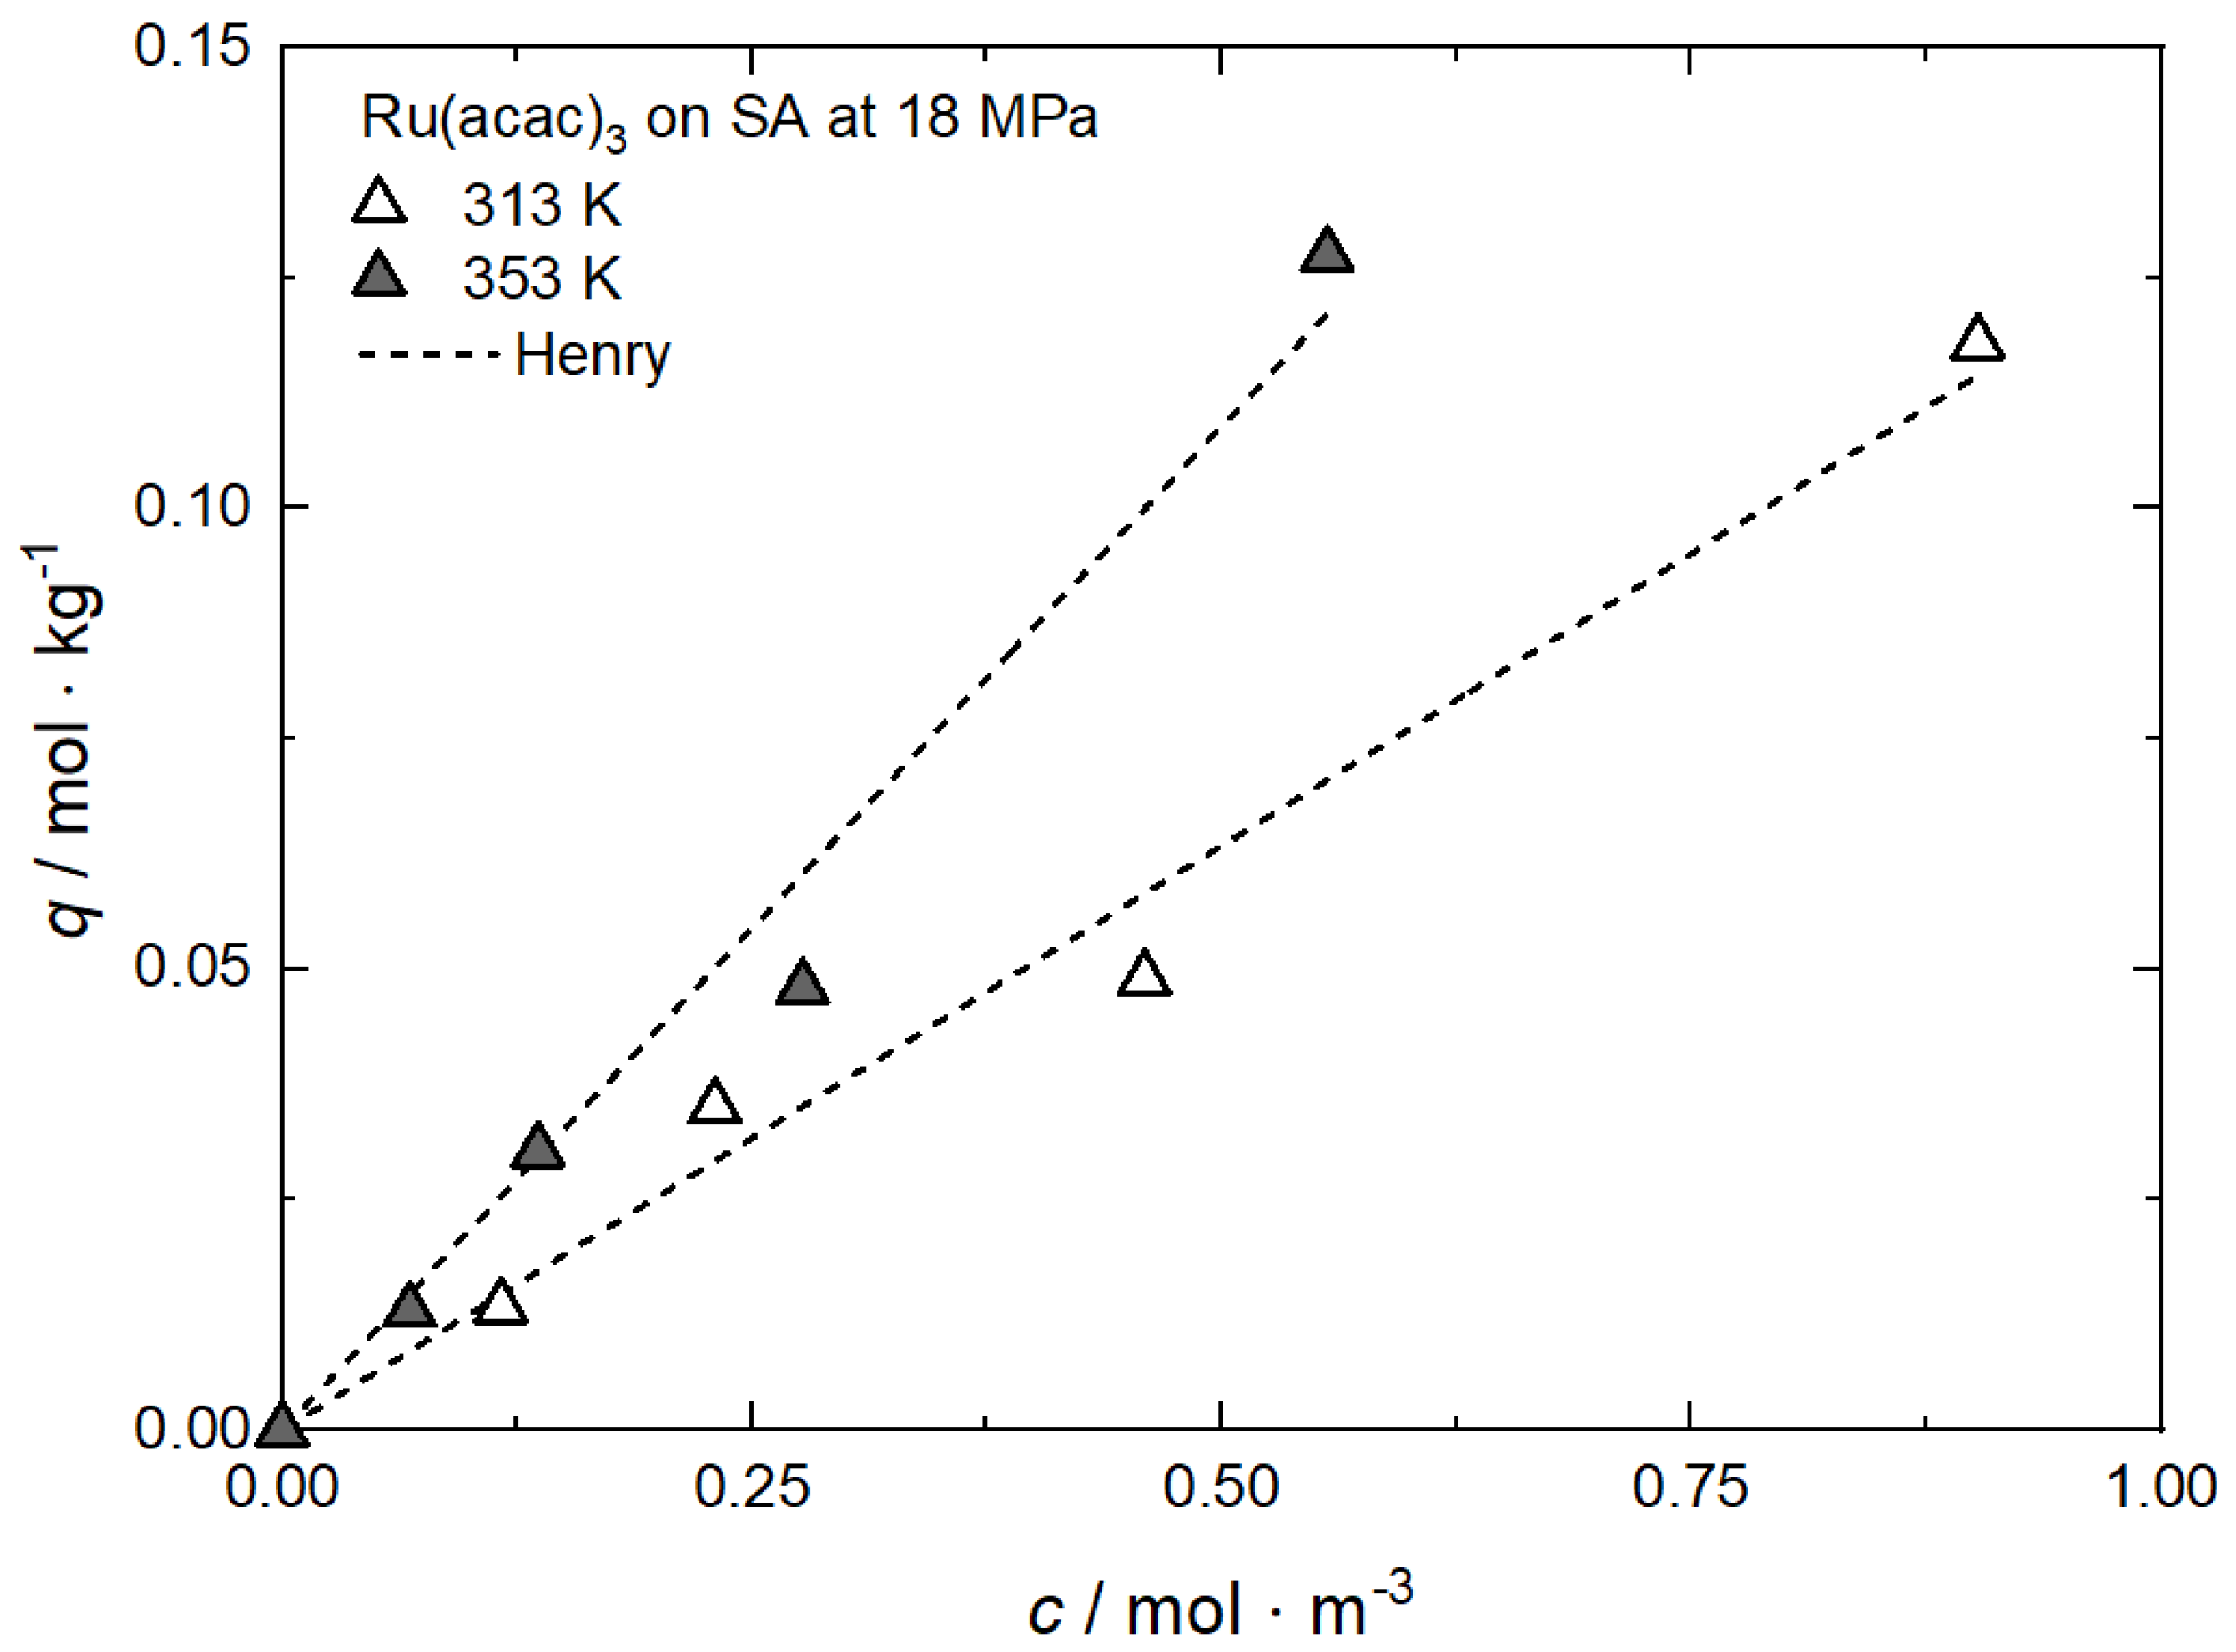

Table A5.
Adsorption isotherm parameters for Ru(acac)3 from scCO2 solution on SA at 18 MPa and different temperatures [23].
Table A5.
Adsorption isotherm parameters for Ru(acac)3 from scCO2 solution on SA at 18 MPa and different temperatures [23].
| Equation | Parameter | Unit | 313 K | 353 K |
|---|---|---|---|---|
| Henry | kH | m3·kg−1 | 0.12685 | 0.21781 |
| R2 | — | 0.98414 | 0.98060 |

Figure A6.
Uptake of Rh(acac)3 on MSU-H at 15 MPa and different temperatures; experimental data taken from [62].
Figure A6.
Uptake of Rh(acac)3 on MSU-H at 15 MPa and different temperatures; experimental data taken from [62].
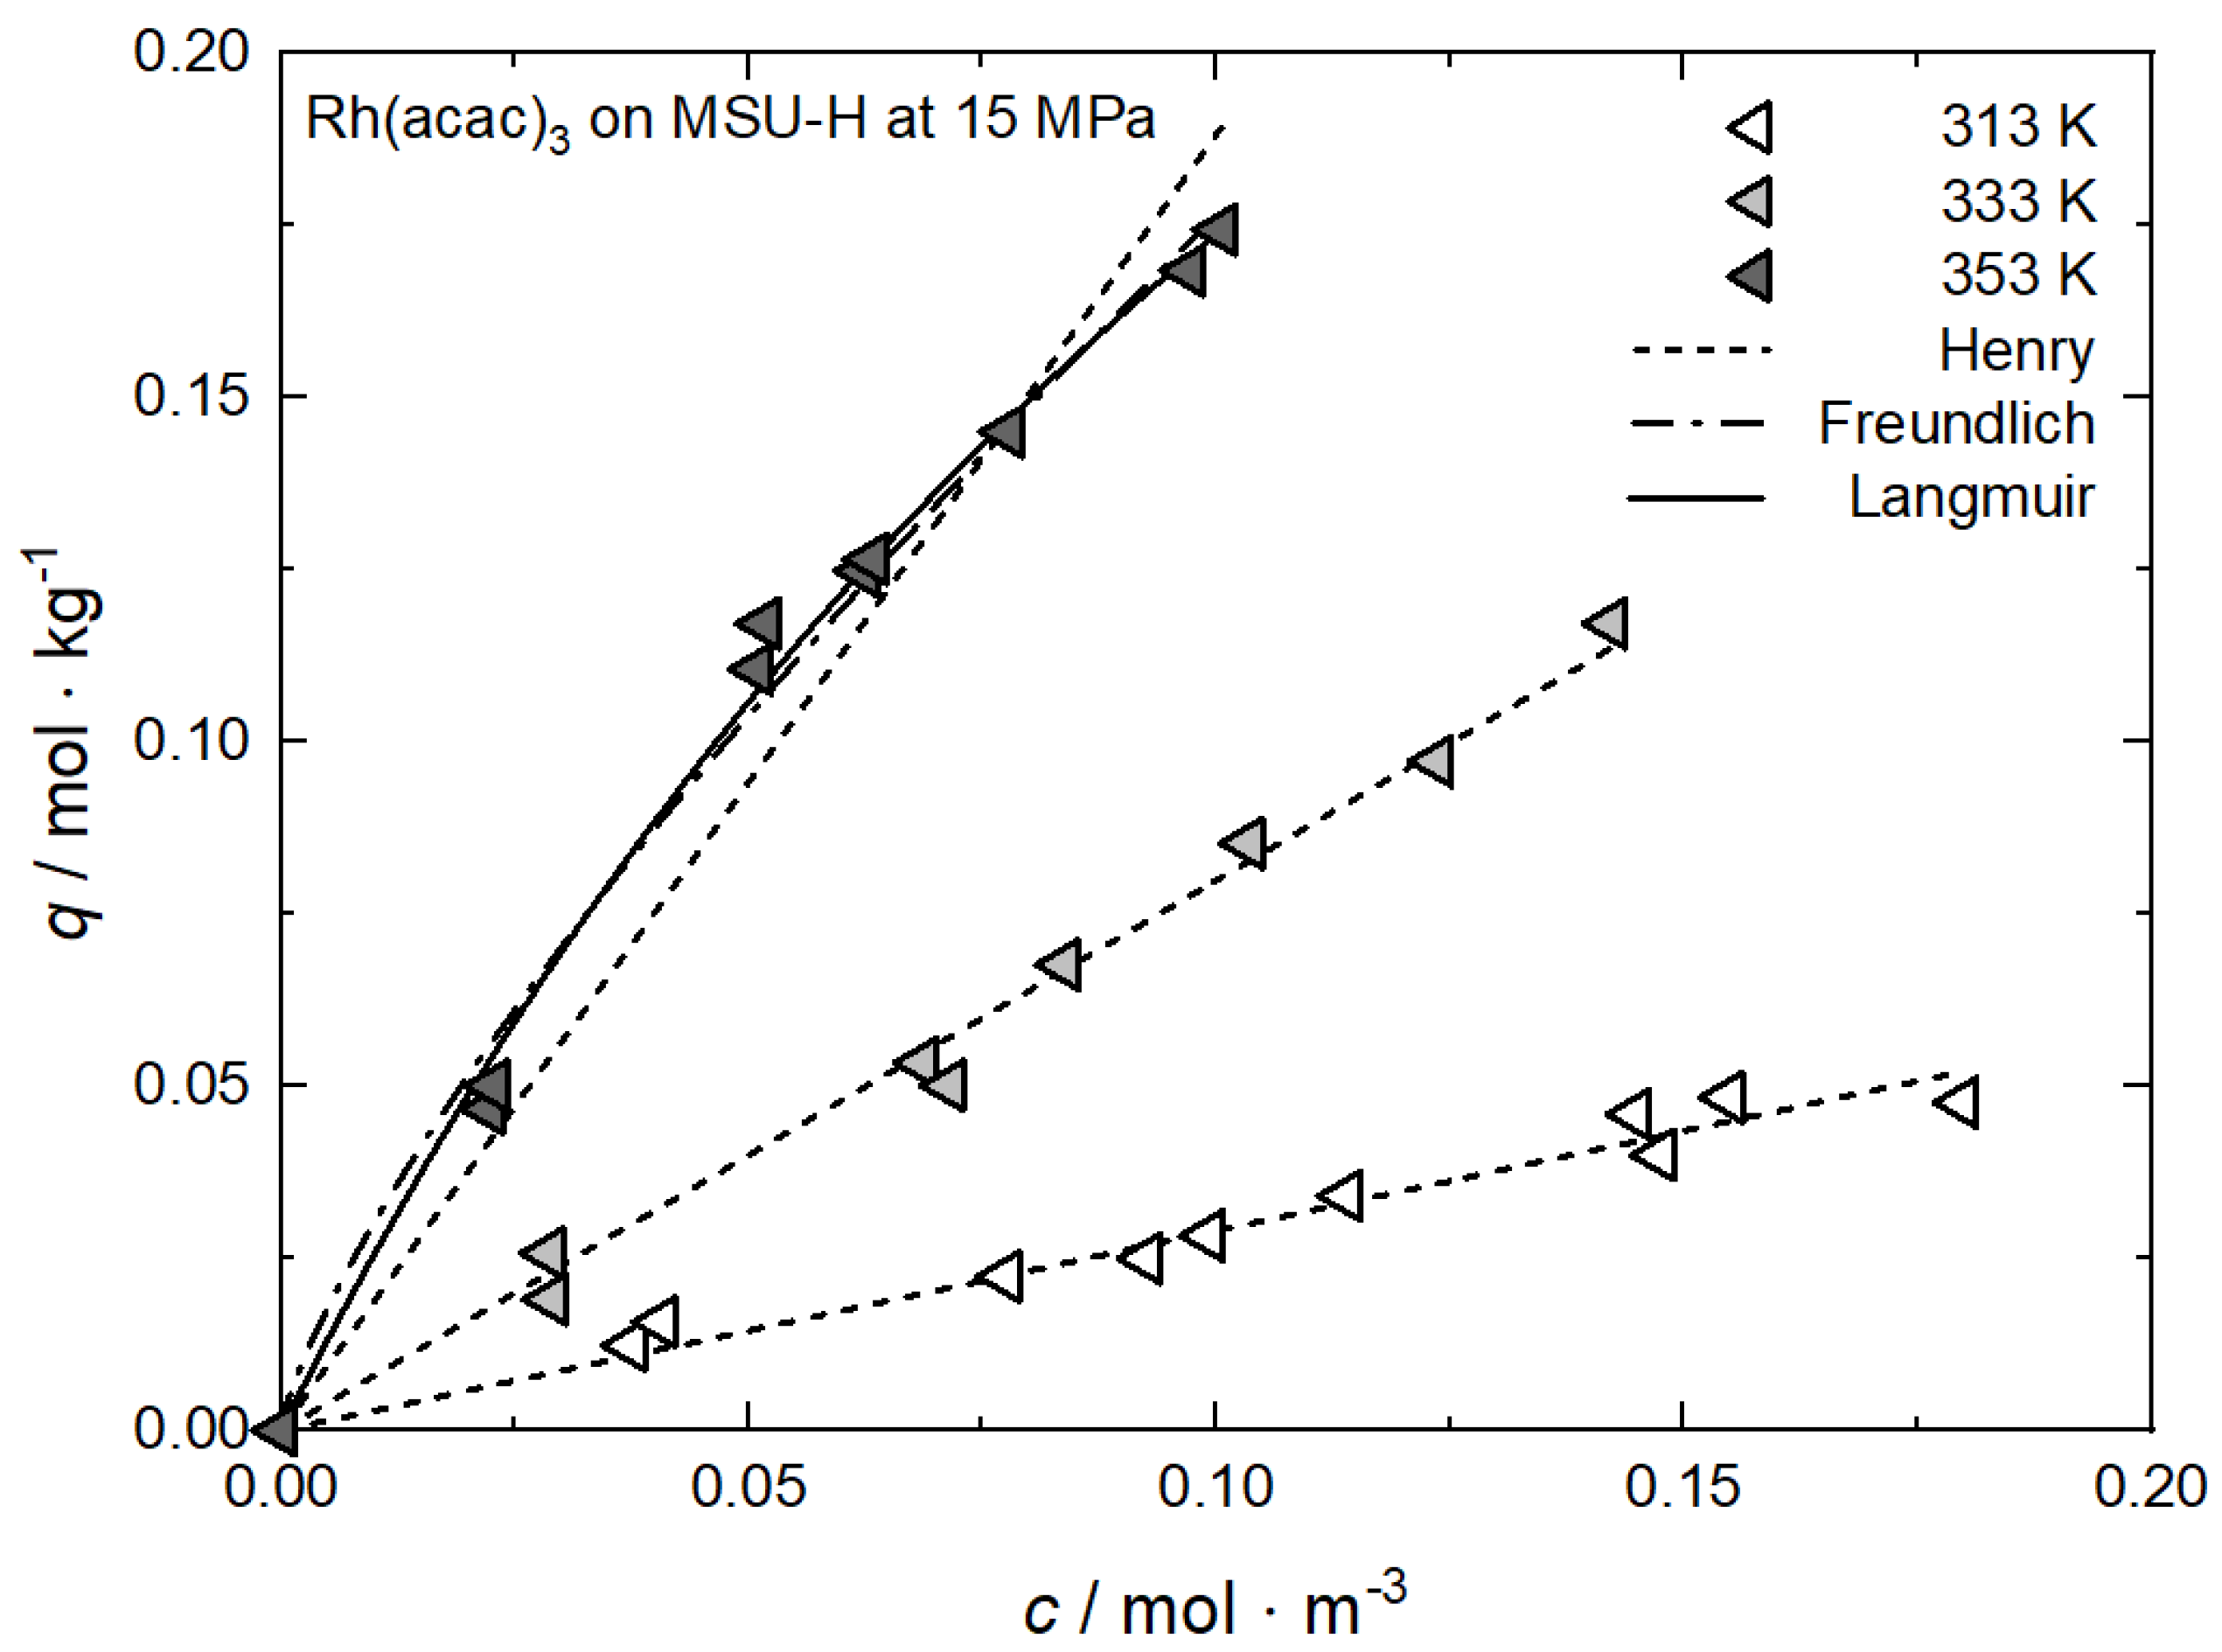

Table A6.
Adsorption isotherm parameters for Rh(acac)3 from scCO2 solution on MSU-H at 15 MPa and different temperatures [62].
Table A6.
Adsorption isotherm parameters for Rh(acac)3 from scCO2 solution on MSU-H at 15 MPa and different temperatures [62].
| Equation | Parameter | Unit | 313 K | 333 K | 353 K |
|---|---|---|---|---|---|
| Henry | kH | m3·kg−1 | 0.28996 | 0.79877 | 1.88163 |
| R2 | — | 0.96894 | 0.99160 | 0.95737 | |
| Freundlich | kF | m3·kg−1 | — | — | 1.02928 |
| nF | — | — | — | 0.76583 | |
| R2 | — | — | — | 0.98811 | |
| Langmuir | qm | mol·kg−1 | — | — | 0.48572 |
| kL | m3·mol−1 | — | — | 5.56882 | |
| R2 | — | — | — | 0.99382 |

Figure A7.
Uptake of Rh(acac)3 on HMS at 15 MPa and different temperatures; experimental data taken from [62].
Figure A7.
Uptake of Rh(acac)3 on HMS at 15 MPa and different temperatures; experimental data taken from [62].
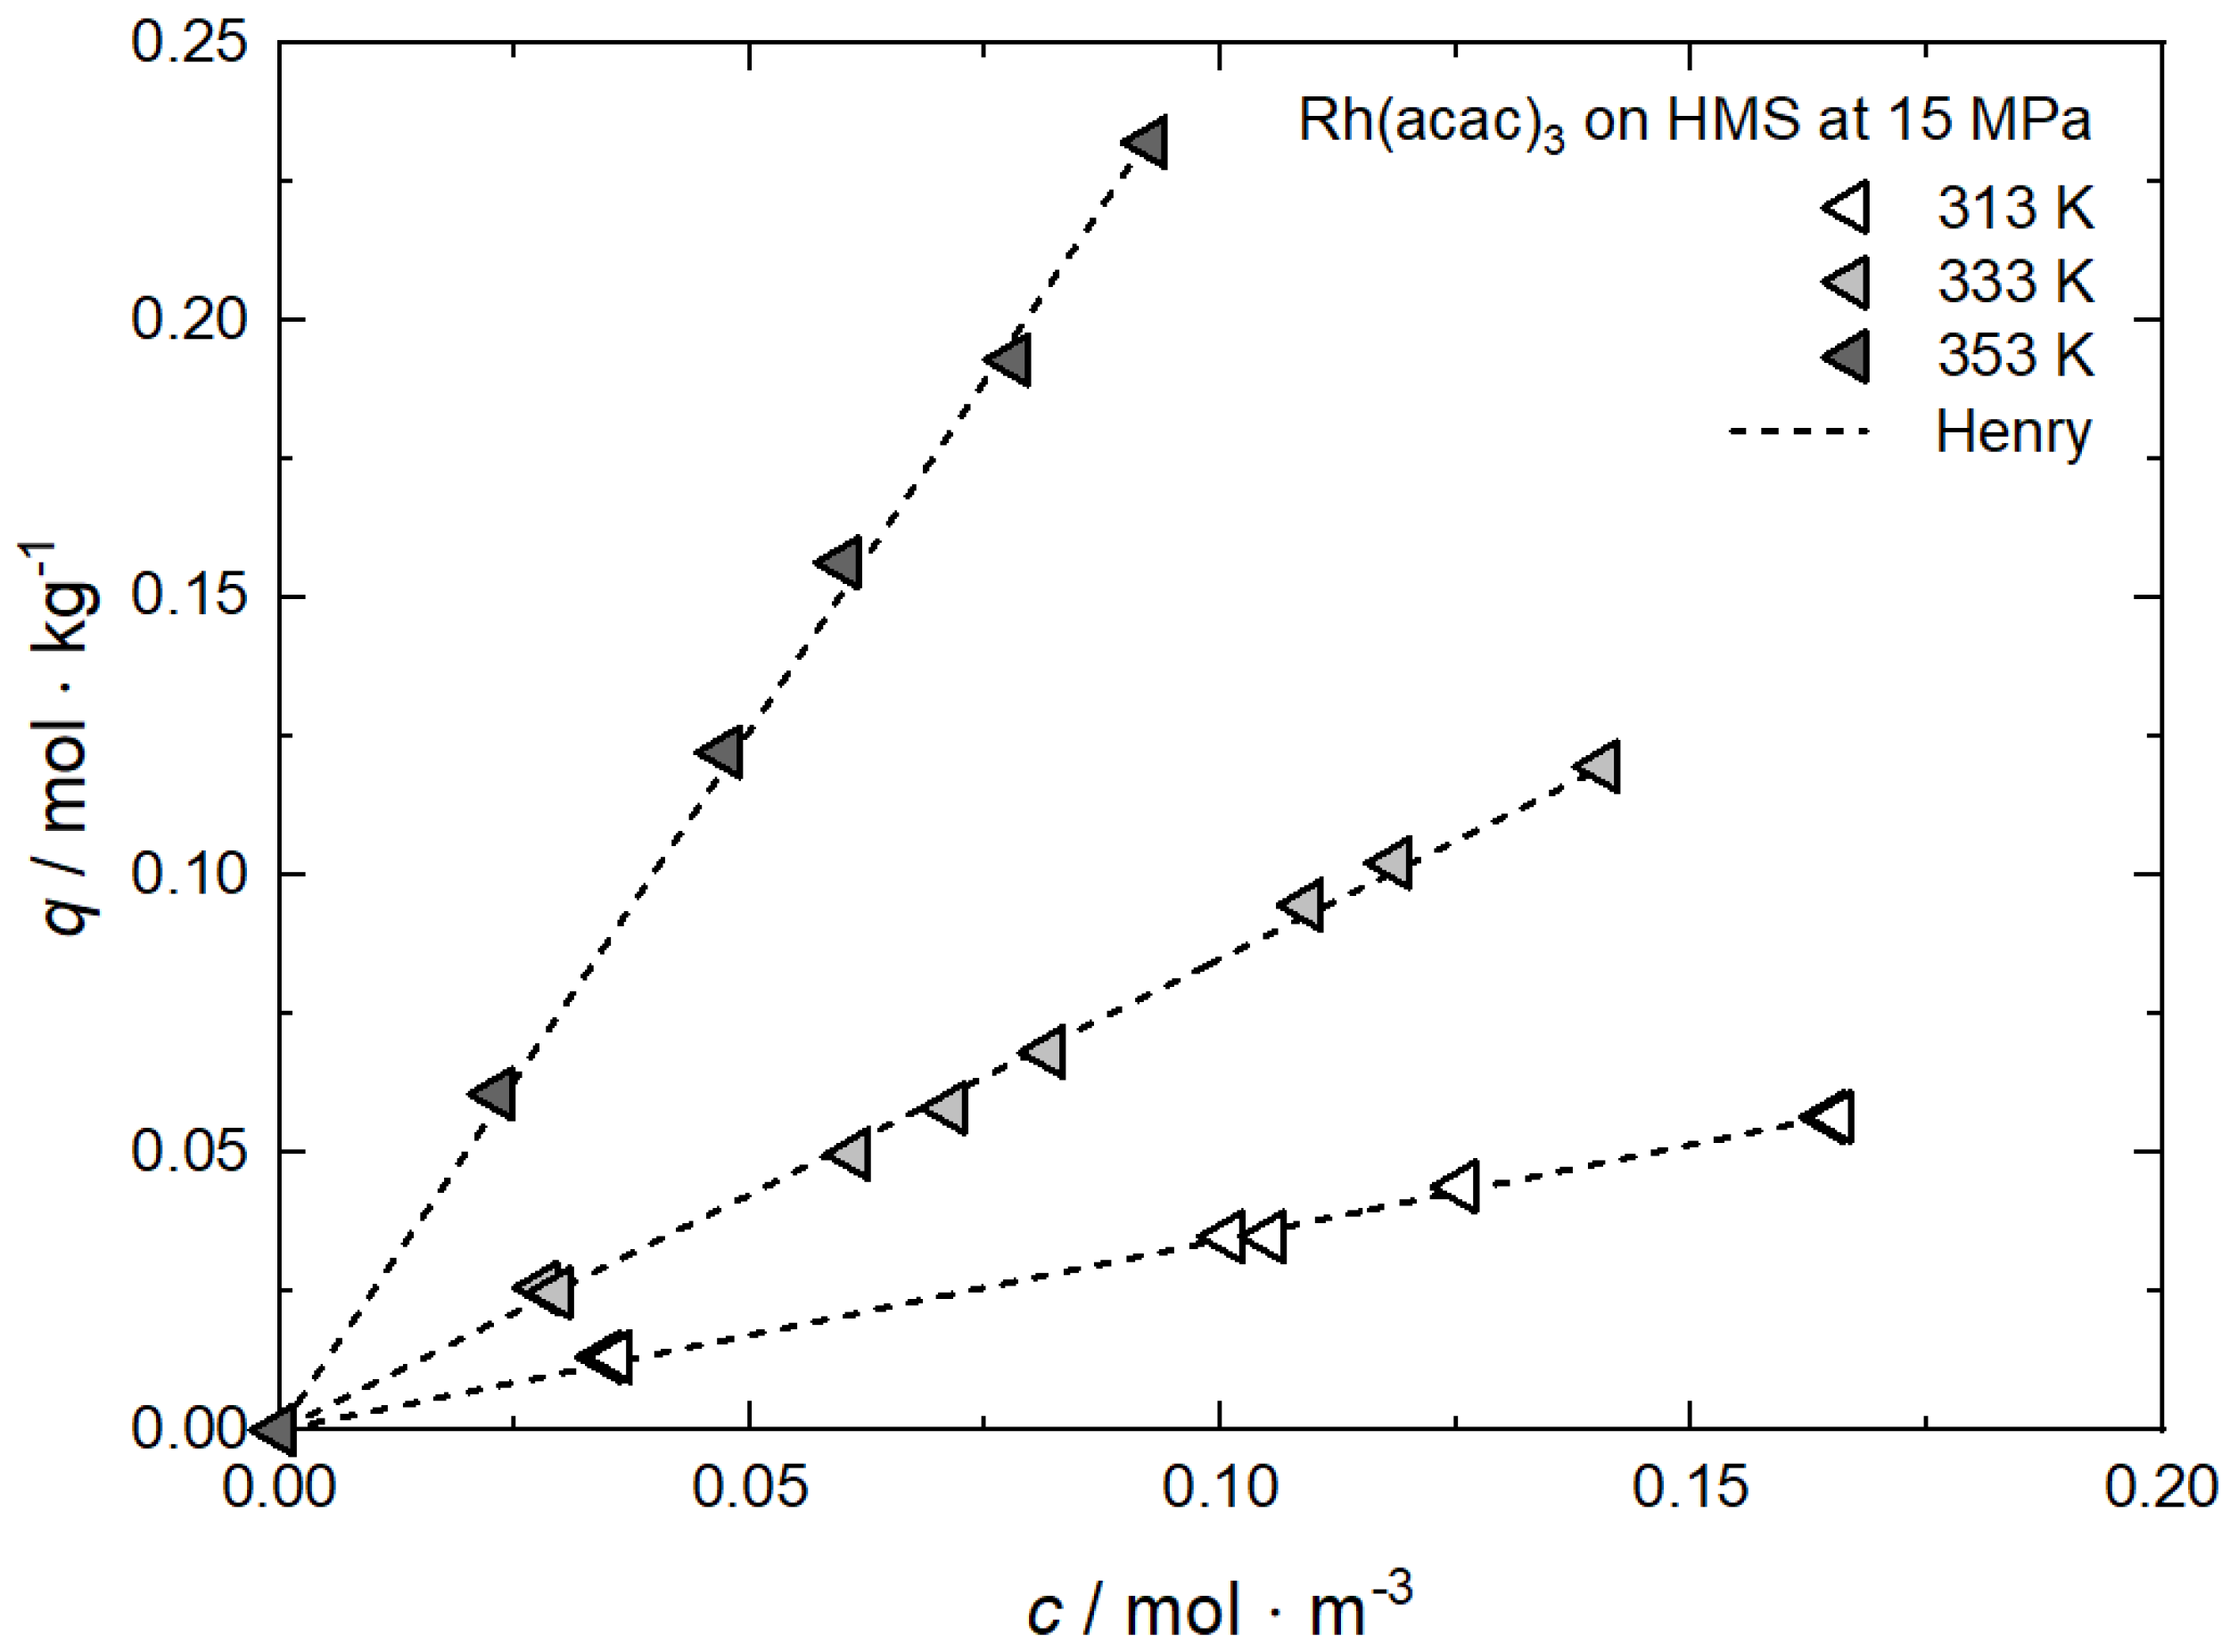

Table A7.
Adsorption isotherm parameters for Rh(acac)3 from scCO2 solution on HMS at 15 MPa and different temperatures [62].
Table A7.
Adsorption isotherm parameters for Rh(acac)3 from scCO2 solution on HMS at 15 MPa and different temperatures [62].
| Equation | Parameter | Unit | 313 K | 333 K | 353 K |
|---|---|---|---|---|---|
| Henry | kH | m3·kg−1 | 0.34319 | 0.85050 | 2.52470 |
| R2 | — | 0.99848 | 0.99828 | 0.99854 |

Figure A8.
Uptake of Rh(acac)3 on MCM-41 at 15 MPa and different temperatures; experimental data taken from [62].
Figure A8.
Uptake of Rh(acac)3 on MCM-41 at 15 MPa and different temperatures; experimental data taken from [62].
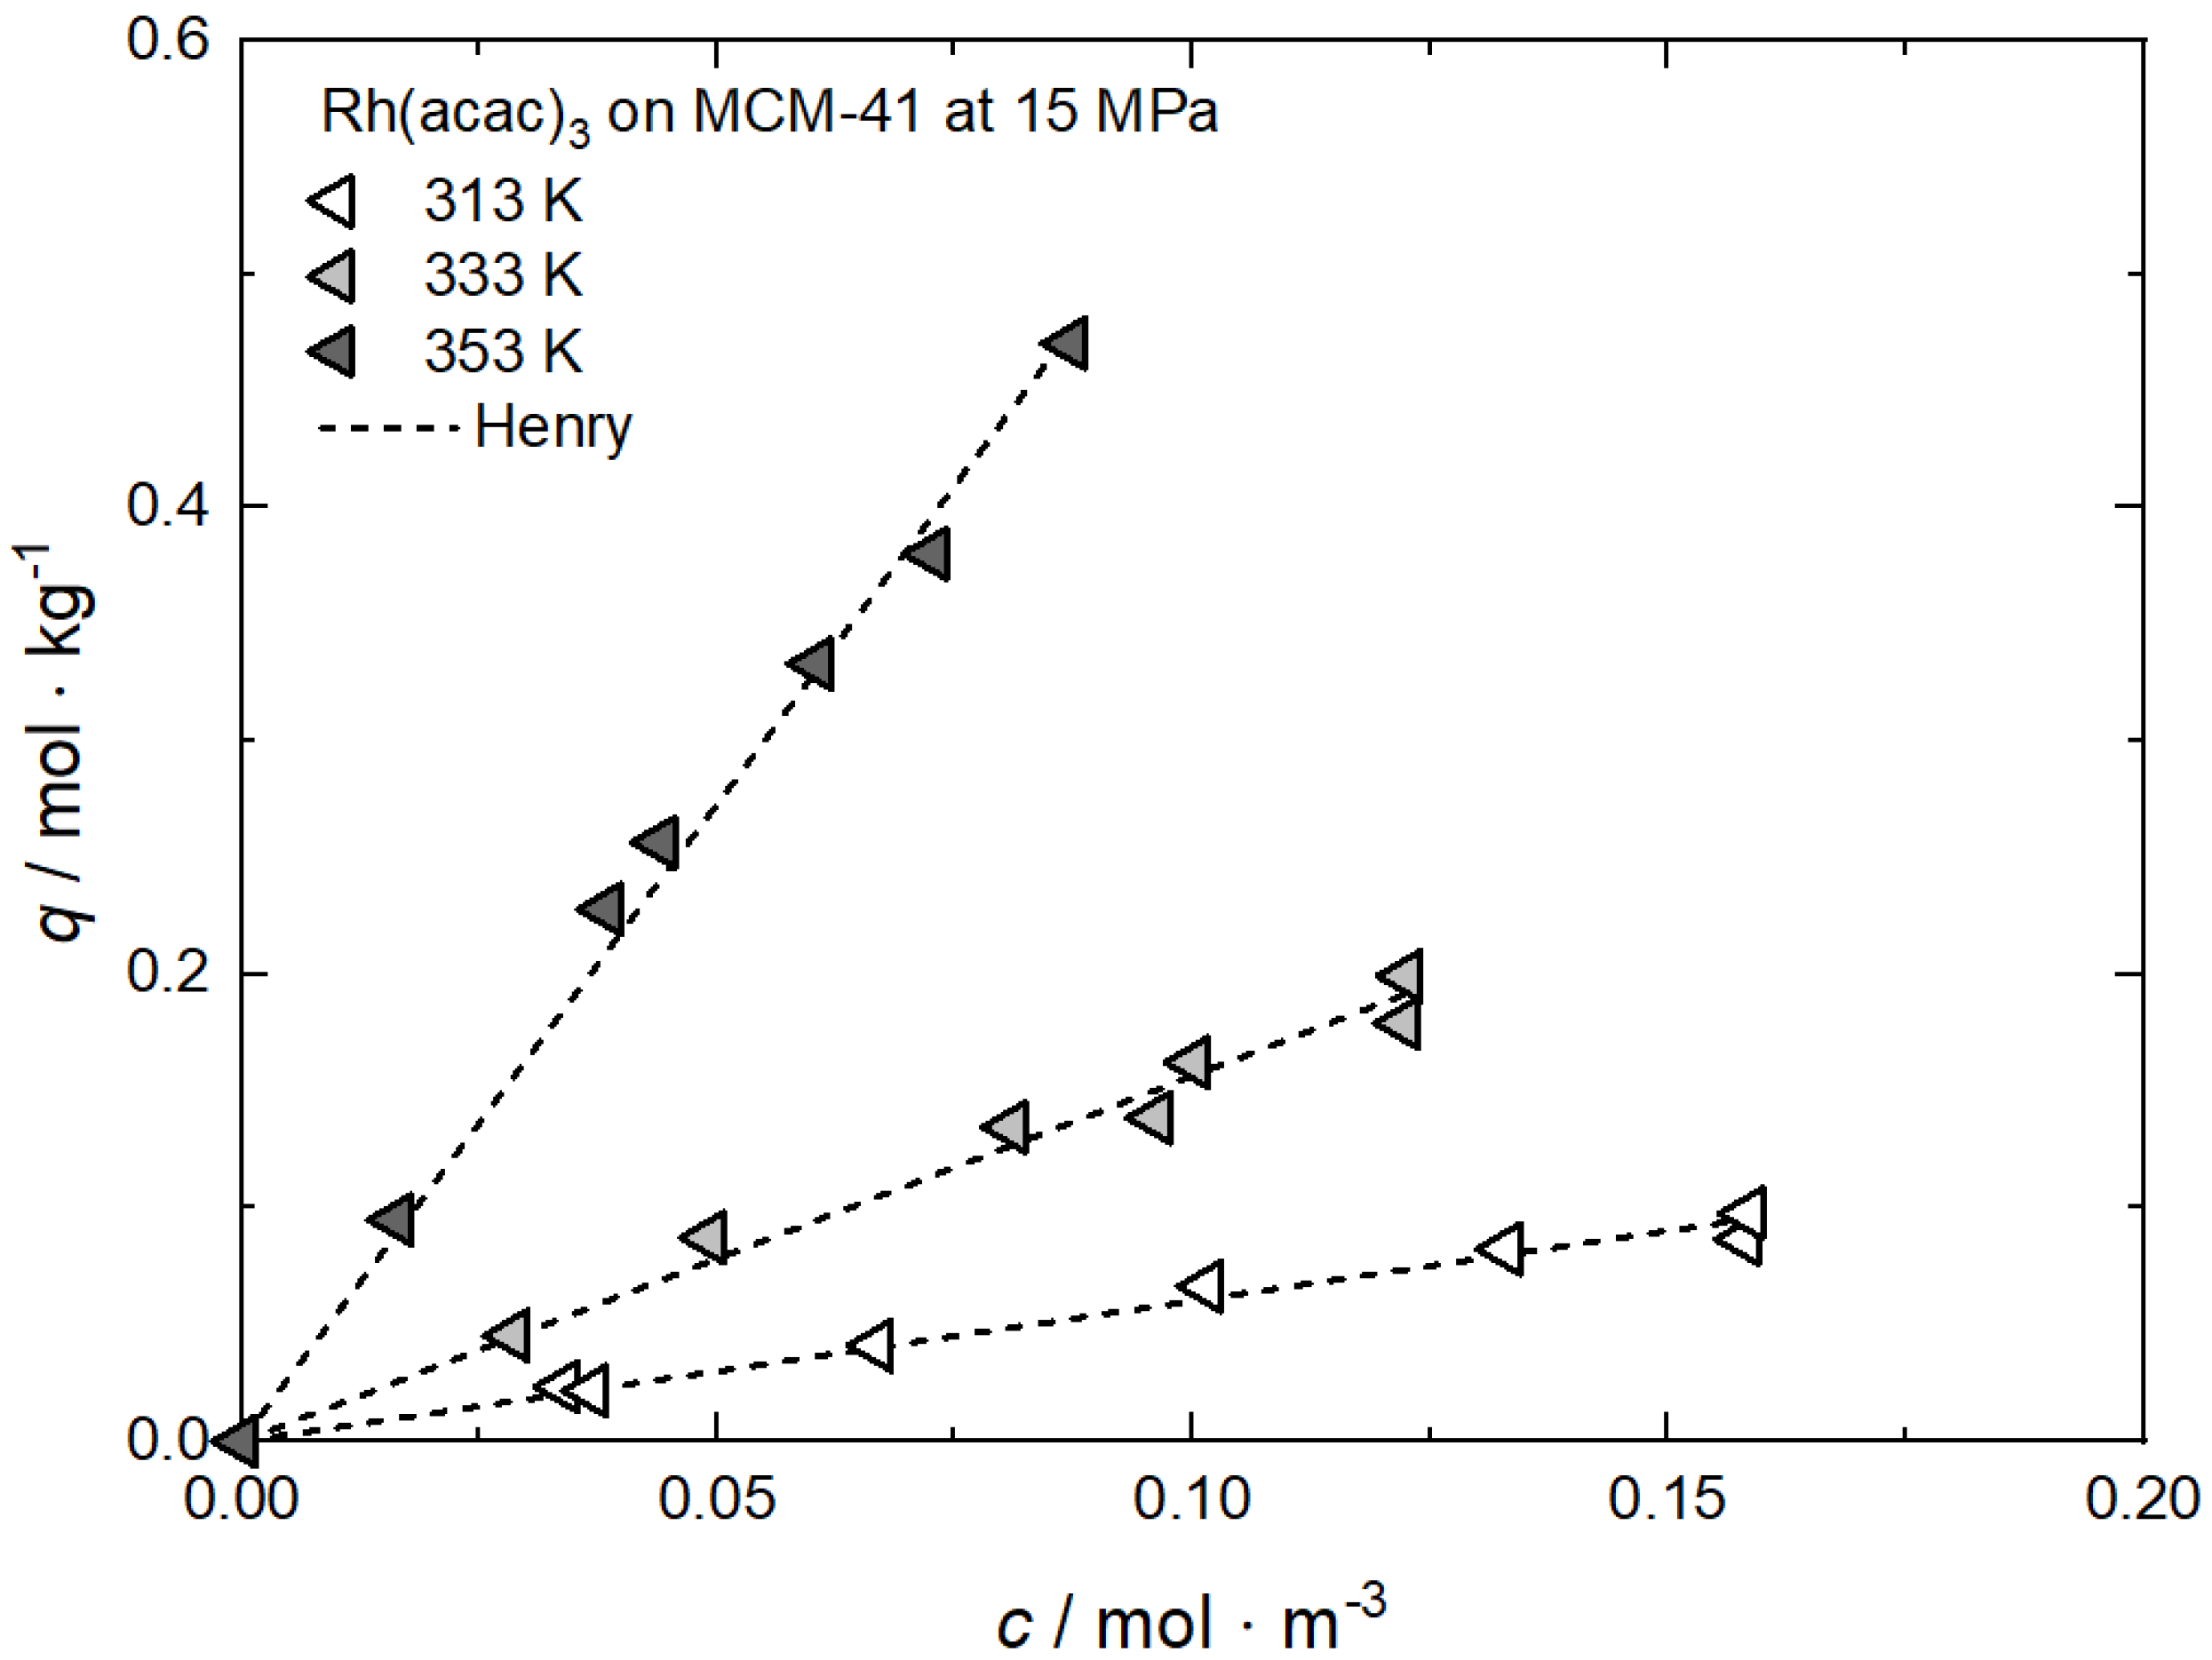

Table A8.
Adsorption isotherm parameters for Rh(acac)3 from scCO2 solution on MCM-41 at 15 MPa and different temperatures [62].
Table A8.
Adsorption isotherm parameters for Rh(acac)3 from scCO2 solution on MCM-41 at 15 MPa and different temperatures [62].
| Equation | Parameter | Unit | 313 K | 333 K | 353 K |
|---|---|---|---|---|---|
| Henry | kH | m3·kg−1 | 0.60171 | 1.56599 | 5.45912 |
| R2 | — | 0.98662 | 0.98361 | 0.99420 |

Figure A9.
Uptake of Ru(cod)(tmhd)2 on CA22 at 19.3 MPa and different temperatures; experimental data taken from [63].
Figure A9.
Uptake of Ru(cod)(tmhd)2 on CA22 at 19.3 MPa and different temperatures; experimental data taken from [63].
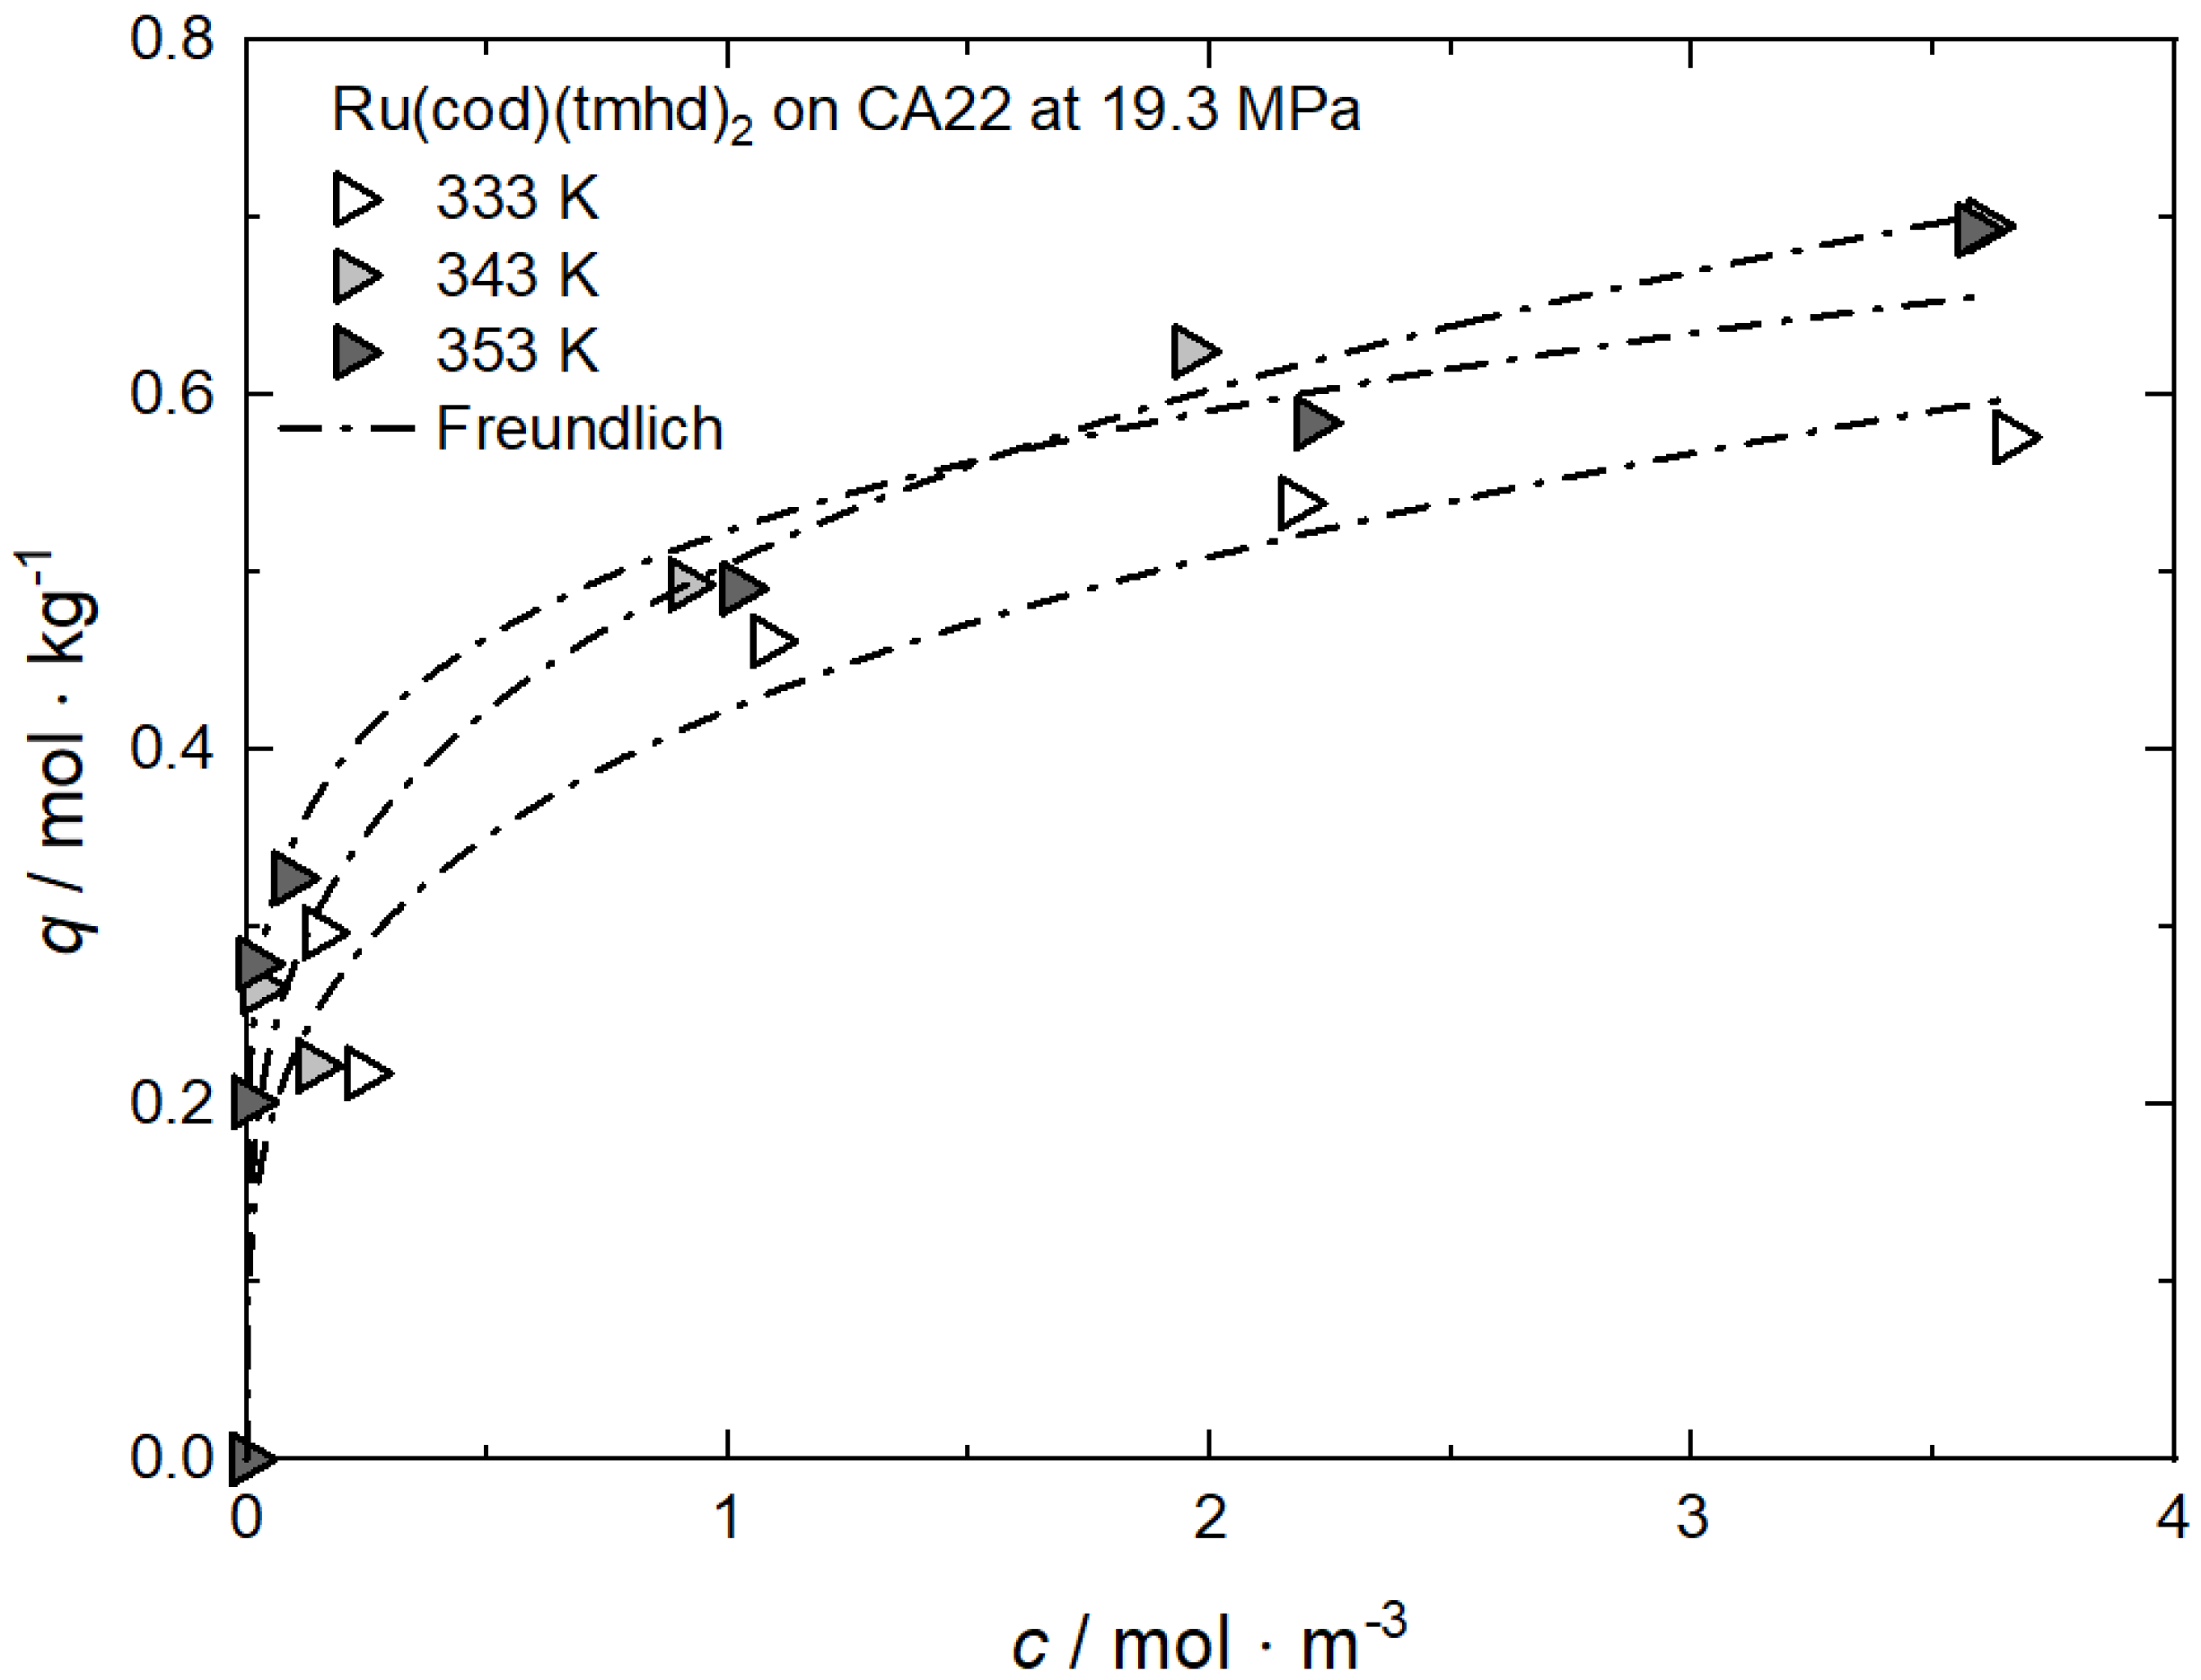

Table A9.
Adsorption isotherm parameters for Ru(cod)(tmhd)2 from scCO2 solution on CA22 at 19.3 MPa and different temperatures [63].
Table A9.
Adsorption isotherm parameters for Ru(cod)(tmhd)2 from scCO2 solution on CA22 at 19.3 MPa and different temperatures [63].
| Equation | Parameter | Unit | 333 K | 343 K | 353 K |
|---|---|---|---|---|---|
| Freundlich | kF | m3·kg−1 | 0.42267 | 0.50484 | 0.52354 |
| nF | — | 0.26781 | 0.25710 | 0.17569 | |
| R2 | — | 0.95622 | 0.95555 | 0.98612 |
Appendix C. Comparison between Experimental and Calculated Data for Adsorption Isotherms: Substrate Influence

Figure A10.
Uptake of Rh(acac)3 at 15 MPa and 313 K on different substrates; experimental data taken from [62].
Figure A10.
Uptake of Rh(acac)3 at 15 MPa and 313 K on different substrates; experimental data taken from [62].
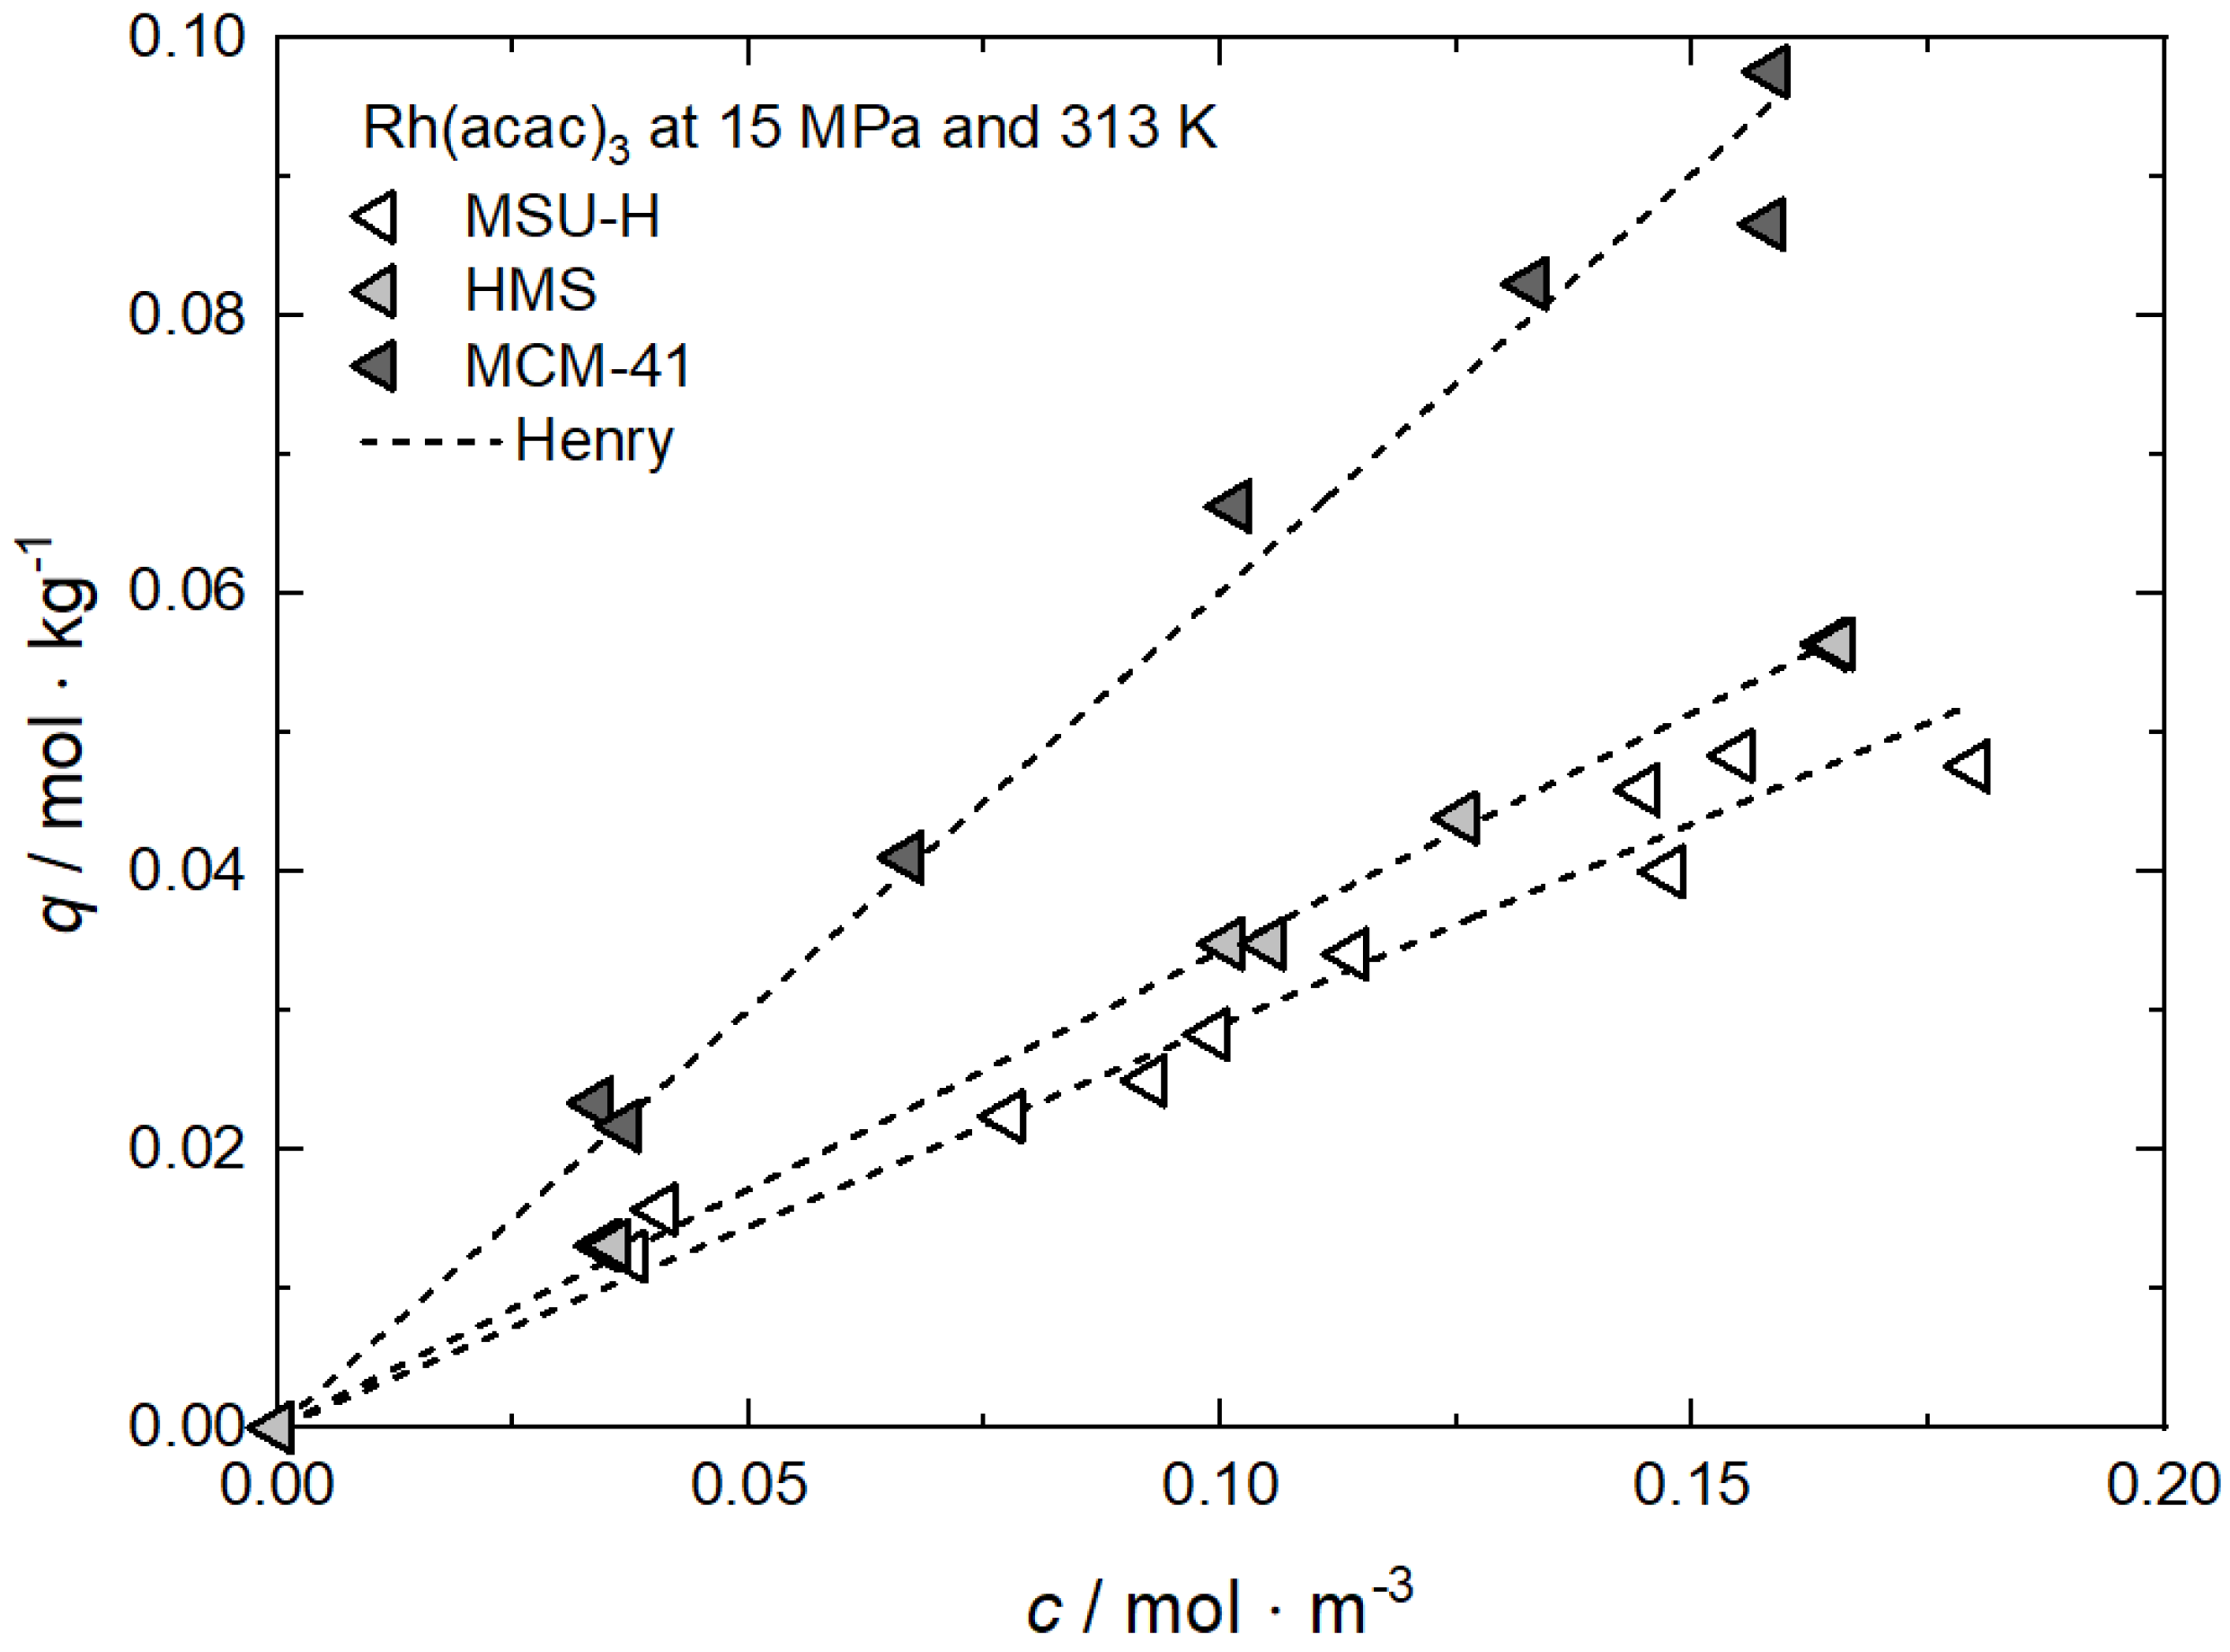

Table A10.
Adsorption isotherm parameters for Rh(acac)3 from scCO2 solution at 15 MPa and 313 K on different substrates [62].
Table A10.
Adsorption isotherm parameters for Rh(acac)3 from scCO2 solution at 15 MPa and 313 K on different substrates [62].
| Equation | Parameter | Unit | MSU-H | HMS | MCM-41 |
|---|---|---|---|---|---|
| Henry | kH | m3·kg−1 | 0.28996 | 0.34319 | 0.60171 |
| R2 | — | 0.96894 | 0.99848 | 0.98662 |

Figure A11.
Uptake of Rh(acac)3 at 15 MPa and 333 K on different substrates; experimental data taken from [62].
Figure A11.
Uptake of Rh(acac)3 at 15 MPa and 333 K on different substrates; experimental data taken from [62].
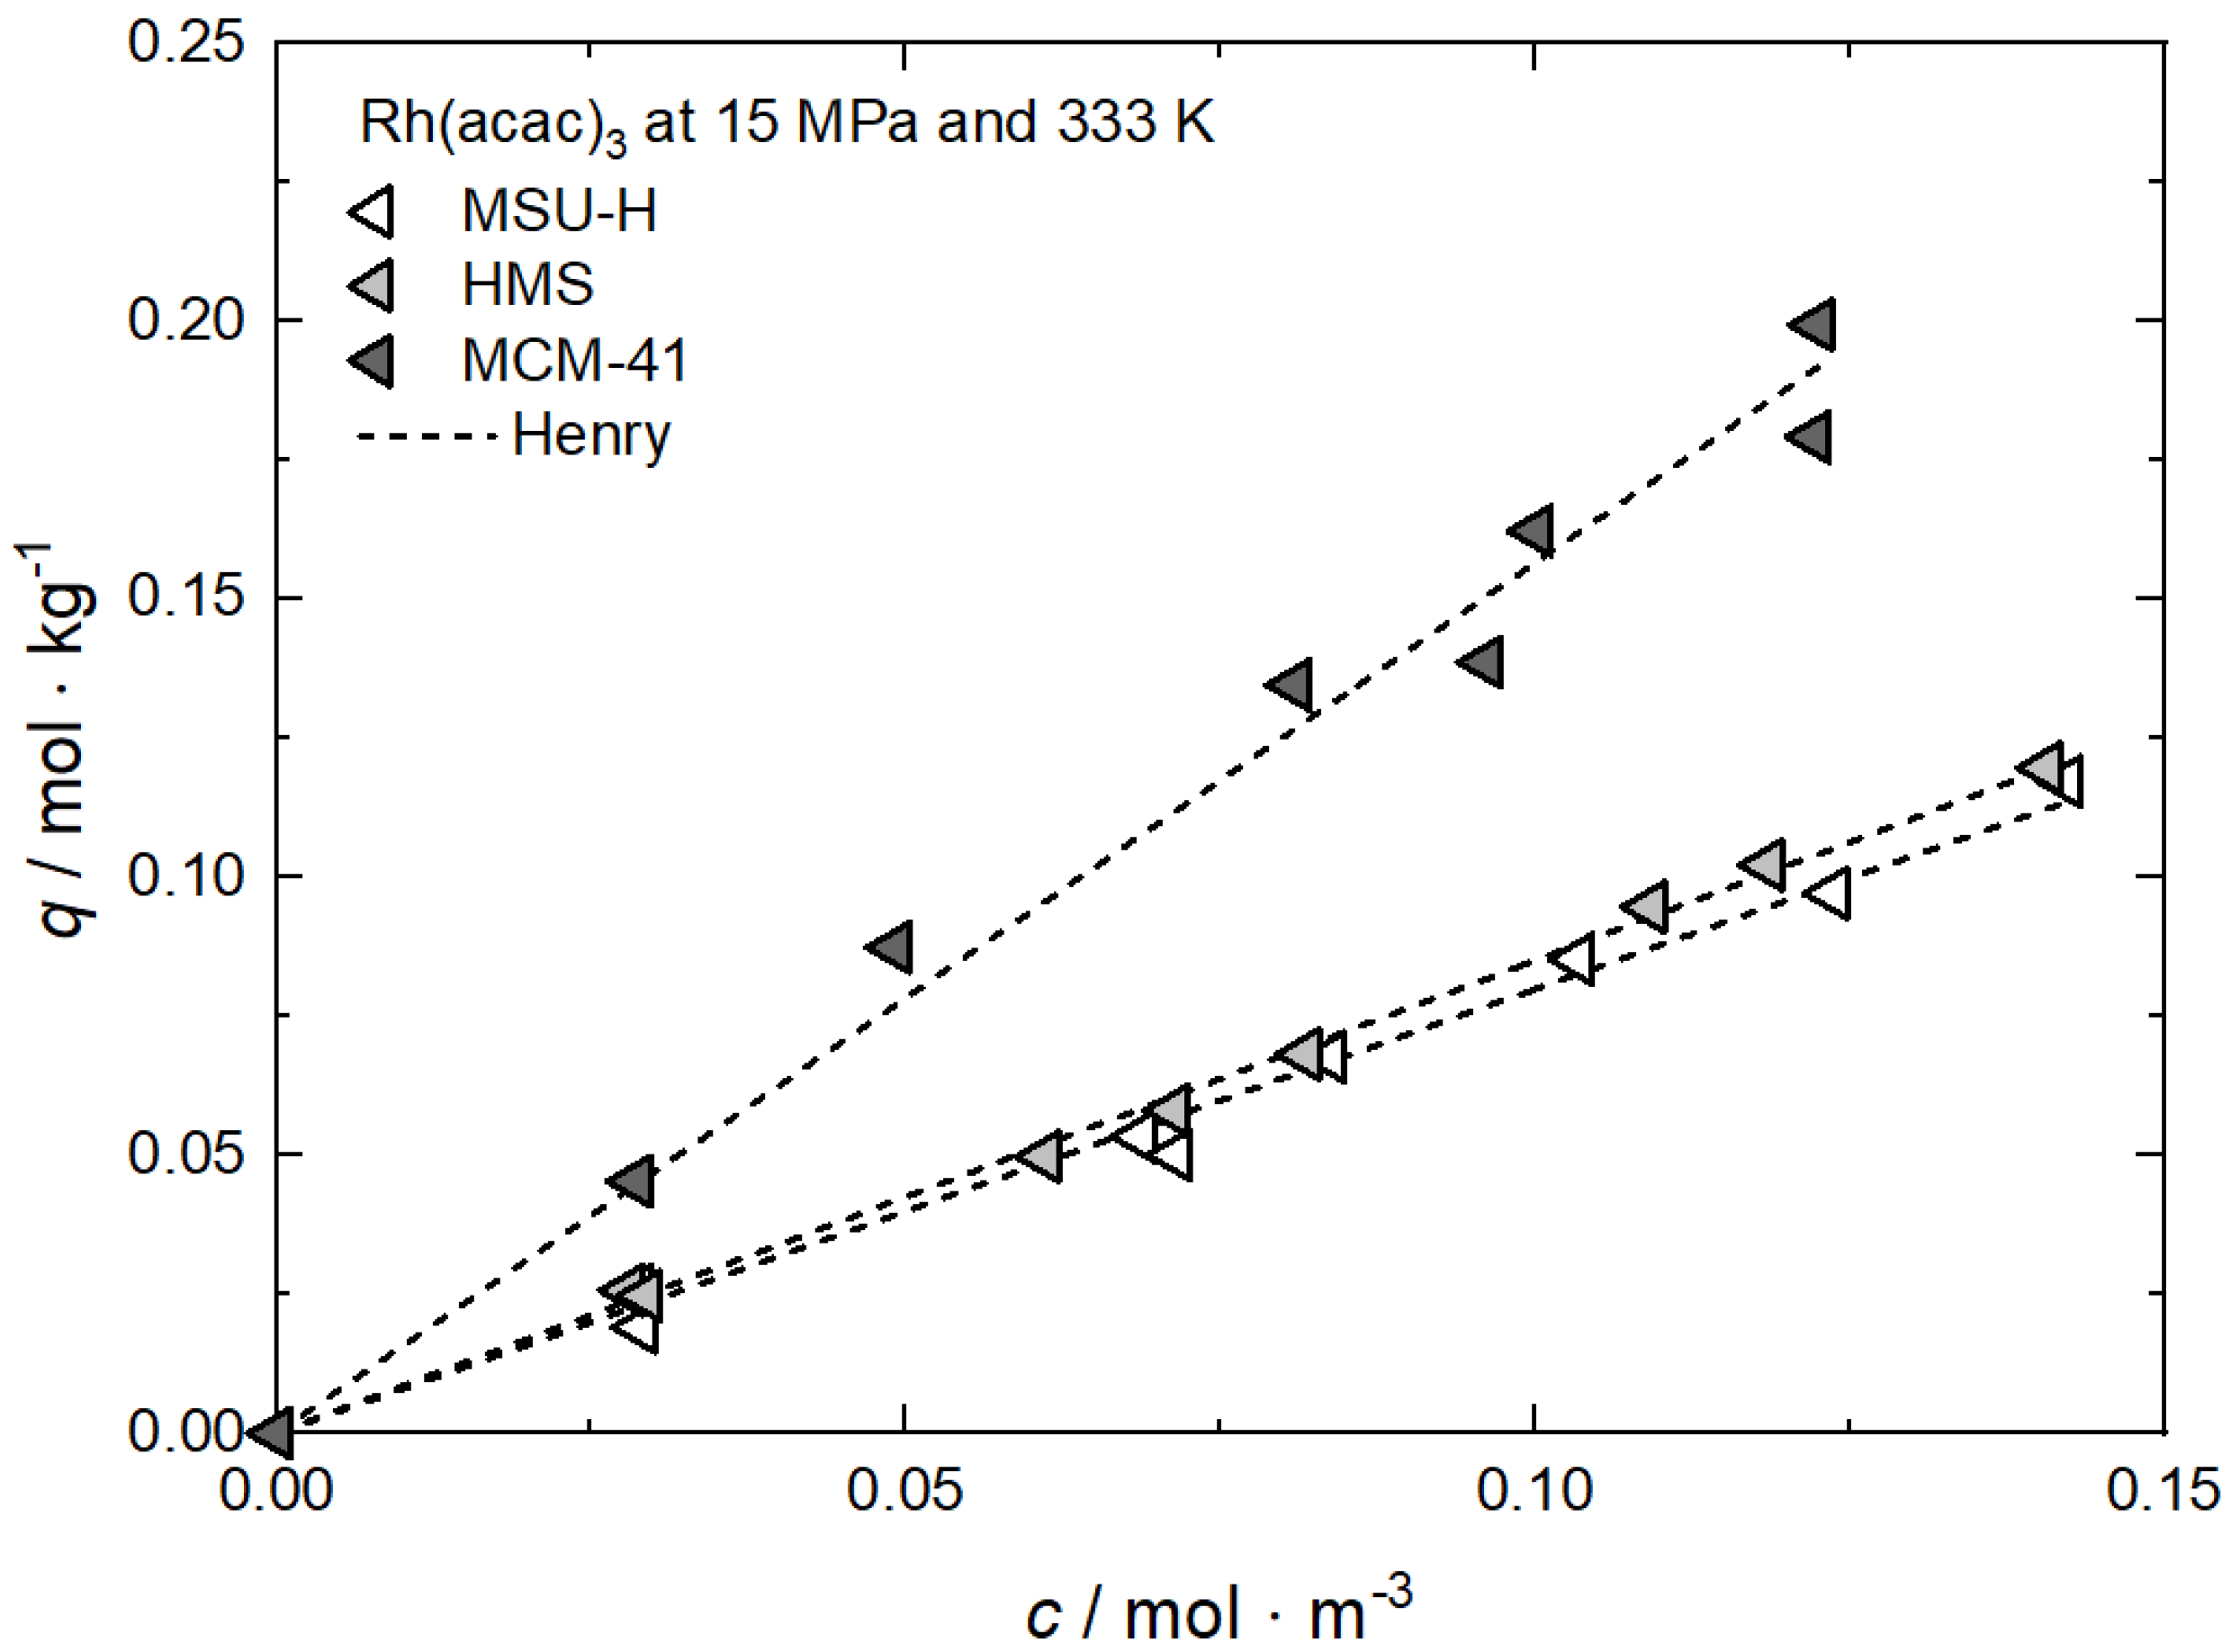

Table A11.
Adsorption isotherm parameters for Rh(acac)3 from scCO2 solution at 15 MPa and 333 K on different substrates [62].
Table A11.
Adsorption isotherm parameters for Rh(acac)3 from scCO2 solution at 15 MPa and 333 K on different substrates [62].
| Equation | Parameter | Unit | MSU-H | HMS | MCM-41 |
|---|---|---|---|---|---|
| Henry | kH | m3·kg−1 | 0.79877 | 0.85050 | 1.56599 |
| R2 | — | 0.99160 | 0.99828 | 0.98361 |

Figure A12.
Uptake of Rh(acac)3 at 15 MPa and 353 K on different substrates; experimental data taken from [62].
Figure A12.
Uptake of Rh(acac)3 at 15 MPa and 353 K on different substrates; experimental data taken from [62].
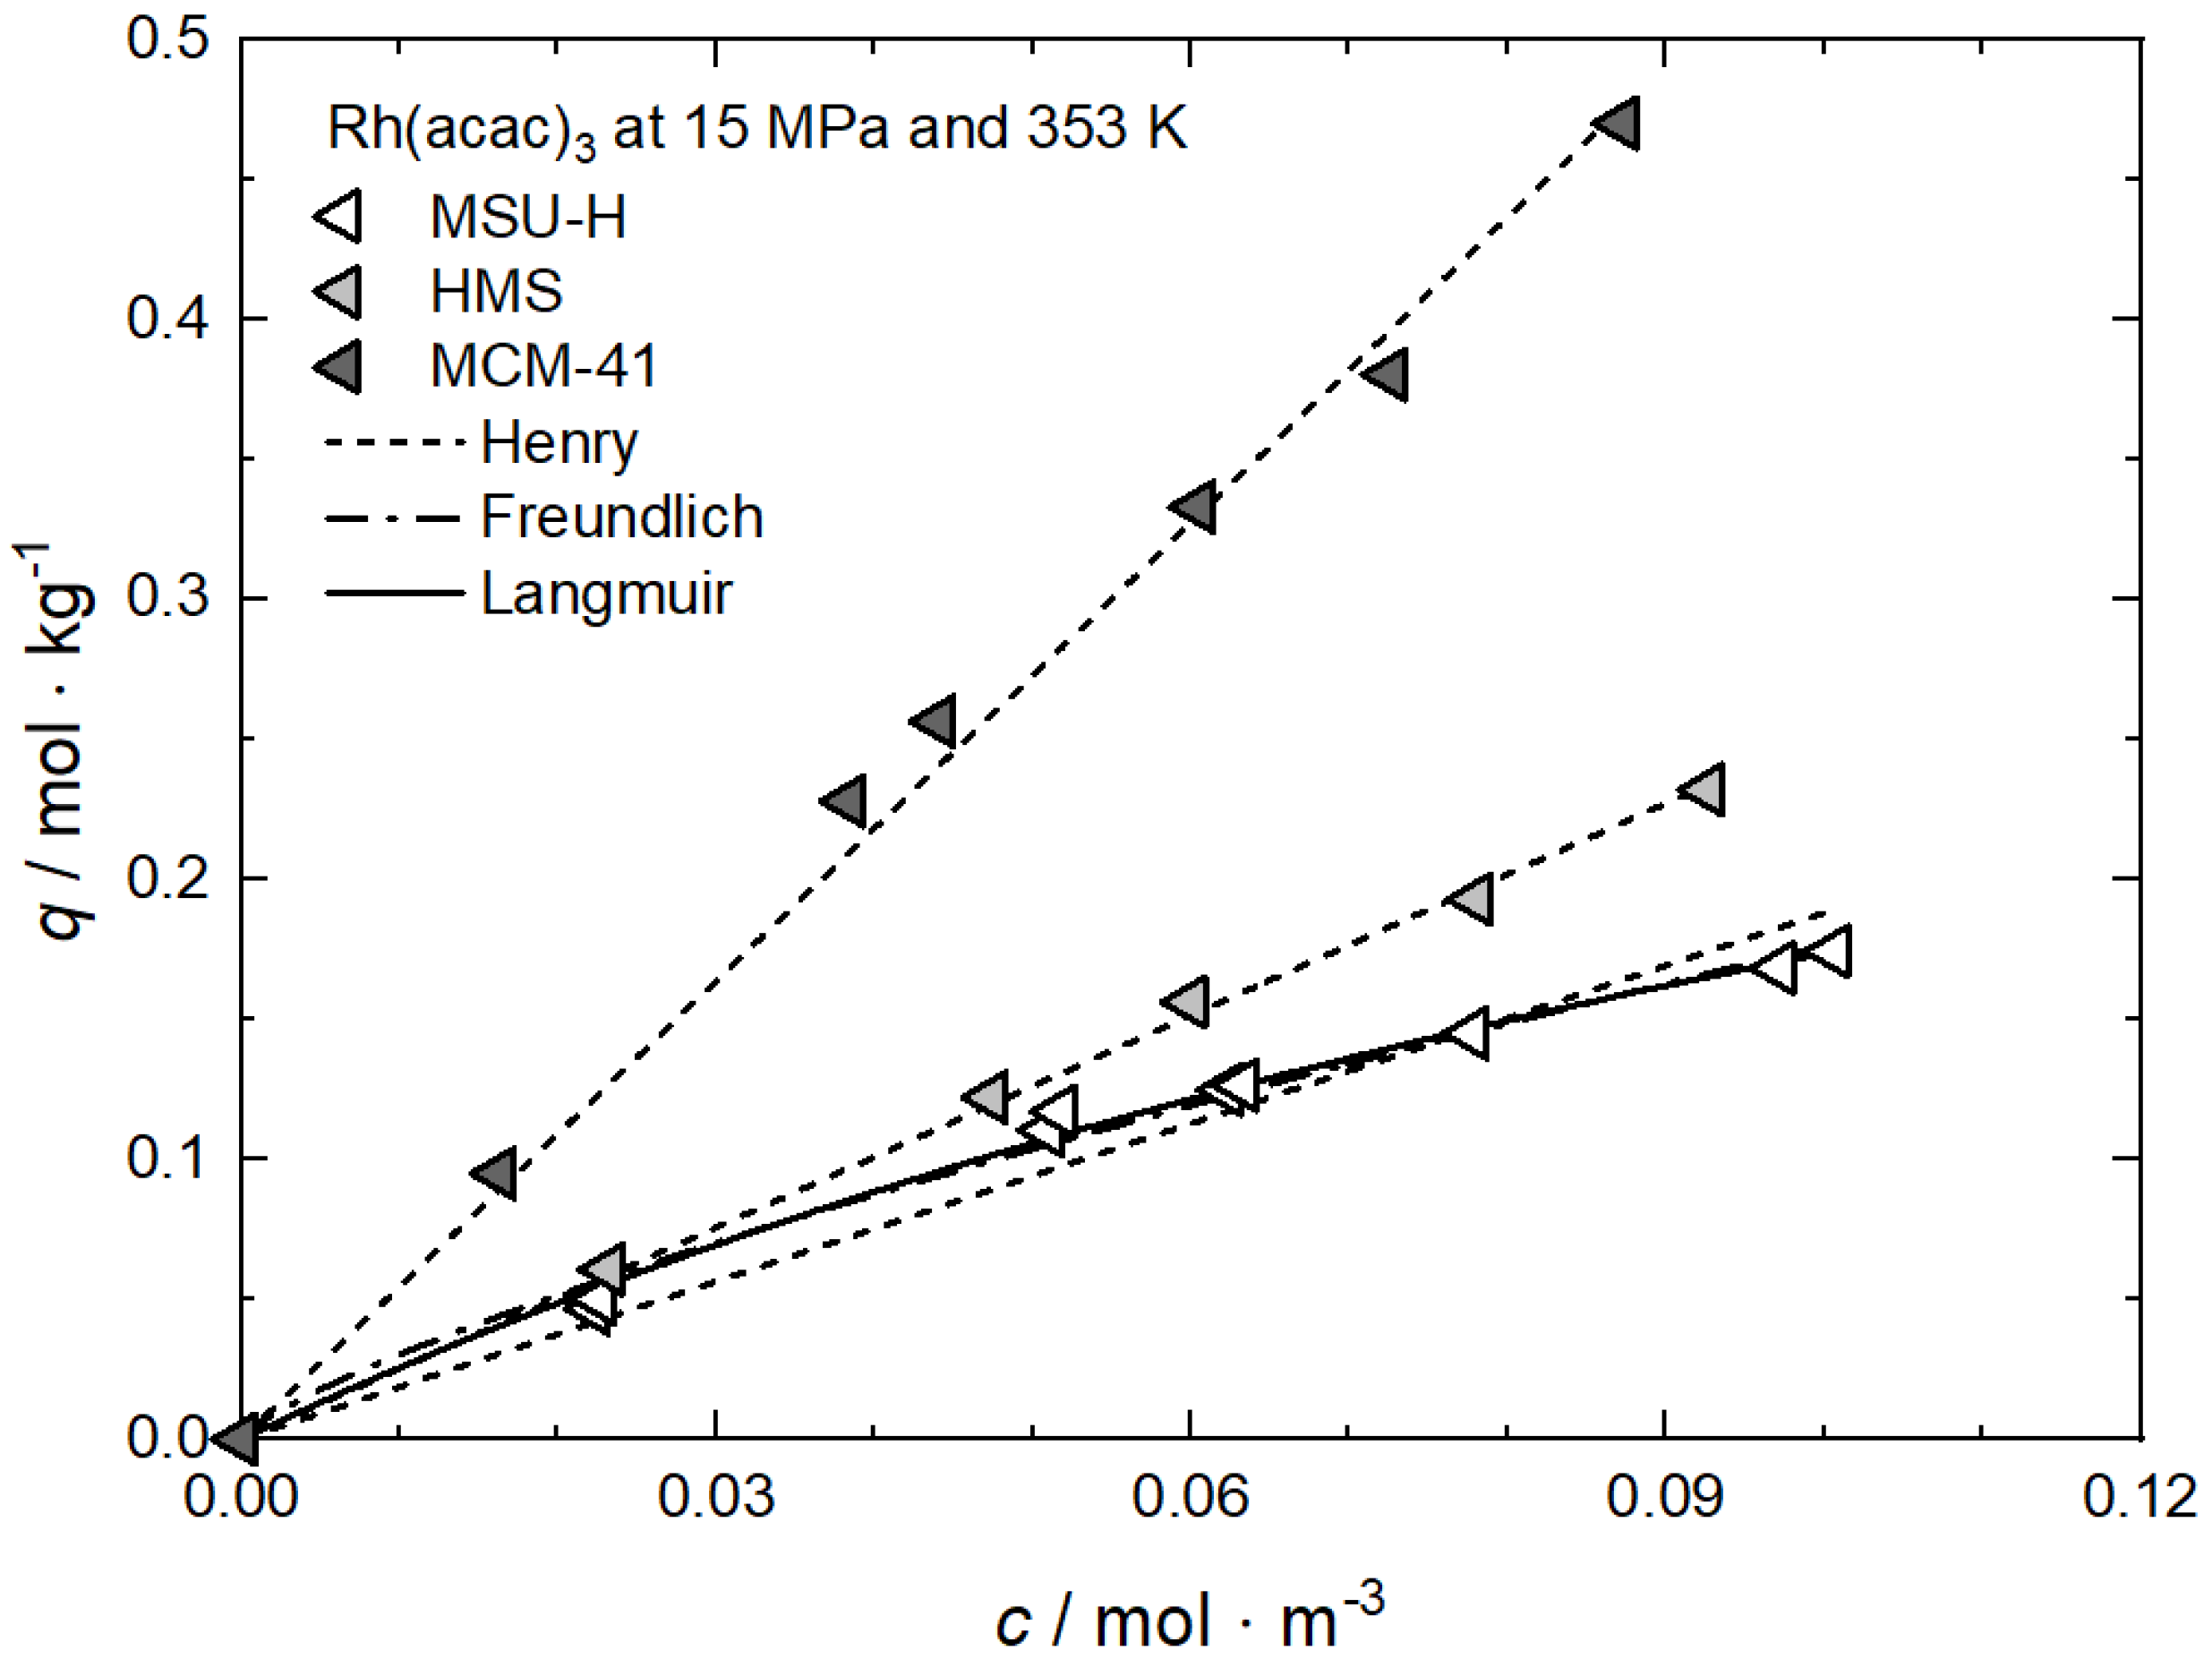

Table A12.
Adsorption isotherm parameters for Rh(acac)3 from scCO2 solution at 15 MPa and 353 K on different substrates [62].
Table A12.
Adsorption isotherm parameters for Rh(acac)3 from scCO2 solution at 15 MPa and 353 K on different substrates [62].
| Equation | Parameter | Unit | MSU-H | HMS | MCM-41 |
|---|---|---|---|---|---|
| Henry | kH | m3·kg−1 | 1.88163 | 2.52470 | 5.45912 |
| R2 | — | 0.95737 | 0.99854 | 0.99420 | |
| Freundlich | kF | m3·kg−1 | 1.02928 | — | — |
| nF | — | 0.76583 | — | — | |
| R2 | — | 0.98811 | — | — | |
| Langmuir | qm | mol·kg−1 | 0.48572 | — | — |
| kL | m3·mol−1 | 5.56882 | — | — | |
| R2 | — | 0.99382 | — | — |

Figure A13.
Uptake of RuCp2 at 11 MPa and 333 K on different substrates; experimental data taken from [64].
Figure A13.
Uptake of RuCp2 at 11 MPa and 333 K on different substrates; experimental data taken from [64].
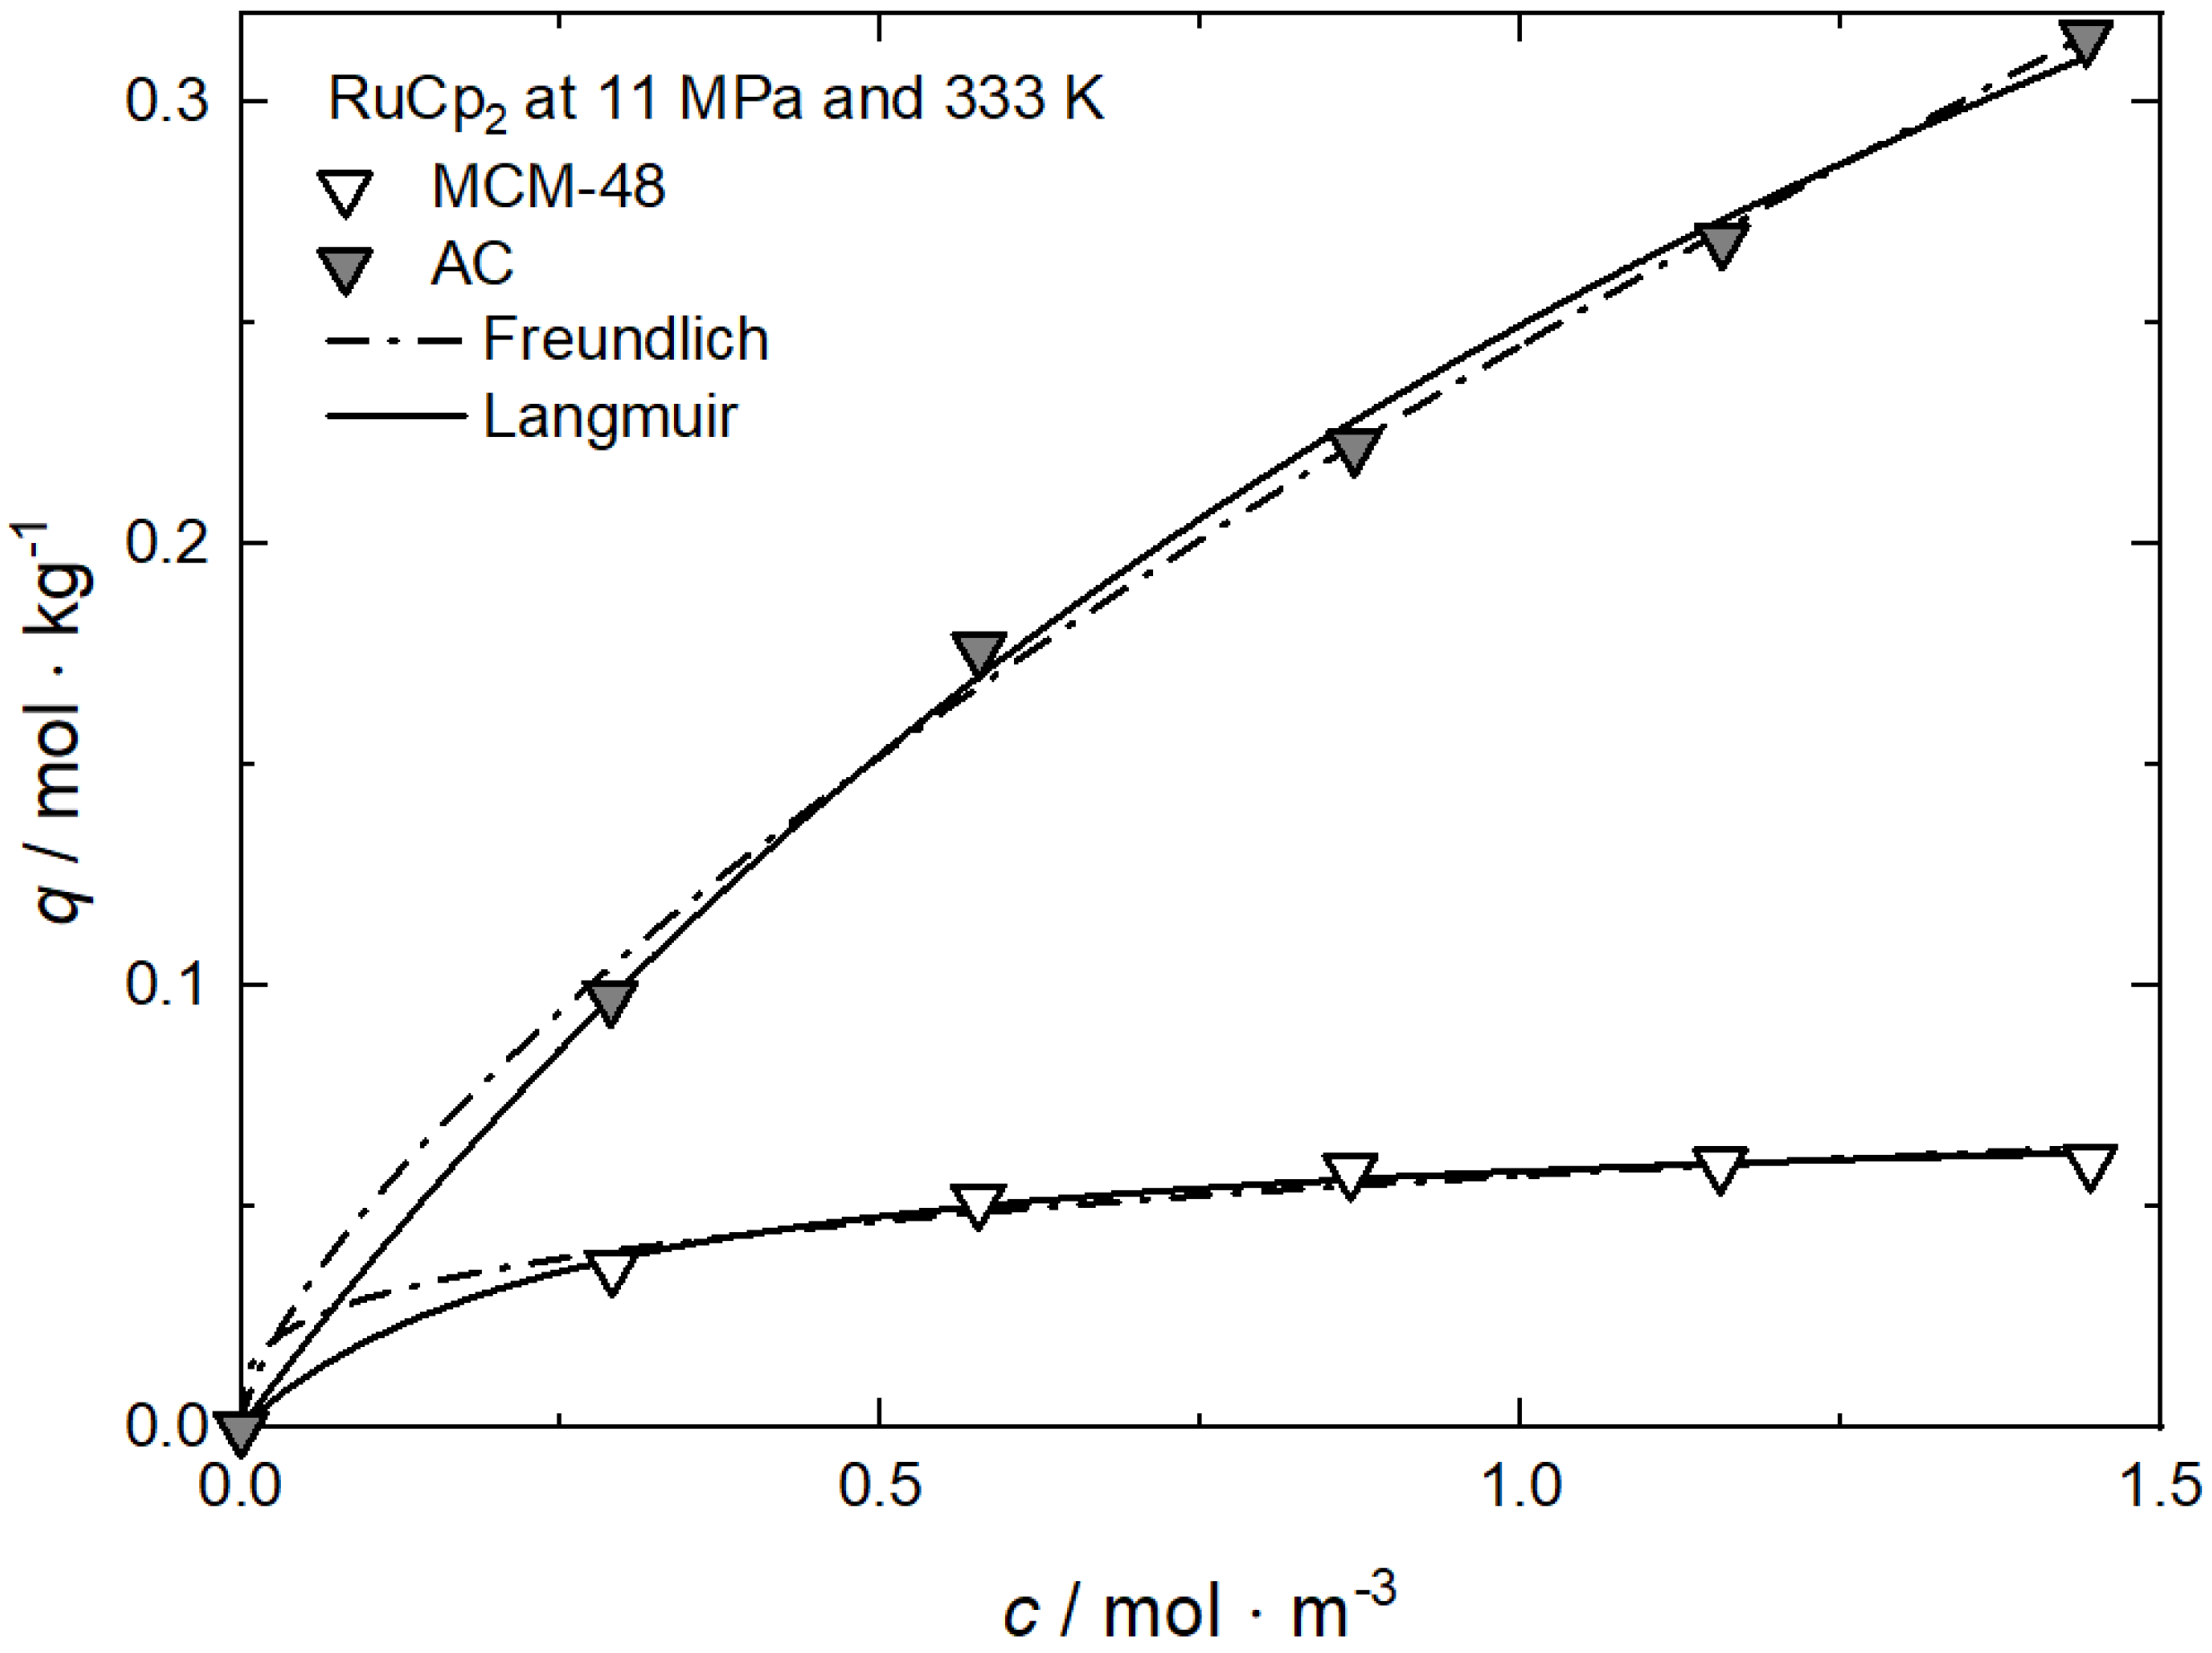

Table A13.
Adsorption isotherm parameters for RuCp2 from scCO2 solution at 11 MPa and 333 K on different substrates [64].
Table A13.
Adsorption isotherm parameters for RuCp2 from scCO2 solution at 11 MPa and 333 K on different substrates [64].
| Equation | Parameter | Unit | MCM-48 | AC |
|---|---|---|---|---|
| Freundlich | kF | m3·kg−1 | 0.05708 | 0.24499 |
| nF | — | 0.28731 | 0.68800 | |
| R2 | — | 0.98154 | 0.99773 | |
| Langmuir | qm | mol·kg−1 | 0.07390 | 0.68825 |
| kL | m3·mol−1 | 3.66984 | 0.56918 | |
| R2 | — | 0.99487 | 0.99793 |

Figure A14.
Uptake of RuCp2 at 14 MPa and 333 K on different substrates; experimental data taken from [64].
Figure A14.
Uptake of RuCp2 at 14 MPa and 333 K on different substrates; experimental data taken from [64].
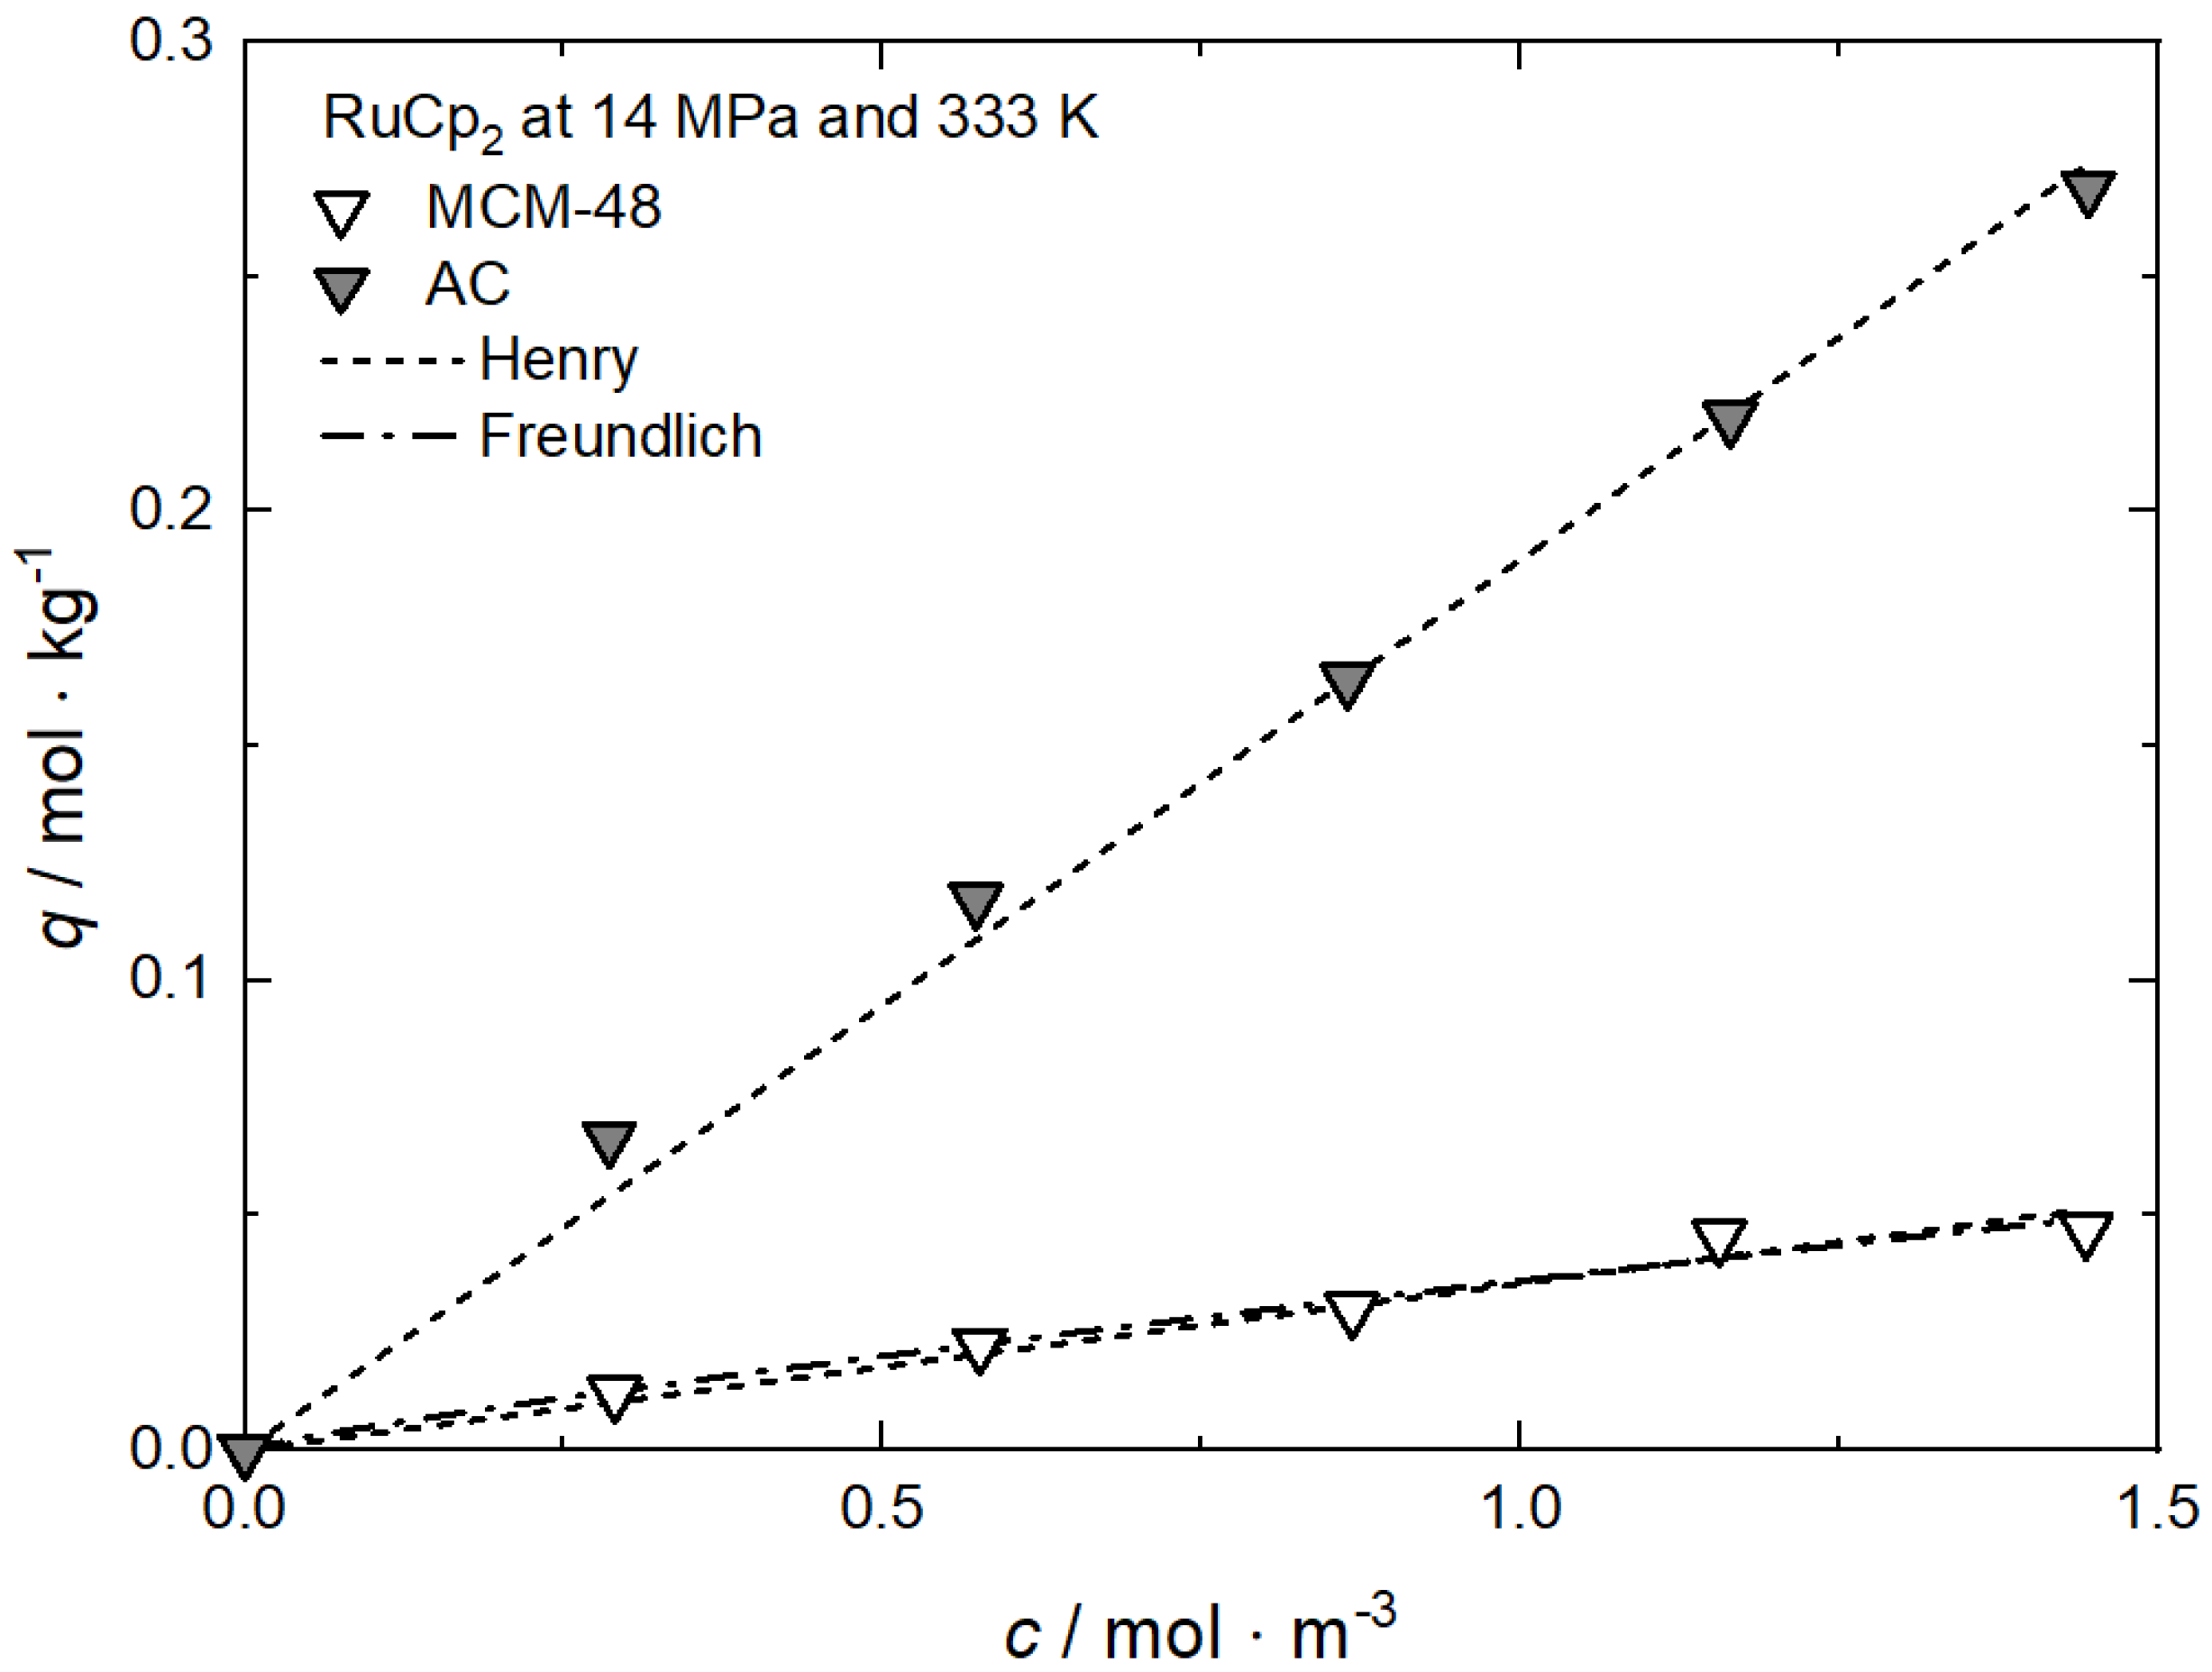

Table A14.
Adsorption isotherm parameters for RuCp2 from scCO2 solution at 14 MPa and 333 K on different substrates [64].
Table A14.
Adsorption isotherm parameters for RuCp2 from scCO2 solution at 14 MPa and 333 K on different substrates [64].
| Equation | Parameter | Unit | MCM-48 | AC |
|---|---|---|---|---|
| Henry | kH | m3·kg−1 | 0.03552 | 0.18965 |
| R2 | — | 0.97211 | 0.99485 | |
| Freundlich | kF | m3·kg−1 | 0.03614 | — |
| nF | — | 0.85081 | — | |
| R2 | — | 0.97637 | — |

Figure A15.
Uptake of RuCp2 at 17 MPa and 333 K on different substrates; experimental data taken from [64].
Figure A15.
Uptake of RuCp2 at 17 MPa and 333 K on different substrates; experimental data taken from [64].
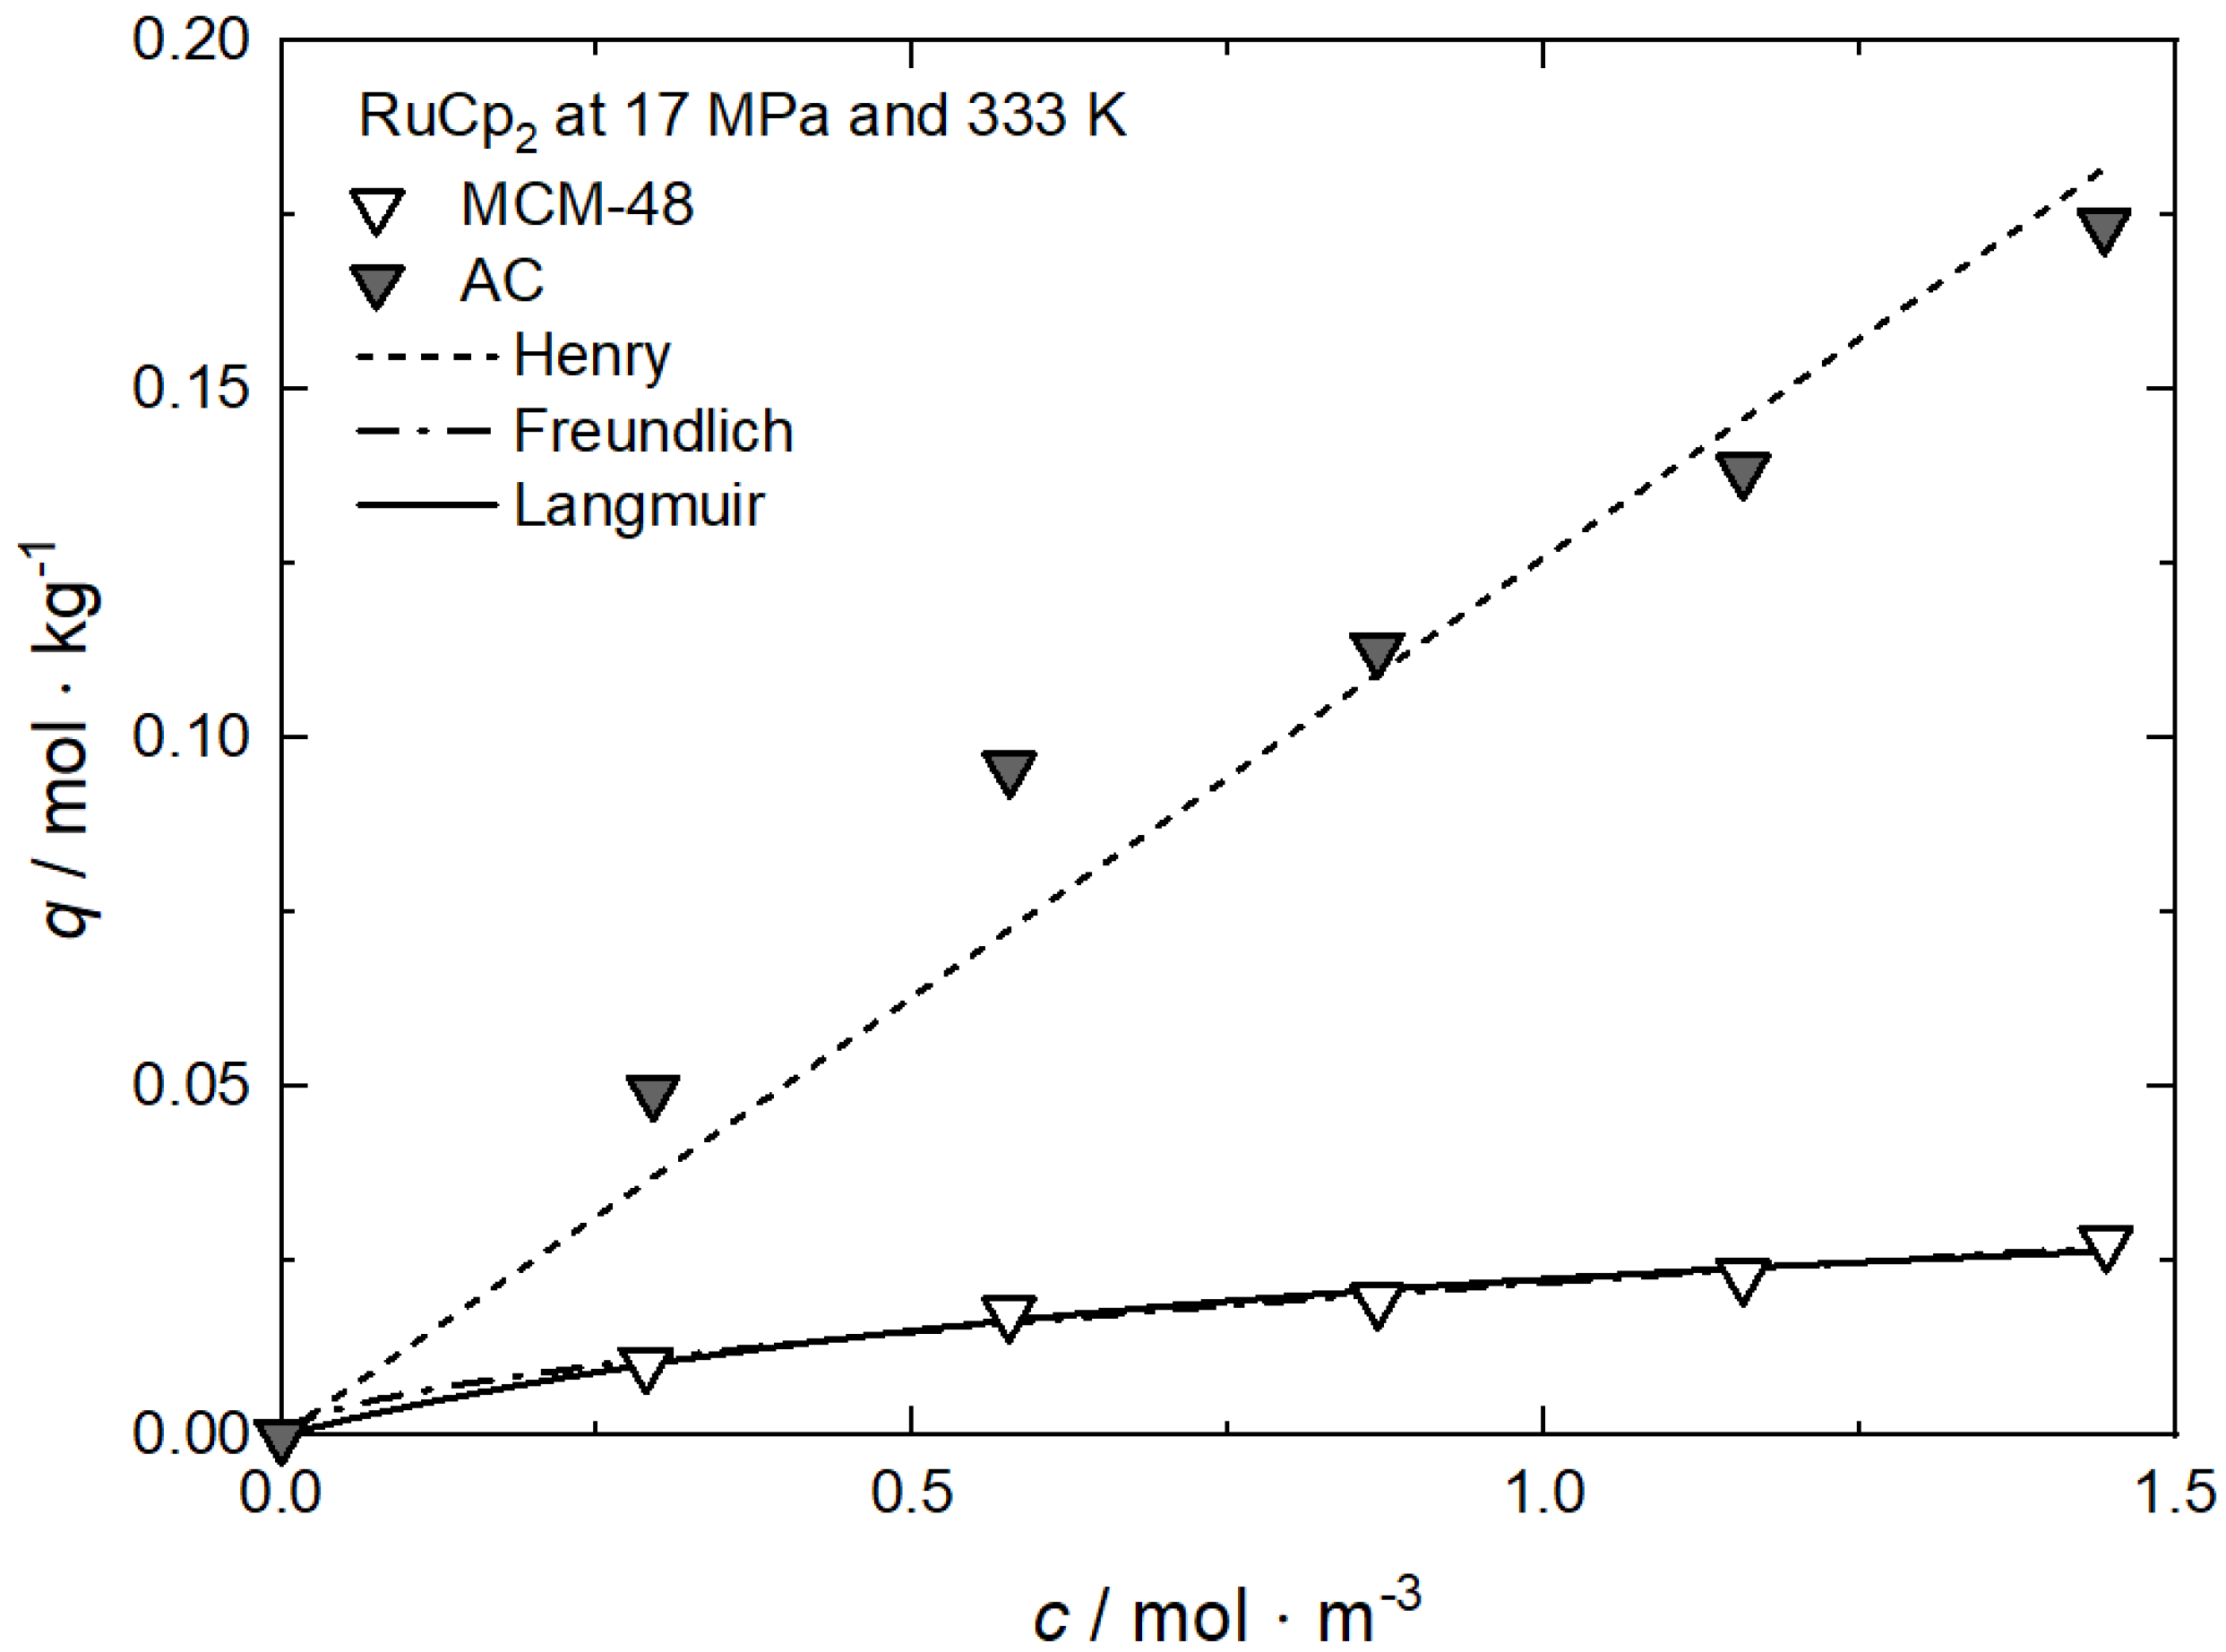

Table A15.
Adsorption isotherm parameters for RuCp2 from scCO2 solution at 17 MPa and 333 K on different substrates [64].
Table A15.
Adsorption isotherm parameters for RuCp2 from scCO2 solution at 17 MPa and 333 K on different substrates [64].
| Equation | Parameter | Unit | MCM-48 | AC |
|---|---|---|---|---|
| Henry | kH | m3·kg−1 | — | 0.12586 |
| R2 | — | — | 0.95812 | |
| Freundlich | kF | m3·kg−1 | 0.02193 | — |
| nF | — | 0.56304 | — | |
| R2 | — | 0.98778 | — | |
| Langmuir | qm | mol·kg−1 | 0.04400 | — |
| kL | m3·mol−1 | 1.03703 | — | |
| R2 | — | 0.98406 | — |

Figure A16.
Uptake of Pt(cod)me2 at 10.6/10.7 MPa and 308 K on different substrates; experimental data taken from [10,58].
Figure A16.
Uptake of Pt(cod)me2 at 10.6/10.7 MPa and 308 K on different substrates; experimental data taken from [10,58].
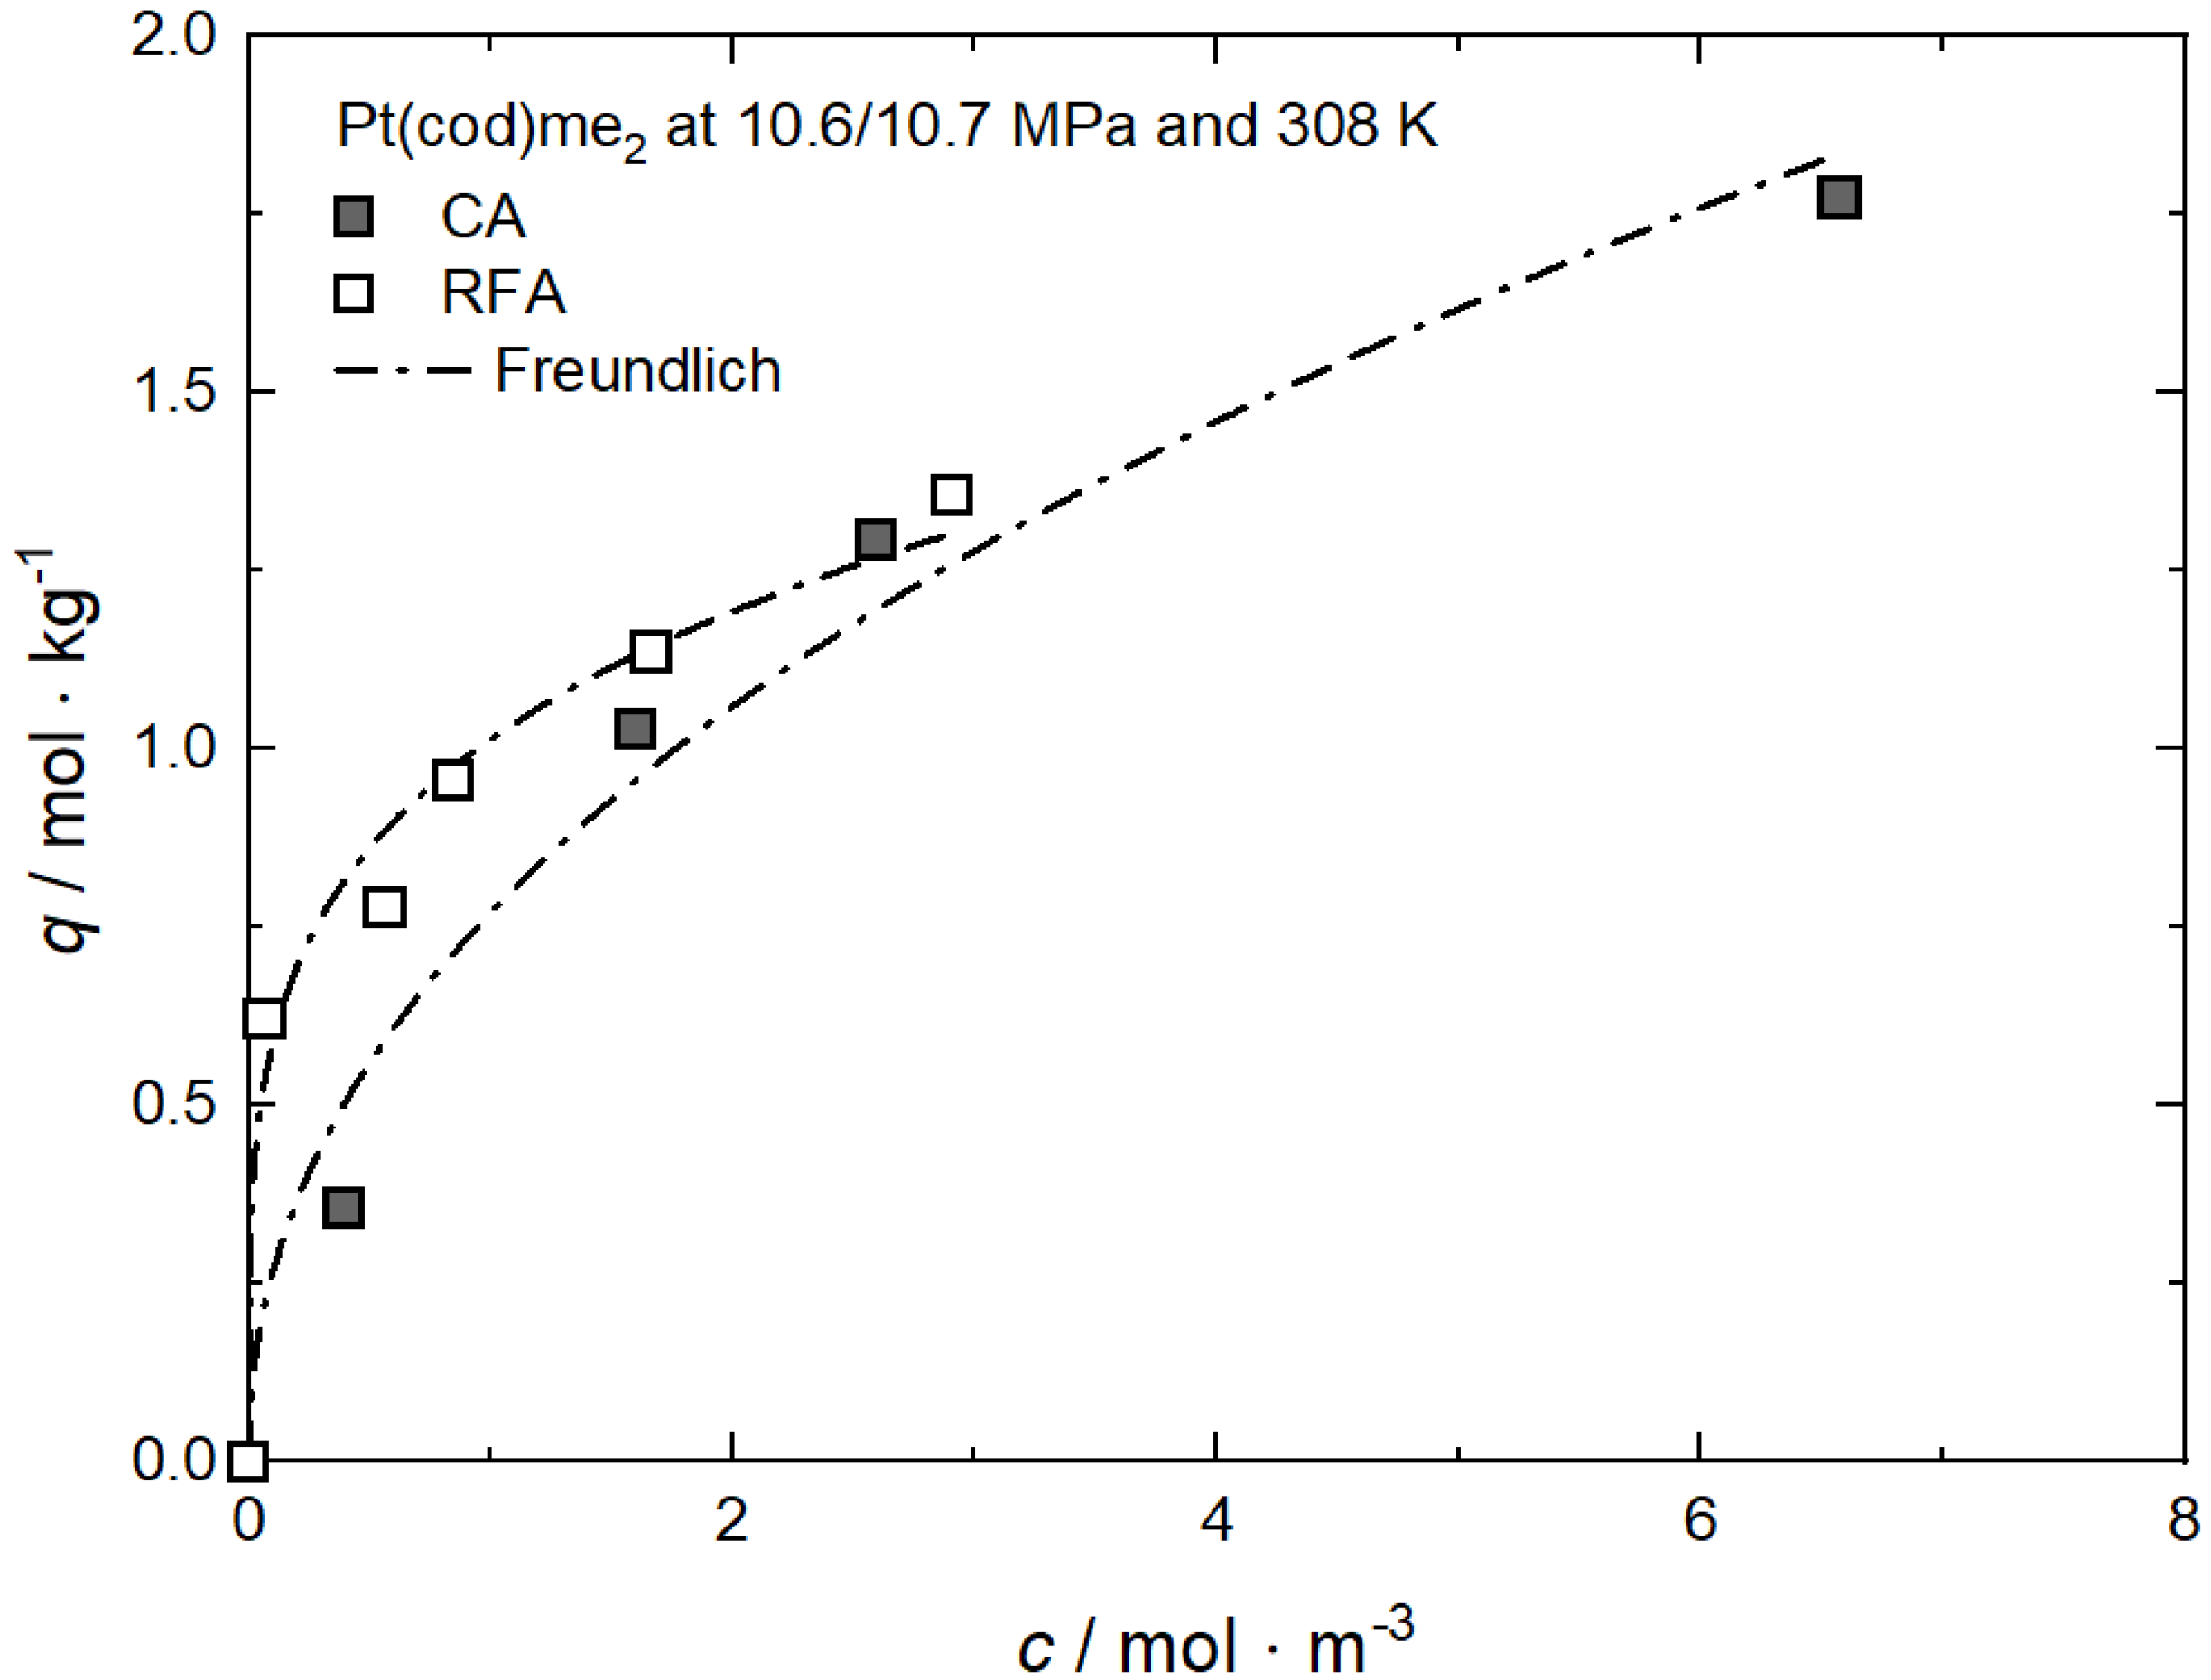

Table A16.
Adsorption isotherm parameters for Pt(cod)me2 from scCO2 solution at 10.6/10.7 MPa and 308 K on different substrates [10,58].
Table A16.
Adsorption isotherm parameters for Pt(cod)me2 from scCO2 solution at 10.6/10.7 MPa and 308 K on different substrates [10,58].
| Equation | Parameter | Unit | CA | RFA |
|---|---|---|---|---|
| Freundlich | kF | m3·kg−1 | 0.77042 | 1.01382 |
| nF | — | 0.46093 | 0.23476 | |
| R2 | — | 0.97365 | 0.97509 |
Appendix D. Comparison between Experimental and Calculated Data for Adsorption Isotherms: Precursor Influence

Figure A17.
Uptake of different precursors on CA at 10.6 MPa and 308 K; experimental data taken from [58].
Figure A17.
Uptake of different precursors on CA at 10.6 MPa and 308 K; experimental data taken from [58].
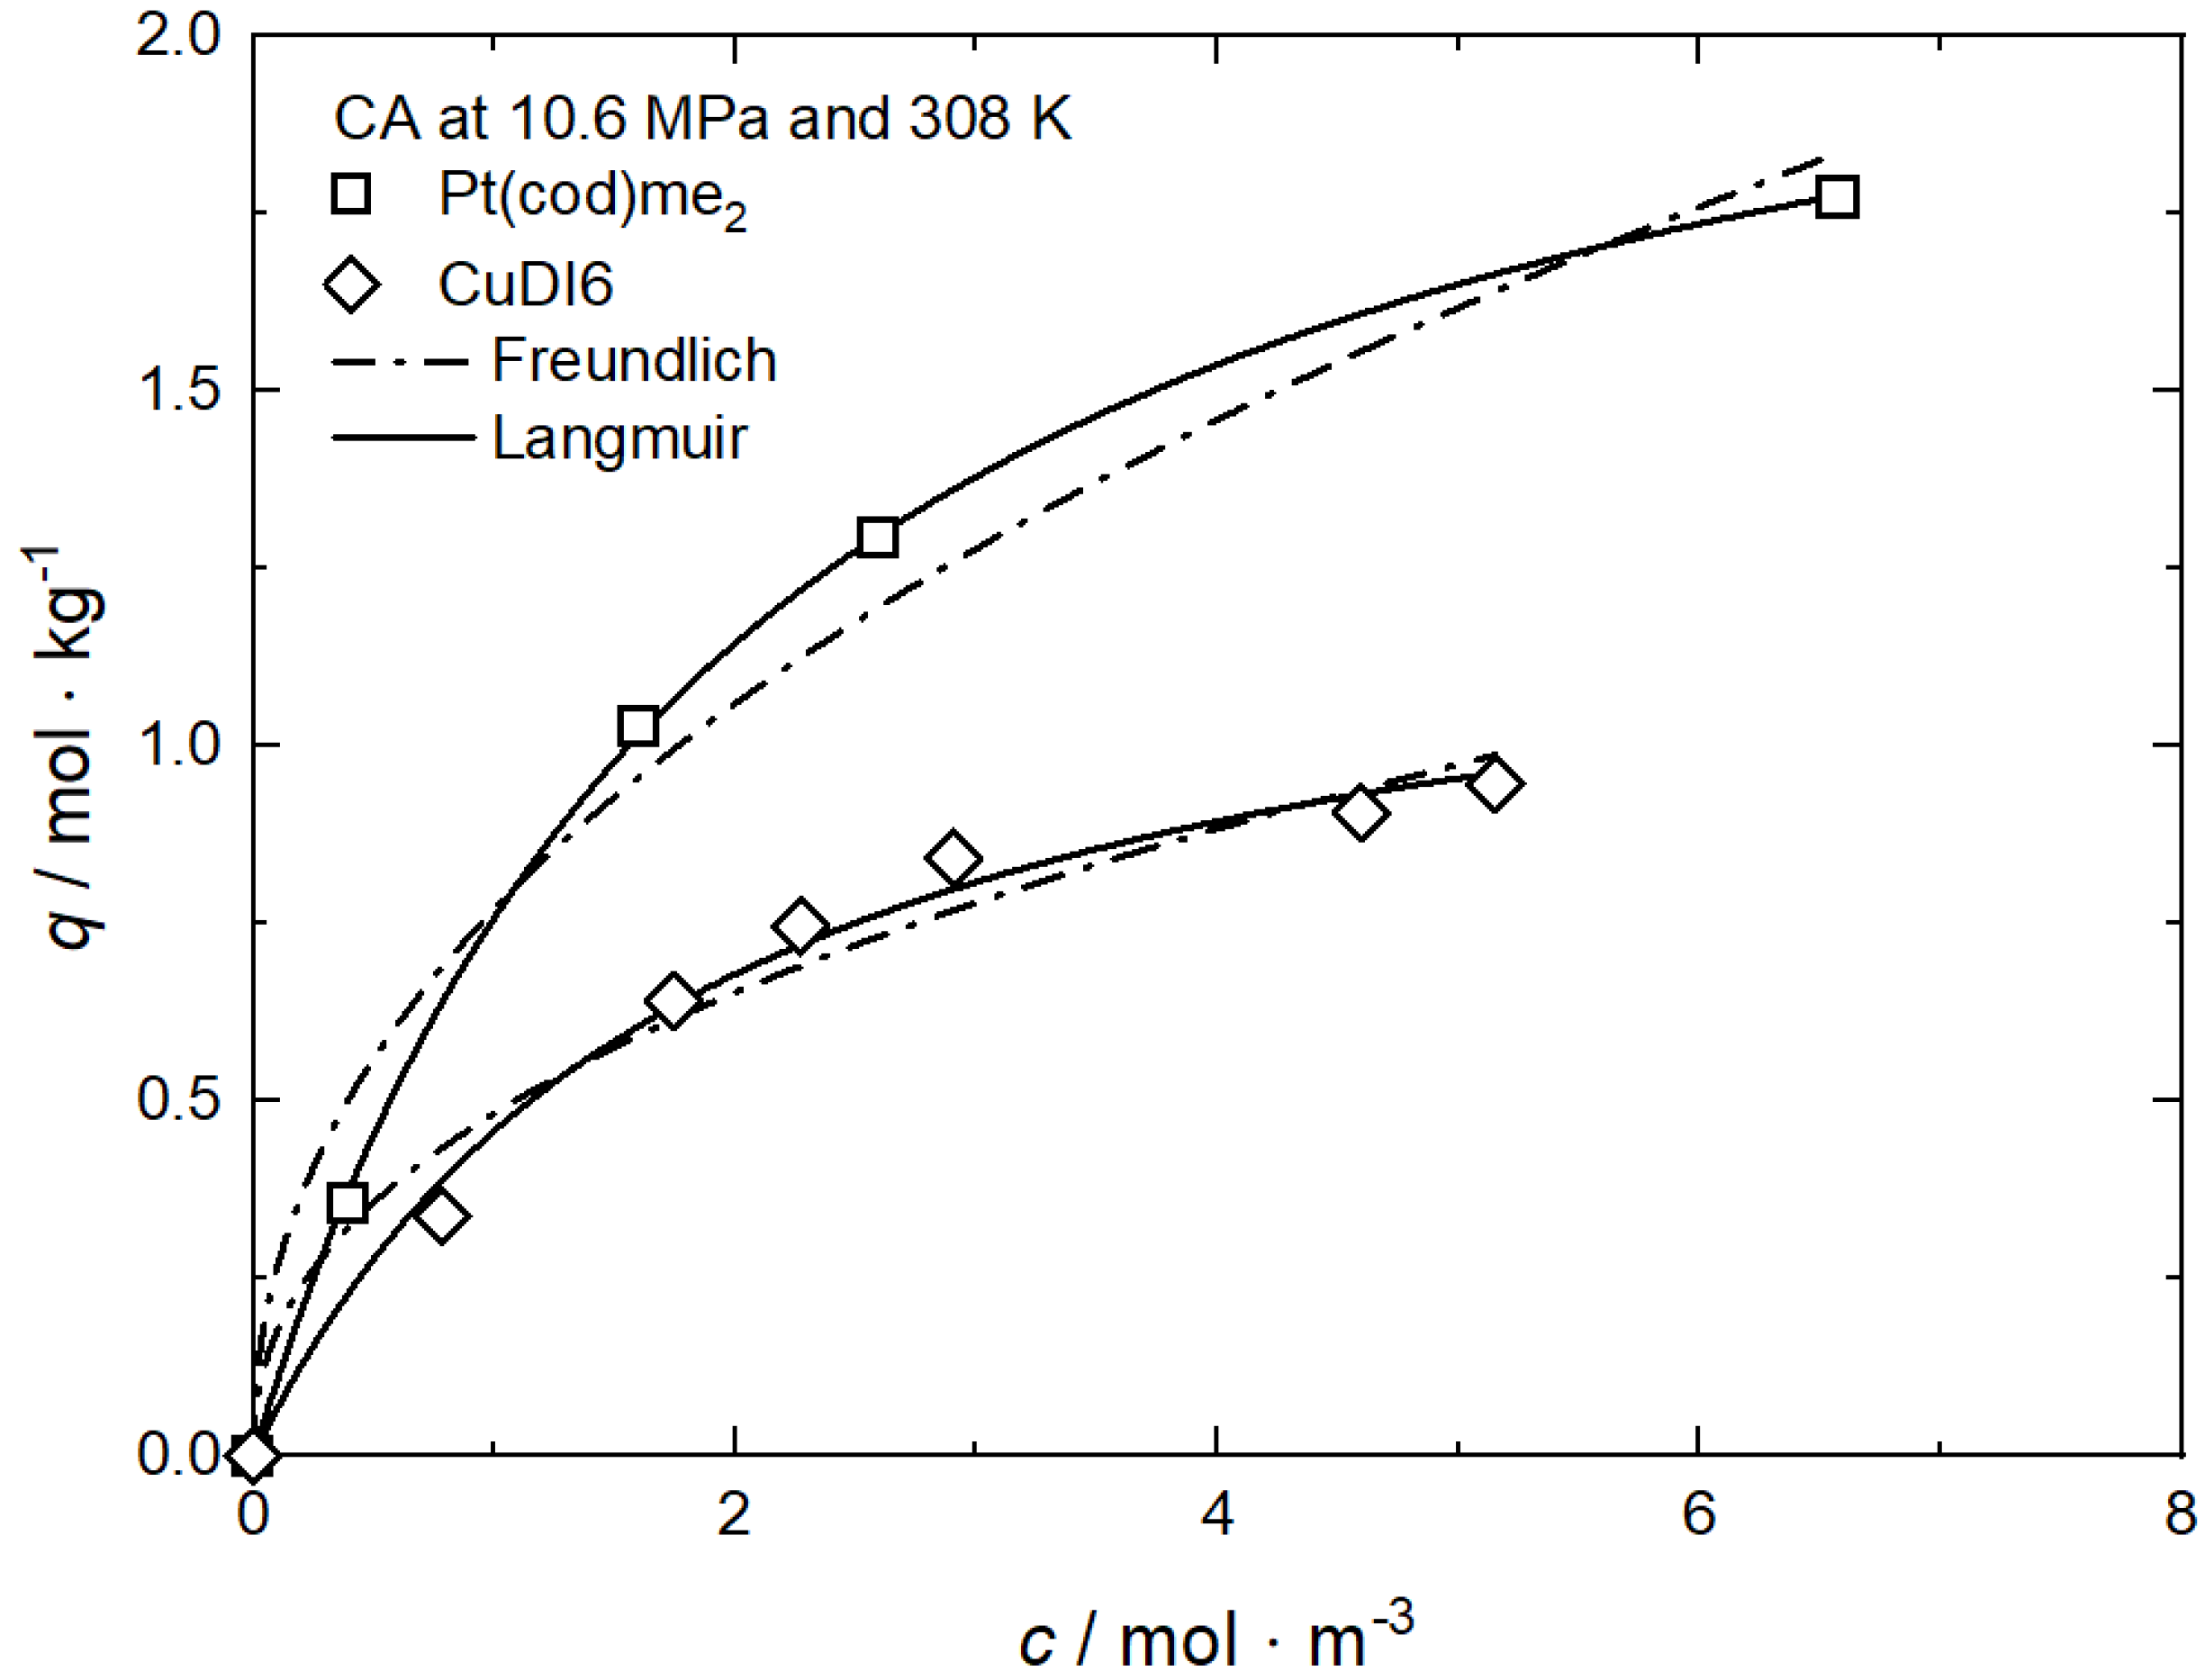

Table A17.
Adsorption isotherm parameters of different precursors from scCO2 solution on CA at 10.6 MPa and 308 K [58].
Table A17.
Adsorption isotherm parameters of different precursors from scCO2 solution on CA at 10.6 MPa and 308 K [58].
| Equation | Parameter | Unit | CuDI6 | Pt(cod)me2 |
|---|---|---|---|---|
| Freundlich | kF | m3·kg−1 | 0.48267 | 0.77042 |
| nF | — | 0.43626 | 0.46093 | |
| R2 | — | 0.96502 | 0.97365 | |
| Langmuir | qm | mol·kg−1 | 1.30948 | 2.33880 |
| kL | m3·mol−1 | 0.53812 | 0.47972 | |
| R2 | — | 0.99000 | 0.99965 |

Figure A18.
Uptake of different precursors on CA4 at 27.6/27.7 MPa and 353 K; experimental data taken from [37,53].
Figure A18.
Uptake of different precursors on CA4 at 27.6/27.7 MPa and 353 K; experimental data taken from [37,53].
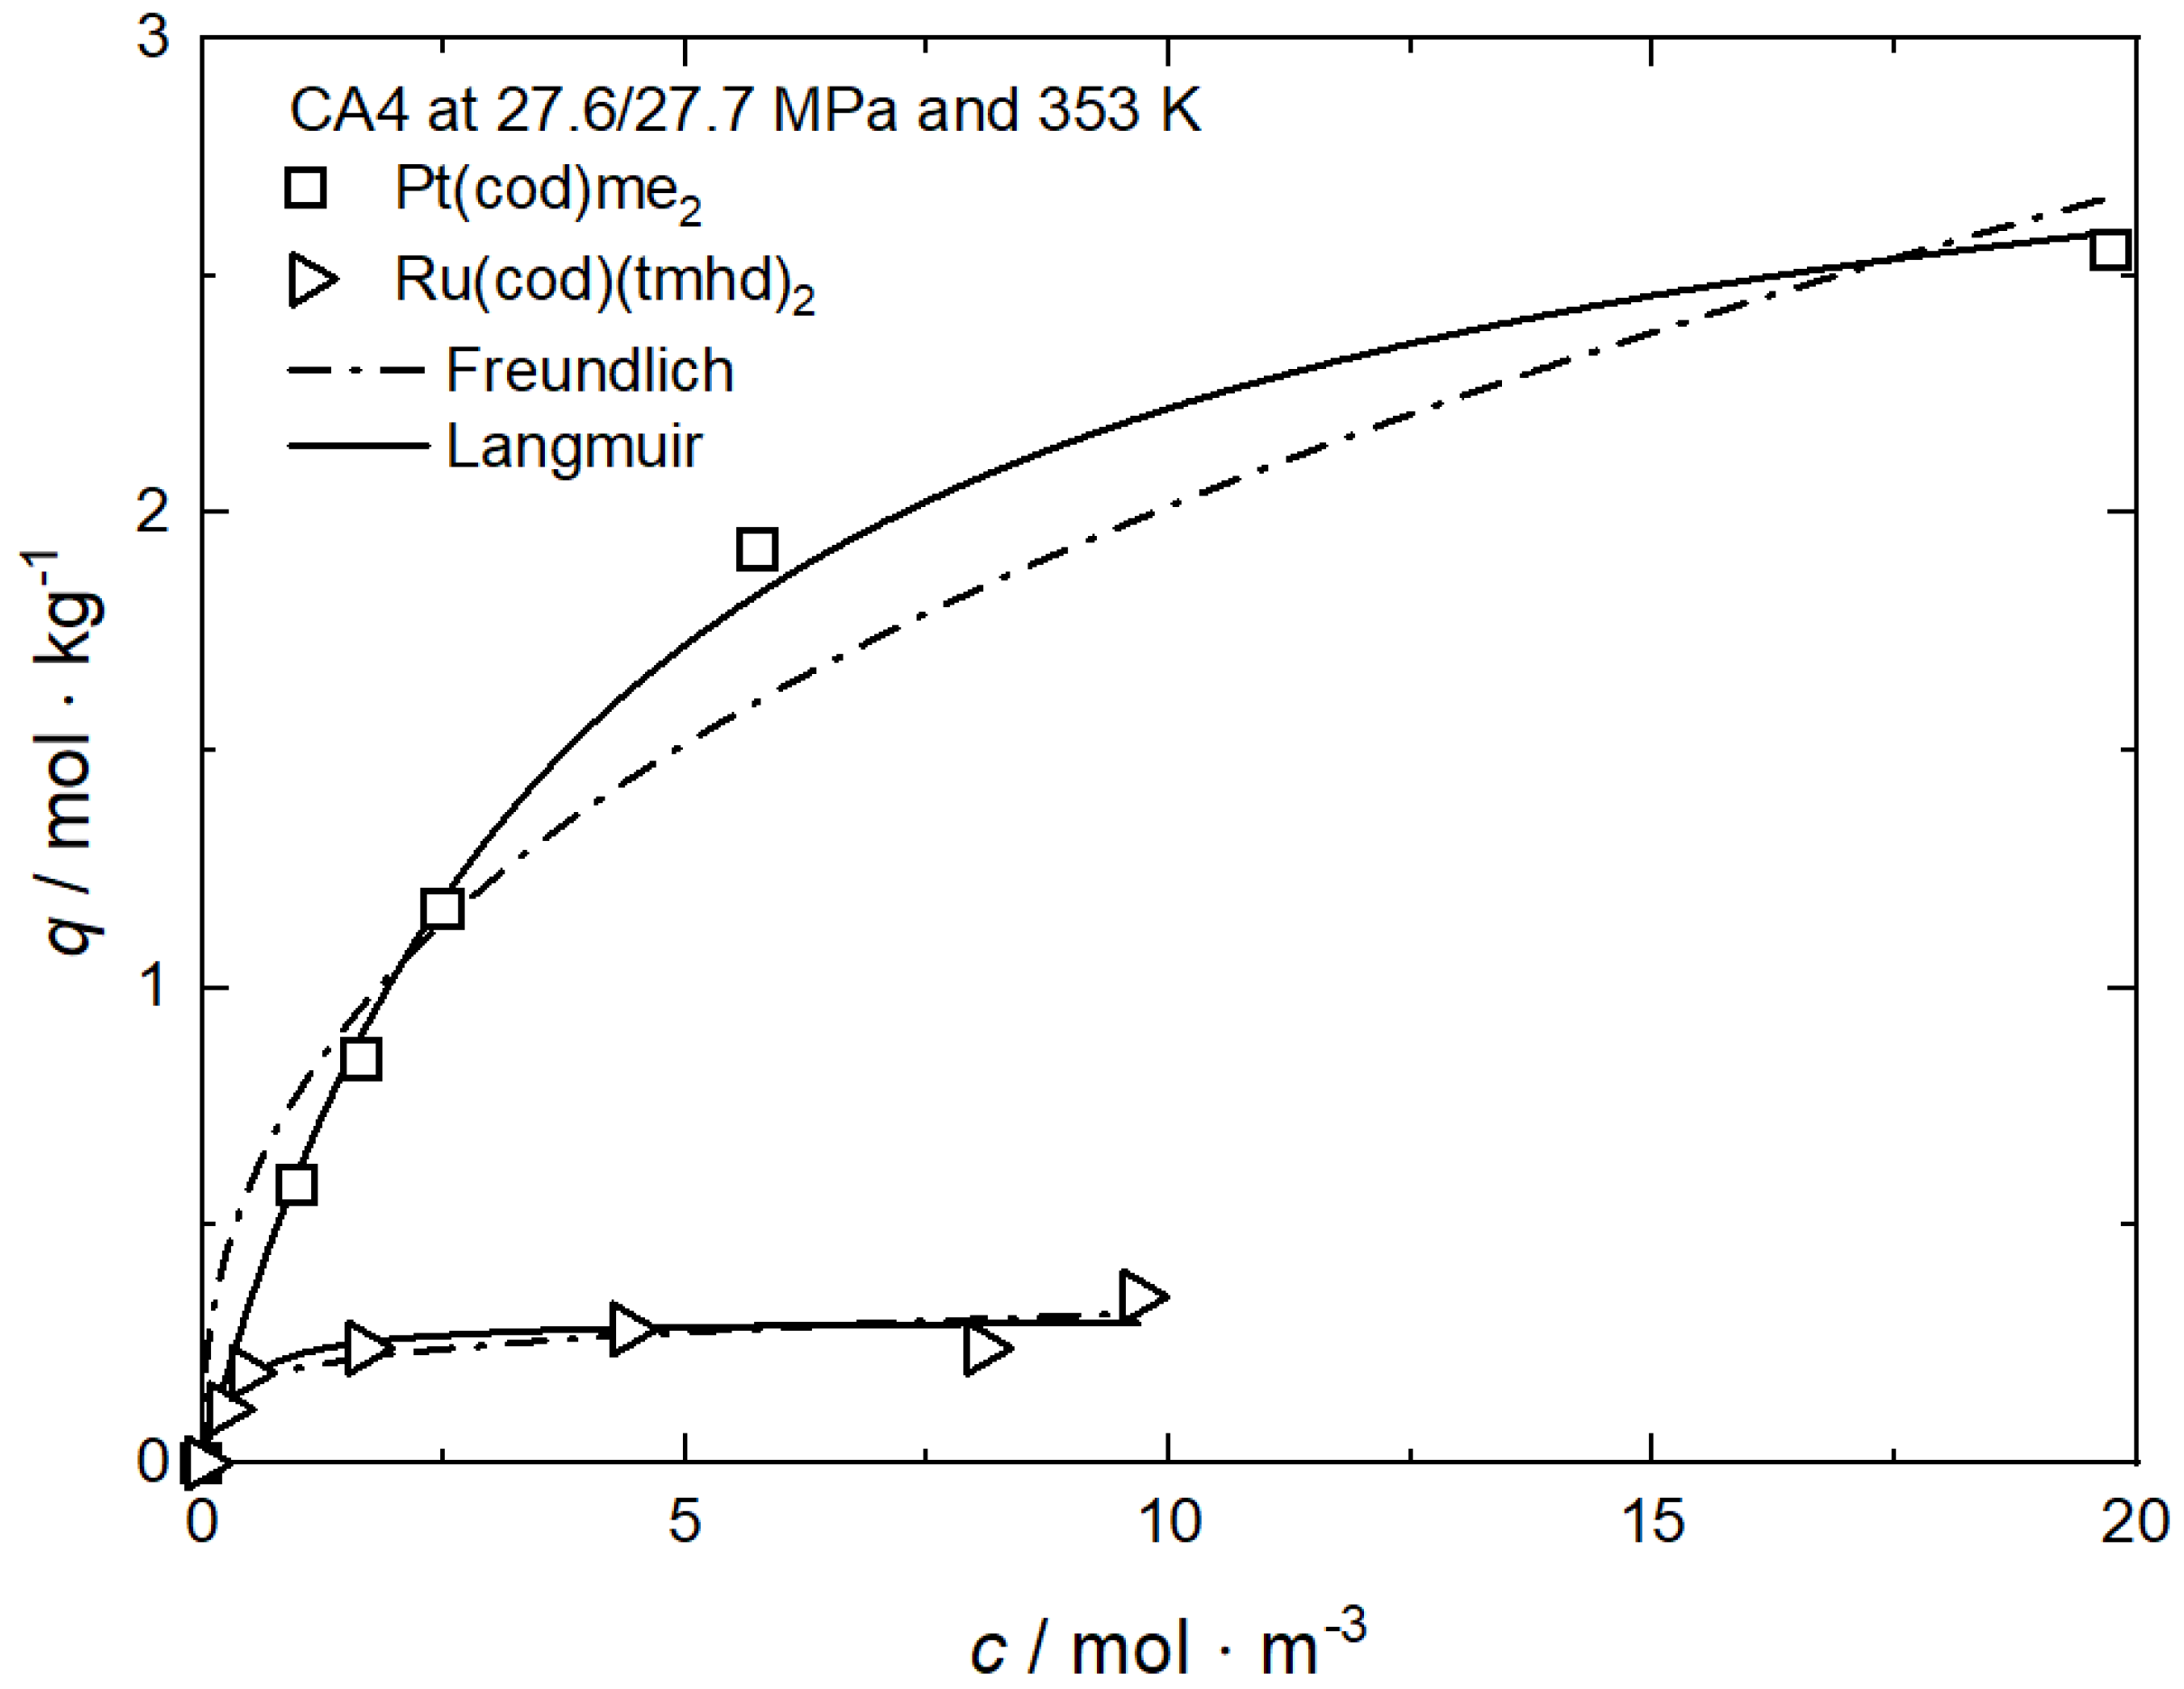

Table A18.
Adsorption isotherm parameters of different precursors from scCO2 solution on CA4 at 27.6/27.7 MPa and 353 K [37,53].
Table A18.
Adsorption isotherm parameters of different precursors from scCO2 solution on CA4 at 27.6/27.7 MPa and 353 K [37,53].
| Equation | Parameter | Unit | Pt(cod)me2 | Ru(cod)(tmhd)2 |
|---|---|---|---|---|
| Freundlich | kF | m3·kg−1 | 0.78177 | 0.20002 |
| nF | — | 0.41135 | 0.19953 | |
| R2 | — | 0.95267 | 0.89313 | |
| Langmuir | qm | mol·kg−1 | 3.12599 | 0.30537 |
| kL | m3·mol−1 | 0.24573 | 3.00483 | |
| R2 | — | 0.99615 | 0.90971 |

Figure A19.
Uptake of different precursors on CA22 at 27.6/27.7 MPa and 353 K; experimental data taken from [37,63].
Figure A19.
Uptake of different precursors on CA22 at 27.6/27.7 MPa and 353 K; experimental data taken from [37,63].
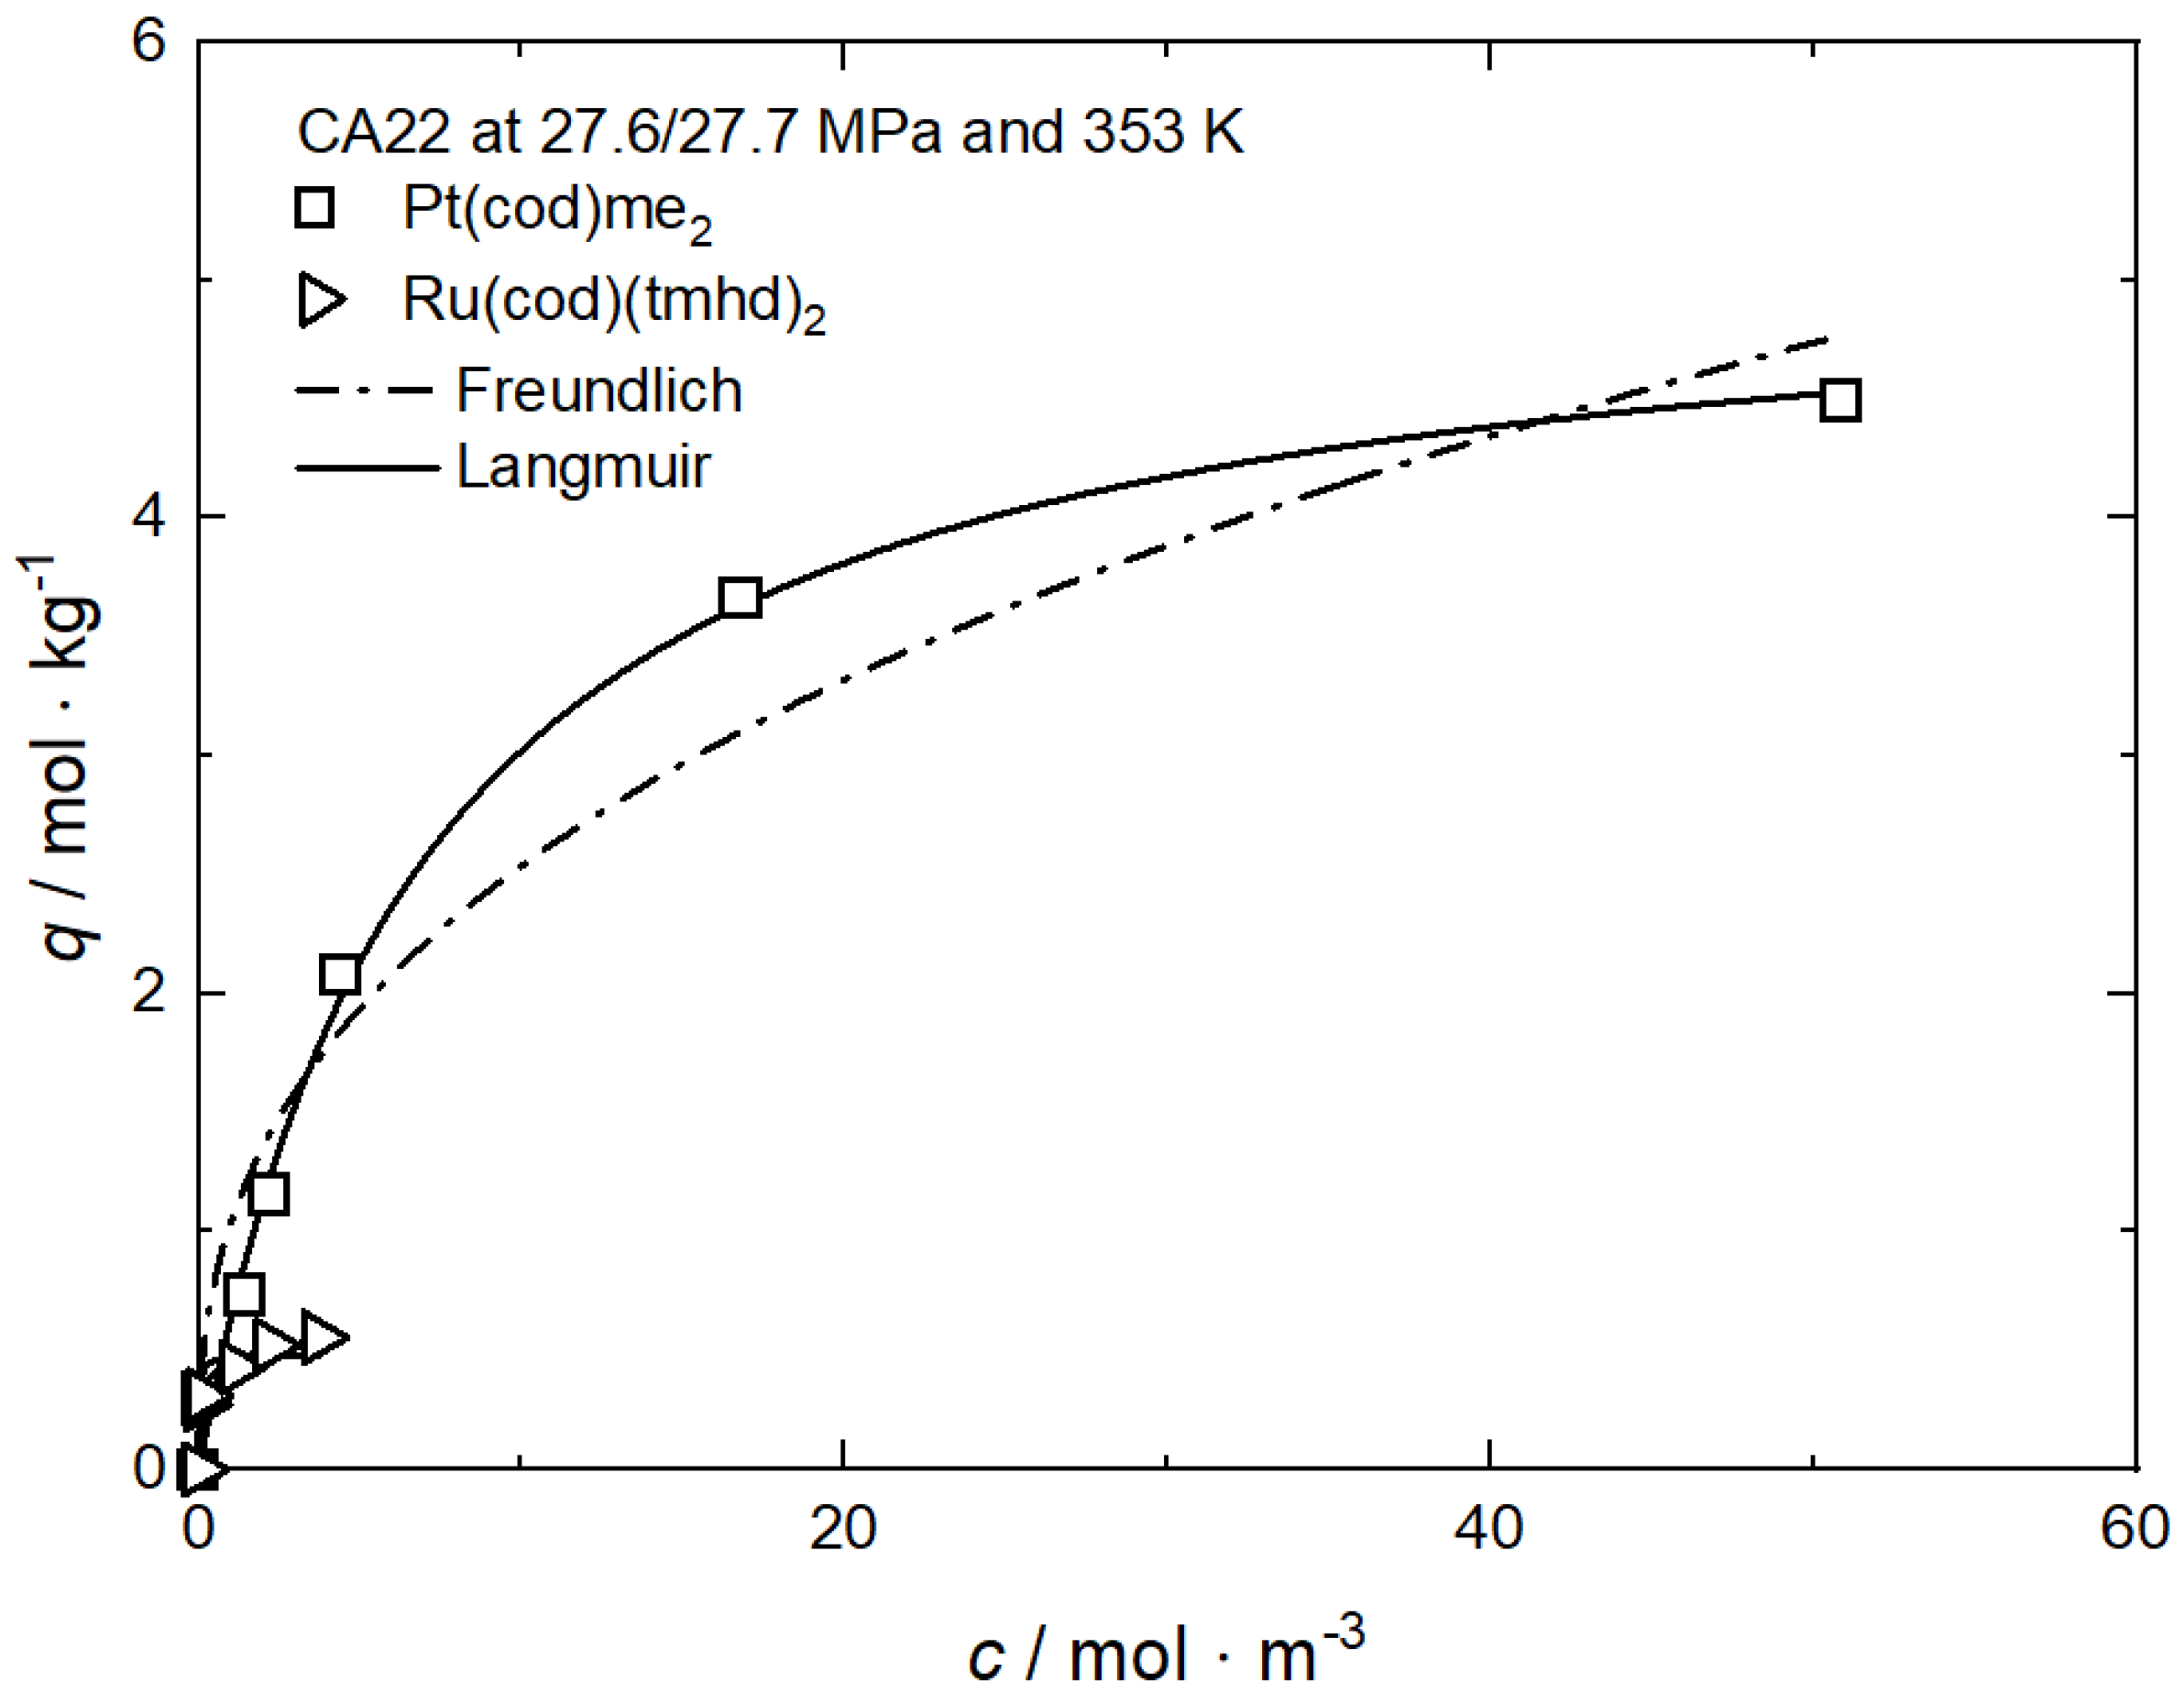

Table A19.
Adsorption isotherm parameters of different precursors from scCO2 solution on CA22 at 27.6/27.7 MPa and 353 K [37,63].
Table A19.
Adsorption isotherm parameters of different precursors from scCO2 solution on CA22 at 27.6/27.7 MPa and 353 K [37,63].
| Equation | Parameter | Unit | Pt(cod)me2 | Ru(cod)(tmhd)2 |
|---|---|---|---|---|
| Freundlich | kF | m3·kg−1 | 1.03861 | 0.44892 |
| nF | — | 0.38798 | 0.14513 | |
| R2 | — | 0.94207 | 0.96893 | |
| Langmuir | qm | mol·kg−1 | 5.15837 | 0.48174 |
| kL | m3·mol−1 | 0.14155 | 38.1565 | |
| R2 | — | 0.99759 | 0.78785 |

Figure A20.
Uptake of different precursors on MCM-41 at 15 MPa and different temperatures; experimental data taken from [60,62].
Figure A20.
Uptake of different precursors on MCM-41 at 15 MPa and different temperatures; experimental data taken from [60,62].
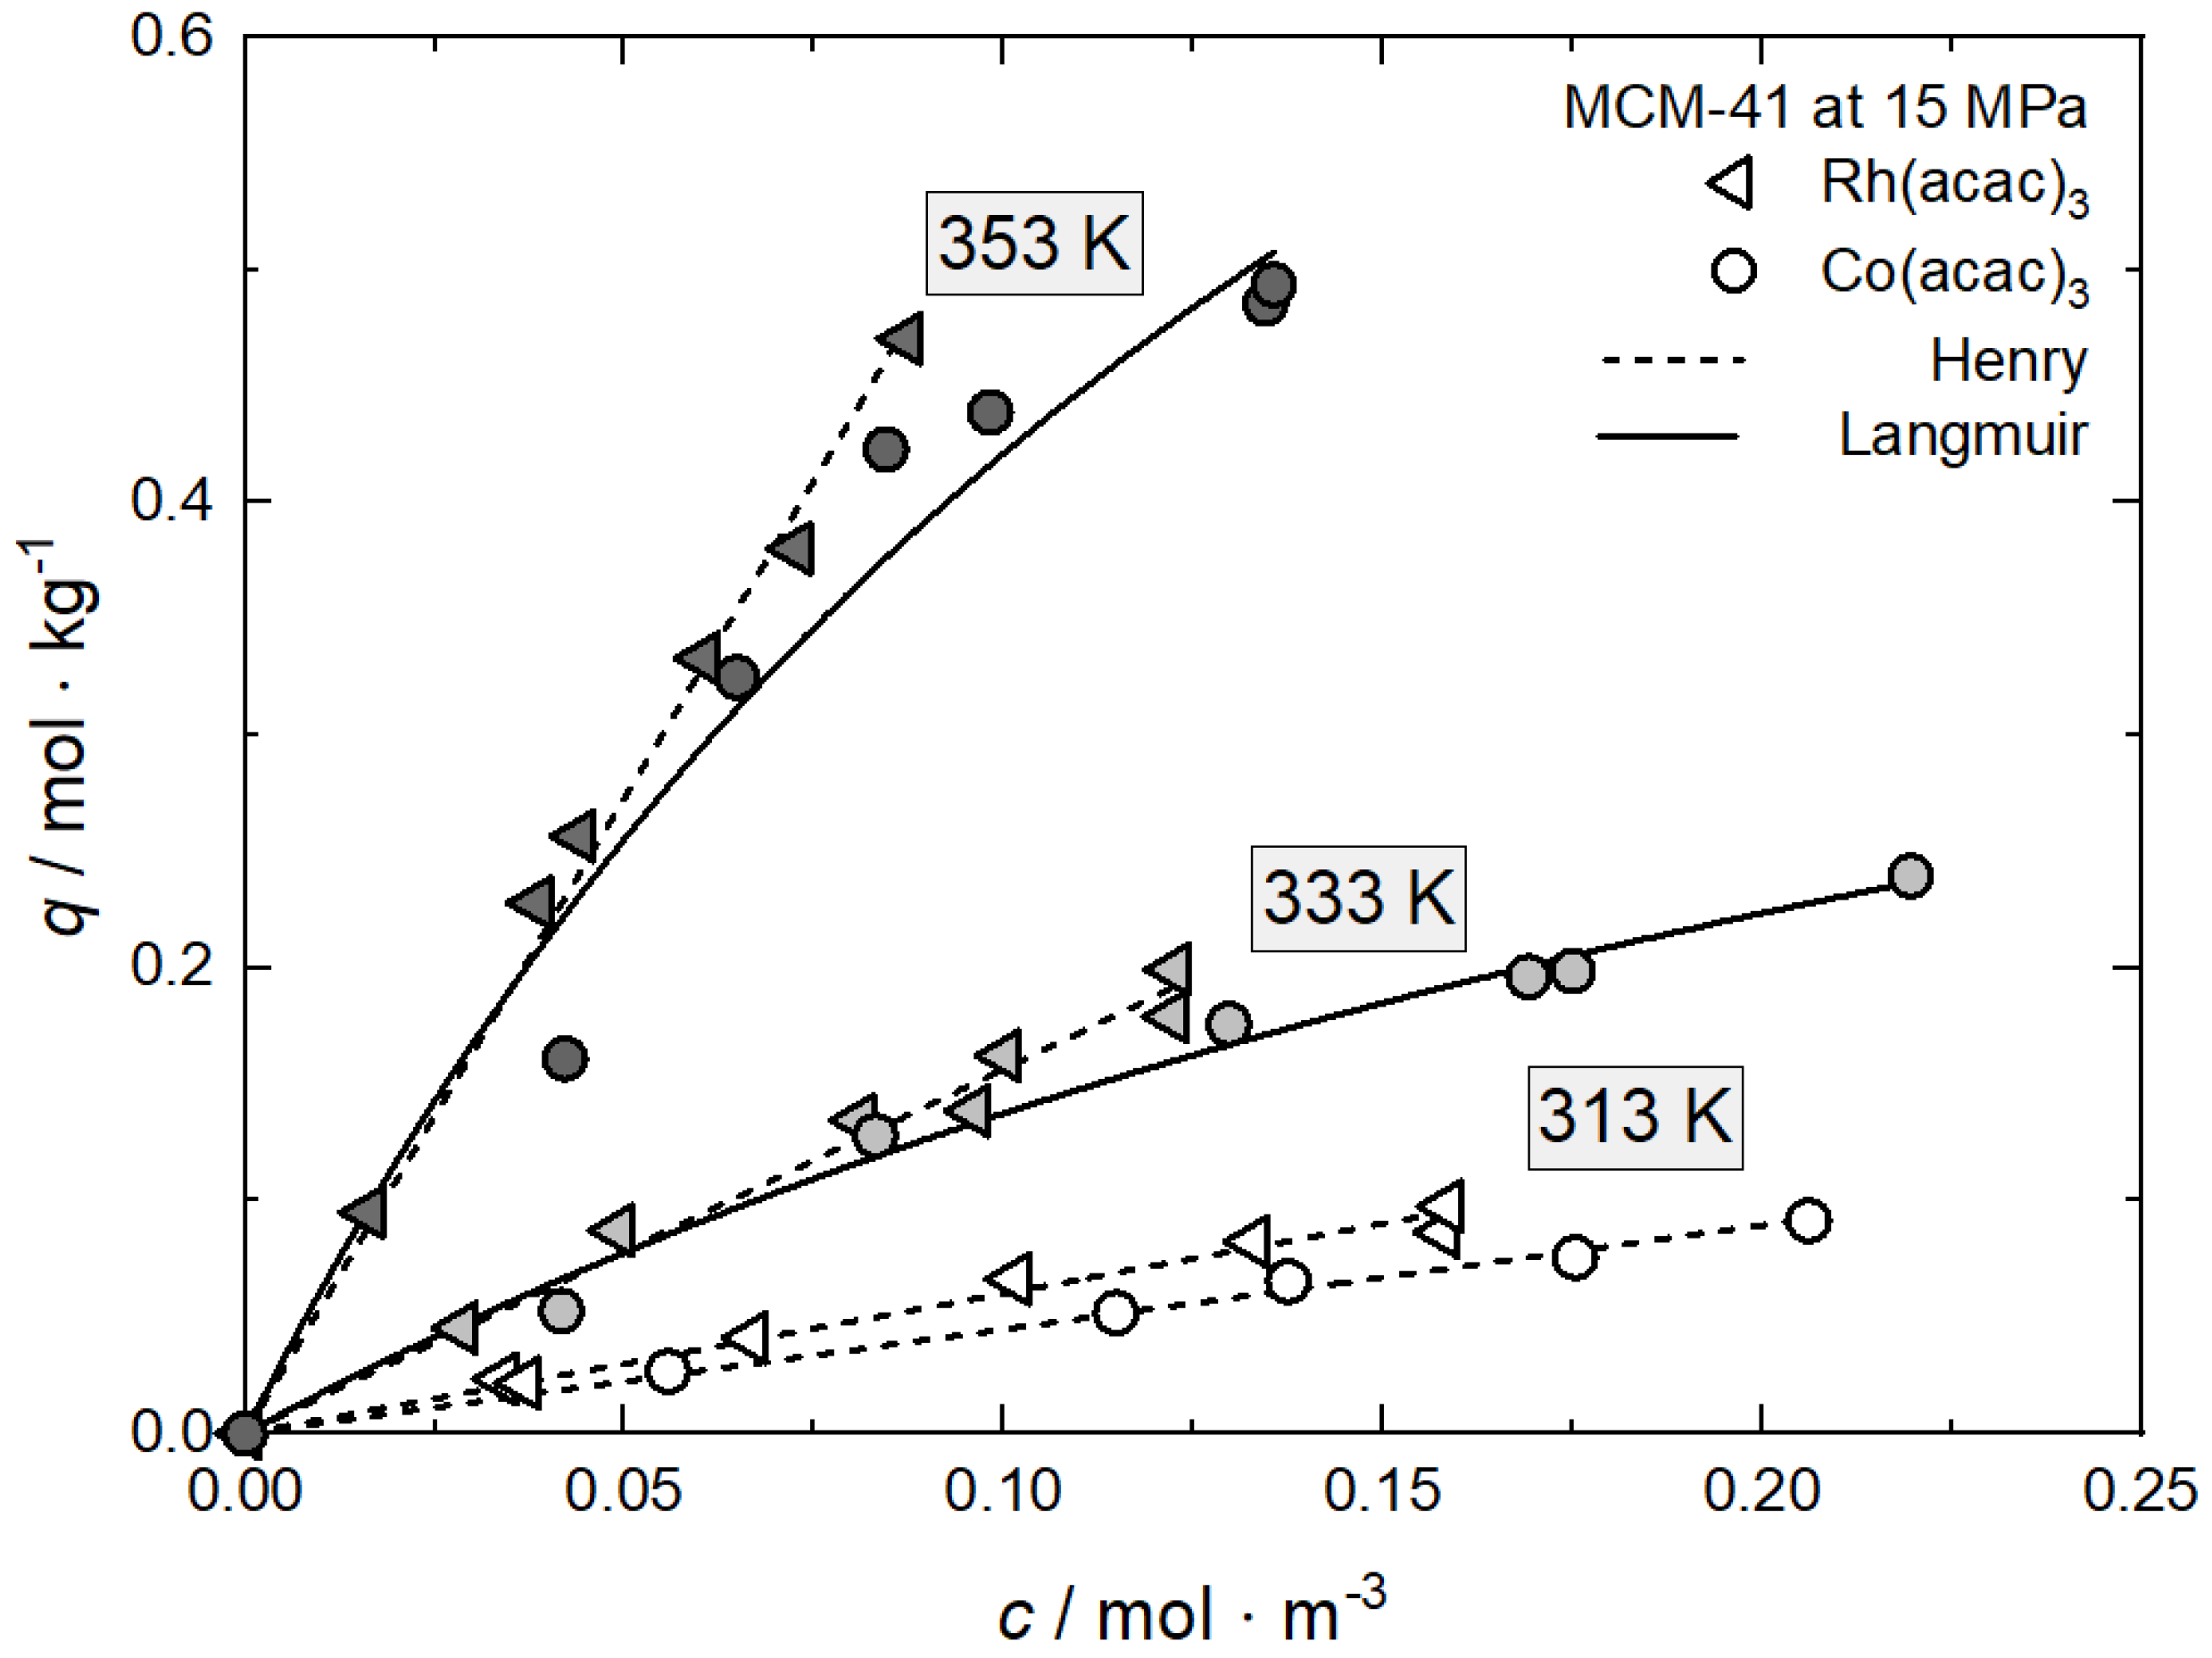

Table A20.
Adsorption isotherm parameters of different precursors from scCO2 solution on MCM-41 at 15 MPa and different temperatures [60,62].
Table A20.
Adsorption isotherm parameters of different precursors from scCO2 solution on MCM-41 at 15 MPa and different temperatures [60,62].
| Equation | Parameter | Unit | Rh(acac)3 | Co(acac)3 |
|---|---|---|---|---|
| 313 K | ||||
| Henry | kH | m3·kg−1 | 0.60171 | 0.44775 |
| R2 | — | 0.98662 | 0.99542 | |
| 333 K | ||||
| Henry | kH | m3·kg−1 | 1.56599 | — |
| R2 | — | 0.98361 | — | |
| Langmuir | qm | mol·kg−1 | — | 0.59637 |
| kL | m3·mol−1 | — | 2.99978 | |
| R2 | — | — | 0.98904 | |
| 353 K | ||||
| Henry | kH | m3·kg−1 | 5.45912 | — |
| R2 | — | 0.99420 | — | |
| Langmuir | qm | mol·kg−1 | — | 1.19879 |
| kL | m3·mol−1 | — | 5.41543 | |
| R2 | — | — | 0.95819 | |
Appendix E. Additional Comparisons between Experimental and Calculated Adsorption Data

Figure A21.
Uptake of Pd(hfac)2 on SBA-15 at 8.5 MPa and 313 K; experimental data taken from [9].
Figure A21.
Uptake of Pd(hfac)2 on SBA-15 at 8.5 MPa and 313 K; experimental data taken from [9].
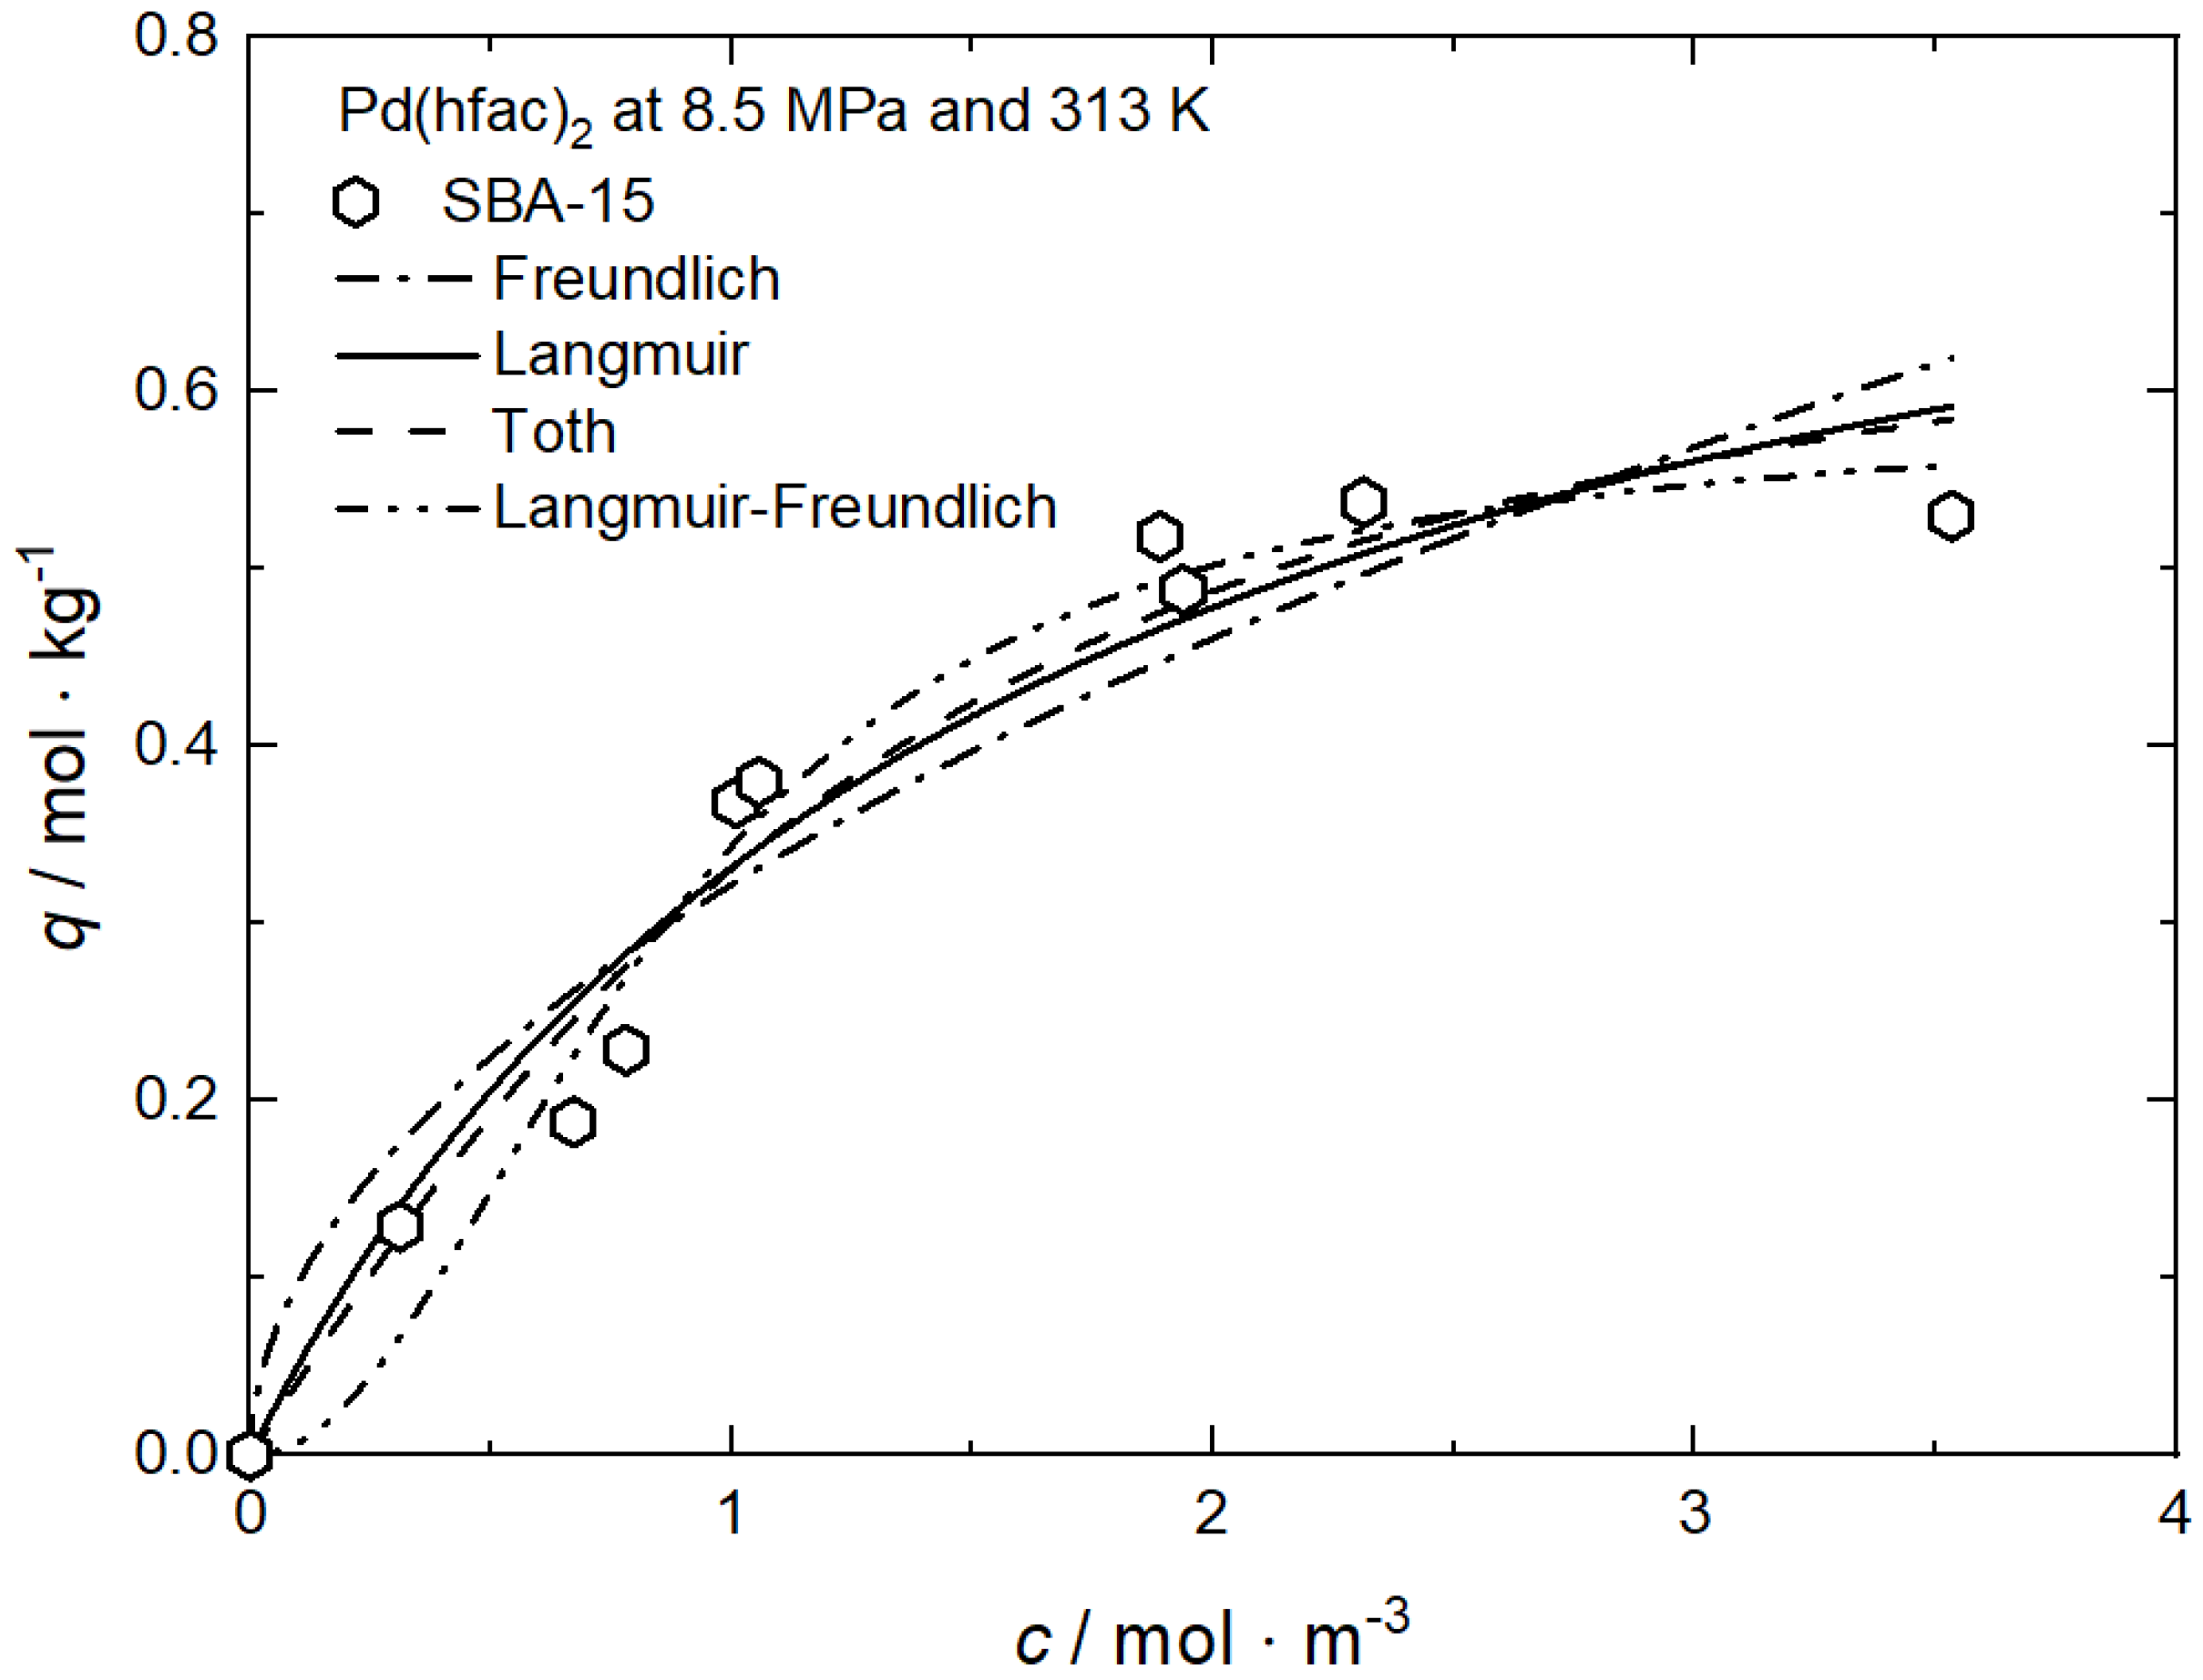

Table A21.
Adsorption isotherm parameters of Pd(hfac)2 from scCO2 solution on SBA-15 at 8.5 MPa and 313 K [9].
Table A21.
Adsorption isotherm parameters of Pd(hfac)2 from scCO2 solution on SBA-15 at 8.5 MPa and 313 K [9].
| Equation | Parameter | Unit | SBA-15 |
|---|---|---|---|
| Freundlich | kF | m3·kg−1 | 0.32184 |
| nF | — | 0.51804 | |
| R2 | — | 0.89402 | |
| Langmuir | qm | mol·kg−1 | 0.85664 |
| kL | m3·mol−1 | 0.63207 | |
| R2 | — | 0.93867 | |
| Toth | qm | mol·kg−1 | 0.68668 |
| kT | m3·mol−1 | 0.60809 | |
| nT | — | 1.59947 | |
| R2 | — | 0.94700 | |
| Langmuir- | qm | mol·kg−1 | 0.58856 |
| Freundlich | kLF | m3·mol−1 | 1.17876 |
| nLF | — | 2.04974 | |
| R2 | — | 0.96225 |

Figure A22.
Uptake of Ni(acac)2 on CA at 30 MPa and 333 K for different precursors; experimental data taken from [65].
Figure A22.
Uptake of Ni(acac)2 on CA at 30 MPa and 333 K for different precursors; experimental data taken from [65].
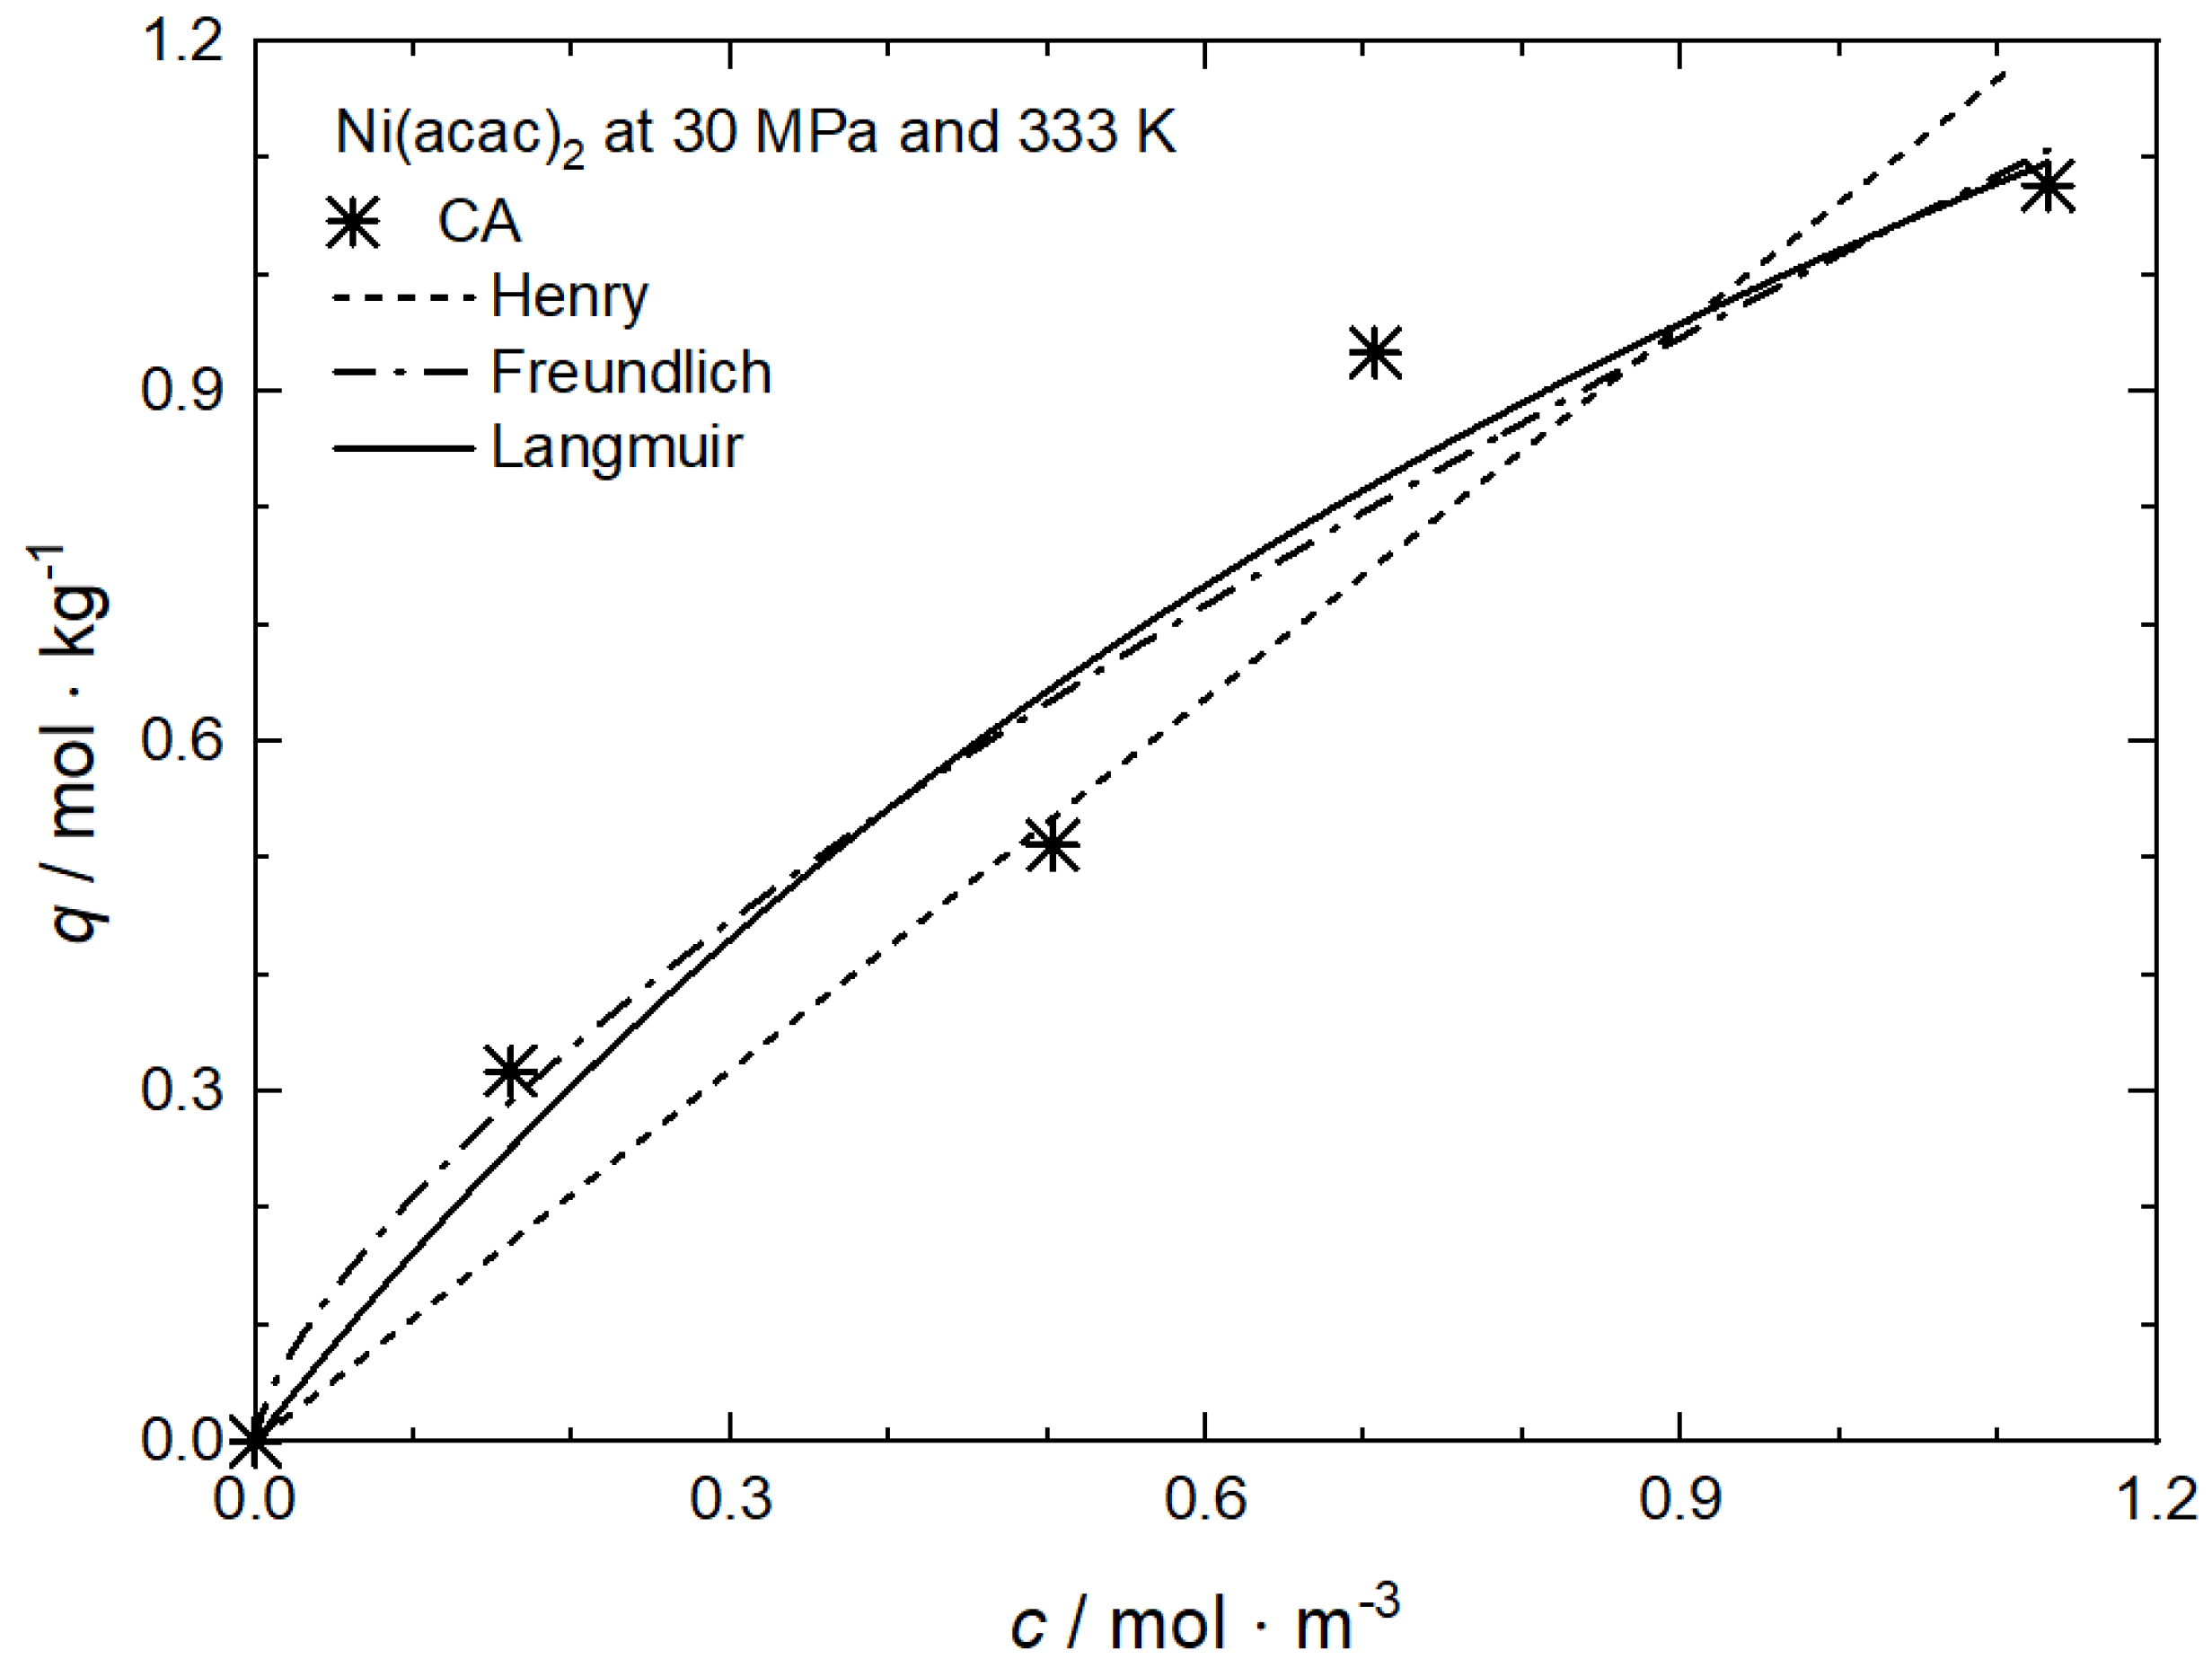

Table A22.
Adsorption isotherm parameters for Ni(acac)2 from scCO2 solution on CA at 30 MPa and 333 K of different precursors [65].
Table A22.
Adsorption isotherm parameters for Ni(acac)2 from scCO2 solution on CA at 30 MPa and 333 K of different precursors [65].
| Equation | Parameter | Unit | CA |
|---|---|---|---|
| Henry | kH | m3·kg−1 | 1.06241 |
| R2 | — | 0.90933 | |
| Freundlich | kF | m3·kg−1 | 1.01768 |
| nF | — | 0.68425 | |
| R2 | — | 0.94171 | |
| Langmuir | qm | mol·kg−1 | 2.47546 |
| kL | m3·mol−1 | 0.70278 | |
| R2 | — | 0.93949 |
References
- Müller, S.A.; Degler, D.; Feldmann, C.; Türk, M.; Moos, R.; Fink, K.; Studt, F.; Gerthsen, D.; Barsan, N.; Grunwaldt, J.-D. Exploiting synergies in catalysis and gas sensing using noble metal-loaded oxide composites. ChemCatChem 2018, 10, 864–880. [Google Scholar] [CrossRef]
- Siril, P.F.; Türk, M. Synthesis of metal nanostructures using supercritical carbon dioxide: A green and upscalable process. Small 2020, 16, 2001972. [Google Scholar] [CrossRef] [PubMed]
- Darr, J.A.; Poliakoff, M. New directions in inorganic and metal–organic coordination chemistry in supercritical fluids. Chem. Rev. 1999, 99, 495–541. [Google Scholar] [CrossRef] [PubMed]
- Erkey, C. Supercritical Fluids and Organometallic Compounds, 1st ed.; Elsevier: Amsterdam, The Netherlands, 2011. [Google Scholar]
- Bozbag, S.E.; Erkey, C. Supercritical deposition: Current status and perspectives for the preparation of supported metal nanostructures. J. Supercrit. Fluid. 2015, 96, 298–312. [Google Scholar] [CrossRef]
- Türk, M.; Erkey, C. Synthesis of supported nanoparticles in supercritical fluids by supercritical fluid reactive deposition: Current state, further perspectives and needs. J. Supercrit. Fluid. 2018, 134, 176–183. [Google Scholar] [CrossRef]
- Erkey, C.; Türk, M. Synthesis of Nanostructured Materials in Near and/or Supercritical Fluids, 1st ed.; Elsevier: Amsterdam, The Netherlands, 2021. [Google Scholar]
- Cangül, B.; Zhang, L.C.; Aindow, M.; Erkey, C. Preparation of carbon black supported Pd, Pt and Pd–Pt nanoparticles using supercritical CO2 deposition. J. Supercrit. Fluid. 2009, 50, 82–90. [Google Scholar] [CrossRef]
- Tenorio, M.J.; Pando, C.; Renuncio, J.A.R.; Stevens, J.G.; Bourne, R.A.; Poliakoff, M.; Cabanas, A. Adsorption of Pd(hfac)2 on mesoporous silica SBA-15 using supercritical CO2 and its role in the performance of Pd–SiO2 catalyst. J. Supercrit. Fluid. 2012, 69, 21–28. [Google Scholar] [CrossRef]
- Bozbag, S.E.; Yazar, N.S.; Zhang, L.C.; Aindow, M.; Erkey, C. Adsorption of Pt(cod)me2 onto organic aerogels from supercritical solutions for the synthesis of supported platinum nanoparticles. J. Supercrit. Fluid. 2011, 56, 105–113. [Google Scholar] [CrossRef]
- Brunner, G.; Johannsen, M. New aspects on adsorption from supercritical fluid phases. J. Supercrit. Fluid. 2006, 38, 181–200. [Google Scholar] [CrossRef]
- Türk, M. Particle synthesis by rapid expansion of supercritical solutions (RESS): Current state, further perspectives and needs. J. Aerosol Sci. 2022, 161, 105950. [Google Scholar] [CrossRef]
- Thommes, M.; Kaneko, K.; Neimark, A.V.; Olivier, J.P.; Rodriguez-Reinoso, F.; Rouquerol, J.; Sing, K.S.W. Physisorption of gases, with special reference to the evaluation of surface area and pore size distribution (IUPAC Technical Report). Pure Appl. Chem. 2015, 87, 1051–1069. [Google Scholar] [CrossRef]
- Ertl, G. Thermodynamics of gas-surface interactions. Pure Appl. Chem. 1989, 61, 1001–1007. [Google Scholar] [CrossRef]
- Laintz, K.E.; Wai, C.M.; Yonker, C.R.; Smith, R.D. Solubility of fluorinated metal diethyldithiocarbamates in supercritical carbon dioxide. J. Supercrit. Fluid. 1991, 4, 194–198. [Google Scholar] [CrossRef]
- Türk, M. Particle Formation with Supercritical Fluids: Challenges and Limitations, 1st ed.; Elsevier: Amsterdam, The Netherlands, 2014. [Google Scholar]
- Stahl, E.; Schilz, W.; Schütz, E.; Willing, E. A quick method for the microanalytical evaluation of the dissolving power of supercritical gases. Angew. Chem. Int. Ed. 1978, 17, 731–738. [Google Scholar] [CrossRef]
- Kumar, S.K.; Johnston, K.P. Modelling the solubility of solids in supercritical fluids with density as the independent variable. J. Supercrit. Fluid. 1988, 1, 15–22. [Google Scholar] [CrossRef]
- Türk, M.; Crone, M.; Upper, G. Effect of gas pressure on the phase behaviour of organometallic compounds. J. Supercrit. Fluid. 2011, 58, 1–6. [Google Scholar] [CrossRef]
- Crone, M.; Türk, M. Solubility of Pd(acac)2 in scCO2. J. Supercrit. Fluid. 2023. in preparation. [Google Scholar]
- Haruki, M.; Kobayashi, F.; Kishimoto, K.; Kihara, S.; Takishima, S. Measurement of the solubility of metal complexes in supercritical carbon dioxide using a UV–vis spectrometer. Fluid Phase Equilib. 2009, 280, 49–55. [Google Scholar] [CrossRef]
- Yoda, S.; Mizuno, Y.; Furuya, T.; Takebayashi, Y.; Otake, K.; Tsuji, T.; Hiaki, T. Solubility measurements of noble metal acetylacetonates in supercritical carbon dioxide by high performance liquid chromatography (HPLC). J. Supercrit. Fluid. 2008, 44, 139–147. [Google Scholar] [CrossRef]
- Caputo, G.; De Marco, I.; Reverchon, E. Silica aerogel–metal composites produced by supercritical adsorption. J. Supercrit. Fluid. 2010, 54, 243–249. [Google Scholar] [CrossRef]
- Kurnik, R.T.; Reid, R.C. Solubility extrema in solid-fluid equilibria. AIChE J. 1981, 27, 861–863. [Google Scholar] [CrossRef]
- Eckert, C.A.; Knutson, B.L.; Debenedetti, P.G. Supercritical fluids as solvents for chemical and materials processing. Nature 1996, 383, 313–318. [Google Scholar] [CrossRef]
- Mendez-Santiago, J.; Teja, A.S. The solubility of solids in supercritical fluids. Fluid Phase Equilib. 1999, 158–160, 501–510. [Google Scholar] [CrossRef]
- Lucien, F.P.; Foster, N.R. Solubilities of solid mixtures in supercritical carbon dioxide: A review. J. Supercrit. Fluid. 2000, 17, 111–134. [Google Scholar] [CrossRef]
- Burgos-Solorzano, G.I.; Brennecke, J.F.; Stadtherr, M.A. Solubility measurements and modeling of molecules of biological and pharmaceutical interest with supercritical CO2. Fluid Phase Equilib. 2004, 220, 57–69. [Google Scholar] [CrossRef]
- Coimbra, P.; Duarte, C.M.M.; de Sousa, H.C. Cubic equation-of-state correlation of the solubility of some anti-inflammatory drugs in supercritical carbon dioxide. Fluid Phase Equilib. 2006, 239, 188–199. [Google Scholar] [CrossRef]
- Gupta, R.B.; Shim, J.-J. Solubility in Supercritical Carbon Dioxide; CRC Press: Boca Raton, FL, USA, 2007. [Google Scholar]
- Skerget, M.; Knez, Z.; Knez-Hrncic, M. Solubility of solids in sub- and supercritical fluids: A review. J. Chem. Eng. Data 2011, 56, 694–719. [Google Scholar] [CrossRef]
- Teoh, W.H.; Mammucari, R.; Foster, N.R. Solubility of organometallic complexes in supercritical carbon dioxide: A review. J. Organomet. Chem. 2013, 724, 102–116. [Google Scholar] [CrossRef]
- Knez, Z.; Cör, D.; Knez-Hrncic, M. Solubility of solids in sub- and supercritical fluids: A review 2010−2017. J. Chem. Eng. Data 2018, 63, 860–884. [Google Scholar] [CrossRef]
- Crone, M.; Türk, M. Thermodynamics of adsorption of carbon dioxide on different metal oxides at temperatures from 313 to 353 K and pressures up to 25 MPa. J. Supercrit. Fluid. 2022, 182, 105461. [Google Scholar] [CrossRef]
- Freundlich, H.M.F. Über die Adsorption in Lösungen. J. Phys. Chem. 1906, 57, 385–471. [Google Scholar] [CrossRef]
- Langmuir, I. The adsorption of gases on plane surfaces of glass, mica and platinum. J. Am. Chem. Soc. 1918, 40, 1361–1403. [Google Scholar] [CrossRef]
- Saquing, C.D.; Kang, D.; Aindow, M.; Erkey, C. Investigation of the supercritical deposition of platinum nanoparticles into carbon aerogels. Microporous Mesoporous Mater. 2005, 80, 11–23. [Google Scholar] [CrossRef]
- Toth, J. State equations of the solid-gas interface layers. Acta Chim. Hung. 1971, 69, 311–328. [Google Scholar]
- Toth, J. Adsorption, 1st ed.; CRC Press: Boca Raton, FL, USA, 2001; pp. 971–983. [Google Scholar] [CrossRef]
- Yun, J.-H.; Düren, T.; Keil, F.J.; Seaton, N.A. Adsorption of methane, ethane, and their binary mixtures on MCM-41: Experimental evaluation of methods for the prediction of adsorption equilibrium. Langmuir 2002, 18, 2693–2701. [Google Scholar] [CrossRef]
- Koble, R.A.; Corrigan, T.E. Adsorption isotherms for pure hydrocarbons. Ind. Eng. Chem. 1952, 44, 383–387. [Google Scholar] [CrossRef]
- Himeno, S.; Komatsu, T.; Fujita, S. High-pressure adsorption equilibria of methane and carbon dioxide on several activated carbons. J. Chem. Eng. Data 2005, 50, 369–376. [Google Scholar] [CrossRef]
- Dreisbach, F.; Staudt, R.; Keller, J.U. High pressure adsorption data of methane, nitrogen, carbon dioxide and their binary and ternary mixtures on activated carbon. Adsorption 1999, 5, 215–227. [Google Scholar] [CrossRef]
- Bazan, R.E.; Bastos-Neto, M.; Staudt, R.; Papp, H.; Azevedo, D.C.S.; Cavalcante, C.L., Jr. Adsorption equilibria of natural gas components on activated carbon: Pure and mixed gas isotherms. Adsorpt. Sci. Technol. 2008, 26, 323–332. [Google Scholar] [CrossRef]
- Reiser, S.; Türk, M. Influence of temperature and high-pressure on the adsorption behavior of scCO2 on MCM-41 and SBA-15. J. Supercrit. Fluid. 2019, 144, 122–133. [Google Scholar] [CrossRef]
- Menon, P.G. Adsorption at high pressures. Chem. Rev. 1968, 68, 277–294. [Google Scholar] [CrossRef]
- Do, D.D.; Do, H.D. Adsorption of supercritical fluids in non-porous and porous carbons: Analysis of adsorbed phase volume and density. Carbon 2003, 41, 1777–1791. [Google Scholar] [CrossRef]
- Myers, A.L.; Monson, P.A. Physical adsorption of gases: The case for absolute adsorption as the basis for thermodynamic analysis. Adsorption 2014, 20, 591–622. [Google Scholar] [CrossRef]
- Pini, R. Interpretation of net and excess adsorption isotherms in microporous adsorbents. Microporous Mesoporous Mater. 2014, 187, 40–52. [Google Scholar] [CrossRef]
- Ansari, H.; Joss, L.; Hwang, J.; Trusler, J.P.M.; Maitland, G.; Pini, R. Supercritical adsorption in micro- and meso-porous carbons and its utilisation for textural characterization. Microporous Mesoporous Mater. 2020, 308, 110537. [Google Scholar] [CrossRef]
- Gurikov, P.; Smirnova, I. Amorphization of drugs by adsorptive precipitation from supercritical solutions: A review. J. Supercrit. Fluid. 2018, 132, 105–125. [Google Scholar] [CrossRef]
- Morere, J.; Tenorio, M.J.; Pando, C.; Renuncio, J.A.R.; Cabanas, A. Solubility of two metal-organic ruthenium precursors in supercritical CO2 and their application in supercritical fluid technology. J. Chem. Thermodyn. 2013, 58, 55–61. [Google Scholar] [CrossRef]
- Zhang, Y.; Kang, D.; Aindow, M.; Erkey, C. Preparation and characterization of ruthenium/carbon aerogel nanocomposites via a supercritical fluid route. J. Phys. Chem. B 2005, 109, 2617–2624. [Google Scholar] [CrossRef]
- Hall, K.R.; Eagleton, L.C.; Acrivos, A.; Vermeulen, T. Pore- and solid-diffusion kinetics in fixed-bed adsorption under constant-pattern conditions. Ind. Eng. Chem. Fund. 1966, 5, 212–223. [Google Scholar] [CrossRef]
- Weber, T.W.; Chakravorti, R.K. Pore and solid diffusion models for fixed-bed adsorbers. AlChE J. 1974, 20, 228–238. [Google Scholar] [CrossRef]
- Foo, K.Y.; Hameed, B.H. Insights into the modeling of adsorption isotherm systems. Chem. Eng. J. 2010, 156, 2–10. [Google Scholar] [CrossRef]
- Kalam, S.; Abu-Khamsin, S.A.; Kamal, M.S.; Patil, S. Surfactant adsorption isotherms: A Review. ACS Omega 2021, 6, 32342–32348. [Google Scholar] [CrossRef] [PubMed]
- Bozbag, S.E.; Unal, U.; Kurykin, M.A.; Ayala, C.J.; Aindow, M.; Erkey, C. Thermodynamic control of metal loading and composition of carbon aerogel supported Pt−Cu alloy nanoparticles by supercritical deposition. J. Phys. Chem. C 2013, 117, 6777–6787. [Google Scholar] [CrossRef]
- Xu, Q.; Wang, Y.; Wang, A.; Yin, J.; Liu, Y. Systematical study of depositing nanoparticles and nanowires in mesoporous silica using supercritical carbon dioxide and co-solvents: Morphology control, thermodynamics and kinetics of adsorption. Nanotechnology 2012, 23, 285602. [Google Scholar] [CrossRef]
- Ushiki, I.; Koike, M.; Shimizu, T.; Sato, Y.; Takishima, S.; Inomata, H. Measurement and modeling of adsorption equilibria of cobalt (III) acetylacetonate on MCM-41 mesoporous silica in the presence of supercritical carbon dioxide with methanol co-solvent. J. Supercrit. Fluid. 2018, 140, 329–335. [Google Scholar] [CrossRef]
- Bozbag, S.E.; Kostenko, S.O.; Kurykin, M.A.; Khrustalev, V.N.; Khokhlov, A.R.; Zhang, L.; Aindow, M.; Erkey, C. Aerogel–copper nanocomposites prepared using the adsorption of a polyfluorinated complex from supercritical CO2. J. Nanopart. Res. 2012, 14, 973. [Google Scholar] [CrossRef]
- Ushiki, I.; Takahashi, N.; Shimizu, T.; Sato, Y.; Ota, M.; Smith, R.L., Jr.; Inomata, H. Adsorption equilibria of rhodium acetylacetonate with MCM-41, MSU-H, and HMS silica substrates in supercritical carbon dioxide for preparing catalytic mesoporous materials. J. Supercrit. Fluid. 2017, 120, 240–248. [Google Scholar] [CrossRef]
- Zhang, Y.; Cangul, B.; Garrabos, Y.; Erkey, C. Thermodynamics and kinetics of adsorption of bis(2,2,6,6-tetramethyl-3,5-heptanedionato) (1,5-cyclooctadiene) ruthenium (II) on carbon aerogel from supercritical CO2 solution. J. Supercrit. Fluid. 2008, 44, 71–77. [Google Scholar] [CrossRef]
- Sastre, A.; Martin, A.; Alonso, E. Adsorption of nickelocene and ruthenocene on mesoporous silica MCM-48 and activated carbon supports in supercritical carbon dioxide. J. Supercrit. Fluid. 2016, 117, 138–146. [Google Scholar] [CrossRef]
- Bozbag, S.E.; Zhang, L.C.; Aindow, M.; Erkey, C. Carbon aerogel supported nickel nanoparticles and nanorods using supercritical deposition. J. Supercrit. Fluid. 2012, 66, 265–273. [Google Scholar] [CrossRef]
- Humayun, R.; Tomasko, D.L. High-resolution adsorption isotherms of supercritical carbon dioxide on activated carbon. AIChE J. 2000, 46, 2065–2075. [Google Scholar] [CrossRef]
- Casapu, M.; Fischer, A.; Gänzler, A.M.; Popescu, R.; Crone, M.; Gerthsen, D.; Türk, M.; Grunwaldt, J.D. Origin of the normal and inverse hysteresis behavior during CO oxidation over Pt/Al2O3. ACS Catal. 2017, 7, 343–355. [Google Scholar] [CrossRef]
- Ogel, E.; Casapu, M.; Doronkin, D.E.; Popescu, R.; Störmer, H.; Mechler, C.; Marzun, G.; Barcikowski, S.; Türk, M.; Grunwaldt, J.-D. Impact of preparation method and hydrothermal aging on particle size distribution of Pt/γ-Al2O3 and its performance in CO and NO oxidation. J. Phys. Chem. C 2019, 123, 5433–5446. [Google Scholar] [CrossRef]
- Shimizu, T.; Ushiki, I.; Ota, M.; Sato, Y.; Koizumi, N.; Inomata, H. Preparation of mesoporous silica supported cobalt catalysts using supercritical fluids for Fischer-Tropsch synthesis. Chem. Eng. Res. Des. 2015, 95, 64–68. [Google Scholar] [CrossRef]
- Yen, C.H.; Shimizu, K.; Lin, Y.-Y.; Bailey, F.; Cheng, I.F.; Wai, C.M. Chemical fluid deposition of Pt-based bimetallic nanoparticles on multiwalled carbon nanotubes for direct methanol fuel cell application. Energy Fuels 2007, 21, 2268–2271. [Google Scholar] [CrossRef]
- Lin, Y.; Cui, X.; Yen, C.H.; Wai, C.M. PtRu/Carbon nanotube nanocomposite synthesized in supercritical fluid: A novel electrocatalyst for direct methanol fuel cells. Langmuir 2005, 21, 11474–11479. [Google Scholar] [CrossRef] [PubMed]
- Barim, S.B.; Bozbag, S.E.; Deljoo, B.; Aindow, M.; Erkey, C. Highly active carbon supported PtCu electrocatalysts for PEMFCs by in situ supercritical deposition. Fuel Cells 2020, 20, 285–299. [Google Scholar] [CrossRef]
- Wolff, S.; Crone, M.; Muller, T.; Enders, M.; Bräse, S.; Türk, M. Preparation of supported Pt nanoparticles by supercritical fluid reactive deposition: Influence of precursor, substrate and pressure on product properties. J. Supercrit. Fluid. 2014, 95, 588–596. [Google Scholar] [CrossRef]
Disclaimer/Publisher’s Note: The statements, opinions and data contained in all publications are solely those of the individual author(s) and contributor(s) and not of MDPI and/or the editor(s). MDPI and/or the editor(s) disclaim responsibility for any injury to people or property resulting from any ideas, methods, instructions or products referred to in the content. |
© 2023 by the authors. Licensee MDPI, Basel, Switzerland. This article is an open access article distributed under the terms and conditions of the Creative Commons Attribution (CC BY) license (https://creativecommons.org/licenses/by/4.0/).

