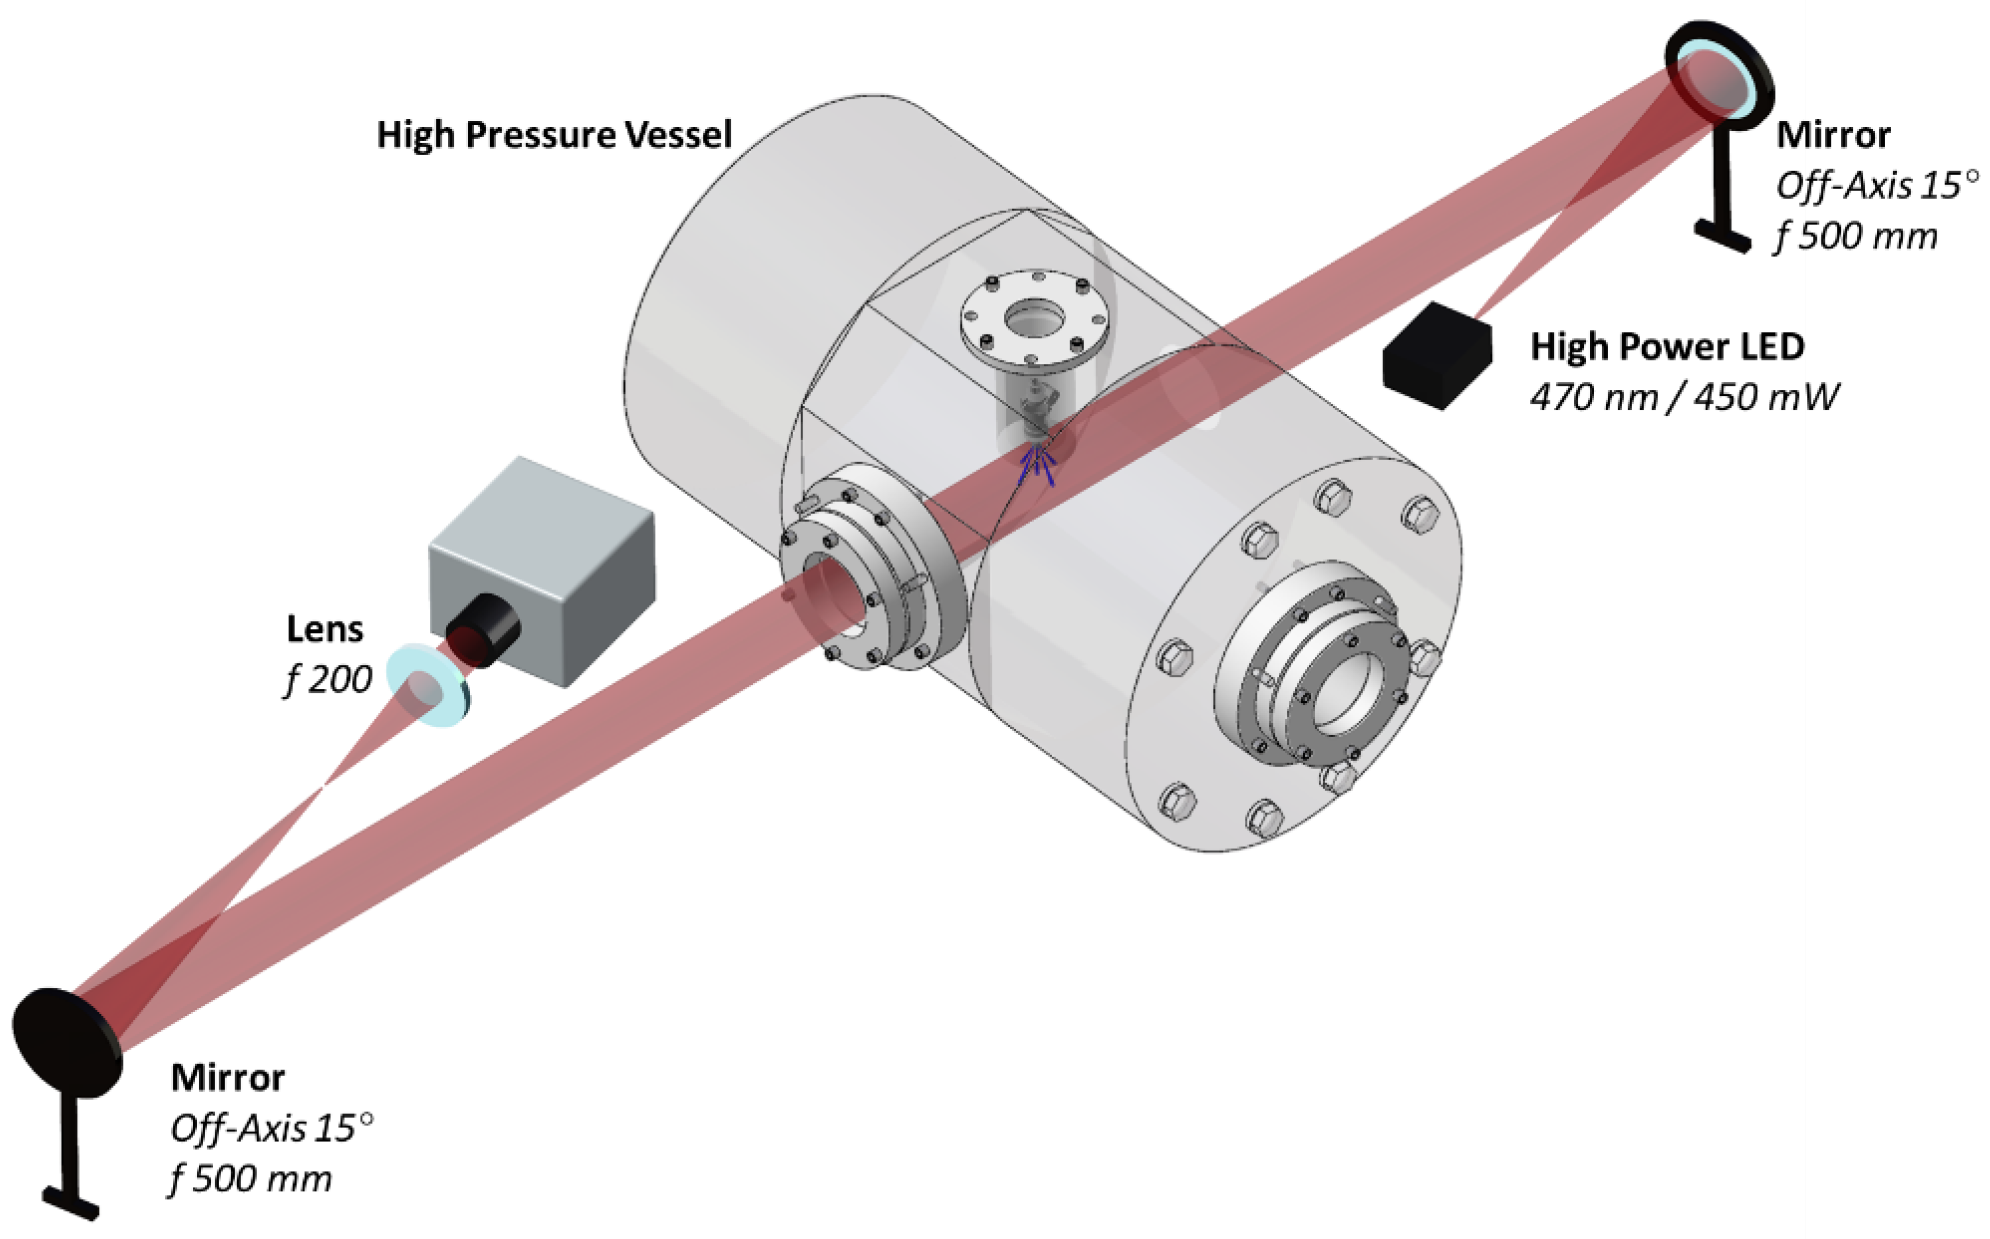
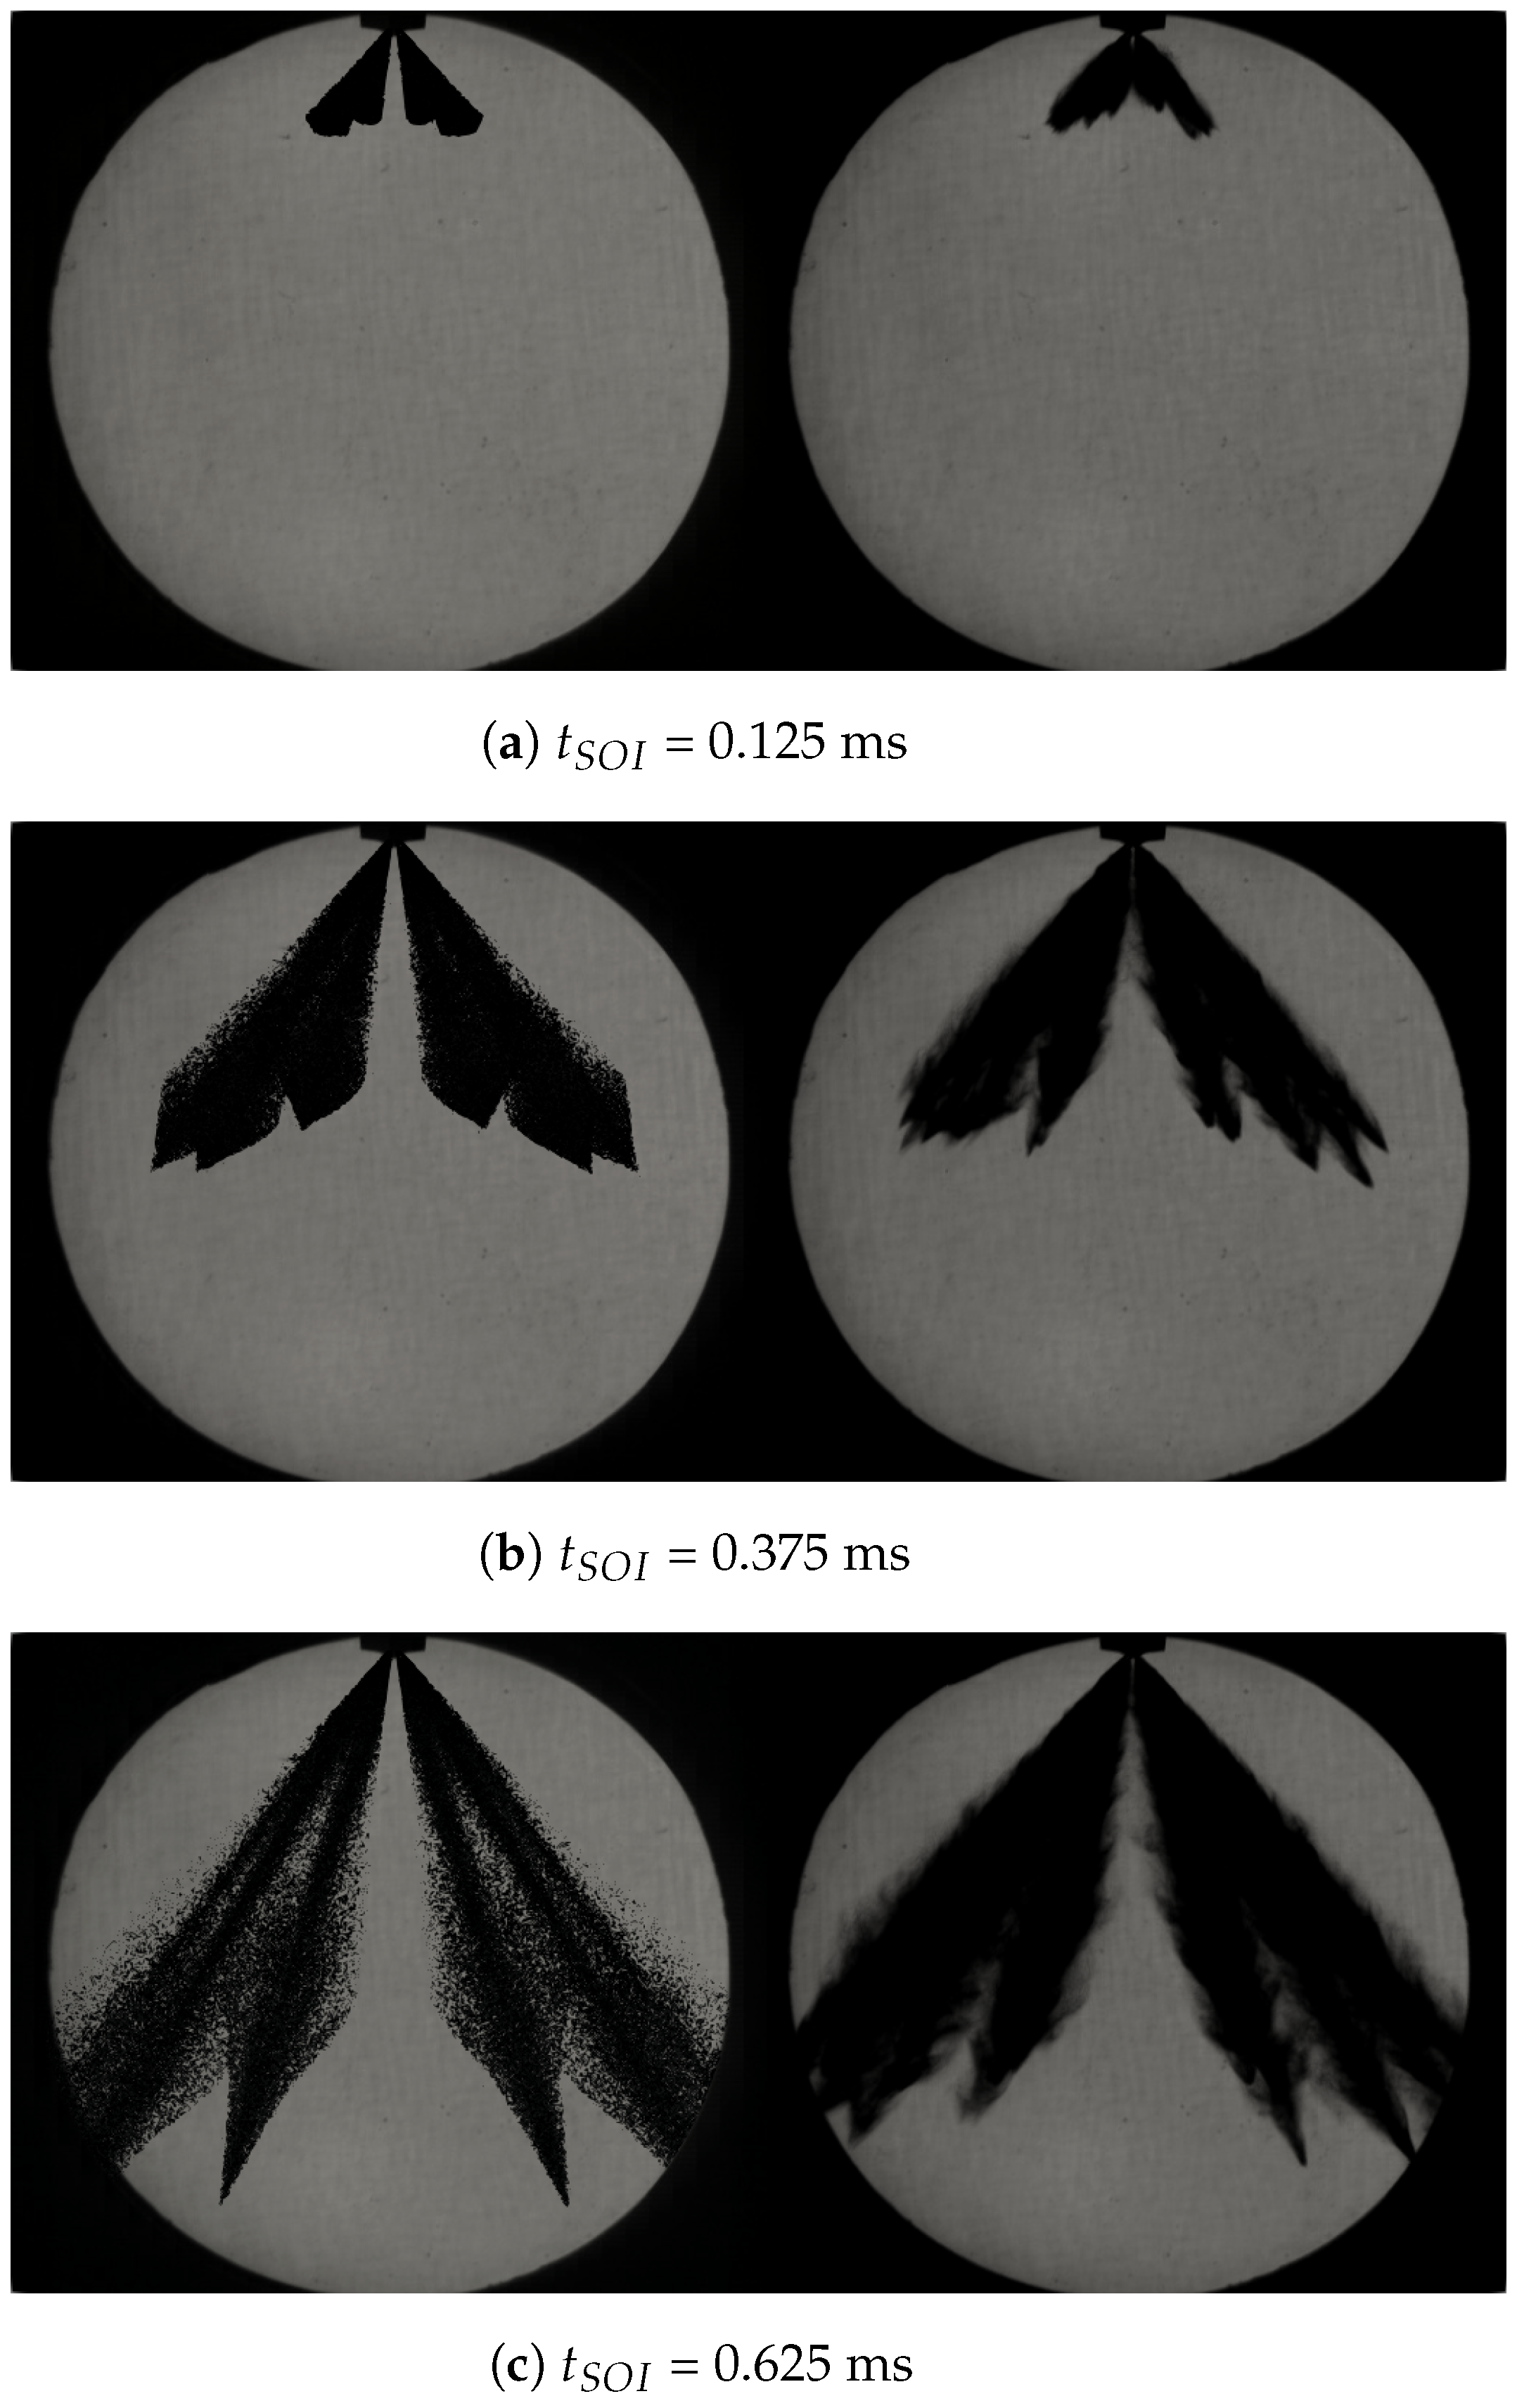
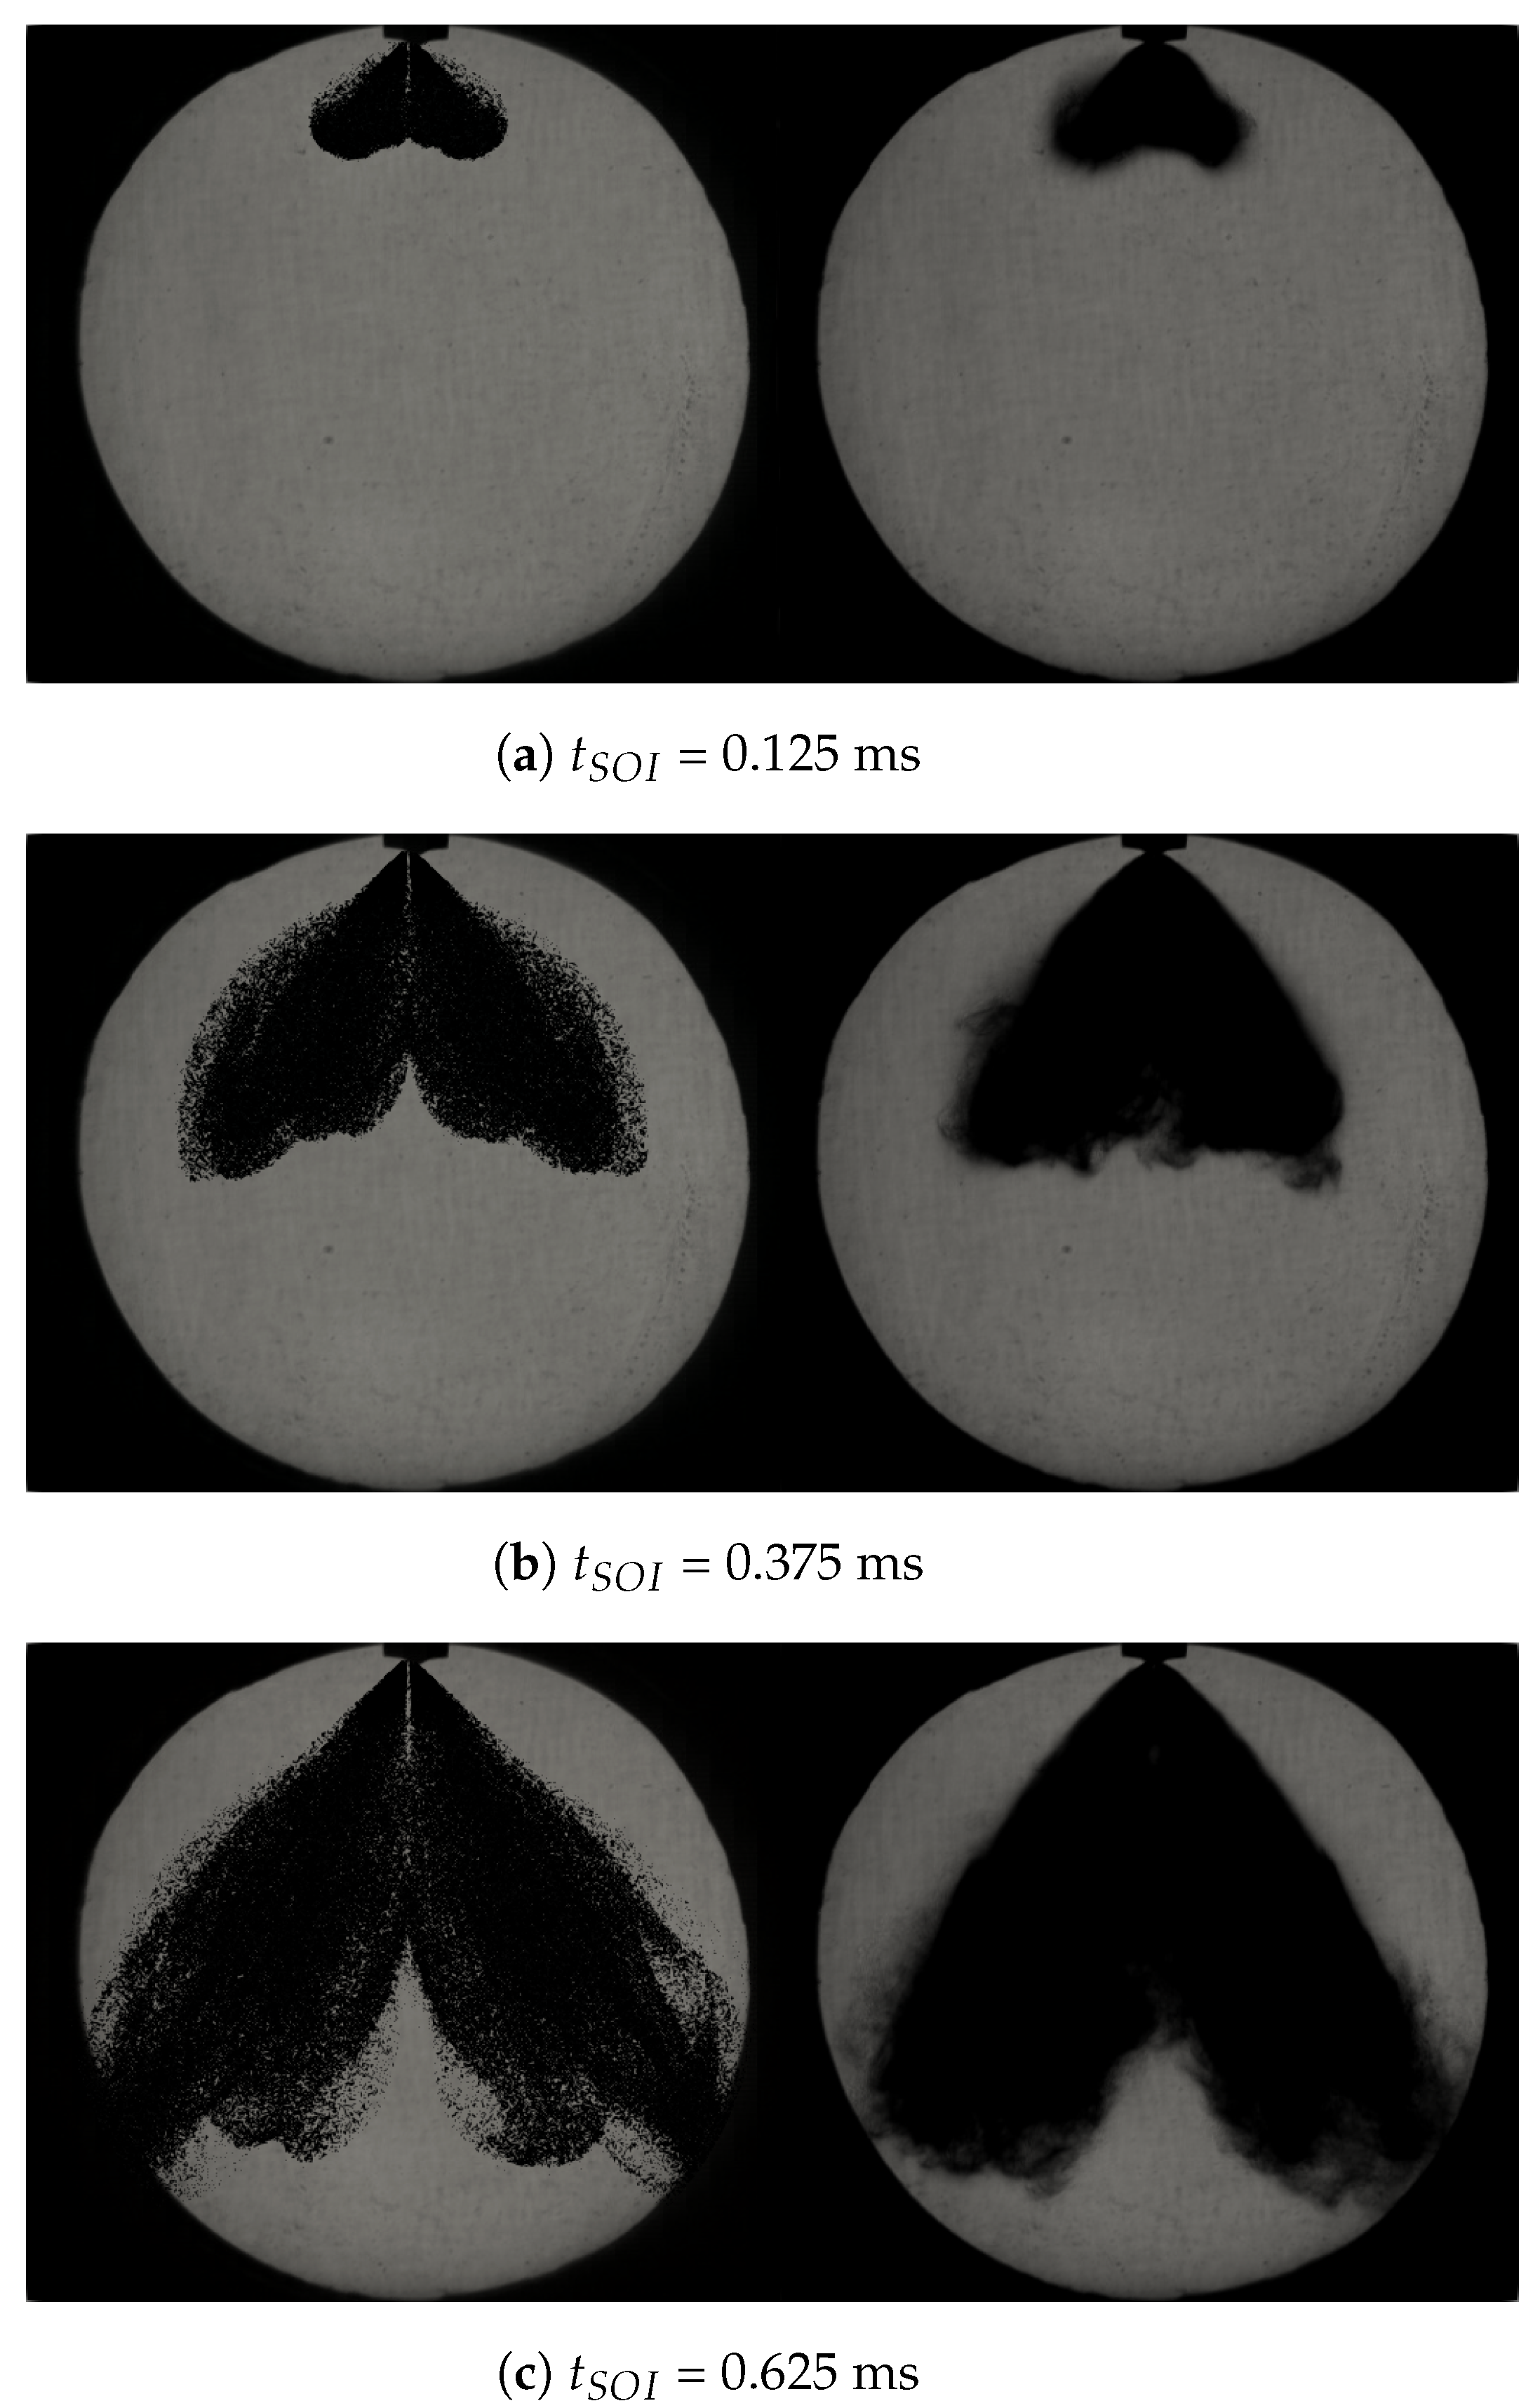
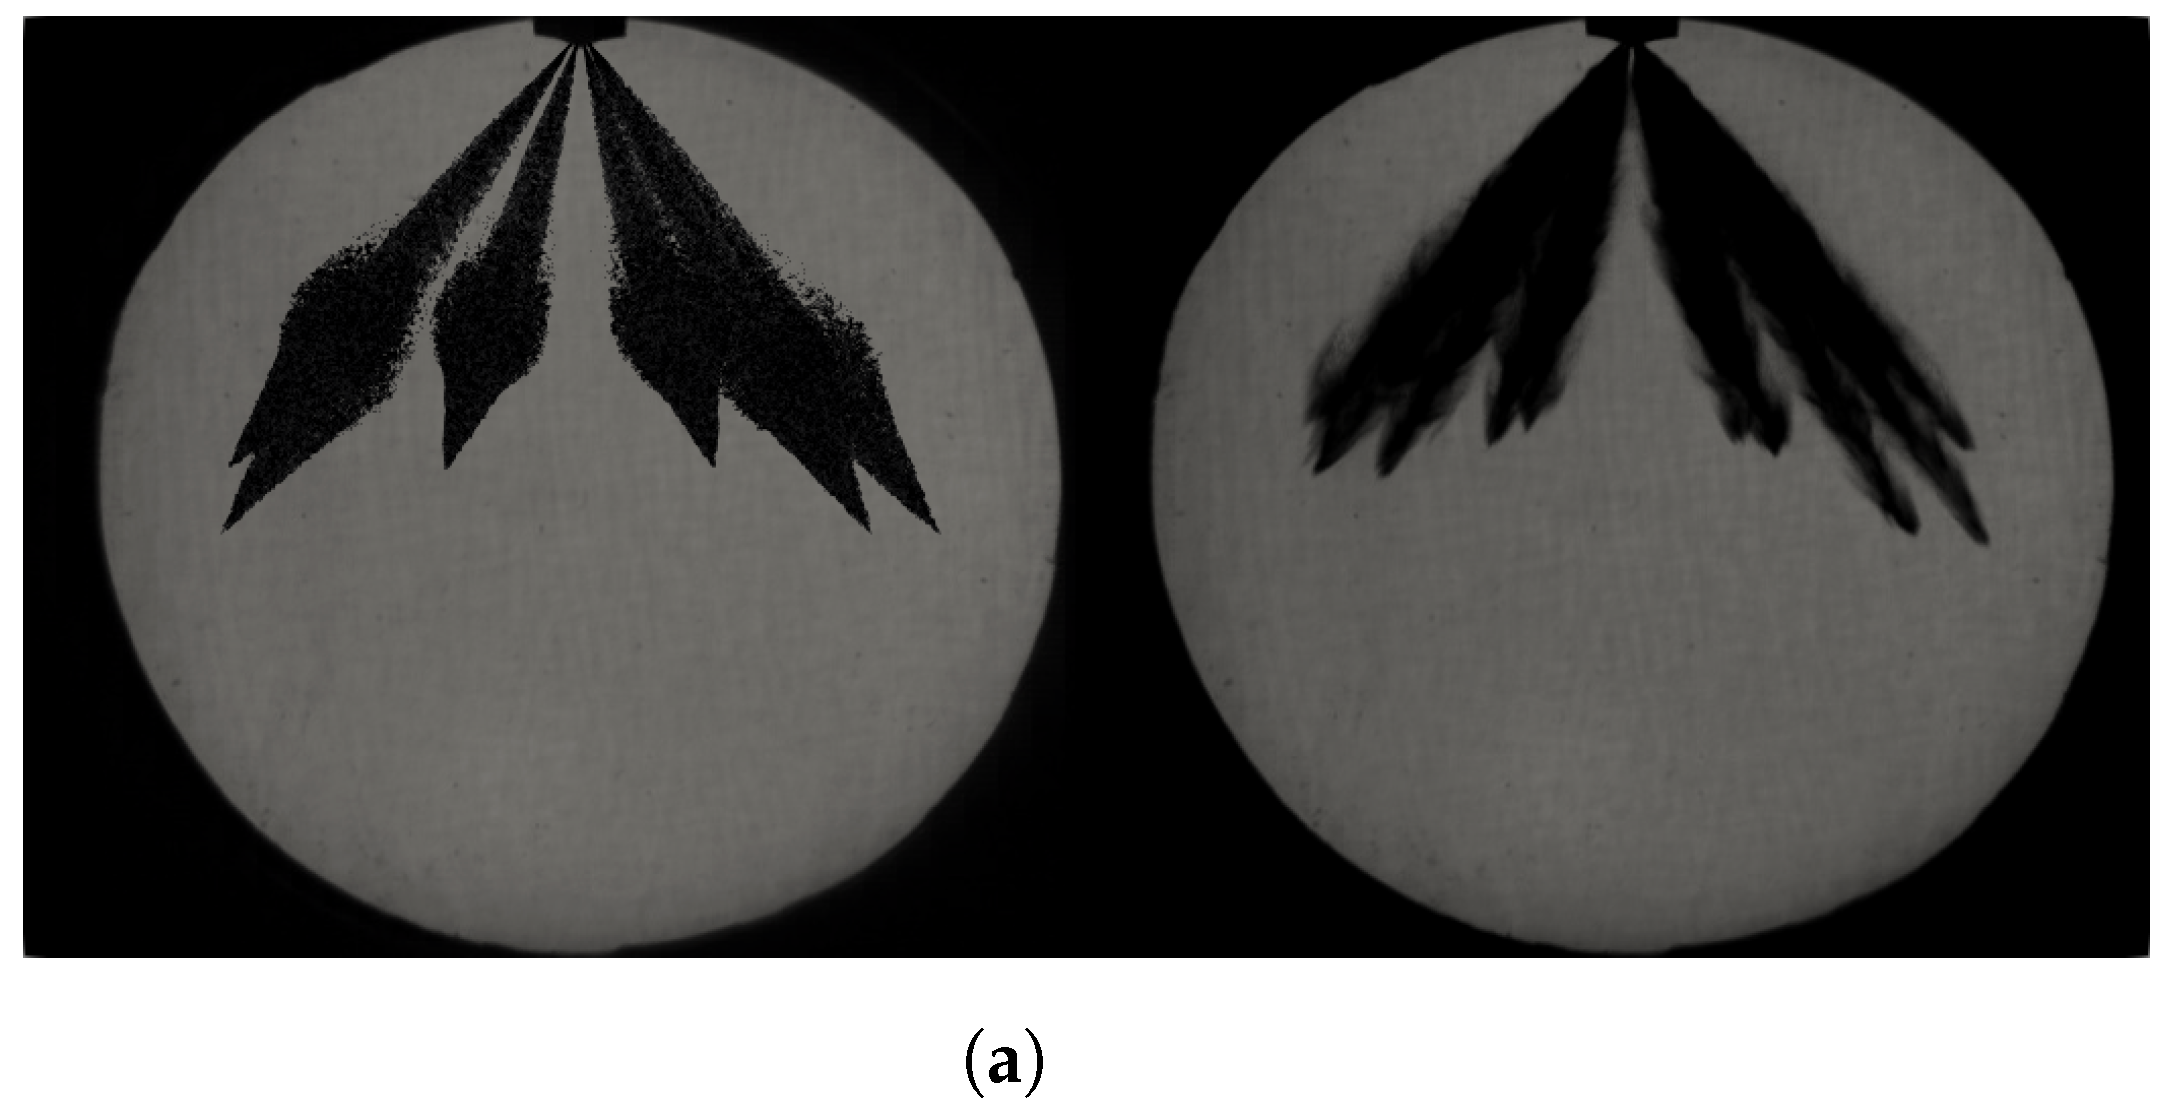
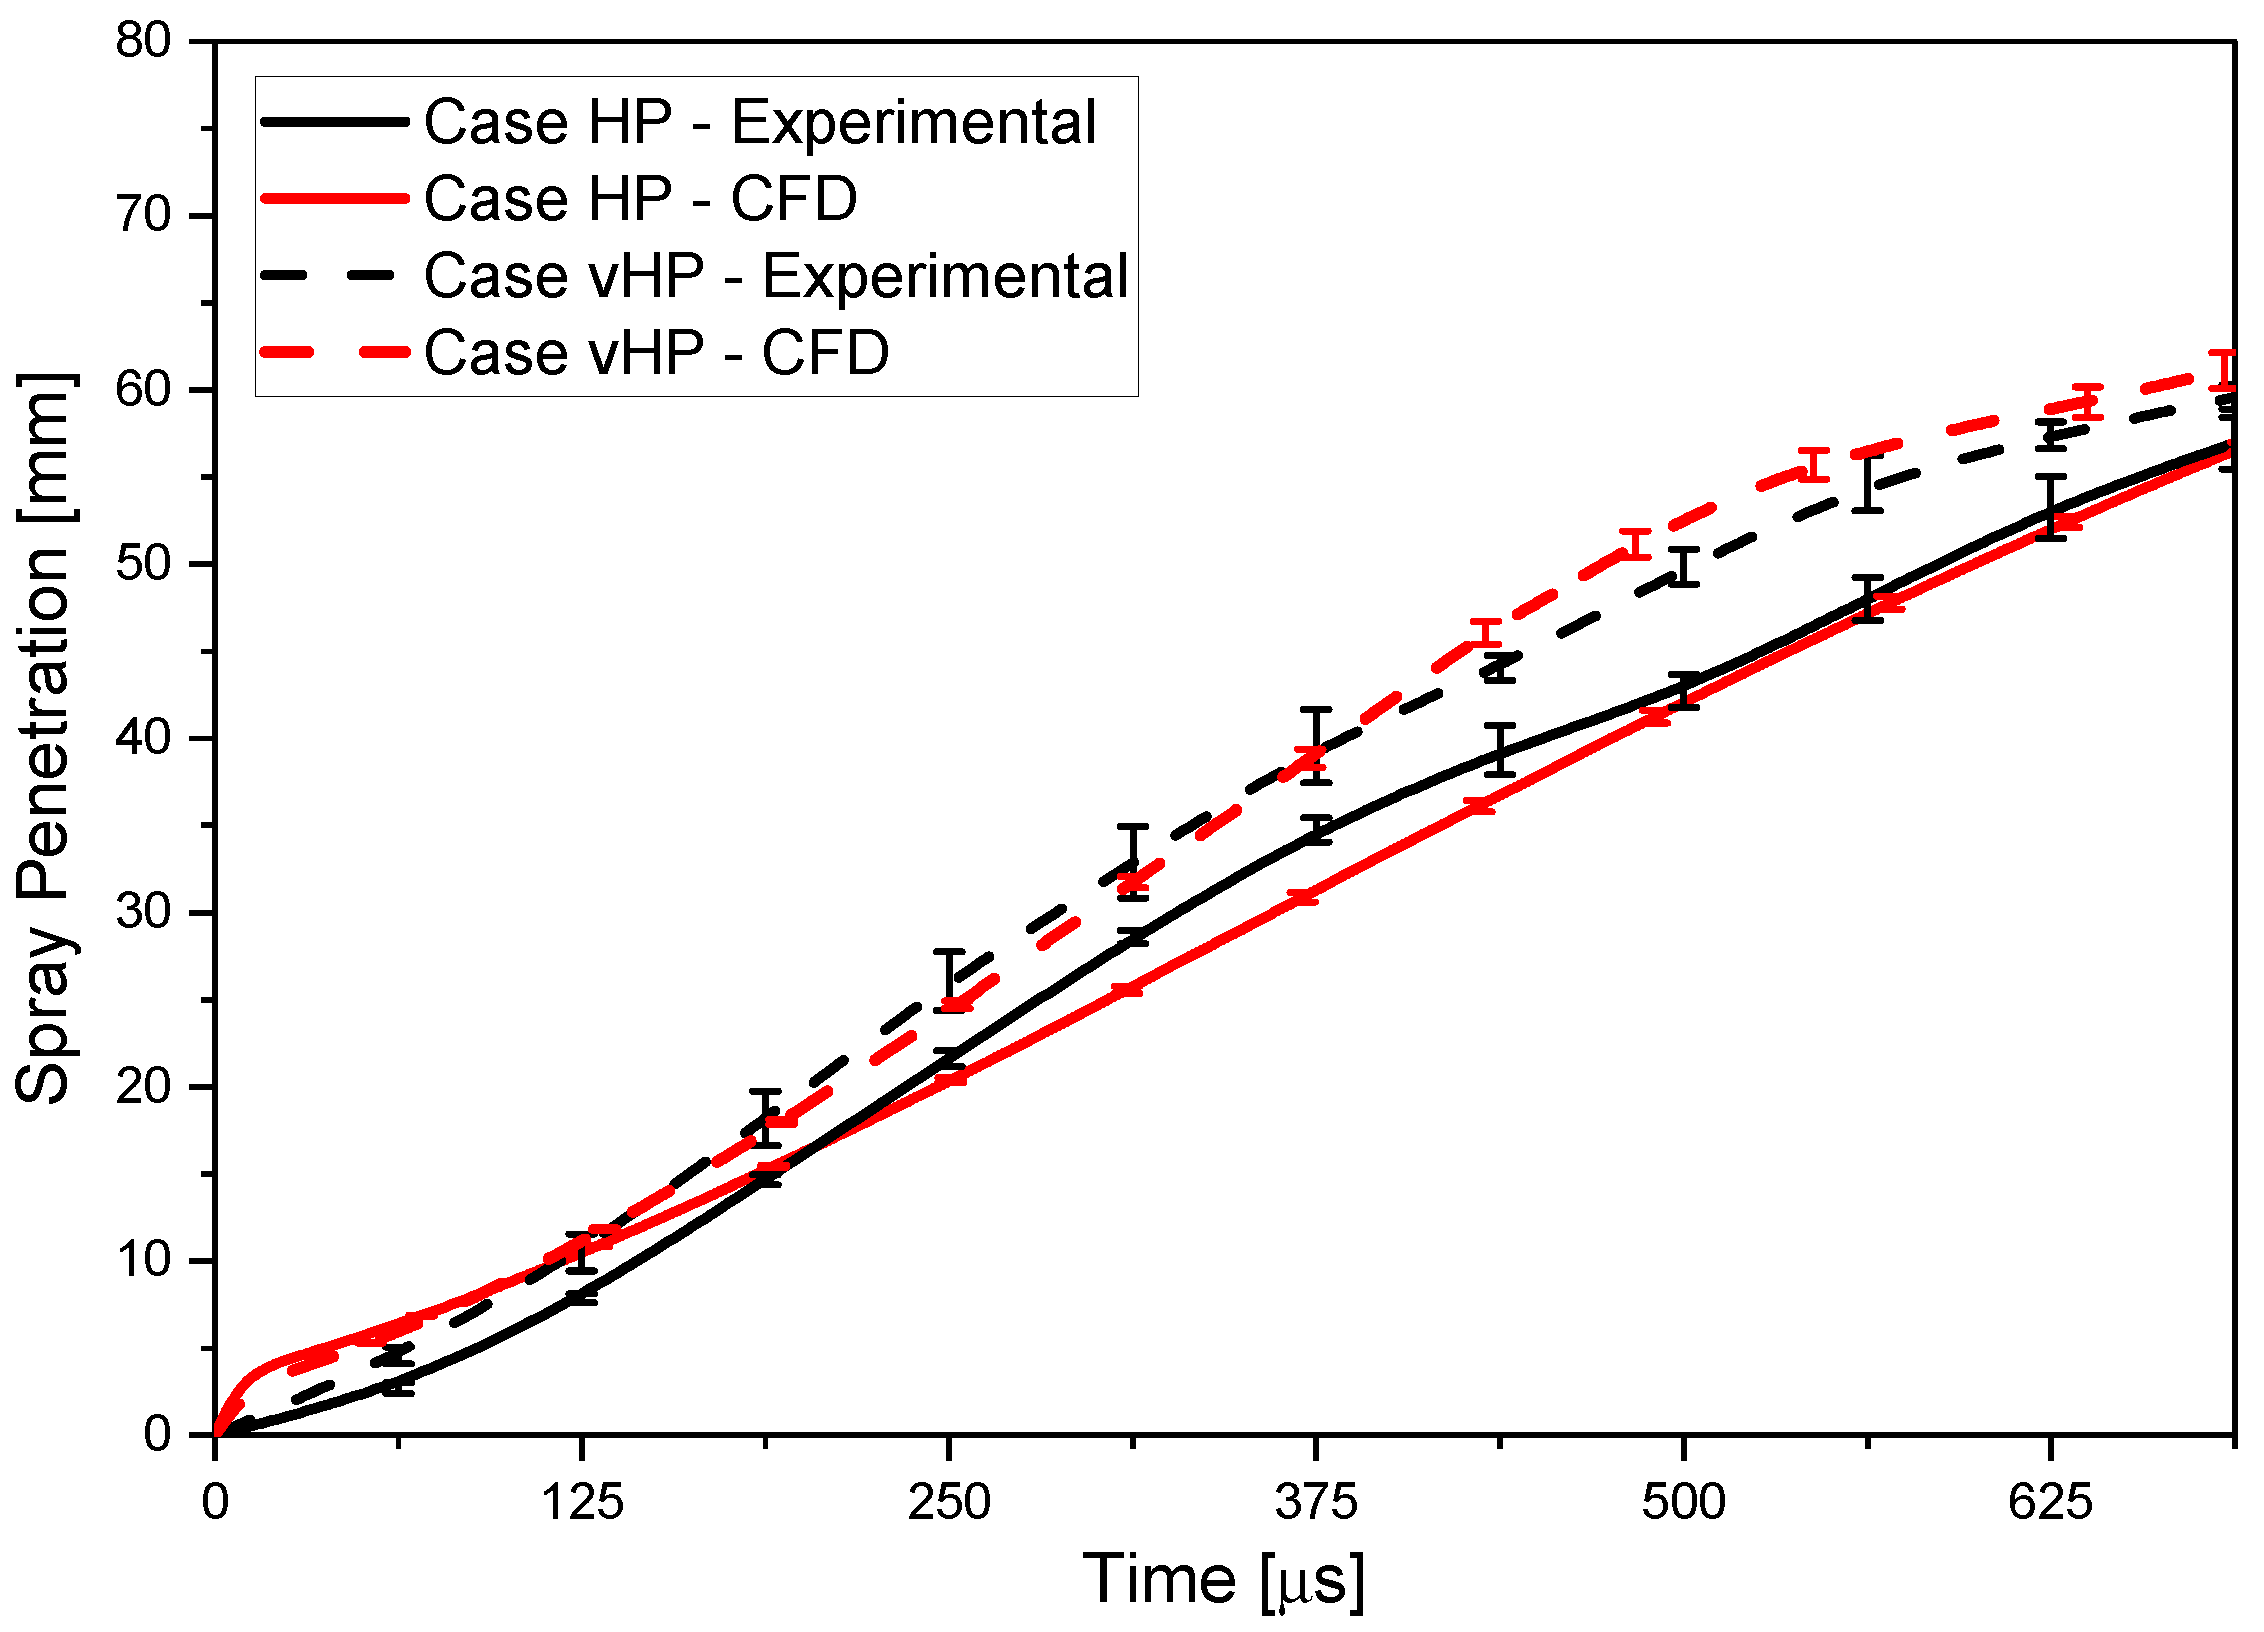
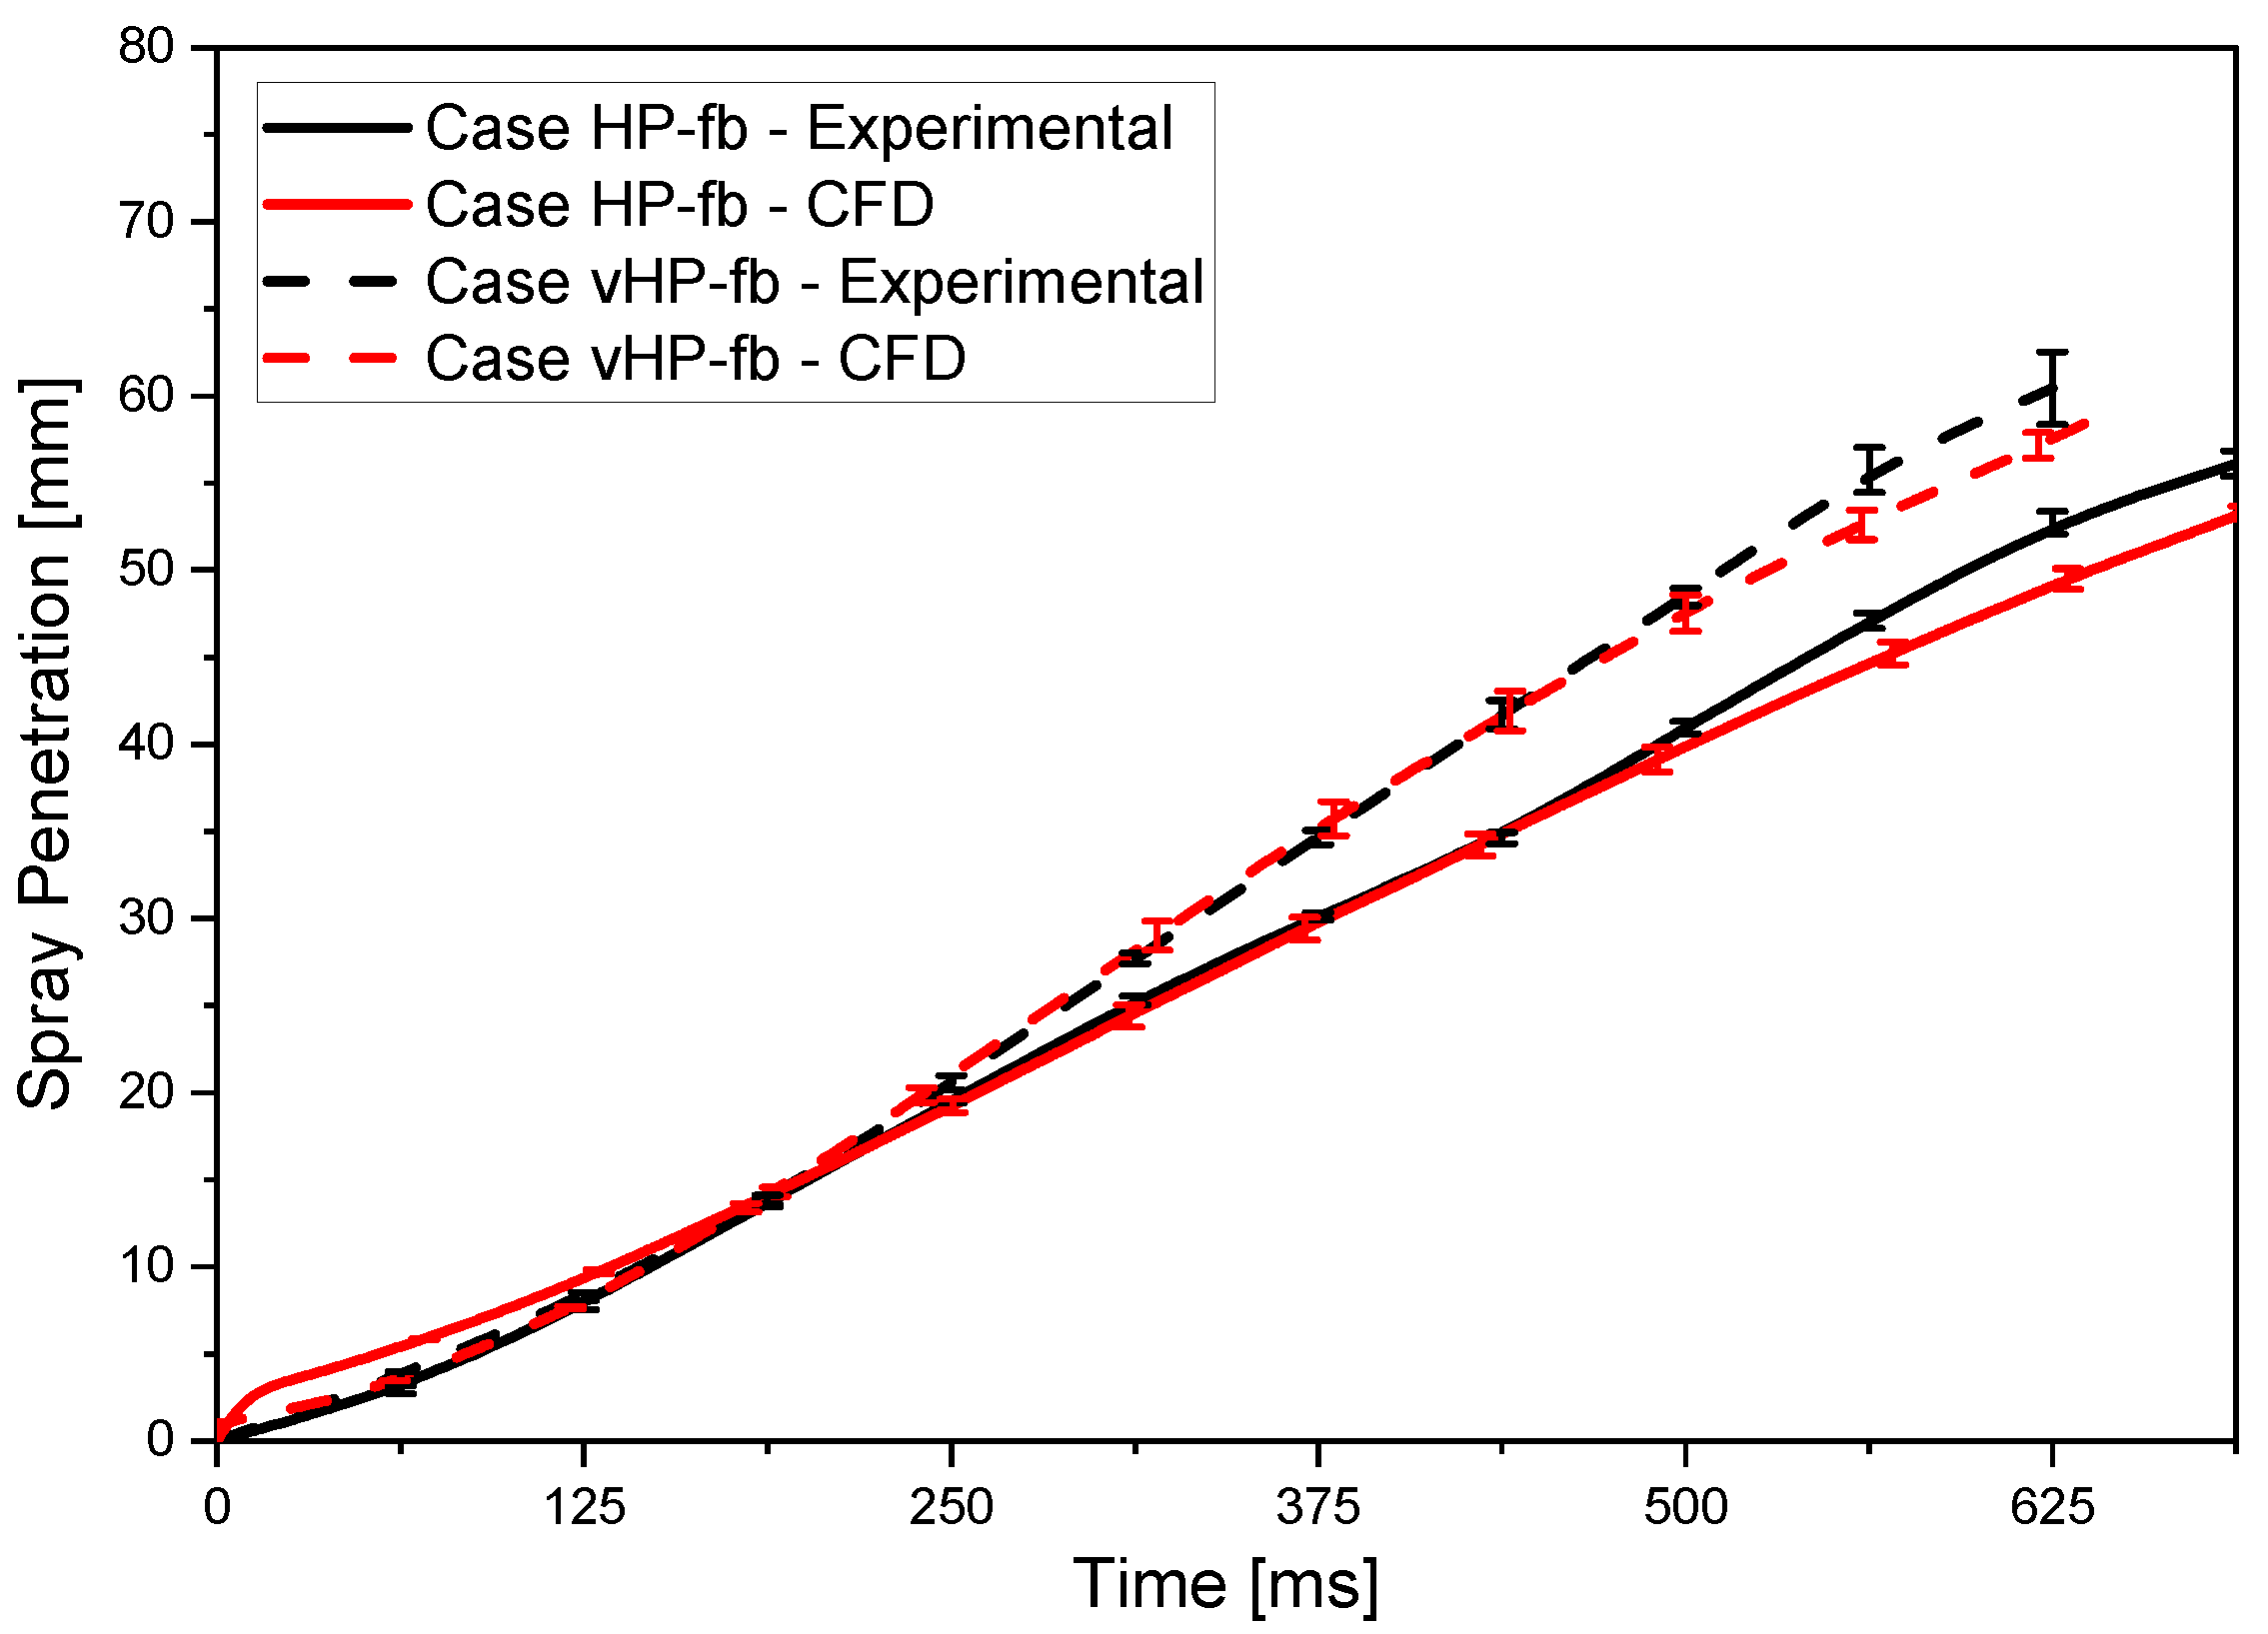
Cases HP (high-pressure) and vHP (very high-pressure) examine nonevaporative gasoline sprays, while cases HP-fb and vHP-fb refer to intense evaporation conditions or, more easily, flash boiling. The fuel temperature is increased to 363 K and ambient pressure is lowered to 0.2 bar. Nitrogen inert gas was used to fill the combustion vessel and realize the desired back-pressures. CFD simulations were validated comparing spray penetration length and shape exploiting experimental images acquired using the shadowgraph optical technique. The flash-boiling breakup model developed by the authors for the CFD simulations was implemented in CONVERGE 3.0 as a User Defined Function (UDF).
2.2. Computational Method
The simulations were carried out with an Eulerian–Lagrangian approach. A modified PISO algorithm was adopted for the solution of the governing equations of the continuum-phase [
27]. The idea behind the present contribution is to use a fixed parameter setup to simulate both nonevaporative and flash-boiling conditions. For this purpose, the developed effervescent breakup model is activated only in flash-boiling conditions to account for the thermodynamic breakup mechanism together with an improved vaporization model. Therefore, it is appropriate to provide a detailed description of the phase change, heat transfer and flash-boiling breakup models essential for simulating flash-boiling conditions. Among other effects, the nucleation of vapor bubbles within the liquid droplets triggers a thermodynamic breakup mechanism that is approximately ten times faster in comparison with the classical aerodynamic breakup [
28,
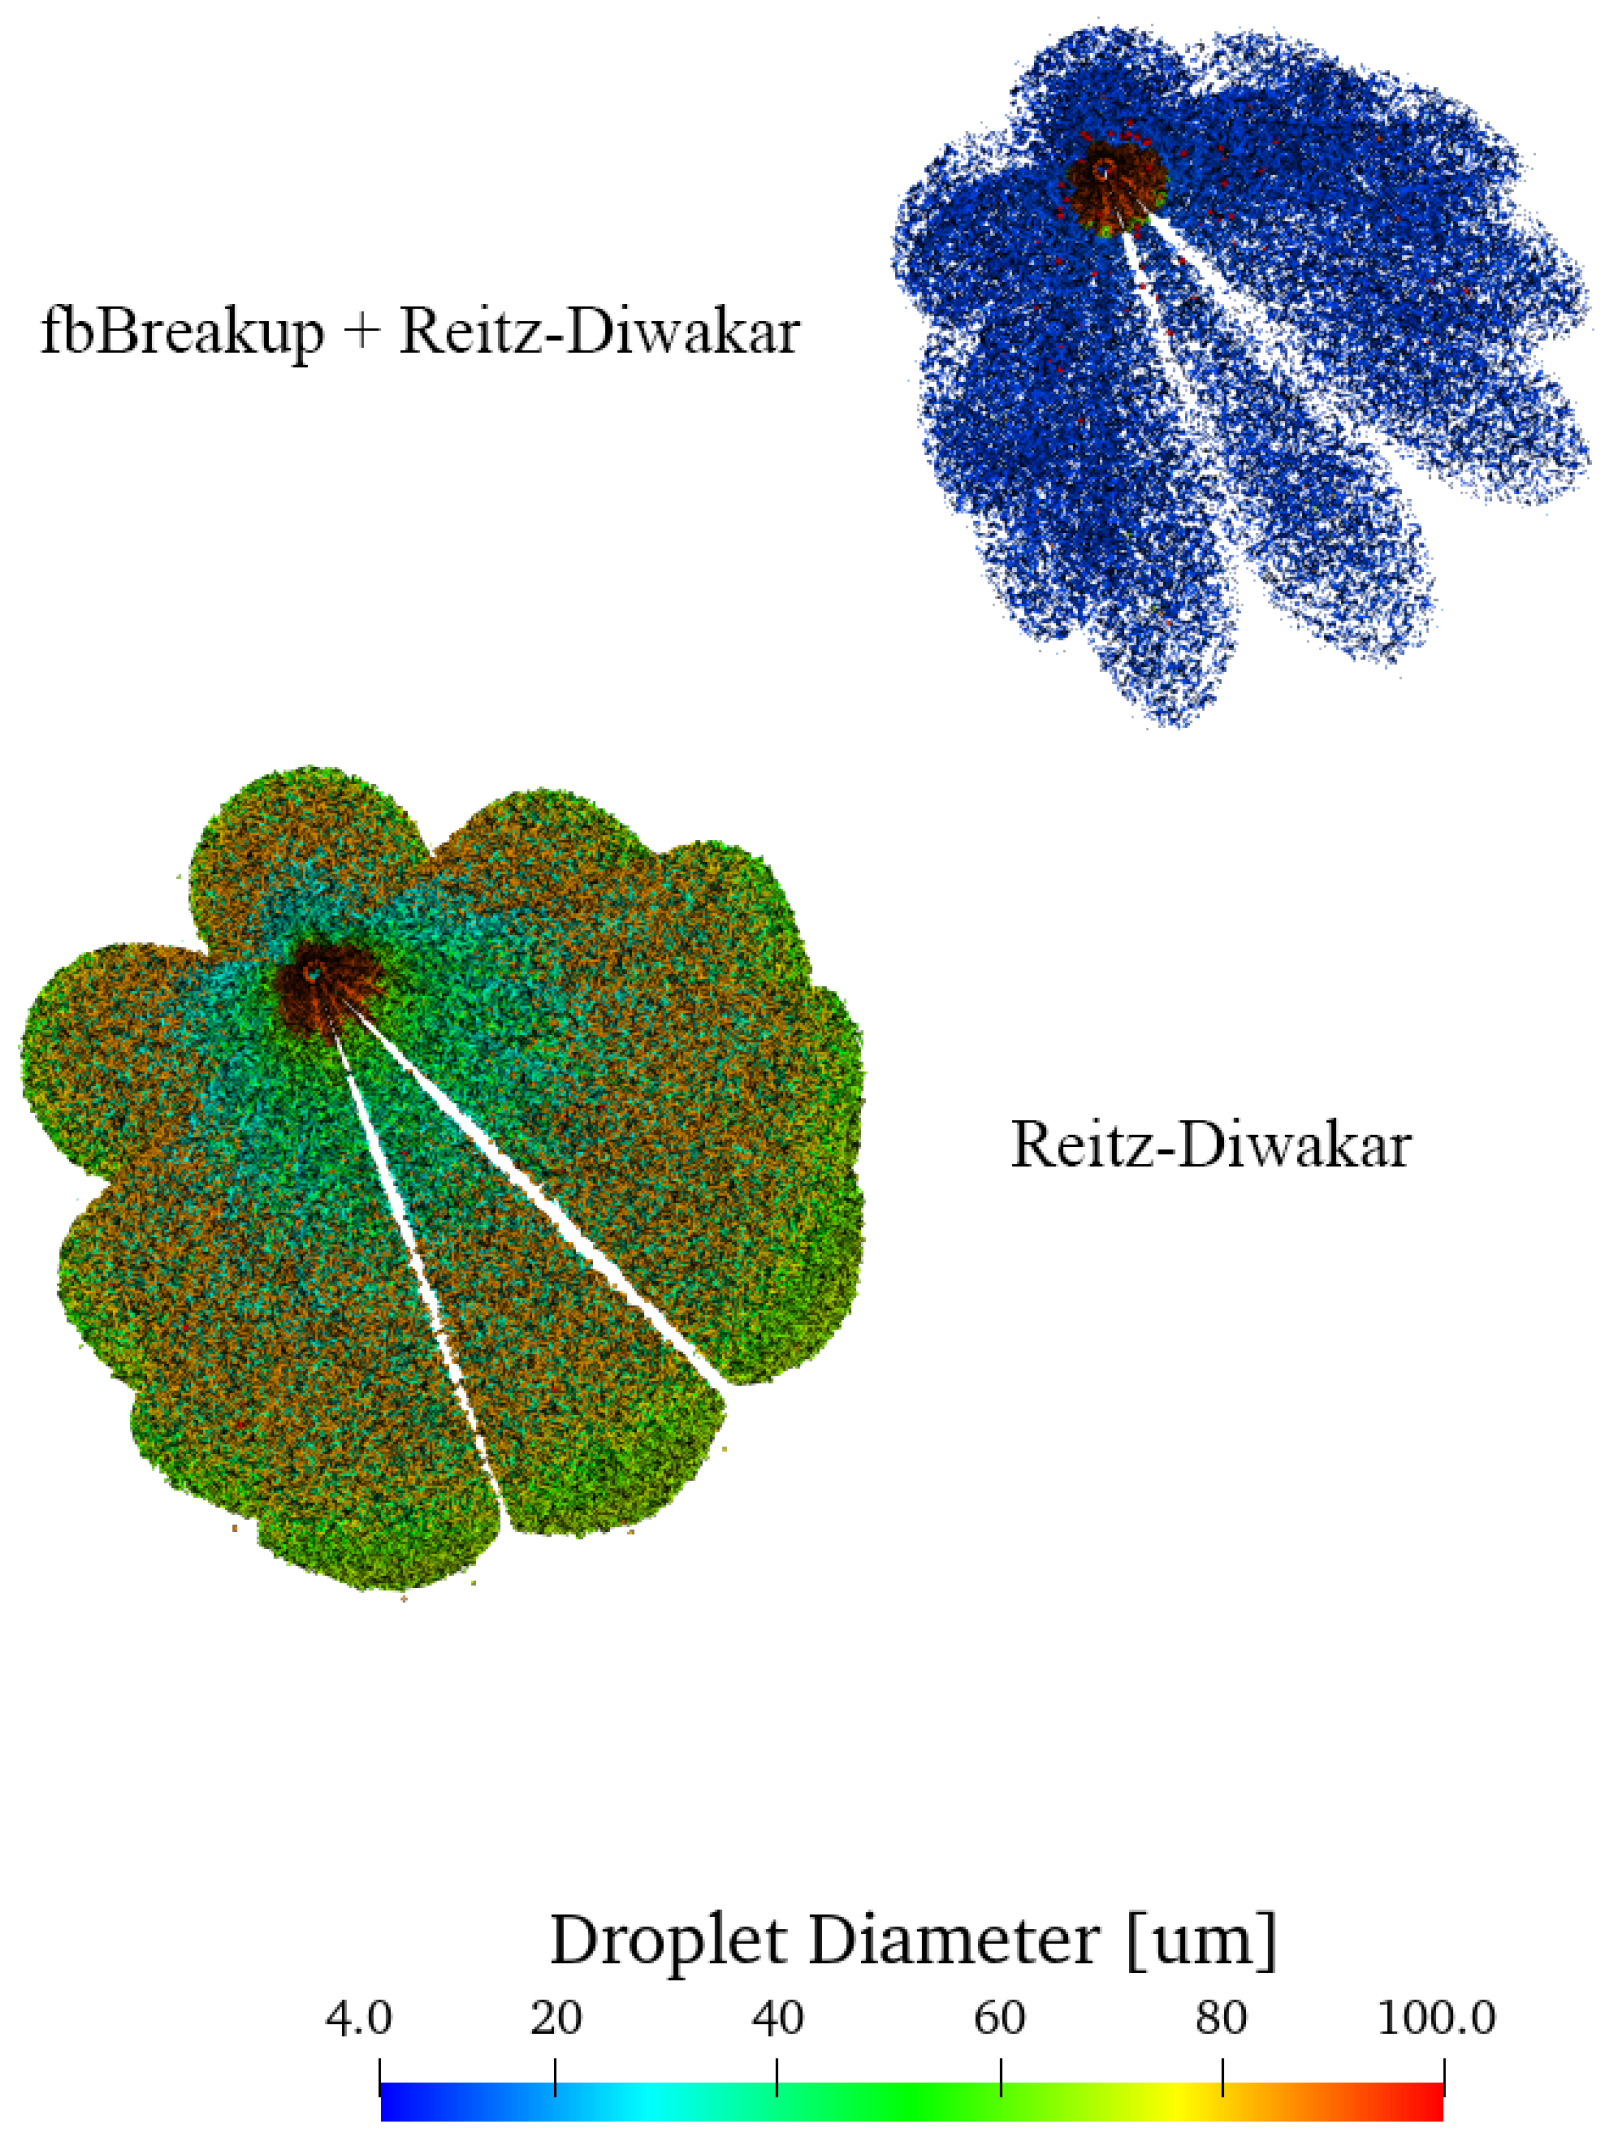
29]. Based on this consideration, an effervescent thermodynamic breakup model, named
fbBreakup, was developed as an UDF within CONVERGE CFD code [
30]. The secondary aerodynamic breakup was modelled with the Reitz–Diwakar model [
31,
32].
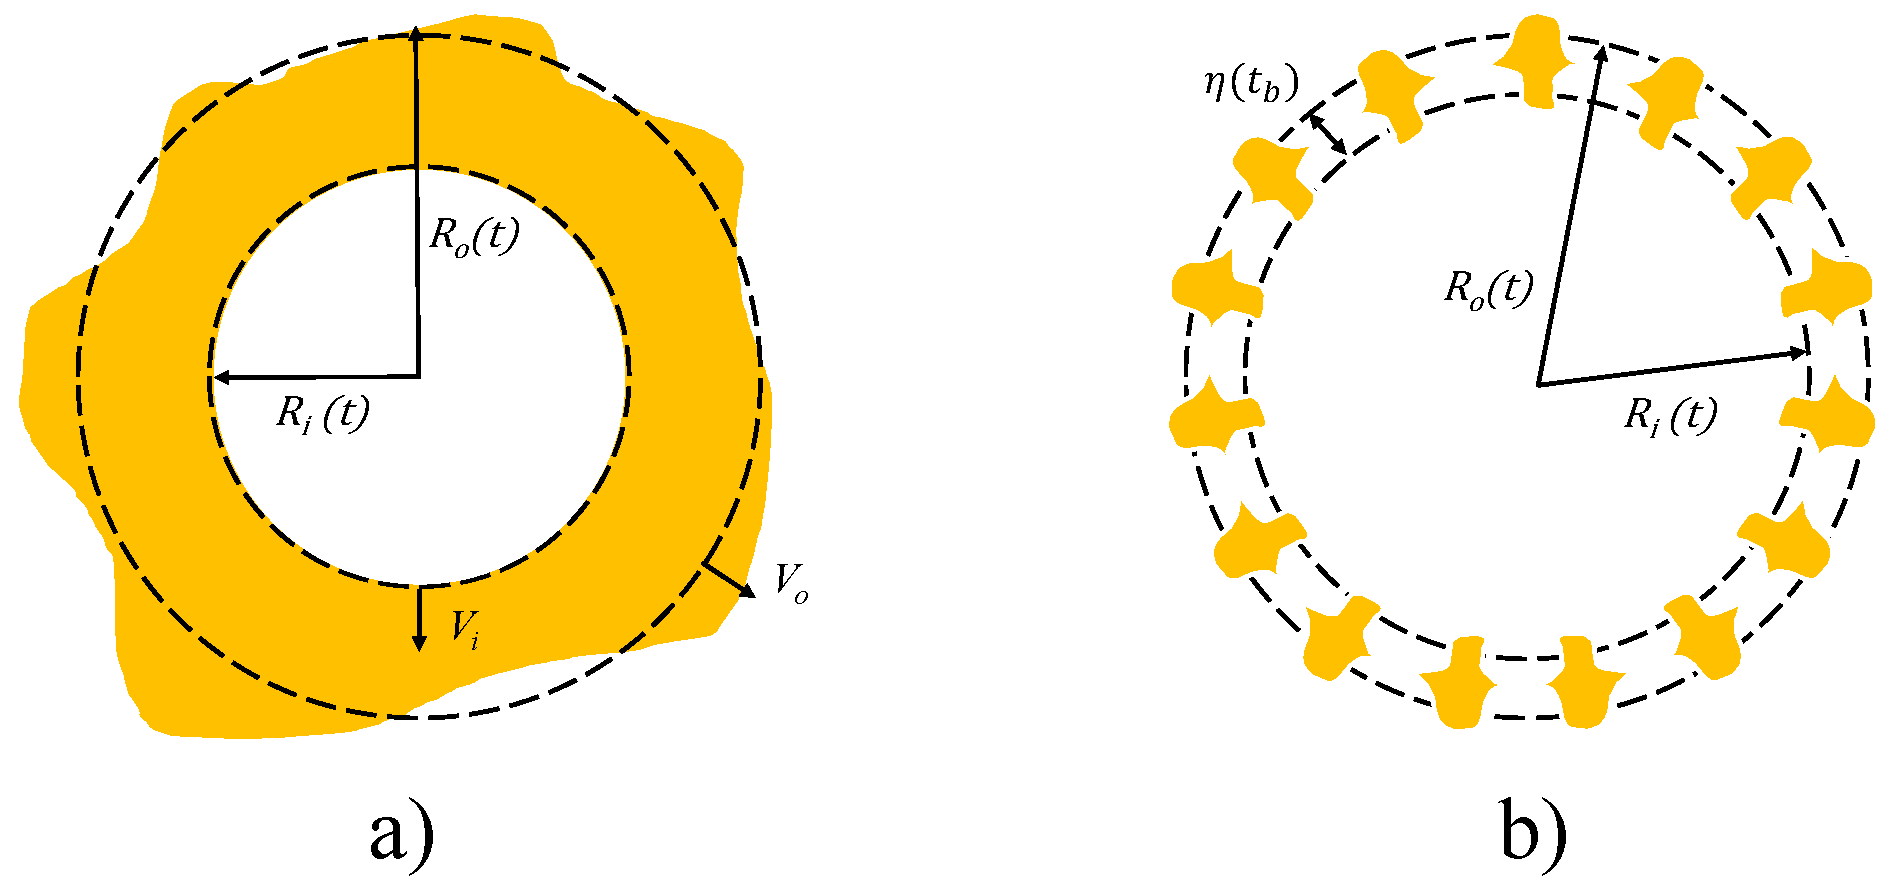
Figure 2 shows the effervescent breakup of the bubble–droplet system.
The liquid is injected in superheated conditions and so vapor bubbles nucleate within the liquid ligaments [
31]. Their initial radius,
, is described by Equation (
1) and represents a dynamic equilibrium between the pressure forces and the liquid surface tension (
):
where
is the ambient pressure computed in the Eulerian framework and
is the liquid saturation pressure.
is the liquid droplet temperature. If the vapor bubbles have a radius smaller than this value, they collapse under the force of the surface tension.
is called the critical radius because any variation of the pressure difference “
” will cause the bubble to grow or collapse. According to the Rayleigh–Plesset equation and neglecting cooling effects from evaporation and thermal diffusion to the bubble surface (inertial-dominated growth), the bubble growth rate was calculated as follows.
This assumption can be accepted because for a bubble growing in a superheated droplet, the timescales from initiation to droplet breakup are in the order of tens of microseconds and so faster than vaporization and heat exchange phenomena [
33] The droplet growth rate is related to the bubble growth rate as follows [
29]:
The breakup of the bubble + droplet system is driven by instabilities that grow along the droplet and bubble surfaces represented in
Figure 2a. The instability growth rate
is the largest real root of the following normalized growth rate equation [
29]:
where:
and
are the bubble and droplet growth rate previously discussed, while
and
are the gas densities within and outside the bubble + droplet system. The following relationship describes the temporal evolution of this instability, denoted with
, which grows with the rate
:
When the instability amplitude becomes larger than a characteristic length of the spray (
Figure 2b) [
34], which can be chosen equal to the film thickness (i.e., the difference between droplet and bubble radius
), breakup takes place. It follows that the breakup criterion is equal to:
where the initial disturbance
is:
. Breakup occurs at
when the instability amplitude equals the film thickness
.
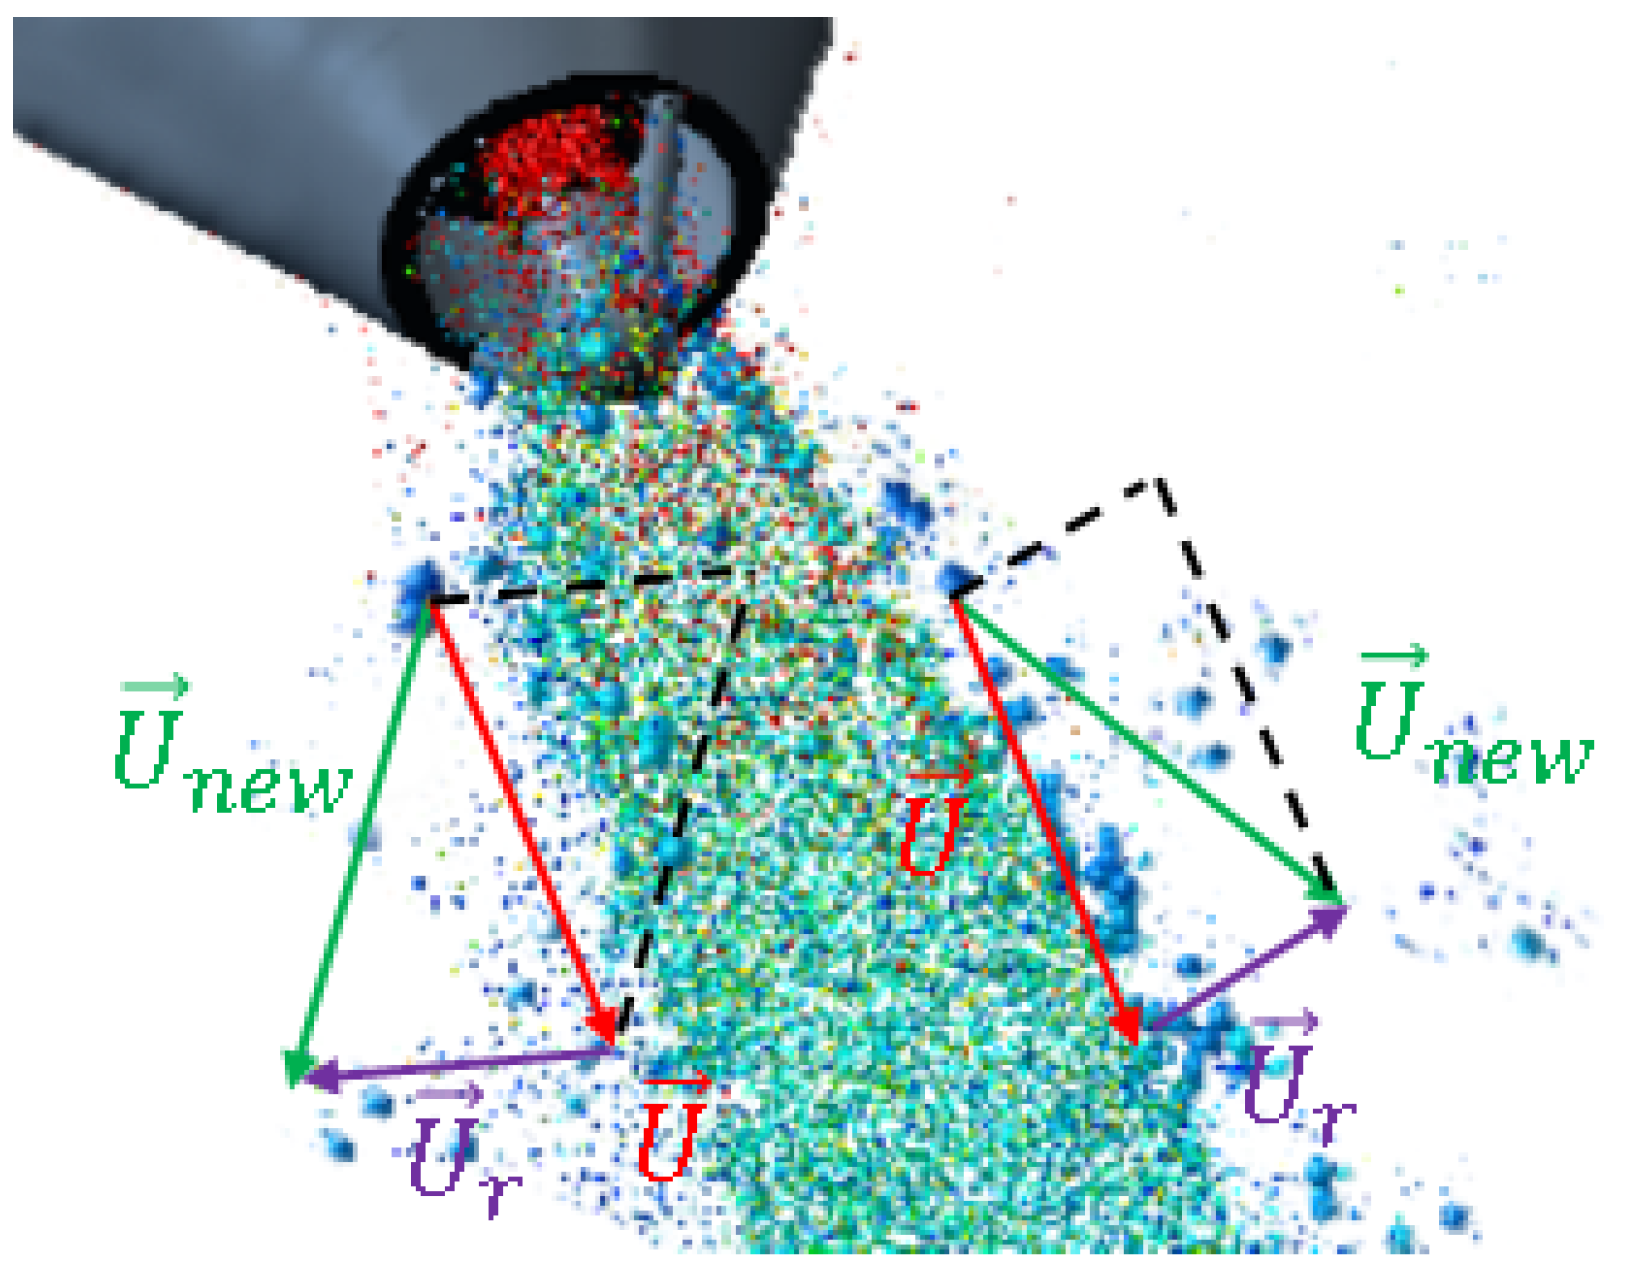
is a model constant that acknowledges the complexities that can be found in reality. In the present investigation, it is assumed equal to the unity. The flash boiling breakup is a catastrophic breakup because it leads to an explosion of the droplet, the expansions of the plumes and thus the plume-to-plume interaction. To reproduce this behavior, once the breakup occurs, a radial velocity component is added to the original velocity of the droplet as shown in
Figure 3.
The magnitude of the radial velocity
is obtained from mass and momentum conservation before and after breakup [
29]:
If follows that the new velocity components, after breakup, are equal to:
vector lies on a plane perpendicular to the initial velocity vector of the parcel and it has a random orientation.
is a coefficient for scaling the radial velocity. Here, it is set equal to the unity. The size of droplets after breakup can be calculated with following relation obtained from the conservation of mass and energy [
29].
where
is the Sauter Mean Radius.
Mass conservation during the breakup process is obtained updating the number of particles is each parcel:
where
and
are the number of particles, respectively, before and after breakup.
Each parcel can experience the flash-boiling breakup only one time. After that, it undergoes on aerodynamic breakup. Differently from the flash-boiling breakup, the latter can be applied multiple times. A specific input parameter allow to activate the fbBreakup model when flashing conditions were simulated. This combined thermodynamic–aerodynamic breakup model was validated in previous works of the authors, but in the present contribution, it will be extended to ultrahigh injection pressure conditions [
23,
28].
Further than modifying the breakup mechanism, flash boiling strongly influences the phase change process. Amsden’s energy balance was used to simulate heat transfer within droplets. The Ranz–Marshall correlation is applied to determine the rate of heat transfer per unit area. Full details and complete descriptions can be found in [
30,
35,
36].
Price models was adopted for describing superheated liquid phase transition [
37]. In such a model, the evaporation rate is given by two components: the subcooled and superheated terms. The subcooled term is computed as:
where:
R: drop radius;
: ambient pressure;
: nondimensional Sherwood number, function of Reynolds and Schmidt numbers:
: binary diffusivity coefficient;
: vapor film temperature (average of the temperatures of the droplet and of the surrounding gas);
: vapor film specific gas constant;
: partial vapor pressure of the liquid species;
: saturation pressure.
The superheated term is:
where:
: latent heat of vaporization of the liquid;
: boiling temperature of the fuel at the specific ambient pressure;
: droplet temperature;
: heat transfer empirical coefficient [
31].
It follows that the total evaporation rate is:
The other physical submodels, present in the Lagrangian simulation, are reported in
Table 3.
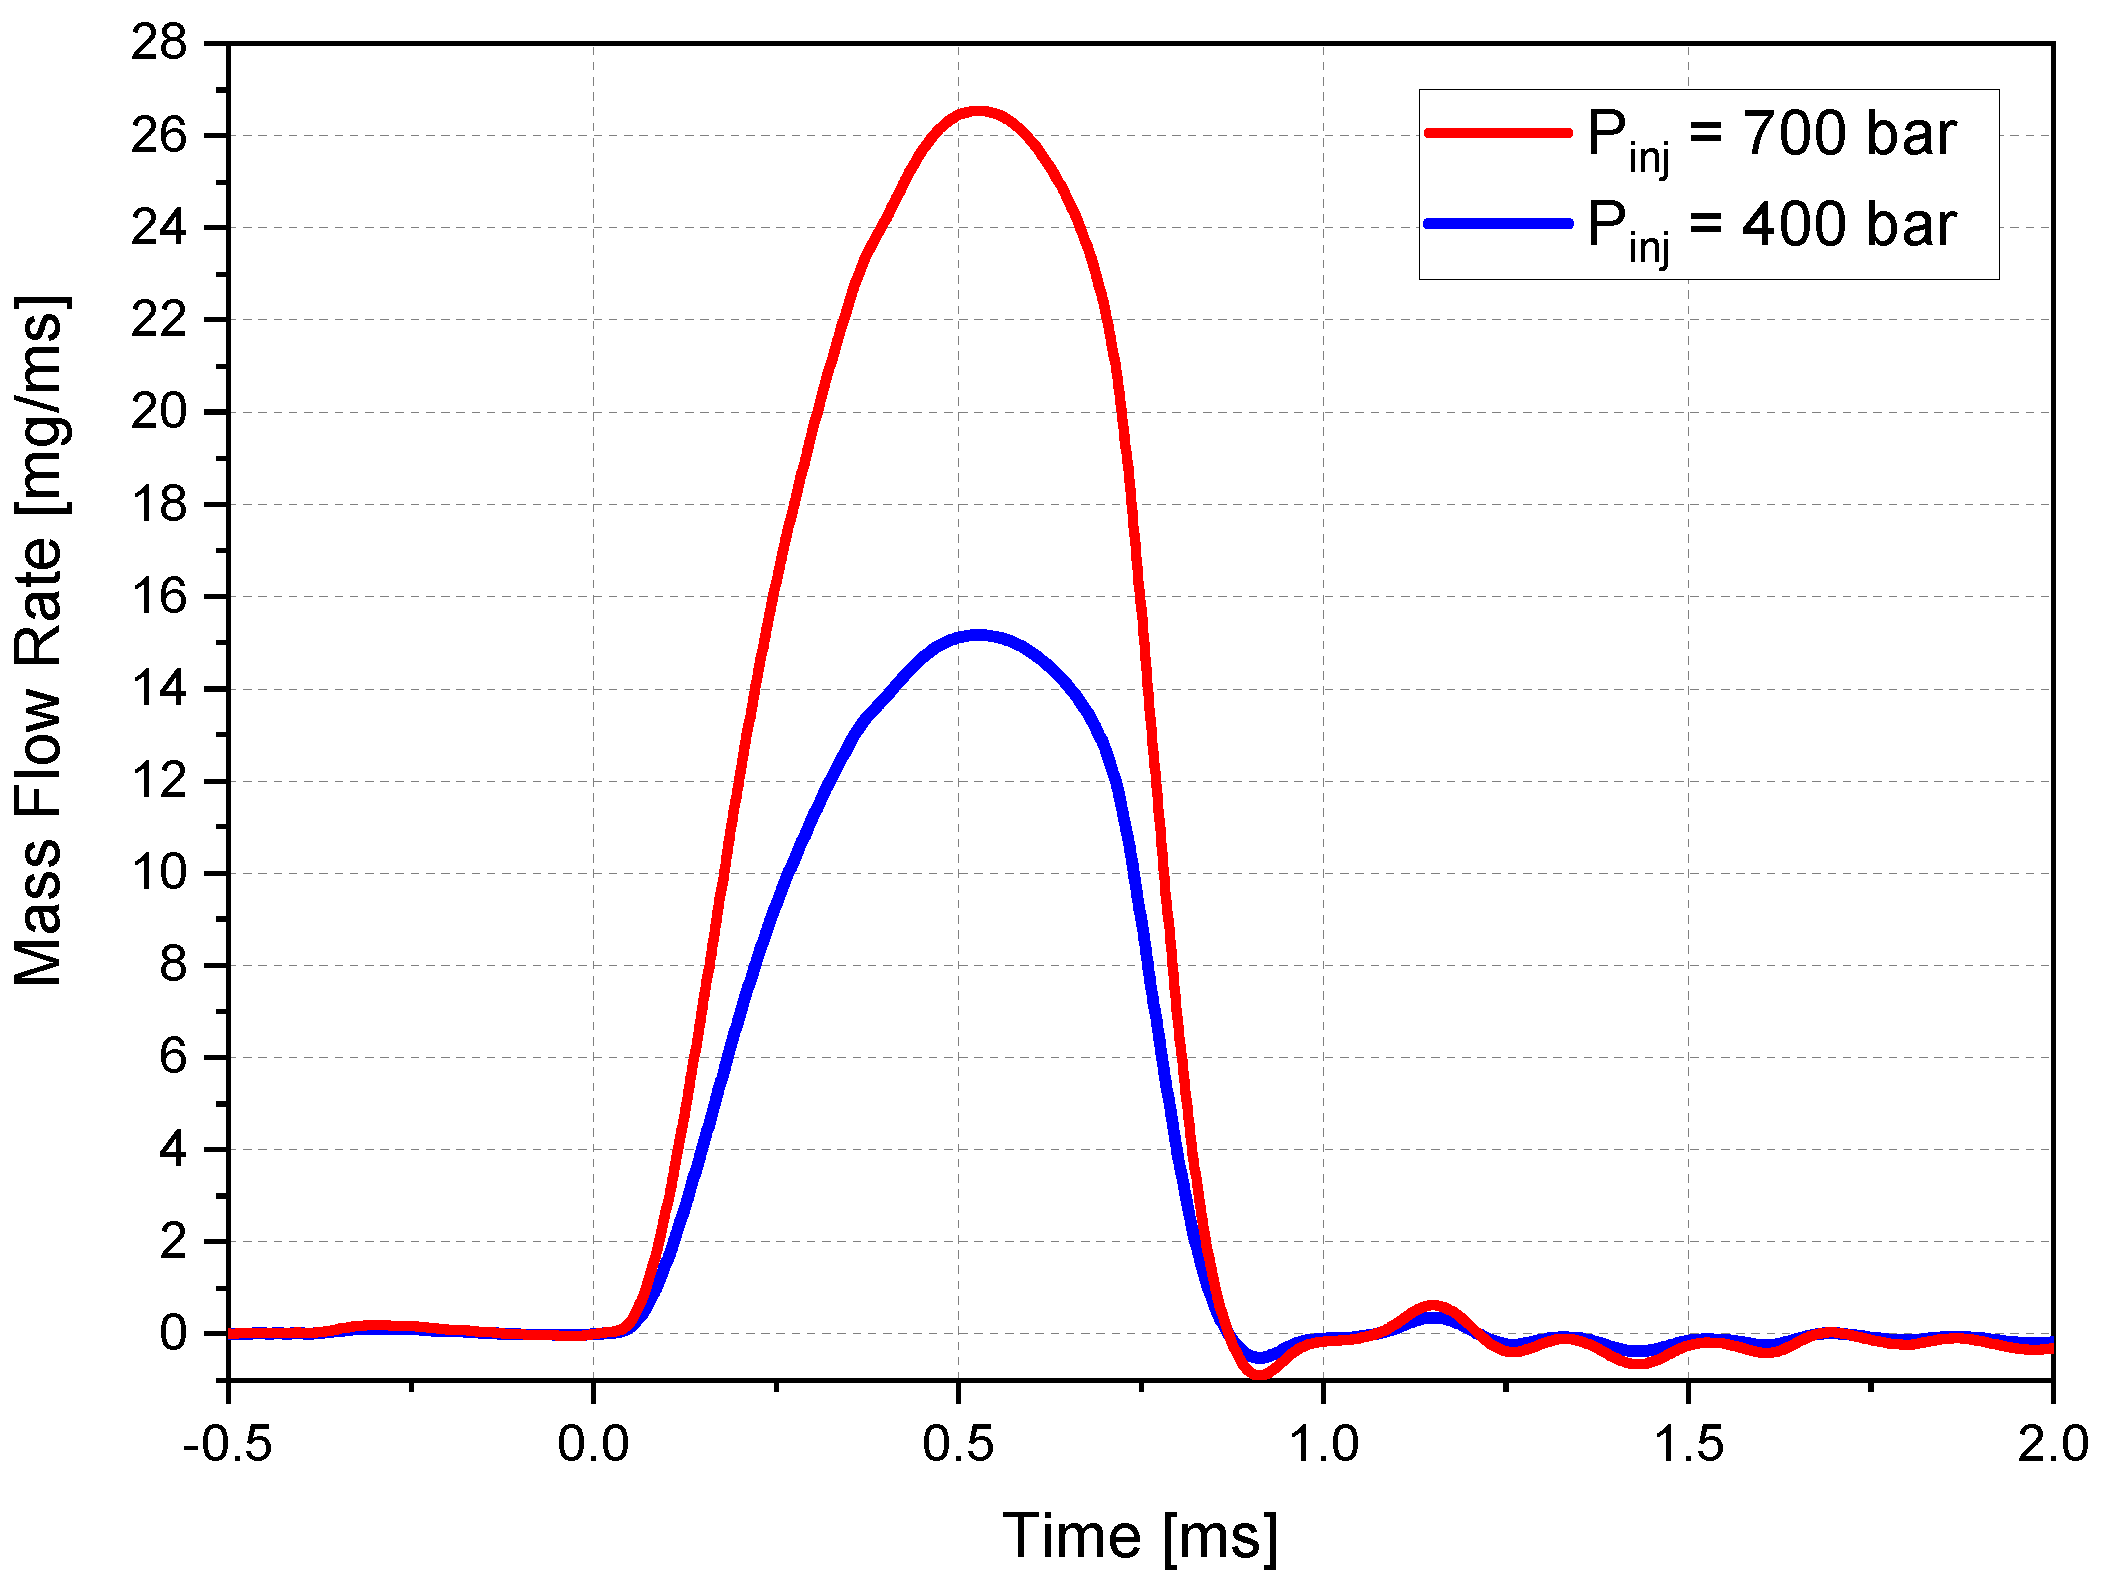
Figure 4 shows the mass flow rate profiles measured by the injector manufacturer.
The parcel count for a grid of 0.125 mm is equal 200,000 parcels per nozzle accordingly with [
30,
38]. Parcels were initialized with a diameter equal to the nozzle one as reported in
Table 1. The cone angle of the spray was measured from experimental images and set equal to
and
for, respectively, cases HP/vHP and cases HP-fb/vHPfb.
Table 4 reports the parameters for the aerodynamic breakup. The Reitz–Diwakar’s constants
,
,
and
are set equal for both flash boiling and ambient conditions.
The injection environment is a cylinder with a height of 0.75 m and a diameter of 0.150 m, which matches the constant volume chamber used in the experiments. The domain was discretized using the internal CONVERGE mesh tool [
30,
39] with a 2 mm base grid, a fixed embedding refinement zone in the near nozzle area and an adaptive mesh refinement (AMR) depending on the velocity gradient for the spray development. Three different grid levels were tested: coarse, base and fine, characterized by different embedding and AMR levels.
Table 5 reports all the details.
The injection environment is filled with nitrogen and RANS RNG-k-
model used for turbulence modeling [
21,
32]. Numerical results were postprocessed using Paraview software.


