Article

Numerical Evaluation of the Flow within a Rhomboid Tessellated Pipe Network with a 3 × 3 Allometric Branch Pattern for the Inlet and Outlet

by
René Rodríguez-Rivera
1,
Ignacio Carvajal-Mariscal
1,*,
Hilario Terres-Peña
2,
Mauricio De la Cruz-Ávila
3,* and
Jorge E. De León-Ruiz
4
1
Instituto Politécnico Nacional, ESIME-UPALM, Mexico City 07738, Mexico
2
Departamento de Energía, Universidad Autónoma Metropolitana, San Pablo 180, Col. Reynosa Tamaulipas, Azcapotzalco, Mexico City 02200, Mexico
3
Centro de Investigación y de Estudios Avanzados, CINVESTAV, Instituto Politécnico Nacional 2508, San Pedro Zacatenco, Mexico City 07360, Mexico
4
Centro de Investigación en Materiales Avanzados, S.C., CIMAV, Miguel de Cervantes 120, Complejo Industrial Chihuahua, Chihuahua 31136, Mexico
*
Authors to whom correspondence should be addressed.
Fluids 2023, 8(8), 221; https://doi.org/10.3390/fluids8080221
Submission received: 30 June 2023 / Revised: 25 July 2023 / Accepted: 28 July 2023 / Published: 30 July 2023
(This article belongs to the Special Issue Pipe Flow: Research and Applications)

Abstract

:
This study presents a comprehensive assessment of the hydrodynamic performance of a novel pipe network with tessellated geometry and allometric scales. Numerical simulations were used to evaluate flow behaviour and pressure drop. The comparison geometry featured a Parallel Pipe Pattern (PPP), while the proposed design employed a Rhombic Tessellation Pattern (RTP). Steady-state simulations were conducted under identical boundary conditions, examining water mass flows ranging from 0.01 to 0.06 kg/s. The results revealed RTP significant advantages over the PPP. The RTP, integrated with a fractal tree pattern, demonstrated remarkable capabilities in achieving uniform flow distribution and maintaining laminar flow regimes across the mass flow rates. Additionally, exhibited an average reduction in pressure drop of 92% resulting in improved efficiency. The Reynolds number at PPP inlet was 5.4 times higher than in the RTP, explaining the considerably higher pressure drop. At a mass flow rate of 0.06 kg/s, the PPP experienced a pressure drop of up to 3.43 kPa, while the RTP’s pressure drop was only 0.350 kPa, highlighting a remarkable decrease of 91.5%. These findings underscore the RTP superior performance in minimizing pressure drop, making it suitable for accommodating higher mass flow rates, thus highlighting its exceptional engineering potential.

1. Introduction

Solar collectors are utilized to harness clean, reliable, and cost-effective solar energy, meeting 50–80% of the demand for hot water [1]. An area of current interest in the investigation of flat solar collectors is their application as evaporators known as collector-evaporators. Collector-evaporators have been employed in Rankine organic cycles [2,3] and primarily in direct expansion heat pumps supported by solar energy (DX-SAHP) [4,5]. Several researchers have conducted both experimental and numerical studies to explore the characteristics and advantages of DX-SAHP systems, emphasizing the integration of a collector-evaporator and its potential for thermal energy generation [6,7,8,9,10].
In 2013, Amancio Moreno [11,12] conducted a study on a heat pump system that utilized a roll-bond collector-evaporator field to capture solar radiation. The research revealed that the energy consumption of the compressor was significantly affected by the pressure drop of the working fluid, R134a. Consequently, it was concluded that an investigation into modified geometric characteristics of the collector is crucial. Specifically, exploring channel size and optimizing the fluid entry from the supply line to the inlet of each manifold are key factors to consider in order to reduce pressure drop.
Various methodologies and approaches have been employed to enhance the efficiency and thermal performance of flat plate solar collectors. For instance, Abhishek et al. [13] conducted a compilation of studies utilizing Computational Fluid Dynamics (CFD) for the analysis of flat plate solar collectors. Additionally, investigations into collector-evaporators have explored diverse methods, such as the utilization of phase change materials for latent thermal energy storage [14], thermal behaviour analyses of collectors [7,14,15,16,17,18,19], and more recently, the implementation of pipes with varying geometries [7,17,19].
Xiaolin et al. [19] examined three types of collectors within the DX-SAHP system: the parallel-piping collector, T-fractal collector, and hexagonal tessellation collector. Their findings revealed that the collector utilizing a hexagonal tessellation demonstrated favourable performance, followed by the T-fractal collector and the parallel-piping collector.
Traditional solar collectors typically consist of metal tubes with various arrangements attached to an absorber plate. Among the collector configurations commonly found in the literature, the serpentine and parallel-pipe collectors are the most widely studied. In the serpentine configuration, a single continuous channel is formed by bending a pipe, while the parallel-pipe configuration consists of multiple parallel ducts interconnected by two cross channels. Numerous researchers have conducted numerical and experimental investigations on various flat collectors, focusing primarily on those with parallel-pipes in a serpentine configuration, as well as other specific patterns, to identify the key parameters that influence performance.
Solar collectors typically operate under specific conditions with a water mass flow rate ranging from 0.0011 to 0.066 kg/s at ambient temperatures [20,21,22,23,24]. Various studies have investigated collectors constructed from copper [25,26,27,28,29,30,31,32] or aluminium [25,26,27,28]. The collector areas examined in these studies range from 1.27 to 1.63 m2, while the hydraulic diameter of the pipes varies between 7 and 12 mm [29,33,34,35].
The hydrodynamic results obtained in each study consistently demonstrated that the serpentine collector pattern exhibits a significantly pressure drop compared to the parallel-pipe collector. Primož et al. [17] conducted a numerical and experimental evaluation of three collectors with distinct design patterns: serpentine, parallel, and bionic. The serpentine and parallel collectors had an area of 0.47 m2, while the bionic collector measured 0.45 m2. The hydraulic diameter for all three collectors was 3.5 mm. In their investigation, a water mass flow rate of 0.013116 kg/s was considered, resulting in a pressure drop of 40 kPa for the serpentine collector, 2 kPa for the parallel collector, and 0.930 kPa for the bionic collector, respectively.
Aste et al. [34] investigated a solar collector featuring a parallel pipe configuration, measuring 1.3 × 1.2 m. The water mass flow rate was set at 0.066 kg/s, with an estimated pressure drop of 20 kPa. In a separate study, Buonomano et al. [35] examined a roll-bond solar collector integrated into a photovoltaic-thermal collector. The collector was constructed using aluminium and employed a parallel pipe configuration. It had a capacity of 0.9 litters, with dimensions of 0.992 × 1.644 m and an internal diameter of 8 mm. The water mass flow rate utilized in their study was 0.0902 kg/s.
Lari et al. [36] conducted a study on a solar collector that employed a parallel-serpentine hybrid pipe pattern using Computational Fluid Dynamics (CFD). The collector was constructed with a 1 mm thick stainless-steel material and featured a hydraulic diameter of 16.6 mm. It had a total area of 1.627 m2 and operated with a water mass flow rate of 0.05 kg/s. Under these specific conditions, the calculated pressure drop was determined to be 7.125 kPa.
Extensive research has been conducted on solar collectors incorporating pipes with diverse geometric patterns. Traditional serpentine and parallel configurations are commonly studied, along with pipes featuring hexagonal or T-fractal tessellation arrangements [19]. The incorporation of fractal geometries in heat exchangers has also been examined by several authors [37,38,39], revealing significant improvements in heat transfer efficiency within compact designs, reduced energy consumption for fluid transport, and lower pressure drops across these geometries. Another related concept is that of constructive theories or allometric scales, which are characteristic of all organisms. Geoffrey et al. [40] presented a comprehensive model describing the transport of essential materials through fractal branching tubes that fill space. The model assumes the minimization of energy dissipation and that the terminal tubes, known as capillaries, have identical sizes. Although investigations into implementing the constructive theory in heat exchangers are relatively recent, the obtained results thus far [41,42,43,44,45] confirm the advantages of utilizing this approach.

Aim and Scope

This study introduces a novel 3D model of a pipe network featuring a distinctive geometry that is not commonly documented in the existing literature but shares dimensions with certain solar collector piping systems. The proposed geometry involves a pipe embedded within a plate resembling a solar collector, forming a rhombic tessellation arrangement within the mainframe. Recognizing the potential benefits of incorporating recursive patterns, a fractal tree pattern with trifurcation at the inlet and outlet of the pipe network was integrated. Allometric scales were utilized to determine the suitable diameters for the fractal tree, based on the pipe size in the channels of the piping pattern.
Given the significant cost associated with manufacturing a single device for experimental purposes, this study employs computational fluid dynamics to numerically evaluate the performance of the intricate geometry under investigation. The primary aim of this research is to gather valuable insights into the pressure drop and flow characteristics of the novel piping system. Such information can provide a solid foundation to justify the construction and application of this device in diverse thermodynamic systems that harness solar energy, including flat-bed solar collectors and solar concentrators, among others. By conducting this analysis, the study seeks to contribute to the advancement of solar energy utilization in various applications.
The simulation results obtained from the proposed model are compared with a pipe network of a conventional solar collector that incorporates parallel pipes. Both piping systems possess equivalent dimensions, the same area for the embedded pipe, identical capacity, and utilize the same working fluid properties. The focus of the comparison is solely based on the geometry of each piping system. The simulations were conducted to examine the hydrodynamic performance of each piping system, allowing for a comprehensive comparison of the results and the determination of whether the proposed design featuring a solar collector with rhombic tessellation offers significant advantages over the conventional parallel pipe configuration.
The research introduces advancement by presenting a comprehensive assessment of the hydrodynamic performance of a pipe network featuring a rhombic tessellation geometry with allometric scaling. This approach unveils a host of remarkable findings, showcasing the novel model’s ability to achieve a uniform velocity distribution at identical mass flow rates. The result is a significantly reduced pressure drop compared to the traditional parallel pipe configuration, exceeding conventional expectations. Moreover, the study’s novelty is further accentuated by the rhombic tessellation model’s consistent maintenance of a laminar flow regime, even when subjected to an increased mass flow rate at the system’s entrance. In stark contrast, the parallel pipe system repeatedly succumbs to turbulent flow in a majority of cases. These remarkable outcomes unequivocally underscore the unparallel superiority of the proposed rhomboid tessellation geometry, positioning it as a highly efficient alternative to the common parallel pipe configuration.
This research represents a pioneering endeavour, pushing the boundaries of current knowledge and offering a fresh perspective on the hydrodynamic performance of pipe networks. The innovative use of rhomboid tessellation coupled with allometric scaling brings forth a breakthrough that has the potential to reshape the engineering design.

2. Numerical Details
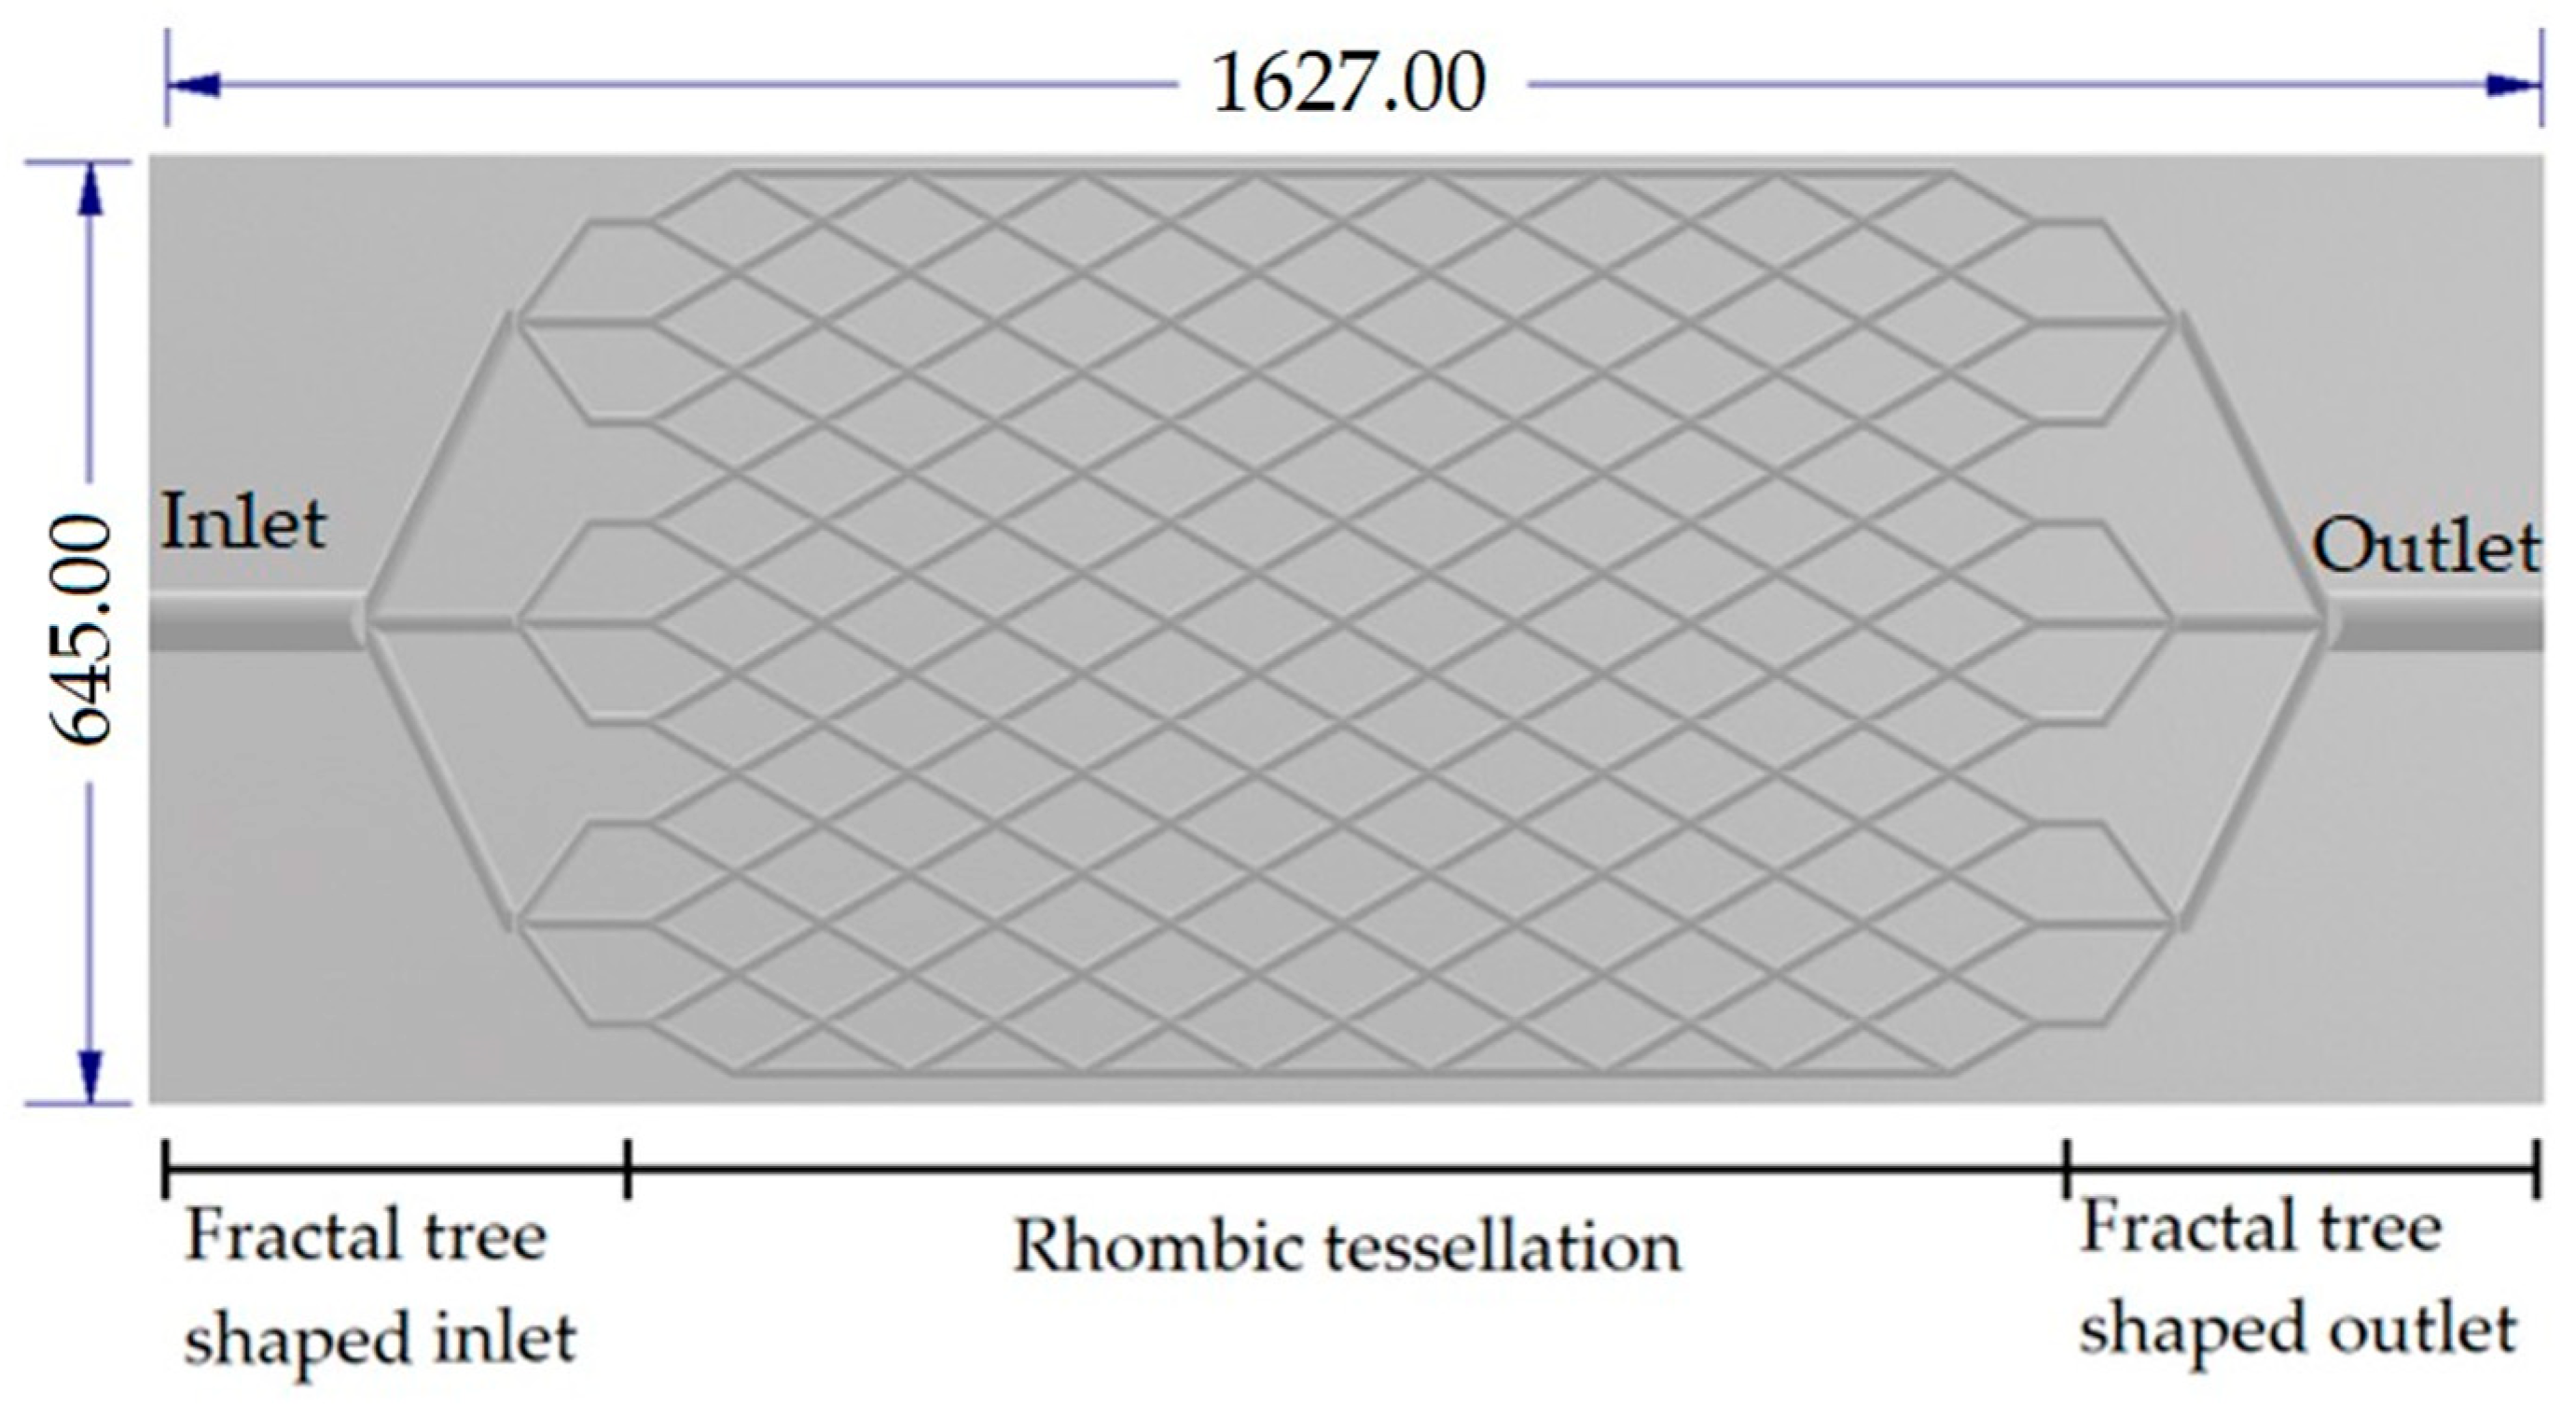
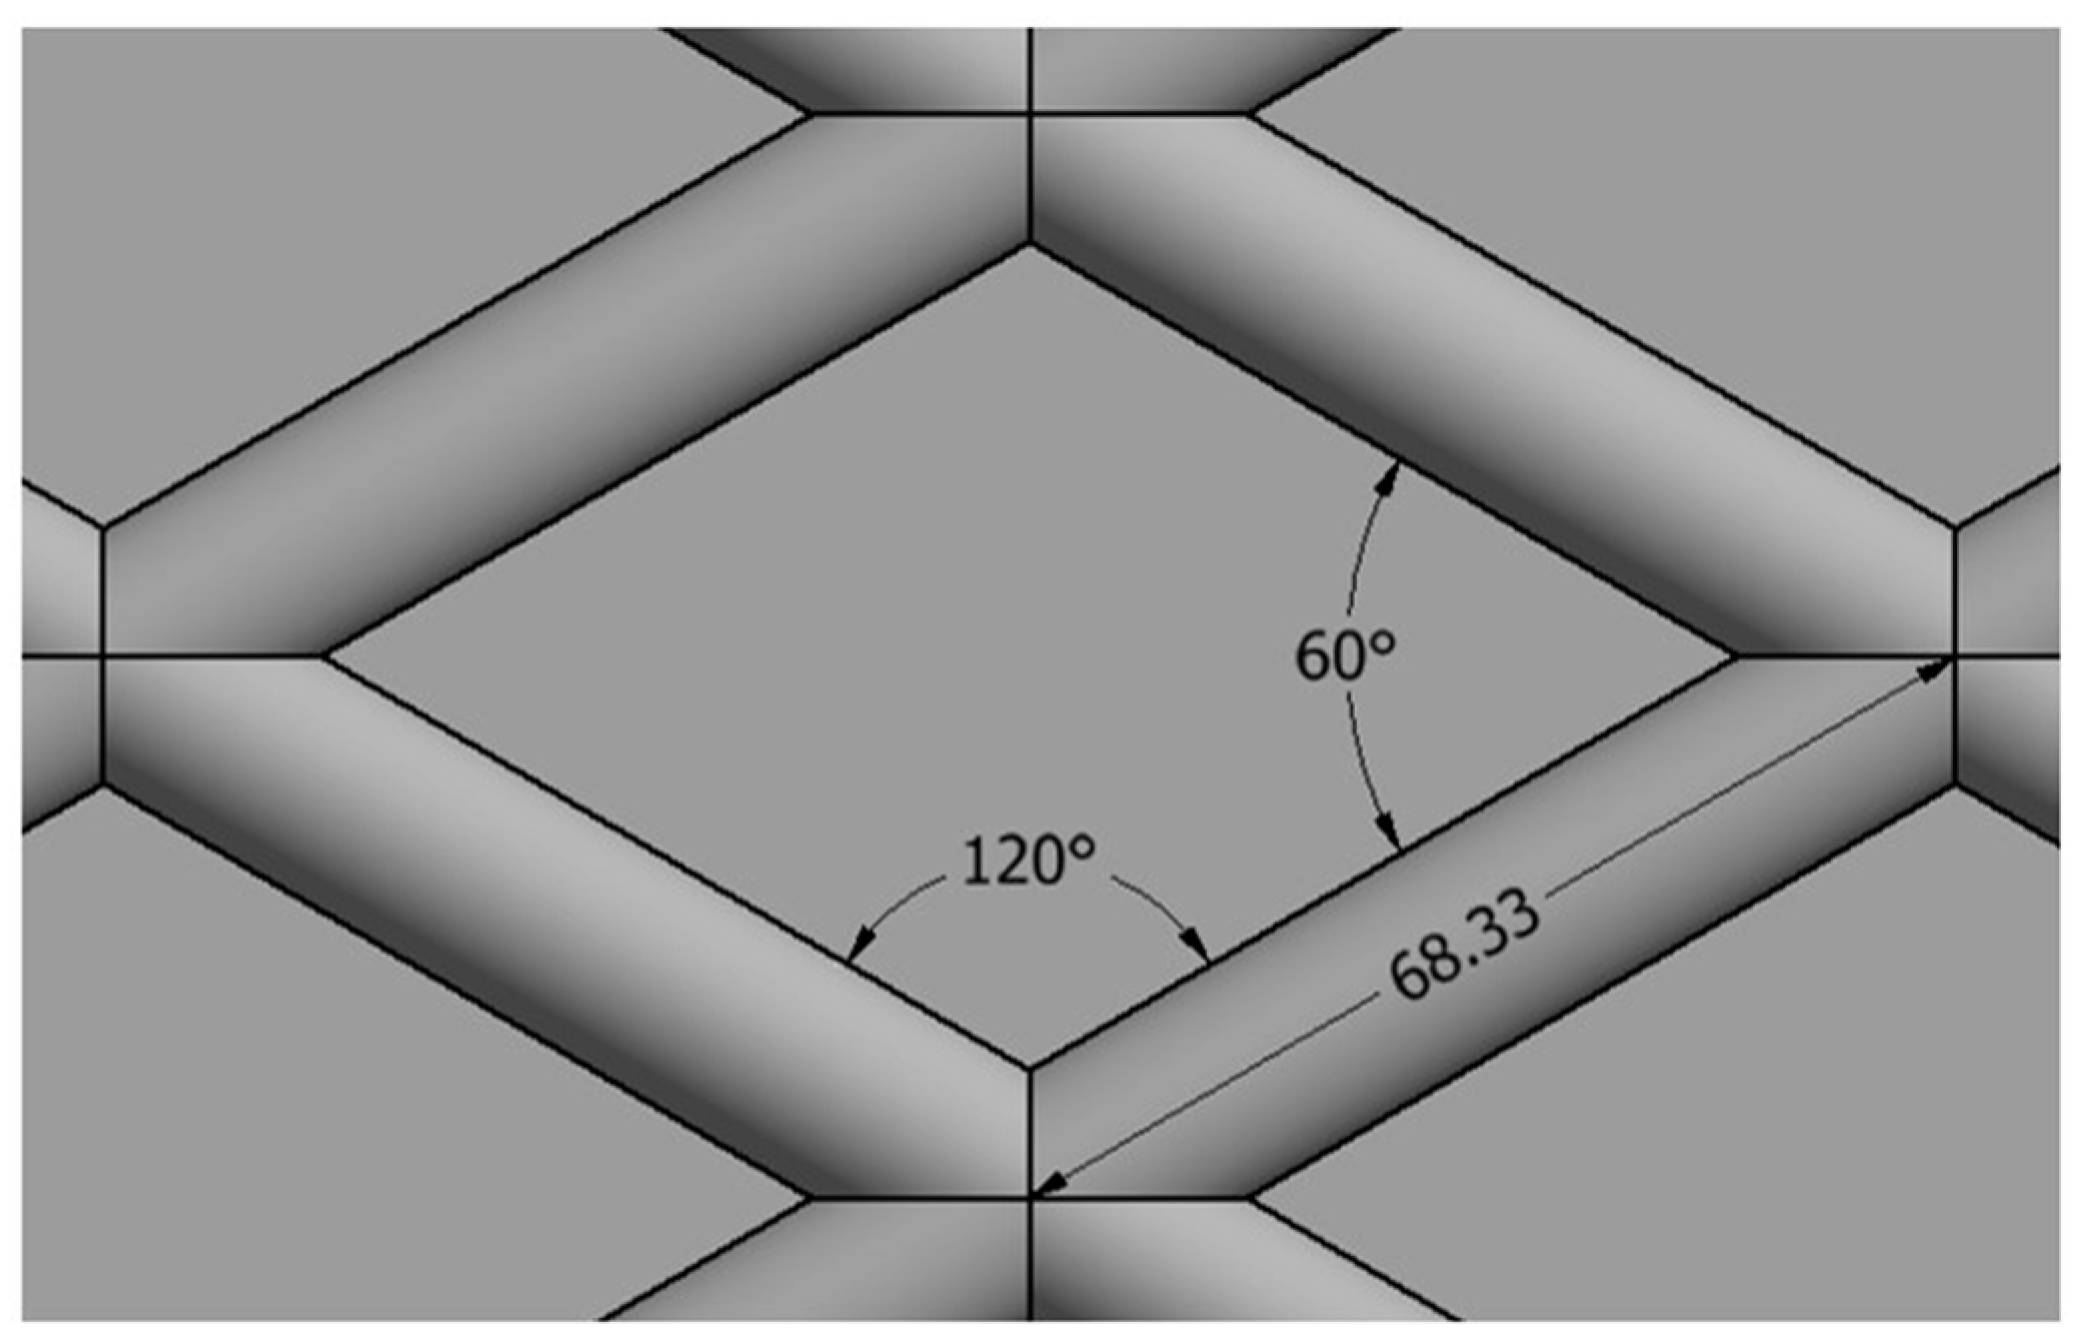
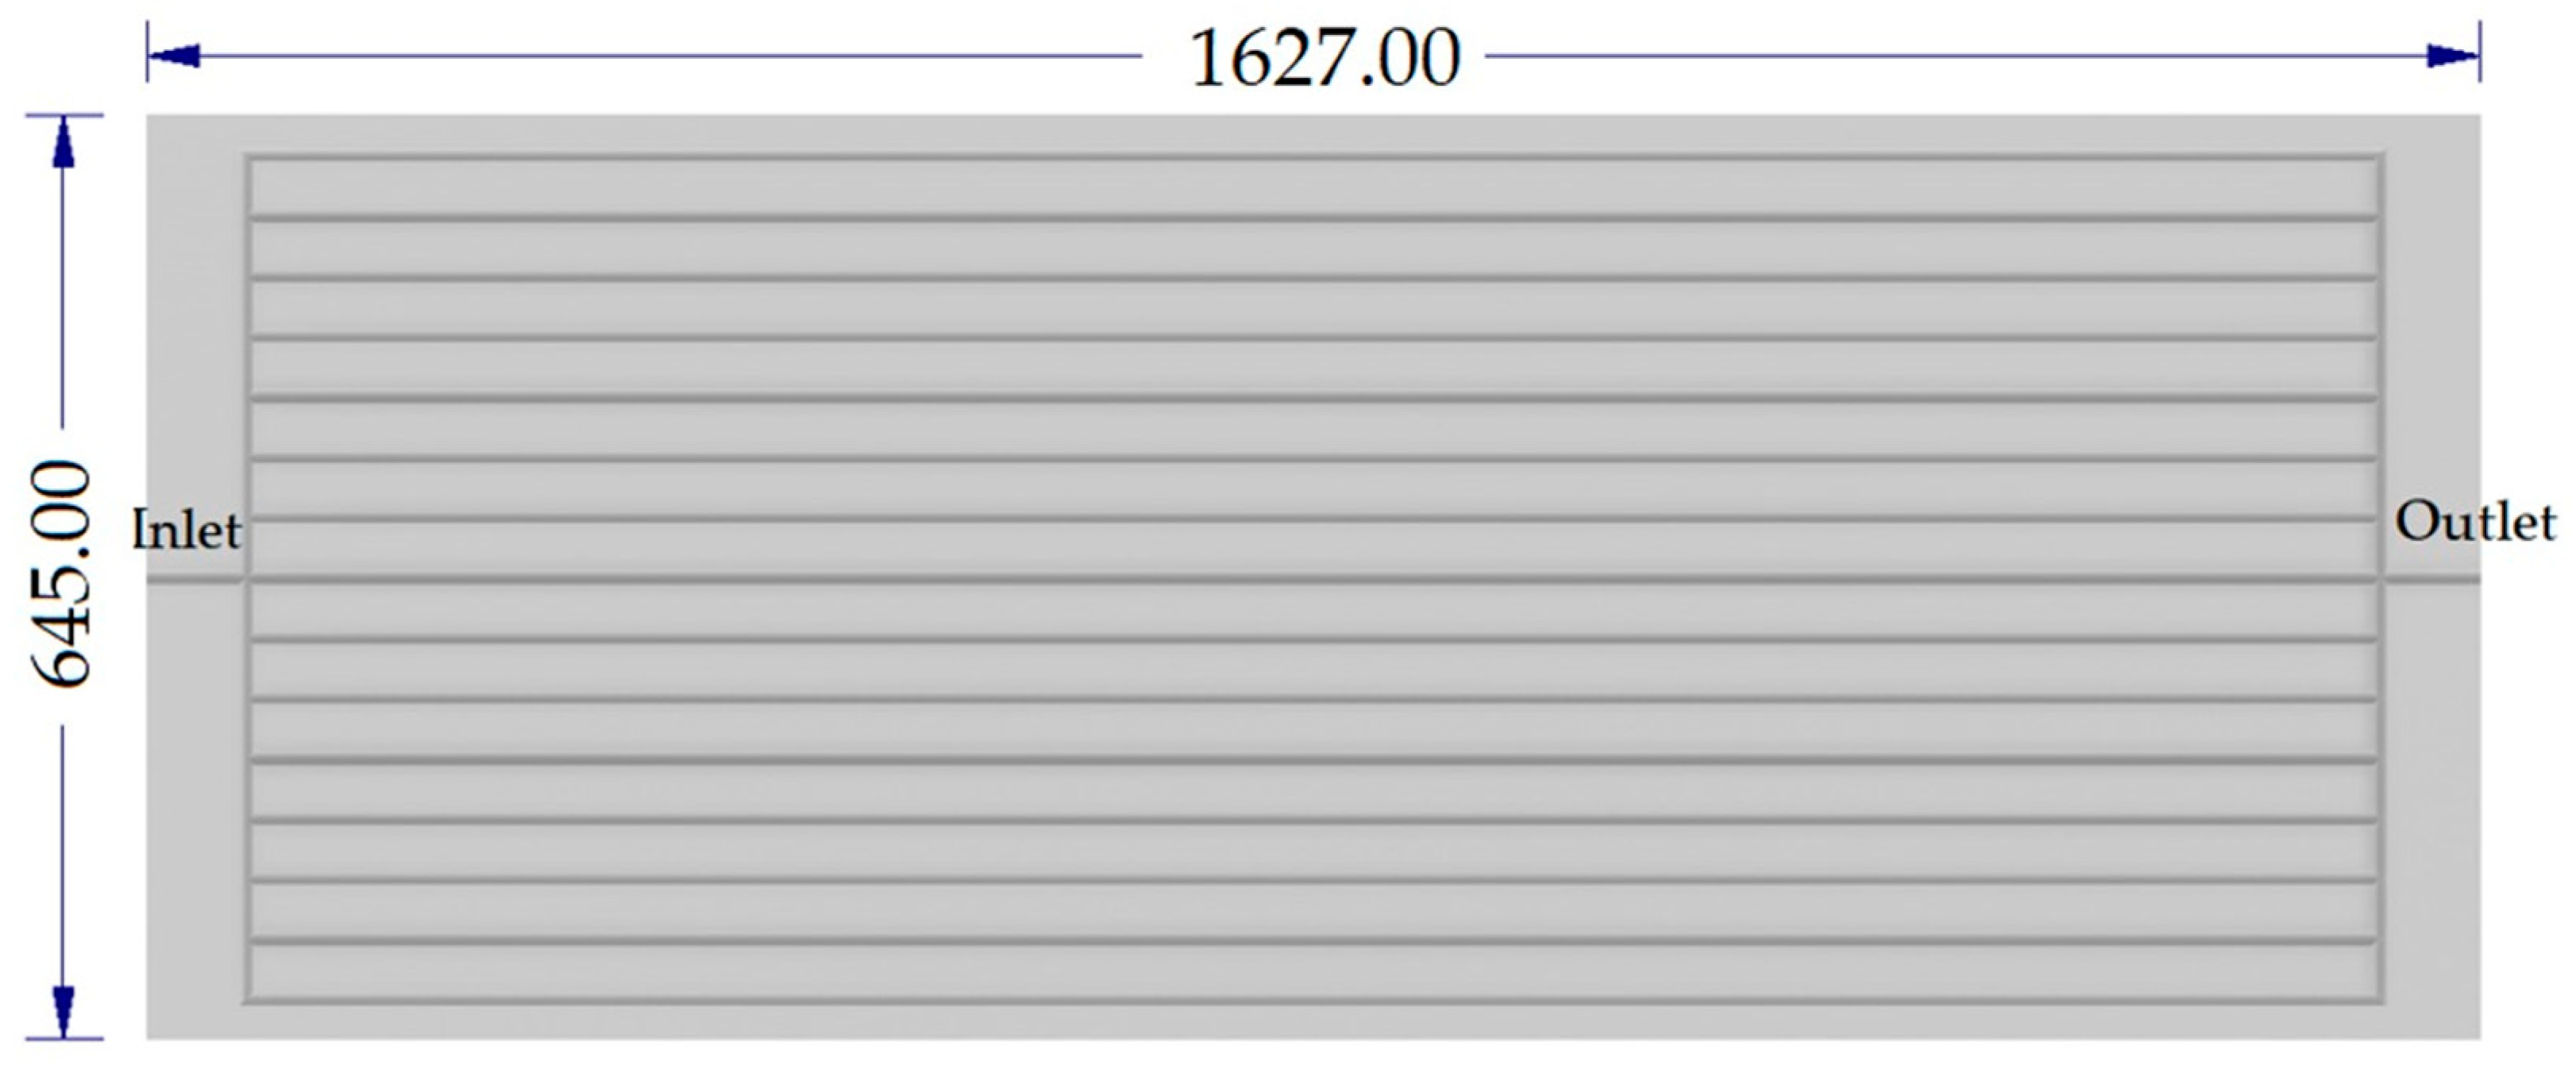
2.1. Case Study

This section presents the assessed proposed geometry and the numerical configuration utilized to simulate its operation. The computational model encompasses embedded piping arranged in a Rhombic Tessellation Pattern, RTP, incorporating allometric and fractal scales constrained to the 3 × 3-branched fractal tree geometry. The proposed model incorporates a fractal tree pattern with allometric relationships at the inlet and outlet of the numerical domain, allowing it to adapt to the dimensions of a real collector’s embedded pipe. Figure 1 illustrates the proposed piping network, while Figure 2 presents detailed dimensions of the rhombic tessellation.
The inner diameter of the pipe is 7.3 mm, which is equivalent to a 3/8-inch (nominal) copper pipe. This particular pipe size was selected based on its widespread usage in real collectors. It aligns with the existing literature where copper is commonly utilized for collectors’ construction due to its availability, ease of handling, and excellent thermal properties.

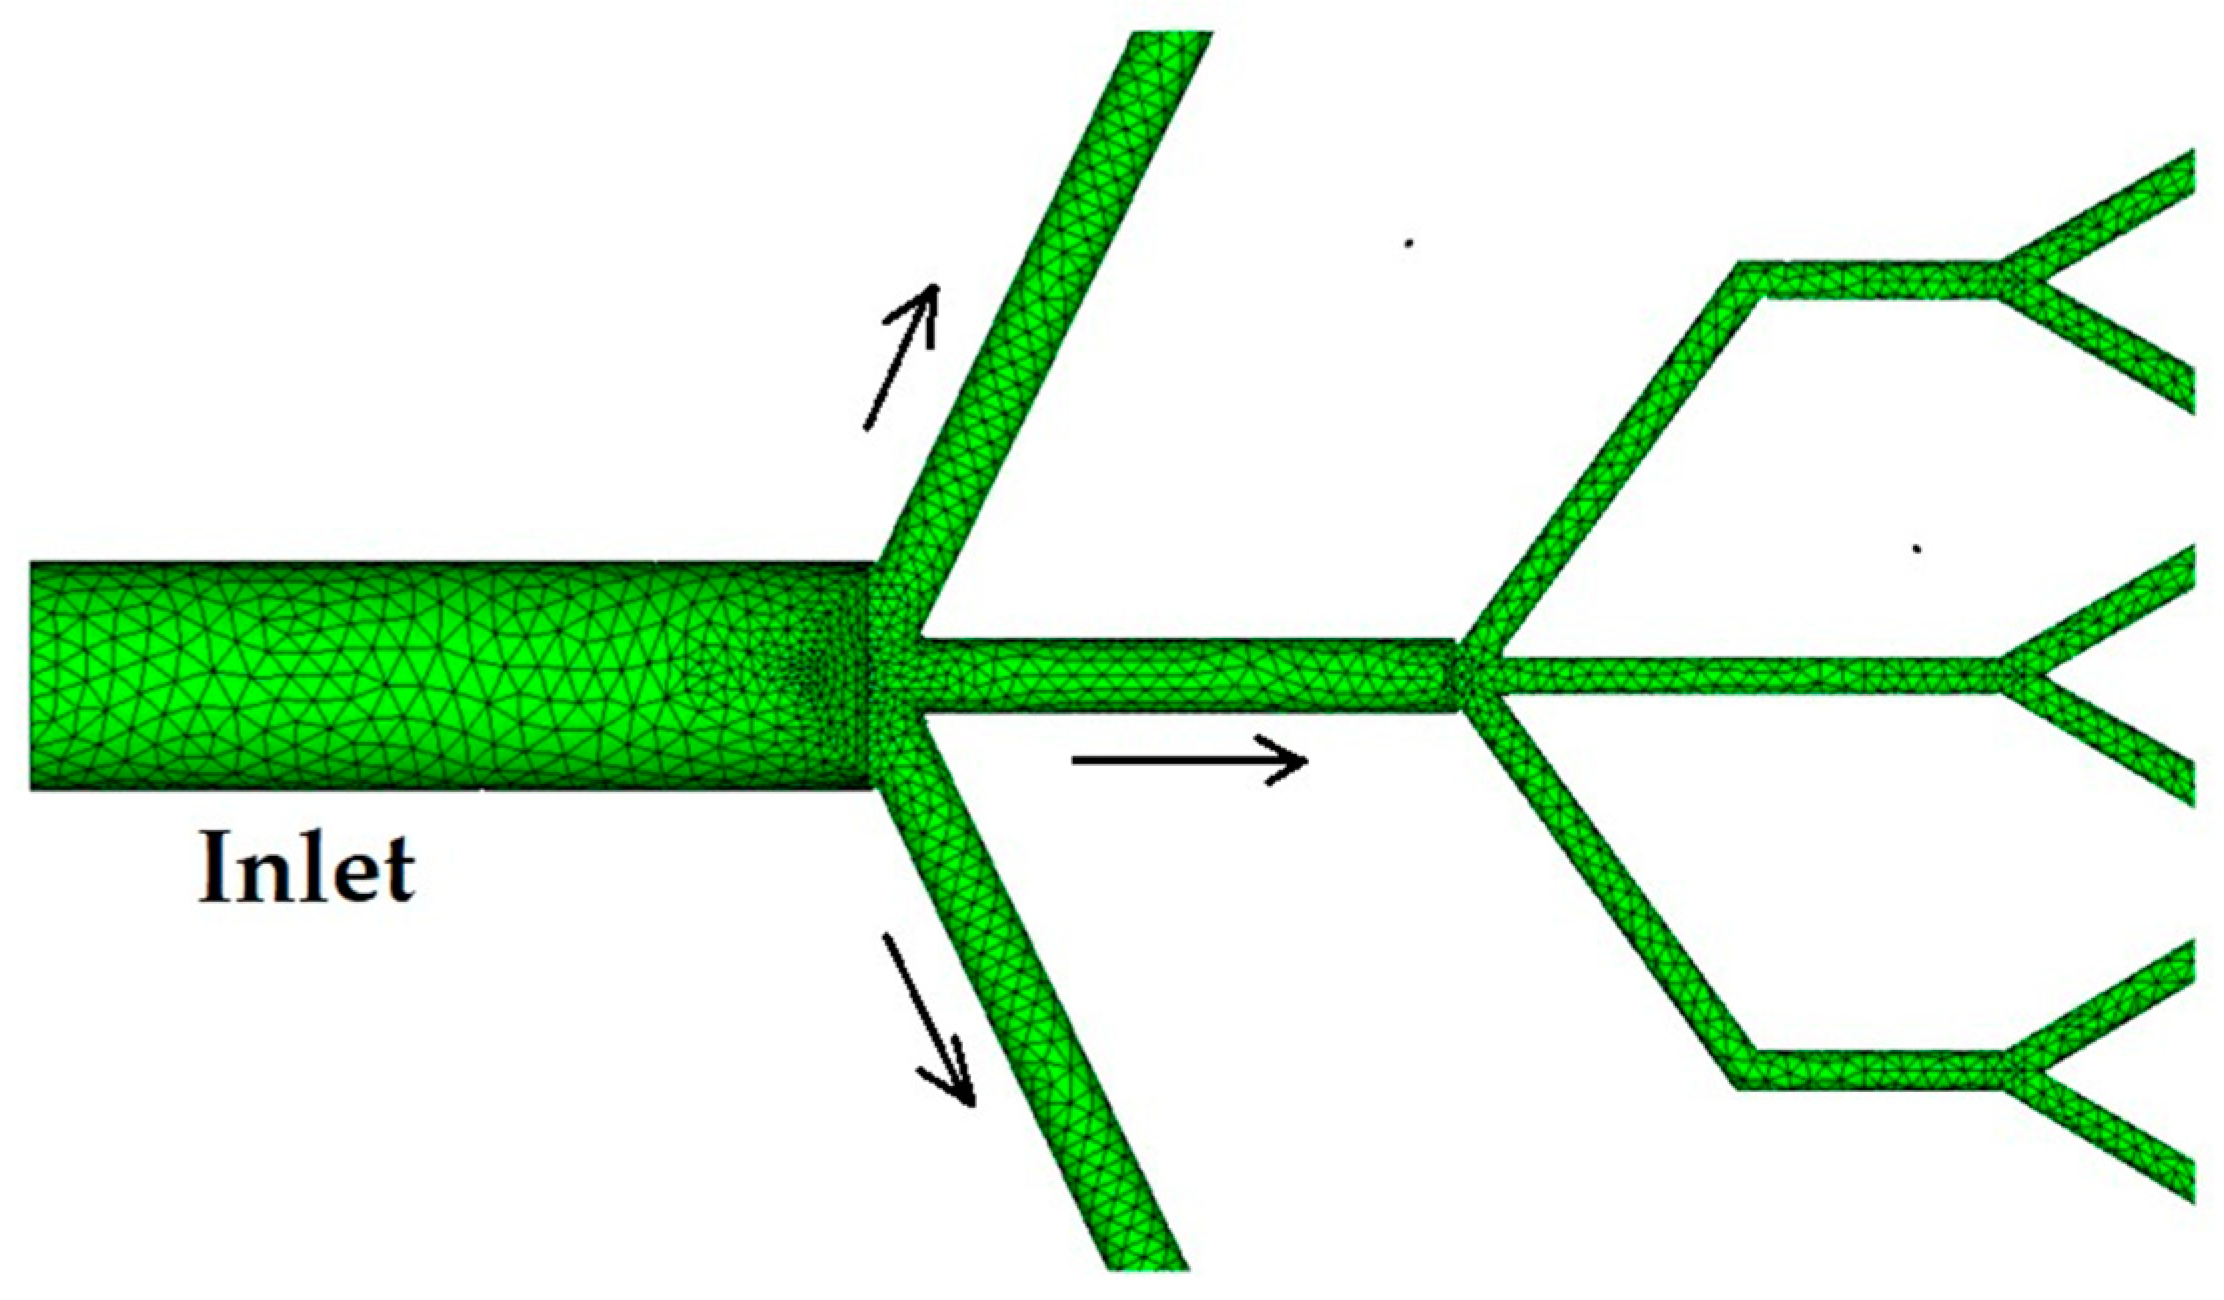
2.2. Pipe Networking Inlet/Outlet Construction Conditions

The core principle of utilizing the fractal tree with trifurcation and allometric scales was implemented to minimize the energy consumption associated with fluid flow within the integrated pipe. The proposed fractal tree with trifurcation closely resembles those discussed in previous literature [40,43,46]. The generation of the self-similar fractal tree-like microchannel network follows these steps: (1) initially, a single microchannel is assigned at the 0-th branching level, characterized by a fixed diameter ( d 0 ) and length ( l 0 ); (2) starting from the 0-th branching level, each subsequent microchannel branches into N microchannels, maintaining an identical diameter and length at each subsequent branching level; (3) the diameter and length of each newly generated microchannel adhere to the scaling law expressed in Equations (1) and (2) [40]:
β z = d z + 1 d z ,
γ z = l z + 1 l z ,
where β is the scale of the diameter, γ is the length scale, and z is the branch.
The relationships for rigid pipe are utilized, and the scale factors for length and diameter in the fractal tree are defined by Equations (3) and (4), respectively [41,43,46].
γ z = n 1 / 3 ,
β z = n 1 / 2 ,
where n is the number of branches in the last branch, n = 9, as shown in Figure 3. The proposed fractal tree scheme is shown in Figure 3, and the diameter and length dimensions for the fractal tree input are shown in Table 1.

2.3. Pipe Networking Operation Conditions

To evaluate the hydraulic behaviour of the proposed pipe network, a 3D model was developed. This model was based on a traditional solar collector with the same dimensions but with Parallel Pipes Pattern, PPP, and a constant diameter of 7.3 mm throughout. The 3D model of the conventional collector is depicted in Figure 4. The operation of both geometries was simulated to obtain their performance results under identical conditions. Table 2 presents the specific characteristics of each numerical domain.
For simulations, liquid water was utilized at 20 °C, and its properties are shown in Table 3.
A water mass flow ranging from 0.01 kg/s to 0.06 kg/s was applied at the inlet boundary to characterize the increase in pressure drop under different inlet mass flow rates with a constant increment of 0.01 kg/s, in order to obtain six different flows for evaluation [17,34,36]. The outlet condition for both domains was set at a pressure of 101.325 kPa. Simulations were conducted to observe the behaviour of both geometries under different water mass flow rates at a steady state.

2.4. Software and Computational Resource

The simulations were conducted using Autodesk® CFD, a commercial software with an academic license, which has shown good agreement with experimental data in previous CFD assessments [47,48]. Autodesk CFD utilizes the finite element method to convert the governing partial differential equations (PDEs) into a system of algebraic equations. This method employs polynomial shape functions that define the dependent variables over small areas or volumes called elements. These representations were then substituted into the governing PDEs and integrated over the elements using weighted functions that match the shape functions [49]. The outcome is a set of algebraic equations for the dependent variable at discrete points or nodes on each element.
The simulations were computed with a workstation that met the requirements for the software execution. The characteristics of the computational resources are a Workstation with an Intel i7-11800H, a 2.3 GHz 8 cores Processor, 24 GB of RAM memory, and Nvidia GeForce GTX 1650 for parallel computing.

2.5. Numerical Domain Details

Considering the dimensions of each piping network and the geometry of the embedded pipe of the real collector 3D model, a specific discretization strategy was employed for each numerical domain. Tetrahedral elements were chosen due to their suitability for capturing complex geometries effectively. Furthermore, refinement was implemented in regions adjacent to the walls of the numerical domain and in areas where the flow underwent division or experienced changes in direction. Figure 5 provides an example of the discretization using a mesh for the rhombic tessellation pipe networking. To enhance the treatment of the walls, the initial mesh length along the walls was set to 0.3 mm. Additionally, a no-slip boundary condition was applied to establish that the fluid velocity is zero at the walls of the numerical domain boundary.

2.6. Numerical Models

In the Autodesk CFD software, the SIMPLE-R scheme was used for pressure-spatial discretization, which is a variant of the SIMPLE scheme (Semi-Implicit Method for Pressure Linked Equations). SIMPLE-R algorithm extracts a pressure field from a given velocity field, and convergence to the final solution can be much faster. The SIMPLE-R algorithm is described by Patankar [50], and it was used in other works [31,51,52,53] because it has shown that the convergence of velocity can be performed in a more synchronized and with good stability.
The resolution of the momentum transport equation in a 3D spatial discretization domain requires the definition of a numerical model, particularly for handling the advective terms. In this study, a streamline upwind approximation was employed to accurately represent the advection terms within the momentum equations. This approximation was preferred due to its ability to significantly reduce the numerical diffusion error compared to the conventional upwind method [54]. To ensure numerical stability, a modified Petrov-Galerkin advection scheme was implemented in the Autodesk CFD software, resulting in improved accuracy for incompressible flow in pipes.

2.7. Governing Equations

For the 3D numerical domain in steady state, without heat transfer and incompressible fluid, the governing equations are continuity and momentum given by the following expressions, respectively:
Continuity,
u x + v y + w z = 0 ,
Momentum in x, y and z directions,
ρ u u x + ρ v u y + ρ w u z = p x + μ 2 u x 2 + 2 u y 2 + 2 u z 2 ,
ρ u v x + ρ v v y + ρ w v z = p y + μ 2 v x 2 + 2 v y 2 + 2 v z 2 ,
ρ u w x + ρ v w y + ρ w w z = p z + μ 2 w x 2 + 2 w y 2 + 2 w z 2 ,
where ρ is the water density (kg/m3), μ is the water viscosity (kg/(m·s)), and p the static pressure of the water (Pa).
For the analytical calculation of the pressure drop (Pa) in each pipe network the following relation [55,56]:
p = f 8 L m ˙ 2 ρ π 2 d 5   ,
where L is the length of the pipe (m), m ˙ is the mass flow of water (kg/s), d is the hydraulic diameter of the pipe (m) and f is the friction factor (dimensionless). This factor for laminar flow is calculated with the expression [56,57,58]:
f = 64 R e ,
and for turbulent flow, it is determined by the Colebrook expression [57,58]:
1 f = 2.0 log e / d 3.7 + 2.51 R e f ,
where e is the roughness of the pipe (m).

2.8. Turbulence Model

Since the collector with parallel pipes operates under a turbulent regime with mass flows exceeding 0.01 kg/s, the two-equation standard turbulence model (Equations (13) and (15)) was employed. This model is based on the Reynolds-Averaged Navier-Stokes (RANS) technique. The selected model offers numerical stability and computational efficiency, making it widely applied in industrial settings [17,59,60,61,62].
One of the distinguishing characteristics of two-equation turbulent models lies in their formulation and solution of two separate transport equations. The standard k ε turbulent model encompasses the turbulent kinetic energy, k , and the turbulent energy dissipation, ε , as the unknown variables, along with the time-averaged fluid velocities. In this model, the turbulent viscosity is calculated using the following equation:
μ t = C μ ρ k 2 ε .
The turbulent kinetic energy equation is described by the following expressions [59,60,61]:
ρ k t + ρ u x ¯ k x + ρ u y ¯ k y + ρ u z ¯ k z = x μ + μ t σ k k x + y μ + μ t σ k k y + z μ + μ t σ k k z + G k ρ ε   ,
G k = 2 μ t u x ¯ x 2 + u y ¯ y 2 + u z ¯ z 2 + μ t u x ¯ y + u y ¯ x 2 + μ t u x ¯ z + u z ¯ x 2 + μ t u z ¯ y + u y ¯ z 2 .
The turbulent energy dissipation equation is [59,60,61]:
ρ ε t + ρ u x ¯ ε x + ρ u y ¯ ε y + ρ u z ¯ ε z = x μ + μ t σ ε ε x + y μ + μ t σ ε ε y + z μ + μ t σ ε ε z + C ε 1 ε k G k C ε 2 ρ ε 2 k ,
where μ t is turbulent viscosity (m2/s), k is turbulent kinetic energy (J/kg), ε is turbulent kinetic dissipation rate (W/kg), u ¯ is average velocity (m/s), and the constants values are [63] C μ = 0.09 , σ k = 1.0 , σ ε = 1.3 , C ε 1 = 1.44 , and C ε 2 = 1.92 .

3. Sensitivity Analysis

Five meshes were generated to ensure the independence of the numerical results from the mesh employed, using a water mass flow rate of 0.01 kg/s for each 3D model. Table 4 provides details of the meshes created for each geometry, while Figure 6 illustrates the corresponding pressure drop values obtained with each mesh.
The mesh sensitivity analysis for the RTP reveals that mesh 3 causes a relative error of 0.8% in the pressure drop calculation compared to the analytical result, which is considered acceptable and congruent with the findings in the literature [17,31,32] for this type of simulation. However, as the number of nodes and elements increases in meshes 4 and 5, the convergence of the pressure drop deviates by 2.3%, and the error in the pressure drop calculation rises to 3%. Additionally, mesh 5 has 1,623,123 more elements than mesh 3, resulting in increased computational resources and time for the solution. Therefore, mesh 3 was chosen as the most affordable mesh for simulating the pipe network with rhombic tessellation. It offers the lowest relative error in the pressure drop calculation compared to the analytical value and requires fewer computing resources.
Regarding the meshes utilized for the PPP, the pressure drop calculated with mesh 5 closely matched the analytical value, with an error of 1.48%. The pressure drop results of meshes 4 and 5 exhibit only a 0.46% difference. However, mesh 5 comprises an additional 560,522 elements compared to mesh 4, leading to increased computational resources and processing time. With mesh 4, the error in the pressure drop calculation was 1.8% in comparison to the analytical result, representing only a 0.32% increase compared to mesh 5. Consequently, mesh 4 was selected for the PPP due to its minimal error percentage and shorter processing time compared to the finer mesh.
With the study of mesh independence, the number of nodes and elements in each pipe networking was defined. The PPP yielded 990,800 nodes and 2,828,856 elements, while the RTP resulted in 661,595 nodes and 2,478,962 elements.

4. Results

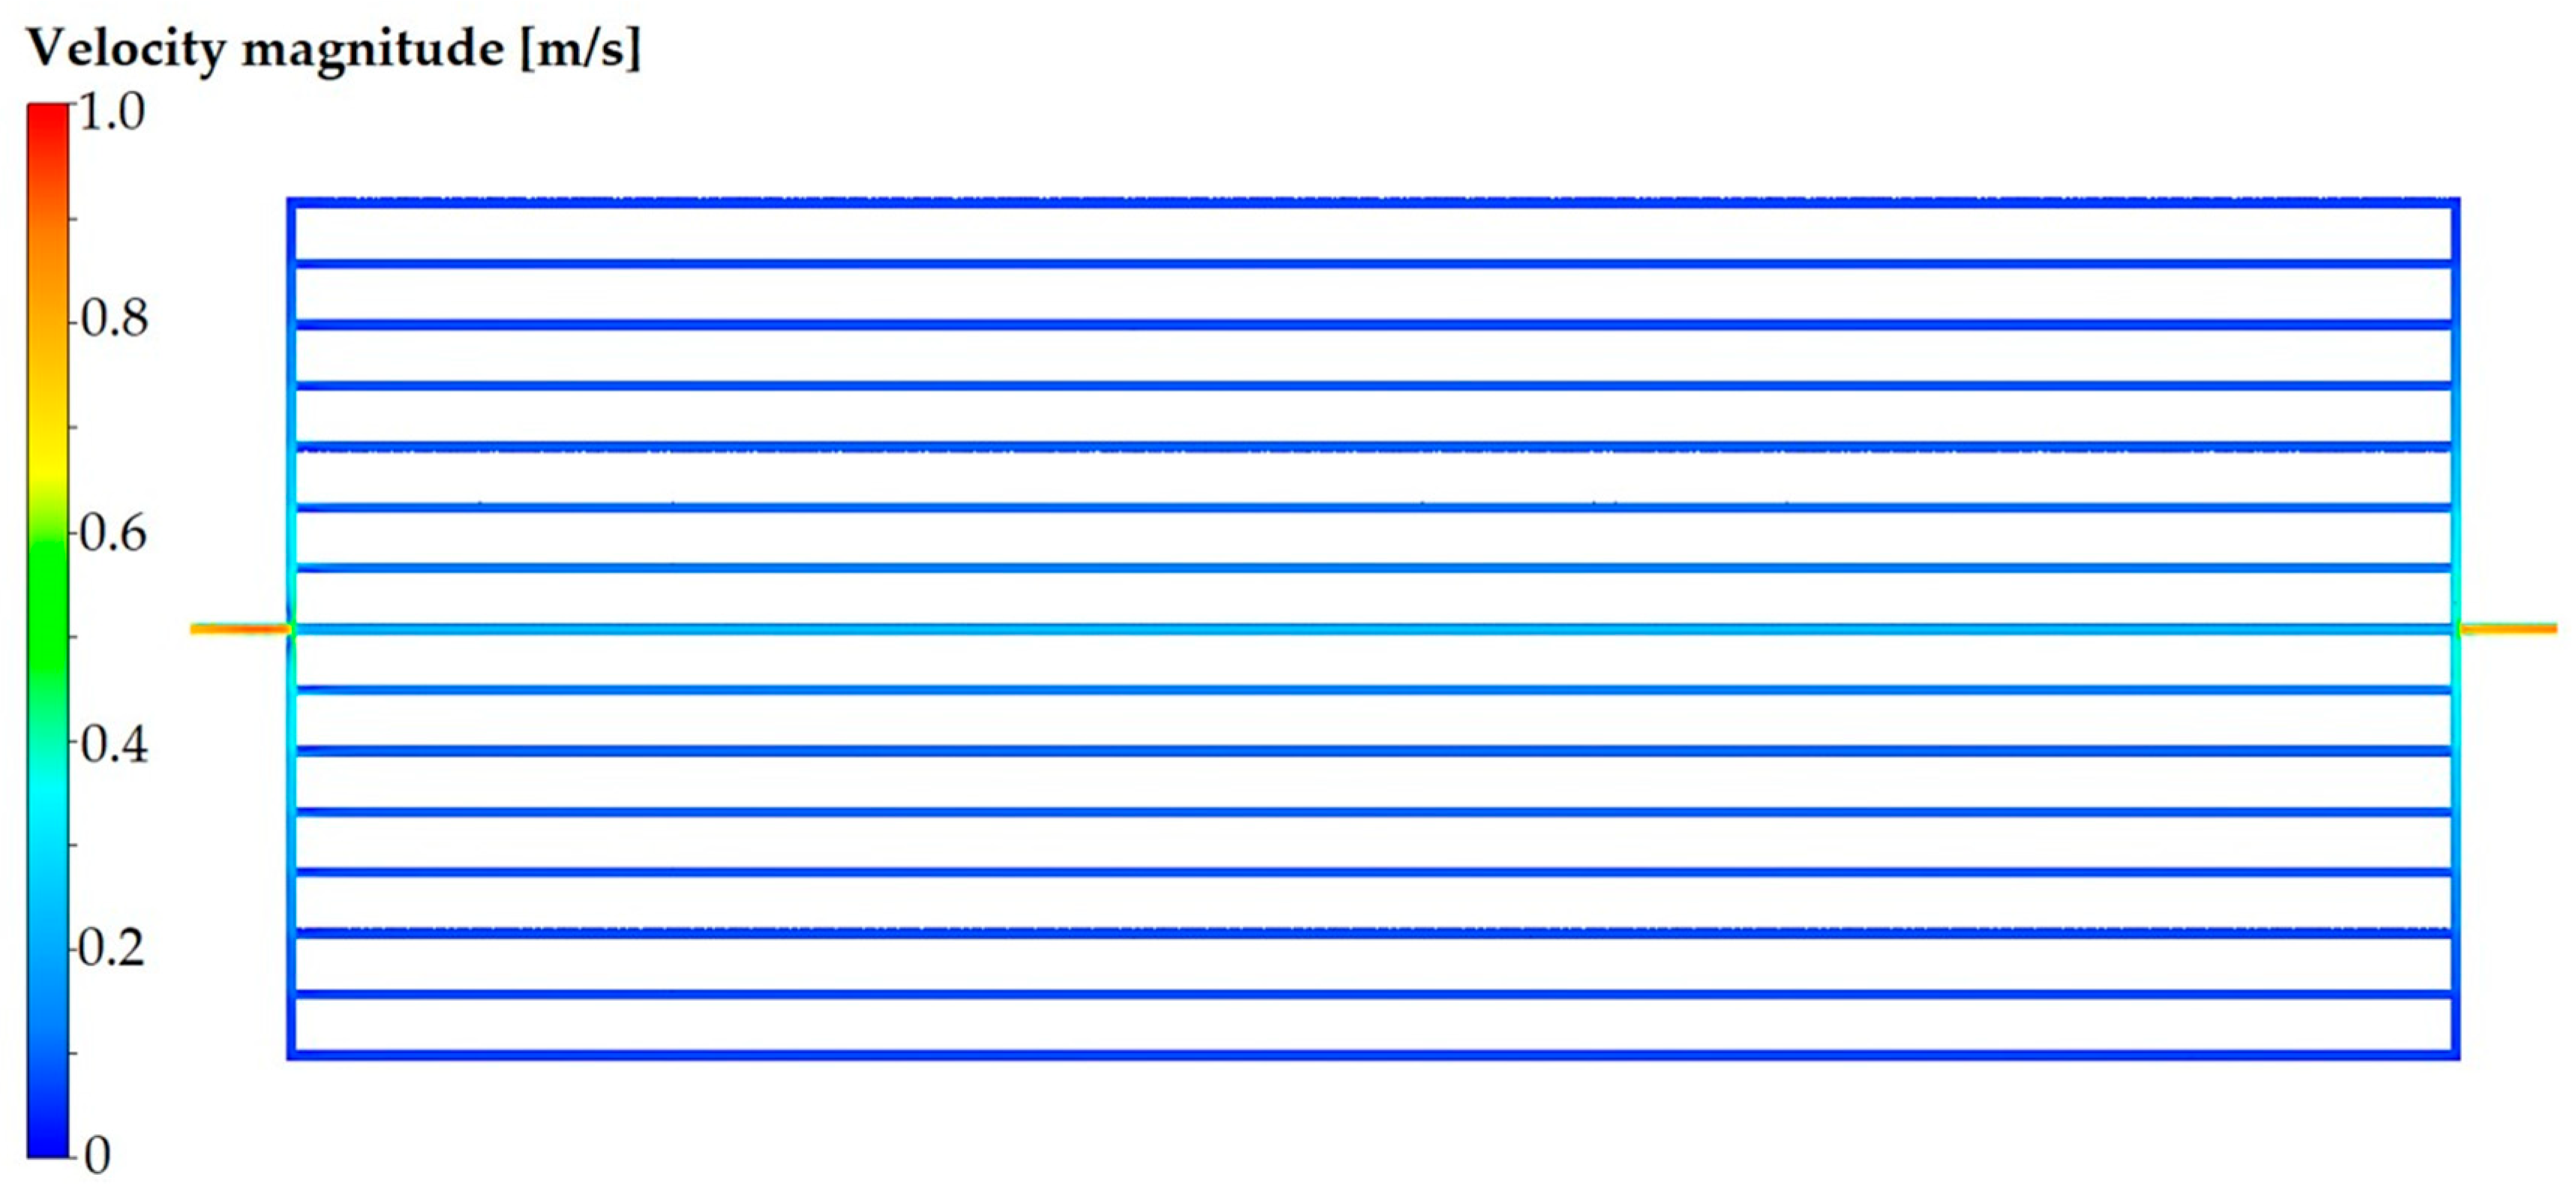
4.1. Velocity Results

Figure 7 and Figure 8 depict the water velocity distribution in each piping model when a water flow rate of 0.03 kg/s is supplied. Upon comparing the figures, noticeable disparities in the velocity magnitude are observed. It is crucial to note that the simulation was conducted under steady-state conditions, assuming that the pipe network was fully filled with water.
Figure 7 illustrates the distribution of water mass flow within the parallel pipes. The highest mass flow occurs in the central pipe, while the pipes farther away from the centre line experience a decrease in mass flow. This non-uniform distribution of mass flow through the network pipes results in varying velocity magnitudes, as indicated by the scale in Figure 7. In the PPP, the water attains a velocity magnitude of up to 1.0 m/s, primarily in the inlet and outlet lines of the numerical domain. This behaviour can be attributed to the pipe diameter size of 7.3 mm. As the water flows into the parallel pipe channels, where the flow is divided, its velocity gradually decreases, reaching its highest value close to 0.4 m/s.
Figure 8 displays the velocity distribution in the RTP. The highest velocity is observed in the second branch of the fractal tree at the inlet and outlet, reaching a value of approximately 0.17 m/s. This magnitude represents 17% of the velocity magnitude obtained in the PPP. Within the embedded pipe of the RTP, characterized by its rhombic tessellation, the water maintains a uniform velocity of around 0.06 m/s throughout the entire rhombus section, as shown in Figure 8. The scale provided in the figure indicates the uniformity of velocity in the RTP for the considered angles in the tree fractal branches. This uniformity is achieved as the flow is divided into branches until it enters the rhombic tessellation. The uniform velocity distribution and lower velocity values in the RTP contribute to a reduced pressure drop. It is worth noting that the velocity distribution in the RTP differs from that of the PPP, where the maximum velocity is not located at the inlet or outlet of the numerical domain. The implementation of the fractal tree pattern at the piping entrance and exit, combined with the use of allometric relationships, has proven to be advantageous.
An exceedingly significant finding that emerged from the comparison of the two geometries is the consistent observation of laminar flow regime in RTP, irrespective of the defined mass flows as boundary conditions. This discovery carries immense importance as it highlights the unique hydraulic behaviour of the piping system. Specifically, at the input section of the tree fractal, where the highest mass flow rate of 0.06 kg/s was applied, the Reynolds number was calculated to be 1923.4. This confirmation of laminar flow at relatively higher mass flows further emphasizes the effectiveness and efficiency of the proposed design. This behaviour of the RTP is mainly attributed to the fractal tree pattern and the allometric relationships employed in constructing the inlet/outlet section. The different lengths and diameters of the fractal tree branches were adapted to the embedded pipe of the rhombic tessellation. Table 5 shows the Reynolds number values at the inlet line of both geometries. In particular, the Reynolds number in the inlet line of the PPP was 5.4 times higher than in the RTP. This difference may explain why the pressure drop in the PPP is considerably higher than in the RTP.

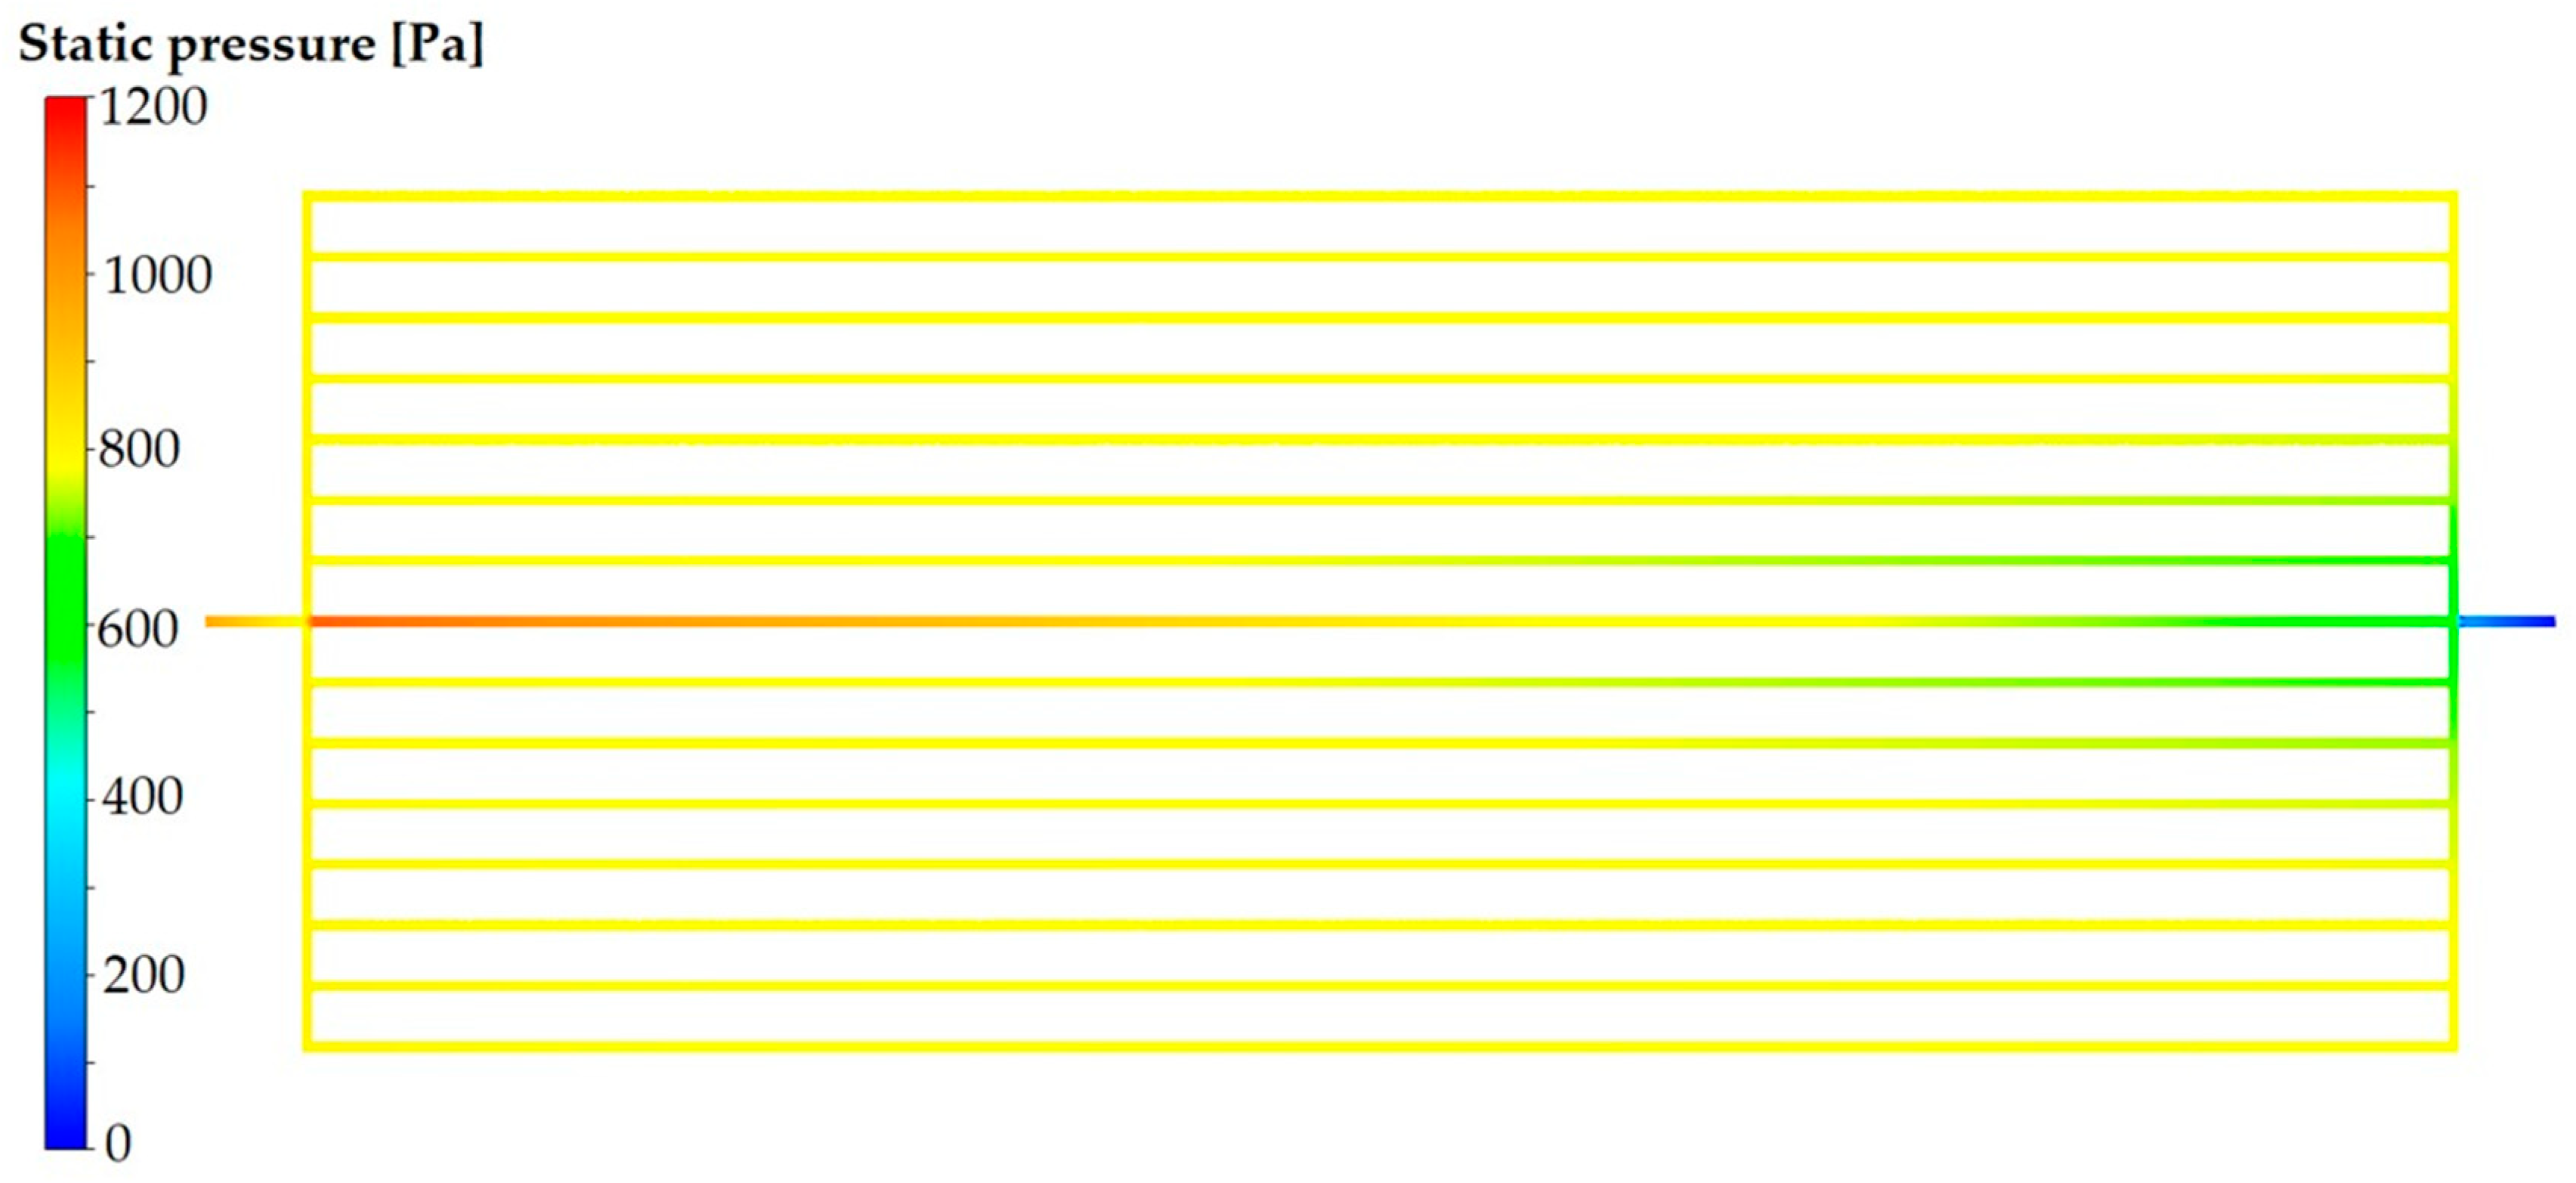
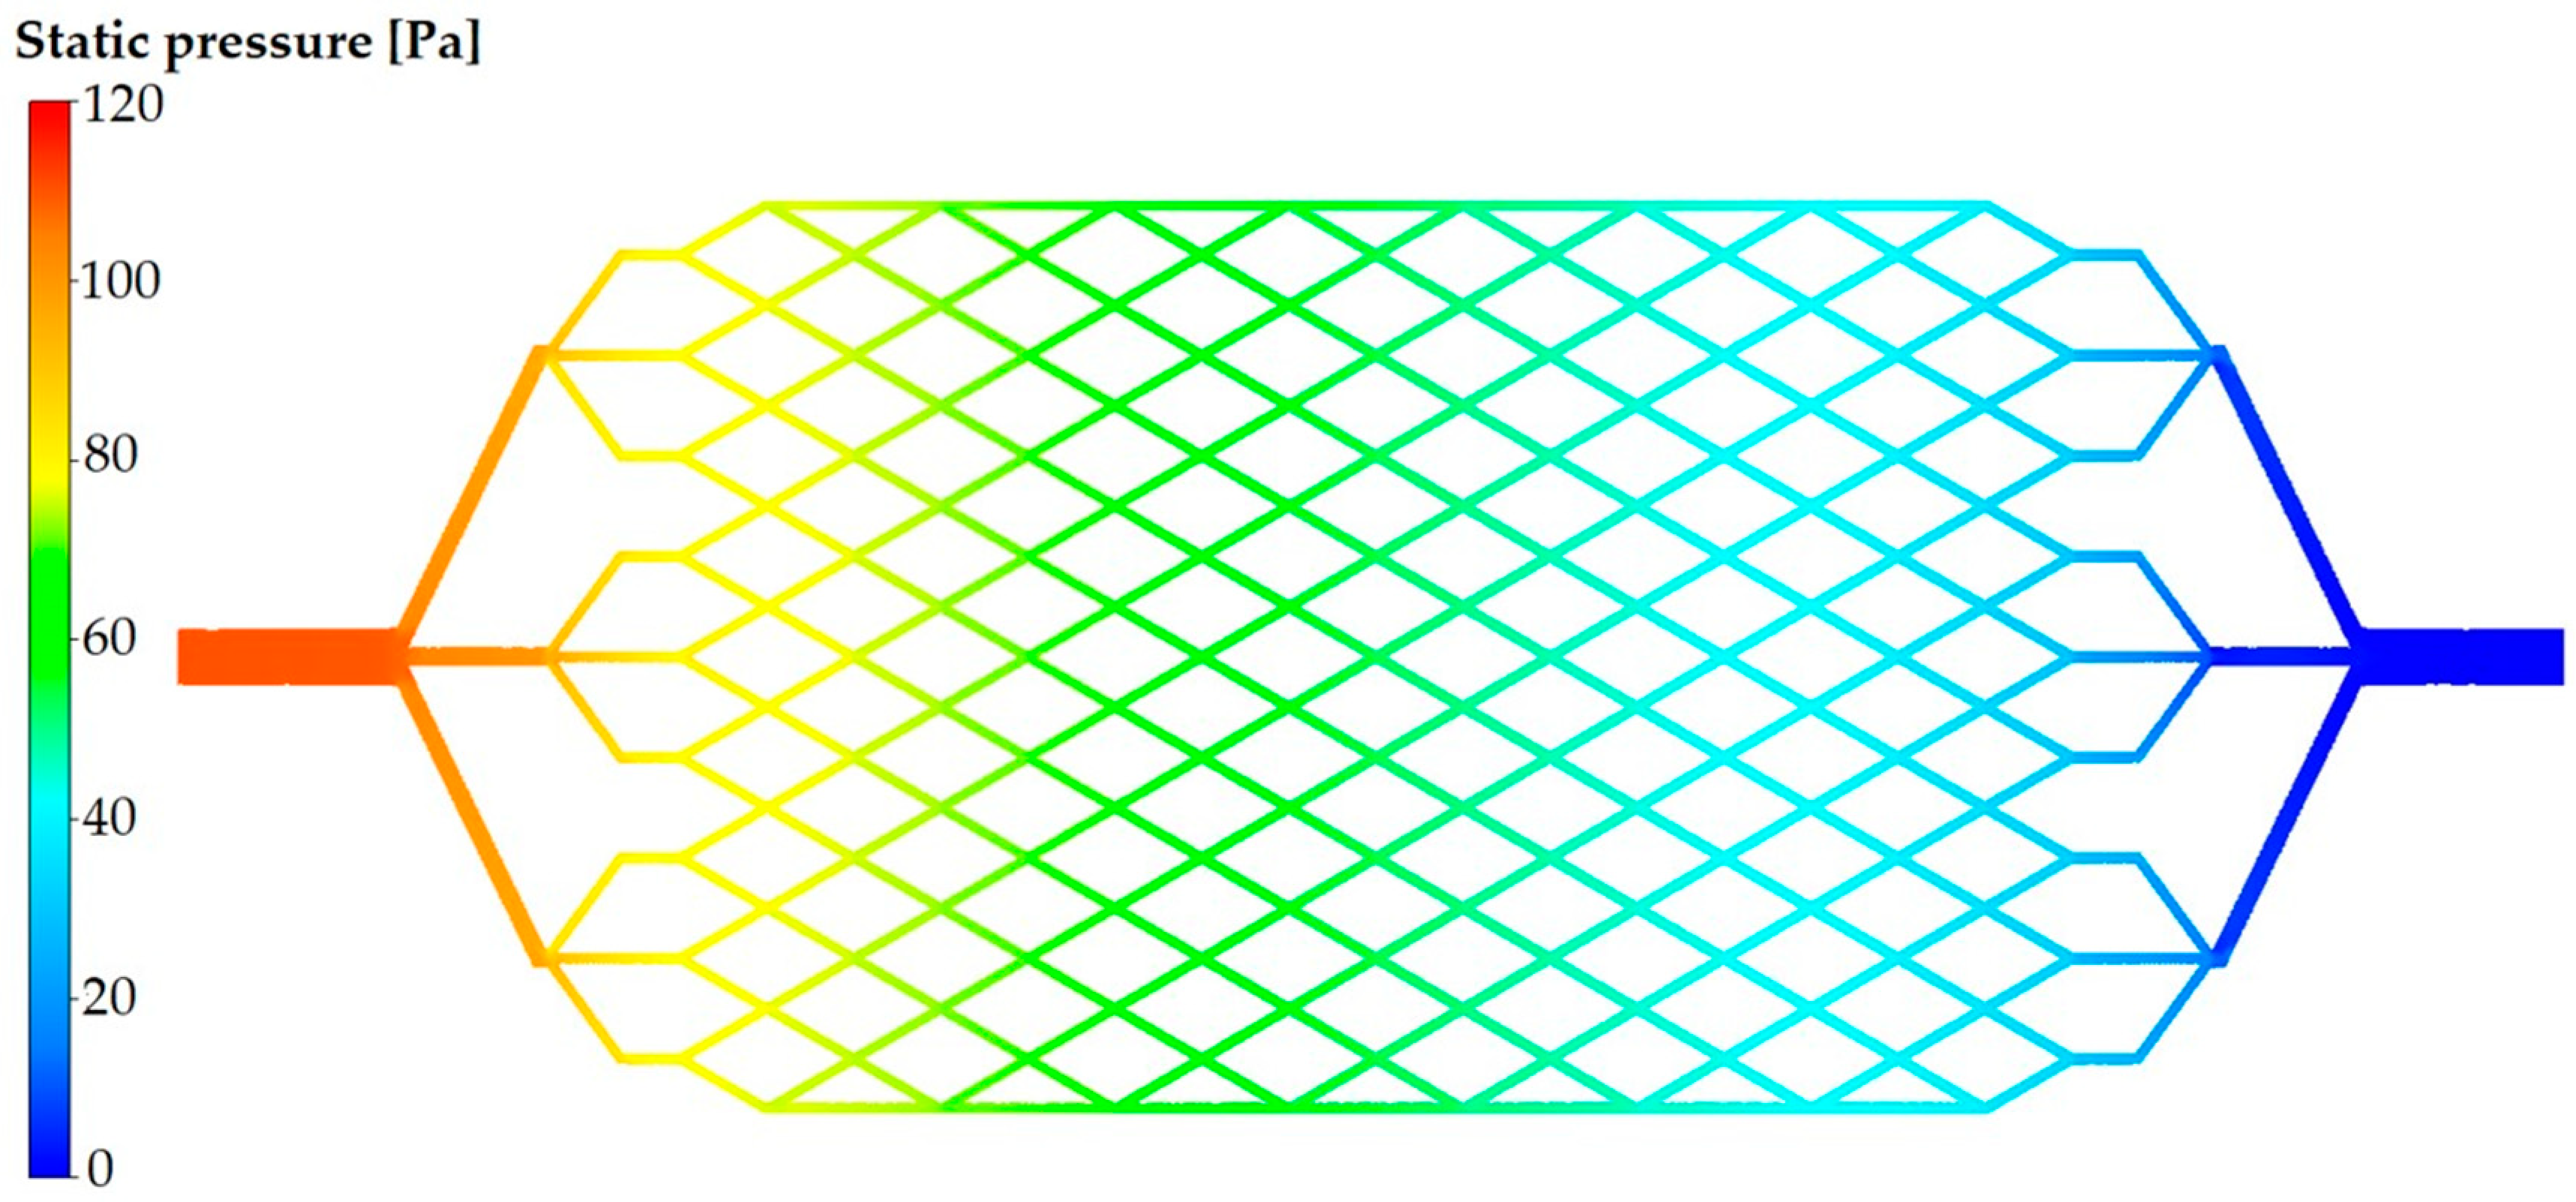
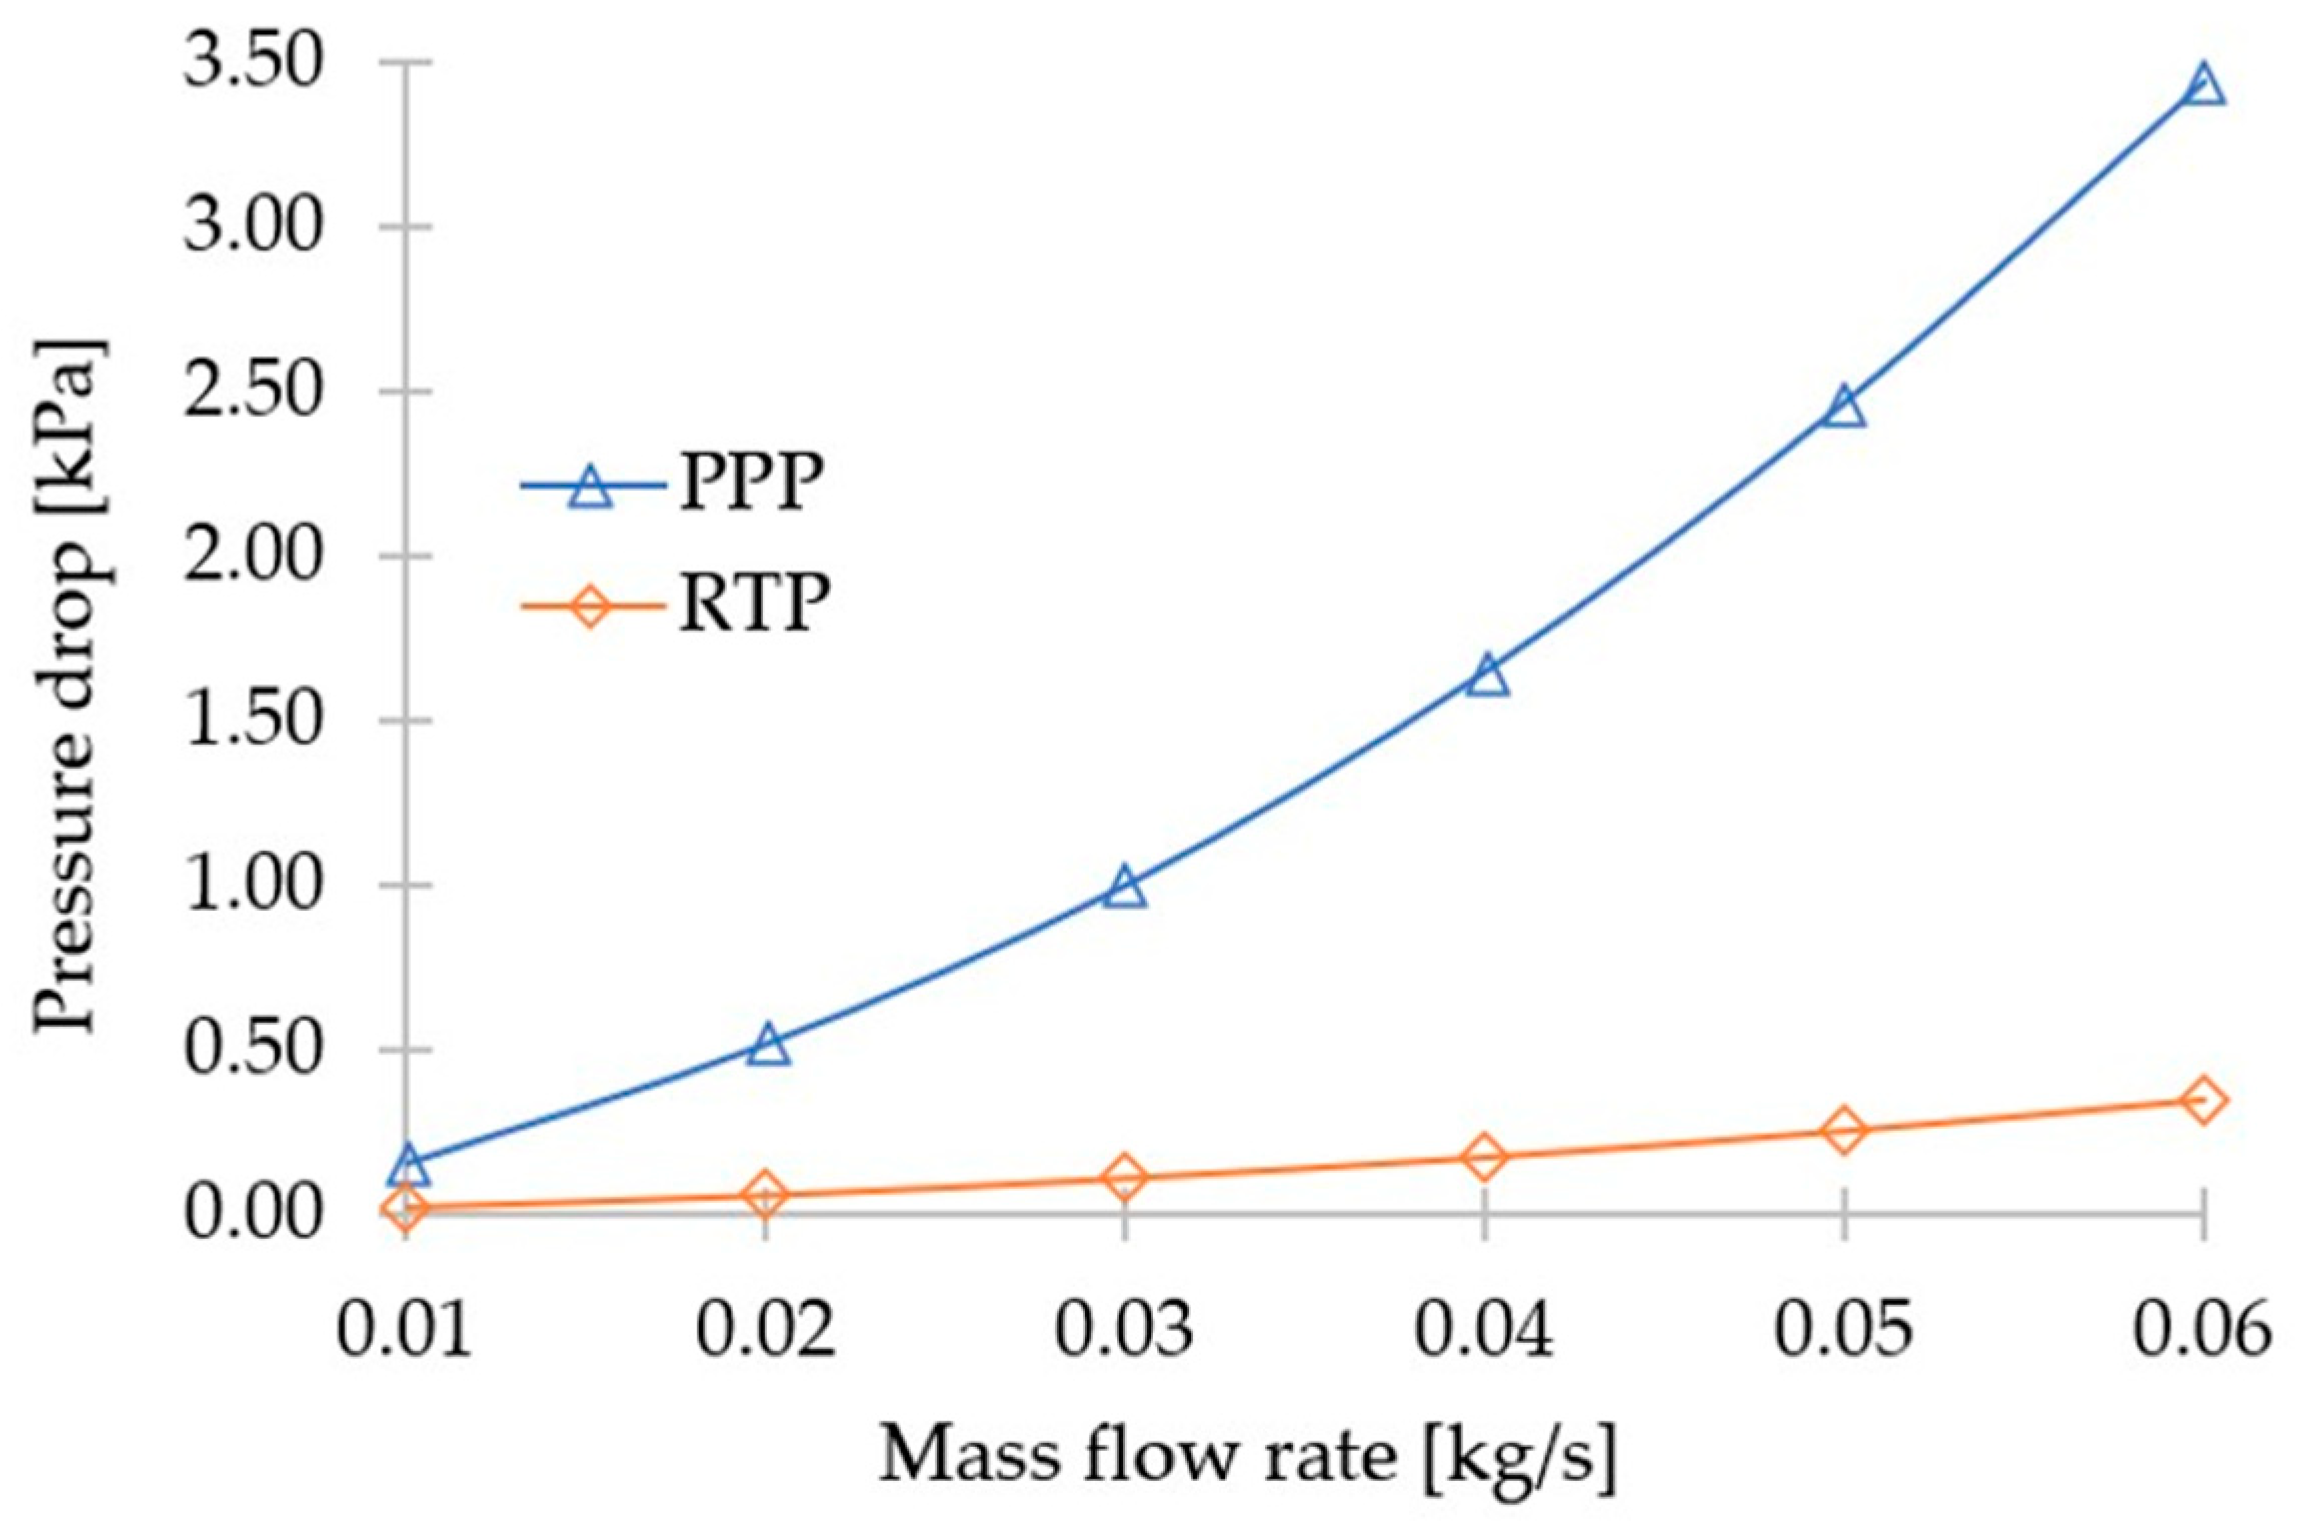
4.2. Pressure Drop Results

The investigation of pressure distribution results within each manifold of various mass flow rates constitutes a significant contribution of this study. Figure 9 and Figure 10 showcase the water pressure distribution in each piping network under a mass flow rate of 0.03 kg/s. Notably, Figure 9 demonstrates a pressure drop of 1.175 kPa in the PPP, whereas Figure 10 reveals a significantly lower pressure drop of 0.1104 kPa in the RTP for the same mass flow rate. It is worth emphasizing that, in comparison to the PPP, the RTP exhibits a substantially reduced pressure drop along its surface, as clearly depicted in Figure 9 and Figure 10, respectively. This discrepancy underscores the advantage of the RTP design in mitigating high-pressure drops, which can significantly impact the overall efficiency and operational cost of solar-assisted heat pump systems.
The pressure drop observed in the RTP amounts to a mere 8% of the pressure drop measured in the PPP. This remarkable reduction in pressure drop can be attributed to the implementation of allometric scales within the fractal tree design. The primary objective of incorporating these concepts is to minimize the energy consumption associated with fluid flow through the conduits. By adapting the dimensions of the fractal tree using allometric relationships, a more efficient and energy-saving system could be achieved, thereby enhancing the overall performance of the collector.
Figure 11 illustrates a compelling comparison of pressure drop between the RTP and PPP. It is highlighted that the piping with rhombic tessellation exhibits a remarkably smaller pressure drop when compared to the PPP design commonly encountered in the market. The figure serves to emphasize the significant advantage offered by the proposed piping networking model. The RTP demonstrates an average reduction in pressure drop of 92% in comparison to the PPP.

5. Discussion

The primary objective of this study was to analyse the internal flow characteristics of two different geometries: one with a PPP and the other with an RTP. Both PPP and RTP manifolds were constructed to have equivalent dimensions, including manifold plate area, percentage of area occupied by embedded tubes, and manifold capacity.
This study specifically examined the hydrodynamics of the observed behaviour in both geometries, without considering energy-related aspects such as heat transfer or phase change. The exclusion of the energy equation solution was due to its high computational demand and for not being a specific objective for this particular study. Additionally, convective phenomena were not taken into account in the analysis of each simulation, as there were no temperature gradients present. Therefore, the advective phenomenon played a crucial role in the transportation of fluid properties, such as mass and momentum, as the fluid flowed through the pipes.
The velocity distribution within the pipe network provides insights into the fluid behaviour and the impact of geometry on flow dynamics. In the PPP configuration, the fluid velocity was found to be highest near the inlet and outlet sections, reaching a maximum of 1.0 m/s. This high velocity is primarily influenced by the geometric arrangement of the parallel distribution tubes, which promotes uneven flow distribution. As the fluid entered the piping system, it gradually traversed through the parallel tubes, resulting in a decrease in flow rate as it reached the tubes located farther away on the sides from the inlet.
When the fluid reaches the outlet end, it encountered an abrupt change in direction due to the perpendicular placement of the tube leading to the outlet, resulting in what can be considered a “blocking” effect creating a zone of partial stagnation. Consequently, the central tube becomes the main pathway for fluid transport available, efficiently carrying it from the inlet to the outlet. As a result, the velocity of the fluid in the side tubes sharply decreases, approaching near-zero values, as the central tube adequately handles the fluid flow across the numerical domain. It is well-established that an increase in fluid velocity corresponds to a proportional pressure drop. In the case of the PPP, the observed pressure drop can be attributed to the flow restriction imposed by the geometry of the system and the higher velocities experienced by the water in the lateral tubes.
However, a notable difference is observed when analysing the RTP geometry. Particularly, the branching pattern from the inlet allows the fluid to irrigate each tube, traversing through each pathway. As a result, the velocity magnitude, as analysed through contour plots, appears more homogeneous and balanced.
It is observed in Figure 12 that, in the second trifurcation, a non-uniform distribution of flow is developed, as evidenced by distinct velocity profiles in each branch. Notably, the central tube within each branch exhibits a higher mass flow rate, possibly due to interference caused by branch 3, potentially inducing a suction effect. However, owing to the steep angle of branch 3, the fluid is unable to follow a curved trajectory. This behaviour is more clearly presented by the use of streamlines in Figure 12b. Consequently, a portion of the fluid is redirected towards branch 3, another portion towards branch 1, and the largest quantity towards the central branch 2. This symmetrical flow distribution pattern is observed in the remaining branches as well. The tessellation directly influences this behaviour for two primary reasons.
First, immediate trifurcation after the fluid enters causes a decrease in velocity, which is compensated by the reduction in diameter in that branch section. Subsequently, the fluid path trifurcates again, further compensating for the velocity magnitude through diameter reduction. In other words, the fluid velocity decreases due to diversion but increases as the diameter decreases. This phenomenon is reminiscent of the behaviour observed in Venturi tubes.
Secondly, as the fluid flows through the pipe with the rhombic pattern, there are as many stagnation zones as there are rhombic in the geometry pattern as seen in Figure 12c. This contributes to a homogenization of velocity throughout the entire pipe. Consequently, any pressure variation that may have occurred is recovered through the reunification of the branches. This behaviour is analogous to a bank of tubes exhibiting similar characteristics. As water is divided into the pipe channels, its velocity decreases due to the increased cross-sectional area.
In contrast, the RTP configuration exhibits a significantly lower pressure drop due to the more uniform velocity distribution and reduced flow opposition facilitated by the fractal geometry and rhombic tessellation. The fluid flow is more evenly distributed along the branches of the fractal tree and the embedded pipes, resulting in a reduced pressure drop compared to the PPP.
The fractal and rhombic pattern within the RTP geometry promotes smoother flow patterns, minimizing disruptions and flow restrictions. This leads to a more efficient transfer of fluid momentum and reduces energy losses due to friction. As a result, the pressure drop in the RTP configuration is significantly mitigated compared to the PPP.
The observed differences in pressure drop between the PPP and RTP highlight the influence of geometric design on flow opposition. The fractal geometry and rhombic tessellation in the RTP contribute to a more favourable flow distribution and reduced pressure drop, making it a promising configuration for applications where minimizing energy losses and flow opposition are crucial factors. Furthermore, this study revealed that for mass flows greater than 0.01 kg/s, both PPP and RTP configurations exhibited a turbulent flow regime at the inlet and outlet sections, resulting in higher water velocities and significant pressure drops.
For the PPP configuration, the pressure drop reached up to 3.43 kPa for a mass flow rate of 0.06 kg/s. In contrast, the RTP experienced a much lower pressure drop, measuring only 0.350 kPa for the same inlet mass flow rate. This remarkable decrease of 91.5% in pressure drop highlights the enhanced performance of the RTP configuration in reducing flow resistance compared to the PPP.
These findings demonstrate the improved performance of the RTP in terms of minimizing pressure drop, indicating its capacity to effectively accommodate higher mass flow rates while maintaining lower flow opposition highlighting its exceptional design and engineering potential. The allometric scaling, influenced by the proportion of the channel size through which the fluid flows, plays a crucial role in achieving this outcome. As the fluid traverses through the tessellation conduits, it experiences smoother displacement due to the direct influence of diameter. This characteristic is derived from Bernoulli’s equation, which states that a proportional and consistent reduction in velocity results in a gradual pressure drop.
The observed results from both geometries revealed a noteworthy finding. The RTP consistently maintained laminar flow regime for all defined mass flows at the inlet. Preserving laminar flow, known for its smooth and streamlined characteristics, is highly desirable as it ensures more efficient operation and mitigates disadvantages associated with turbulence.

6. Conclusions

This study utilized computational fluid dynamics (CFD) to conduct a numerical assessment of the hydrodynamic behaviour of two novel 3D pipe networking geometries featuring distinct embedded pipe configurations. The first geometry employed a parallel pipe pattern (PPP), while the second utilized a rhombic tessellation pattern (RTP). Both configurations shared equivalent dimensions, differing solely in the geometric arrangement of the embedded pipes. Steady-state simulations were conducted on both models, applying identical boundary conditions and varying water mass flows within the range of 0.01 to 0.06 kg/s at a temperature of 20 °C. The obtained results included velocity distribution profiles and pressure drop measurements within each piping configuration, encompassing the entire range of mass flows considered.
By integrating the fractal tree pattern and the allometric relationship at the inlet and outlet sections of the RTP, a uniform flow distribution was achieved. The flow regime observed in the RTP remained laminar for all six defined mass flows. This unique characteristic of the pipe network was attributed to the carefully designed sizing of the fractal tree pattern and the incorporation of allometric relationships.
The implementation of the rhombic tessellation pattern enabled a homogeneous flow distribution within the piping system, leading to a uniform velocity magnitude that was lower compared to the water velocity in the parallel channels of the PPP. This uniform velocity distribution in the RTP contributed to a considerable reduction in the average pressure drop at the same water mass flow rate.
The geometry and size of the pipe networking play a crucial role in the hydrodynamics development. Conventional configurations, such as serpentine or parallel patterns, often result in higher pressure drops. To address this limitation, alternative geometries based on construction laws, such as allometric scales, have been proposed to enhance the performance of flat solar collectors. The current study evaluated the performance of the RTP, which incorporates a different geometry, and demonstrated its potential for improving the hydrodynamic characteristics of flat solar collectors.
The reduction in pressure drop observed in this study holds significant advantages for systems utilizing solar collectors’ pipe complex configurations. Therefore, the results of this study serve as a diagnostic tool to estimate the performance of the device under the specified conditions and highlight the potential applications of the RTP geometry in various industrial activities. The findings offer valuable insights into the feasibility and benefits of incorporating the RTP design in practical applications.
Finally, the hydrodynamic outcomes presented in this study, resulting from the geometric characteristics of the RTP, hold significant potential for various industrial applications involving fluid transport. These outcomes include the potential for reducing operating costs and enhancing efficiency in fluid distribution. The unique geometric features of the RTP offer promising advantages that can positively impact multiple industrial activities.

Author Contributions

Conceptualization, I.C.-M. and J.E.D.L.-R.; methodology, R.R.-R., H.T.-P. and M.D.l.C.-Á.; software, R.R.-R. and M.D.l.C.-Á.; validation, R.R.-R., H.T.-P. and M.D.l.C.-Á.; formal analysis, I.C.-M., R.R.-R., J.E.D.L.-R. and M.D.l.C.-Á.; investigation, I.C.-M., R.R.-R., J.E.D.L.-R., H.T.-P. and M.D.l.C.-Á.; resources, I.C.-M. and H.T.-P.; data curation, R.R.-R. and M.D.l.C.-Á.; writing—original draft preparation, R.R.-R., H.T.-P. and M.D.l.C.-Á.; writing—review and editing, R.R.-R., H.T.-P. and M.D.l.C.-Á.; visualization, I.C.-M.; supervision, I.C.-M. and H.T.-P.; project administration, I.C.-M. and H.T.-P.; funding acquisition, I.C.-M. and H.T.-P. All authors have read and agreed to the published version of the manuscript.

Funding

This research was funded by the Instituto Politécnico Nacional and the Consejo Nacional de Humanidades, Ciencia y Tecnología, México.

Data Availability Statement

All data is within the document.

Acknowledgments

The authors of this paper are particularly grateful to Moreno-Rodríguez. from the Carlos III University of Madrid for the contributions made and the information provided.

Conflicts of Interest

The authors declare no conflict of interest.

References

  1. Sumair, F.A.; Mohammad, K.; Mahesh, V.R.; Arshid, N.; Abdul, K.R.; Nabisab, M.M. Recent progress in solar water heaters and solar collectors: A comprehensive review. Therm. Sci. Eng. Prog. 2021, 25, 100981. [Google Scholar]
  2. Evangelos, B.; Christos, T.; Zafar, S. Investigation and optimization of a solar-assisted pumped thermal energy storage system with flat plate collectors. Energy Convers. Manag. 2021, 237, 114137. [Google Scholar]
  3. Qureshi, I.A.; Waqas, A.; Ali, M.; Mehmood, A.; Javed, A. Performance evaluation of ORC system using evacuated flat plate Photovoltaic-Thermal collector as an evaporator. Sol. Energy 2021, 230, 859–873. [Google Scholar] [CrossRef]
  4. Sun, X.; Dai, Y.; Novakovic, V.; Wu, J.; Wang, R. Performance comparison of direct expansion solar-assisted heat pump and conventional air source heat pump for domestic hot water. Energy Procedia 2015, 70, 394–401. [Google Scholar] [CrossRef] [Green Version]
  5. Li, Y.W.; Wang, R.Z.; Wu, J.Y.; Xu, Y.X. Experimental performance analysis on a direct- expansion solar-assisted heat pump water heater. Appl. Therm. Eng. 2007, 27, 2858–2868. [Google Scholar] [CrossRef]
  6. Sajid, A.; Yuan, Y.; Hassan, A.; Zhou, J.; Zeng, C.; Yu, M.; Emmanuel, B. Experimental and numerical investigation on a solar direct-expansion heat pump system employing PV/T & solar thermal collector as evaporator. Energy 2022, 254, 124312. [Google Scholar]
  7. Yao, J.; Liu, W.; Zhao, Y.; Dai, Y.; Zhu, J.; Novakovic, V. Two-phase flow investigation in channel design of the roll-bond cooling component for solar assisted PVT heat pump application. Energy Convers. Manag. 2021, 235, 113988. [Google Scholar] [CrossRef]
  8. Yao, J.; Zheng, S.; Chen, D.; Dai, Y.; Huang, M. Performance improvement of vapor-injection heat pump system by employing PVT collector/evaporator for residential heating in cold climate region. Energy 2021, 219, 119636. [Google Scholar] [CrossRef]
  9. Jorge, L.R.; Ignacio, C.M. Mathematical Thermal Modelling of a Direct-Expansion Solar-Assisted Heat Pump Using Multi-Objective Optimization Based on the Energy Demand. Energies 2018, 11, 1773. [Google Scholar]
  10. Jorge, L.R.; Ignacio, C.M. Thermal capacity: Additional relative efficiency to assess the overall performance of heat pump-based heating systems. Appl. Therm. Eng. 2019, 159, 113841. [Google Scholar]
  11. Amancio, M.R.; Arturo, G.G.; Marcelo, I.; Nestor, G.H. Theoretical model and experimental validation of a direct-expansion solar assisted heat pump for domestic hot water applications. Energy 2012, 45, 704–715. [Google Scholar]
  12. Amancio, M.R.; Arturo, G.G.; Marcelo, I.; Nestor, G.H. Experimental validation of a theoretical model for a direct-expansion solar-assisted heat pump applied to heating. Energy 2013, 60, 242–253. [Google Scholar]
  13. Abhishek, T.; Sushil, K.; Pawan, K.; Sanjeev, K.; Bhardwaj, A.K. A review on the simulation/CFD based studies on the thermal augmentation of flat plate solar collectors. Mater. Today Proc. 2021, 46, 8578–8585. [Google Scholar]
  14. Badiei, Z.; Eslami, M.; Jafarpur, K. Performance improvements in solar flat plate collectors by integrating with phase change materials and fins: A CFD modeling. Energy 2020, 192, 116719. [Google Scholar] [CrossRef]
  15. Mohammad, A.; Ben, H.; Andrew, H.; Dominic, C. Determining the Effect of Inlet Flow Conditions on the Thermal Efficiency of a Flat Plate Solar Collector. Fluids 2018, 3, 67. [Google Scholar]
  16. Gunjo, D.G.; Mahanta, P.; Robi, P.S. Exergy and energy analysis of a novel type solar collector under steady state condition: Experimental and CFD análisis. Renew. Energy 2017, 114, 655–669. [Google Scholar] [CrossRef]
  17. Primož, P.; Urban, T.; Nada, P.; Boris, V.; Uroš, F.; Andrej, K. Numerical and experimental investigation of the energy and exergy performance of solar thermal, photovoltaic and photovoltaic-thermal modules based on roll-bond heat exchangers. Energy Convers. Manag. 2020, 210, 112674. [Google Scholar]
  18. Kasuba, S.; Suresh, A.; Kishen, K.R. Experimental and computational analysis of radiator and evaporator. Mater. Today Proc. 2015, 2, 2277–2290. [Google Scholar]
  19. Sun, X.; Wu, J.; Dai, Y.; Wang, R. Experimental study on roll-bond collector/evaporator with optimized channel used in direct expansion solar assisted heat pump water heating system. Appl. Therm. Eng. 2014, 66, 571–579. [Google Scholar] [CrossRef]
  20. Aste, N.; Claudio, D.P.; Fabrizio, L. Water flat plate PV–thermal collectors: A review. Sol. Energy 2014, 102, 98–115. [Google Scholar]
  21. Miglioli, A.; Aste, N.; Del Pero, C.; Leonforte, F. Photovoltaic-thermal solar-assisted heat pump systems for building applications: Integration and design methods. Energy Built Environ. 2023, 4, 39–56. [Google Scholar]
  22. Aste, N.; Claudio, D.P.; Fabrizio, L. Thermal-electrical optimization of the configuration a liquid PVT collector. Energy Procedia 2012, 30, 1–7. [Google Scholar] [CrossRef] [Green Version]
  23. Al-Shamani, A.N.; Sopian, K.; Mat, S.; Hasan, H.A.; Abed, A.M.; Ruslan, M.H. Experimental studies of rectangular tube absorber photovoltaic thermal collector with various types of nanofluids under the tropical climate conditions. Energy Convers. Manag. 2016, 124, 528–542. [Google Scholar] [CrossRef]
  24. Dupeyrat, P.; Ménézo, C.; Rommel, M.; Henning, H.M. Efficient single glazed flat plate photovoltaic–thermal hybrid collector for domestic hot water system. Sol. Energy 2011, 85, 1457–1468. [Google Scholar] [CrossRef]
  25. Huide, F.; Xuxin, Z.; Lei, M.; Tao, Z.; Qixing, W.; Hongyuan, S. A comparative study on three types of solar utilization technologies for buildings: Photovoltaic, solar thermal and hybrid photovoltaic/thermal systems. Energy Convers. Manag. 2017, 140, 1–13. [Google Scholar] [CrossRef]
  26. Del Col, D.; Padovan, A.; Bortolato, M.; Dai Prè, M.; Zambolin, E. Thermal performance of flat plate solar collectors with sheet-and-tube and roll-bond absorbers. Energy 2013, 58, 258–269. [Google Scholar] [CrossRef]
  27. Swapnil, D.; Andrew, A.O. Testing of two different types of photovoltaic–thermal (PVT) modules with heat flow pattern under tropical climatic conditions. Energy Sustain. Dev. 2013, 17, 1–12. [Google Scholar]
  28. Guarracino, I.; Mellor, A.; Ekins-Daukes, N.J.; Markides, C.N. Dynamic coupled thermal-and-electrical modelling of sheet-and-tube hybrid photovoltaic/thermal (PVT) collectors. Appl. Therm. Eng. 2016, 101, 778–795. [Google Scholar] [CrossRef] [Green Version]
  29. Santbergen, R.; Rindt, C.M.; Zondag, H.A.; Van Zolingen, R.C. Detailed analysis of the energy yield of systems with covered sheet-and-tube PVT collectors. Sol. Energy 2010, 84, 867–878. [Google Scholar] [CrossRef]
  30. Touafek, K.; Khelifa, A.; Adouane, M. Theoretical and experimental study of sheet and tubes hybrid PVT collector. Energy Convers. Manag. 2014, 80, 71–77. [Google Scholar] [CrossRef]
  31. Hosseinzadeh, M.; Salari, A.; Sardarabadi, M.; Passandideh-Fard, M. Optimization and parametric analysis of a nanofluid based photovoltaic thermal system: 3D numerical model with experimental validation. Energy Convers. Manag. 2018, 160, 93–108. [Google Scholar]
  32. Herrando, M.; Ramos, A.; Zabalza, I.; Markides, C.N. A comprehensive assessment of alternative absorber-exchanger designs for hybrid PVT-water collectors. Appl. Energy 2019, 235, 1583–1602. [Google Scholar] [CrossRef] [Green Version]
  33. Fudholi, A.; Sopian, K.; Yazdi, M.H.; Ruslan, M.H.; Ibrahim, A.; Kazem, H.A. Performance analysis of photovoltaic thermal (PVT) water collectors. Energy Convers. Manag. 2014, 78, 641–651. [Google Scholar] [CrossRef]
  34. Aste, N.; Fabrizio, L.; Claudio, D.P. Design, modeling and performance monitoring of a photovoltaic–thermal (PVT) water collector. Sol. Energy 2015, 112, 85–99. [Google Scholar] [CrossRef]
  35. Buonomano, A.; Francesco, C.; Maria, V. Design, simulation and experimental investigation of a solar system based on PV panels and PVT collectors. Energies 2016, 9, 497. [Google Scholar] [CrossRef]
  36. Lari, M.O.; Ahmet, Z.S. Design, performance and economic analysis of a nanofluid-based photovoltaic/thermal system for residential applications. Energy Convers. Manag. 2017, 149, 467–484. [Google Scholar] [CrossRef]
  37. Yu, X.F.; Zhang, C.P.; Teng, J.T.; Huang, S.Y.; Jin, S.P.; Lian, Y.F.; Cheng, C.H.; Xu, T.T.; Chu, J.C.; Chang, Y.J.; et al. A study on the hydraulic and thermal characteristics in fractal tree-like microchannels by numerical and experimental methods. Int. J. Heat Mass Transf. 2012, 55, 7499–7507. [Google Scholar] [CrossRef]
  38. Wang, G.; Gu, Y.; Zhao, L.; Xuan, J.; Zeng, G.; Tang, Z.; Sun, Y. Experimental and numerical investigation of fractal-tree-like heat exchanger manufactured by 3D printing. Chem. Eng. Sci. 2019, 195, 250–261. [Google Scholar] [CrossRef] [Green Version]
  39. Zhuang, D.; Yang, Y.; Ding, G.; Du, X.; Hu, Z. Optimization of Microchannel Heat Sink with Rhombus Fractal-like Units for Electronic Chip Cooling. Int. J. Refrig. 2020, 116, 108–118. [Google Scholar] [CrossRef]
  40. Jing, D.; He, L.; Wang, X. Optimization analysis of fractal tree-like microchannel network for electroviscous flow to realize minimum hydraulic resistance. Int. J. Heat Mass Transf. 2018, 125, 749–755. [Google Scholar] [CrossRef]
  41. Geoffrey, W.; James, B.; Brian, E. A general model for the origin of allometric scaling laws in biology. Science 1997, 276, 122–126. [Google Scholar]
  42. Kittinan, B.; Mehrdad, M.; Javad, M.N.; Rasool, A.; Omid, M.; Ahmet, S.D.; Ho, S.A.; Somchai, W. Prediction of battery thermal behaviour in the presence of a constructal theory-based heat pipe (CBHP): A multiphysics model and pattern-based machine learning approach. J. Energy Storage 2022, 48, 103963. [Google Scholar]
  43. Bejan, A.; Lorente, S. Constructal theory of generation of configuration in nature and engineering. J. Appl. Phys. 2006, 100, 5. [Google Scholar] [CrossRef] [Green Version]
  44. Bejan, A. Constructal-theory network of conducting paths for cooling a heat generating volume. Int. J. Heat Mass Transf. 1997, 40, 799–816. [Google Scholar] [CrossRef]
  45. Kittipong, S.; Mehrdad, M.; Jatuporn, K.; Ahmet, S.D.; Ho, S.A.; Omid, M.; Somchai, W. Novel design of a liquid-cooled heat sink for a high performance processor based on constructal theory: A numerical and experimental approach. Alex. Eng. J. 2022, 61, 10341–10358. [Google Scholar]
  46. Tesař, V. Bifurcating channels supplying “numbered-up” microreactors. Chem. Eng. Res. Des. 2011, 89, 2507–2520. [Google Scholar] [CrossRef]
  47. Johansson, E.; Moohammed, W.Y. Wind comfort and solar access in a coastal development in Malmö, Sweden. Urban Clim. 2020, 33, 100645. [Google Scholar] [CrossRef]
  48. Nguyen, T.D.; Ha, M.B. Computational fluid dynamic model for smoke control of building basement. Case Stud. Chem. Environ. Eng. 2023, 7, 100318. [Google Scholar] [CrossRef]
  49. Moaveni, S. Finite Element Analysis Theory and Application with ANSYS, 2nd ed.; Pearson Education: Hoboken, NJ, USA, 2011; pp. 5–8. [Google Scholar]
  50. Patankar, S.V. Numerical Heat Transfer and Fluid Flow; Hemisphere Publishing Corporation: New York, NY, USA, 1980. [Google Scholar]
  51. Walter, H. Dynamic simulation of natural circulation steam generators with the use of finite-volume-algorithms—A comparison of four algorithms. Simul. Model. Pract. Theory 2007, 15, 565–588. [Google Scholar] [CrossRef]
  52. Nelson, O.M.; Juan, I.J.; Roberto, C.C. An approach to accelerate the convergence of SIMPLER algorithm for convection-diffusion problems of fluid flow with heat transfer and phase change. Int. Commun. Heat Mass Transf. 2021, 129, 105715. [Google Scholar]
  53. Yin, R.; Chow, W.K. Comparison of four algorithms for solving pressure velocity linked equations in simulating atrium fire. Int. J. Archit. Sci. 2003, 4, 24–35. [Google Scholar]
  54. Schnipke, R.J. A Streamline Upwind Finite-Element Method for Laminar and Turbulent Flow; University of Virginia: Charlottesville, VA, USA, 1986. [Google Scholar]
  55. Garg, H.; Agarwal, R. Some aspects of a PV/T collector/forced circulation flat plate solar water heater with solar cells. Energy Convers. Manag. 1995, 36, 87–99. [Google Scholar] [CrossRef]
  56. White, F.M. Fluid Mechanics, 5th ed.; McGraw-Hill Book Company: Boston, MA, USA, 2003. [Google Scholar]
  57. Colebrook, C.F.; Blench, T.; Chatley, H.; Essex, E.H.; Finniecome, J.R.; Lacey, G.; Macdonald, G. Correspondence. turbulent flow in pipes, with particular reference to the transition region between the smooth and rough pipe laws. (includes plates). J. Inst. Civ. Eng. 1939, 12, 393–422. [Google Scholar] [CrossRef]
  58. Fox, R.W.; McDonald, A.T.; Mitchell, J.W. Fox and McDonald’s Introduction to Fluid Mechanics; John Wiley & Sons: Hoboken, NJ, USA, 2020. [Google Scholar]
  59. Gabriela, L.; Andrew, K.; Amir, K. Experimental Techniques against RANS Method in a Fully Developed Turbulent Pipe Flow: Evolution of Experimental and Computational Methods for the Study of Turbulence. Fluids 2022, 7, 78. [Google Scholar]
  60. Milad, A.; Paola, G.; David, V.; Carlo, G. Numerical Study of Flow Downstream a Step with a Cylinder Part 1: Validation of the Numerical Simulations. Fluids 2023, 8, 55. [Google Scholar]
  61. Yoon, G.H. Topology optimization method with finite elements based on the k-ε turbulence model. Comput. Methods Appl. Mech. Eng. 2020, 361, 112784. [Google Scholar] [CrossRef]
  62. Brice, R.; Jonas, K.J.; Svenn, K.H.; Wiebke, B.M. Analysis of Cold Air Recirculation in the Evaporators of Large-Scale Air-Source Heat Pumps Using CFD Simulations. Fluids 2020, 5, 186. [Google Scholar]
  63. Launder, B.; Spalding, D. Mathematical Models of Turbulence; Academic Press: London, UK, 1972. [Google Scholar]
Figure 1. 3D model of the numerical domain with rhombic tessellation pattern, fractal tree inlet and outlet, and allometric scales (RTP), [mm].
Fluids 08 00221 g001
Figure 2. Detail of the rhombic tessellation construction that conform the piping network [mm].
Fluids 08 00221 g002
Figure 3. Manifold inlet with fractal tree form, α 1 = 64 ° ,   α 2 = 53.7 ° .
Fluids 08 00221 g003
Figure 4. 3D model of the parallel pipe pattern collector (PPP) [mm].
Fluids 08 00221 g004
Figure 5. Example of the discretized model.
Fluids 08 00221 g005
Figure 6. Sensitivity analysis for both numerical domains (a) Rhombic Tessellation Pattern, and (b) Parallel Pipe Pattern.
Fluids 08 00221 g006
Figure 7. Velocity distribution for PPP with 0.03 kg/s of water.
Fluids 08 00221 g007
Figure 8. Velocity distribution for the RTP with 0.03 kg/s of water.
Fluids 08 00221 g008
Figure 9. Static pressure for PPP with 0.03 kg/s of water.
Fluids 08 00221 g009
Figure 10. Static pressure for the RTP with 0.03 kg/s of water.
Fluids 08 00221 g010
Figure 11. Pressure drop of both pipe network model with each mass flow of water simulated.
Fluids 08 00221 g011
Figure 12. (a) Detail of branching pattern over the inlet velocity magnitude contour. (b) trifurcation and (c) bifurcation streamlines close up.
Fluids 08 00221 g012
Table 1. Diameter and length dimensions for the fractal tree inlet.
Diameter [mm]Length [mm]
Inlet line39.6148
First Branch13.2229
Second Branch7.3130
Table 2. Characteristics of each model.
PPPRTP
MaterialCopperCopper
Length [mm]16271627
Width [mm]645645
Thickness [mm]11
Area [m2]1.0491.049
Pipe area [%]20.8120.96
Hydraulic diameter [mm]7.339.6, 13.2, 7.3
Volume [m3]0.0020.002
Table 3. Properties of liquid water for the simulation, at 20 °C.
PropertyValue
Density, ρ   [kg/m3]998.2
Viscosity, μ   [kg/(m·s)] 0.01003
Table 4. Mesh sensitivity analysis.
Mesh 1Mesh 2Mesh 3Mesh 4Mesh 5 P a n a l y t i c s
Pipe networking with rhombic tessellation
Number of nodes215,936360,480661,595728,3241,020,862
Number of elements648,9091,186,9532,478,9622,796,2404,102,085
Pressure drop [Pa]27.824.622.321.921.822.49
Pipe networking with parallel pipe
Number of nodes252,426671,693932,002990,8001,195,763
Number of elements611,3861,829,5402,655,7012,828,8563,389,378
Pressure drop [Pa]210.8179.3151.3150.6150.1147.9
Table 5. Reynolds number in the inlet/outlet line of both geometries for each mass flow.
m ˙ [kg/s] RTPPPP
0.01320.61738.9
0.02641.13477.9
0.03961.75216.8
0.041282.36955.8
0.051602.88694.7
0.061923.410,433.7
Disclaimer/Publisher’s Note: The statements, opinions and data contained in all publications are solely those of the individual author(s) and contributor(s) and not of MDPI and/or the editor(s). MDPI and/or the editor(s) disclaim responsibility for any injury to people or property resulting from any ideas, methods, instructions or products referred to in the content.

