Article

CFD Thermo-Hydraulic Evaluation of a Liquid Hydrogen Storage Tank with Different Insulation Thickness in a Small-Scale Hydrogen Liquefier

1
Alternative Fuel Power System R&D Department, Korea Automotive Technology Institute, Cheonan-si 31214, Republic of Korea
2
Engineering Center, Hyundai Heavy Industries Power System, Seongnam-si 13591, Republic of Korea
*
Author to whom correspondence should be addressed.
Fluids 2023, 8(9), 239; https://doi.org/10.3390/fluids8090239
Submission received: 1 August 2023 / Revised: 19 August 2023 / Accepted: 22 August 2023 / Published: 24 August 2023
(This article belongs to the Special Issue Multiphase Flow for Industry Applications)

Abstract

:
Accurate evaluation of thermo-fluid dynamic characteristics in tanks is critically important for designing liquid hydrogen tanks for small-scale hydrogen liquefiers to minimize heat leakage into the liquid and ullage. Due to the high costs, most future liquid hydrogen storage tank designs will have to rely on predictive computational models for minimizing pressurization and heat leakage. Therefore, in this study, to improve the storage efficiency of a small-scale hydrogen liquefier, a three-dimensional CFD model that can predict the boil-off rate and the thermo-fluid characteristics due to heat penetration has been developed. The prediction performance and accuracy of the CFD model was validated based on comparisons between its results and previous experimental data, and a good agreement was obtained. To evaluate the insulation performance of polyurethane foam with three different insulation thicknesses, the pressure changes and thermo-fluid characteristics in a partially liquid hydrogen tank, subject to fixed ambient temperature and wind velocity, were investigated numerically. It was confirmed that the numerical simulation results well describe not only the temporal variations in the thermal gradient due to coupling between the buoyance and convection, but also the buoyancy-driven turbulent flow characteristics inside liquid hydrogen storage tanks with different insulation thicknesses. In the future, the numerical model developed in this study will be used for optimizing the insulation systems of storage tanks for small-scale hydrogen liquefiers, which is a cost-effective and highly efficient approach.

1. Introduction

Liquid hydrogen has the best storage capacity per unit mass and is economical among the methods for using hydrogen as fuel [1,2]. Thus, great efforts have recently been made to develop liquified hydrogen tanks as a fuel storage method for launch vehicle applications, subsonic transport aircraft [3], unmanned aerial vehicles [4,5] and liquid hydrogen-fueled automobiles [2,6].
Although the small-scale hydrogen liquefier market is not yet active, the advent of the hydrogen economy is imminent and demand this fuel is rapidly increasing. Therefore, it is expected that a new market will form soon, and companies with existing hydrogen liquefaction technology are in a good position to enter this market. However, when production of small-capacity liquid hydrogen is required, investment and operating costs for future profit making are too large to apply the cycle base technology for large-scale hydrogen liquefaction, and the business feasibility falls [7]. Therefore, it is necessary to preoccupy the market by the development of a direct cooling-based small-scale hydrogen liquefier.
In the design of a small-scale hydrogen liquefier, securing the insulation performance of the liquid hydrogen storage tank is very important in terms of storage and production efficiency. However, since hydrogen has a very low boiling point, it is vulnerable to heat penetration from the environment. When these heat leaks penetrate the tank, the hydrogen evaporates intensively, increasing the tank pressure, causing not only serious security problems such as overpressure explosions, but also a serious decrease in the storage capacity of the tank. It is well known that tank pressure increases result in additional heat input to the tank because pressurization sub-cools the liquid and raises the temperature difference between liquid and vapor, increasing the axial temperature gradient near the interface, which leads to high levels of interfacial conduction heat flux. This interfacial conduction heat flux also causes the liquid near the interface to become warmer because of further increases in the liquid temperature. As time elapses, the axial temperature gradient in the liquid, which is called thermal stratification, increases due to heat leaking in from the environment. A schematic of the evolution of thermal stratification in a typical liquid hydrogen tank due to various external heat sources is shown in Figure 1.
In the development of a high-efficiency direct-cooled small-scale hydrogen liquefier, evaporation of liquefied hydrogen by thermal stratification, which is called boil-off, is a major cause of deterioration in storage efficiency as well as liquefaction efficiency. Therefore, controlling boil-off losses of liquid hydrogen is of significance for design of small-scale hydrogen liquefiers. Thus, it is important to establish prior knowledge about the pressurization and thermo-fluid characteristics inside the tank due to heat penetration through the development of a numerical model to predict the insulation efficiency and boil-off loss of the direct-cooled hydrogen liquefier [8].
To develop liquefied hydrogen storage tanks that are cost-effective and have high adiabatic performance, various numerical analysis models have been developed, and the reliance on computational models is ever-increasing. Thus, reliable predictive numerical models to aid the tank design process are required. However, the physical mechanisms that occur in the liquefied hydrogen tank with heat penetration from the environment are controlled by the kinetics of the phase change and buoyancy-driven turbulent flows in the vapor and liquid phases. Therefore, to date, various numerical and experimental studies have analyzed the thermophysical phenomena in liquefied hydrogen tanks according to heat penetration from the outside.
Kang [4,5] simulated thermal stratification by various heat ingresses in a conventional LNG tank using finite element analysis (FEA) and verified the accuracy of the analysis by measuring the axial temperature distribution through experiments. The numerical results were in good agreement with the experimental values and showed that thermal stratification is strongly influenced by the thermal aspect ratio determined by the filling height of the storage tank.
On the other hand, calculating multi-dimensional N-S type governing equations using the finite element method or finite difference method such as FEA is very time-consuming and expensive, so there are many limitations in terms of design time compared with experimental methods. Therefore, several thermodynamic equilibrium lumped (0-D) models [9,10,11] with varying levels of accuracy and complexity have been developed to predict the adiabatic performance and temperature distributions in partially filled liquid hydrogen tanks under various heat ingress conditions for long durations.
These 0-D models provided valuable design ideas and engineering insights into the adiabatic conditions to the designers of liquefied hydrogen storage under various conditions caused by long-term heat penetration. Panzarella [9,10] studied the long-term pressurization of a large LH2 (liquid hydrogen) storage tank in microgravity by using a coupling strategy which combined the lumped energy and lumped mass equations of the ullage with the Navier-Stokes and energy equations in the liquid in their CFD model. Barsi and Kassemi [12] also used the coupling strategy of Panzarella and Kassemi [9] and coupled the incompressible N-S type equations based on Boussinesq approximation in the liquid to a 0-D lumped energy and mass model of the ullage. By using this lumped strategy, they described the thermophysical behavior of a partially filled LH2 tank in normal gravity. Liu and Li [13] developed a stratification model based on a transient analytical thermodynamic lumped method to predict the temporal growth of a stratified layer and mass under constant wall temperature.
Recently, Joseph [14] developed a one-dimensional unsteady thermodynamic lumped model based on a software package named SINDA/FLUINT to study the thermal stratification inside a liquefied hydrogen storage tank for various insulation thickness. They calculated the ullage part by 1-D axial discretization, while the liquid part was discretized in the radial direction by dividing it into three parts. The accuracy of the 1-D model for simulating boil-off and thermo-fluid characteristics in the tank was validated by comparison with the previous literature and a good agreement was shown.
With the help of highly efficient numerical techniques and advanced computational resources, CFD approaches have been actively used since the early 2000s to study thermal stratification and boil-off losses in cryogenic storage tanks. Adnani and Jennings [15] used the commercial CFD software FLUENT to simulate the temporal variation in pressure and pressurant gas requirement in a liquid hydrogen tank. In this model, the liquid phase inside the tank was not modeled but was treated as stationary liquid with constant temperature.
Meanwhile, multi-dimensional CFD analysis has been performed to study the effects of geometric variation of cryogenic tanks on the transient natural convection in a cryogenic tank [16]. These researchers pointed out that the interfacial heat and mass transfer strongly depend on the liquid–solid contact area in the tank. However, numerical modeling of interfacial heat and mass transfer at the free surface due to thermal stratification, which is essential to reach this conclusion, was not considered in this study.
From the results of the previous literature mentioned above, the most important work in numerical analysis to achieve heat leak minimization due to heat penetration of the cryogenic storage tank is how to model the interfacial heat and mass transfer phenomenon at the free surface. Therefore, numerous recent studies [2,17,18,19,20] have actively investigated the relationship between buoyancy-driven turbulent flow and boil-off loss due to heat leaks using a CFD model that considers heat and mass transfer on the free surface of a liquefied hydrogen storage tank. Numerical models utilizing the CFD technique have been widely adopted for describing the vapor–liquid interface phase change at the free surface. Recently, these include Volume of Fluid (VOF) [2,18,19,21,22] models and a sharp interface model based on the Schrage molecular mass transfer model [17,23]. Similarly, a CFD model based on VOF has been used to investigate the effects of variations in geometric shapes such as the aspect ratio of a liquefied hydrogen storage tank [21] and changes in the position of baffles to suppress sloshing on the boil-off rate and buoyancy-driven turbulent flow in a tank [20]. Very recently, the scope of application of the CFD model based on VOF has been extended to investigate the effects of excitation outside the cryogenic fuel tank on the sloshing pattern of liquid and pressurization of the ullage area [24,25]. A CFD model based on the Schrage molecular mass transfer model was also actively used in the study of thermal stratification caused by heat leaks in liquefied hydrogen tanks. However, to use this model accurately, the model’s coefficients must be calibrated by a trial-and-error method [17,26], and the difficulty of relieving the numerical stiffness must be overcome [27]. In addition, this model has the disadvantage that the sloshing effect cannot be considered.
Multi-layer insulation (MLI), which has excellent thermal insulation properties, is lightweight and environmentally friendly and has been extensively applied to LH2 tanks. Hence, many experimental and numerical studies under various ambient conditions have been performed, and computational models for predicting the adiabatic and thermal performance of MLI have been reported in the literature [28,29,30,31]. In addition, since the insulation performance of MLI and the degree of vacuum are very closely related, Li [32] conducted numerical and experimental studies on thermal stratification inside the tank according to the degree of vacuum and reported that vacuum loss caused rapid thermal stratification. However, most of the aforementioned investigations used simple empirical models to evaluate only the insulating performance of MLI.
In designing the insulation of an LH2 tank, the most recent focus has been on the thickness of the insulation. Particularly, a one-dimensional thermodynamic lumped model was recently applied to investigate the effect of insulation thickness on thermal and adiabatic performance under fixed ambient temperature and wind velocity [14]. In their model, ullage space was considered temporally varying and axially one-dimensional. However, it was reported that the average temperature of each computational element overestimates the heat transfer from the ullage to the liquid at the interface due to the limitations of one-dimensional lumped model [22]. Additionally, the prediction performance of this model was not validated in terms of self-pressurization in the tank, which was affected by the fluid dynamics of the buoyancy-driven turbulent flows in the liquid and vapor phases [1]. Therefore, the existing 0-D and 1-D models do not appear to be valid for predicting the effect of the cryogenic tank’s thermal insulation performance on the thermo-fluid characteristics in the liquid and vapor as well as self-pressurization. Furthermore, the above-mentioned thermo-fluid characteristics can only be displayed by a CFD model with interfacial treatments such as VOF and a shape interface model with the Schrage equation.
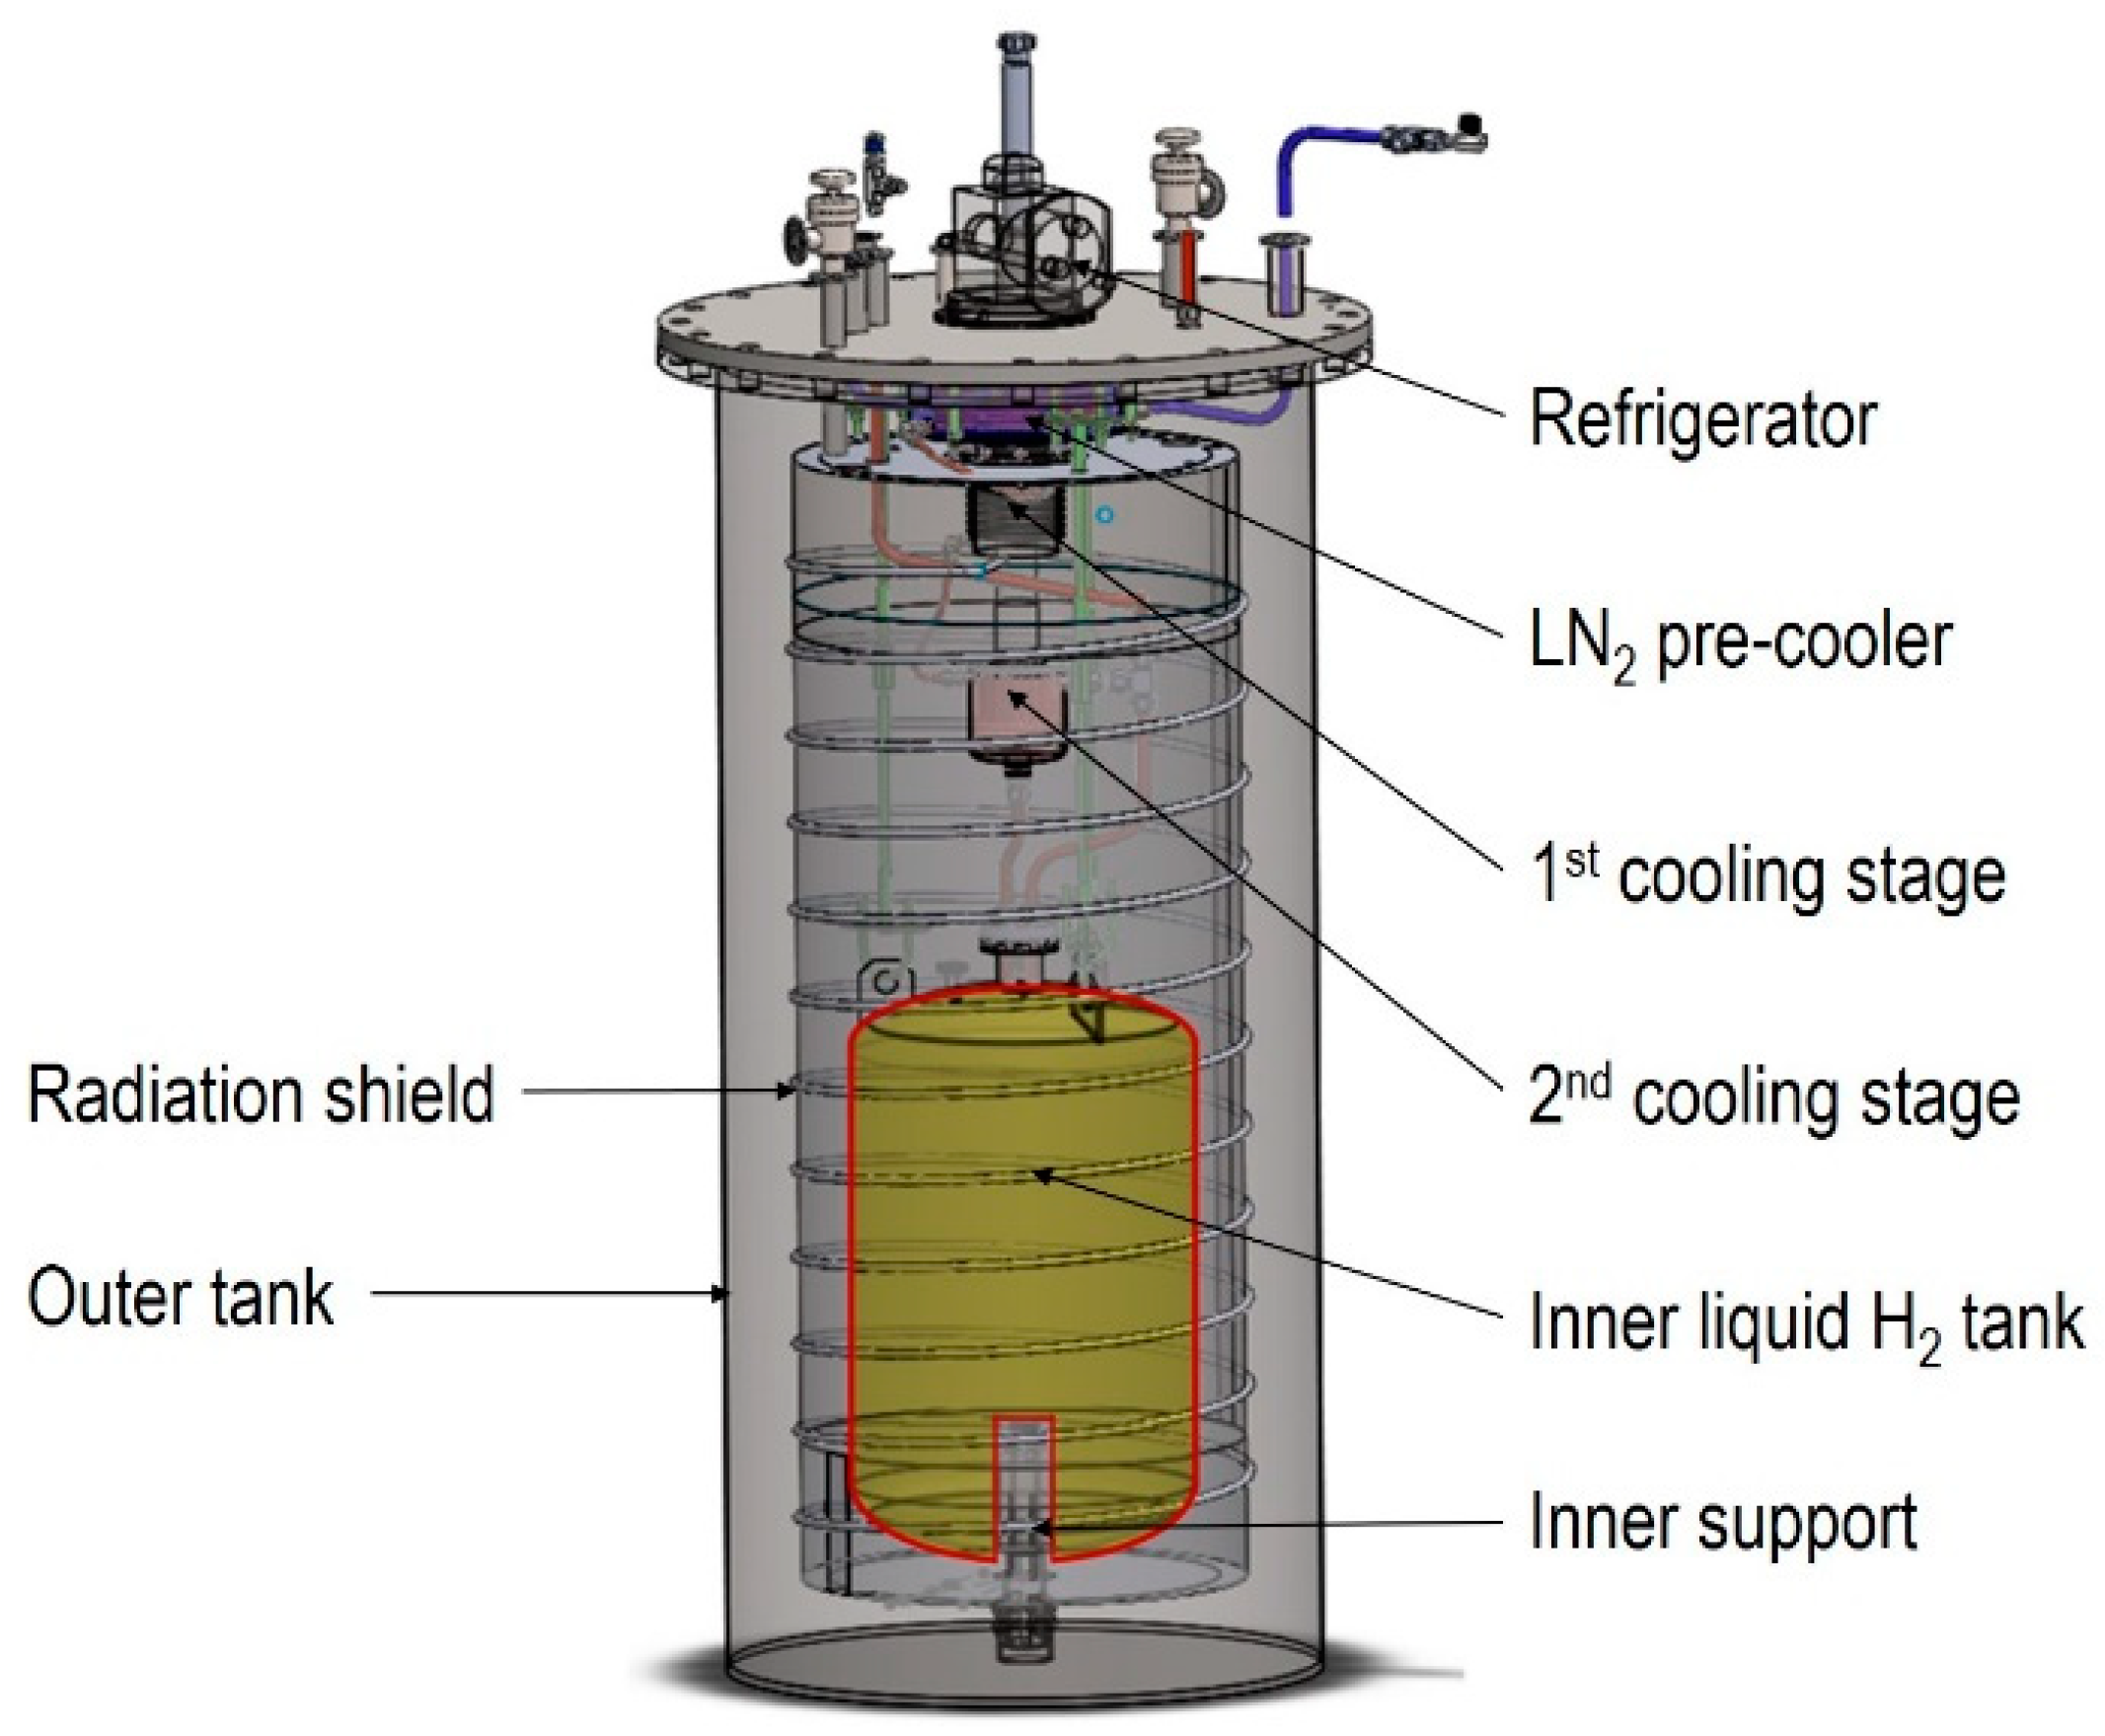
Figure 2 shows the small-scale hydrogen liquefier system considered in this study. As shown in the figure, this small-scale hydrogen liquefier is designed in such a way that the cryocooler with the first and second cooling stage, LN2 (Liquid Nitrogen) precooler, inner tank, and radiation shield are installed inside the outer tank. In this liquefier, gaseous hydrogen supplied to the liquefier is cooled to 77 K by passing through the LN2 precooler and then liquefied at 20 K and 1 atm. It passes through the first cooling stage and second cooling stage directly in contact with the cold head of the cryocooler and is stored in the inner liquid hydrogen storage tank. In addition, the radiation shield prevents radiant heat being emitted from the outside. The main components described above (LN2 precooler, two-stage cryocooler, inner tank) are covered with multi-layer thin film insulation (25 layers/inch) to prevent heat leakage.
In this study, to develop a more compact and cost-effective small hydrogen liquefier (1.3 L/h), a numerical analysis model was developed that can accurately evaluate the insulation performance of various insulation materials. In the case of liquid hydrogen storage for small-scale hydrogen liquefiers, MLI has been generally applied, which causes the price of small-scale liquefiers to rise. MLI has very good insulation performance, but as shown in Figure 2, since the surroundings must be kept in a vacuum, an outer tank must be installed, requiring higher installation costs and a larger space. Therefore, it is necessary to develop a cost-effective, high-efficiency insulation material comparable to MLI that does not require an outer tank or radiation shield. It is also necessary to develop a three-dimensional CFD model that can evaluate the insulation and thermodynamic performance of various insulation materials. Therefore, in this study, a three-dimensional CFD model with interfacial treatment based on the VOF was developed that can predict the thermo-fluid characteristics of the liquid and ullage in a hydrogen storage tank, as well as the insulation performance of various insulation materials.
As mentioned above, the CFD approach has been widely applied in the study of thermal stratification and self-pressurization of LH2 tanks. However, there is no previously published literature including a comprehensive investigation using a CFD approach which could consider the three-dimensional effects of insulation thickness, not only on the thermal stratification and tank pressurization due to thermal penetration but also heat transfer within tank wall and insulation mat. Therefore, in this study, a three-dimensional CFD thermo-hydraulic evaluation with different thicknesses of polyurethane insulation has been performed under extreme conditions in the atmosphere with mild wind breezing.

2. Numerical Modeling

In this section, the main features of the three-dimensional CFD model with two-phase VOF models for the LH2 tank are presented. For a more detailed description of the numerical model, reference can be made to the published literature [6,17,18,27].

2.1. Modeling Description

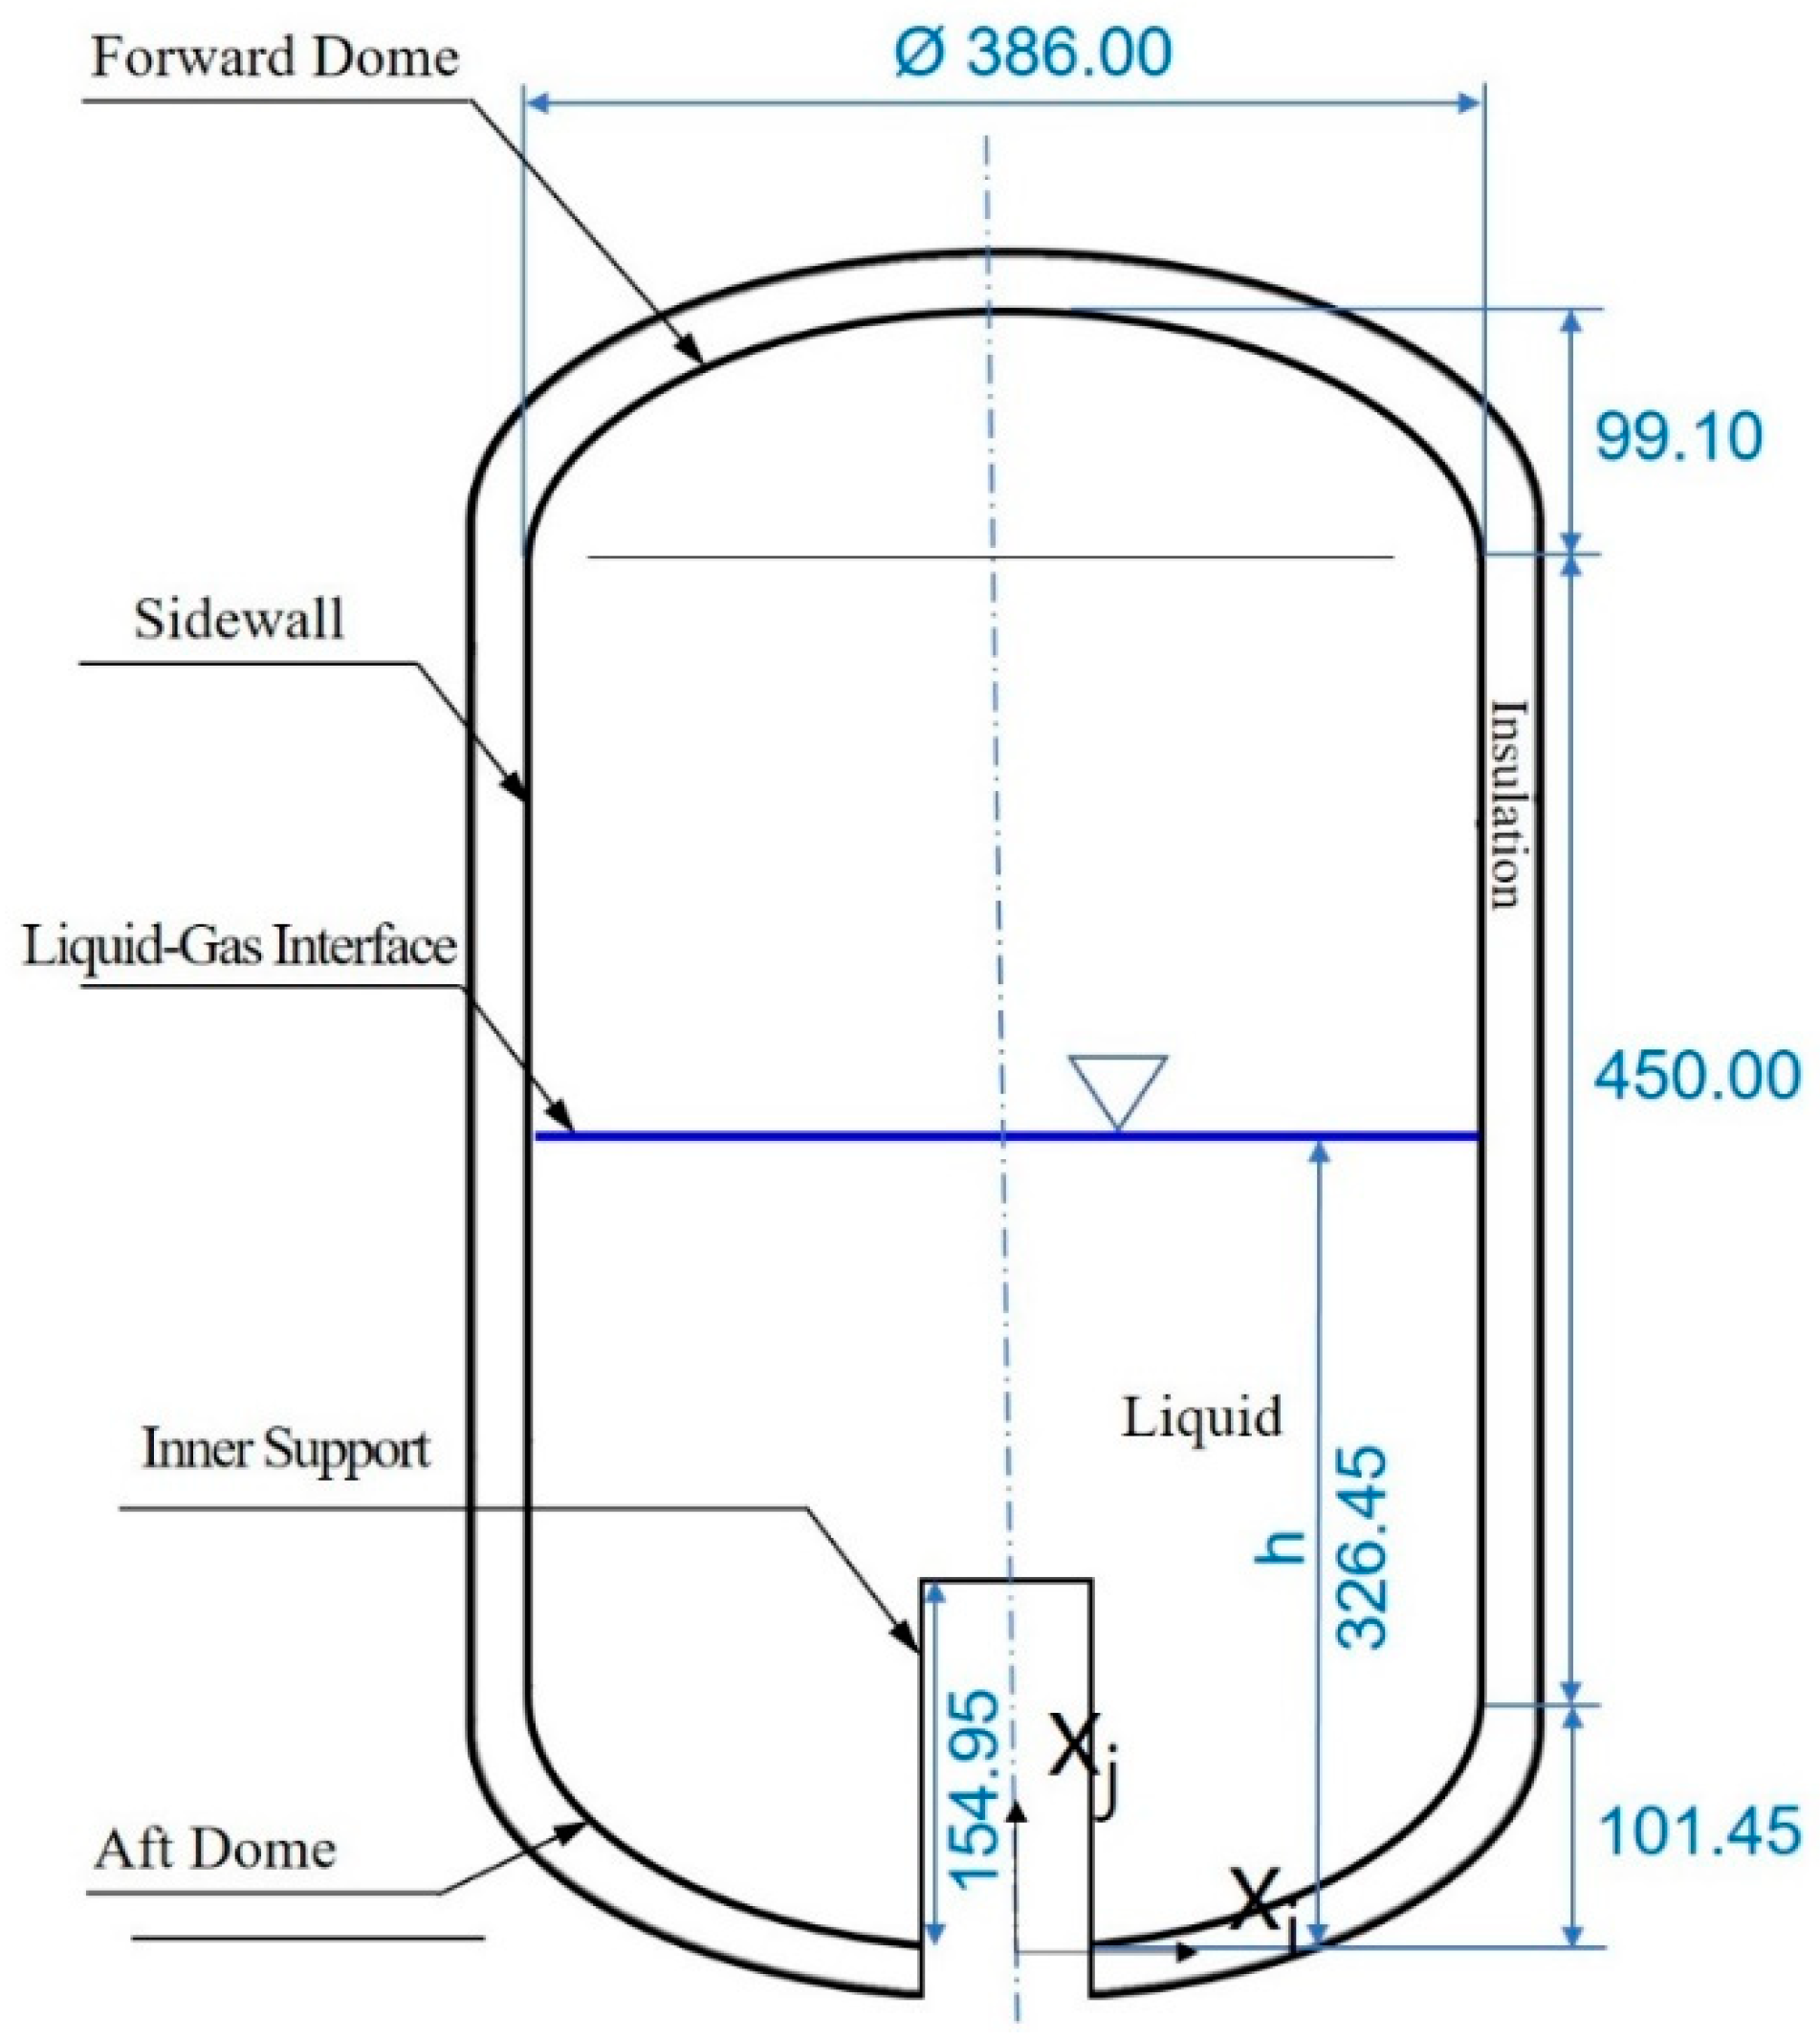
Figure 3 shows the schematic diagram of a LH2 tank (50 L) for a small-scale liquefier. The tank consists of a cylinder with a diameter of 386 mm and a height of 450 mm, as well as two dome heads with heights of 99.1 mm and 101.45 mm, respectively. A sheet of 2219 aluminum with a thickness of 3 mm was used to construct the tank walls.
Additionally, there is a cylindrical groove under the tank for inserting the support, which can guarantee the stability of the entire storage tank and internal devices of the hydrogen liquefier.
To reduce the heat ingress from the environment, various foam insulation thicknesses of 10 mm, 20 mm, and 30 mm were applied to the surface of the tank. The reason for the parametric study using polyurethane foam as an insulation material in this study is that polyurethane foam provides a high strength-to-weight ratio and a stable insulation performance for a wide vacuum range. Additionally, it may be cheaper than other insulation materials, and it is feasible to store it for a short period of time.
In the current simulation, the tank is filled to 50% of the liquid level by volume. In contrast to previous analyses [6,17,20,27], the wall heating is computed based on stable heat conduction to determine the tank wall temperature, while assuming external convective heat transfer with an increasingly adiabatic heat conduction tendency [21]. All of the fluid thermal properties in this study are defined as functions of temperature and corresponding ullage pressure taken from NIST [33] and updated with time. Since the foam material has low thermal conductivity, a large temperature gradient exists in the thermal insulation layer. Hence a fine mesh is required for the foam area. In order to reduce large computational burdens, the mesh becomes progressively coarser with distance from the wall. The internal regions of the ellipsoidal top and bottom are meshed with hexahedron grids. After checking its grid dependency, the total number of grids used in this numerical model was 40,000. The physical and geometric parameters that compose the tank are presented in Table 1.

2.2. Governing Equations and Numerical Modeling

Thermo-fluid and mass transfer in the tank are described by the continuity, Navier-Stokes, energy equations and phase equations for two phases:
ρ t + ( ρ u ) = S ˙ m , c S ˙ m , e
t ( ρ u j ) + x j ( ρ u i u j ) = - P x j + μ eff ( u i x j + u j u i ) + ρ g i + f σ
( ρ E ) t + ( u ( ρ E + P ) ) = ( k eff T ) +   S ˙   q , e   S ˙   q , e
t ( ρ χ q ) + x i ( ρ u i χ q ) = ρ D eff   2 χ q   S ˙   m , e +   S ˙   m , c
q = 1:vapor, q = 2:liquid
where S ˙ m , e and S ˙ m , c represent the mass source terms resulting from liquid vaporization and vapor condensation, respectively.   S ˙ q , e and   S ˙ q , c represent the heat source terms from evaporation and condensation, respectively.
The liquid phase is assumed to be incompressible with properties that vary with temperature, except for density. The liquid density can vary linearly with temperature in the body term of the momentum equation based on the Boussinesq approximation. The vapor is modeled as a compressible ideal gas. The tracking of the liquid–vapor interface is carried out using the VOF method [34]. This model is a numerical technique for tracing the interface between the liquid phase and the gas phase of an immiscible fluid with large particles relative to the grid size. This numerical technique can use the same momentum and energy equations for both the liquid phase and gas phase domains. In other words, it is very economical because it can share the same pressure, temperature, and velocity field in each phase. Thus, many researchers have used it, and the accuracy of the analysis has been proven. Therefore, in the present study, there are only the vapor and the liquid in the computational domain.
α l + α g = 1  
The mixing density and dynamic viscosities of liquid phase and gas phase in each calculation cell can be expressed by the equation below.
ρ = α g ρ g + ( 1   -   α g ) ρ l
μ = α g μ g + ( 1   -   α g ) μ l
The energy term (E) in Equation (2) is treated as a mass-averaged variable:
E = α g ρ g E g + α l ρ l E l α g ρ g + α l ρ l
In the VOF model, the surface tension is calculated as a volume term ( f σ ) acting on the calculation cell included in the interface. In this study, the CSF (Continuum Surface Force) model [10] is used to calculate the surface tension. A large pressure jump is formed at the interface between the liquid phase and the gas phase, and in an equilibrium state, the pressure gradient due to this pressure jump must have the same magnitude as the extra buoyancy term included in the momentum Equation (2). Therefore, the force due to the pressure gradient that appears prominently at the phase interface is expressed by the equation below.
f σ = - σ ( ( α | α | ) ) α
Therefore, it is necessary to know the vapor volume fraction in the entire computational domain. Tracking the interface between the liquid phase and the gas phase is achieved from the result of the continuity equation for the volume fraction. In an n-phase fluid system, the equation for the qth phase has the following form:
α q t + α q u q = S ˙ m , e + S ˙ m , c
When a computational cell is completely occupied with the vapor phase, α l is equal to one and vice versa. The range of volume fractions of cells in an interface fall in the range of 0 < α < 1 . S ˙ m , e and S ˙ m , c represent the liquid and vapor interface due to the evaporation of liquid and condensation of vapor.
In the present study, to express the mass interfacial exchange which controls how mass is exchanged between phases, the Ranz–Marshall model [35,36] was selected. The governing equations are solved by using the commercial CFD code FIRE [37]. It is modified to include the Ranz–Marshall model and all the thermo-physical and thermodynamic properties with respect to temperature and pressure which are taken from NIST [9]. The Nusselt number, Nu, is calculated as:
Nu = 2 . 0 + 0 . 6   Re 1 2 Pr 1 3
S ˙ m , e = C evap   C A k 1 D d Nu A i h fg ( T 1 T sat ) , T 1 T sat
  S ˙   m , c = C cond   C A k l D d Nu A i h fg ( T v T sat ) , T v T sat
where h f g is the latent heat and D d is the dispersed phase diameter. C e v a p and C c o n d are the closure coefficients for evaporation and condensation, respectively. In addition, these coefficients have a great influence on numerical stability. A i is the interfacial area density described by the equation:
A i = 6 α d D d
where α d is the dispersed phase volume fraction. There is an additional closure variable, C A , which is used to correct for the effective mass change interfacial area density. It is defined as:
C A = 1   -   α d + α min α pack   + α min
where α p a c k is the packing limit, and α m i n is the minimum volume fraction. Therefore, the energy source terms included in Equation (3) are as follows:
  S ˙   q , e =   S ˙   m , e h fg
  S ˙   q , c =   S ˙   m , c h fg
It is noted that for tuning, all the model coefficients in Equations (11)–(17) can be used to calibrate the evaporation or condensation rate at the interfacial surface. The pack limit, α p a c k can significantly influence the interfacial area, meaning that mass exchange in the cells at the interface far from the wall would be the most greatly influenced. However, in the application of interest in this study, the most important is the heat transfer between the wall and fluids.

2.3. Initial and Boundary Conditions

It is assumed that stationary saturation conditions are dominant before the heat flux is applied at the surface of the tank. The initial conditions at t = 0 are:
u ( i ,   j ) = u i = u j = 0
The initial pressure is set to atmospheric pressure and the initial temperature is considered as the hydrogen saturation temperature at that pressure (20.268 K). The initial temperature is assumed to be the same throughout the liquid and vapor.
In this study, there are three kinds of boundary conditions: symmetric conditions, adiabatic conditions and wall boundary conditions. The symmetrycondition can be applied due to the cylindrical geometry, the applied boundary conditions, and the physics of the problem. Therefore, the flow and temperature fields are numerically considered as axisymmetric.
In this study, the harsh conditions in which there is no outer tank or radiation shield are shown in Figure 1. In this study, the insulation foam at the outermost part of the tank is exposed to normal temperature and pressure with light breeze.
During self-pressurization, the LH2 tank is subjected to external forced convection with a wind velocity of 2 m/s for the entire surface of the tank.
As mentioned earlier, the outside of the liquid hydrogen storage tank of the small-scale liquefier which is the subject of this study uses MLI as an insulator; thus, an outer tank exists to create a vacuum atmosphere. However, in this case, the amount of heat ingress is very small, so it takes much computational time to evaluate the prediction performance of the numerical model and investigate the effect of the insulation thickness. Therefore, in this study, this atmospheric temperature situation, which is a more severe situation, was used as a boundary condition to simulate the case where the heat penetration proceeds more rapidly.
Therefore, on the external insulation surfaces, the Robin boundary conditions is formulated as
- k T n = q w   ,   q w = h conv ( T   -   T w )
where qw is the forced convection heat flux (=heat ingress). The characteristic temperature in this formula is the average temperature of the tank wall temperature, Tw, and wind velocity temperature, T (283.15 K). The tank inner diameter is used as the characteristic length. In this study, the convective heat transfer coefficient of the tank cylinder surface, hconv is calculated using the Churchill and Burnstein formula, which can take into account the ambient temperature and air flow [38].
However, it is known that this relation somewhat underestimates Nu in the middle Reynolds number region between 20,000 and 400,000. In the case of this study, the Re number of the flow passing through the tank cylinder surface is within this range, so the following modified equation was used [39].
Nu = 0 . 3 + 0 . 62 Re 1 / 2 Pr 1 / 3 [ 1 + ( 0 . 4 / Pr ) 2 / 3 ] 1 / 4 [ 1 + ( Re 282 , 000 ) 5 / 8 ] 4 / 5
The equilibrium heat conduction is calculated based on the tank wall temperature in Equation (19) as follows:
q cond = k ( T w   - T ) δ
where k is the insulation thermal conductivity and δ is the insulation thickness. It is assumed that with long time soaking, the external convection heat transfer gradually tends to the insulation heat conduction. Thus, q conv q cond .
The trial-and-error method is used to solve the insulation outer surface temperature [21]. The computation starts by guessing the appropriate value for initial Tw. Then qconv and qcond are computed with this guessed value of initial Tw. If both values qconv and qcond are not equal with each other, the guessed value of initial T is corrected by increasing or decreasing the guessed value. The iteration runs until both qconv and qcond are almost equal, namely, the convergence criterion ( | q conv - q cond | ( q conv + q conv ) / 2 < 0 . 5 % ) is met. More detailed information can be found in the published literature [21].
Computed with the above numerical procedure, when the insulation thickness varies from 10 mm to 30 mm, the range of hconv is 9.4~9.6 W/(m2·K), and the external surface insulation temperature ranges from 220 K to 268 K. For the top and bottom dished heads, the heat transfer correlation [40] with the flow over sphere is used. The rest of the computational procedure for obtaining the wall temperature is the same as for the cylinder tank wall.
The surfaces of inner support are assumed to be insulated and an adiabatic boundary condition is thus valid:
T n = 0
The pressure in the liquid is taken as a function of the height and density. No slip boundary conditions are imposed on the sidewalls of the tank.

2.4. Turbulence Model

Previous studies report that modeling heat exchange between the ullage gas and tank wall plays a dominant role in the prediction of thermo-fluid characteristics due to heat ingress [20,21,30,31]; thus, more attention should be paid to the fluid–wall heat transfer issue. Recently, many studies have reported that low-Re k-ε models have been successfully applied to the conjugate heat transfer region between the liquid and wall. Due to the nature of the buoyancy-driven turbulent flow inside the tank by heat ingress, a low Reynolds effect is prevalent and the basic assumption of the wall function for high Reynolds flow is no longer valid [22,30,31,41,42]. However, low Re k-ε turbulence modeling tends to have a major drawback, requiring a dense grid such that the center of the wall-adjacent cell lies within the viscous sublayer region where the first cell nearest the wall is positioned at y+ ≈ 1 [43]. Hence, it is very difficult to build near-wall grid system successfully for complex shapes.
In addition, a common drawback of low-Re turbulence models is the use of ad hoc viscous damping functions that represent wall proximity effects on turbulence and avoid kinematic wall blocking effects.
The noteworthy features of the damping functions are that they use non-linear exponential relationships [24]. As a result, numerical stiffness can be introduced, and therefore, a strong under-relaxation factor is required with the result that much computation time is required to obtain a converged solution.
Therefore, in this study, the k-ζ-f model [44] was selected as a turbulence model, considering its high accuracy and convergence stability optimized in the near-wall turbulence closure model proposed by Durbin [45]. This is a model with the same characteristics as the low-Re turbulence model. The k-ζ-f model incorporates the near-wall turbulent anisotropy and non-local pressure-strain effects by introducing the wall-normal velocity fluctuation v2 and the source term f as variables in addition to the turbulent kinetic energy and dissipation rate of the standard k-ε turbulence model. Hence, careful introduction of this kind of relaxation avoids the need for a damping function [46]. This model improves the numerical stability of the original v2-f model by solving the transport equation for the velocity scale ratio ζ = v2/k opposite to the velocity scale v2. Numerical stability is a very important factor in the low-Re version of turbulence model for predicting the buoyancy-driven turbulent flow by thermal penetration in a liquid hydrogen tank that has a turbulent flow structure with strong anisotropy.
During the evaporative process at the interface, the process of turbulent mixing between the evaporation gas and ambient gas in the LH2 tank is strongly influenced by the high gradient in thermo-physical properties and the evaporation process at the interface. A strong upward flow in both the liquid and gas regimes based on natural convection by heat penetration thickens the boundary layer, potentially leading to a highly anisotropic turbulent structure. Therefore, when considering anisotropic turbulence, the k-ζ-f model is expected to have much better predictive ability than the k-ε model. It has also been reported that the k-ζ-f model has better prediction performance than the conventional k-ε turbulence model for many engineering problems [47].
In the meantime, several researchers have investigated the prediction performance of RANS-type turbulence models, along with VOF models, for simulating the thermal and fluid characteristics in liquefied hydrogen storage containers with thermal penetration.
Kassemi [17] reported that the CFD predictions using Menter’s k-w SST turbulence model with wall functions underestimate the rate of pressure rise and thermal stratification at the ullage. Because the influence of turbulence at the interface and vapor the model misrepresents the degree of heat transfer to the ullage. They also explained that the reason the VOF- and k-e-based turbulence models underestimate the evaporation rate, pressure rise rate and thermal stratification in the tank is that they overestimate the mixing in the ullage and underestimate the turbulent dissipation rate at the free surface.
Therefore, to overcome the above-mentioned errors of the two-equation RANS turbulence models, such as k-ε and SST k-ω, in predicting thermo-physical phenomena in LH2 tanks, the k-ζ-f model is adopted in this study.

2.5. Numerical Implementation

The mass and heat transfer equations at the interface used with VOF, and the mass transfer and energy balances by evaporation and condensation are presented in the governing Equations (4)–(10). In this study, an in-house modified version of the commercial CFD code, AVL FIRE™ was used as a solver and grid generator to numerically calculate the governing Equations (11)–(14).
The liquid hydrogen storage tank geometry is modeled in a two-dimensional axial-symmetry, which could reflect the three-dimensional results while saving substantial computing resources and time. The whole computational domain is divided into hexahedron-structured grids with the near-wall region refined into the boundary layer mesh. A second-order upwind TVD (Total Variation Diminishing) scheme with Roe’s MINMOD limiter is used to discretize the convective terms. The iterative SIMPLE-like (Semi-Implicit Method for Pressure-Linked Equations) pressure–velocity coupling scheme is used to compute the pressure field. Crank–Nicolson time integration is used for time discretization with the VOF model, and the CFL (Courant–Friedrichs–Lewy) number for time step size ranges from 0.05 to 0.15. It is well known that in SIMPLE-family algorithms, the iteration convergence can be accelerated by using strong under-relaxation factors. In this study, a velocity under-relaxation factor of 0.1 and turbulence, pressure, energy and scalar under-relaxation factors of 0.2, 0.05, 0.6 and 0.8, respectively, are used for accelerating the iteration convergence and suppressing divergence.
The solution is iterated until the convergence criteria are met. When the residuals of the momentum equation, the turbulent kinetic energy and the turbulent energy dissipation rate fall below 10−6 and the energy equation residual below 10−8, it is considered to have met the convergence criteria.

2.6. Model Validation

2.6.1. Numerical Validation

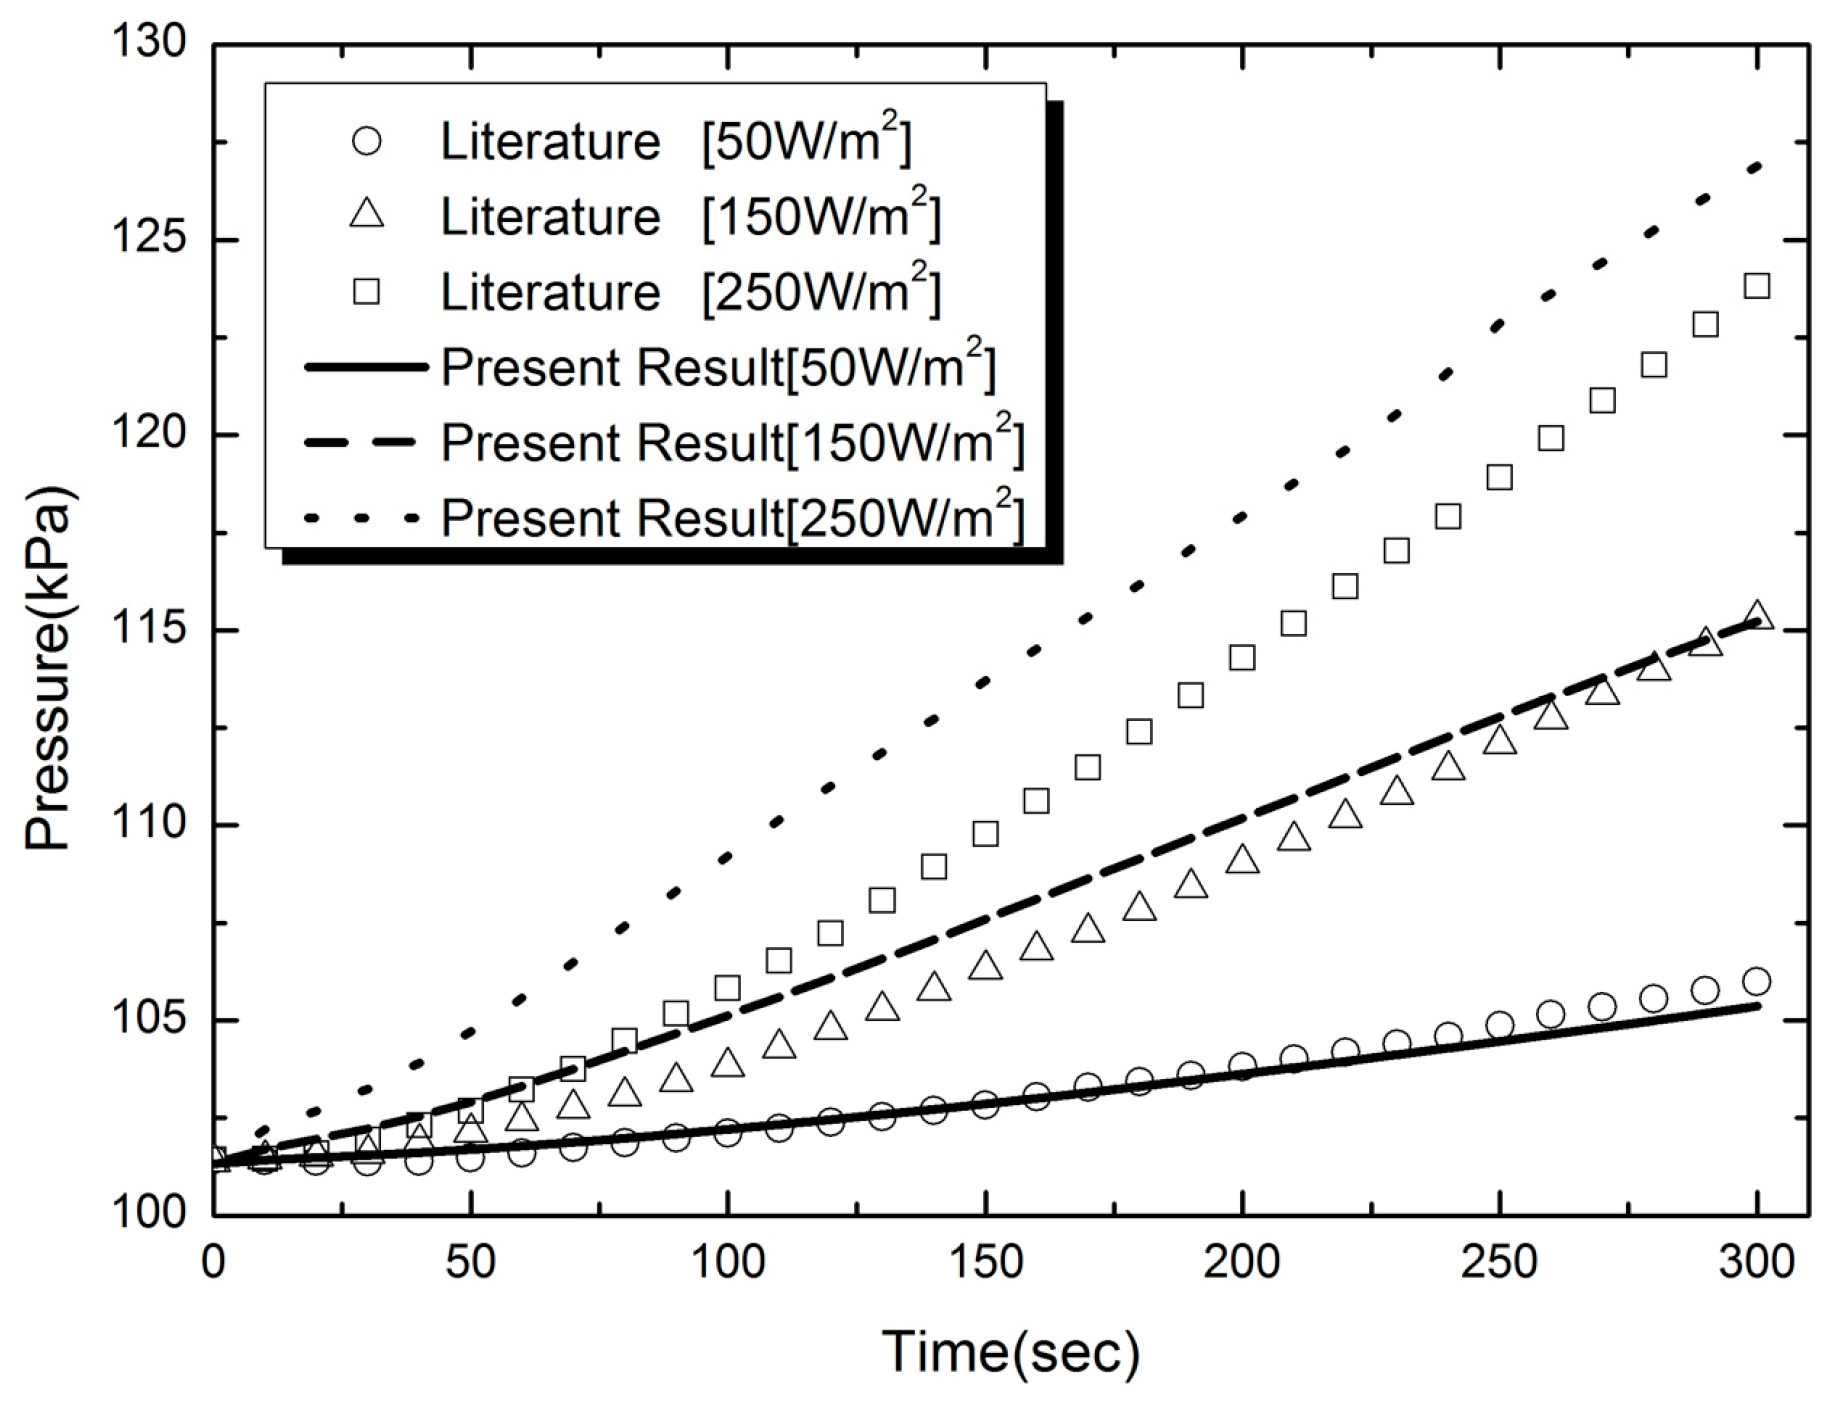
In order to verify the computational methodology and accuracy of the numerical model presented in this study, the predictions were compared with previous computational results by [20,48] for a liquid hydrogen tank. Here, a cylindrical tank with a diameter of 0.5 m and a height of 1 m was studied. It is filled with liquid hydrogen up to the level of 50%, with three constant heat flux boundary conditions of 50 W/m2, 150 W/m2 and 250 W/m2, which are imposed directly at the tank outer surface. For the description of turbulent effects in the tank, this work adopts the standard k-ε model. The initial pressure is 101.32 kPa and the temperature corresponds to the saturation value at this pressure. The comparison of the present computational results with previous results for the temporal variations in pressure in a tank for various heat ingress is presented in Figure 4. It can be seen that the tendency of the tank to be pressurized is well expressed in the case of the two models. As the heat flux increases, the maximum pressure and gradient of pressure increase both rise. It should be noted that the present numerical pressure is larger than previously reported values [20,48], particularly in the case of the higher heat leakage (150, 250 W/m2). As described above, this discrepancy is due to the fact that the turbulence models of the k-e model series underestimate the pressure rise rate and thermal stratification in the ullage in the tank. As mentioned above, a previous study [17] reported that two-equation RANS turbulence models such as k–ε and SST k-ω underpredict the pressurization rate. Hence, we could reason from the previous results and this comparison to the fact that the k-ζ-f model adopted in this study has a much better prediction capability compared with the k-ε model for predicting the impact of interfacial and vapor side turbulence on transport of heat into the ullage and self-pressurization in the cryogenic tank. The details of the merits of the k-ζ-f model used in the present study have been mentioned before, so they will not be discussed further here.
A previous study [49] reported that the analysis results using a standard k-ε turbulence model with a wall function showed that the Nu was underestimated when inputting the temperature difference into both sides in a closed square space similar to this study. Therefore, the previous study results based on the standard k-ε turbulence model and wall function [20,48] underestimated the thermal stratification in the ullage due to heat flux from the wall, thereby predicting a low self-pressurization. In contrast, in this study, calculating the eddy viscosity near the wall can effectively gauge the anisotropic effect of speed change near the wall by using v 2 ¯ , an equation without a wall function. Therefore, accurate prediction performance is expected in a flow where strong buoyancy is dominant [50,51].
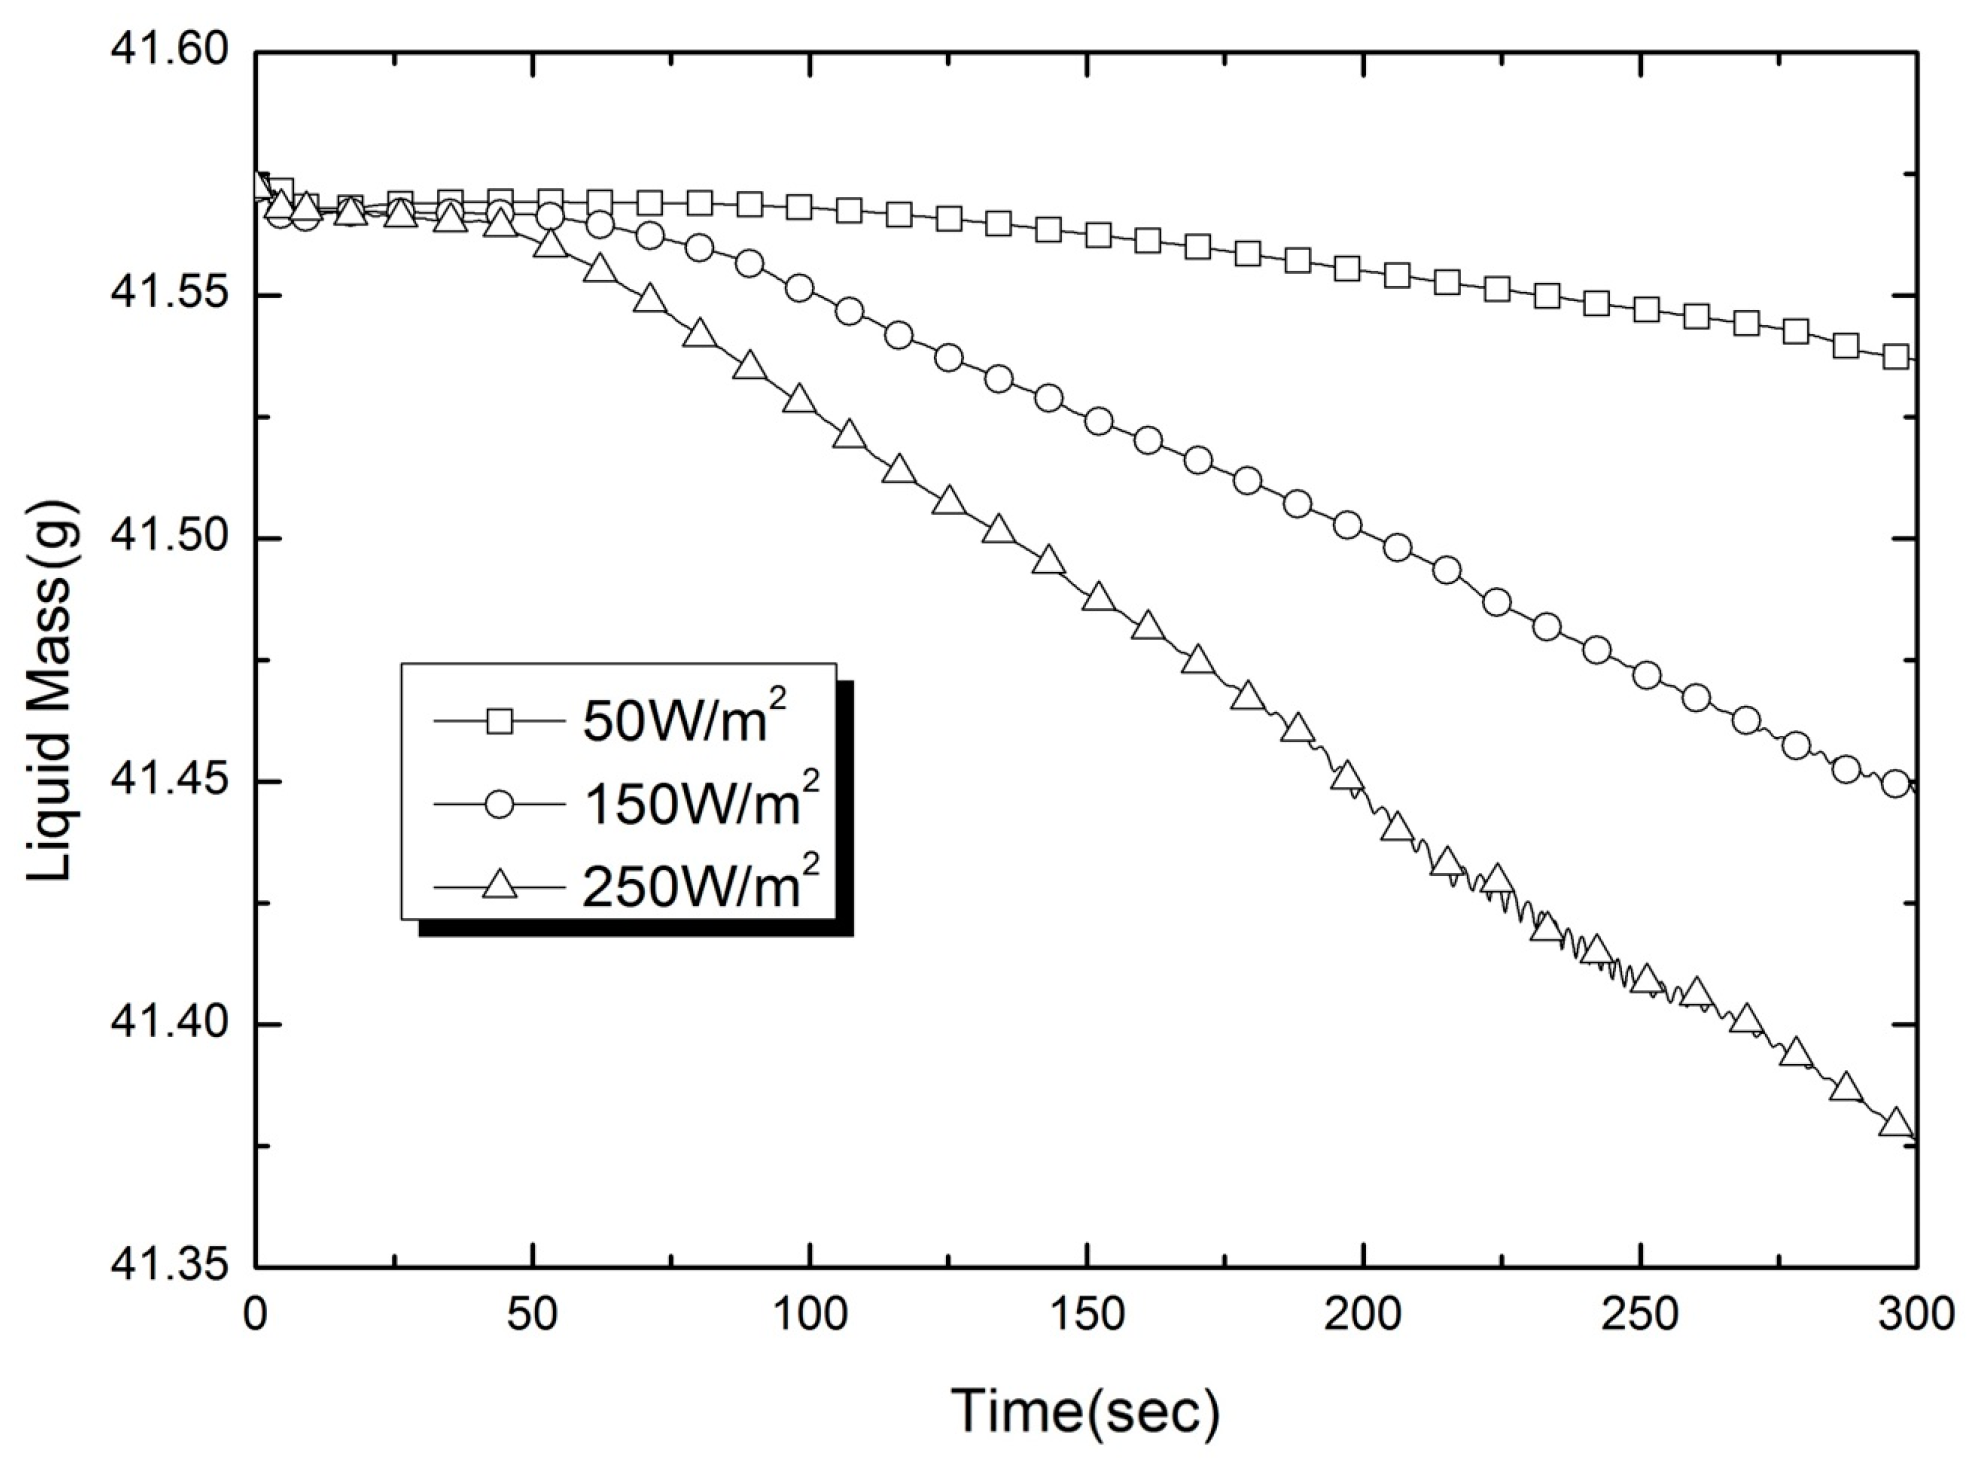
However, the prediction for the low heat-leakage case (50 W/m2) is observed to be in better agreement with the previous data [48], with an average error about 1% but locally somewhat higher. Figure 5 shows a comparison of the liquid mass amounts left in the tank with time for various uniform wall heat fluxes. In comparison with Figure 5, there is a marginal evaporation period due to a coupling between the buoyancy force and convective cooling. After this period, vigorous evaporation occurs and the pressure starts to rise gradually. As heat penetration increases, the delay before evaporation begins becomes shorter, and after evaporation begins, the rate of pressure and evaporation rise steepens. Since this physical phenomenon is well-known from previous study results [17,20,48], the analysis model developed in this study can physically validate the pressure behavior caused by evaporation in the tank according to the amount of heat ingress coming from outside.

2.6.2. Experimental Validation

In this study, AS-203 flight experiment [51] results were used for the second verification of the numerical model. The main purpose of AS-203 was to investigate how the fuel in the tank of the second stage rocket S-IVB reacts to low gravity conditions. Based on the results of the existing Saturn AS-203 test flight, the phenomenon of pressurization of the inside of the tank due to propellant boil-off caused by external heat penetration was simulated. Approximately 160 g of LH2 remained in the tank at the beginning of this part of the experiment, and the tank pressure was 85.5 kPa. The analysis of this LH2 tank experiment using the CFD model included several simplifications. First of all, it was assumed that a constant gravity level of 1.0 × 10⁻⁴ g was used during the entire simulation period, and that the incoming heat flux from each part of the tank was uniformly introduced over the entire tank surface, with a uniform heat flux of 40 kW.
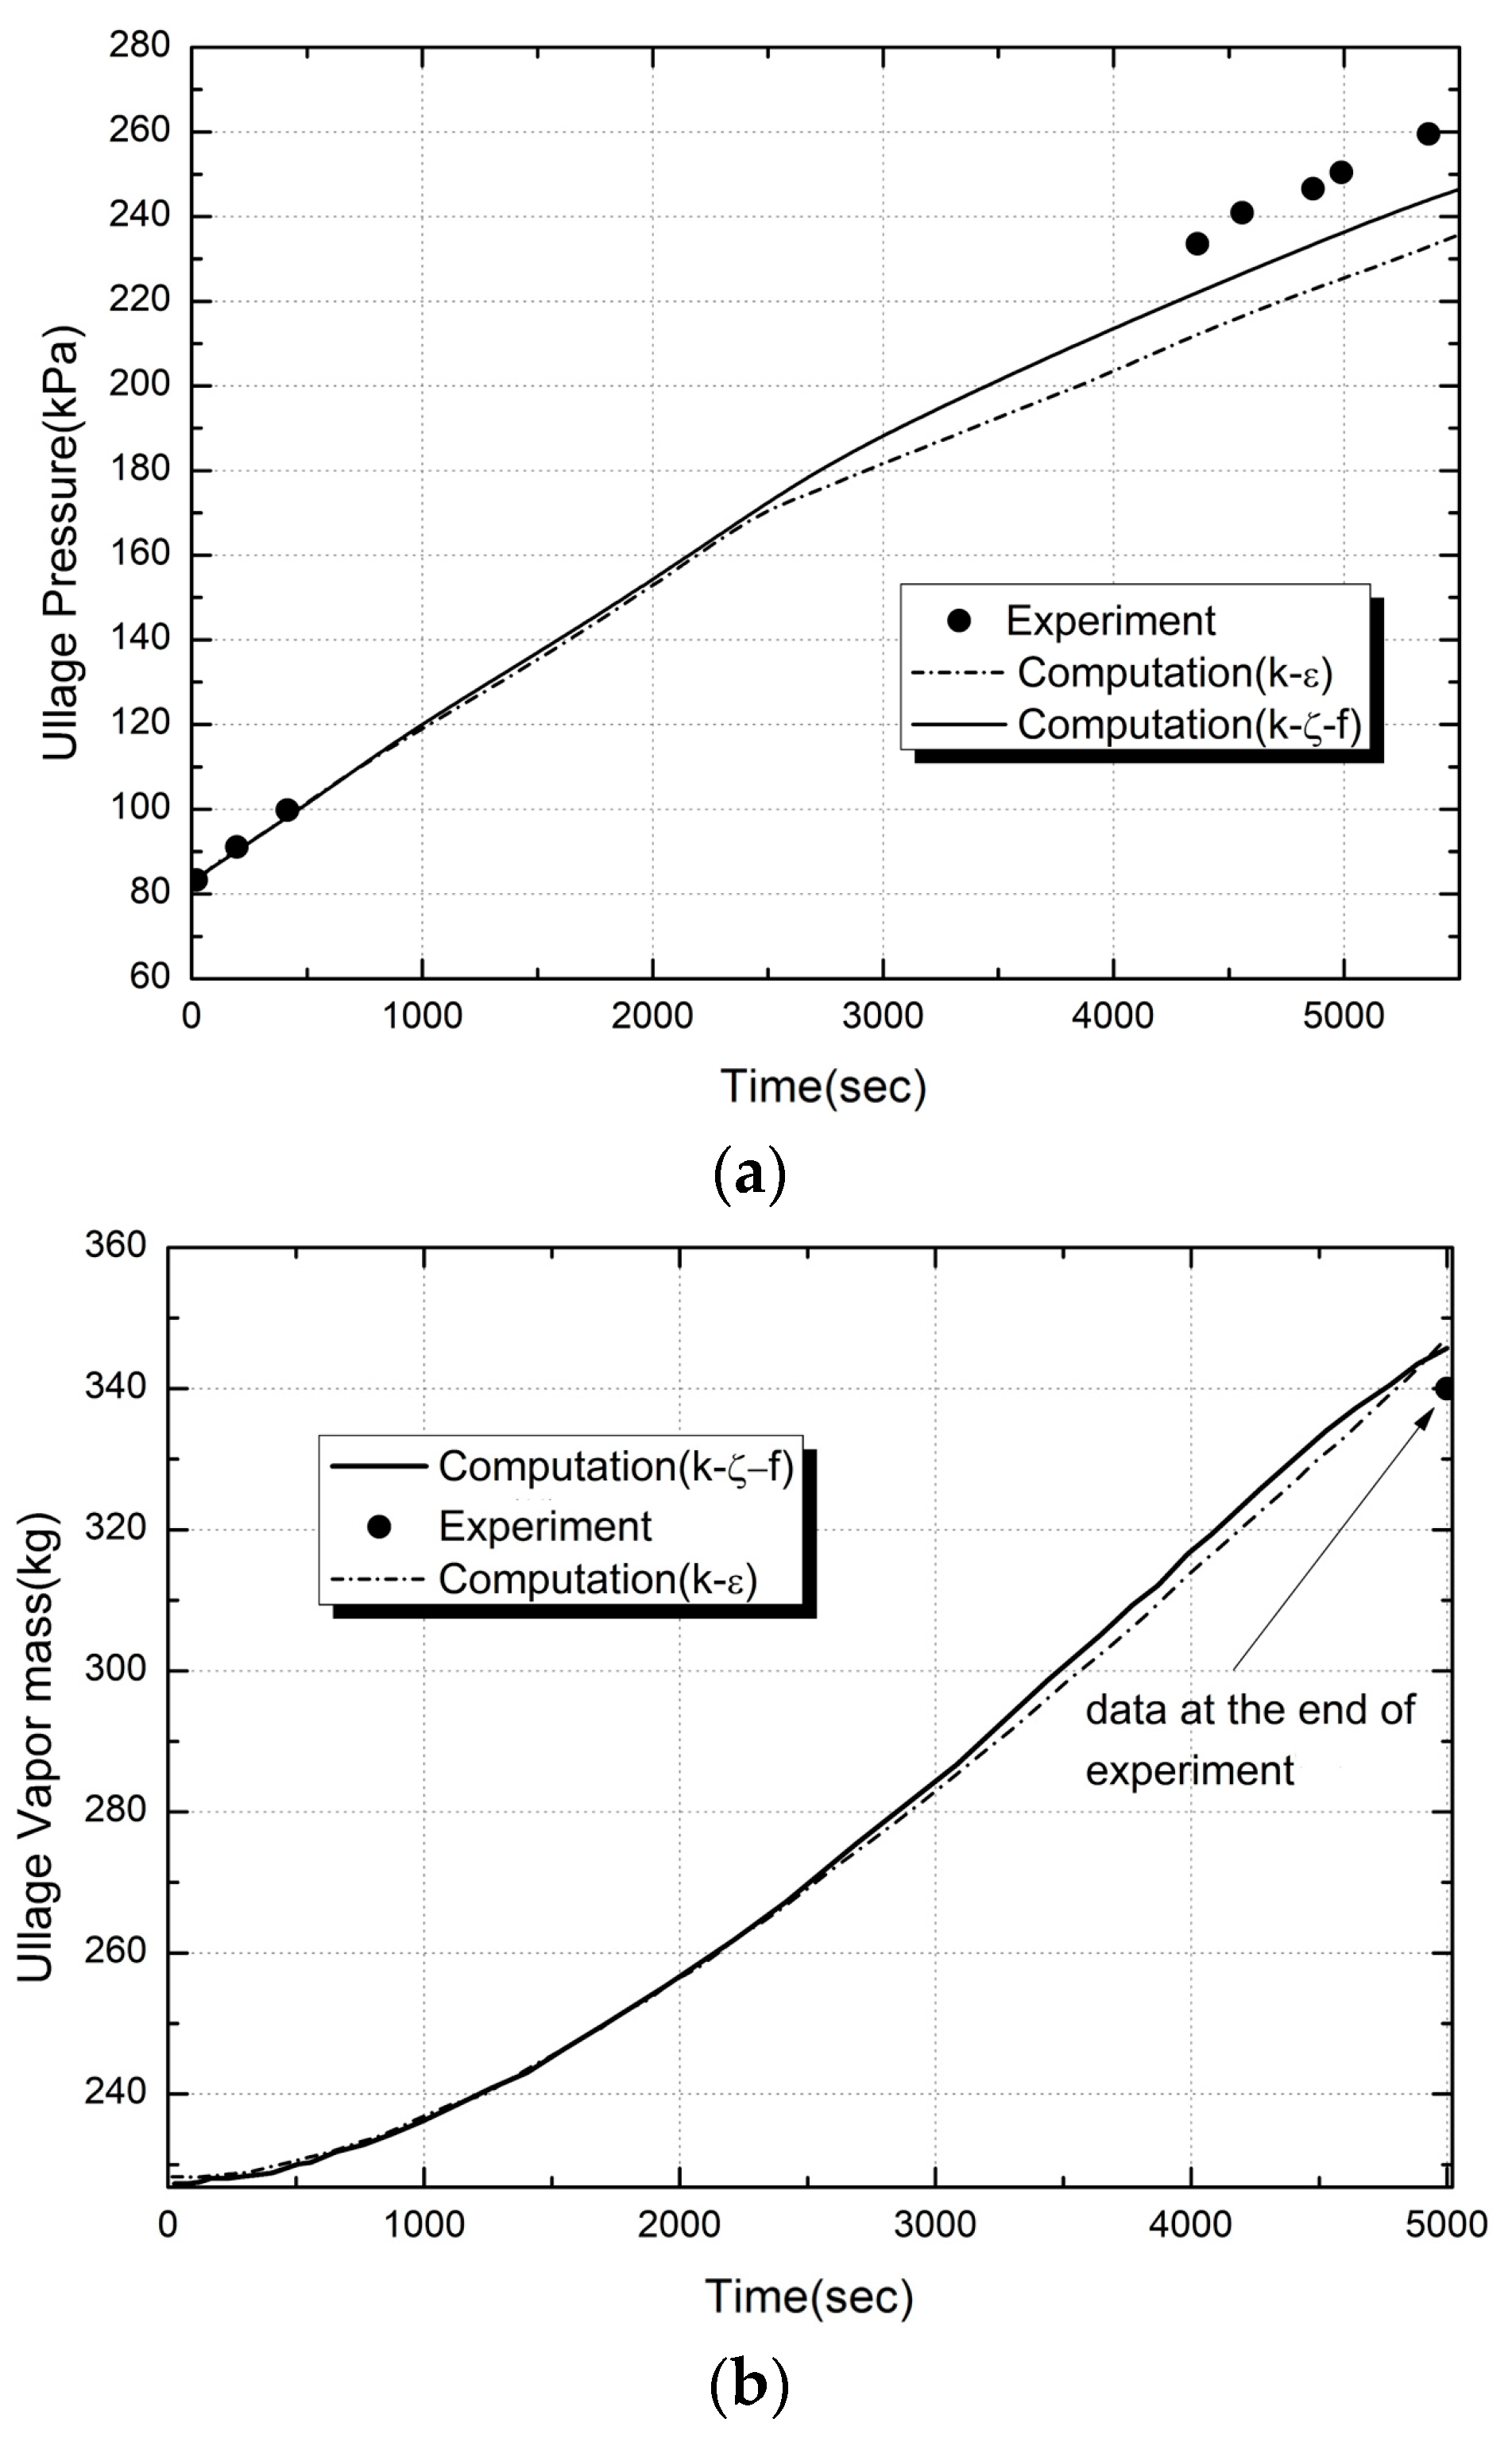
The experimental ullage pressure histories from Ref. [51] are given in Figure 6a with the CFD model prediction overlaid for the k-ε and k-ζ-f turbulence models. It can be clearly seen that the two turbulence models have a tendency to underpredict the experimental pressurization rate, but the calculation results obtained by the k-ζ-f turbulence model are in better agreement with the experimental data [51]. It is interesting to note that after t = 2500 s, there is still a growing discrepancy between the slope of the measured and calculated pressure rises. This lack of agreement may be due to the imposition of a constant heat flux boundary condition, the assumption of continuity in the turbulence quantities across the interface by the VOF model, or inadequacies associated with turbulence models in the region of ullage. In addition, this could be also due to the fact that the k-ε model series underestimates the pressure rise rate and thermal stratification in the ullage in the tank [17].
The pressure error at the end of the experiment compared with simulation with the k-ζ-f turbulence model is approximately 6%, which can be considered as good given the simplified boundary conditions and assumptions. On the other hand, the prediction error of the k-ε turbulence model at the end of the experiment is 10.34% for tank pressurization. This large discrepancy between the two turbulence models is closely related to the fact that they do not adequately reflect the non-uniform wall shear stress caused by buoyancy, although it is closely related to the local flow structure and the turbulent quantities which influence the actual heat transfer phenomenon. These limitations arise because many RANS turbulence models are built on the concept of isotropic eddy viscosity. However, it can be observed that the predictions by the k-ζ-f model adopted in this study show better accuracy because the introduction of the velocity scale v2 causes the V2F k-ε turbulence model to reflect the effect of anisotropy on the velocity fluctuation near the wall.
Figure 6b shows a comparison of the evolution of the ullage vapor mass for experimental data [22] and the numerical predictions of the two turbulence models. As shown in the figure, the temporal variations in evaporative vapor mass curves for the ullage show a rather short initial transient period, resulting in an almost exponential rate of vapor mass increase as time elapses. It was found that the two turbulence models indicate that net interfacial mass transfer essentially evaporates throughout the test run. The increased rates of vapor mass to which the two turbulence models were applied did not show a significant difference. The difference between the experimental data and the k-ε turbulence model at the end of the experiment was on the higher side (2.1%), while the predicted result with the k-ζ-f turbulence model was higher by 1.7%. By comparing the temporal variations in the mass transfer rate and pressure rise results by evaporation using two different turbulence models, it can be observed that the underestimation of pressure rise by the k-e model is not due to misrepresentation in the evaporation rate at the interface. It can be clearly seen that the reason is more predominantly due to miscalculation of the influence of the turbulence effect at the interface and ullage on the heat transfer to the ullage [30,31]. It could be also noted that the prediction of pressurization rate is more sensitive to eddy viscosity formulation and near-wall treatment of the turbulence model than prediction of the interfacial mass transfer.

3. Results and Discussion

A calibrated three-dimensional CFD model is built to investigate the influence of insulation thickness on the temporal evolution of the complex thermo-fluid characteristics of liquid and vapor in a liquid hydrogen (LH2) tank. The pressure change and thermo-fluid characteristics in a partially filled liquid hydrogen storage tank, subject to ambient conditions with wind blowing, has been investigated numerically. The simulation results from the analyses are discussed below.

Thermo-Fluid Characteristics in the Tank

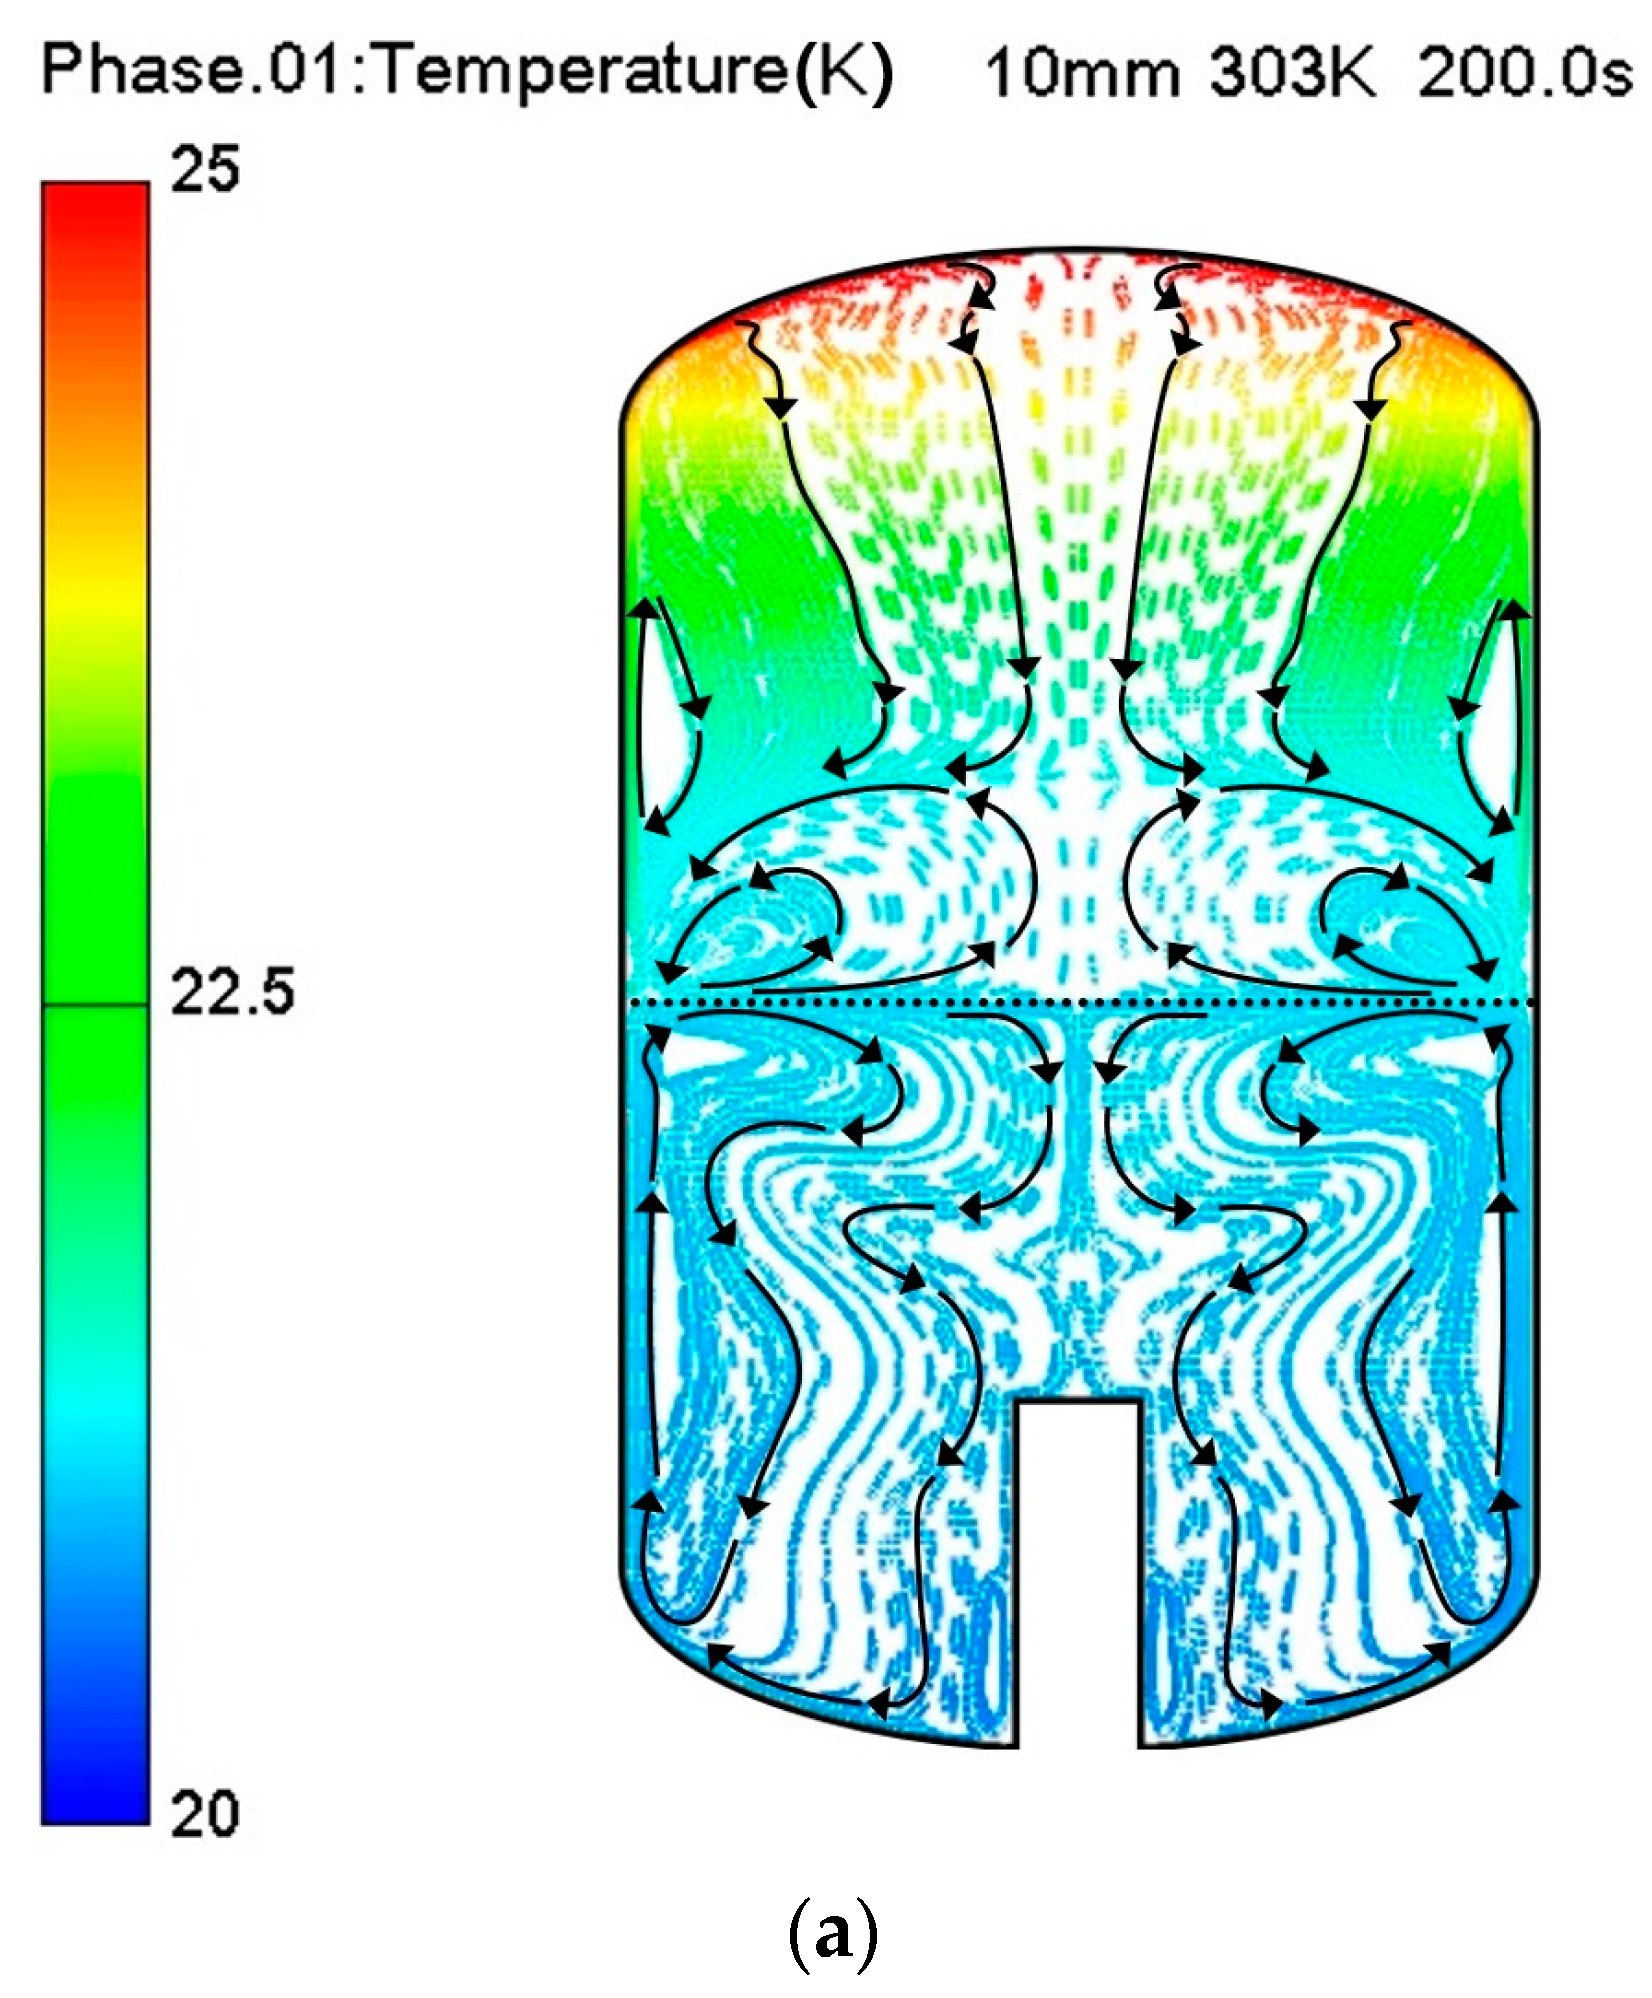
Figure 7 shows the streamlines and temperature distribution of liquid and vapor formed inside the tank with an insulation thickness of 200 s. An area of insulation material is omitted in the figure to more clearly detail the heat and flow characteristics caused by thermal penetration into the tank.
Observing Figure 7, it can be seen that the important physical phenomena that make up thermal stratification are well represented in succession. That is, when thermal leakage penetrates the tank, the heat load is mainly used to increase the tank pressure by gas expansion, thereby increasing the liquid temperature, and causing a phase change. Initially, the liquid close to the walls is heated by the heat input. Afterwards, the hot liquid near the heated wall moves upward under the influence of upward buoyancy-driven flow, mixes with the cold liquid near the interface, cools down, and eventually flows downward in the central area of the tank. As this process proceeds iteratively, it can be seen that increasingly warmer liquid accumulates at the liquid–vapor interface [28] and provides a warmer liquid layer along the axial direction, illustrating the progress of thermal stratification. In the liquid region, the heat conducted through the insulation from the sidewall is transferred into the thermal boundary layer near the wall, and some of the heat-inflated fluid forms an upward jet flow due to buoyance, flowing upward before being cooled near the free surface. It then moves to the central axis of the tank and becomes dense, ultimately descending to form a pair of recirculation zones near each side walls. A noteworthy feature of this study is that the descending flow at the central axis shows a radially distorted streamline and wake flow due to the existence of the cylindrical support groove. At this time, when the insulation thickness was thin (10 mm) and where heat flux flowed excessively to the wall due to thin insulation, a weak and slow downward flow which was not sufficiently cooled formed a highly curved streamline and large recirculation zone before the support groove. Meanwhile, in the case of (b) and (c), where the heat flux flowing into the liquid phase was relatively small due to the thick insulation, a stronger downward flow existed. In addition, a pair of vortices was formed before the support groove, which made the flow stagnant. The stagnant flow due to the support groove prevents the mixing of the cooled downflow with the hot fluid near the wall, which can cause a non-uniform temperature distribution in the liquid phase, and especially increases the temperature near the wall, eventually increasing the amount of boil-off. In particular, in the case of a 10 mm insulation thickness with a large heat ingress, a downward flow with low momentum is created due to insufficient cooling on the free surface, resulting in a wide stagnation region in front of the support groove. This can be considered as a dead zone because mixing with hot fluid is impossible in this region. Moreover, the rapidly rising flow near the wall caused fast flow at the liquid–vapor interface and accelerated vaporization.
Since the gaseous hydrogen evaporated from the interface moved to the central axis when heated on the liquid surface, the liquid hydrogen had the highest temperature at the center of the free surface. As a result, some of it moved to the vortex side and descended, while some other portion vaporized and ascended along the central axis. Therefore, most of the external heat ingress accumulates under the top dished head. Particularly, as shown in Figure 7a, with a very thin insulation thickness (10 mm), it can be observed that a very strong thermal accumulation is obvious in the vapor region, resulting in the highest temperature in the top dished head because of natural convection. A large recirculation area exists near the free surface since the upward vapor flow generated by the strong heat energy supplied from the free surface of the liquid side is hindered by heat accumulation in the top dished head.
In the case of Figure 7b,c, the penetrating heat leakage was small, so the vapor rising after evaporation became sufficiently cooled, forming a stable downward flow along both the walls and center, and descended toward the free surface. Therefore, the recirculation area above the free surface was reduced. In the case of Figure 7c, the amount of heat flowing into the tank was smaller, so it could not evaporate upward from the center of the liquid–vapor interface but evaporated from around the wall where the thermal boundary layer existed.
As the gas rose upward and a weak thermal stratification region existed at the tank top, a pair of vortices were formed and became stagnant in this region. A downward flow occurred at the wall because the temperature where the vortex occurred was higher than that at the thermal boundary layer. Therefore, a pair of vortices also formed on the gaseous wall surface. Since the amount of thermal accumulation at the tank top increased as the insulation became thinner, a strong temperature gradient was formed. The heated and uprising vapor could not move to the tank top, leading to the formation of a pair of vortices on the liquid–vapor interface.
Additionally, as the thickness of the insulation decreases, more thermal energy is introduced into the tank, forming a strong buoyancy-driven force, allowing fully developed natural convection to occur in both the liquid and vapor domains. This improves the heat transfer rate by natural convection in each phase and the heat transfer from the free surface to the ullage by turbulence, resulting in faster heat transfer from the steam and interface.
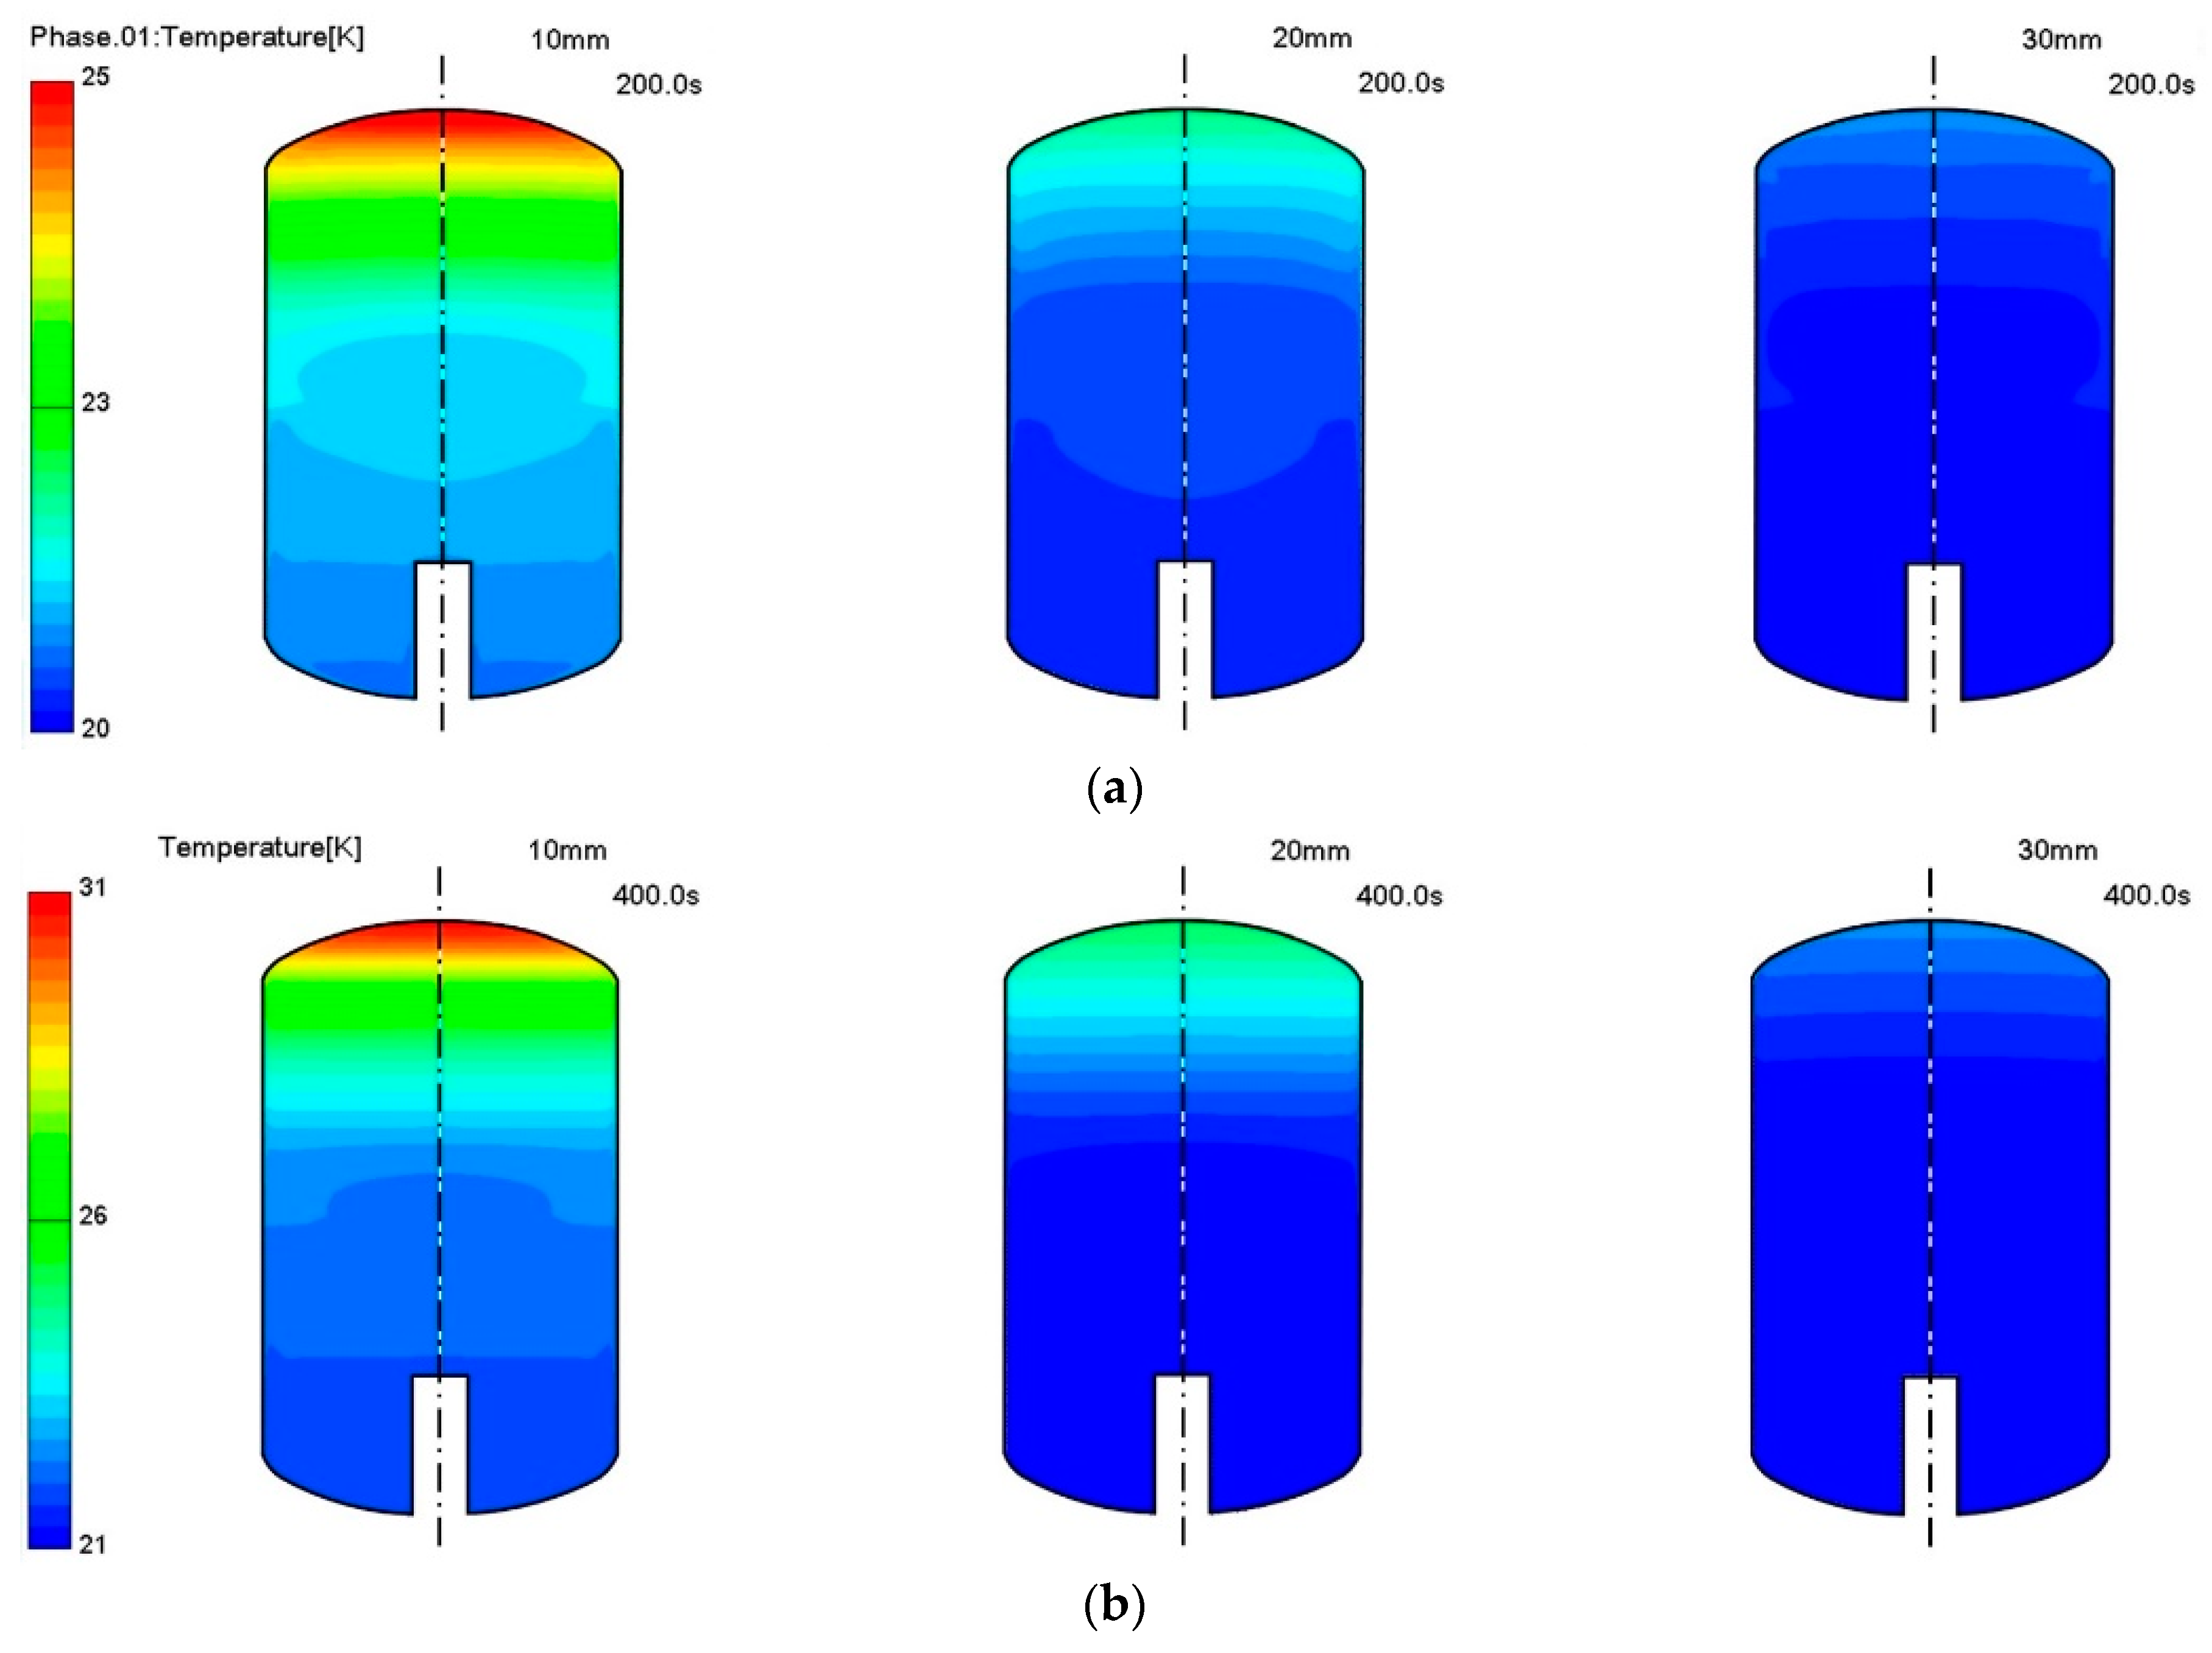
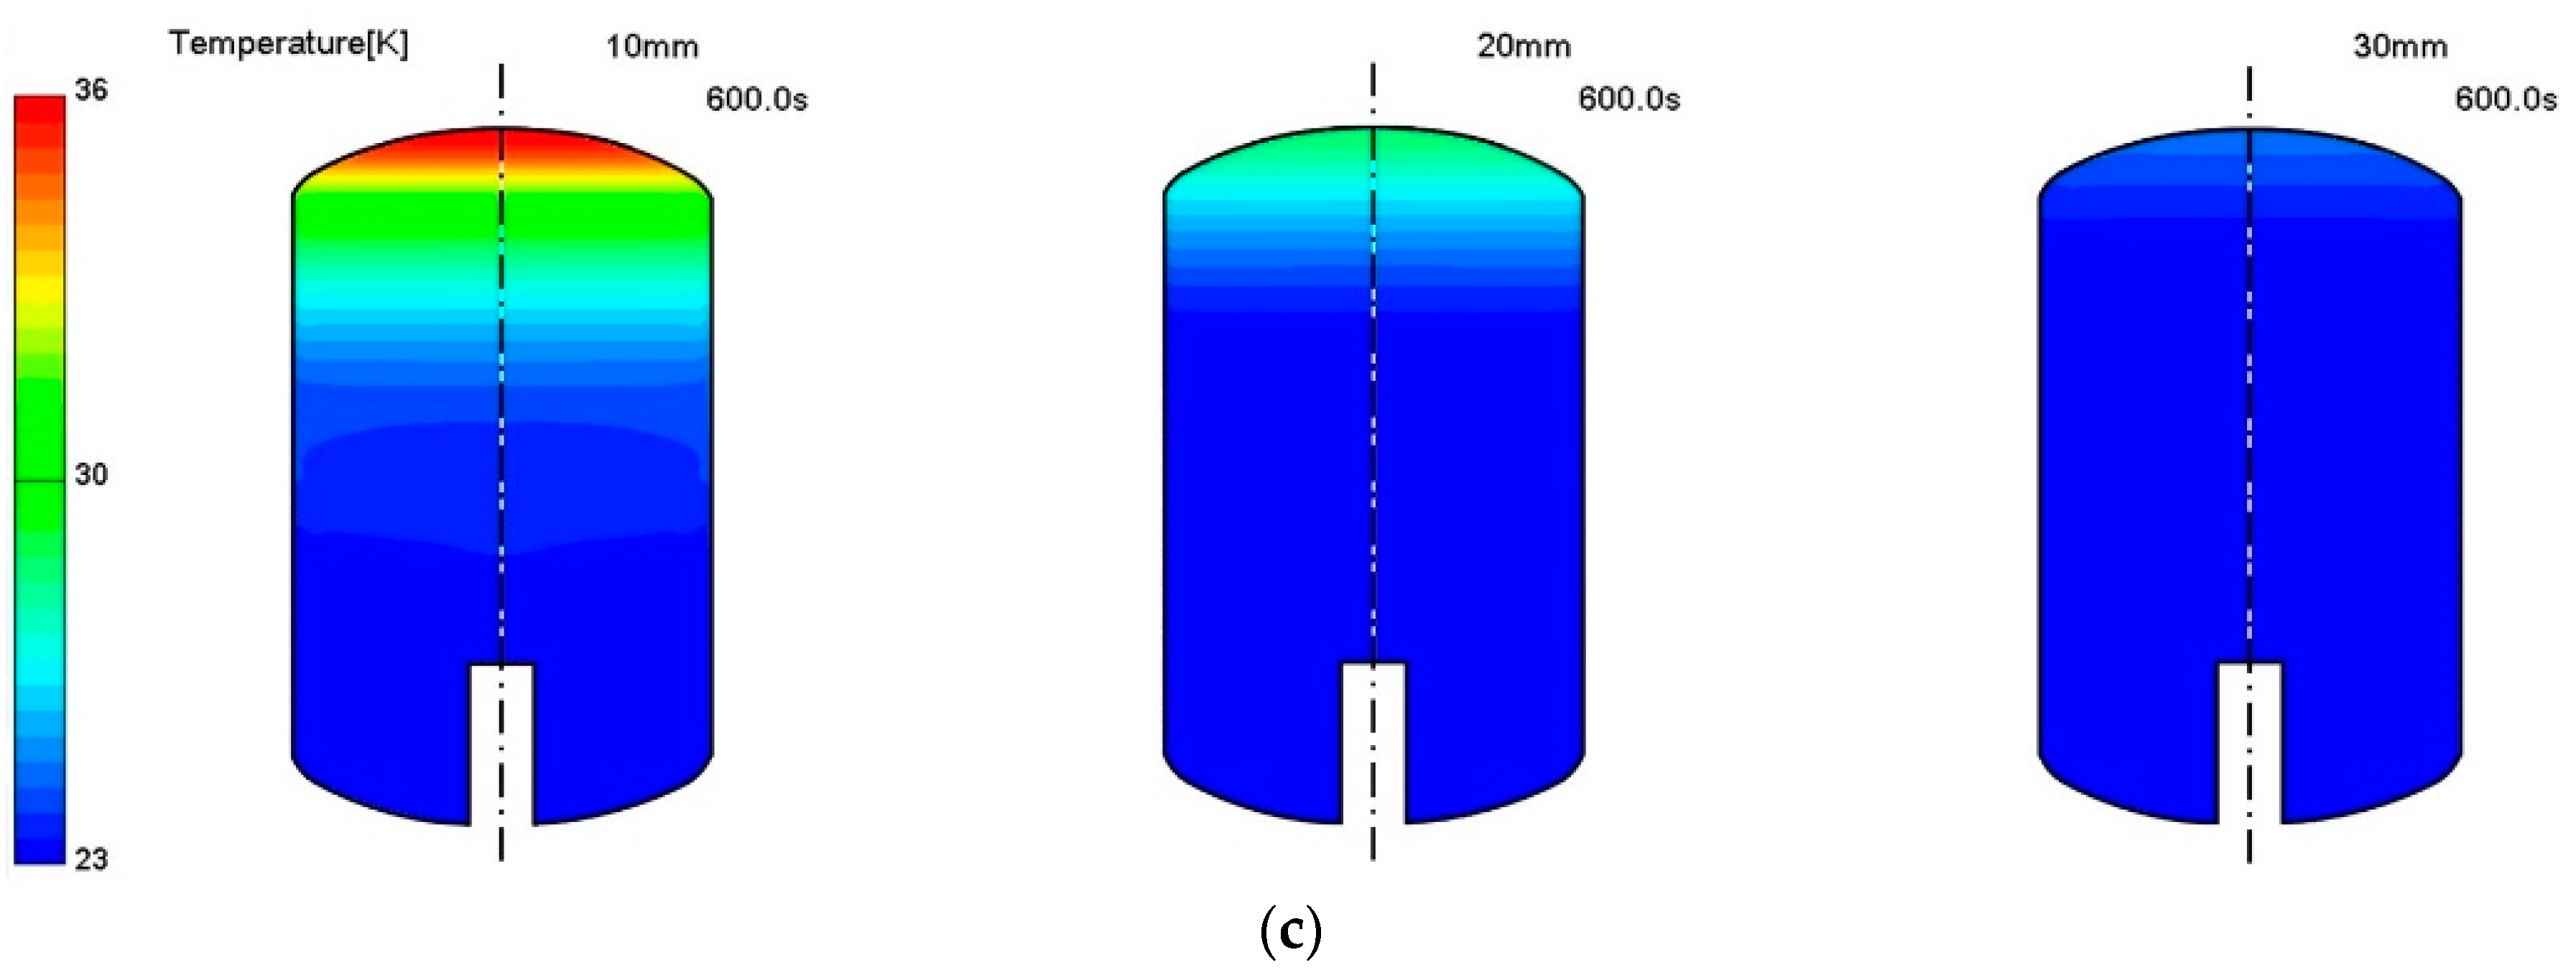
Figure 8 shows the thermal fields formed inside the tank when three different insulation thicknesses were applied at 200 s, 400 s, and 800 s. As in the case of Figure 7, the figure shows the calculation results for the tank wall surface and inner area, excluding the insulating material area. A comprehensive analysis of the above results, in terms of temperature gradient in the liquid region inside the tank, showed that a radial temperature gradient gradually decreased with time starting from the heat leakage, but an axial temperature gradient was strongly formed. It can be observed that the existence of the mixing dead zone due to the support groove intensifies the radial temperature gradient. In the case of a 10 mm insulation thickness with a large heat ingress into the tank, a large stagnant region exists in front of the support groove, so the radial temperature gradient in this region can be confirmed even at 600 s, which means that the temperature mixing proceeds very slowly. Therefore, in the future, a study on optimizing the shape of the support groove, which can minimize flow interference, will be conducted. In addition, the amount of heat accumulation in the vapor region increased with time at the tank top due to rising vapor evaporated at the liquid–vapor interface and expanded vapor near the wall surface, both causing a sharp temperature gradient near the tank top. This phenomenon became more evident as the insulating thickness was thinner and the heat leak was large. In the case of the insulating thickness of 1 0 mm, a strong buoyancy-induced flow occurred at the liquid–wall surface and transferred heat to the interfacial surface since it had the most significant heat leak. The radial temperature gradient by flow pattern, which was cooled at the central axis and flowed down, was large at 200 s and 400 s near the liquid–vapor interface. This result confirms that a thermal stratified layer was well developed.
As it progressed further, the radial temperature gradient was considerably alleviated. In contrast, with the thicker insulation of 20 mm and 30 mm, the thermal penetration was slight, and a weaker radial temperature gradient occurred compared with that formed with 10 mm insulation. In the case of vapor, as explained before, a sharp and dense temperature gradient is created at the tank top dished head due to thermal accumulation as the insulating thickness decreases. In the case of the insulating thickness of 10 mm at 400 s and 800 s, the thermal accumulation of the tank top was enormously increased, which caused liquid to directly evaporate at the interface.
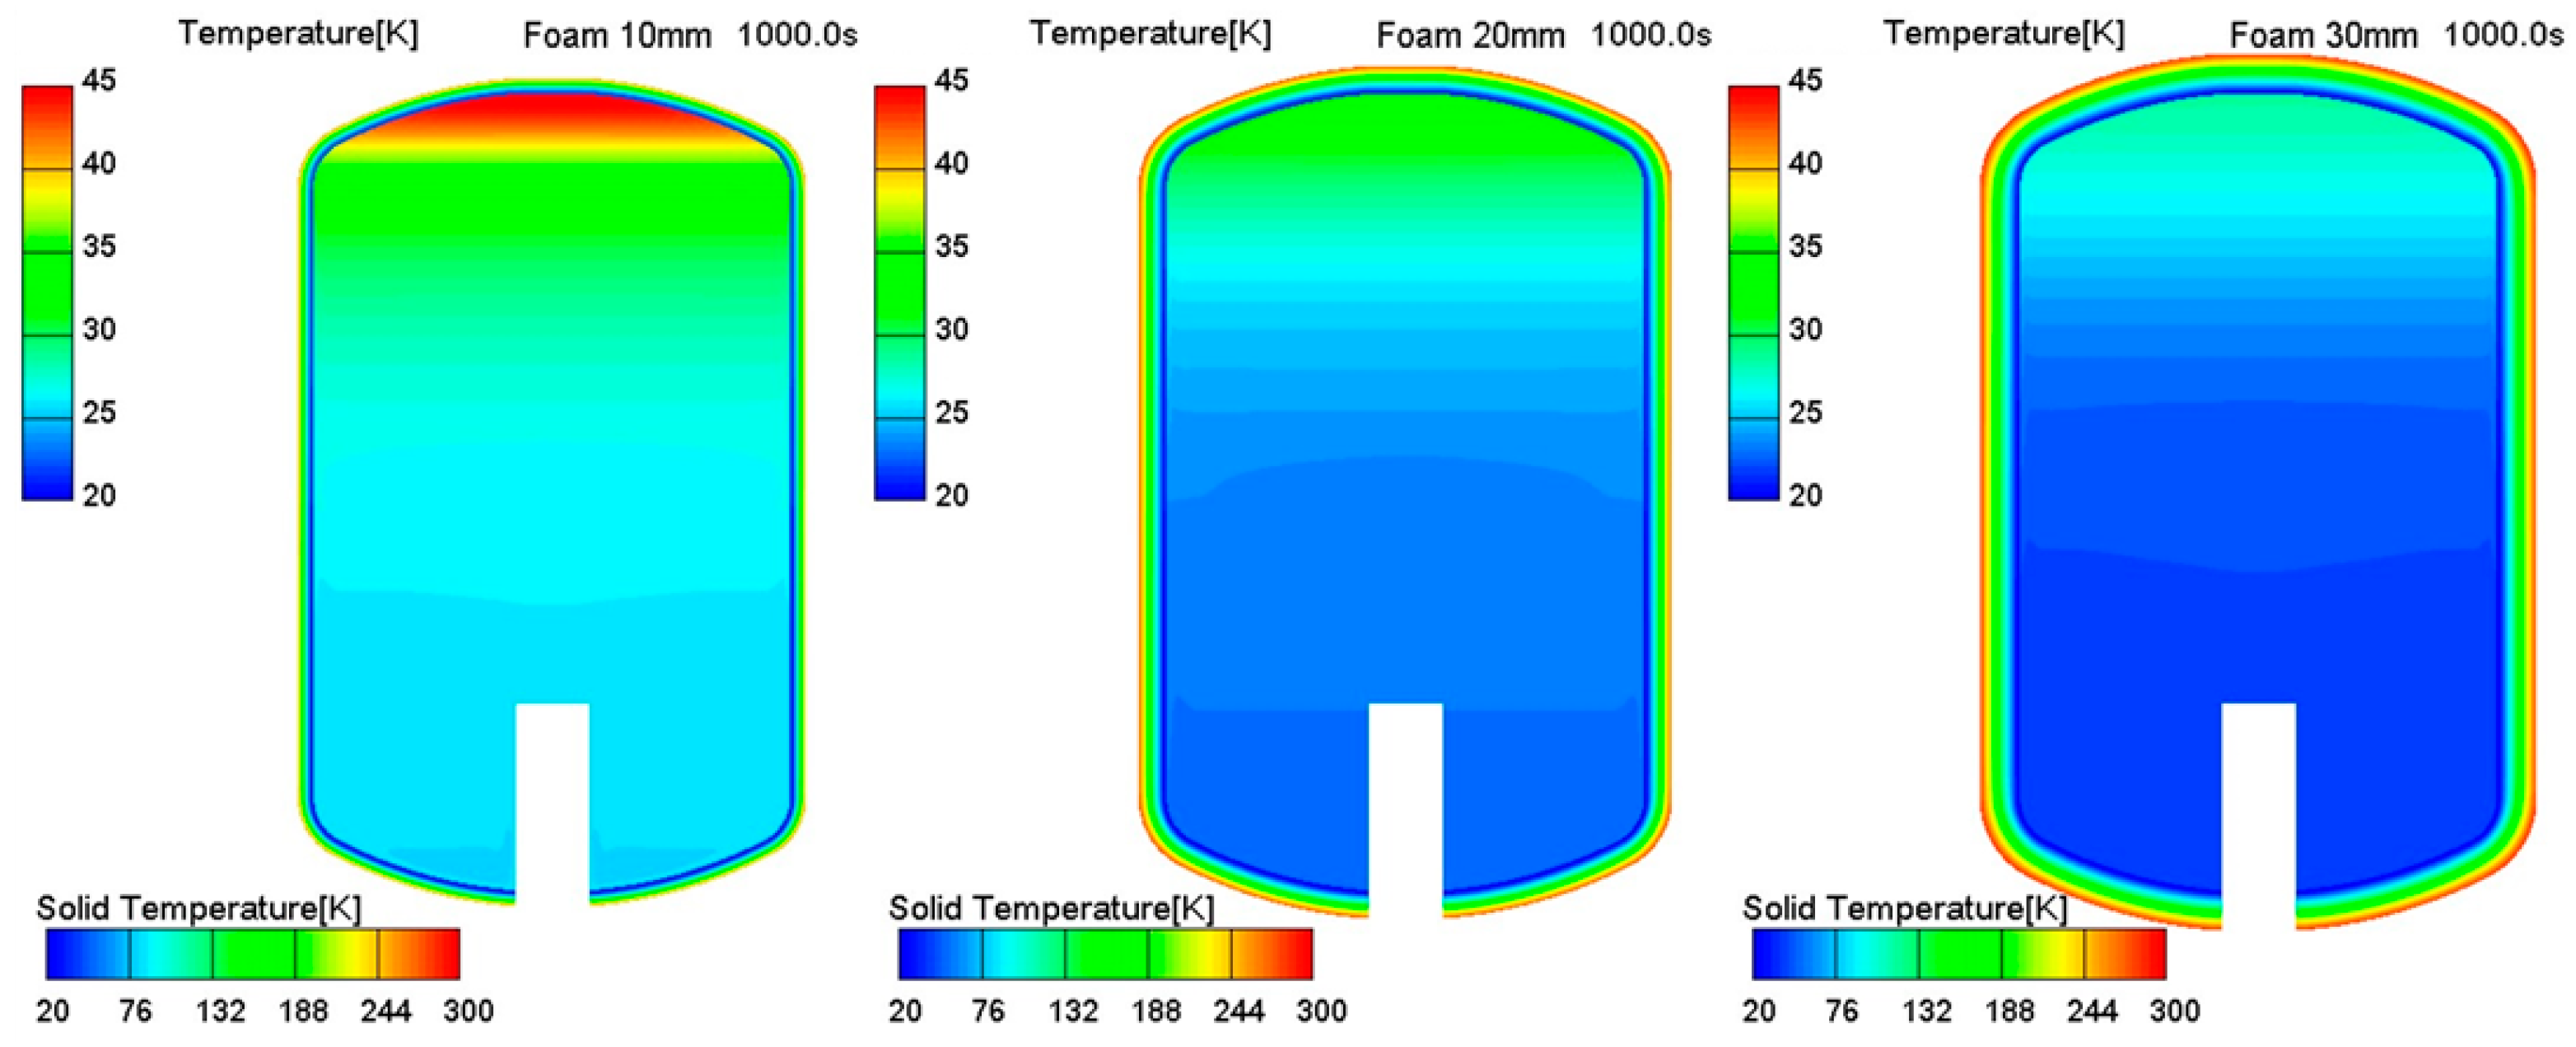
By observing Figure 8, it can be also deduced that as most of the penetrated thermal energy is driven under the buoyancy force and accumulates on the top of the tank, the heat transfer capacity from the vapor to the interface that contributes to thermal stratification is reduced. Therefore, the thermal energy contributing to the thermal stratification of the liquid phase from the ullage is reduced. Figure 9 shows the temperature distribution for the three insulation thicknesses, including the insulation mat, at t = 1000 s. Since the temperature scales distributed inside the tank and insulation materials were quite different, each scale is indicated differently. The results indicate that the insulation thickness has a dominant effect on the axial temperature gradient, which is due to the difference in the degree of energy mixing resulting from the buoyancy force in the liquid and gas phases. It is evident from Figure 9 that the presence of a constant heat flux on the surface of the insulation raises the temperature inside insulation, thereby increasing the conductive heat flux passing through the insulator, eventually increasing the heat ingress.
In further detail, it can be confirmed that there is a close relationship between heat leakage and the rise in the surface temperature of the insulation. A substantial temperature gradient formed in the insulation material due to the conductive heat flux passing through it. At a thickness of 10 mm, with a significant thermal penetration due its small thermal capacitance, a high thermal accumulation and a high-temperature gradient were observed near the tank top. In contrast, in the case of the thick insulation material of 30 mm which has a high thermal capacitance, the radial temperature gradient at the tank top was greatly alleviated. Heat diffusion significantly progressed at 1000 s, developing an axial temperature gradient more clearly than a radial temperature gradient.
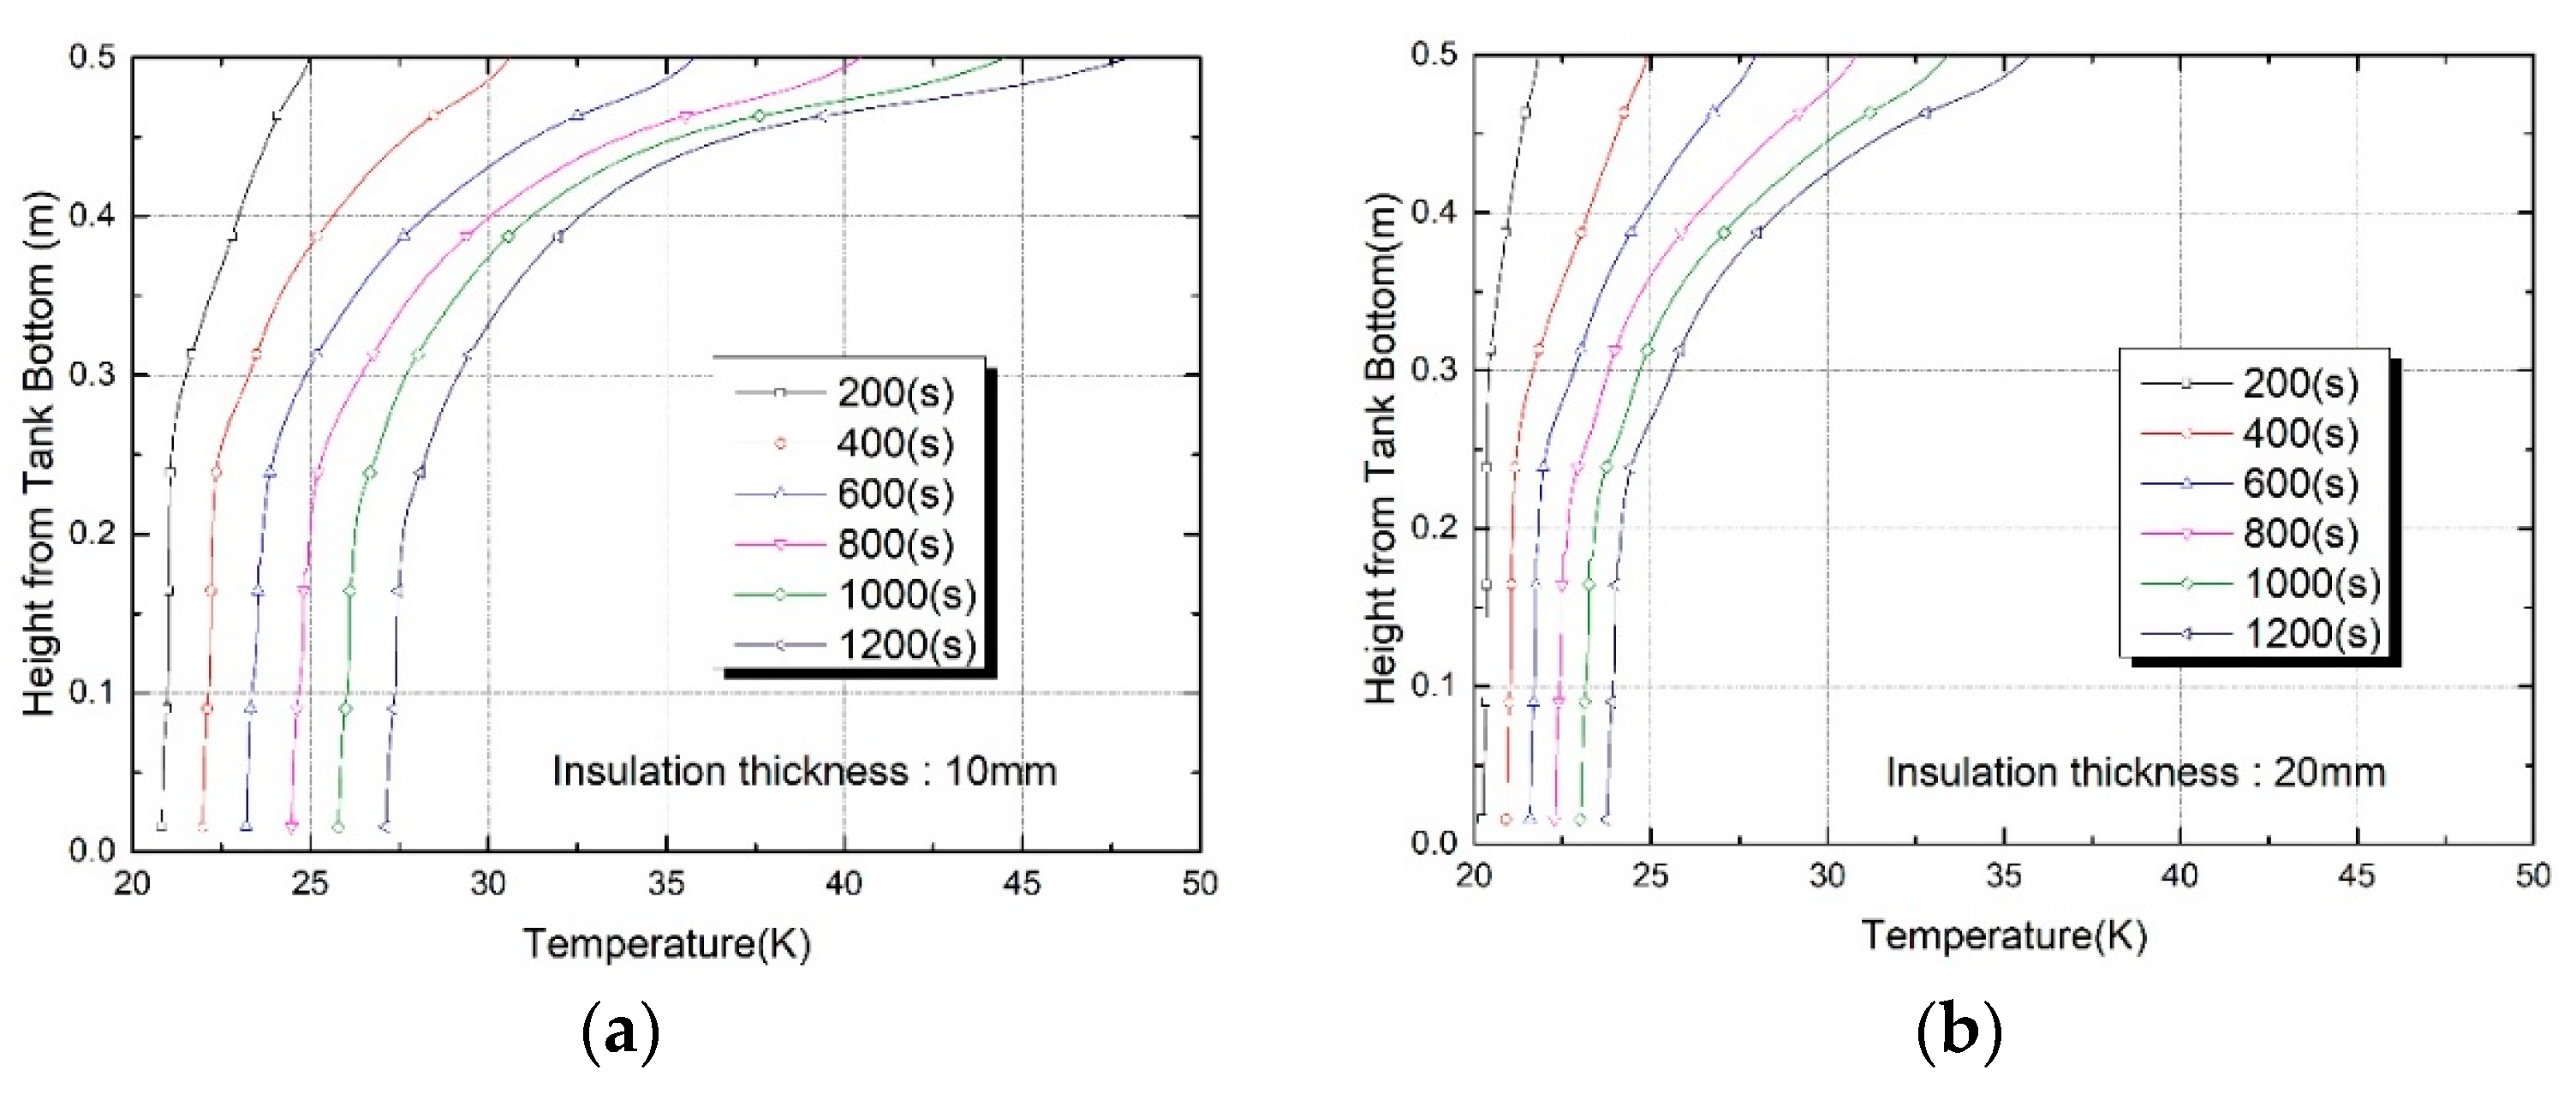
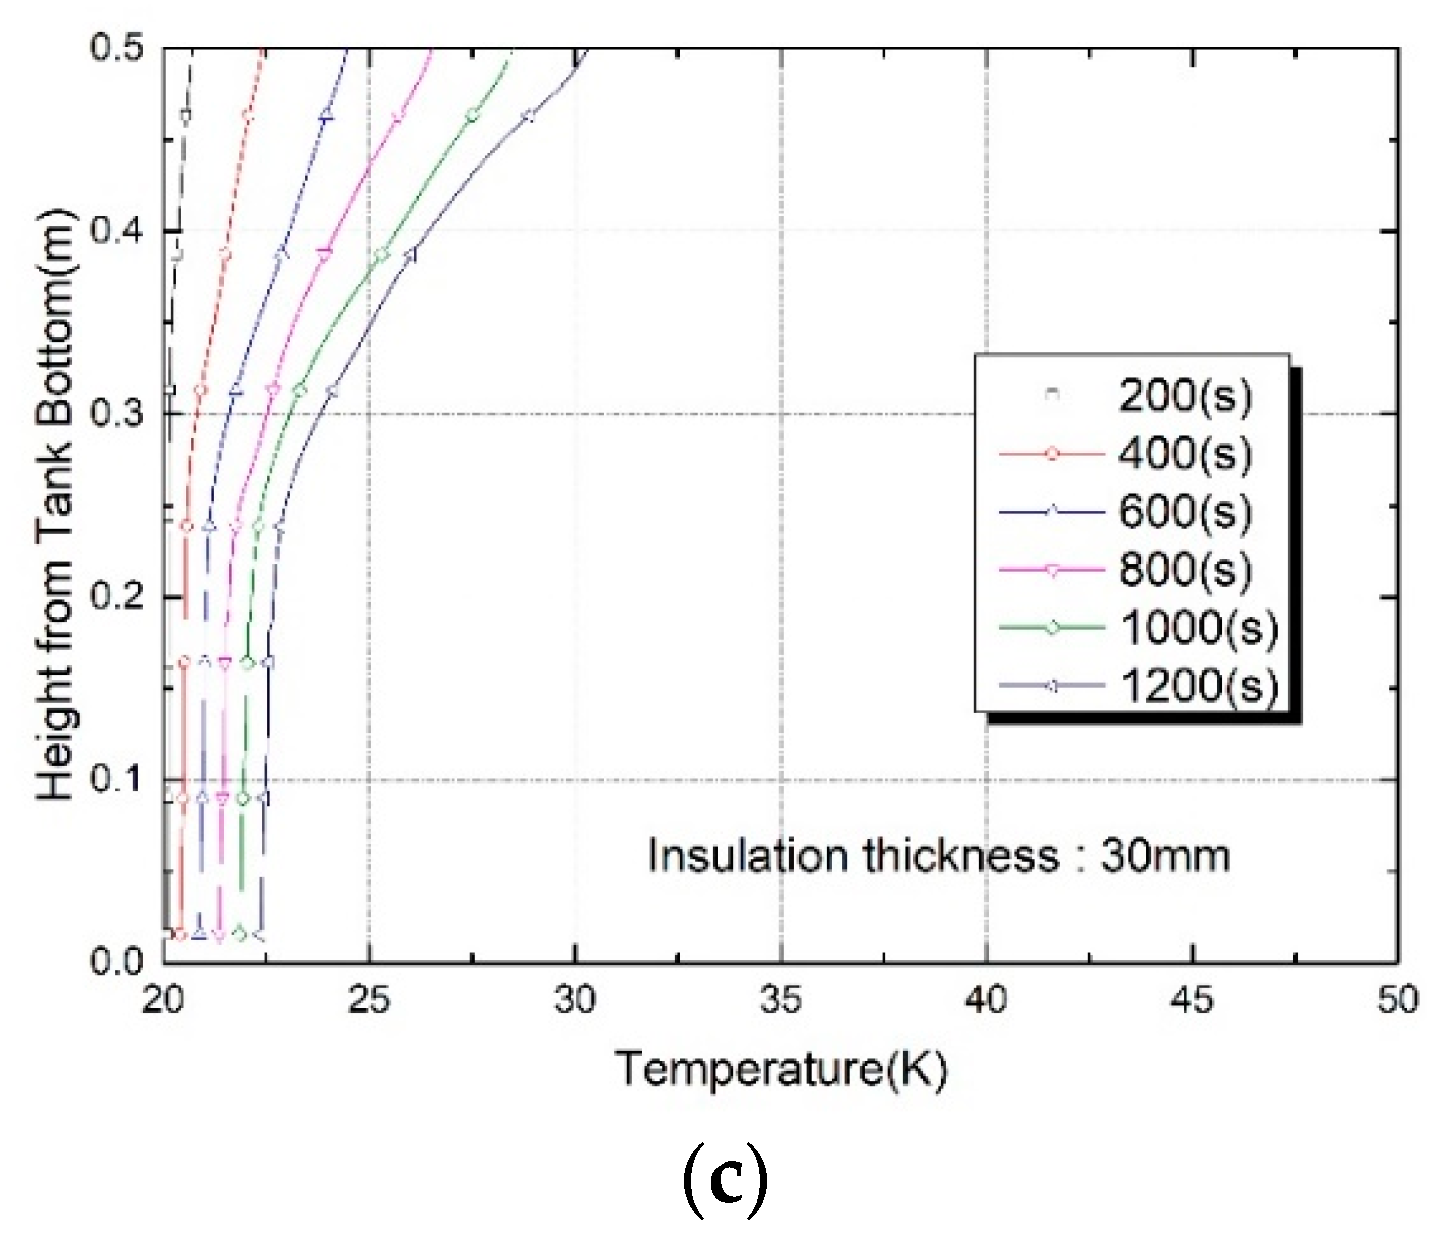
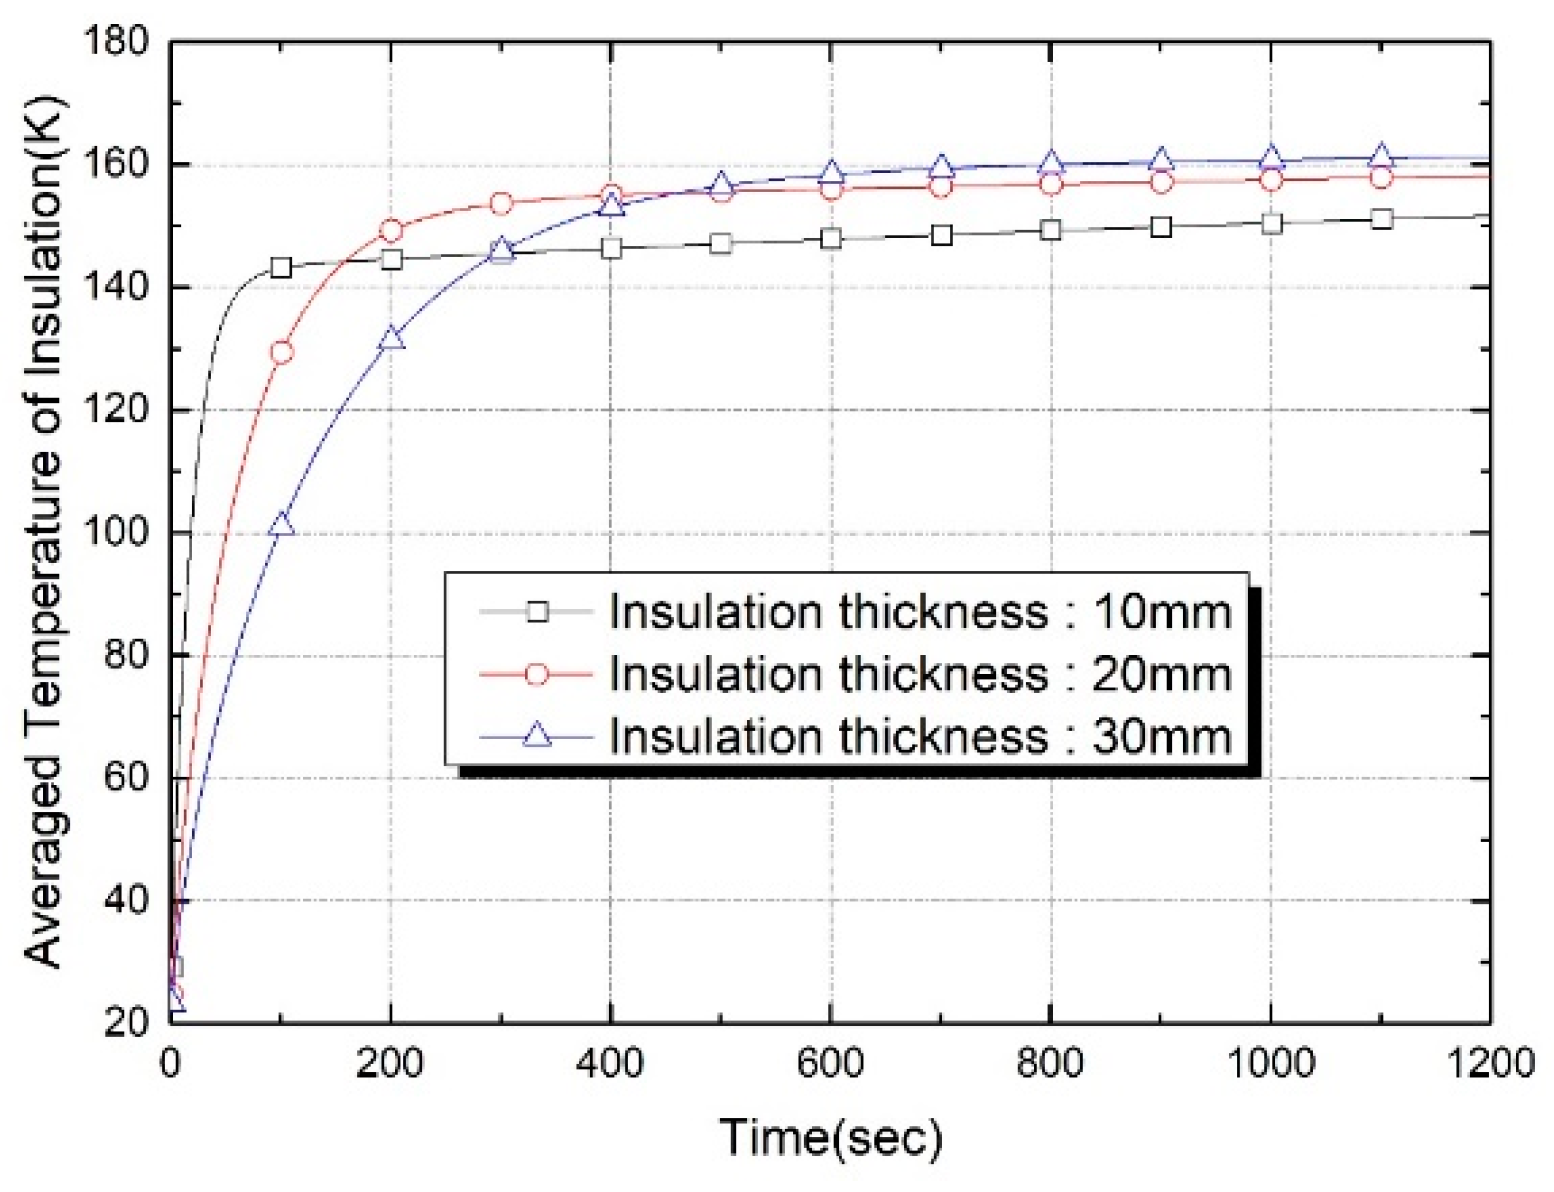
The central vertical temperature profiles at various times for the three different insulation thicknesses are shown in Figure 10. It is clearly seen that the temperatures of the liquids and vapors increased at a faster rate with the thinner insulation. In addition, as the insulation thickness decreased and time lapsed, a large temperature gradient near the tank top formed due to thermal accumulation. The results also show that the degree of thermal stratification in the vapor phase and the degree of thermal energy mixing between the liquid and vapor phases through the interface, according to the difference in the thermal energy transferred to the liquid phase, vary greatly depending on the insulation thickness. The temperature changed with time when the insulation thickness increased, as well as the thermal capacitance. The heat leak penetration speed was delayed, causing a delay in temperature increase inside the tank. Significantly, as shown in Figure 10a, with 10 mm thick insulation and a small thermal capacitance, a large amount of heat penetrated the tank and the conduction flux flowed in to the liquid–vapor interface, causing the liquid temperature at the interface to exceed the saturation temperature. When the side wall heat ingress was large due to thin insulation, not only did the free surface temperature increase but evaporation was also initiated before the thermal stratification build-up. However, the temperature increase at the free surface was considerably delayed in the case of 30 mm insulation thickness. Volume-averaged temperature–time histories for insulation of three different thickness are shown in Figure 11. This figure shows that the small thermal capacitance resulting from reduced insulation thickness shortened the time to the near steady-state condition of the inner temperature of the insulation material. As the insulation thickness increased from 10 mm to 20 mm, the time to reach normal condition could be delayed by 215%. Again, when the insulation thickness increased to 30 mm, the time to reach normal condition was delayed by 550%, delaying the speed that heat penetrated into the tank. Therefore, by increasing the insulation thickness, more time elapsed between the heat load input and the elevated pressure state, ultimately restricting the boil-off and self-pressurization processes.
From the above results, when the heat leakage penetrates the tank, the heat load mainly increases the temperature of both the tank wall and thermal insulation material, which in turn, increases the liquid temperature and causes a phase change, resulting in self-pressurization.
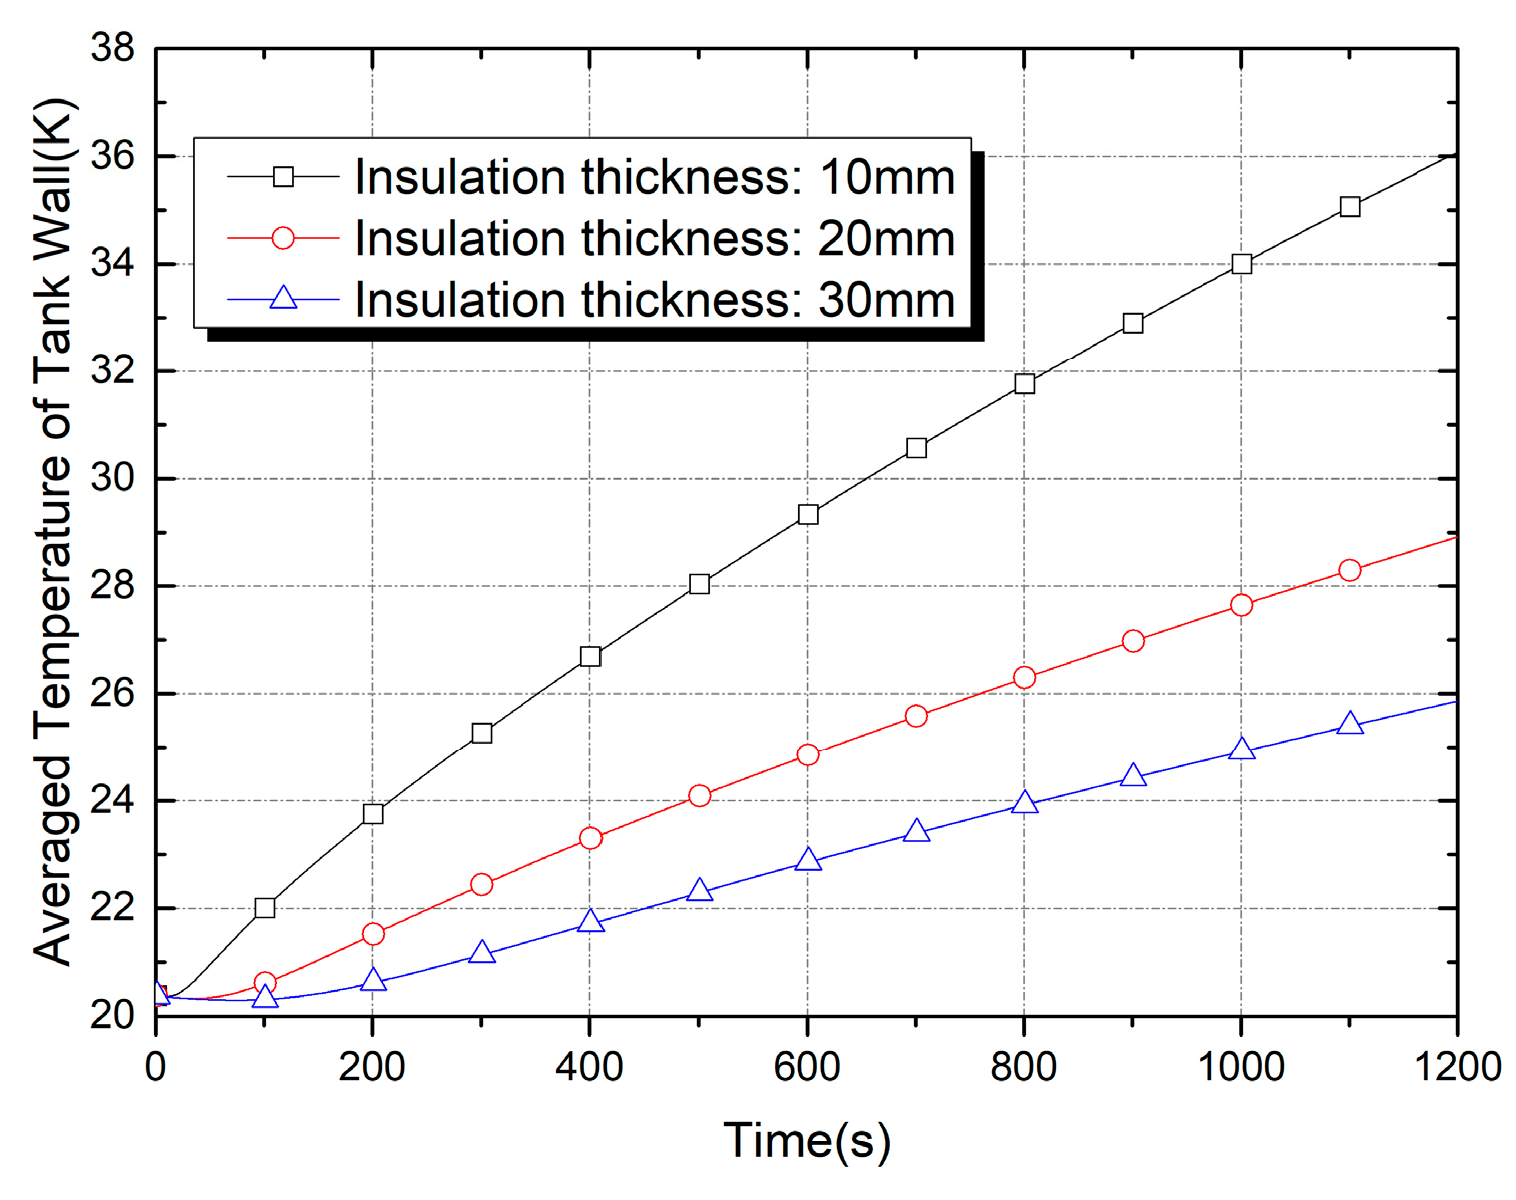
Figure 12 displays the temporal evolution of volume-averaged temperature profiles of the tank wall for three different insulation thicknesses. It can be observed in the figure that as the liquid surface is reduced by evaporation due to heat ingress, the area available for heat transfer between the warmer vapor with heat accumulation and the tank wall increases, improving heat transfer from the ullage to the tank wall. Therefore, the linear rise in the tank wall temperature can be due to the continuous rise in the heat exchange rate at both the fluid–wall interface and at the wall–foam interface.
As predicted, as the insulation became thinner, the amount of heat leakage became enormous, so the heat penetrated quickly into the tank wall. As time elapsed, the temperature rose almost linearly, with a sharp temperature gradient. The temperature rose with an alleviated temperature gradient with thicker insulation. In Figure 11, it is clear that the temperature of the tank wall increases at a steeper rate with thinner insulation. As already mentioned, this is due not only to high levels of heat leakage into the bulk liquid and ullage but also to the low thermal capacitance of the insulation material.
In the case of the thinnest insulation thickness (10 mm), the temperature rise gradient was about 0.0128 (K/s), which was 138% higher than insulation thickness of 30 mm which was three times thicker. It was 66.9% increase compared with the insulation thickness of 20 mm.
According to the three different insulation thicknesses, evaporation losses at 600 s and 1200 s are presented in Table 2. The thermal capacitances of the different insulation thickness at 600 s, which increased according to the insulation thickness and evaporation, changed as the insulation thickness increased from 10 mm to 20 mm. The thermal capacitance doubled, and thus, the evaporation decreased by about half. With an insulation thickness of 30 mm, the evaporation reduced to a quarter. Similarly, at 1200 s, the evaporation was reduced with insulation thickness increases. With insulation thicknesses of 20 mm and 30 mm, the evaporation decreased to 43% and 25%, respectively, of the 10 mm insulation level.
From the thermal diffusion point of view, the temporal variations in volume-averaged temperature of the insulator, as shown in Figure 11, are very sluggish, due to the much lower thermal diffusion coefficient (3.41 × 10⁻⁷ m2/s) compared with that of the tank wall (5.83 × 10⁻⁵). Thus, the greater the thickness, the greater the amount of heat that can be accumulated within the insulation material. Therefore, it can be seen that the greater the thickness, the longer the time required to reach the near steady-state condition. In addition, it can be also seen that the temperature at the near steady state increases with thicker insulation that can accumulate more heat. The same tendency appears when the heat ingress from the environment decreases. Meanwhile, in the case of the wall with a higher thermal diffusivity, the temperature rises linearly, as shown in Figure 12, because heat moves more rapidly through the wall relative to its volumetric heat capacity.
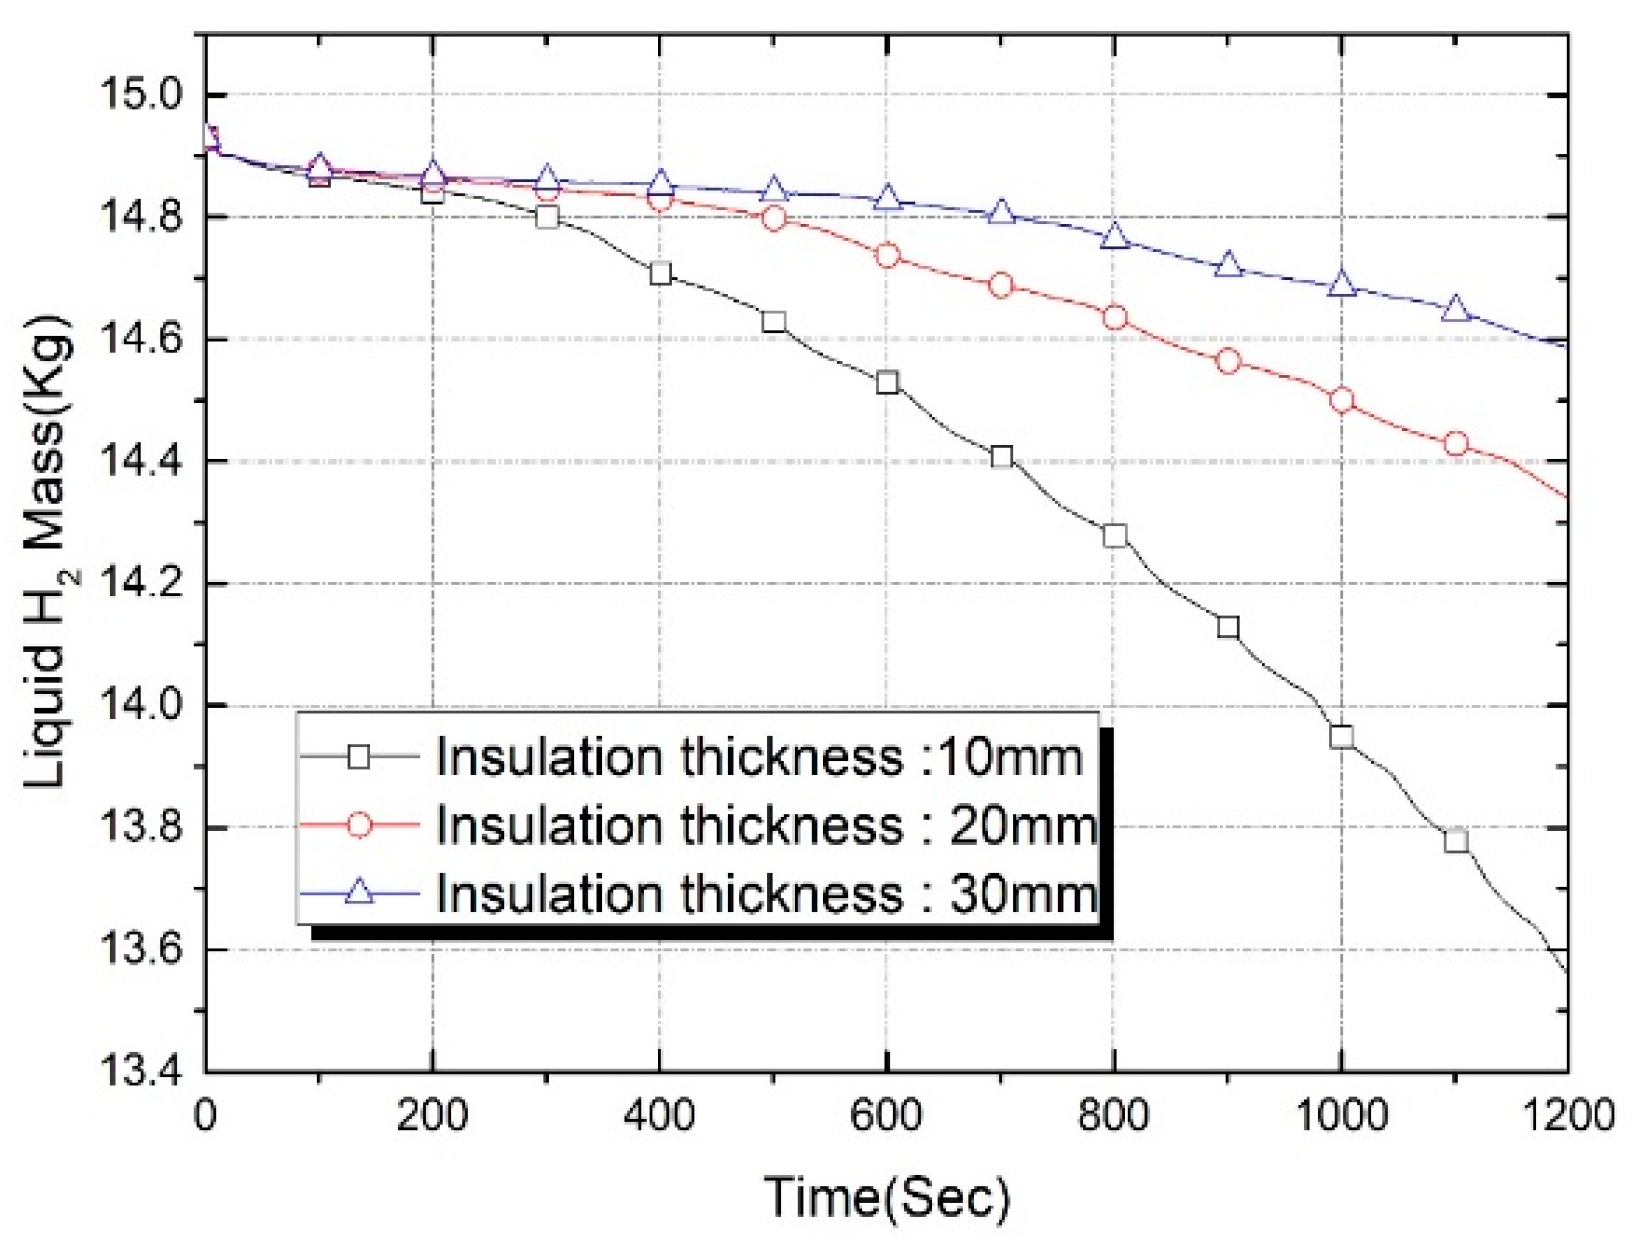
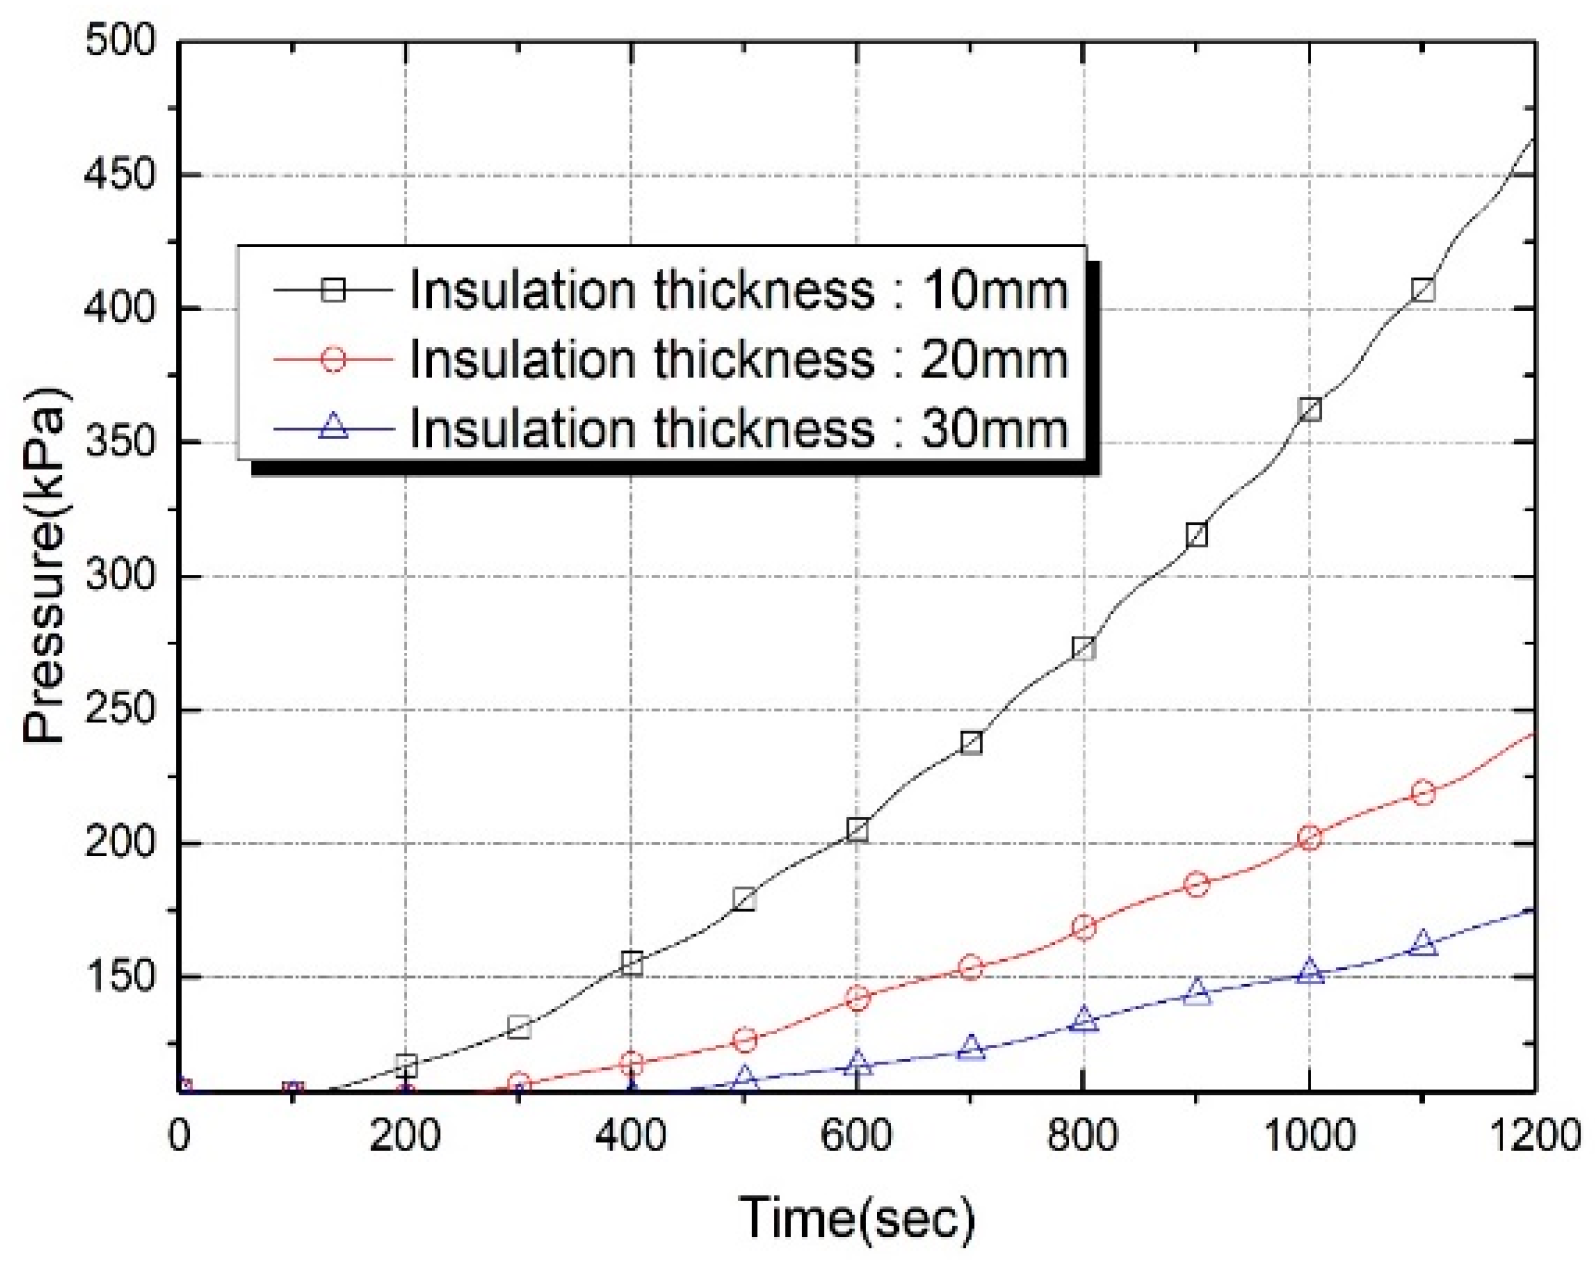
The changes in liquid mass for the three insulation thicknesses with time are presented in Figure 13. The liquid mass of the LH2 left in the tank decreases as the evaporation proceeds. As depicted in the figure, as the insulation became thinner, the heat ingress penetrating the wall surface increased, which shortened the elapsed time, and evaporation took place quickly. Thermal leakage into the wall increased, and the buoyancy near the wall caused the warm liquid to rise and reach the interface in a shorter time. As a result, the rapid coupling of buoyancy and convection caused the enthalpy inside the liquid hydrogen to increase rapidly, accelerating the onset of evaporation. After 600 s, when the evaporation had significantly progressed, the evaporation became relatively high with thinner insulation. Figure 14 shows the pressure rise versus time in the LH2 tank for three different insulation thicknesses. The results indicate that pressurization rates are increased with decreasing thickness. This is because as time elapses, for the lesser insulation thickness, the larger heat ingress into the tank leads to an increase in the internal energy of the two phases, resulting in a much more rapid rise in tank pressure. This behavior was also reported experimentally in a previous study [52], in which higher pressurization rates were measured for increased heat penetration into the tank. In Figure 14, it is observed that the pressure starts to rise after a certain time in all cases. This is because the warm liquid generated by the sidewall heat flux needs some time to flow upwards and reach the interface, and the enthalpy also increases [48]. It is also observed that as the thickness of the insulation decreases, the delay before evaporation begins becomes shorter.

4. Conclusions

In this study, a three-dimensional CFD model to accurately evaluate the insulation performance and thermo-fluid characteristics in a partially filled liquid hydrogen tank of a small-scale hydrogen liquefier has been developed and used to investigate the effect of insulation thickness, ranging from 10 to 30 mm, on thermo-physical characteristics and evaporation loss. The proposed CFD model in this study describes not only thermo-fluid and mass transport phenomena in the ullage and liquid but also at the interface by solving N-S type governing equations with empirical correlations for mass interfacial exchange at the free surface. The interfacial surface between the liquid and vapor is represented and tracked using the VOF method. In addition, the proposed numerical model also includes a complex, conjugated, heat transfer problem coupled with a k-ξ-f turbulence model for simulating the near-wall heat and fluid flow. To demonstrate thermo-physical consistency and prediction accuracy, the proposed model was validated using temporal pressure and evaporative mass data from experiments and computational results previously reported in the literature. It was confirmed that the numerical results in this study and the experimental results were in good agreement, and was noted that the prediction of the pressurization rate is more sensitive to eddy viscosity formulationand near-wall treatment of the turbulence model than prediction of interfacial mass transfer.
From the results of this study, it is observed that with insulation thickness decreases, the enthalpy inside the liquid hydrogen quickly increased due to a fast coupling between buoyance and convection, which caused evaporation to begin sooner. It was also found that the radial temperature gradient rapidly decreased with time elapsed, but the axial temperature gradient was more strongly formed, causing a stronger temperature gradient and the thermal accumulation near the tank top in the vapor region.
It was also found that the stagnant flow due to the support groove prevents the mixing of the cooled downflow with the hot fluid near the wall, which can cause a non-uniform temperature distribution in the liquid phase, and especially increases the temperature near the wall, eventually increasing the amount of boil-off. As a result, pressurization rates due to evaporation show increases with decreasing insulation thickness because of the smaller thermal capacitance of the insulation.
In the future, the numerical model developed in this study will be used to evaluate the insulation performance of a storage tank of a small-scale hydrogen liquefier to which new insulation material is applied. It will also be used to investigate the effects of inner structures such as support grooves on the temperature distribution and boil-off in the storage tank.

Author Contributions

Conceptualization, S.-J.J. and S.-J.L.; methodology, S.-J.J.; software, S.-J.J.; validation, S.-J.J.; formal analysis, S.-J.J. and S.-J.L.; investigation, S.-J.J. and S.-J.L.; resources, S.-J.J. and S.-J.L.; writing—original draft preparation, S.-J.J.; writing—review and editing, S.-J.J. and S.-J.L.; visualization, S.-J.J. and S.-J.M.; supervision, S.-J.J.; funding acquisition, S.-J.J. All authors have read and agreed to the published version of the manuscript.

Funding

This work was supported by the Material and Parts Technology Development Project of the Korea Evaluation Institute of Industrial Technology, funded by the Korean government (Grant No. 20004900).

Data Availability Statement

The cases, models, and data solutions can be made available by contacting the corresponding author.

Acknowledgments

The authors also thank AVL Korea, with whom they collaborated during the initial stages of this work.

Conflicts of Interest

The authors declare no conflict of interest.

Nomenclature

The following nomenclature is used in this manuscript:
gGravitational acceleration (m2/s)
hHeat transfer coefficient (W/m2K)
kConductivity (W/mK)
v 2 ¯ Wall normal fluctuations
DDiameter of tank or diffusivity (m, m2/s)
HHeight of tank (m)
nNormal direction
αVolume fraction
ρDensity
μViscosity
δInsulation thickness
νKinematic viscosity
χSpecies mass fraction
Subscripts
airAir
AmbAmbient
ccondensation
eff Effective
eEvaporation
gGas
i, jCoordinate
Liquid
mmass concentration
sTank outer surface
satSaturation
vVapor
oSurface
sSurface
wWall

References

  1. White, C.; Steeper, R.; Lutz, A. The hydrogen-fueled internal combustion engine: A technical review. Int. J. Hydrogen Energy 2006, 31, 1292–1305. [Google Scholar] [CrossRef]
  2. Gruz, M.; Baltacioglu, E.; Hames, Y.; Kaya, K. The meeting of hydrogen and automotive: A review. Int. J. Hydrogen Energy 2017, 42, 23334–23346. [Google Scholar] [CrossRef]
  3. Verstraete, D.; Hendrick, P.; Pilidis, P.; Ramsden, K. Hydrogen fuel for subsonic transport aircraft. Int. J. Hydrogen Energy 2010, 35, 11085–11098. [Google Scholar] [CrossRef]
  4. Kang, M.; Kim, J.; You, H.; Chang, D. Experimental investigation of thermal stratification in cryogenic tanks. Exp. Therm. Fluid Sci. 2018, 96, 371–382. [Google Scholar] [CrossRef]
  5. Kang, H.; Kim, S.Y. Thermal design analysis of a 1 L cryogenic liquid hydrogen tank for an unmanned aerial vehicle. Int. J. Hydrogen Energy 2018, 39, 20009–20016. [Google Scholar] [CrossRef]
  6. Jeong, S.-J.; Moon, S.-J.; Park, K.W.; Moon, S.-J. Development of the three-dimensional numerical model for predicting thermal physical performance in liquified hydrogen tank for hydrogen fueled vehicle. Trans. Korean Soc. Automot. Eng. 2020, 28, 203–210. [Google Scholar] [CrossRef]
  7. Saif, Z.S.; Stephanie, M.; Umberto, C.; Eric, F.M. Hydrogen liquefaction: A review of the fundamental physics, engineering practice and future opportunities. Energy Environ. Sci. 2022, 15, 2690–2731. [Google Scholar]
  8. Masters, P.A. Computer Programs for Pressurization (RAMP) and Pressurized Expulsion from a Cryogenic Liquid Propellant Tank; NASA TN D-7504; NASA: Greenbelt, MD, USA, 1974. [Google Scholar]
  9. Panzarella, C.; Kassemi, M. On the validity of purely thermodynamic descriptions of two-phase cryogenic fluid storage. J. Fluid Mech. 2003, 484, 41–68. [Google Scholar] [CrossRef]
  10. Panzarella, C.; Plachta, D.; Kassemi, M. Pressure control of large cryogenic tanks in microgravity. Cryogenics 2004, 44, 475–483. [Google Scholar] [CrossRef]
  11. Karimi, H.; Nassirharand, A.; Mohseni, M. Modeling and simulation of a class of liquid propellant engine pressurization systems. Acta Astrongautica 2010, 66, 539–549. [Google Scholar] [CrossRef]
  12. Barsi, S.; Kassemi, M. Numerical and experimental comparison of the self-pressurization behavior of an LH2 tank in normal gravity. Cryogenics 2008, 48, 122–129. [Google Scholar] [CrossRef]
  13. Liu, Z.; Feng, Y.; Lei, G.; Li, Y. Sloshing hydrodynamic performance in cryogenic liquid oxygen tanks under different amplitudes. Appl. Therm. Eng. 2019, 150, 359–371. [Google Scholar] [CrossRef]
  14. Joseph, J.; Agrawal, G.; Agarwal, D.K.; Pisharady, J.C.; Kumar, S.S. Effect of insulation thickness on pressure evolution and thermal stratification in a cryogenic tank. Appl. Therm. Eng. 2017, 111, 1629–1639. [Google Scholar] [CrossRef]
  15. Adnani, P.; Jennings, R.W. Pressurization analysis of cryogenic propulsion systems. In Proceedings of the 36th AIAA/ASME/SAE/ASEE Joint Propulsion Conference and Exhibit, Las Vegas, NV, USA, 24–28 July 2000. AIAA-2000-3788. [Google Scholar]
  16. Roh, S.; Son, G. Numerical study of natural convection in a liquefied natural gas tank. J. Mech. Sci. Technol. 2012, 26, 3133–3140. [Google Scholar] [CrossRef]
  17. Kassemi, M.; Kartuzova, O. Effect of interfacial turbulence and accommodation coefficient on CFD predictions of pressurization and pressure control in cryogenic storage tank. Cryogenics 2016, 74, 138–153. [Google Scholar] [CrossRef]
  18. Liu, Z.; Li, C. Influence of slosh baffles on thermodynamic performance in liquid hydrogen tank. J. Hazard. Mater. 2018, 346, 253–262. [Google Scholar] [CrossRef] [PubMed]
  19. Chen, L.; Liang, G.Z. Simulation research of vaporization and pressure variation in a cryogenic propellant tank at the launch site. Microgravity Sci. Technol. 2013, 25, 203–211. [Google Scholar] [CrossRef]
  20. Fu, J.; Sunden, B.; Chen, X. Influence of wall ribs on the thermal stratification and self-pressurization in a cryogenic liquid tank. Appl. Therm. Eng. 2014, 73, 1421–1431. [Google Scholar] [CrossRef]
  21. Liu, Z.; Li, Y.; Jin, Y.; Li, C. Thermodynamic performance of pre-pressurization in a cryogenic tank. Appl. Therm. Eng. 2017, 112, 801–810. [Google Scholar] [CrossRef]
  22. Wang, L.; Ye, S.; Ma, Y.; Wang, J.; Li, Y. CFD investigation on helium pressurization behaviors in liquid hydrogen tank. J. Hydrog. Energy 2017, 42, 30792–30803. [Google Scholar] [CrossRef]
  23. Schrage, R.W. A Theoretical Study of Interphase Mass Transfer; Columbia University Press: New York, NY, USA, 1953. [Google Scholar]
  24. Liu, Z.; Li, Y. Thermal physical performance in liquid hydrogen tank under constant wall temperature. Renew. Energy 2019, 130, 601–612. [Google Scholar] [CrossRef]
  25. Duan, Z.; Zhu, Y.; Wang, C.; Yuan, Y.; Xue, H.; Tang, W. Numerical and Theoretical Prediction of the Thermodynamic Response in Marine LNG Fuel Tanks under Sloshing Conditions. Energy 2023, 270, 126935–126949. [Google Scholar] [CrossRef]
  26. Wang, H.; Wang, B.; Li, R.; Shen, X.; Wu, Y.; Pan, Q.; He, Y.; Zhou, W.; Gan, Z. Theoretical Investigation on Heat Leakage Distribution between Vapor and Liquid in Liquid Hydrogen Tanks. Int. J. Hydrogen Energy 2023, 48, 17187–17201. [Google Scholar]
  27. Zuo, Z.; Jiang, W.; Qin, X.; Huang, Y. A numerical model for liquid-vapor transition in self-pressurized cyogenic containers. Appl. Therm. Eng. 2021, 193, 117005–117015. [Google Scholar] [CrossRef]
  28. Le, T.-L.; Chen, J.-C.; Nguyen, H.-B. Numerical investigation of the forward and backward thermocapillary motion of a water droplet in a microchannel by two periodically activated heat sources. Numer. Transf. Part A Appl. 2021, 79, 146–162. [Google Scholar] [CrossRef]
  29. Sun, P.; Wu, J.Y.; Zhang, P.; Xu, L.; Jiang, M. Experimental study of the influences of degraded vacuum on multilayer insulation blankets. Cryogenics 2009, 49, 719–726. [Google Scholar] [CrossRef]
  30. Liu, Z.; Li, Y.; Xie, F.; Zhou, K. Thermal performance of foam/MLI for cryogenic liquid hydrogen tank during the ascent and on orbit period. Appl. Therm. Eng. 2016, 98, 430–439. [Google Scholar] [CrossRef]
  31. Liu, Z.; Li, Y.; Jin, Y. Pressurization performance and temperature stratification in cryogenic final stage propellant tank. Appl. Therm. Eng. 2016, 106, 211–220. [Google Scholar] [CrossRef]
  32. Li, X.; Xie, G.; Wang, R. Experimental and numerical investigations of fluid flow and heat transfer in a cryogenic tank at loss of vacuum. Heat Mass Transf. 2010, 46, 395–404. [Google Scholar] [CrossRef]
  33. Lemmon, E.W.; McLinden, M.O.; Friend, D.G.; Linstrom, P.; Mallard, W. NIST Chemistry WebBook; NIST Standard Reference Database Number 69; National Institute of Standards and Technology: Gaithersburg, MD, USA, 2011. [Google Scholar] [CrossRef]
  34. Hardt, S.; Wondra, F. Evaporation model for interfacial flows based on a continuum-field representation of the source terms. J. Comput. Phys. 2008, 227, 5871–5895. [Google Scholar] [CrossRef]
  35. Ranz, W.; Marshall, W.R. Modeling the interaction between a thermal flow and a liquid: Review and future eulerian-lagrangian approaches. Chem. Eng. Prog. 1952, 48, 141–146. [Google Scholar]
  36. Chu, X.; Chen, W.; Shang, Y.; Hao, J.; Zhang, D. CFD investigation on reverse flow characteristics in U-tubes under two-phase natural circulation. Prog. Nucl. Energy 2019, 114, 145–154. [Google Scholar] [CrossRef]
  37. FIRE ver. 2019 R2 Main Program User Manual. Available online: https://www.avl.com/en (accessed on 10 December 2022).
  38. Churchill, S.W.; Bernstein, M. A Correlating Equation for Forced Convection from Gases and Liquids to a Circular Cylinder in Crossflow. J. Heat Transf. 1977, 99, 300–306. [Google Scholar] [CrossRef]
  39. Bergman, T.L.; Lavine, A.S.; Incropera, F.P.; Dewitt, D.P. Fundamentals of Heat and Mass Transfer, 8th ed.; John Wiley & Sons Inc.: Hoboken, NJ, USA, 2018; ISBN 978-1-119-35388-1. [Google Scholar]
  40. Whitaker, S. Forced convection heat transfer correlations for flow in pipes, past flat plates, single cylinders, single spheres, and for flow in packed beds and tube bundles. AIChE J. 1972, 18, 361–371. [Google Scholar] [CrossRef]
  41. Wang, L.; Li, Y.; Li, C.; Zhao, Z. CFD investigation of thermal and pressurization performance in LH2 tank during discharge. Cryogenics 2013, 57, 63–73. [Google Scholar] [CrossRef]
  42. Wang, Y.; Li, Y.; Zhu, K.; Jin, Y. Comparison of three computational models for predicting pressurization characteristics of cryogenic tank during discharge. Cryogenics 2015, 65, 16–25. [Google Scholar]
  43. Wilcox, D.C. Turbulence Modeling for CFD, 2nd ed.; DCW Industries Inc.: La Cañada Flintridge, CA, USA, 1998. [Google Scholar]
  44. Hanjalić, K.; Popovac, M.; Hadžiabdić, M. A robust near-wall elliptic-relaxation eddy-viscosity turbulence model for CFD. Int. J. Heat Fluid Flow 2004, 25, 1047–1051. [Google Scholar] [CrossRef]
  45. Durbin, P.A. Near-wall turbulence closure modeling without “damping functions”. Theor. Comput. Fluid Dyn. 1991, 3, 1–13. [Google Scholar] [CrossRef]
  46. Nzebuka, G.G.; Waheed, M.A. Thermal evolution in the direct chill casting of an Al-4 pct Cu alloy using the low-Reynolds number turbulence model. Int. J. Therm. Sci. 2020, 147, 106152. [Google Scholar] [CrossRef]
  47. Wu, X.; Durbin, P.A. Numerical simulation of heat transfer in a transitional boundary layer with passing wakes. J. Heat Transf. 1991, 122, 248–257. [Google Scholar] [CrossRef]
  48. Sundén, B.; Fu, J. Heat Transfer in Aerospace Applications; Academic Press: Cambridge, MA, USA, 2017. [Google Scholar]
  49. Altac, Z.; Ugurlubilek, N. Assessment of turbulence models in natural convection from two- and three-dimensional rectangular enclosures. Int. J. Therm. Sci. 2016, 107, 237–246. [Google Scholar] [CrossRef]
  50. Spall, E.; Richards, A.; McEligot, D.M. An assessment of k-w and v2-f turbulence models for strongly heated internal gas flows. Numer. Heat Transf. 2004, 46, 831–849. [Google Scholar] [CrossRef]
  51. Ward, W.D. Evaluation of AS-203 low-gravity orbital experiment. NASA CR 1967, 94045, 13. [Google Scholar]
  52. Van Dresar, N.; Lin, C.; Hasan, M. Self-pressurization of a flight weight liquid hydrogen tank: Effects of fill level at low wall heat flux. In Proceedings of the 30th Aerospace Sciences Meeting and Exhibit, Reno, NV, USA, 6–9 January 1992. NASA TM-105411. [Google Scholar]
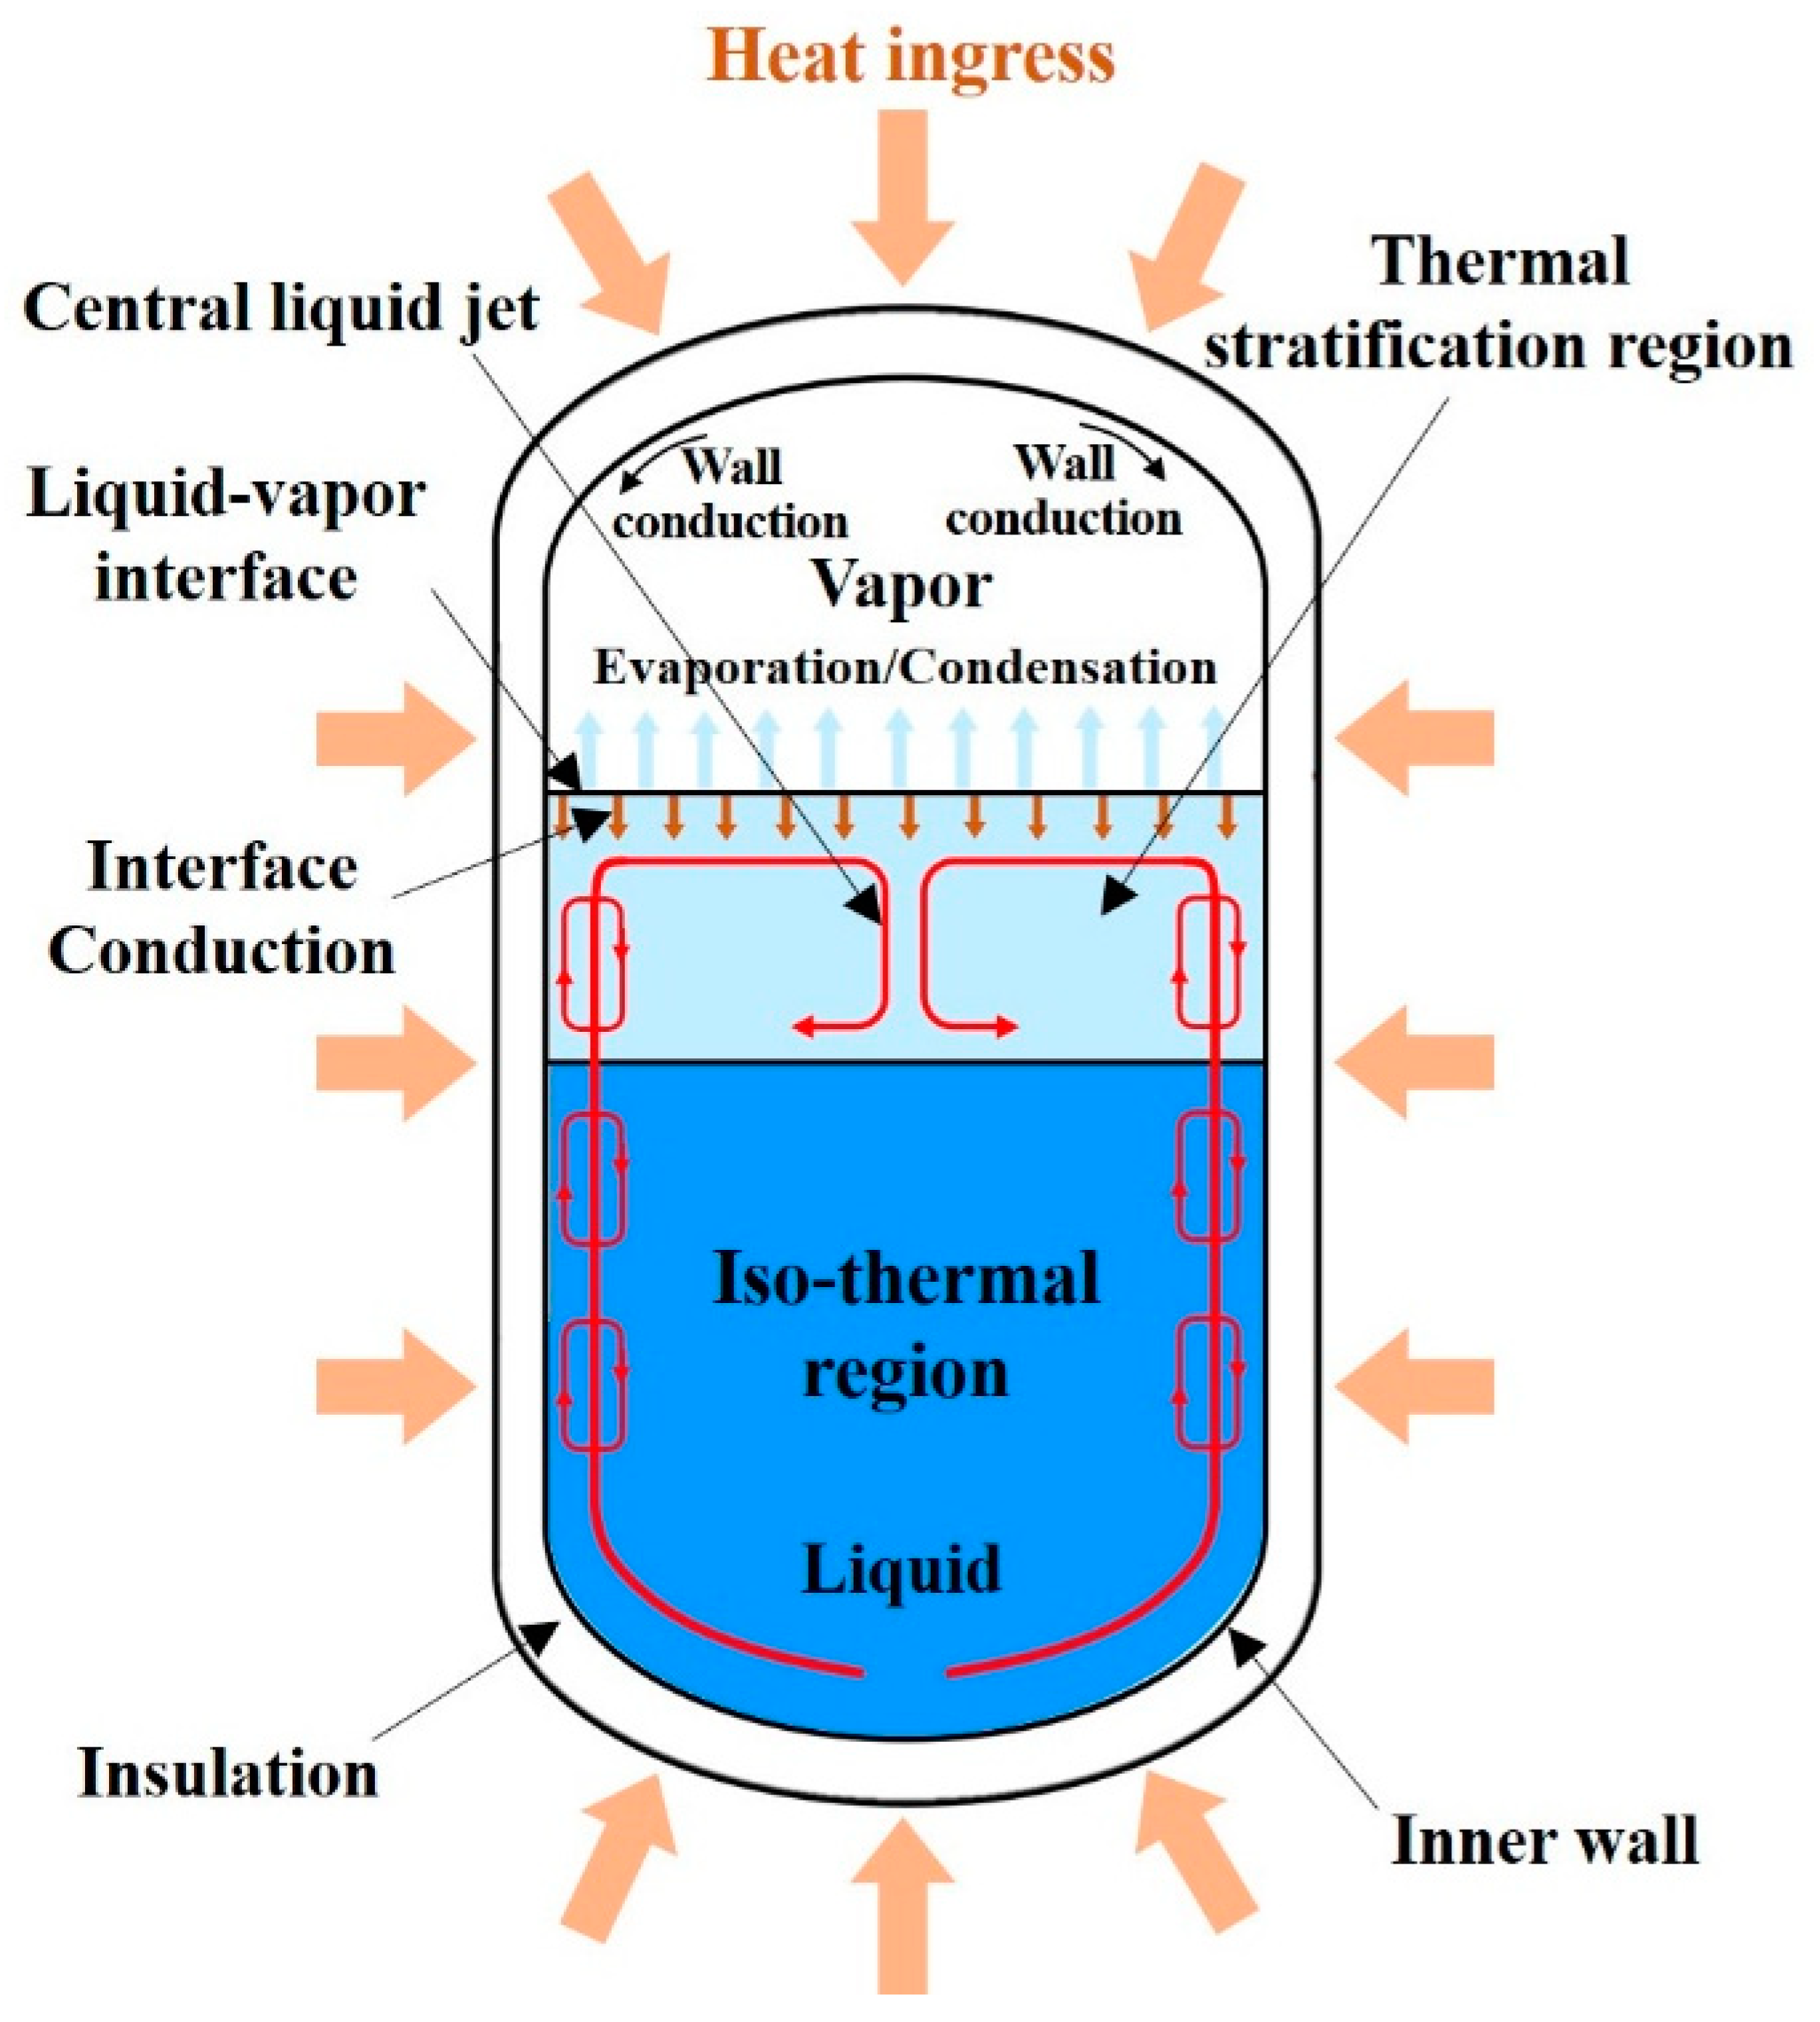
Figure 1. Self-pressurization subject to a liquid and vapor heat flux.
Fluids 08 00239 g001
Figure 2. Schematic diagram of the small-scale (1.3 L/h) hydrogen liquefier.
Fluids 08 00239 g002
Figure 3. Schematic diagram of the inner liquid H2 tank.
Fluids 08 00239 g003
Figure 4. Predicted temporal evolution of pressure for the pressurization of the 50% filling level of a tank subjected to various levels of sidewall heat ingress: comparison of predictions against previous computational results by [20].
Fluids 08 00239 g004
Figure 5. Comparison of liquid mass amounts with time for various uniform wall heat fluxes.
Fluids 08 00239 g005
Figure 6. Comparison of k-ε and k-ζ-f turbulence models employing the VOF model’s predictions against experimental results [51]. (a) Temporal evolution of ullage pressure. (b) Temporal evolution of ullage vapor mass.
Fluids 08 00239 g006
Figure 7. Comparison of streamlines in a tank for various insulation thicknesses: (a) 10 mm, (b) 20 mm, and (c) 30 mm.
Fluids 08 00239 g007aFluids 08 00239 g007b
Figure 8. Temporal variations in temperature contours for the three different insulation thicknesses (insulation mat is not displayed). At 800 s, the thermal energy is mixed. (a) 200 s, (b) 400 s, (c) 600 s.
Fluids 08 00239 g008aFluids 08 00239 g008b
Figure 9. Temperature contours for three different insulation thickness at 1000 s (including insulation mat).
Fluids 08 00239 g009
Figure 10. Temperature profiles at the central axis for three different times and insulation thicknesses: (a) 10 mm, (b) 20 mm, and (c) 30 mm.
Fluids 08 00239 g010aFluids 08 00239 g010b
Figure 11. Temporal variations in averaged temperature of insulation for three different insulation thicknesses.
Fluids 08 00239 g011
Figure 12. Temporal evolution of averaged-temperature profiles of the tank wall for three different insulation thicknesses.
Fluids 08 00239 g012
Figure 13. Comparison of liquid mass amounts with time for various insulation thicknesses.
Fluids 08 00239 g013
Figure 14. Predicted evolution of pressure for the self-pressurization of the 50% filled tank with various insulation thicknesses.
Fluids 08 00239 g014
Table 1. Geometrical dimensions and physical properties.
PropertiesTank Wall (2219 Al Alloy)Insulation Foam
Thickness (mm)310~30
Density (kg/m2)284035
Specific heat (J/(kgK))8641674
Thermal conductivity (W/(m·k))1430.02
Table 2. Interface evaporation loss at t = 600 s and t = 1200 s for three different insulation thicknesses.
Insulation Thickness (mm)Thermal Capacitance (J/K)Evaporation Loss (g) at t = 600 sEvaporation Loss (g) at t = 1200 s
10174.20.3981.360
20366.30.1900.588
30577.40.1010.341
Disclaimer/Publisher’s Note: The statements, opinions and data contained in all publications are solely those of the individual author(s) and contributor(s) and not of MDPI and/or the editor(s). MDPI and/or the editor(s) disclaim responsibility for any injury to people or property resulting from any ideas, methods, instructions or products referred to in the content.