Abstract
A jet flame occurs when the release of flammable gas or liquid ignites, resulting in a long, intense, and highly directional flame. This type of fire is commonly associated with industrial incidents involving pipelines, storage tanks, and other pressurized equipment. Jet fires are a significant concern in the oil and gas industry due to the handling and processing of large volumes of flammable hydrocarbons under pressure. The new computational method presented here includes several aspects of hydrogen jet flame accidents and their mitigation: the CFD simulation of a hydrogen jet flame using the HyRAM code and Fire Dynamics Simulator (FDS) software 5.0 using a large eddy simulation (LES) turbulence model; the calculation of the gaseous mixture’s thermo-physical properties using the GASEQ thermochemical code; the calculation of convective and radiative heat fluxes using empirical correlation; and a heat transfer simulation on the pipe thermal barrier coating (TBC) using COMSOL Multiphysics software 4.2a during the heating phase. This method developed for the ceramic blanket was validated successfully against the previous experimental results obtained by Gravit et al. It was shown that a jet fire’s maximum temperature obtained using FDS software was similar to that obtained using GASEQ thermochemical software 0.79 and HyRAM software. The TBC’s surface temperature reached 1945 °C. The stainless steel’s maximal temperature reached 165.5 °C. There was a slight decrease in UTS at this temperature.
1. Introduction
Low-cost H2 is critical for hydrocarbon refining (such as hydrocracking and hydrodesulphurization) and producing ammonia. Hydrodesulphurization units are required in refineries to clean streams from materials, such as sulfur, to the catalysts and are therefore located before the hydrocracker and fluid catalytic cracker (FCC). These processes adjust the final product specification for various streams, such as light naphtha, kerosene, and low-sulfur fuel oils (LSFOs). Hydrogen has long been an attractive potential fuel and energy carrier. It can be combusted, similar to a fossil feedstock, without CO2 coproduction, and/or utilized electrochemically in a fuel cell for direct electric power generation. However, the design and operation of downstream oil refineries require careful consideration of safety measures, particularly when dealing with flammable substances such as hydrogen. One critical aspect is that the behavior of hydrogen jet flames, with their high velocity and high temperature, can potentially cause hazards [1,2,3]. In fuel jet flames formed in the atmosphere, the combustion process is coupled with a mixing process [4]. This mixing process, rather than the rate of chemical reaction, controls the rate of combustion. An analysis of such flames requires consideration of the mixing process; only fuel jet flames range from slow combustion (such as a candle flame) to rapid fuel combustion in engines of various types, in which mixing is accomplished by turbulent eddy motion [4]. One review paper provides a general dimensionless correlation for predicting the length of expanded and under-expanded hydrogen jet flames from round nozzles of an arbitrary size at different storage pressures and temperatures [5].
1.1. Literature Review of CFD Modeling of Hydrogen Jet Flames
To assess and mitigate hazards, CFD modeling can be employed to simulate the behavior of hydrogen jet flames [6]. This modeling can help identify potential areas of concern, such as over-predicting products and temperature and under-predicting fuel and oxidizers. Using a computational approach, CFD modeling allows the cost-effective exploration of different design options and operational decisions related to downstream oil refineries. Additionally, using computational fluid dynamic simulations can provide valuable insights into these systems’ turbulent reacting flows. Such simulations can help predict turbulence–chemistry interactions and obtain fundamental information regarding hydrogen jet flames’ behavior. Furthermore, using a simplified multi-environment-presumed (Probability Density Function) PDF model validated against detailed transported PDF simulations can facilitate the prediction of turbulence–chemistry interactions in a manner that closely resembles physical reality. Moreover, discrepancies in fuel, oxidizers, products, and temperature predictions can be investigated using sensitivity studies and diagnostic calculations. CFD simulation and a Boiling Liquid Expanding Vapor Explosion (BLEVE) mitigation study were performed. It was assumed that heptane jet fire impinges the external boundary of the tank’s composite lining [7]. Jang et al. carried out a CFD hydrogen jet fire simulation and a fire damage analysis on a hydrogen pipeline in a pipe rack structure [8]. They applied Kameleon FireEx (KFX) software version 2014 to obtain a jet fire’s temperature and the heat flux distribution under a pipe rack structure’s complex geometry.
1.2. Scope and Novelty of This Study
This paper includes the numerical simulation of a hydrogen jet flame. It is assumed that one of the refinery pipes is exposed to the jet. The pipe’s internal radius is 45 mm, the stainless steel AISI 304 pipe wall is 5 mm thick, and the TBC is 10 mm thick.
This computational method includes several aspects of hydrogen jet flame accidents and their mitigation: the CFD simulation of hydrogen jet flames using the HyRAM code and Fire Dynamics Simulator (FDS) software using a large eddy simulation (LES) turbulence model; the calculation of the gaseous mixture’s thermo-physical properties using GASEQ thermochemical code; the calculation of convective and radiative heat fluxes by using empirical correlation and HyRAM software. To the best of my knowledge, it is the first time that the HyRAM is applied for the calculation of radiative heat flux for the design of the TBC. The heat transfer simulation on the pipe thermal barrier coating (TBC) was performed by using COMSOL Multiphysics software during the heating phase. This method is shown schematically in Figure 1.
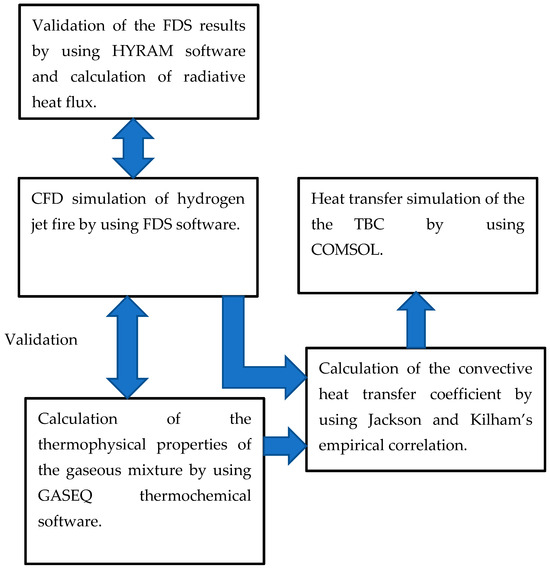
Figure 1.
Schematics of the coupled CFD and heat transfer hydrogen jet simulation method.
2. Materials and Methods
2.1. Fire Dynamics Simulator (FDS) Overview
Fire Dynamics Simulator (FDS) is advanced computational fluid dynamics (CFD) software developed by the National Institute of Standards and Technology (NIST) [9,10]. It is widely used to simulate the behavior of fire scenarios (jet, pool, and wildland), smoke and combustion products, flows, and heat transfer. It has been applied to fire safety design and fire incident investigations in tunnels, buildings, power plants, refineries, nuclear reactors, and ships [11,12,13]. Fire Dynamics Simulator software has several features, detailed below.
Combustion Modeling
This simulates detailed combustion processes, including the generation of heat, smoke, and other combustion products. It supports various types of fuels and fire scenarios. Fire Dynamics Simulator (FDS) uses a mixture fraction combustion model. The mixture fraction is a conserved scalar quantity that is defined as the fraction of gas at a given point in the flow field that originated as fuel. This software assumes that combustion is mixing controlled, and that the reaction of fuel and oxygen is infinitely fast. The mass fractions of all of the major reactants and products can be derived from the mixture fraction by means of “state relations”, empirical expressions arrived at using a combination of simplified analysis and measurement [9].
Fluid Dynamics
This solves the momentum transport equation to model the flow of combustion products and soot particles. It incorporates a large eddy simulation (LES) turbulence model to accurately represent airflow patterns in and around fires. The core algorithm is an explicit predictor–corrector scheme that is second-order accurate in space and time.
Heat Transfer
This models conduction, convection, and radiation heat transfer. It uses the Finite Volume Method in order to solve the Radiative Transport Equation (RTE). It can simulate fire’s impact on different materials and structural elements.
Smoke and Particulate Transport
This tracks the flow of smoke and particulates emitted by a fire. It helps assess visibility and smoke toxicity in fire scenarios.
Meshing
This supports using multiple meshes to handle large-scale and detailed simulations concurrently. It allows for high-resolution modeling in areas of interest while maintaining overall efficiency.
Integration with Post Processing and Finite Element Codes
This is compatible with visualization and post-processing tools such as Smoke-view. It can be coupled with finite element multiphysics codes, such as COMSOL software, to perform the comprehensive thermal and structural analysis of a TBC [14].
2.2. Governing Equations of FDS Software
The following subsections describe continuity (mass), Navier–Stokes (momentum), and energy (heat transfer) transport equations.
2.2.1. Mass and Species Transport
The mass conservation transport equation [9] is
where represents the density [kg/m3], and represents the velocity field [m/s]. This equation is expressed in terms of each gaseous species, as follows:
Dα is the diffusion coefficient of the mixture’s component [m2/s].
2.2.2. Momentum Transport
The Navier–Stokes (or momentum) transport equation is [9]
Here, represents the body force term [Pa/m]. The stress tensor, [Pa], is defined in Equation (4) [9]:
Sij is the symmetric rate-of-strain tensor, and μ represents the fluid’s dynamic viscosity. In this study, numerical calculations were performed using large eddy simulation (LES). Large-scale eddies were calculated directly.
2.2.3. Large Eddy Simulation (LES)
Large eddy simulation (LES) is a mathematical model for turbulence applied in computational fluid dynamics (CFD). It is particularly useful in studying and predicting complex fluid behavior in fire engineering, meteorology, and environmental science. In LES, large-scale turbulent motions (large eddies) are resolved directly, whereas smaller scale motions (small eddies) are modeled. Navier–Stokes equations are filtered to separate large-scale motions from smaller ones. Larger scales are computed using the grid, whereas a subgrid-scale (SGS) model handles smaller scales. The SGS model approximates the effects of small eddies on larger ones, reducing the computational cost while maintaining accuracy for larger flow features. This subsection provides a description of how these terms are modeled in FDS software. The dissipation rate, [Pa/s], the rate at which kinetic energy is converted to thermal energy by viscosity [9], is
Viscosity, μ, is modeled as
where Cs denotes an empirical constant, and is a length on the order of the size of a grid cell. The bar above various symbols means that these were computed from the numerical solution sampled on a coarse grid (relative to DNS). The other diffusive parameters are thermal conductivity and material diffusivity. They are related to the turbulent viscosity by the following equations [9]:
The turbulent Prandtl number, (this term is defined by coefficients that are not the fluid physical properties but functions of flow and numerical grid characteristics), and the turbulent Schmidt number, , are assumed to be constant for the CFD simulation. The viscosity, μLES, is subgrid-scale viscosity, which models the effect of small-scale turbulence (at smaller scales than the filter width) onto the filtered flow field. The turbulent viscosity is a property of fluids that represents the diffusion of momentum within a turbulent flow, which means that it describes the increase in the apparent viscosity of a fluid due to the presence of turbulent fluctuations.
2.2.4. Energy Transport
The energy conservation transport (or heat transfer) equation is written in terms of the sensible enthalpy, [J/kg] [9]:
Assuming that the gaseous mixture behaves as an ideal gas (i.e., the hydrogen jet fire occurs at atmospheric pressure, which is much less than the gaseous mixture’s critical pressure), the sensible enthalpy, [J/kg], is a function of the temperature [9], as follows:
where the sensible heat of each component in the mixture was calculated by the following [9]:
Here, denotes the volumetric heat release rate produced from a hydrogen oxidation reaction [W/m3], denotes the energy transferred to the evaporating hydrogen liquid [W/m3], and represents conductive and radiative heat fluxes [W/m2] [9]:
The radiative transport equation was solved by using the Finite Volume Method (FVM) numerical method. To obtain the discretized form of the RTE, the unit sphere was divided into a finite number of solid angles.
2.2.5. Equation of State
The pressure, p, was computed using the ideal gas equation of state:
where T is the temperature in [K], and is the gas constant. is the molar mass of the gaseous mixture in [J/mol].
2.3. FDS Modeling of the Hydrogen Jet Flame
The geometrical model of the hydrogen jet fire computational domain is shown in Figure 2.
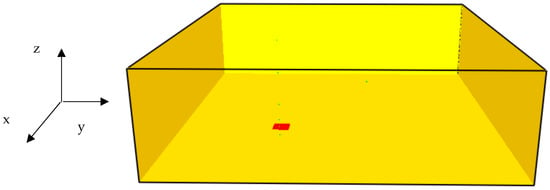
Figure 2.
The geometry of the hydrogen jet fire computational domain.
The red square located at the bottom of the computational model represents the hydrogen injection point. The green points represent the thermal monitor sensors. The height of the computational domain is 3.0 m. The width and the length of the computational domain are 10 m. At the bottom side of the computational domain, hydrogen was injected and ignited (in coordinates x = y = 3.1 m and z = 0). Five thermal monitor sensors were placed inside the computational domain. Table 1 shows the thermal monitor sensors locations inside this domain. It is assumed that the conditions on the flame impingement on a flat wall can be used to approximate the conditions on a cylindrical surface.

Table 1.
Thermal monitor sensor locations.
Boundary and Initial Conditions
It is assumed that the temperature, component concentrations in the air, and pressure are: , respectively.
2.4. Hydrogen Risk Assessment Model Overview
HyRAM (hydrogen risk assessment model) software is a specialized tool developed to assess the safety and risks associated with hydrogen infrastructure [15]. It integrates probabilistic risk assessment (PRA) methodologies with models for hydrogen behavior, including leak, dispersion, and explosion scenarios. HyRAM software’s key features are as follows:
Probabilistic Risk Assessment (PRA)
HyRAM software incorporates PRA techniques to evaluate the likelihood and consequences of hydrogen-related incidents. It models both component reliability and human factors to provide comprehensive risk assessments.
Hydrogen Behavior Modeling
HyRAM software simulates hydrogen release and dispersion in various environmental conditions. It models combustion behavior, including deflagration and detonation scenarios.
Consequence Analysis
HyRAM software evaluates the potential impacts of hydrogen leaks, including thermal effects, overpressure, and radiation exposure. It provides quantitative data to inform safety distances and mitigation measures.
2.5. Thermal Barrier Coatings Types
Thermal barrier coatings (TBCs) designed for fire protection are generally referred to as fire-resistant coatings and are used to protect structures and materials from high temperatures and fire exposure. The four types of thermal barrier coatings are intumescent coatings, cementitious coatings, ceramic coatings, and fiber-reinforced polymers (FRPs) [16,17]. A recently published review paper [17] describes the reinforced thermoplastic (RTP) applied in the oil and gas industry, its processing parameters, and failures in detail, with recommendations for its future use in refining and production pipelines. Epoxy-based intumescent coatings have been applied as thermal barrier coatings. Intumescent coatings are the most common fire-resistant coatings [18,19]. They swell when exposed to high temperatures, forming a char layer that insulates the underlying material from heat and flame. They typically contain a binder (epoxy resin), an acid source (such as ammonium polyphosphate), a carbon source (such as pentaerythritol), and a blowing agent (such as melamine). Intumescent coatings significantly expand when exposed to jet or pool fire, creating an insulating char layer. They are commonly applied on steel structures in buildings, oil and gas facilities, and other industrial applications. In this study, a ceramic fiber blanket was applied as a thermal barrier coating. Ceramic blanket thermal barrier coatings (TBCs) are advanced materials used primarily for insulation in high-temperature environments. They serve as a protective layer in various industrial applications, including the aerospace and automotive industries, and power generation. Ceramic blankets provide excellent thermal insulation, with low thermal conductivity. They are capable of withstanding temperatures up to 1800 °C [20], making them ideal for environments where high heat resistance is crucial. These blankets are lightweight and can be easily cut, shaped, and installed, even in complex geometries. Their flexibility allows them to be wrapped around pipes, equipment, or other surfaces. Typically, these blankets are manufactured using ceramic fibers, and are often composed of alumina, zirconia, or silica [21,22]. These fibers are woven into a blanket-like structure, offering flexibility and ease of application. Ceramic blankets have several advantages, as follows:
(a) Ceramic blankets are resistant to thermal shock, corrosion, and chemical degradation, ensuring long-term performance in harsh environments.
(b) Ceramic blankets reduce heat loss, thus contributing to energy savings and improved operational efficiency.
Thermo-Physical Properties of the Ceramic Thermal Barrier Coating and Stainless Steel 304 L
The ceramic fiber blanket TBC’s thermal conductivity as a function of temperature is provided in Figure 3 [20].
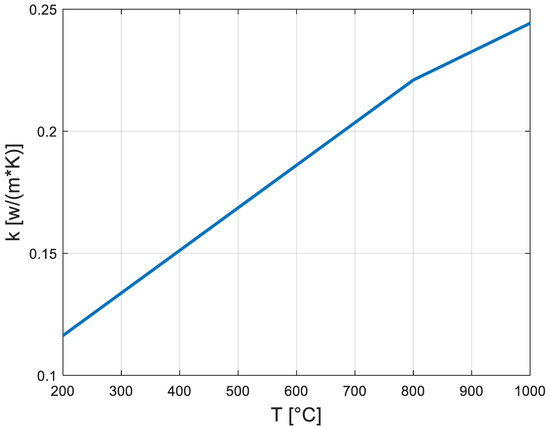
Figure 3.
Thermal conductivity of ceramic fiber blanket [20].
The ceramic fiber blanket’s density is 3000 [kg/m3], and its heat capacity is 1130 [J/(kg·K)] [20]. Stainless steel AISI 304’s thermal conductivity is 16.2 [W/(m·K)], and its heat capacity and density are 500 [J/(kg·K)] and 8003 [kg/m3], respectively [23].
3. Results
3.1. Grid Sensitivity Study Results
This study verified its CFD numerical results. Three FDS models were developed, containing 10,800; 19,200; and 76,800 (see Figure 4 and Figure 5). The average temperature was computed via numerical integration of the instantaneous temperature readings over time. The maximum difference in thermal monitor sensor no. 5 was less than 10.3%.
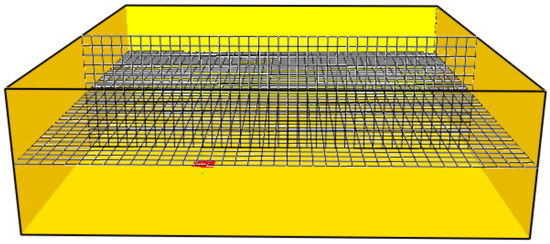
Figure 4.
Visualization of the FDS grid containing 19,200 cells.
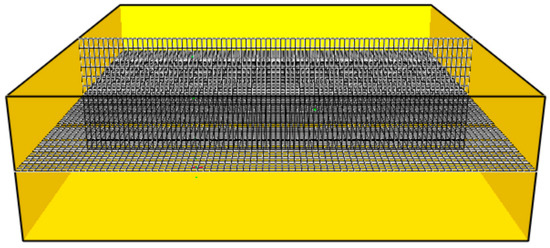
Figure 5.
Visualization of the FDS grid containing 76,800 cells.
3.2. FDS Hydrogen Jet Fire Numerical Results
FDS software was applied to find the temperature field of hydrogen jet flames. The temperature plot of a hydrogen jet fire at t = 6.7 s is shown in Figure 6.
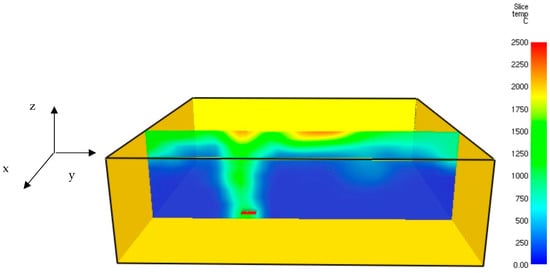
Figure 6.
Three-dimensional temperature field of a hydrogen jet fire at t = 6.7 s.
Figure 6 shows the hot gaseous mixture’s expansion, including a clear temperature increase in the thermal monitor sensors located close to the protective lining. The jet fire’s maximum temperature obtained using FDS software was similar to the temperature obtained using GASEQ software. The flame temperature obtained in this work is similar to previous results obtained by Li et al. [24]. The velocity plot of the hydrogen jet fire at t = 6.7 s is shown in Figure 7.
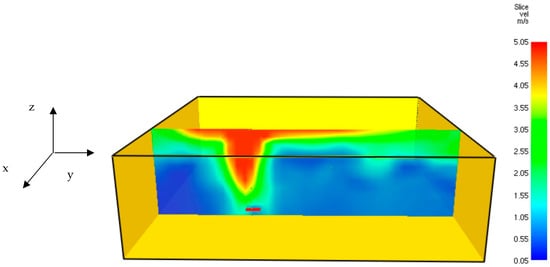
Figure 7.
Three-dimensional velocity field of the hydrogen jet fire at t = 6.7 s.
Figure 7 shows that the hot gaseous mixture’s maximal velocity was about 5.05 m/s. Figure 8 provides the transient thermal response of the five thermal monitor sensors (TC1–TC5) and shows that there has been a sharp decrease in temperature readings at about 15 s.
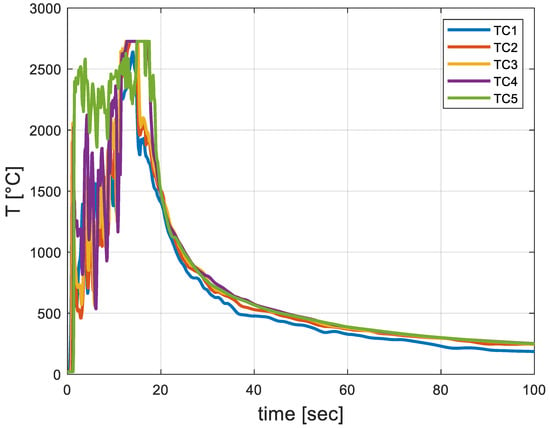
Figure 8.
Transient thermal response of the five thermal monitor sensors (TC1–TC5).
Figure 8 indicates that the maximum temperature occurs after 15 s.
3.3. GASEQ Thermochemical Code Results
GASEQ software was designed to perform thermodynamic calculations related to chemical equilibrium in gas–phase reactions. It is commonly used in fields such as combustion, atmospheric science, and chemical engineering [25]. It is frequently used to analyze combustion processes, including determining combustion products and calculating flame temperatures. It can calculate a gas mixture’s equilibrium composition given a set of initial conditions, such as temperature, pressure, and the amount of each species. It determines a mixture’s thermodynamic properties, such as enthalpy, entropy, and heat capacity [25]. The combustion product mixture’s composition and the thermo-physical properties and composition are provided in Figure 9.
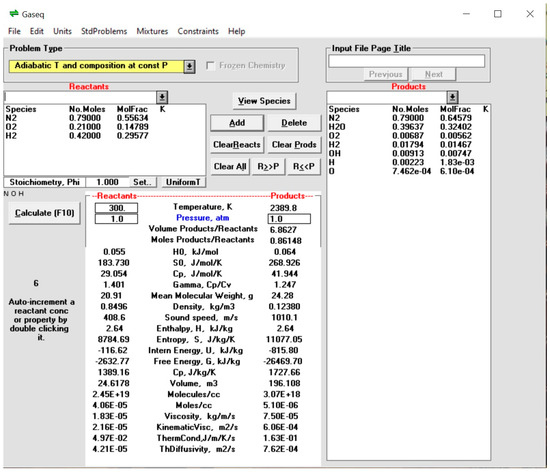
Figure 9.
Combustion products’ composition and the thermo-physical properties.
3.4. Calculation of Thermal Loads Acting on the TBC’s External Surface
It is assumed that the hydrogen jet diameter, d, is 0.4 m. The impinging jet heat transfer convective coefficient was evaluated using the Jackson and Kilham empirical correlation [26]:
The velocity obtained by FDS software was about 4.5 m/s (see Figure 7). Thus, the numerical value of the Reynolds number of jet flow is as follows:
Experiments have shown that, if Re exceeds about 2000, the jet flow will be turbulent [27]. Substituting the thermo-physical properties shown in Figure 9 in Equation (13), the convective heat transfer coefficient obtained using Equation (13) is as follows:
3.5. HyRAM Numerical Results for Hydrogen Jet Flame Radiative Heat Transfer
HyRAM software was applied to find the temperature field of hydrogen jet flames and radiative heat flux. The temperature plot of a hydrogen jet is shown in Figure 10.
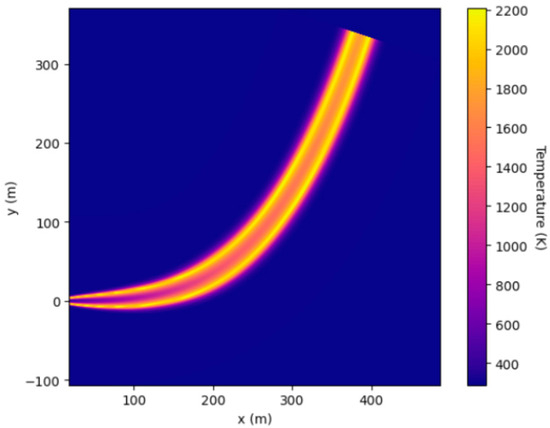
Figure 10.
Temperature field of a hydrogen jet flame obtained using HyRAM software.
The maximum temperature of the jet fire obtained using HyRAM software was slightly lower than the temperature obtained using GASEQ and FDS software. The calculated radiative heat transfer flux at a distance of 3 m by using HyRAM software is as follows:
3.6. Temperature Calculation Results for the Ceramic Blanket
In this study, a thermal transient model was applied in COMSOL Multiphysics software. Figure 11 shows the 3D temperature field inside the TBC and the stainless steel pipe obtained at t = 600 s (10 min).
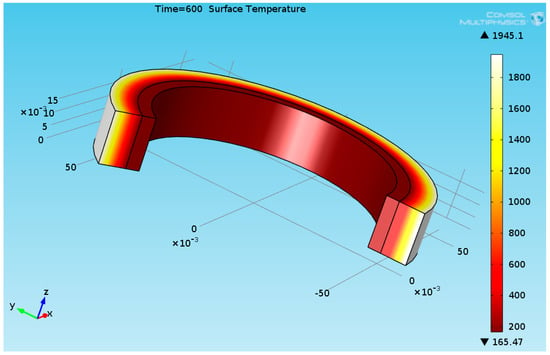
Figure 11.
Three-dimensional temperature plot of the TBC and the pipe at t = 600 s.
The ceramic fiber blanket’s surface temperature reached 1945 °C. The stainless steel’s maximal temperature reached 165.5 °C. Figure 12 shows temperature evolutions of the TBC’s external surface and at the TBC/steel interface.
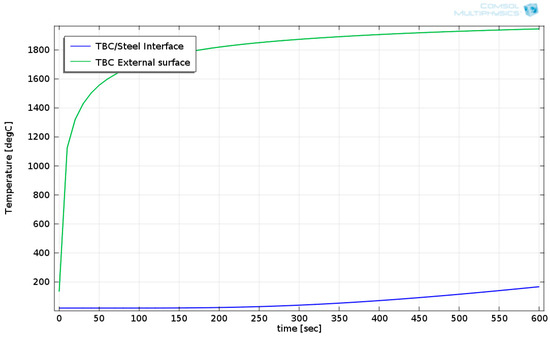
Figure 12.
Calculated temperatures of the TBC’s external surface and at the TBC/steel interface.
Figure 12 shows that there was a slight temperature increase at the TBC/steel interface. This occurred because the TBC’s thermal diffusivity was low. The strengths of several steels are shown as a function of temperature in Figure 13 [28].
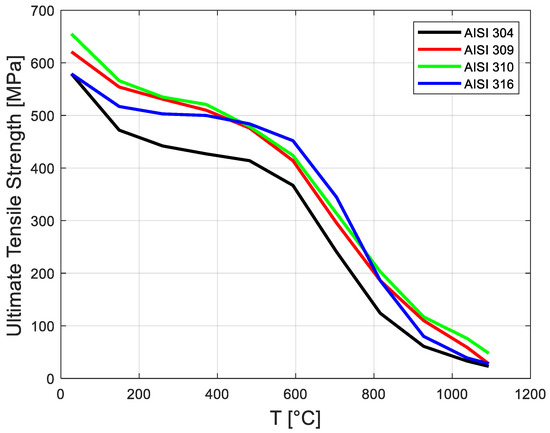
Figure 13.
Plot of ultimate tensile strengths of several stainless steels shown as a function of temperature (thermomechanical data are from [28]).
4. Conclusions
Low-cost H2 is critical for use in hydrocarbon refining (including hydrocracking and hydrodesulphurization) and for ammonia production. One critical aspect is that the behavior of hydrogen jet flames, with their high velocity and high temperature, can potentially cause hazards.
In this study, a ceramic fiber blanket was applied as a thermal barrier coating. Ceramic blanket thermal barrier coatings (TBCs) are capable of withstanding temperatures up to 1800 °C, making them ideal for environments where high heat resistance is crucial. Typically, these blankets are manufactured using ceramic fibers and are often composed of alumina, zirconia, or silica.
This new numerical method includes several aspects of hydrogen jet flame accidents and their mitigation: the CFD simulation of hydrogen jet flames using the HyRAM code and Fire Dynamics Simulator (FDS) software using a large eddy simulation (LES) turbulence model; the calculation of the gaseous mixture’s thermo-physical properties using the GASEQ thermochemical code; and the calculation of convective and radiative heat fluxes using empirical correlation and HyRAM software. The heat transfer simulation on the pipe thermal barrier coating (TBC) was carried out by using COMSOL Multiphysics software during the heating phase. The computational procedure is based on FDS and COMSOL, which interact with the HyRAM and GASEQ. The HyRAM and GASEQ were used as supporting approaches, for showing the similarity of the results, i.e., for validating the CFD numerical results. The thermo-physical properties needed for calculating the convective coefficients of the hydrogen jet flames were obtained by using GASEQ software. The results show that the maximum temperature of the jet fire obtained using FDS software was similar to the temperature obtained using GASEQ thermochemical software and HyRAM software. This study verified its CFD numerical results. Two FDS models were developed, containing 10,800; 19,200; and 76,800 grid sizes. It was found that the maximum difference was less than 10.3%. This method developed for the ceramic blanket was validated successfully against the previous experimental results obtained by Gravit et al. [21]. There was a slight decrease in UTS at 165.5 °C. This computational method may be applied for other hydrocarbon (naphtha, gasoline, and diesel) jet flame simulations in oil and gas industries and for the design TBC for road tunnels.
Funding
This study did not receive external funding.
Data Availability Statement
The data presented in this study are available on request from the corresponding author due to privacy.
Conflicts of Interest
The author declares no conflicts of interest.
Abbreviations
| BLEVE | Boiling Liquid Expanding Vapor Explosion; |
| CFD | Computational Fluid Dynamics; |
| FDS | Fire Dynamic Simulator; |
| FRP | Fiber-reinforced Polymer; |
| FVM | Finite Volume Method; |
| LES | Large Eddy Simulation; |
| Probability Density Function; | |
| TBC | Thermal Barrier Coatings; |
| UTS | Ultimate Tensile Strength. |
| Nomenclature | |
| c | Concentration; |
| D | Diffusion coefficient in [m2/s]; |
| h | Enthalpy in [J/kg]; convective coefficient in Equation (15) in [W/(m2*K)]; |
| p | Pressure in [Pa]; |
| Pr | Prantl number; |
| Prt | Turbulent Prandtl number; |
| Gas constant (8.3143 J/(mole·K)); | |
| Re | Reynolds number; |
| T | Temperature in [K]; |
| t | Time in [s]; |
| Velocity vector in [m/s]; | |
| v | Velocity of the impinging hydrogen jet [m/s]; |
| Greek letters | |
| γ | Ratio of the specific heats of the gasous products; |
| ρ | Density in [kg/m3]; |
| ν | Kinematic viscosity of in [m2/s]. |
References
- Fischer, S.; Markus, D.; Maas, U. Numerical investigation of the ignition of diethyl ether/air and propane/air mixtures by hot jets. J. Loss Prev. Process Ind. 2017, 49 Pt B, 832–838. [Google Scholar] [CrossRef]
- Cermelli, D.; Curro, F.; Vairo, T.; Fabiano, B. Hydrogen Jet-Fire: Accident Investigation and Implementation of Safety Measures for the Design of a Downstream Oil Plant. Chem. Eng. Trans. 2018, 67, 415–420. [Google Scholar] [CrossRef]
- Vallejo-Molina, L.F. Educational Program for the Prevention of Fires and Explosions through Emerging Technologies. Doctoral Dissertation, Chemical Engineering, National University of Colombia Medellin Campus Faculty of Mines, Department of Processes and Energy, Medellín, Colombia, 2023. [Google Scholar]
- Lewis, B.; Von Elbe, G. Combustion Flames and Explosion of Gases, 2nd ed.; Academic Press Inc.: New York, NY, USA; London, UK, 1961. [Google Scholar]
- Molkov, V.; Saffers, J.B. Hydrogen jet flames. Int. J. Hydrogen Energy 2013, 38, 8141–8158. [Google Scholar] [CrossRef]
- Rowinski, D.H.; Pope, S.B. PDF calculations of piloted premixed jet flames. Combust. Theory Model. 2011, 15, 245–266. [Google Scholar] [CrossRef]
- Davidy, A. CFD Simulation and Mitigation with Boiling Liquid Expanding Vapor Explosion (BLEVE) Caused by Jet Fire. ChemEngineering 2019, 3, 1. [Google Scholar] [CrossRef]
- Jang, C.B.; Choi, S.W.; Baek, J.B. CFD modeling and fire damage analysis of jet fire on hydrogen pipeline in a pipe rack structure. Int. J. Hydrogen Energy 2015, 40, 15760–15772. [Google Scholar] [CrossRef]
- McGrattan, K. Fire Dynamics Simulator (Version 5)—Technical Reference Guide Volume 1: Mathematical Model; NIST Special Publication 1018; National Institute of Standards and Technology U.S. Department of Commerce: Washington, DC, USA, 2010. [Google Scholar]
- McGrattan, K.; Forney, G.P. Fire Dynamics Simulator (Version 5)—User’s Guide; NIST Special Publication 1019; National Institute of Standards and Technology U.S. Department of Commerce: Washington, DC, USA, 2010. [Google Scholar]
- McGrattan, K. Numerical Simulation of the Caldecott Tunnel Fire, April 1982; NISTIR 7231; National Institute of Standards and Technology U.S. Department of Commerce: Washington, DC, USA, 2005. [Google Scholar]
- Ingason, H.; Zhen Li, Y.; Lönnermark, A. Tunnel Fire Dynamics; Springer: Berlin, Germany, 2024. [Google Scholar] [CrossRef]
- Van Hees, P.; Wahlqvist, J.; Hostikka, S.; Sikanen, T.; Husted, B.; Magnusson, T.; Jörud, F. Prediction and Validation of Pool Fire Development in Enclosures by Means of CFD Models for Risk Assessment of Nuclear Power Plants (Pool fire)—Report Year 1; Department of Fire Safety Engineering and System Safety Lund University: Lund, Sweden, 2012. [Google Scholar]
- Davidy, A. Multiphysics Design of Pet-Coke Burner and Hydrogen Production by Applying Methane Steam Reforming System. Clean Technol. 2021, 3, 260–287. [Google Scholar] [CrossRef]
- Ehrhart Brian, D.; Hecht Ethan, S. Hydrogen Plus Other Alternative Fuels Risk Assessment Models (HyRAM+) Version 5.0 Technical Reference Manual; SAND2022-16425; Sandia National Lab.(SNL-NM): Albuquerque, NM, USA, 2022. [Google Scholar]
- Available online: https://flameseal.com/2023/11/08/types-of-thermal-barrier-coatings-used-in-fire-prevention/ (accessed on 1 June 2024).
- Abdul Karim, M.; Abdullah, M.Z.; Deifalla, A.F.; Azab, M.; Waqar, A. An assessment of the processing parameters and application of fibre-reinforced polymers (FRPs) in the petroleum and natural gas industries: A review. Results Eng. 2023, 18, 101091. [Google Scholar] [CrossRef]
- Gravit, M.; Klementev, B.; Shabunina, D. Fire Protection of Steel Structures with Epoxy Coatings under Cryogenic Exposure. Buildings 2021, 11, 537. [Google Scholar] [CrossRef]
- Wang, X.; Weinell, C.E.; Ring, L.; Kiil, S. Proof of concept investigation of alternative and less harmful boron compounds for epoxy-based hydrocarbon intumescent coatings. Fire Saf. J. 2021, 125, 103437. [Google Scholar] [CrossRef]
- HILTEX, ALF the Ultimate Solution. Available online: https://www.hiltex.com (accessed on 1 June 2024).
- Gravit, M.; Korolchenko, D.; Nedviga, E.; Portnov, F.; Diachenko, S. Impact of Jet Fires on Steel Structures: Application of Passive Fire Protection Materials. Fire 2024, 7, 281. [Google Scholar] [CrossRef]
- Karadimas, G.; Salonitis, K. Ceramic Matrix Composites for Aero Engine Applications—A Review. Appl. Sci. 2023, 13, 3017. [Google Scholar] [CrossRef]
- Steel, A.K. Product Data Bulletin; 304L Stainless Steel; Scientific Research Publishing Inc.: Irvine, CA, USA, 2007. [Google Scholar]
- Li, M.; Wang, Z.; Jiang, J.; Lin, W.; Ni, L.; Pan, Y.; Wang, G. Numerical Simulation and Consequence Analysis of Full-Scale Jet Fires for Pipelines Transporting Pure Hydrogen or Hydrogen Blended with Natural Gas. Fire 2024, 7, 180. [Google Scholar] [CrossRef]
- Available online: http://www.gaseq.co.uk/ (accessed on 12 June 2024).
- Baukal, C.E. Heat Transfer in Industrial Combustion; CRC Press LLC: New York, NY, USA, 2000. [Google Scholar] [CrossRef]
- Lee, J.H.W.; Chu, V.H. Turbulent Jets. In Turbulent Jets and Plumes; Springer: Boston, MA, USA, 2003. [Google Scholar] [CrossRef]
- American Iron and Steel Institute. High Temperature Characteristics of Stainless Steels, A Designer’s Handbook Series, No. 9004; American Iron and Steel Institute: Washington, DC, USA, 1979. [Google Scholar]
Disclaimer/Publisher’s Note: The statements, opinions and data contained in all publications are solely those of the individual author(s) and contributor(s) and not of MDPI and/or the editor(s). MDPI and/or the editor(s) disclaim responsibility for any injury to people or property resulting from any ideas, methods, instructions or products referred to in the content. |
© 2024 by the author. Licensee MDPI, Basel, Switzerland. This article is an open access article distributed under the terms and conditions of the Creative Commons Attribution (CC BY) license (https://creativecommons.org/licenses/by/4.0/).


