Abstract
Cavitation resulting from underwater explosions in compressible multiphase or multicomponent flows presents significant challenges due to the dynamic nature of shock–cavitation–structure interactions, as well as the complex and discontinuous nature of the involved interfaces. Achieving accurate resolution of interfaces between different phases or components, in the presence of shocks, cavitating regions, and structural interactions, is crucial for modeling such problems. Furthermore, pressure convergence in simulations involving shock–cavitation–structure interactions requires accurate algorithms. In this research paper, we employ the diffuse interface method, also known as the interface-capturing scheme, to investigate cavitation in various underwater explosion test cases near different surfaces: a free surface and a rigid surface. The simulations are conducted using the unstructured compressible Navier–Stokes (UCNS3D) finite-volume framework employing central-weighted essentially non-oscillatory (CWENO) reconstruction schemes, utilizing the five-equation diffuse interface family of methods. Quantitative comparisons are made between the performance of both models. Additionally, we examine the effects of cavitation as a secondary loading source on structures, and evaluate the ability of the CWENO schemes to accurately capture and resolve material interfaces between fluids with minimal numerical dissipation or smearing. The results are compared with existing high-order methods and experimental data, where possible, to demonstrate the robustness of the CWENO schemes in simulating cavitation bubble dynamics, as well as their limitations within the current implementation of interface capturing.
1. Introduction
Cavitation, which refers to the formation of vapour bubbles within a liquid due to high velocities and strong acceleration at low pressure, has diverse applications in various scientific and engineering fields. It can be beneficial in marine design engineering for reducing skin friction drag and achieving high speed for submerged projectiles, as well as in medicine for treating kidney stones and cancerous bodies. However, cavitation can also have adverse effects, such as material erosion, noise, and vibrations in marine propellers and turbomachinery, that can cause significant damage. Therefore, understanding the dynamics of cavitation is crucial, but it poses challenges in numerical simulations of compressible multiphase problems due to the complex physics involved in phase change, high gradients of flow variables, numerical discretization choices, and validation with experimental results. Numerical studies often focus on attached cavitations, as they are the primary subject of investigation in most research [1,2,3]. However, hull/bulk cavitation, which occurs during underwater explosions, is different as it evolves rapidly and unsteadily, changing dimensions before collapsing violently due to the surge in pressure, resulting in erratic and rapidly changing cavitation patterns. This makes numerical simulations of hull/bulk cavitation more challenging.
In hull cavitation, vapour bubbles are created on the surface of a submerged rigid surface, such as a projectile, ship hull, or submarine, due to rarefaction caused by high-pressure shock waves from an explosion. On the other hand, bulk cavitation occurs near a free surface between two interacting fluids due to the explosive shock waves, leading to widespread cavitation throughout the liquid. Hull cavitation is often more challenging to study using numerical methods due to its rapid and unsteady nature, while bulk cavitation is characterized by the formation of large-scale vapour bubbles throughout the liquid. Both forms of cavitation can have detrimental effects on marine structures and machinery.
In the context of hull or bulk cavitation, where regions experience extreme variations in pressure, negative pressure values are observed, which are physically unrealistic and can cause numerical codes to fail. To address this issue, two common approaches are used in diffuse interface models for simulating UNDEX (underwater explosion) phenomena. The first approach is to incorporate a single-fluid model, which has been used by several researchers [4,5,6,7,8,9] in similar UNDEX simulations. Various methods in this category, such as the cut-off model, vacuum model, isentropic model, Schmidt model, and modified Schmidt model, have been used to avoid negative pressure values during cavitation. The cut-off model assumes that cavitation bubbles do not form until the pressure drops below a critical value, known as the cut-off pressure, and is generally accurate in predicting peak pressure at the cavitation boundary but may not accurately predict cavitation collapse periods. The Schmidt model is accurate when the void fraction (ratio of vapour bubble density to total fluid density) is less than 10 −5 [4] but has limitations in calculating the speed of sound, making it suitable for high-speed cavitating flows. The modified Schmidt model is an extension of the original Schmidt model and addresses its limitations, thereby expanding its range of applicability to larger vapour-to-liquid density ratios. The vacuum cavitation model assumes zero mass inside the cavitation bubble but is limited in capturing the complex shapes and dynamics of cavitation bubbles in multidimensional flows. The isentropic model, which has been used in the five-equation diffuse interface models [5,10], is robust as it considers the mixture as consisting of isentropic vapour and liquid phases, but it requires more computational resources and the predetermination of a model parameter k [4]. The cut-off model is preferred in this case as it is relatively simple to implement and does not alter peak pressure accuracy at the cavitation boundary, which is important for the UNDEX test cases considered in the studies. The one-fluid cavitation model aligns with the no-phase transition assumption of the five-equation interface-capturing models used in this study.
The accuracy of the one-fluid model in predicting the details of the cavitation process, including thermodynamic aspects, in compressible two-phase flows, is limited due to its inability to account for mass and heat transfer between the liquid and vapour phases. To overcome this limitation, researchers have extended simplified diffuse interface models such as the four-, five-, or six-equation models by incorporating source terms in the energy and mass conservation equations to represent mass and heat transfer. This approach, known as the “two-fluid cavitation model”, aims to prevent non-physical pressure occurrences in the cavitation region. The source terms are implicitly expressed using an algebraic relaxation solver for phase transition modeling, as proposed by Pelanti and Shyue [11,12]. However, this method is more complex and computationally expensive, especially for seven-equation diffuse interface models such as the full non-equilibrium models of Baer–Nunziato [13] or Saurel–Abgrall [14]. A computational efficient and simple strategy in UNDEX is to employ a reduced diffuse interface model with phase transition, such as four- or five-equation models, which enforce mechanical, thermal, or both equilibrium. Jun et al. [15] extended the phase transition model used by Chiapolino et al. [16] for the four-equation model to study cavitation in underwater explosion test cases. Other existing diffuse interface models with phase transitions include those proposed by Pelanti and Shyue [9,11], Martelot et al. [17], Zein et al. [18], and others [14]. Ma et al. [19] utilised the Kapila [20] variant of the five-equation two-phase flow model with thermo-chemical relaxation terms to investigate liquid–vapour phase transition in cavitating flows for UNDEX test cases.
The present study focuses on hull and bulk cavitation in compressible multiphase or multicomponent flows, specifically in the context of underwater explosions. Two interface-capturing models, namely the ones proposed by Allaire et al. [21] and Kapila et al. [20], will be used to investigate the cavitation phenomenon in this study. The performance of these models will be evaluated using four underwater explosion (UNDEX) test cases in the open-source finite-volume UCNS3D solver [22].
To solve the interface-capturing models, high-order central-weighted essentially non-oscillatory (CWENO) schemes for multicomponent species within the finite-volume framework, as implemented by Tsoutsanis and Dumbser [23], will be employed. The CWENO schemes offer computational advantages such as lower cost and faster computation compared to classical WENO schemes, due to the use of low-order polynomials associated with directional stencils and their reduced size compared to the high-order polynomials related to the central stencil. These advantages will be fully utilised in capturing the dynamics of cavitation in the test cases considered herein.
The paper proceeds to Section 2, where it presents the governing equations that describe the diffuse interface models of Allaire et al. [21] and Kapila et al. [20], which consist of five equations. It includes details about the additional term that distinguishes these models, as well as the cut-off model used to prevent non-physical pressure values during cavitation. In Section 3, the implementation of the reconstruction process of the CWENO schemes is described, including the chosen fluxes and temporal discretization, within the finite-volume framework using the diffuse interface methods mentioned earlier. Section 4 is dedicated to the study of five test cases, where the proposed method is utilised to investigate cavitation occurrences in underwater explosions near different boundaries, such as a planar solid wall, a closed cylindrical container, and a free surface. The analysis focuses on parameters such as the influence of shock loading and cavitation collapse reloading on nearby structures like ship hulls or closed tanks. Additionally, the bubble dynamics of cavitating flows induced by underwater explosions near a free surface, as well as the impact of bubble separation distance on cavitation phenomena, are analyzed. The numerical results obtained are compared with analytical, experimental, and reference solutions whenever possible. A comparison between the five-equation models of Allaire et al. [21] and Kapila et al. [20] is also presented. Finally, the last section provides concluding remarks and a summary drawn from this study.
2. The Five-Equation Diffuse Interface Model
The five-equation model typically consists of two continuity equations: one momentum equation and one energy equation coupled with a non-conservative advection equation of the volume-fraction equation. The common five-equation models are the Allaire et al. [21], Kapila et al. [20], Murrone et al. [24], and Wackers et al. [25] models. All these are simpler formulations or reductions to lesser unknowns of the full seven (7) Baer–Nunziato [13] equations, which are often too complex to solve numerically. In this paper, we shall only be considering the Allaire and Kapila five-equation models. The difference between Allaire’s and Kapila’s models is only in the non-conservative advection equation in the volume-fraction equation. The equations are presented below:
where the subscript represents the fluid’s component, is the volume fraction of each component, is the density, is the velocity, p is the pressure, and E is the total energy.
This class of five-equation models (Allaire et al. [21] and Kapila et al. [20] model) is often referred to as mechanical equilibrium models. We assume that the momentum, energy, and mass transfer between the phases reach equilibrium due to the thermodynamic difference between each component. This reasonable flow assumption involves a free surface like the one treated in this paper. Note that this is a mechanical equilibrium of the fluid: each phase remains in thermal disequilibrium. All the models in this category can be expressed in the following general form of a non-linear system of partial differential equations in multiple space dimensions:
where Q is the vector of evolution variables (conserved and not conserved), F is a flux function, is the velocity field, and H and S are non-conservative quantities.
We then define Q, F, and H in the form as presented in Equation (8) (Allaire et al.’s model [21]) and Equation (9) (Kapila et al.’s model [21]) for a two-phase flow. The K∇· v term in Kapila’s model [20] describes the compressibility and thermodynamic properties of the mixture region of the two-phase fluid. It is derived from the asymptotic reduction of Baer–Nunziato’s seven-equation model [13,26,27]. From Equations (5) and (6), the term differentiates Kapila et al.’s model [20] from Allaire et al.’s model [21].
Allaire et al.’s five-equation model, presented in vector form:
Kapila et al.’s five-equation model, presented in vector form:
For each fluid’s component i, the mixture is assumed to be in mechanical equilibrium, as stated previously. The velocity and pressure of each component is and (i.e., we maintain a single velocity and single pressure for the mixture).
The total density, momentum, and kinetic and internal energy of the mixture are stated below:
So, the total energy can be expressed as:
To determine the internal energy and put closure to the equations, it is convenient to use the stiffened equation of state (EOS) introduced by Harlow and Amsden [28] to describe the thermodynamic properties of both fluid components:
Using the stiffened EOS, the internal energy can now be expressed as:
and the total energy below:
From the five equations, as shown in Equations (5) and (6), the advection equation of the volume fraction is in a non-conservative form, which will present some difficulties when solving our five-equation model. We simplify it into a conservative term using Johnsen and Colonius’s [29] approach.
First, let f represent a vector in three-dimensional form, defined as
The divergence of f then is:
And then:
Substituting into the non-conservative advection equation of the volume fraction in Equations (5) and (6) to obtain the quasi-conservative form, the equation for the advection of the volume fraction can be written as Equations (18) and (19).
For Allaire et al.:
For Kapila et al.:
The K function in Kapila et al.’s model can be determined from Equation (20), where the mixture’s speed of sound is obtained using Wood’s speed of sound, as seen in Equation (22)
where , and are given as:
The “mixture-mixture” speed of sound derived from the stiffened-gas (SG)-EOS mixture is used for the Allaire et al. five equations [21] and is given as follows:
Cut-Off Methods
The stiffened-gas equation of state (SG-EOS) introduced by Harlow and Amsden [30] has been commonly used by various authors [29,31,32,33] to achieve thermodynamic closure for multiphase compressible flow, including flows involving cavitation. However, in cases where the pressure difference between the two-phase medium is considerably high, such as in underwater explosions, the use of stiffened-gas EOS alone may not be sufficient. This is because cavitation induced by the high-pressure surge is very fast, unsteady, and rapidly evolves into various dimensions before collapsing violently, resulting in non-physical negative pressures when using only the stiffened-gas EOS. Similar findings have been reported by other authors in their numerical simulations.
To improve the accuracy of simulations for cavitating flows, modifications are needed. One common approach is to incorporate an additional single-fluid model to circumvent the issue, such as the cut-off model, isentropic model, or Schmidt model, which have been used by authors in previous studies. Among these models, the cut-off model is often preferred due to its simplicity of implementation and preservation of peak pressure accuracy during cavitation collapse, which is important in underwater explosion (UNDEX) test cases. Additionally, these models are pure phase models that do not consider phase exchange, as noted in previous studies [4,34]. Further details of these models can be found in the references cited. In the cut-off model, once the pressure in the cavitation region drops below a certain fixed saturation pressure psat, the non-physical pressure computed assumes a new value, which is the value set for the psat.
The physical saturation pressure () is chosen to be a comparatively small value in relation to the significantly higher ambient pressure exerted by the fluid, and refers to the static pressure at cell i. To avoid the negative physical pressure that occurs in the cavitating regions when the fluid experiences very steep and large variations in pressure, most authors [4,5,27,35] assume a value between 2000 and 5000 Pa.
The mixture’s internal energy can be expressed as:
and the total energy is final given by:
3. Numerical Model
3.1. Finite-Volume Framework
Let us consider a 3D domain consisting of conforming tetrahedral, hexahedral, prism, and pyramid, triangles, or quadrilateral cells, each one of them indexed by a unique mono-index i, and the governing equations of the five-equation model written in vector form as follows:
where is the vector of conserved variables and the volume fraction of one species, and is the non-linear flux in the direction normal to the cell interface, as given below:
and expressed as:
Integrating Equation (26) over the mesh element i using a high-order explicit finite-volume formulation, the following equation is obtained that incorporates the source term as previously defined:
where is the volume-averaged vector of variables
and is a numerical flux function in the direction normal to the cell interface between a considered cell i and one of its neighboring cells j. is the number of faces per element, is the number of quadrature points used for approximating the surface integrals, is the surface area of the corresponding face, and and are the high-order approximations of the solutions for cell i and cell j, respectively. corresponds to different Gaussian integration points and weights over each face. corresponds to the volume-averaged volume fraction of cell i at time level n. A suitable Gauss–Legendre quadrature numerically approximates the volume, surface, and line integrals.
The reconstruction process adopted in UCNS3D [22] follows the approaches of Tsoutsanis et al. [23,36] and Titarev et al. [36] that have been previously applied to a wide range of smooth and discontinuous flow compressible flow problems, including laminar, transitional, and fully turbulent settings.
3.2. CWENO Scheme
Tsoutsanis’s and Dumbser’s [23] CWENO and CWENOZ schemes for mixed-element unstructured mesh schemes were used to test compressible multiphase components [33,37,38]. Their paper shows that the CWENO scheme can produce lesser oscillations near the interface at a cheaper computational cost than the WENO schemes on the same grid. This is made possible by the fact that in the presence of discontinuity, the CWENO scheme, unlike the traditional WENO schemes, uses the lower-order polynomials from the directional stencils that might contain a smooth solution for its reconstruction and, in the presence of smooth use, the optimal polynomial in the desired order of accuracy. This slight but significant difference gives the CWENO scheme advantages over the WENO schemes. The CWENO scheme will be discussed below briefly, and consequently, the same schemes will be used in capturing and resolving the material interface between the two-phase medium of UNDEX. More details of the CWENO schemes implemented by Tsoutsanis on an unstructured grid can be seen in Refs. [23,33].
The optimal polynomial is defined as:
where s is the stencil index, with being the central stencil; being the directional stencil; being the total number of stencils; and being the linear coefficients for each stencil, whose sum is equal to 1. The polynomial is not computed directly but computed by subtracting the lower-order polynomials from the optimum polynomial as follows:
The CWENO scheme computes a reconstruction polynomial below as a non-linear combination of all the polynomials:
where corresponds to the non-linear weights assigned to each polynomial, and in regions with smooth data, , hence obtaining the high-order approximation from the central stencil. In regions of discontinuous solutions, the reconstructed solution will be mostly influenced from the lower-order polynomials of the directional stencils using the Type 3 directional stencils. The reader is referred to the work of Tsoutsanis [39] for the stencil selection algorithms. are the reconstructed degrees of freedom, and the non-linear weight is defined as such that the non-linear coefficients are computed from the linear ones as:
where is taken as 10−6 similarly to the WENO reconstructions, denotes the smoothness indicator, and . The readers are referrfed to [23] for a detailed description of the smoothness indicators.
3.3. Fluxes and Time Advancement
For the numerical fluxes, we employ the Harten–Lax–van Leer–Contact Riemann solver of Toro [40]. The solution is advanced in time by a third-order TVD Runge–Kutta method:
and the time step is selected according to:
where is an estimate of the maximum in absolute value of the propagation speed in the cell i, d is the number of dimensions, is a characteristic length of the element i, and CFL refers to the Courant–Friedrichs–Lewy condition. is used for all tests unless otherwise specified. The reconstruction is performed with respect to the primitive variables since they were previously found [33] to be less oscillatory than the conserved variables.
All the volume/surface/line integrals are approximated by the Gaussian quadrature rule suitable for the order of polynomials employed. All the schemes developed are implemented in the UCNS3D CFD code [22], which is written in object-oriented Fortran 2008, employing the MPI message-passing interface (MPI) and the Open Multi-Processing (OpenMP) application programming interface (API), and the reader is referred to [41] for more details on implementation and performance benchmarks.
4. Test Cases
Using the high-order CWENO schemes in conjunction with the five-equation interface-capturing scheme models [20,21], five underwater test problems were selected (initial physical parameters of each fluid can be seen in Table 1) to study the cavitation effect of underwater shock near different boundaries:
- 2D underwater explosion near a free surface.
- 2D cylindrical underwater explosion near a planar rigid wall.
- 3D underwater explosion in an enclosed, rigid cylindrical wall.
- 2D underwater explosion of two bubbles placed horizontally near a free surface.
- 3D underwater of two bubbles placed vertically in an enclosed region.

Table 1.
Summary of the initial physical parameters of each fluid for the five (5) test cases.
Table 1.
Summary of the initial physical parameters of each fluid for the five (5) test cases.
| Test Cases | Materials | u | v | p | |||
|---|---|---|---|---|---|---|---|
| Test 4.1 | Air | 1.225 | 0 | 0 | 2.0 | 0 | |
| Explosive | 1250 | 0 | 0 | 2.0 | 1 | ||
| Water | 1000 | 0 | 0 | 7.15 | 0 | ||
| Test 4.2 | Explosive | 1270 | 0 | 0 | 2.0 | 1 | |
| Water | 1000 | 0 | 0 | 7.15 | 0 | ||
| Test 4.3 | Explosive | 1770 | 0 | 0 | 2.0 | 1 | |
| Water | 1000 | 0 | 0 | 7.15 | 0 | ||
| Test 4.4 | Air | 1.225 | 0 | 0 | 2.0 | 0 | |
| Explosive | 1250 | 0 | 0 | 2.0 | 1 | ||
| Water | 1000 | 0 | 0 | 7.15 | 0 | ||
| Test 4.5 | Explosive | 1770 | 0 | 0 | 2.0 | 1 | |
| Water | 1000 | 0 | 0 | 7.15 | 0 |
4.1. 2D Underwater Explosion near a Free Surface
To study the dynamics of bubbles at the interface between air and water in an underwater explosion, a two-dimensional model of an underwater explosion near the free surface of water is considered. Previous studies by various authors have used numerical [5,15,42,43,44,45,46,47] and experimental [47,48] methods to investigate this phenomenon. For the experimental setup, a spherical charge of silver azide with known initial energy is detonated in an open cylinder half-filled with water, and the process involves charge detonation, bubble pulsation, and jet formation [47].
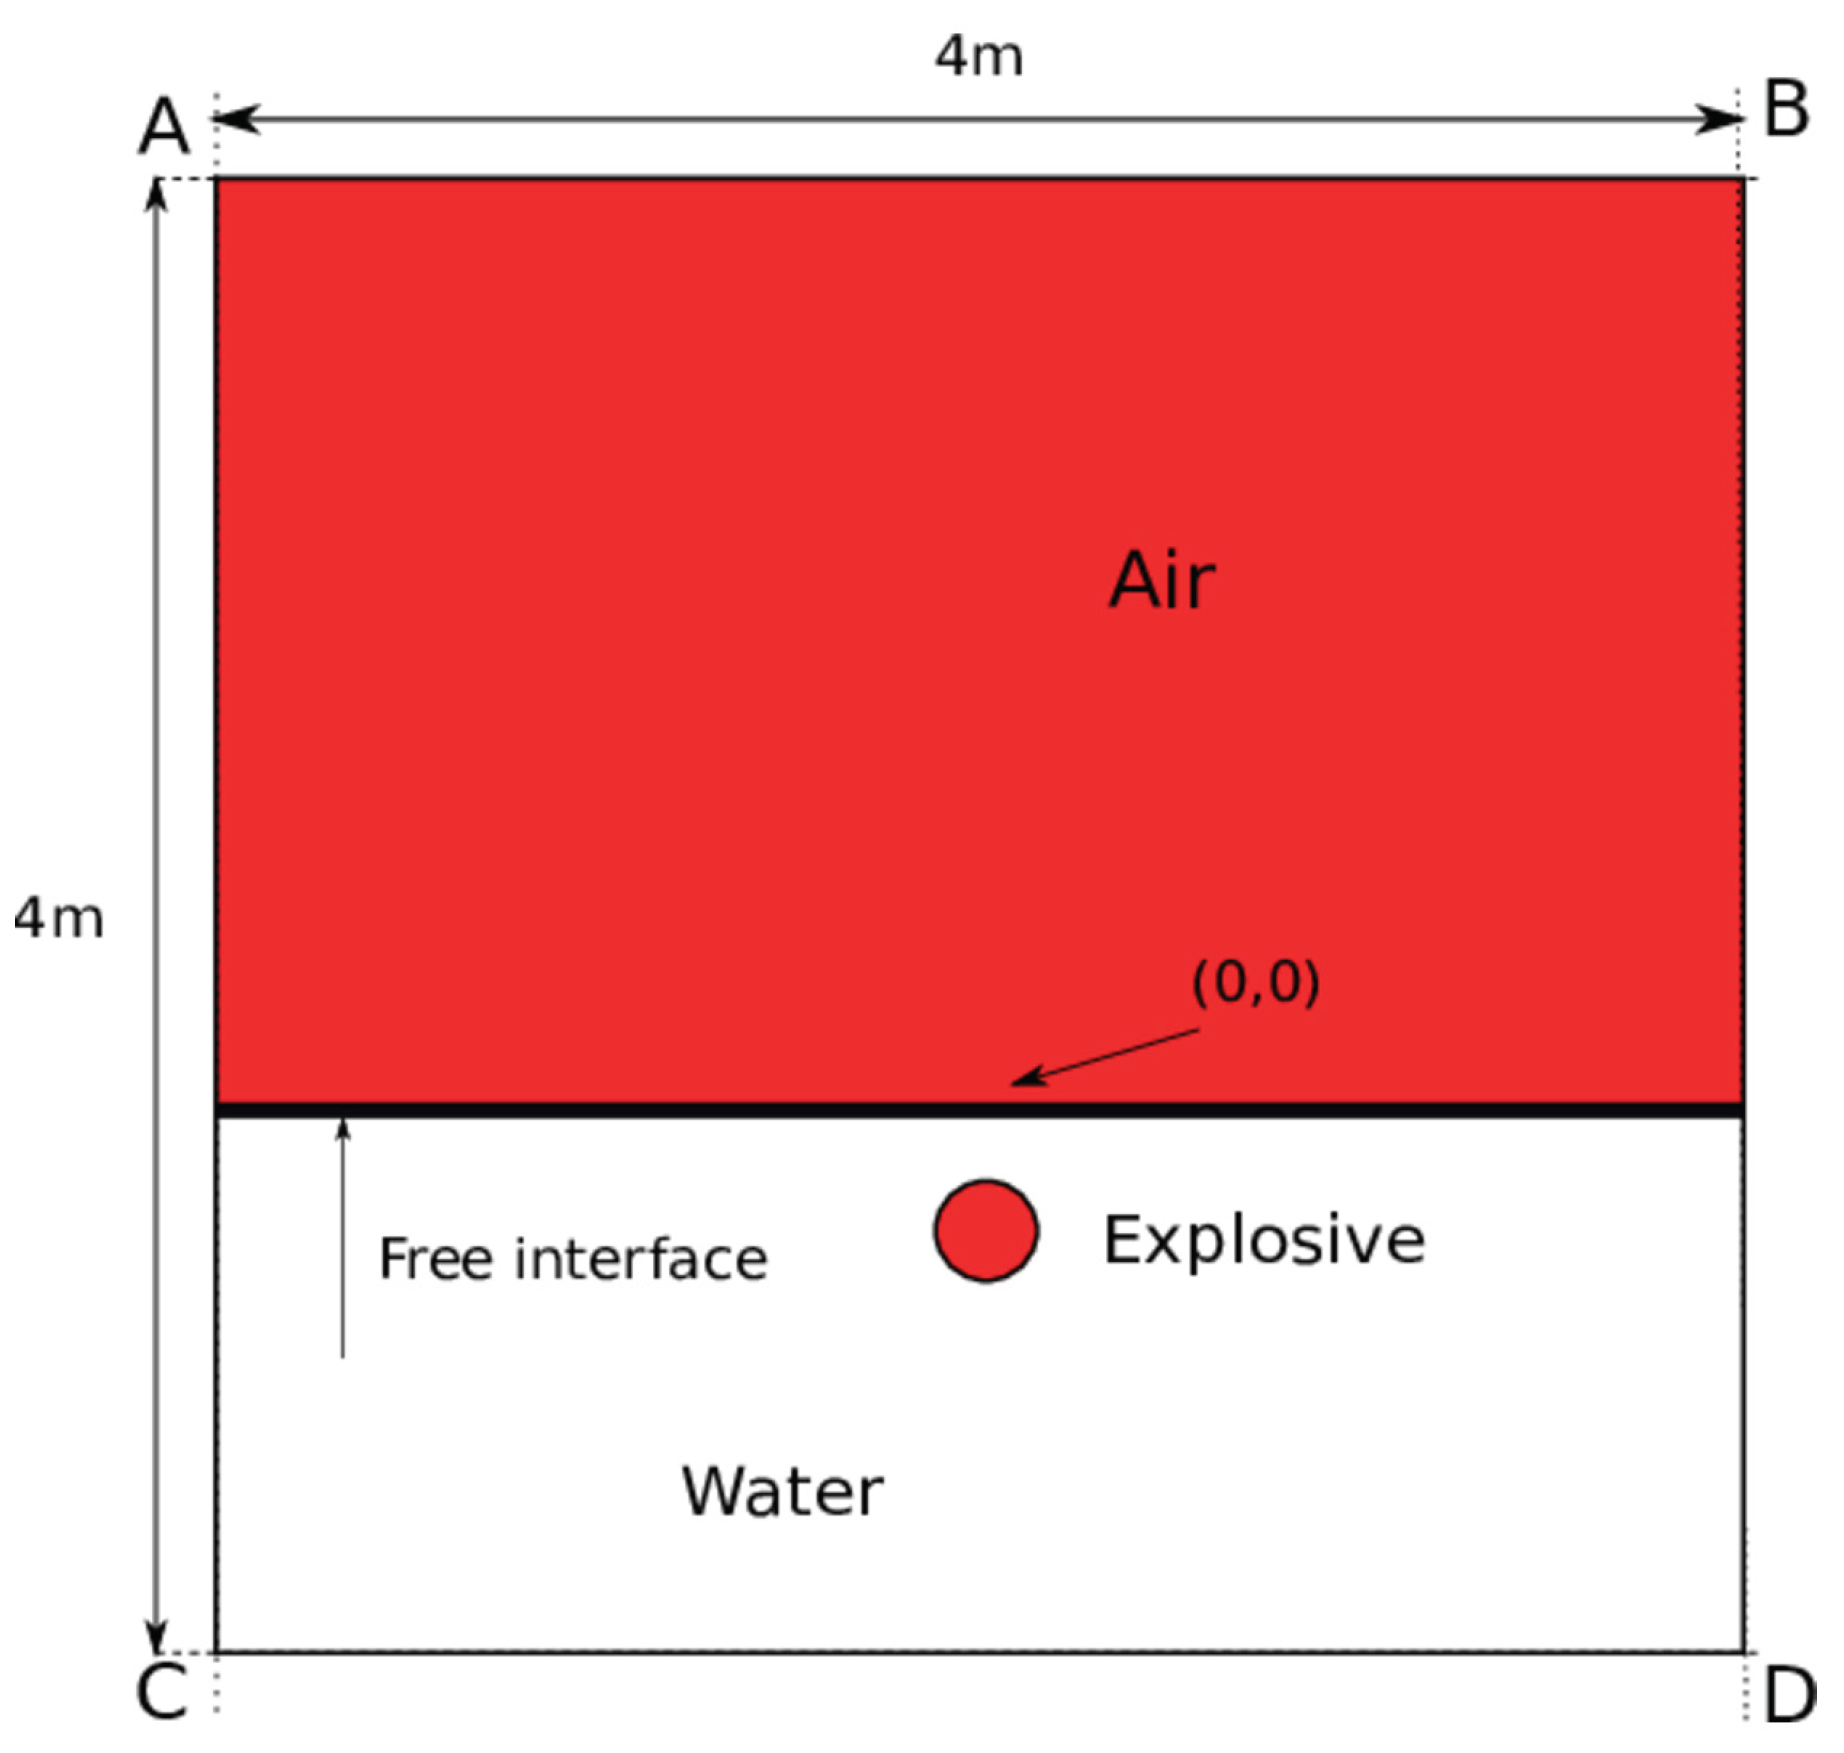
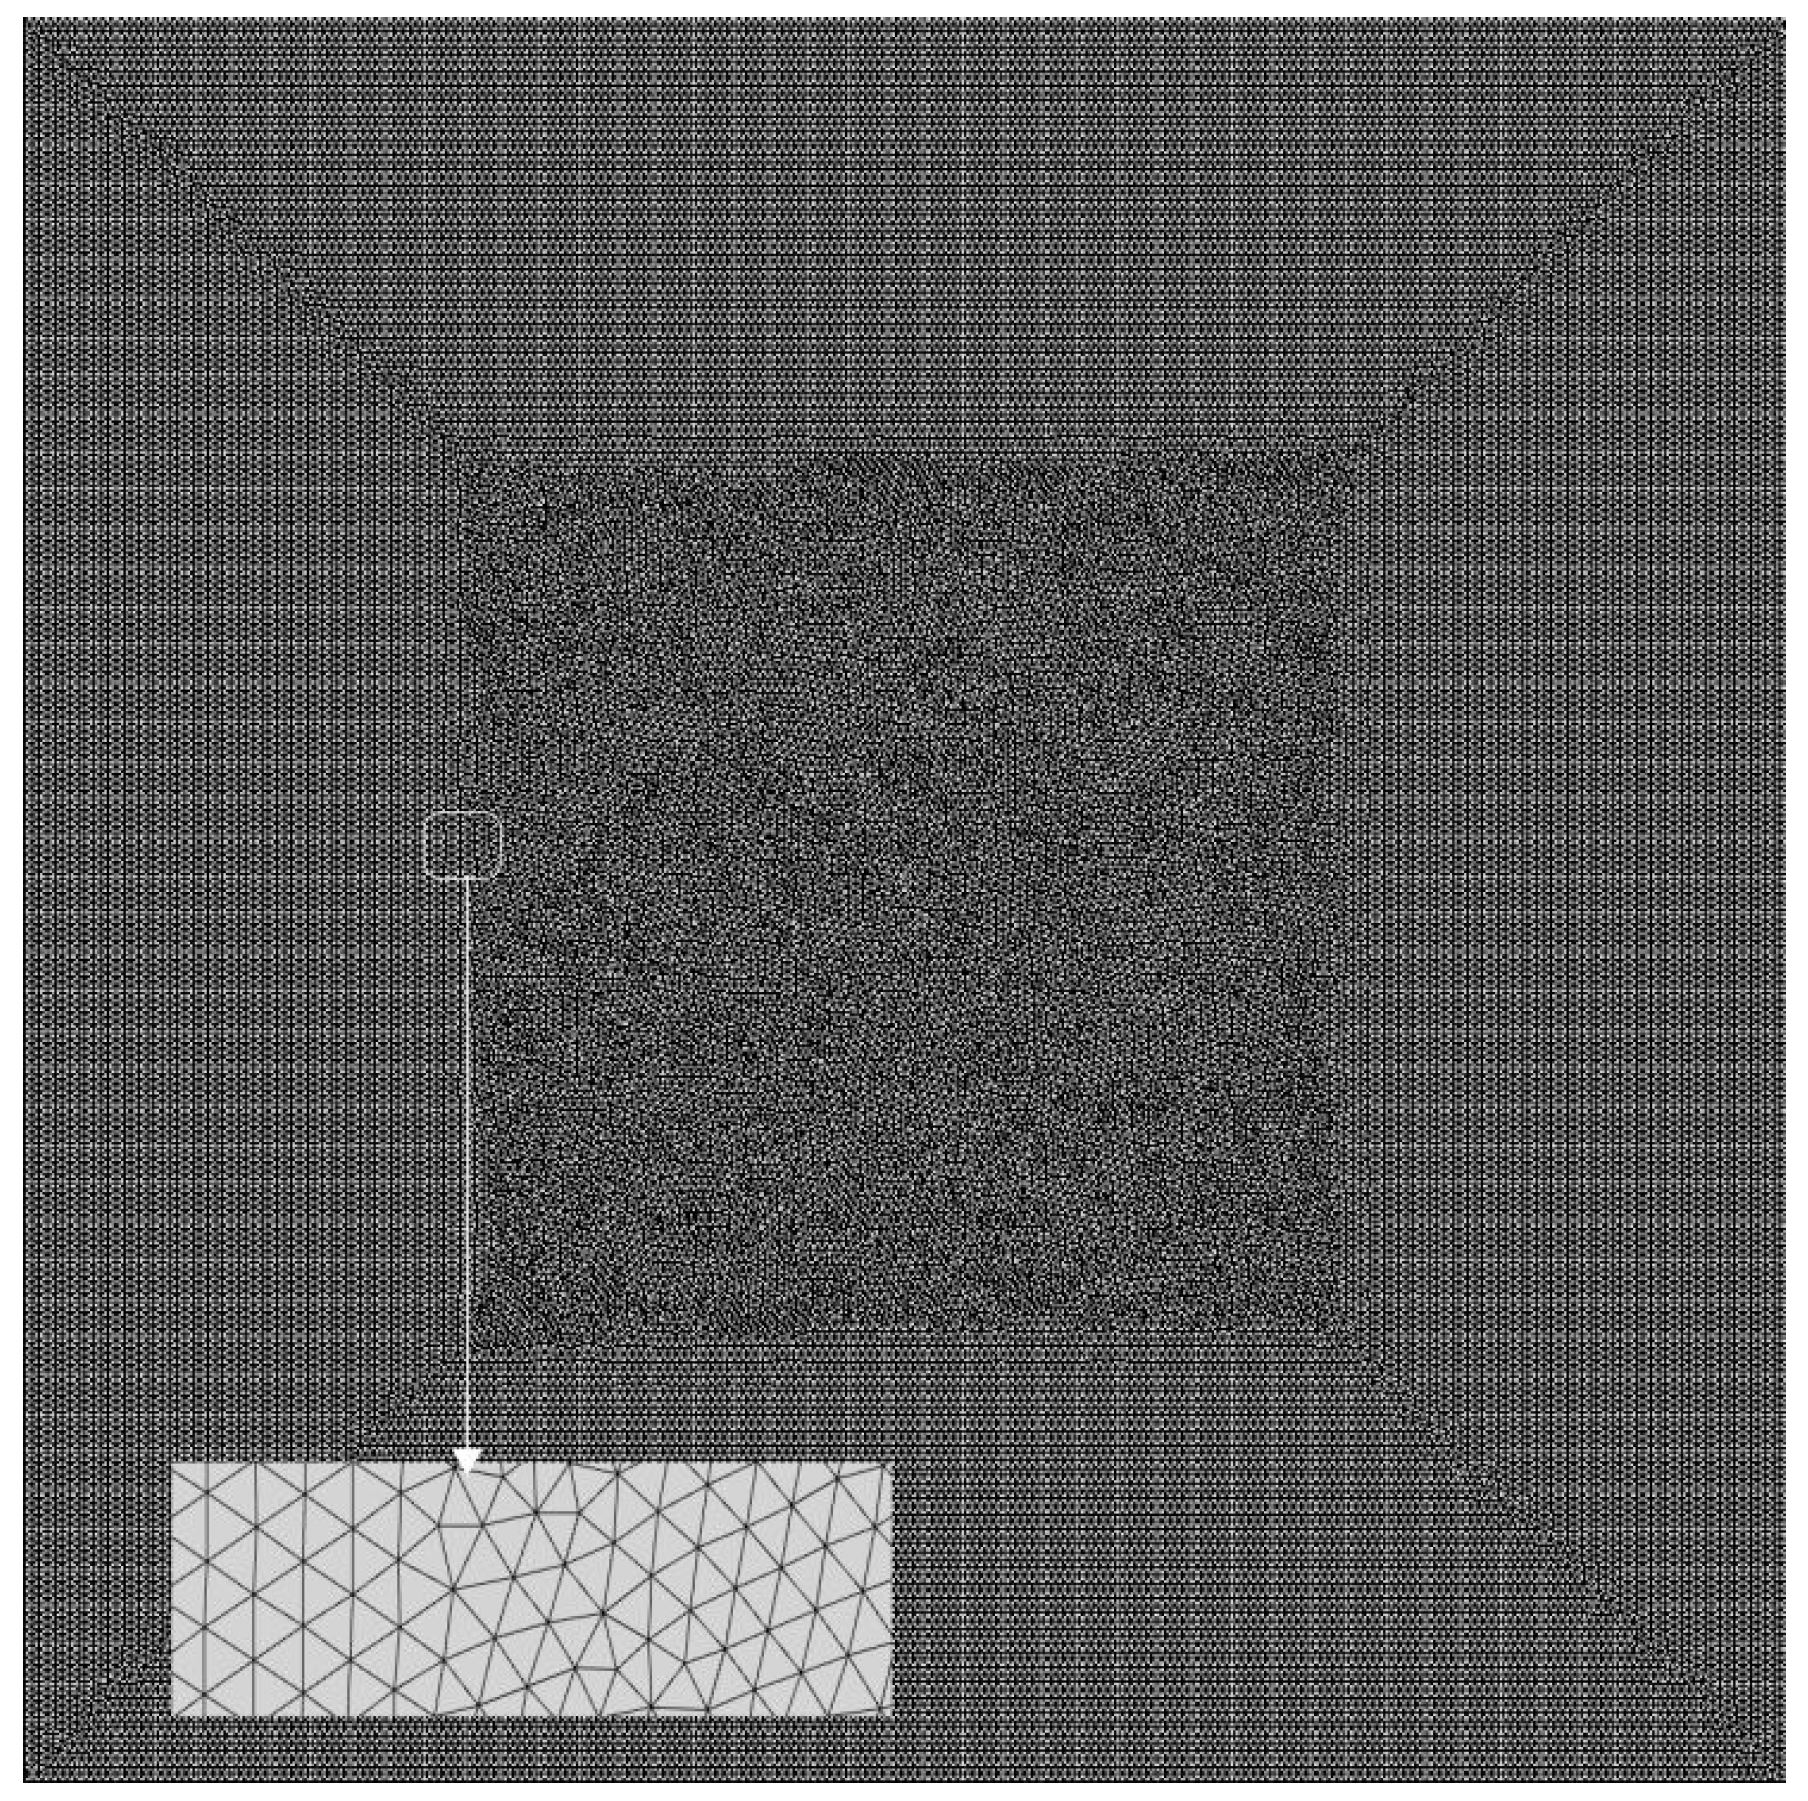
For all of our UNDEX numerical studies in this paper, a pressurized bubble will be used as a substitute for explosives in underwater explosions. The pressurized gas bubble with a diameter of 0.24 m is placed at [0, −0.3] m in the two-phase medium, using a similar setup as that seen in Shukla et al.’s work [46]. Our computational domain is a square area with of dimensions () m (Figure 1) and discretized with a mixed-element unstructured mesh, incorporating quadrilateral and triangular elements in 2D, as shown in Figure 2, with the air–water interface positioned at the centre .
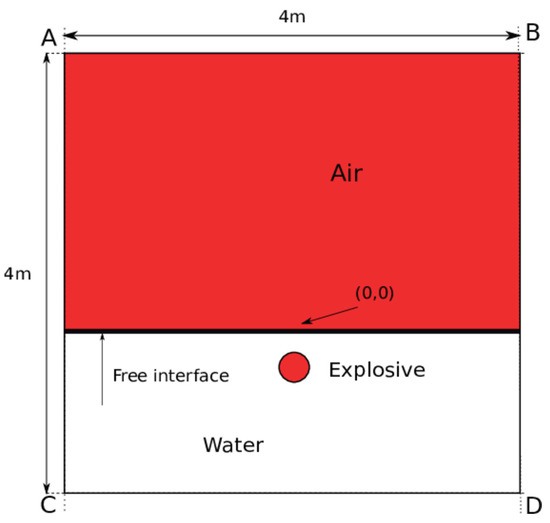
Figure 1.
Computational domain setup for a two-dimensional underwater explosion near a free surface.
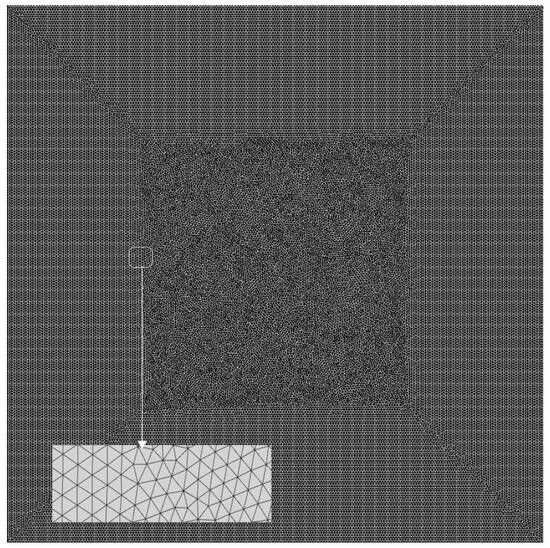
Figure 2.
Underwater explosion near a free surface; 2D unstructured finest mesh with triangular elements used for this test case. The density of mesh elements in specific areas of the domain is increased to better capture the physical phenomena occurring in those regions. The zoomed-in area on the left provides a more detailed view of the mesh’s structure.
Transparent boundary conditions were set up at the top, left, and right surfaces, while the bottom was set to reflecting. The simulation was carried out until ms as the final time, and the initial physical parameters of each fluid (density, velocities, pressure, specific heat ratio, and volume fraction) were set accordingly, as presented below:
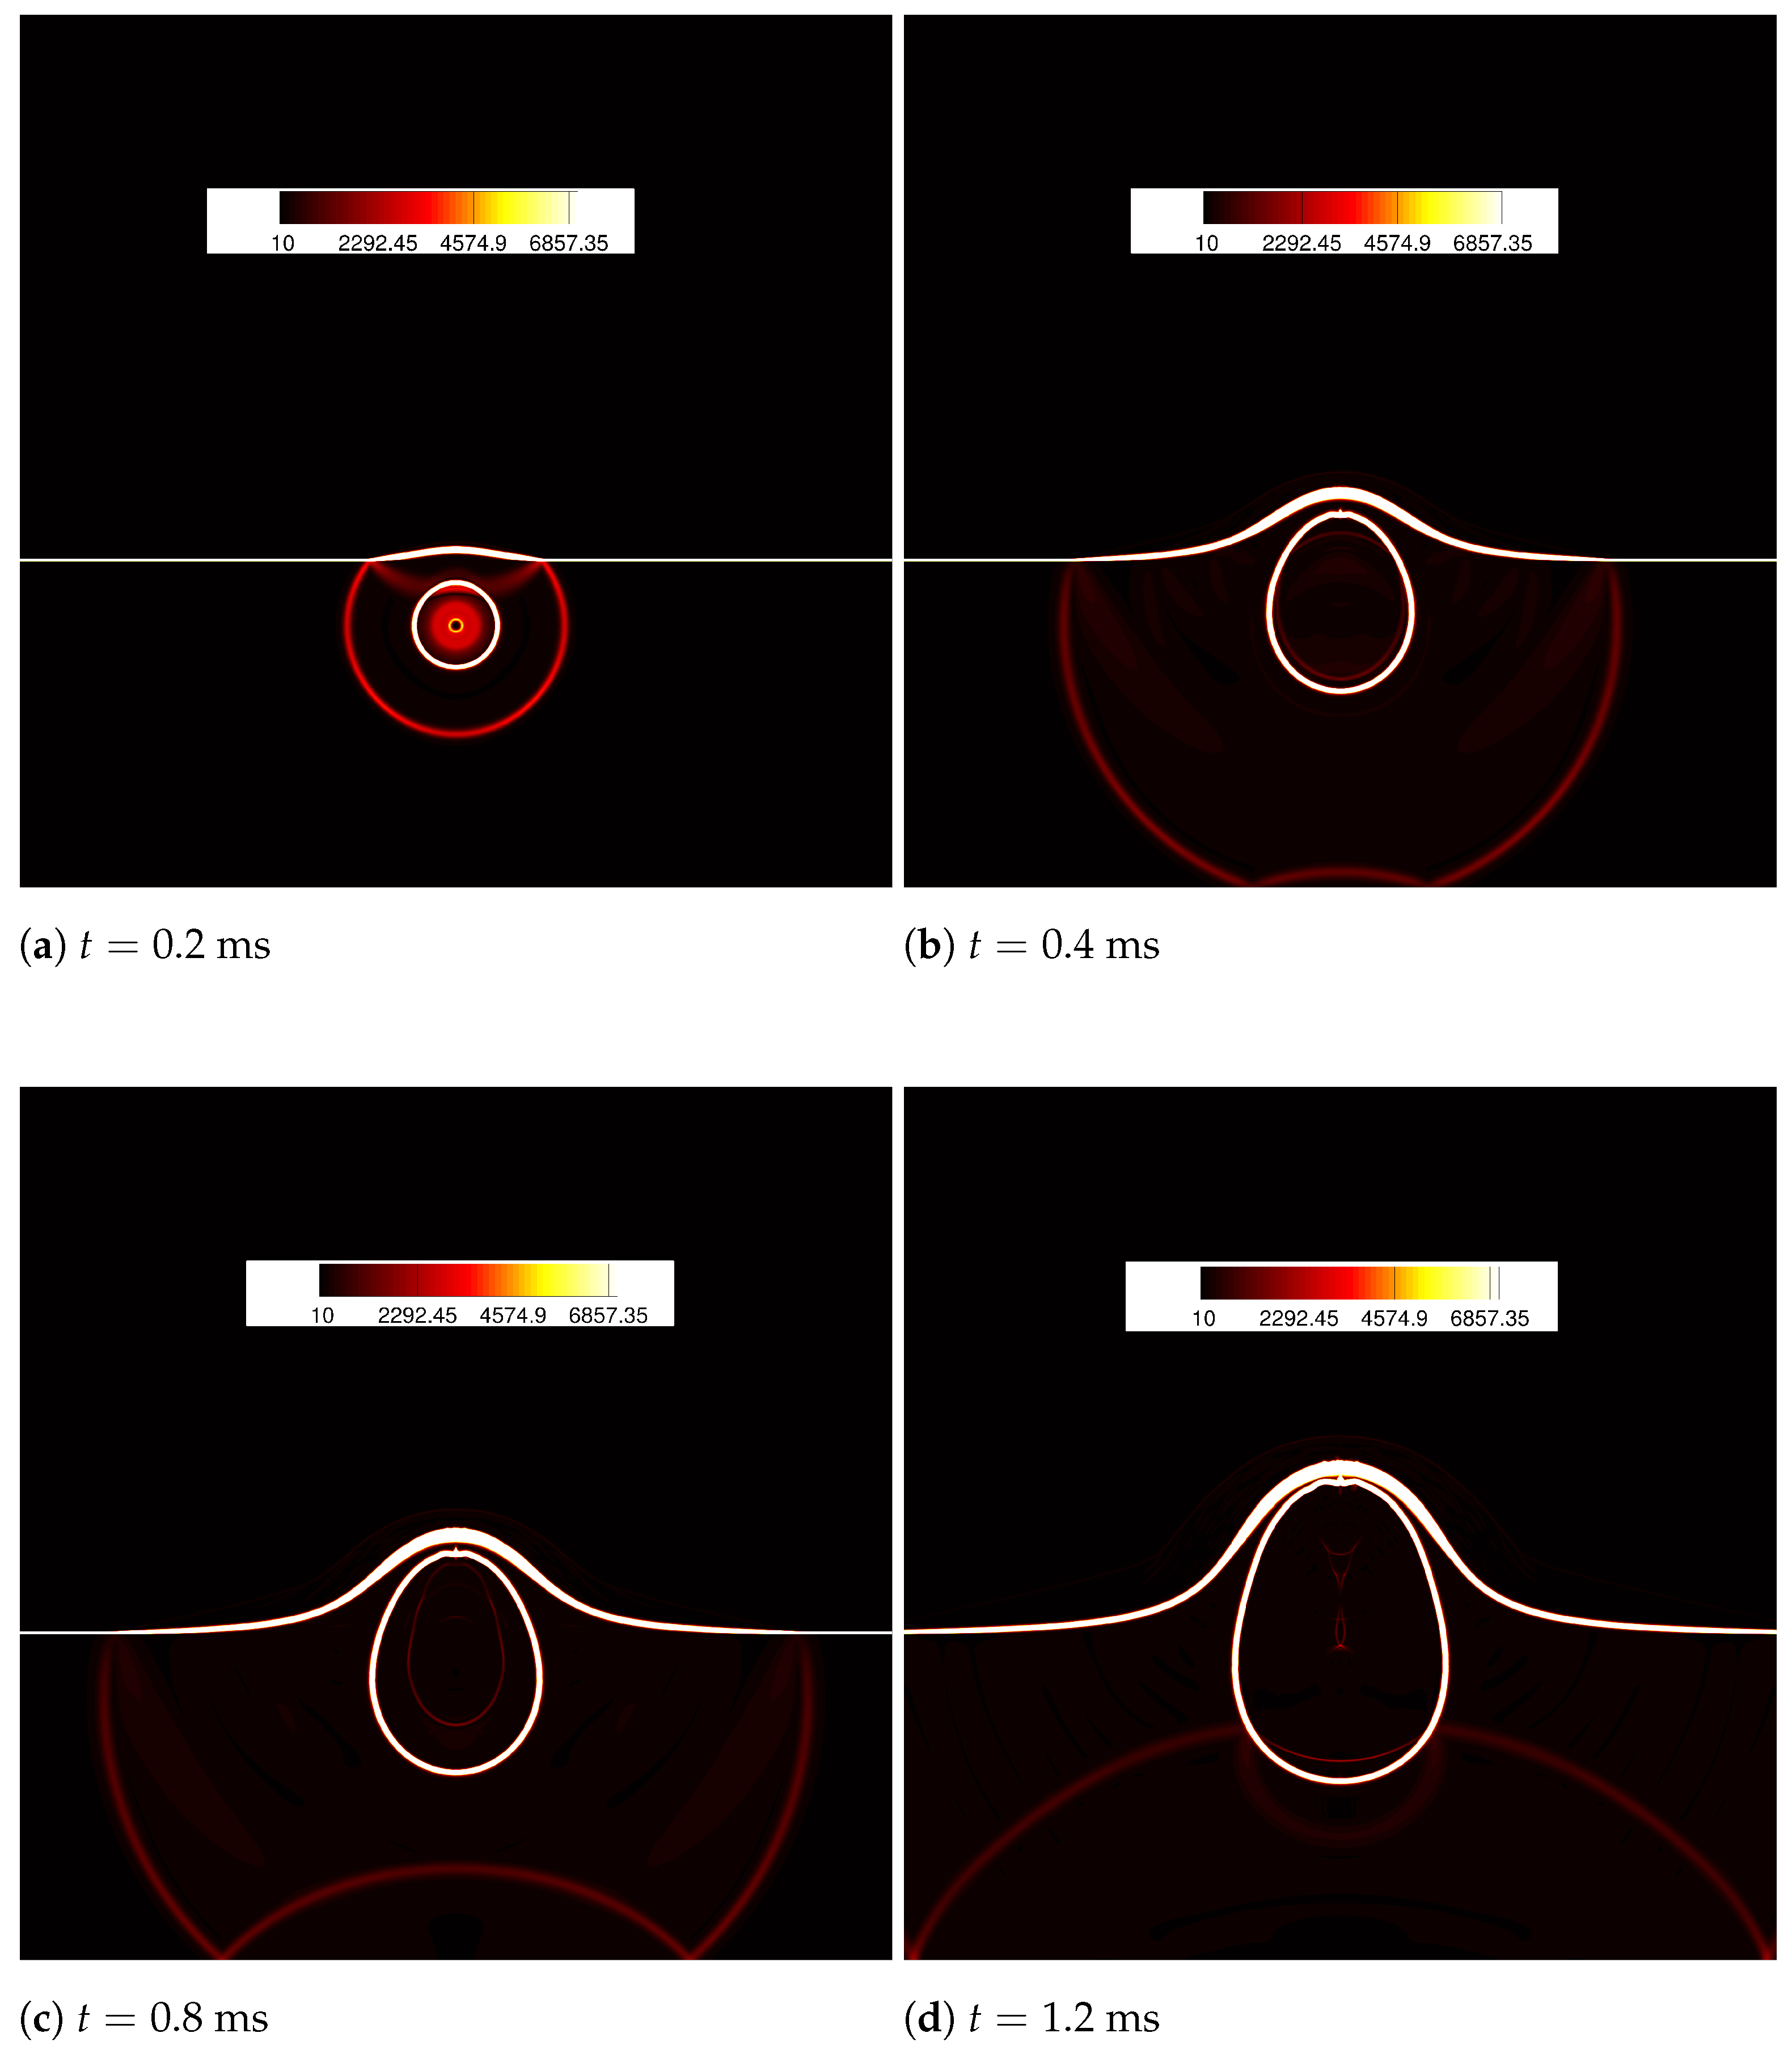
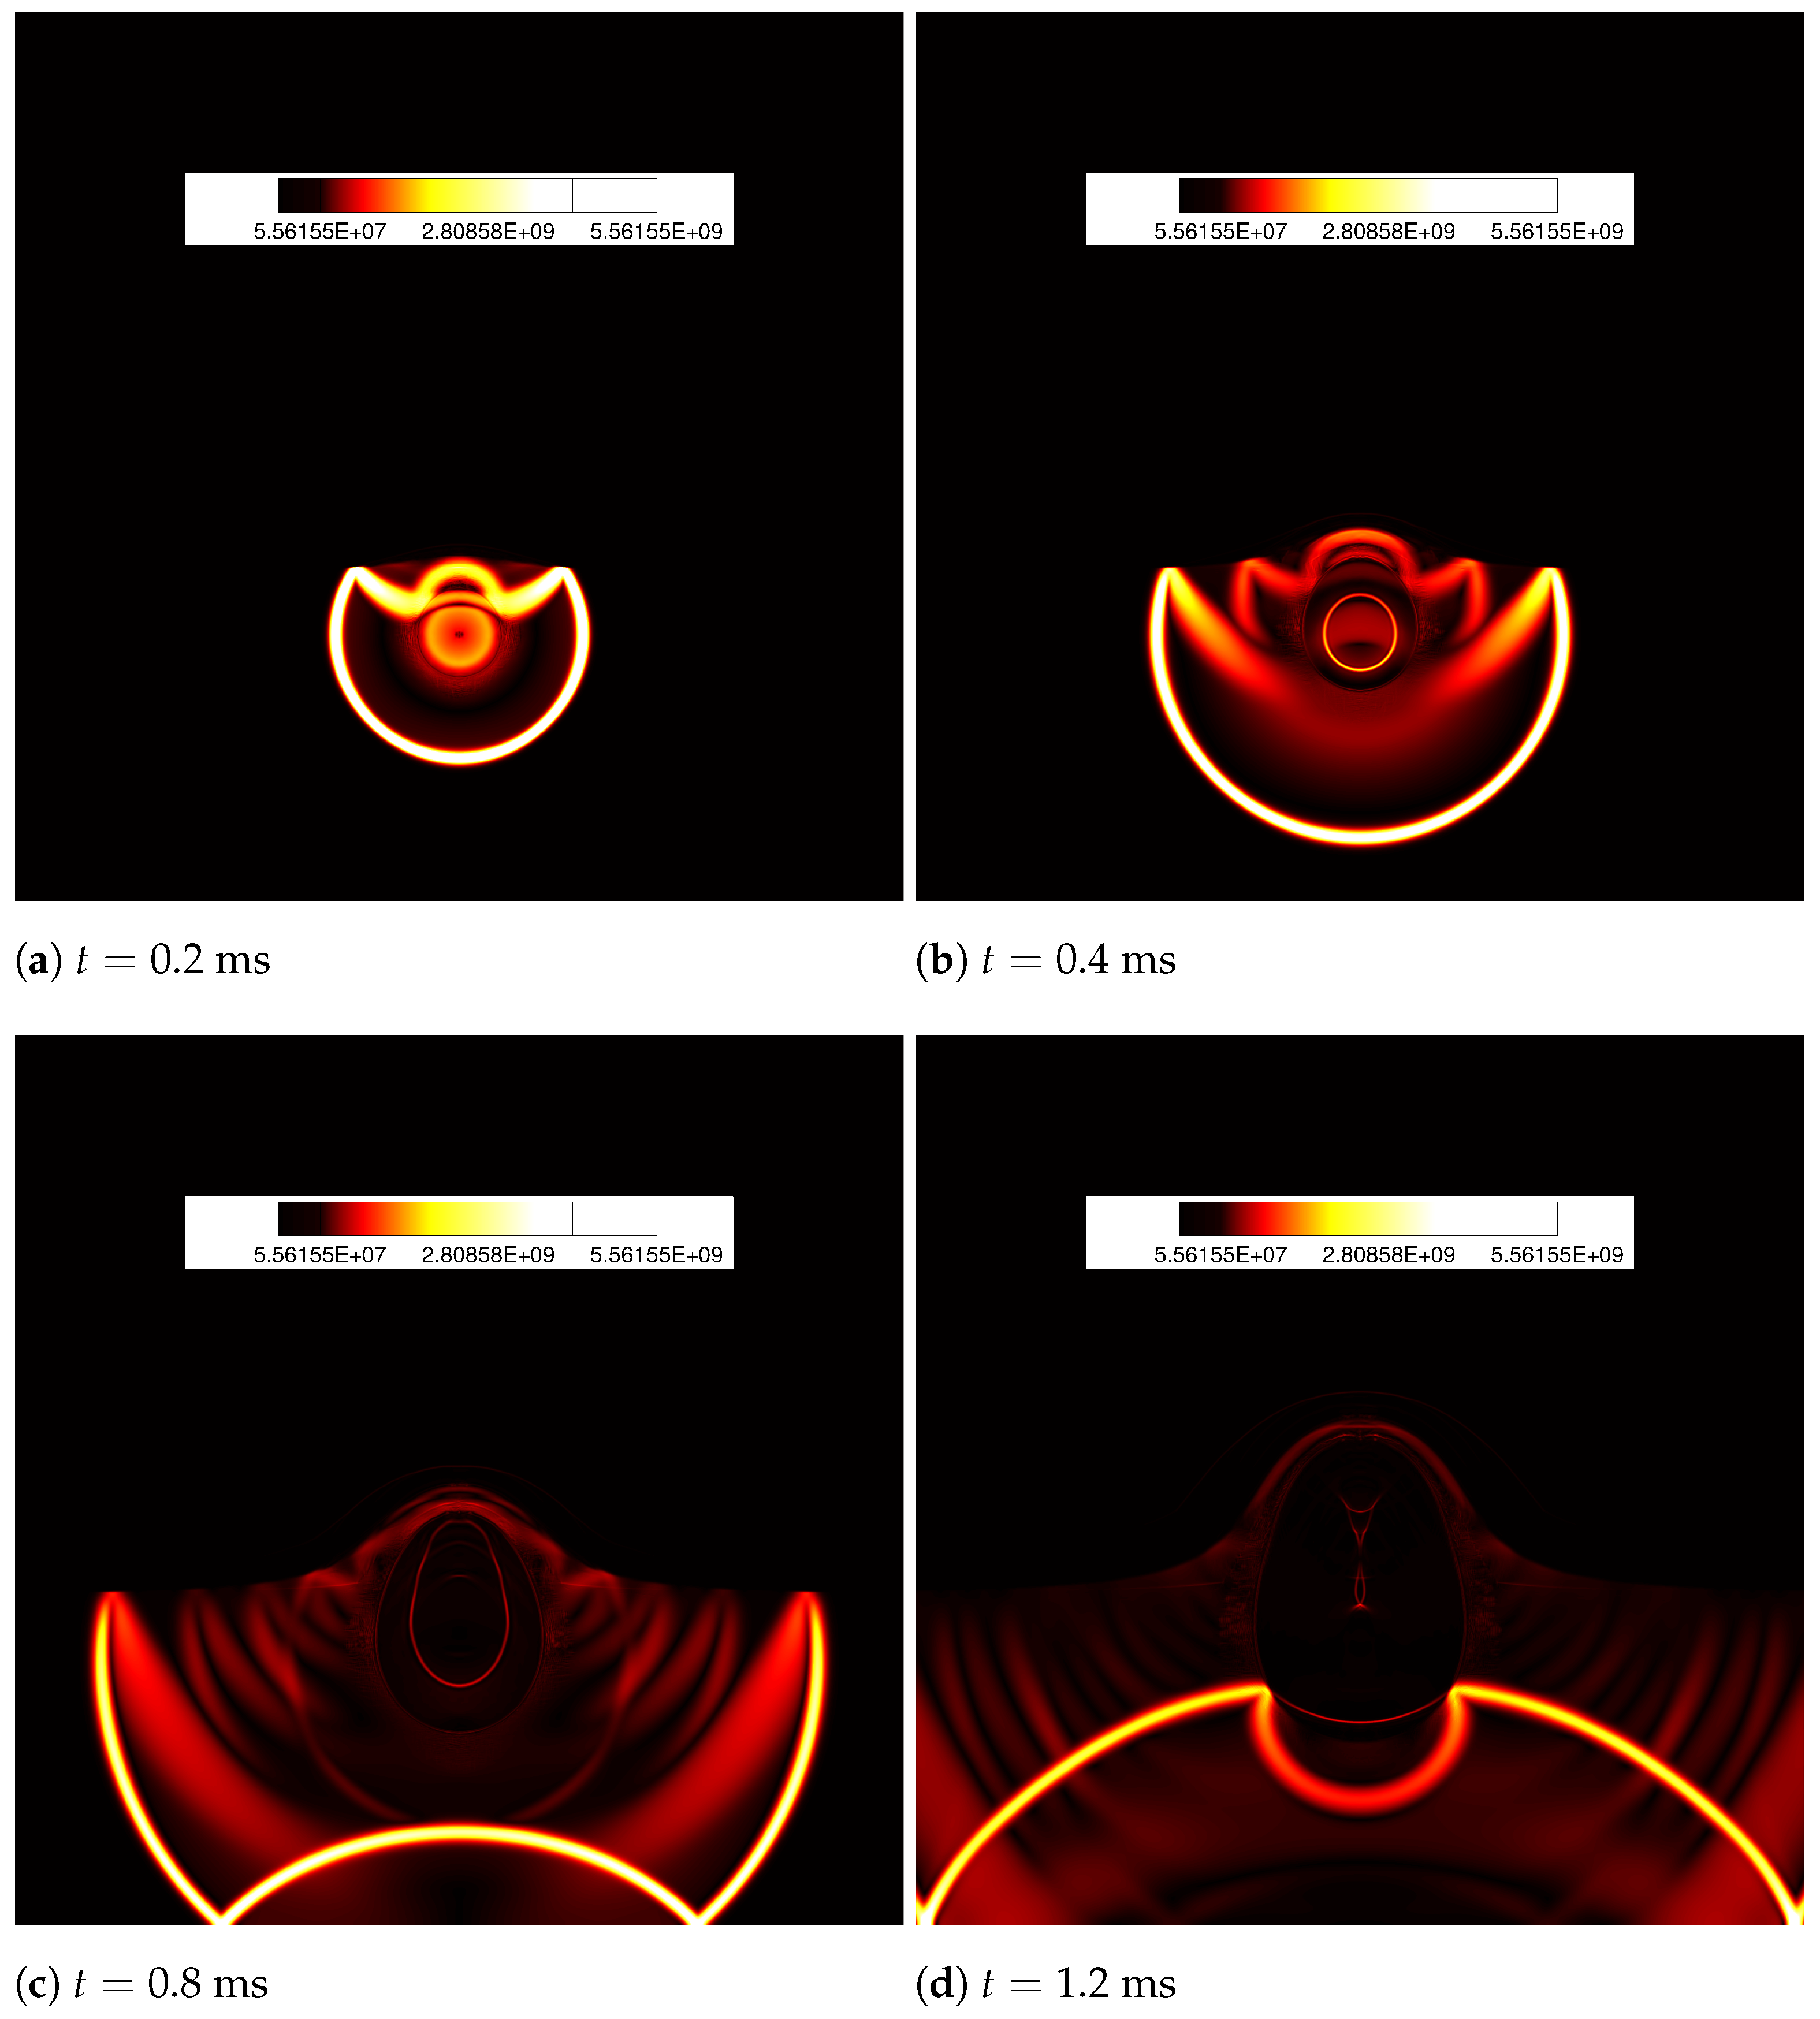
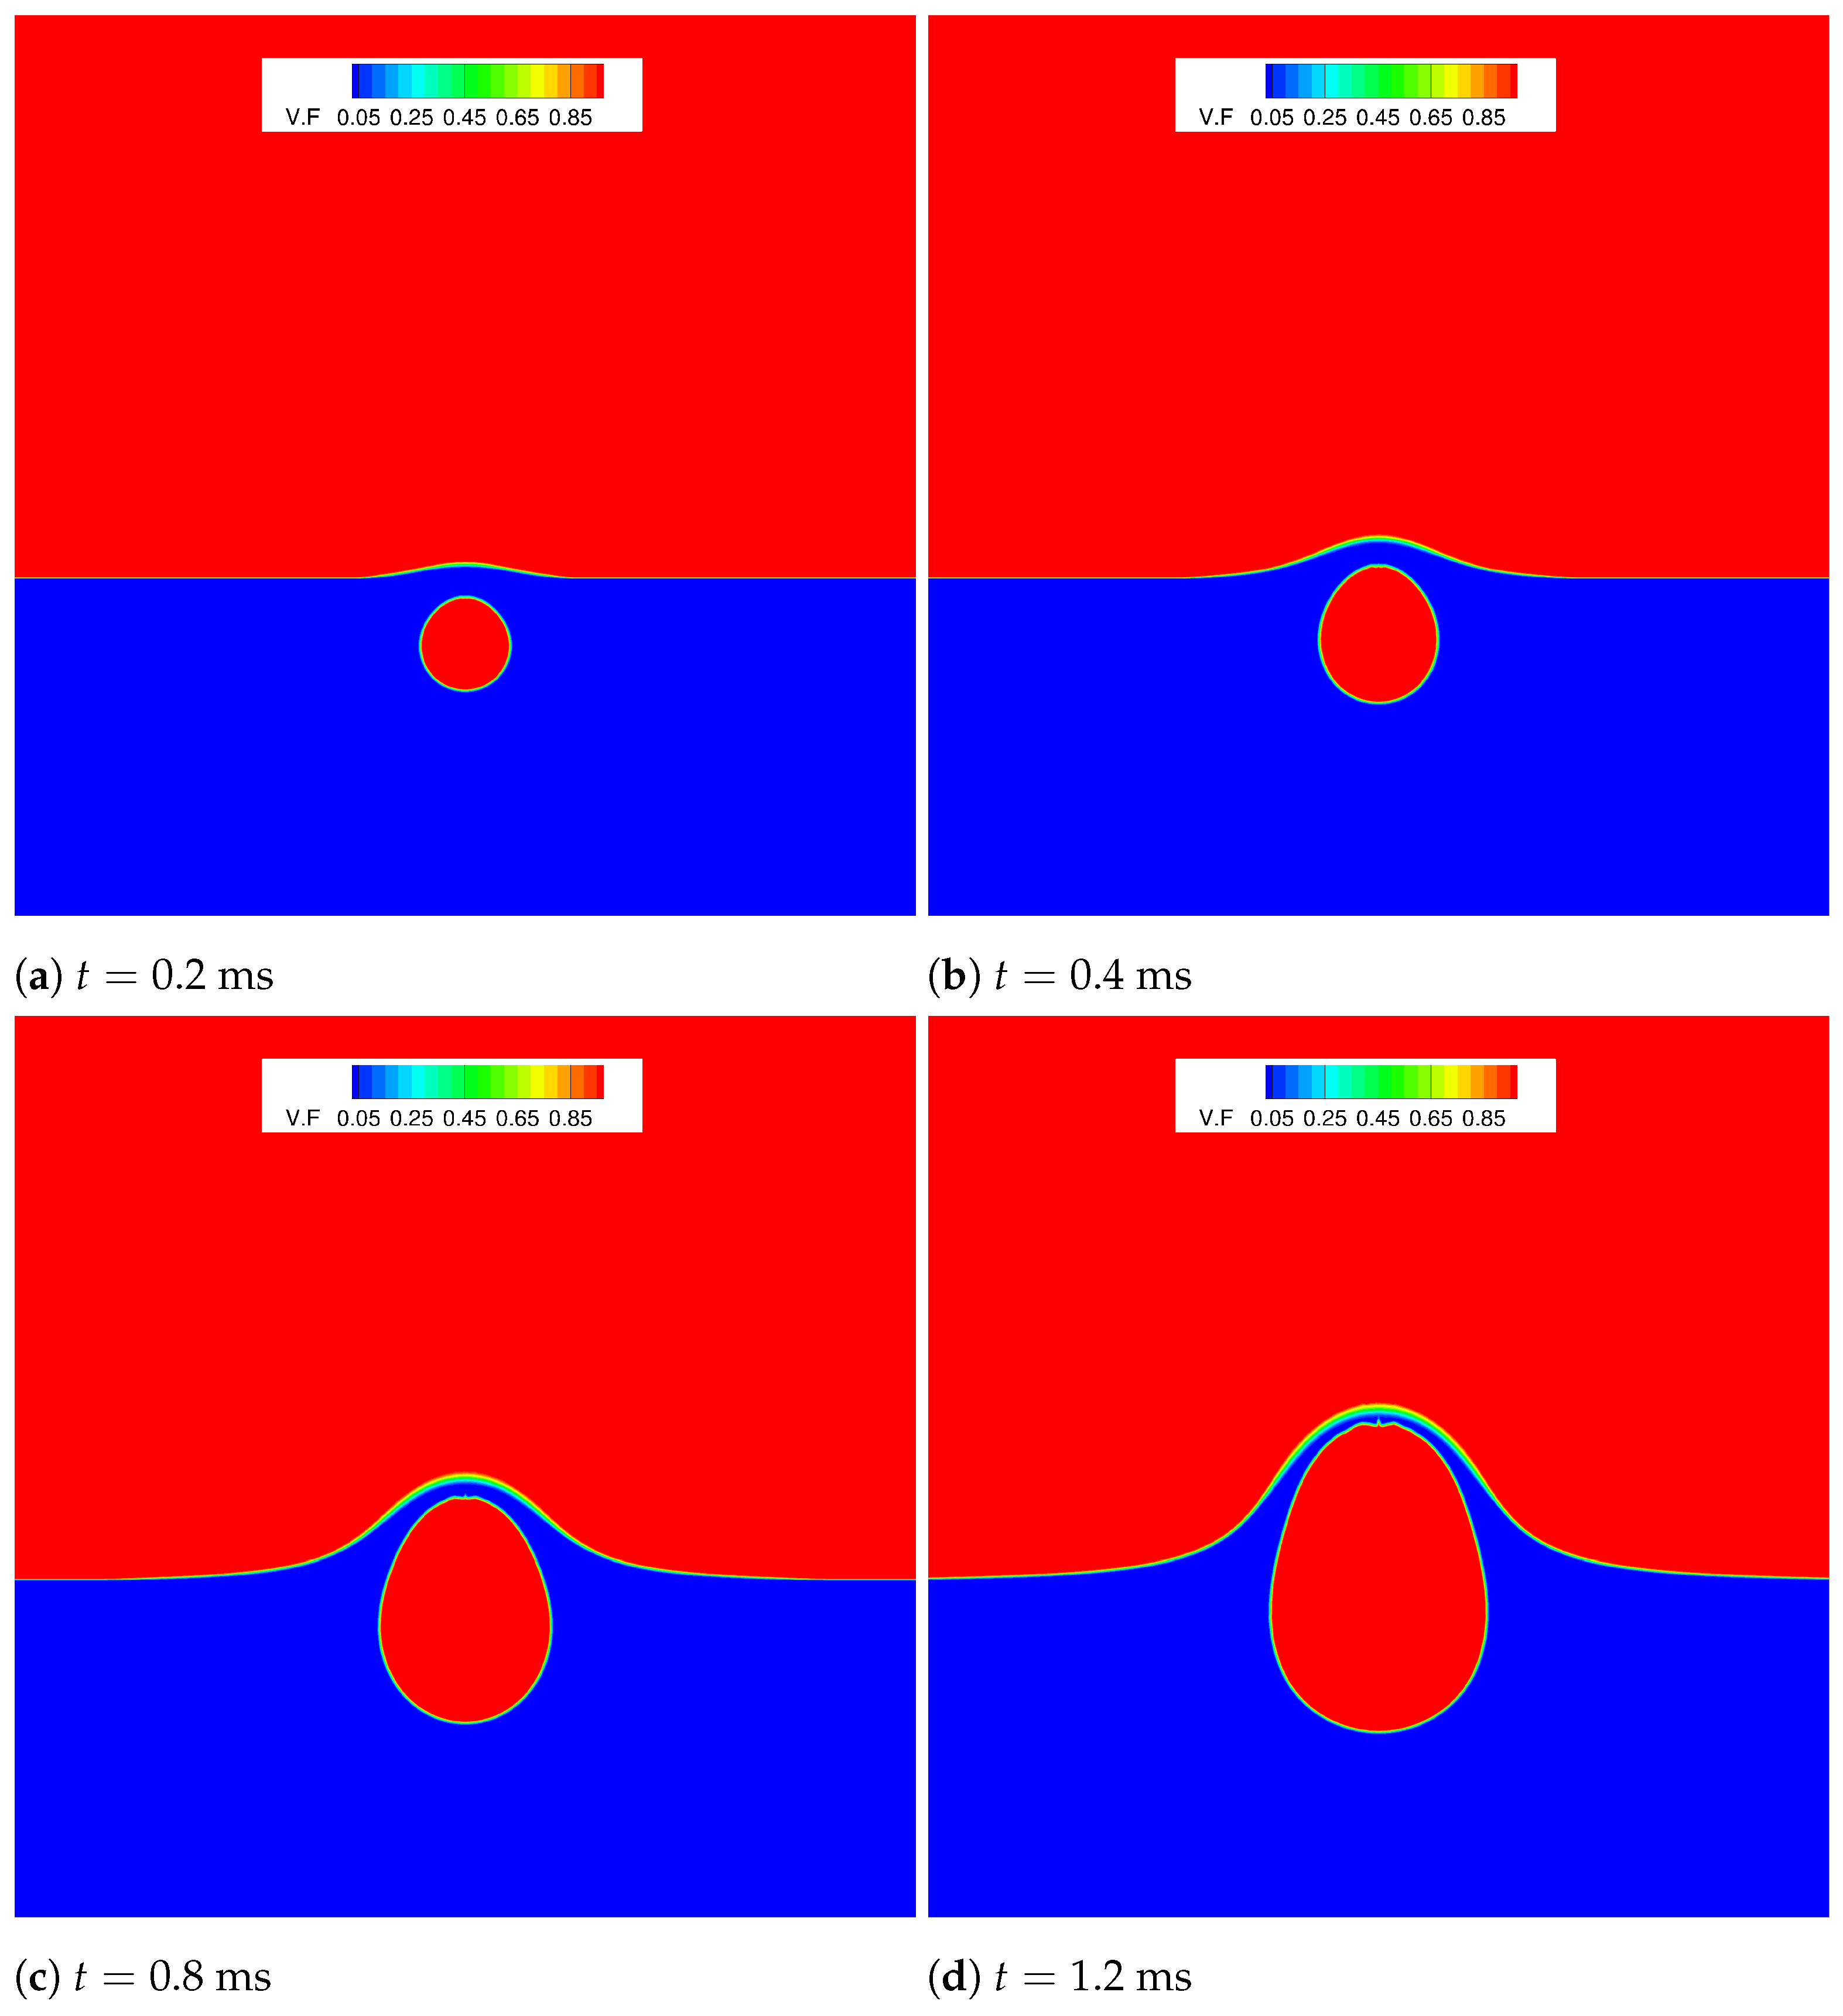
We employ the high-order CWENO4 finite-volume method developed by Tsoutsanis et al. [23,33], on three grid resolutions (coarse, medium, and fine), in our study to investigate the interaction between gas bubbles and the free surface of an air–water medium. Numerical Schlieren visualisations were generated to capture density and pressure gradients at various instants, as depicted in Figure 3 and Figure 4, respectively. The high-pressure air bubble undergoes an explosion, resulting in a shock wave that propagates outward towards the interface, reflects into the water upon hitting the air–water interface, and leaves behind cavitation bubbles, as evident from the pressure gradients in Figure 4. Subsequently, the bubble transforms from a spherical shape to an oval shape, as illustrated in the volume-fraction contour in Figure 5.
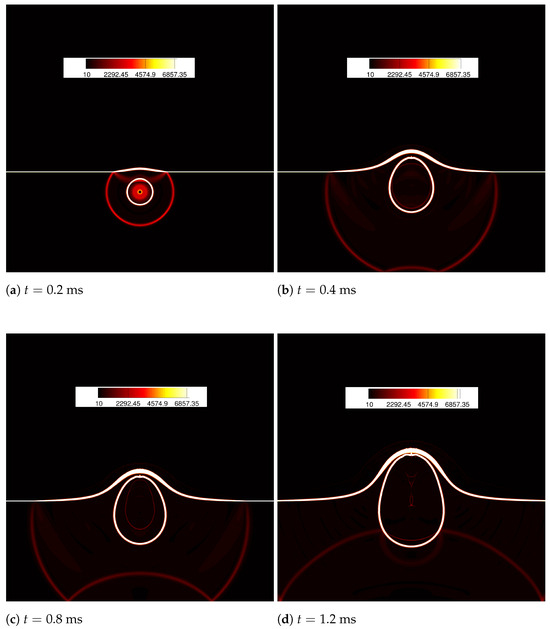
Figure 3.
Underwater explosion near a free surface; Schileren visualisation of density gradient using a CWENO4 scheme at a resolution of 1600 × 1600 cells (finest mesh) at ms. The colour legend represents density gradient, measured in units of kg/m4. Energy release by the exploding bubble causes rapid pressure and temperature rise, heating and expanding the water, resulting in decreased density. Circular pressure waves are generated; a shock wave propagating through the water hits the free surface above it and a rarefaction wave is reflected and traverses towards the bubble ( ms). A wave diffraction occurs due to this interaction leading to a change in the shape of the gas bubble, from a circular to an oval form. Finally, the shock wave hits the wall at the bottom ( ms) and reflects back into the water hitting the bubble eventually at ms.
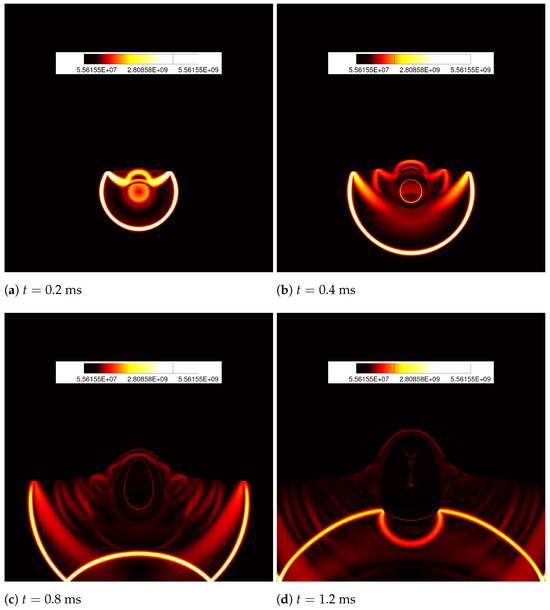
Figure 4.
Underwater explosion near a free surface; Schileren visualisation of pressure gradient using a CWENO4 scheme on the finest mesh at ms. The colour legend represents pressure gradient, measured in units of Pa/m. The visualisation displays the intricate wave patterns in the flow. At ms, a shock wave expands outward through the water and causes rarefaction near the free surface. The rarefaction leads to a drastic drop in pressure in the fluid region below the free surface ( ms). The shock wave reaches the bottom wall at ms, and then, at ms, it reflects back into the water, striking the bubble from below.
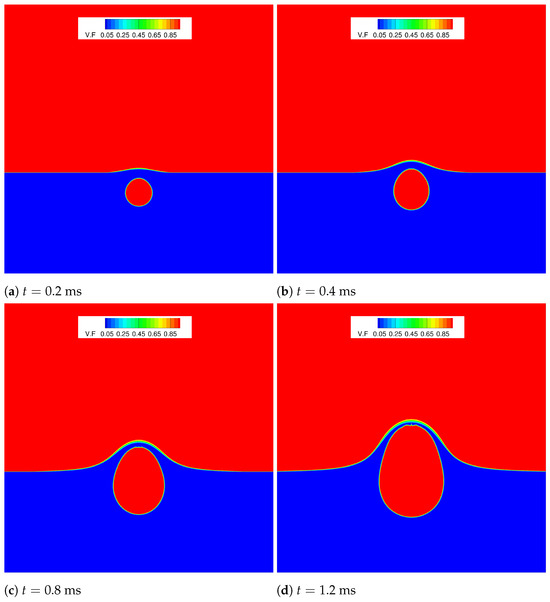
Figure 5.
Underwater explosion near a free surface; contours of volume fraction for underwater explosion near a free surface using a CWENO4 scheme on finest grid at ms. As the bubble rises with the increasing pressure, it stretches and change shape from its spherical shape to an oval shape. The green-yellow areas depict the interface where water meets air as the bubble expands.
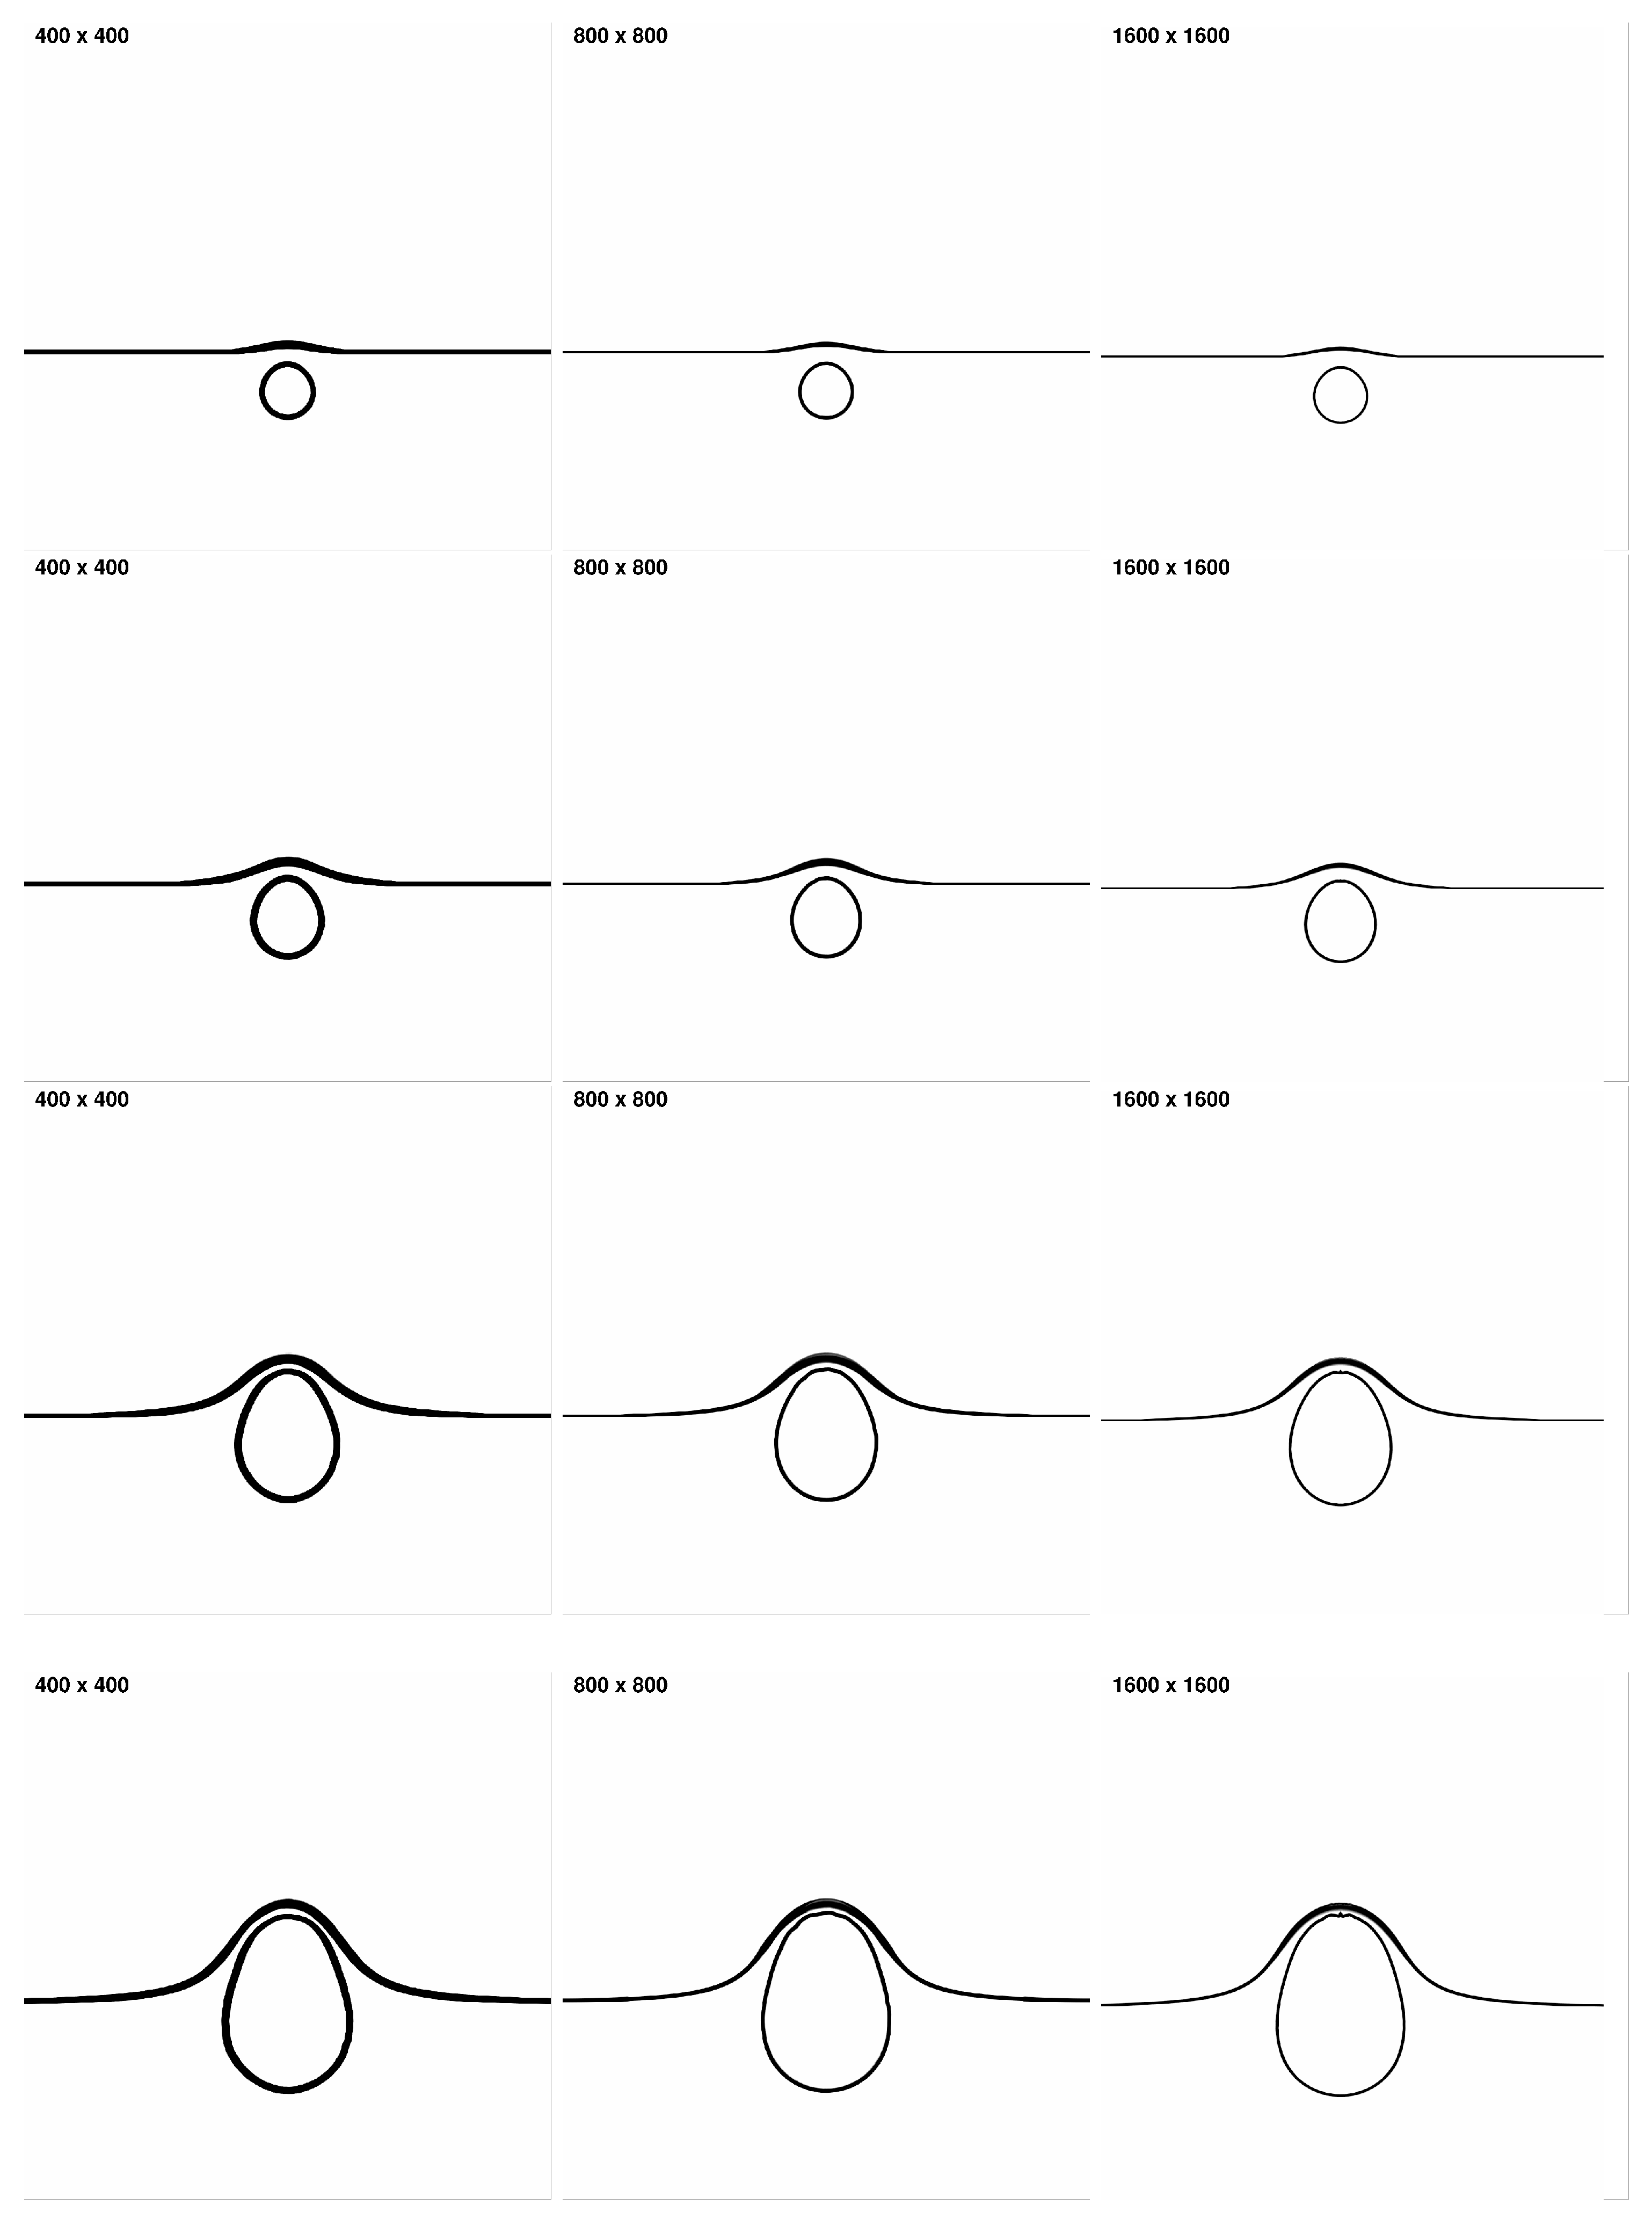
We conducted a study to investigate the impact of grid resolution on the evolution of the interfacial region between the exploding gas bubble and the air–water free surface using the CWENO4 scheme, employing different grid sizes (400 × 400, 800 × 800, and 1600 × 1600). Changes in the CWENO4 scheme’s behavior and its ability to capture the interfacial region between the gas bubble and the air–water free surface can be seen in Figure 6 as the grid size is refined. These include reductions in the smearing or numerical diffusion between the free surface and the expanding air bubble, resulting in a sharper description of the interface. The results are free from oscillations, which also demonstrates the robustness of the numerical framework employed. However, interface-sharpening or anti-diffusion techniques could prove beneficial, especially for up to third-order methods at coarse grid resolutions since they are the ones that can benefit most from this strategy [33,35,46].
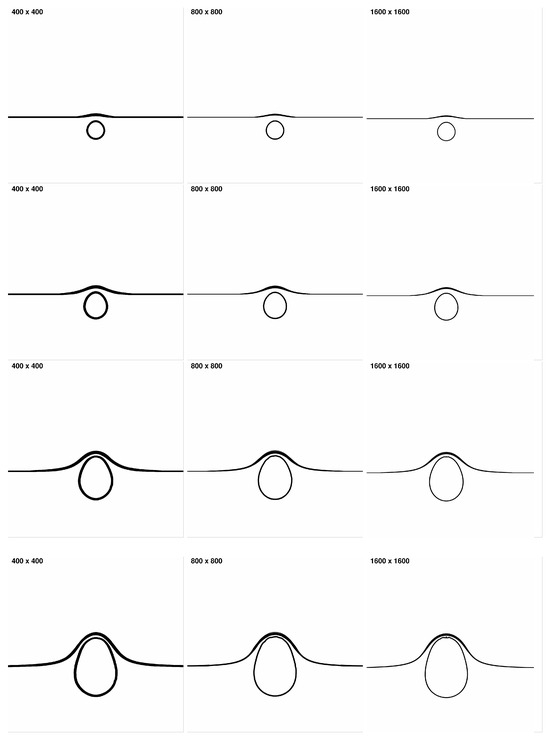
Figure 6.
Underwater explosion near a free surface; density gradient contours at ms. Captured using CWENO4 schemes with different grids resolution. More inter-facial structures are sharper as the grid resolution increases.
We performed a quantitative investigation on the medium grid for the obtained density and pressure profiles along the horizontal axis (x = 0) and compared them with published results that utilize sharpening techniques and anti-diffusive techniques in conjunction with high-order schemes [9,49]. The results, as shown in Figure 7 and Figure 8, are consistent with previously published findings [9,49,50].
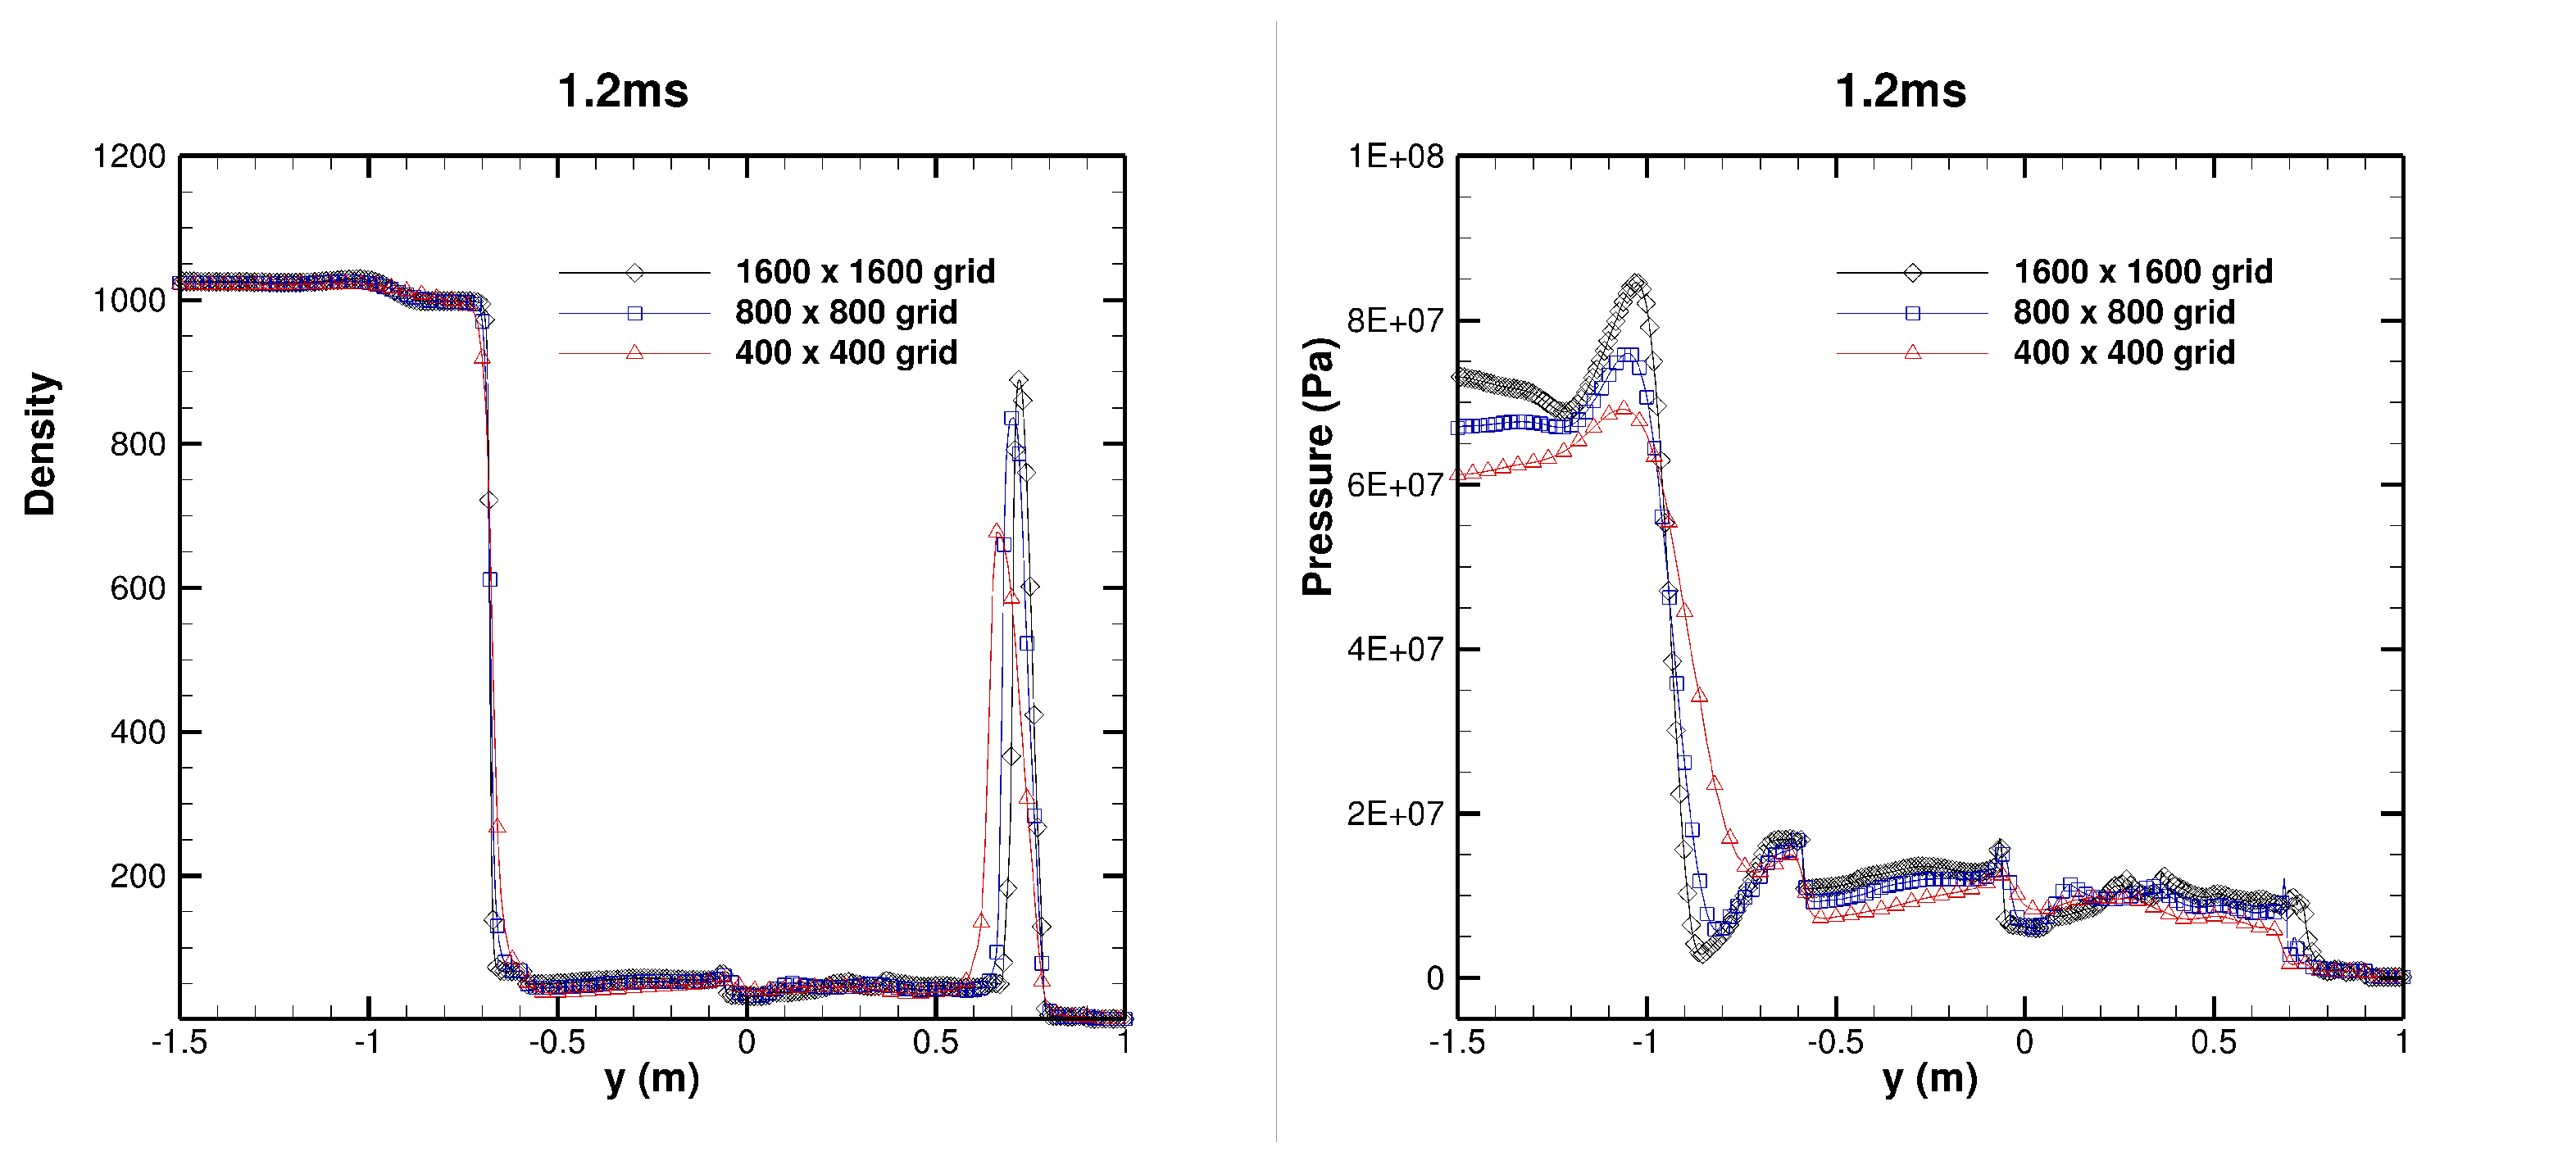
Furthermore, we applied both the five-equation models proposed by Allaire et al. and Kapila et al. to investigate the influence of the additional term in Kapila’s model, thereby differentiating between the two models. The density and pressure plots, depicted in Figure 9, demonstrate that both the five-equation diffuse interface multicomponent models of Allaire et al. and Kapila et al. yield comparable results and are in good agreement with the published works of [49,51]. This shows that for cavitation test cases such as the one under consideration in this paper, we can affirm that the five-equation model of Allaire et al. and Kapila et al. accurately portrays both cavitation formation and collapse. However, this accuracy does not extend to spherical bubble collapse in a liquid, as highlighted in Ref. [26], where the five-equation model of Allaire et al. falls short in correctly representing the solution of spherical bubble collapse. In Figure 10, we observe that the maximum peak pressure on the finest mesh is approximately 85 MPa at x = −1.0 m, which is the location where the shock wave reflects upon hitting the expanding cavity from below. This finding is consistent with the observation made in [51] that traditional WENO schemes, although computationally more expensive than CWENO, fail to prevent the smearing of the air–water interfaces. Our results demonstrate that CWENO is capable of resolving material interfaces with reduced numerical smearing while maintaining their non-oscillatory nature, as reported in [33]. This makes CWENO schemes a favourable choice in terms of computational cost for simulating compressible multiphase or multicomponent flows involving cavitation.
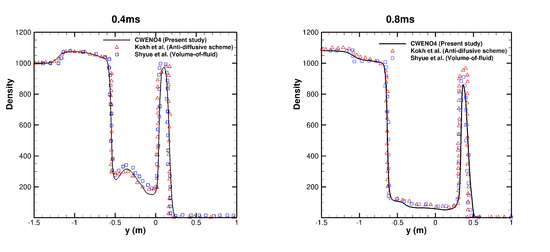
Figure 7.
Underwater explosion near a free surface; plot of the density distribution along the horizontal axis x = 0 at two instants, specifically t = 0.4 ms and t = 0.8 ms. The obtained results are compared to those reported in previous studies of Kokh (2010) [49] and Shyue (2006) [52].
Figure 7.
Underwater explosion near a free surface; plot of the density distribution along the horizontal axis x = 0 at two instants, specifically t = 0.4 ms and t = 0.8 ms. The obtained results are compared to those reported in previous studies of Kokh (2010) [49] and Shyue (2006) [52].
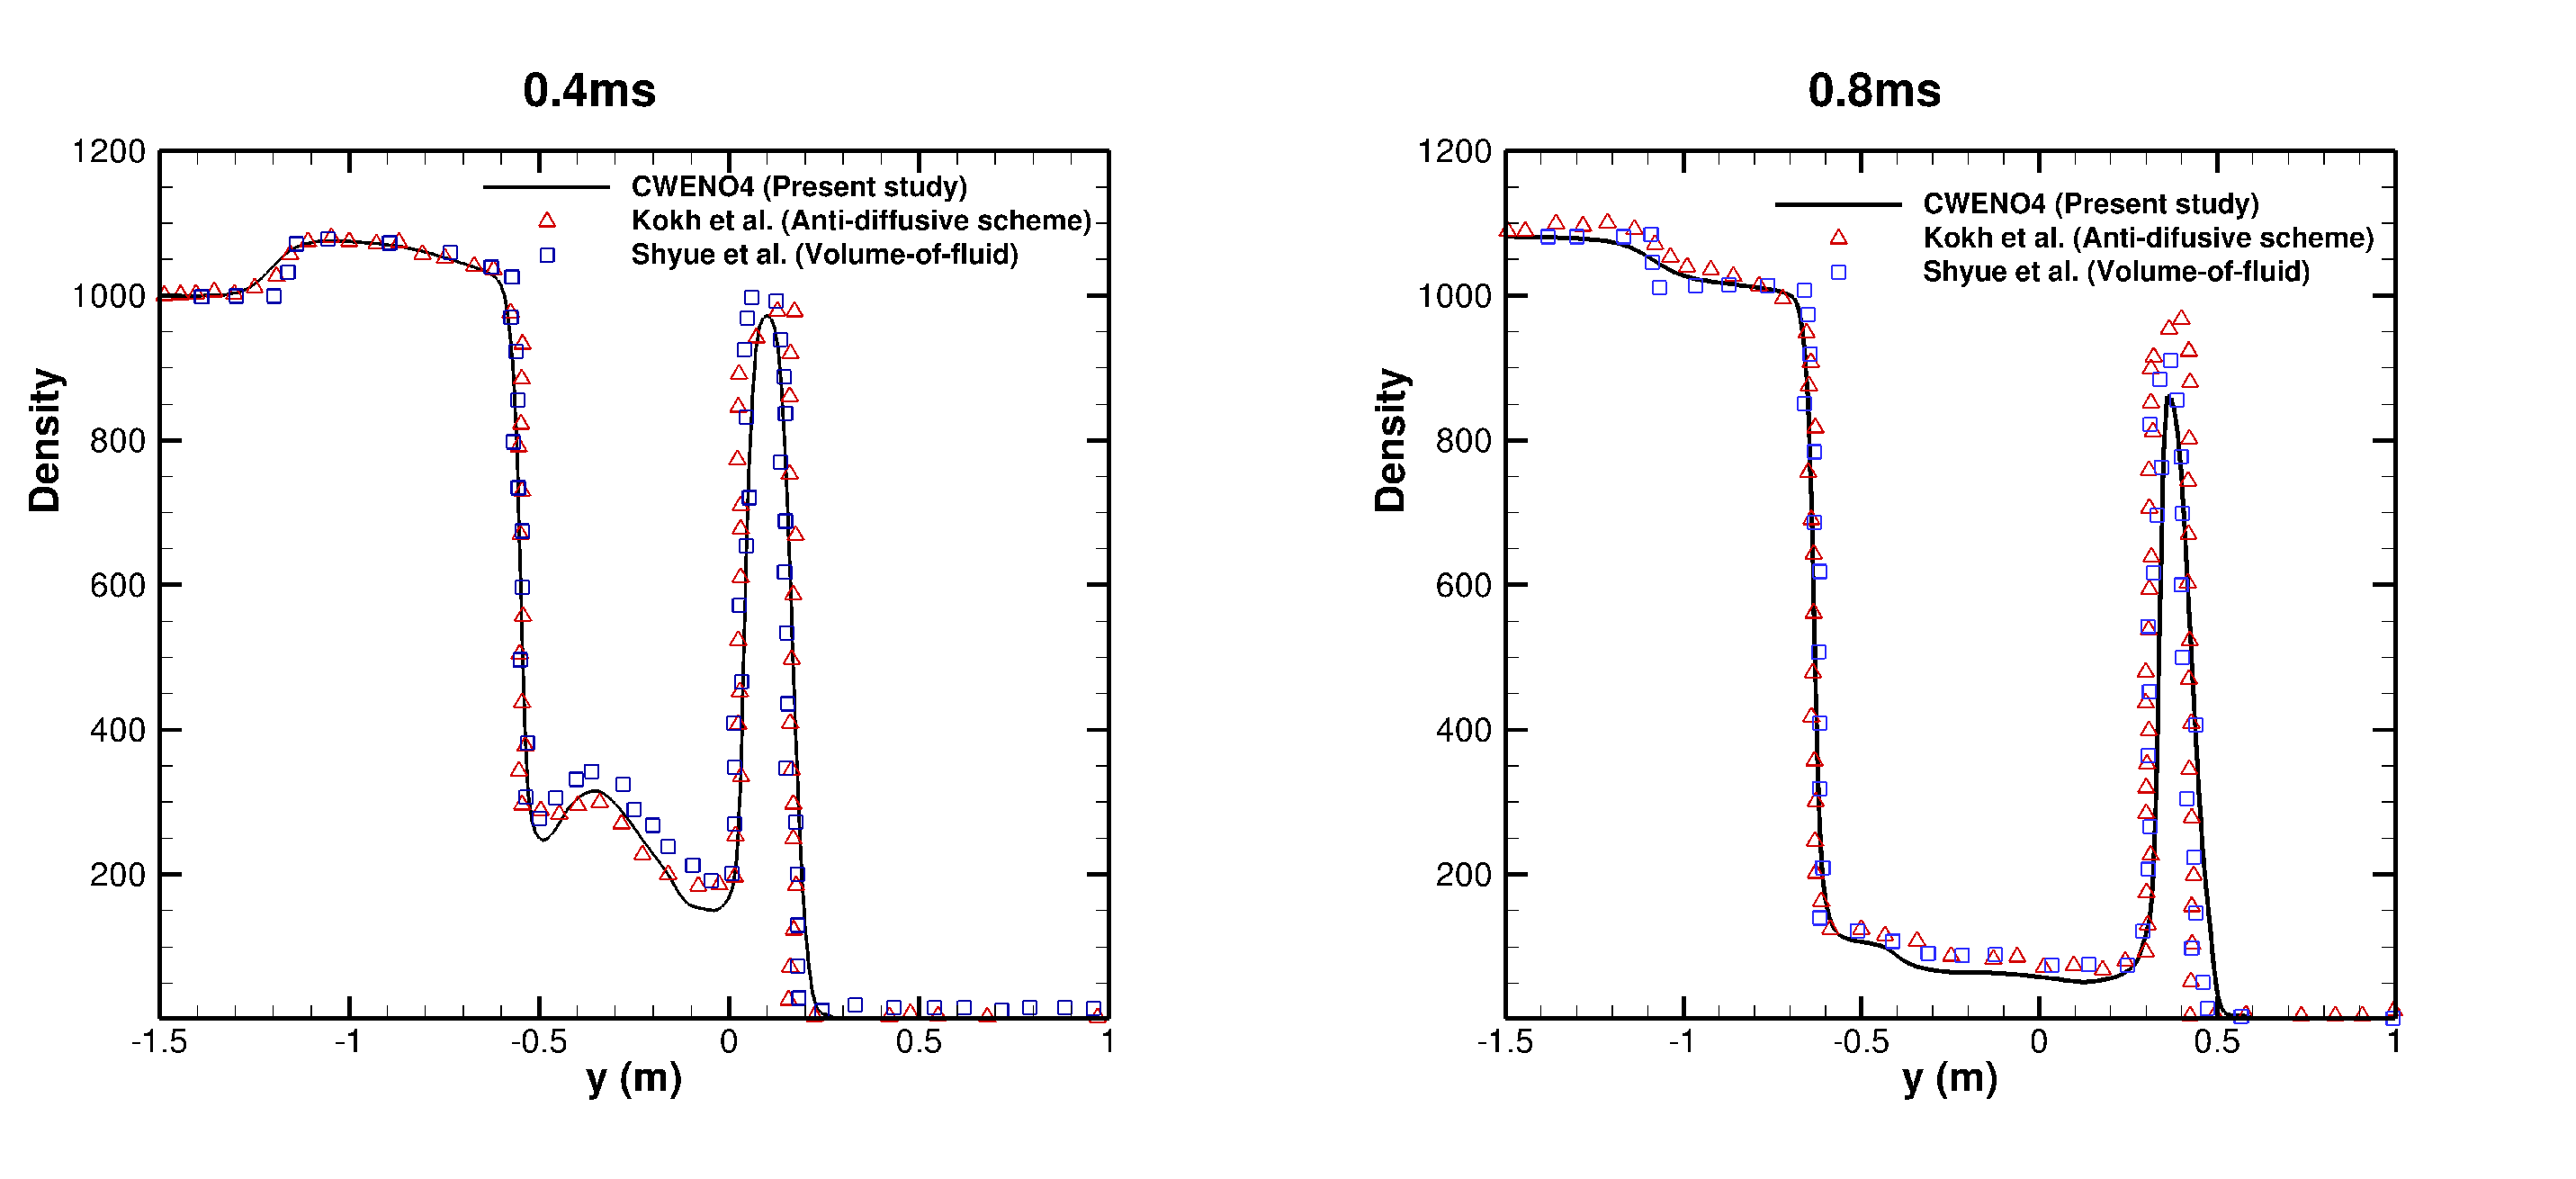

Figure 8.
Underwater explosion near a free surface; pressure plot along horizontal axis x = 0 at instants t = (0.4; 0.8) ms. Comparison are made with the results of [49,50,52].
Figure 8.
Underwater explosion near a free surface; pressure plot along horizontal axis x = 0 at instants t = (0.4; 0.8) ms. Comparison are made with the results of [49,50,52].

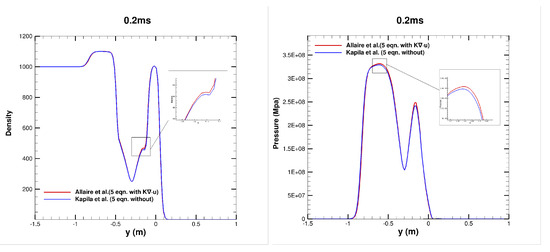
Figure 9.
Underwater explosionnear a free surface; density and pressure plot along horizontal axis x = 0 at instants t = 0.2 ms using Allaire et al. [21] and Kapila et al. [20] models.
Figure 9.
Underwater explosionnear a free surface; density and pressure plot along horizontal axis x = 0 at instants t = 0.2 ms using Allaire et al. [21] and Kapila et al. [20] models.
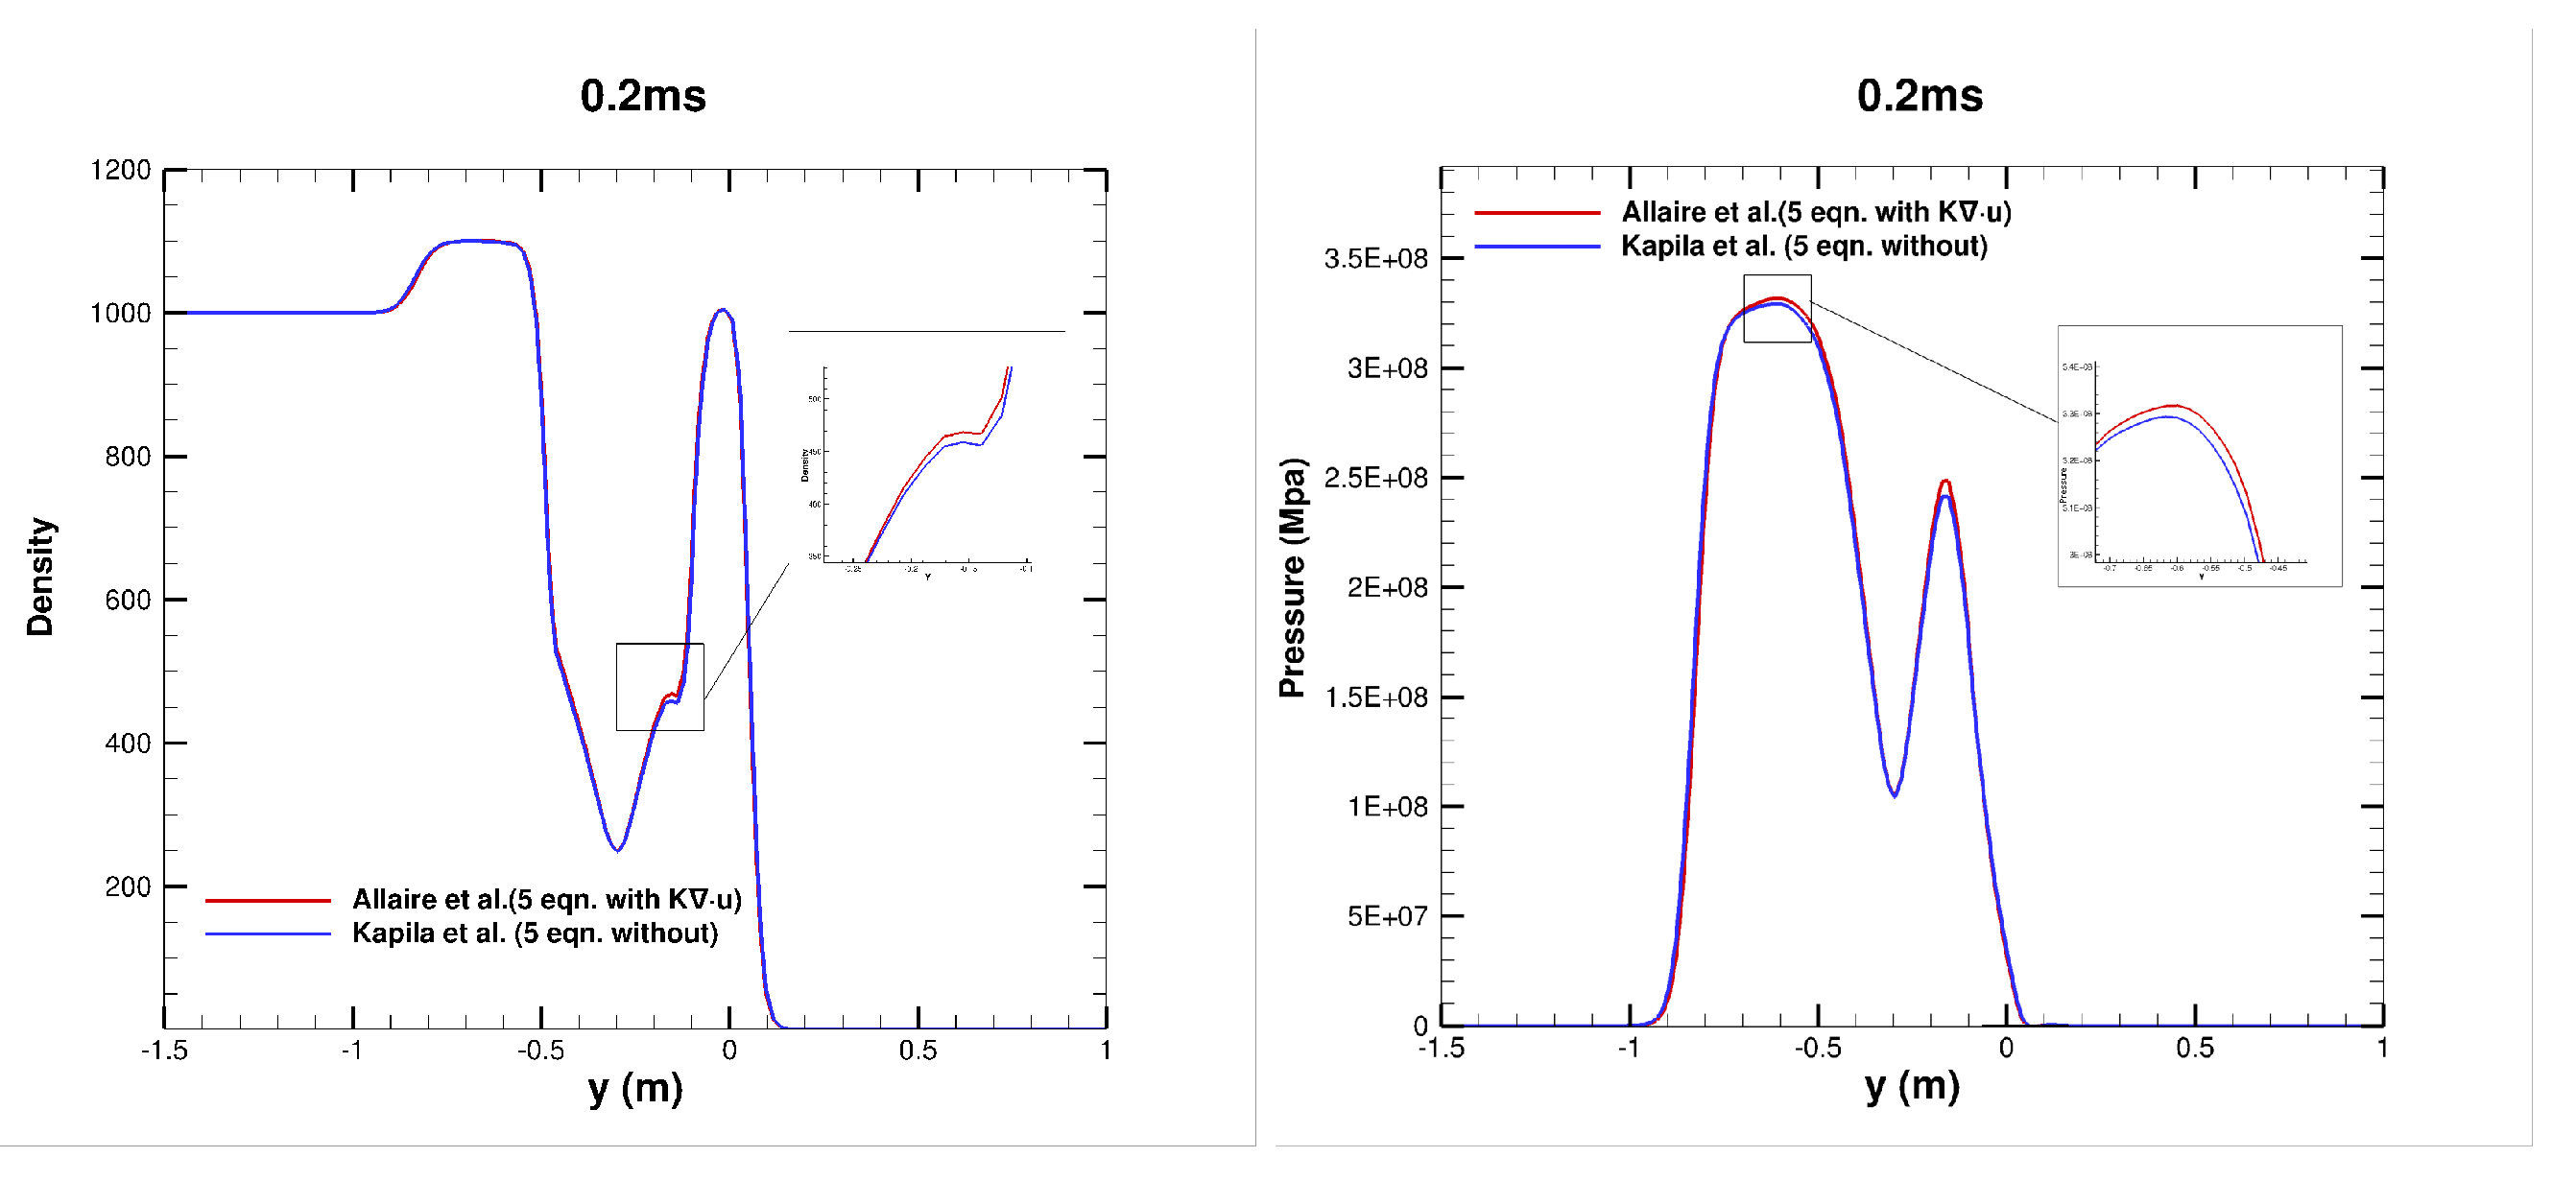
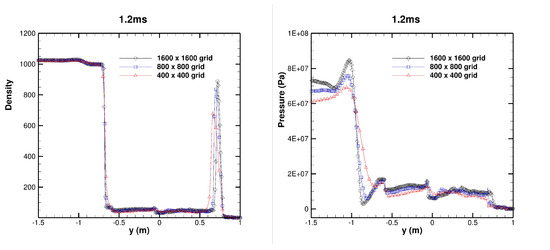
Figure 10.
Underwater explosion near a free surface; density and pressure plot along horizontal axis x = 0 at instants t = 1.2 ms using different grid resolutions.
Figure 10.
Underwater explosion near a free surface; density and pressure plot along horizontal axis x = 0 at instants t = 1.2 ms using different grid resolutions.
4.2. 2D Cylindrical Underwater Explosion near a Planar Rigid Wall
This test case was carried out to examine the impact of shock loading and cavitation loading or reloading, caused by an underwater explosion, on a rigid structure (e.g., a ship’s hull). Numerous studies, both numerical and experimental, have been conducted on this test case by various researchers [34,43,47,53,54]. The experiment involves detonating an explosive submerged in water underneath a plate.
The physical properties (density, velocities, pressure, specific heat ratio, and volume fraction) of each fluid involved in these test cases are presented below:
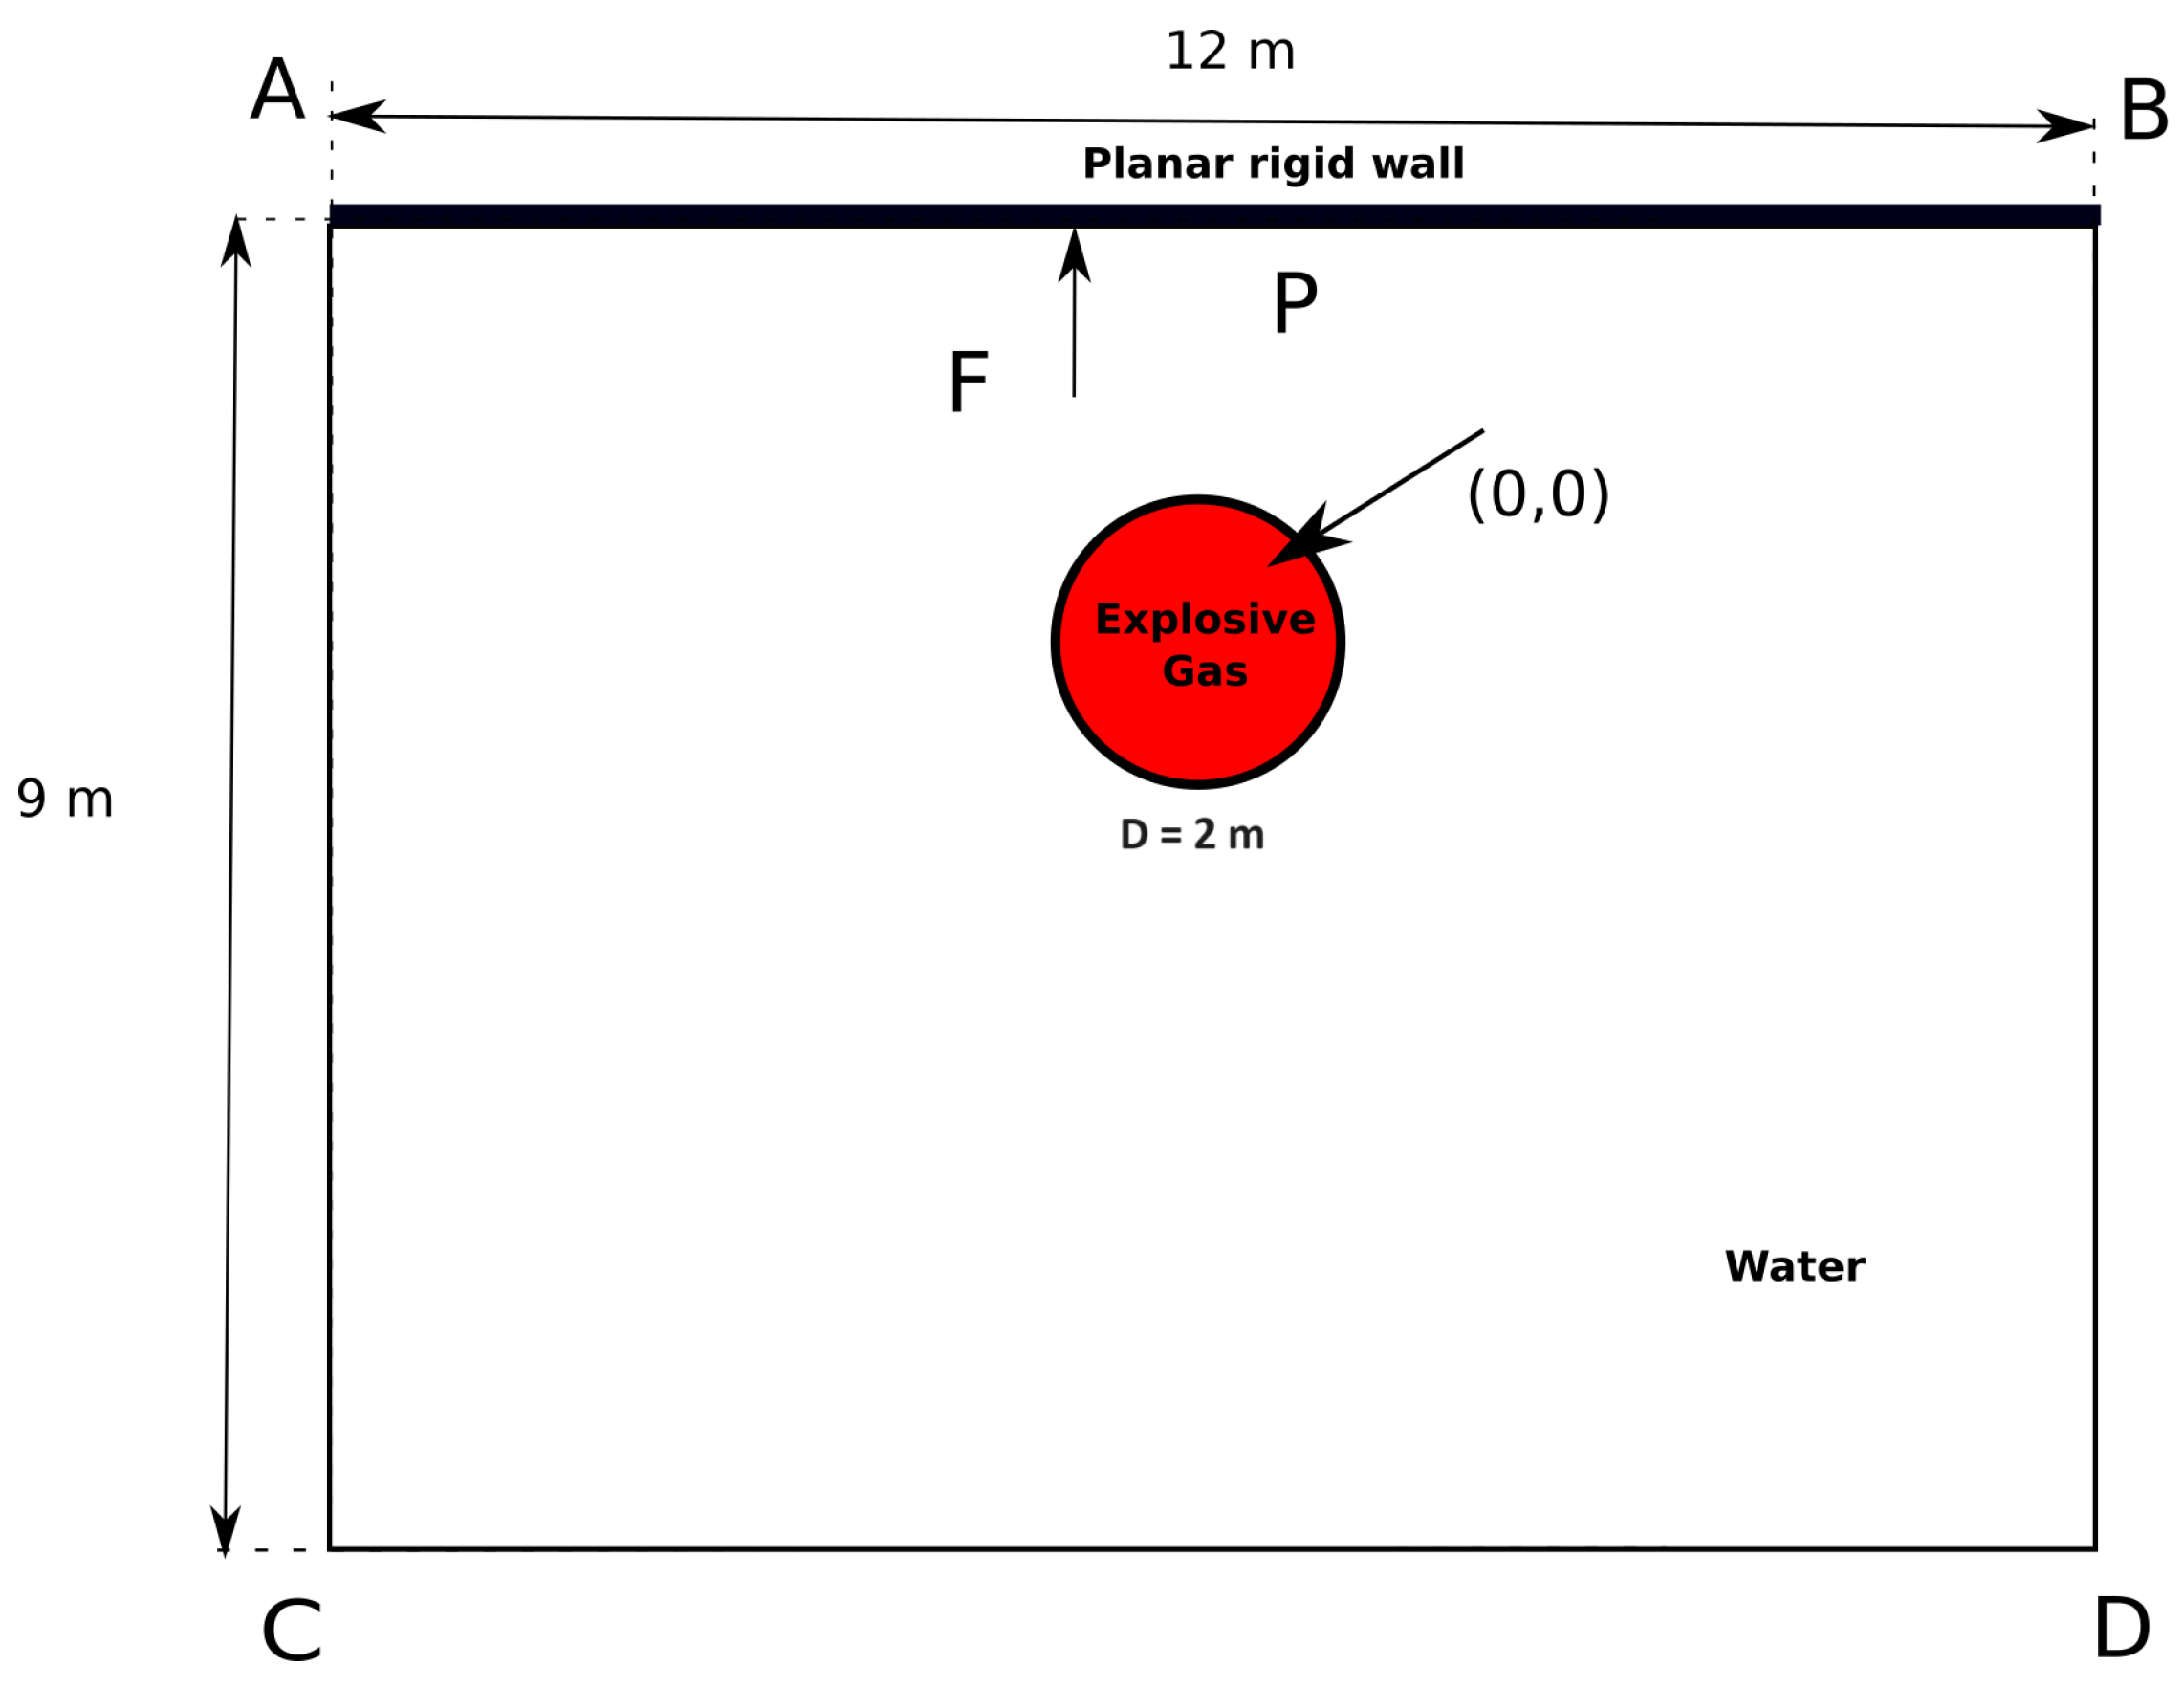
The rectangular computational domain in two dimensions (as shown in Figure 11) has dimensions of m. Similar to the previous test case, the explosive is modeled as a high-pressure air bubble with a spherical gas bubble of 2 m diameter placed in water at the origin . A rigid wall is located at m above the bubble, and a numerical sensor is placed at the centre point of the wall (denoted as P) to measure the load on the wall. The boundary conditions for the upper surface are set as reflecting, while the left, right, and bottom surfaces are set as non-reflecting. A coarse grid is used to discretize the domain, and the simulation is run for a final time of ms.
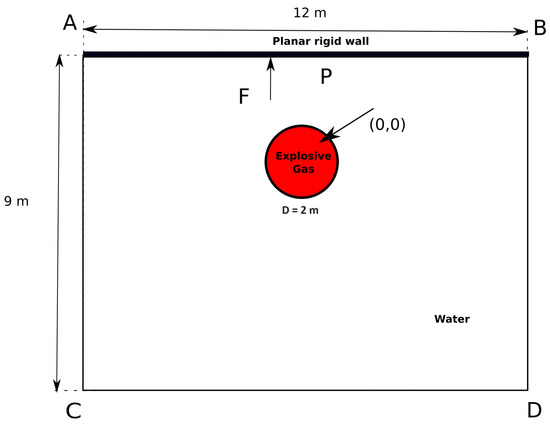
Figure 11.
Computational domain setup for a two-dimensional underwater explosion near a planar rigid wall.
The fourth-order CWENO scheme is used with the five-equation diffuse interface model for this test problem. To address the issue of non-physical negative pressure values (i.e., p < 0) that can occur in cavitation regions during the explosion, a cut-off model, described in Section 2, is introduced to maintain the pressure at 5000 Pa.
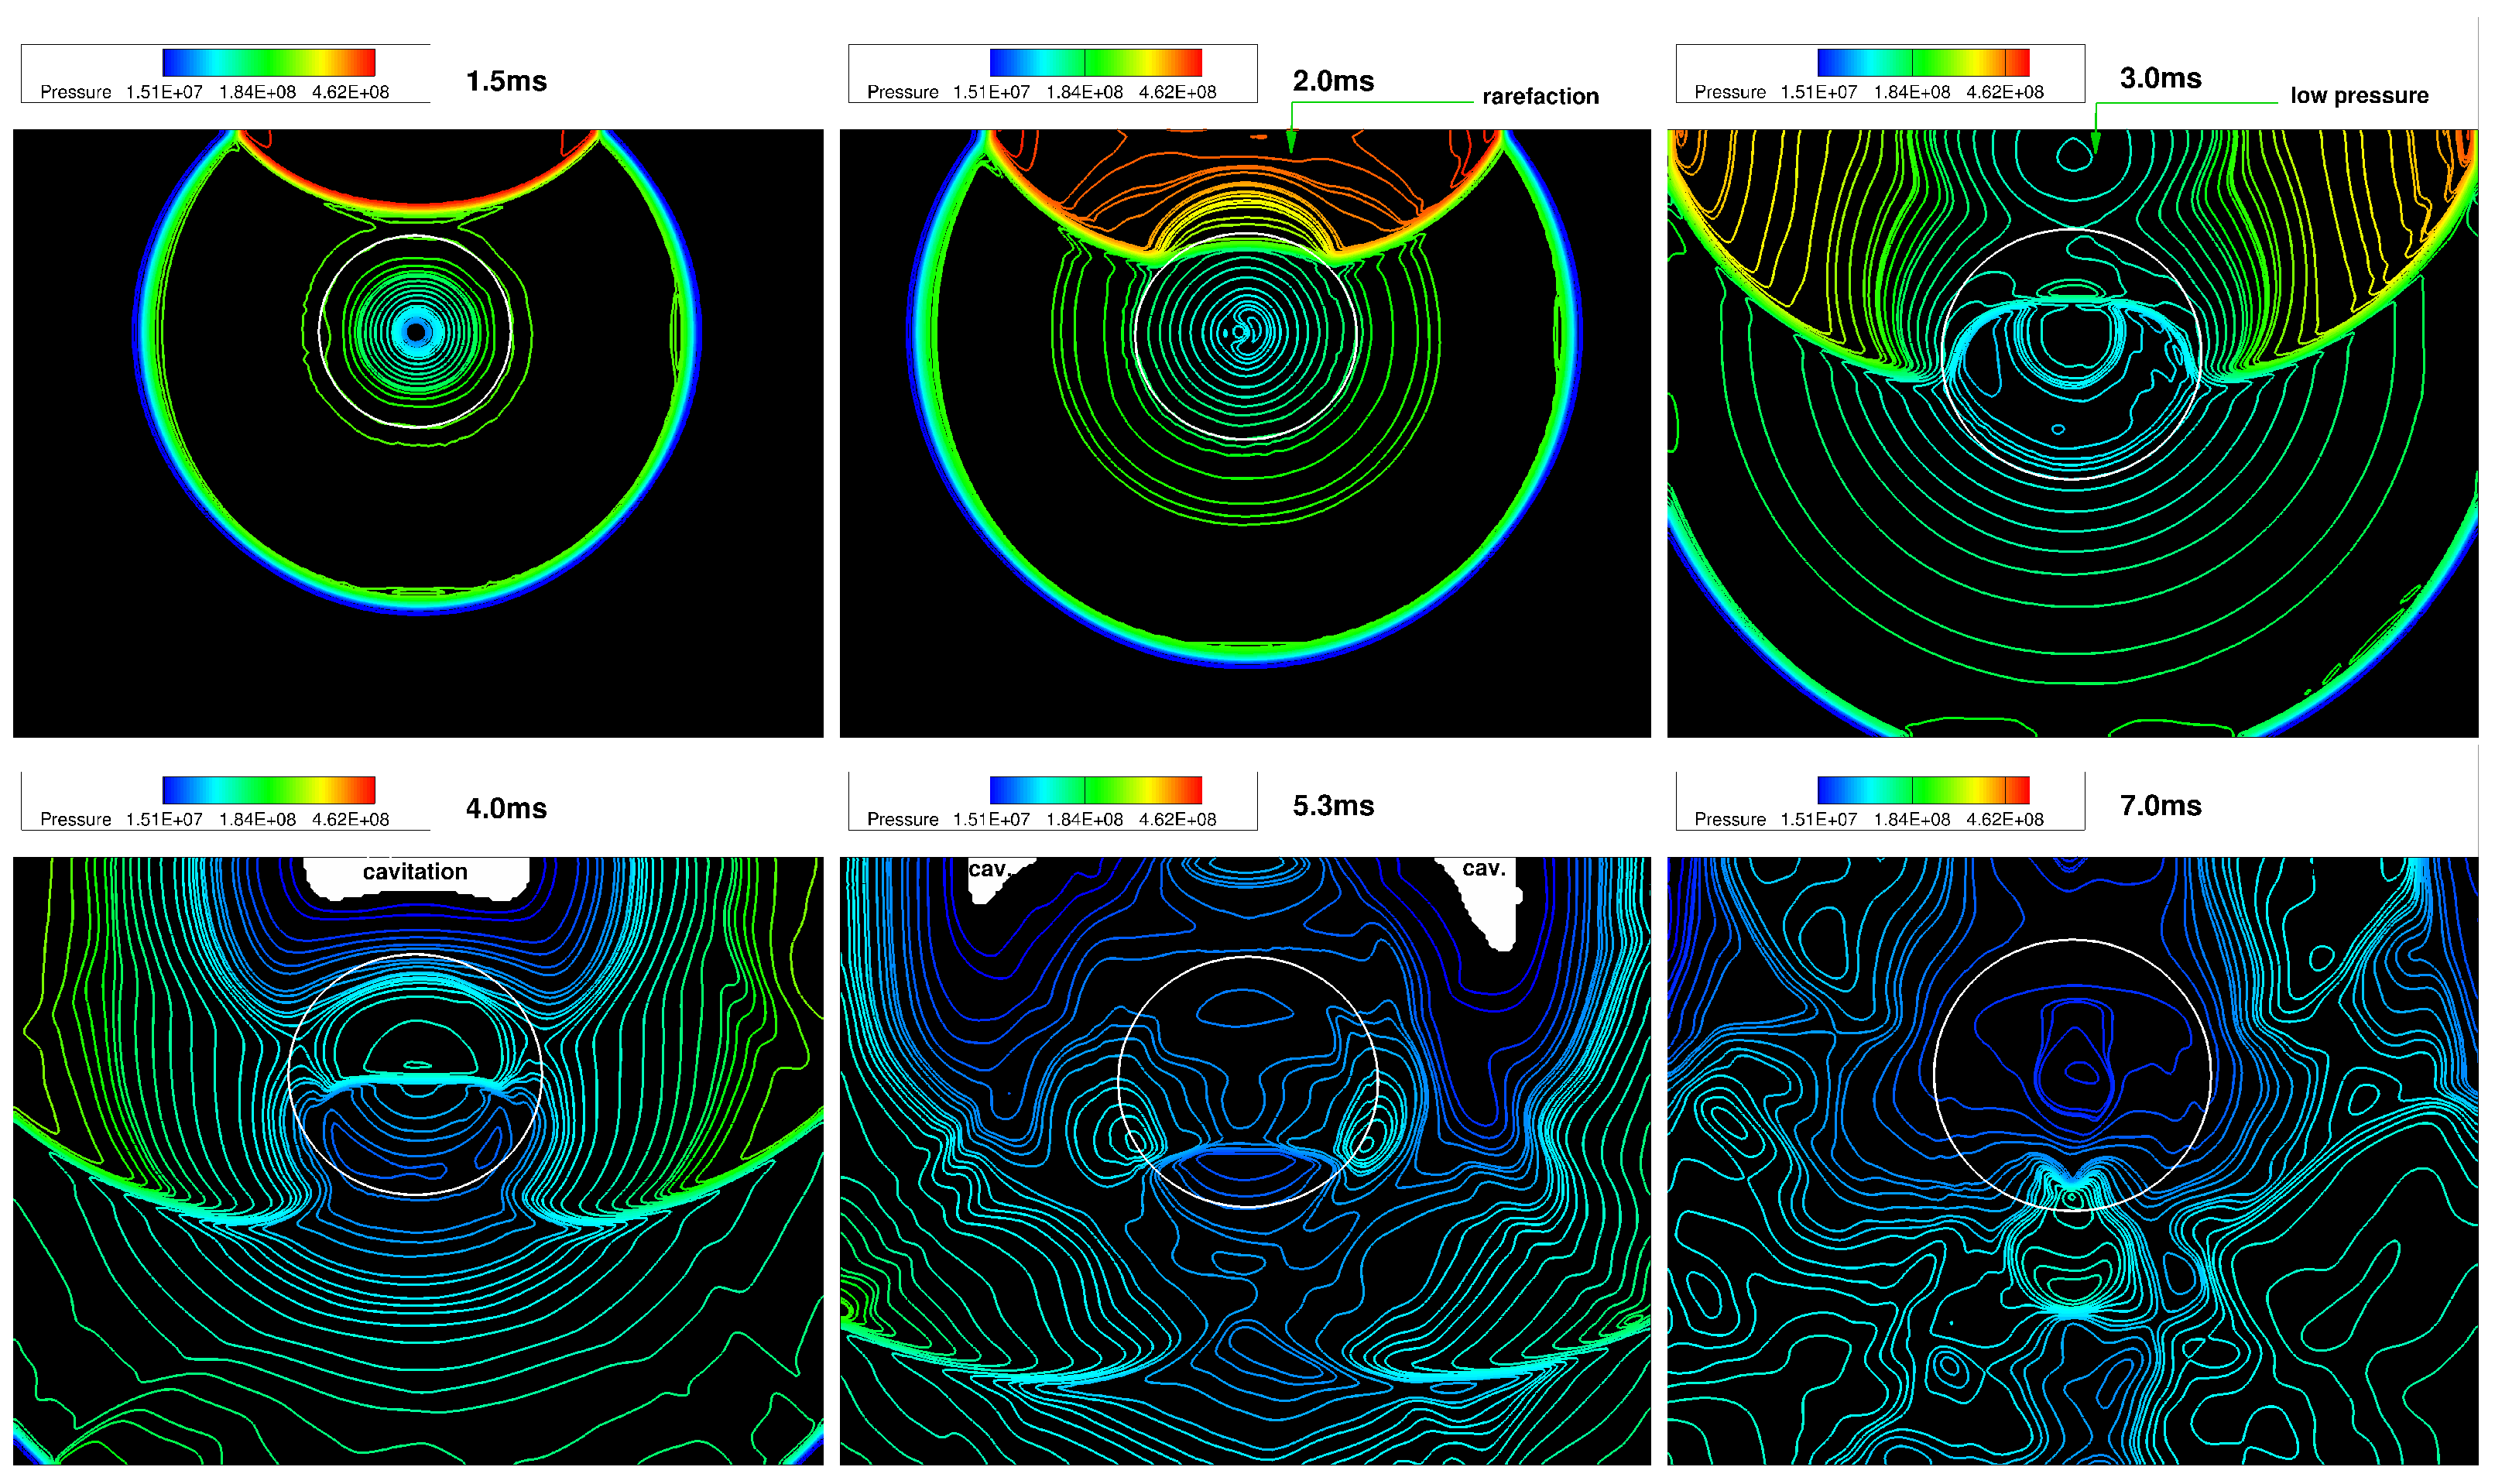
Contour plots of pressure obtained using the fourth-order CWENO scheme at different times during the explosion are shown in Figure 12. The plots show that the primary loading occurs when the pressurized air bubble explodes, generating shock waves that hit the wall above it at t = 1.5 ms and immediately reflect into the water, causing a rapid drop in density. Rarefaction can be observed in Figure 12 at t = 2 ms, as the pressure decreases around the wall, forming a low-pressure region at t = 3 ms. This pressure drop intensifies, resulting in a cavitation region around the wall at t = 4 ms and t = 5.3 ms. The cavitation collapses and generates a reload impact on the wall, known as cavitation collapse reloading (secondary reloading).
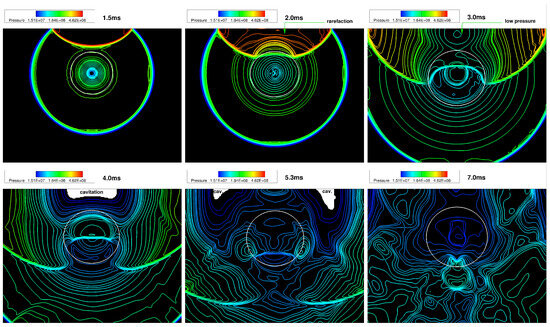
Figure 12.
Underwater explosion near a rigid wall; the pressure contours at different instants. Captured using CWENO3 scheme with medium grid resolution. At very low pressure, cavitation can be noticed at times t = 4 ms and 5.3 ms near the rigid walls. The colour legend represents pressure gradient, measured in units of Pa/m.
The pressure history of the wall along the horizontal axis is shown in Figure 13. The first peak pressure created by the shockwaves is 6200 MPa for the Allaire et al. model and 6400 MPa for the Kapila et al. model, indicating good agreement with the results of other authors [43,53]. As the bubbles continue to expand, the cavitation reloading impact on the wall occurs at a second peak pressure of 720 MPa for Allaire et al.’s model and 760 MPa for Kapila et al.’s model. It should be noted that although the impact of the shock loading is higher than that of the cavitation reloading, the duration of the cavitation reloading is longer, resulting in significant loading on the wall.
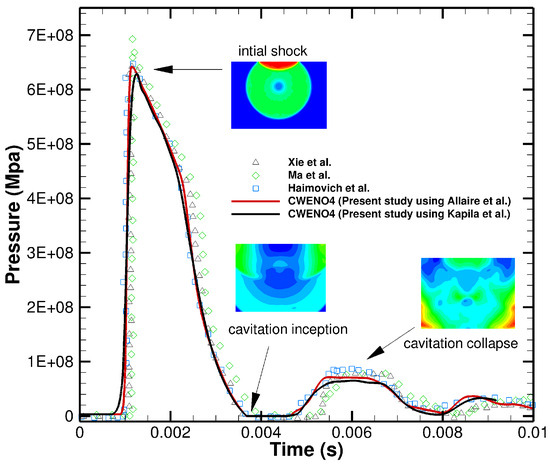
Figure 13.
Underwater near a rigid wall; plots of pressure history for the underwater explosion near a planar rigid wall at the centre location of the upper wall obtained with CWENO4 schemes and compared with other published results [19,43,55].
4.3. 3D Underwater Explosion in an Enclosed, Rigid Cylindrical Wall
This test case has been investigated numerically by various authors [9,34,53,56,57,58]. It serves as an ideal problem for studying shock and cavitation responses in enclosed structures such as a cylindrical tank. The initial conditions for this simulation are based on Xie et al.’s work [4] and are presented below:
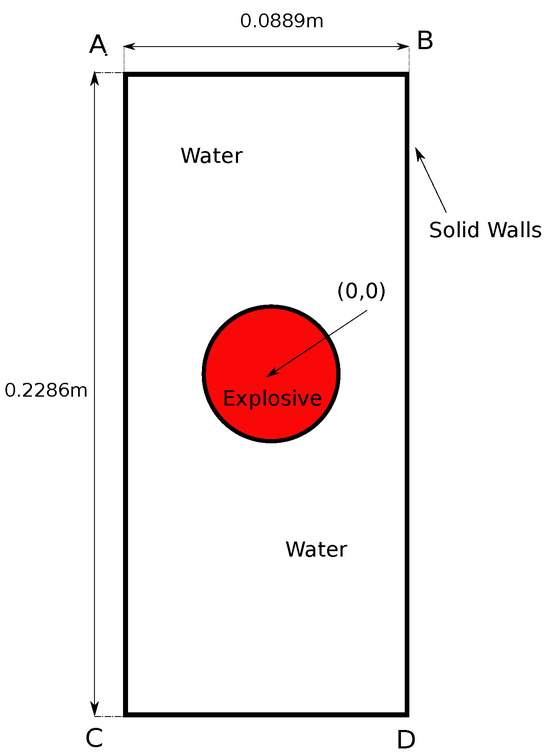
Figure 14.
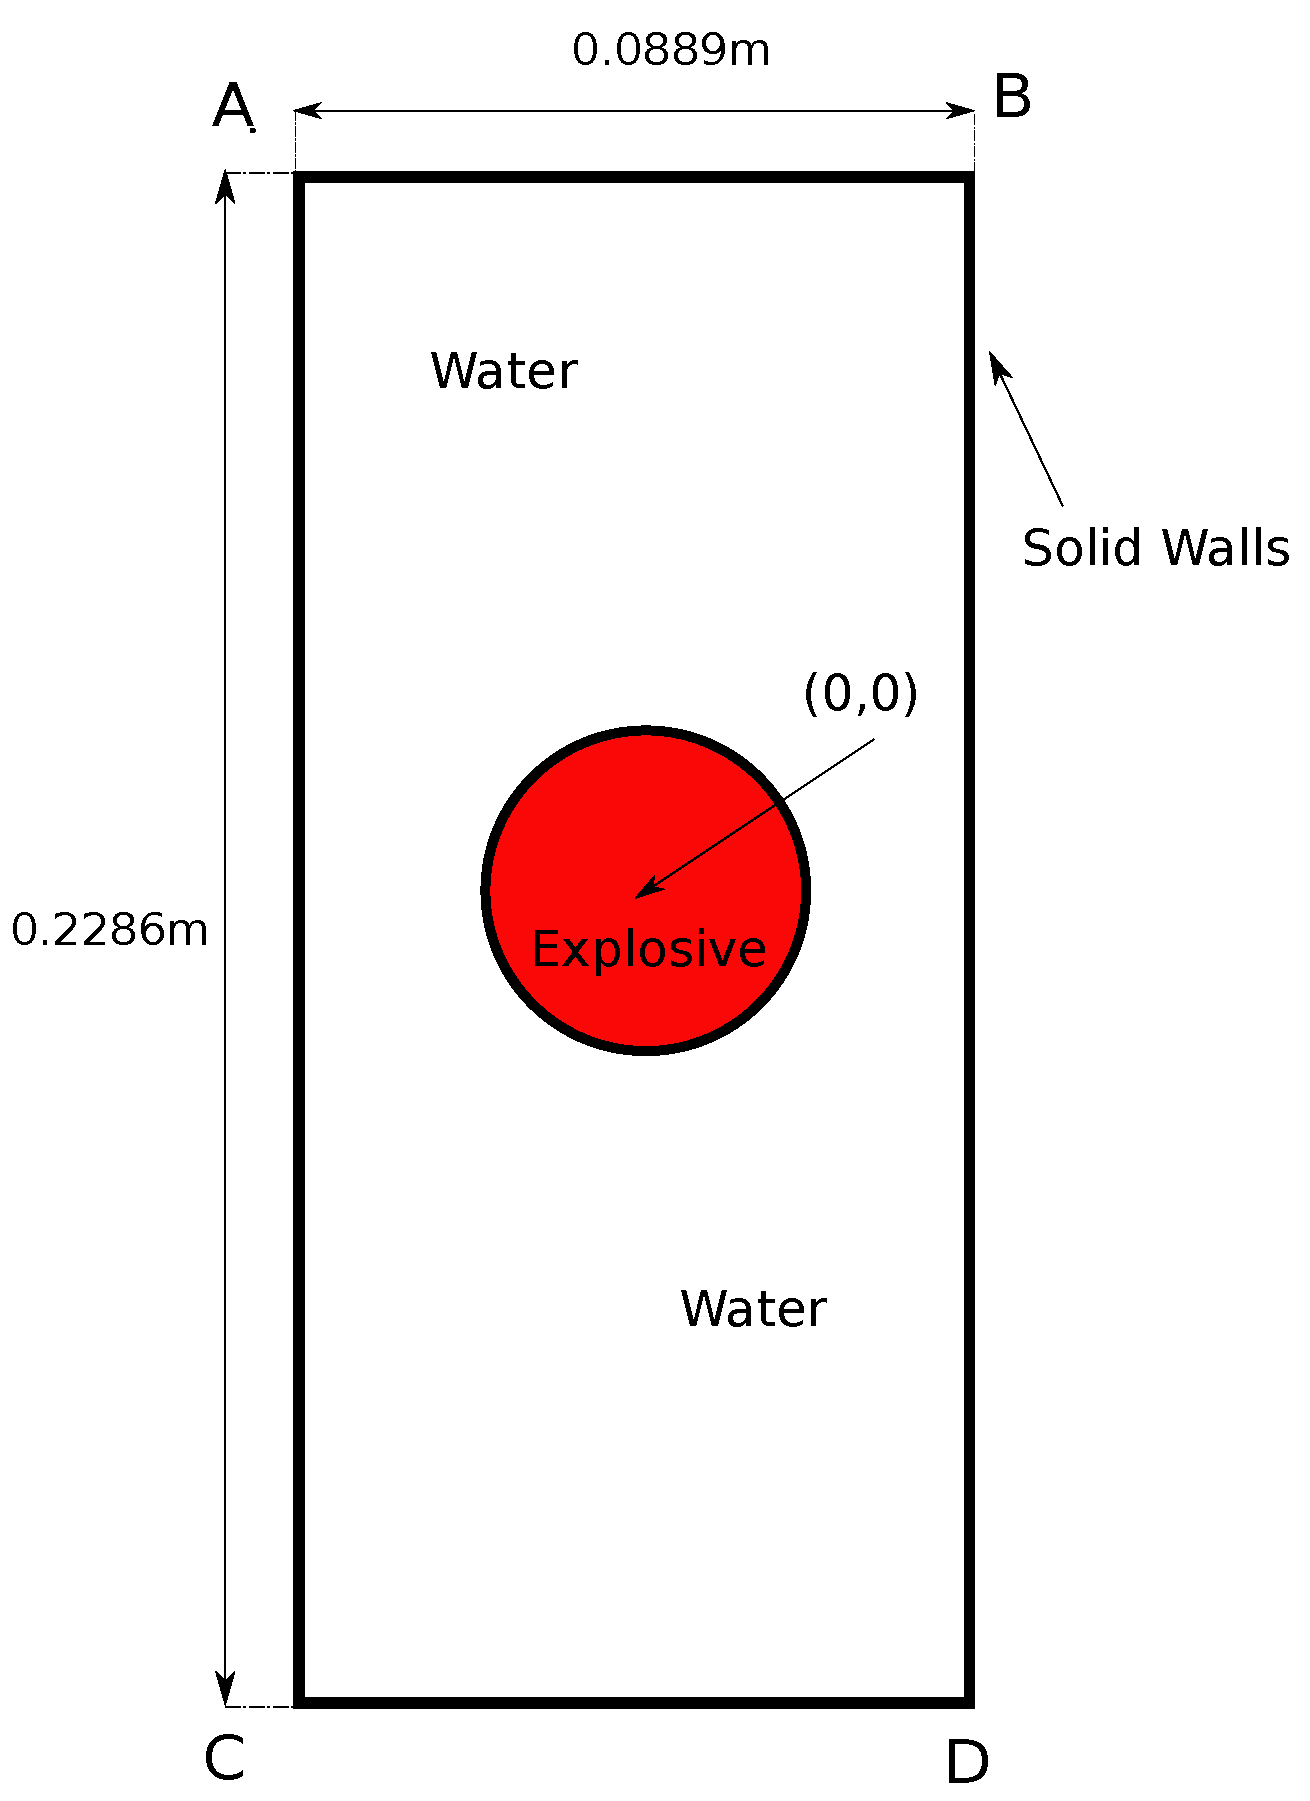
Computational domain setup for three-dimensional underwater explosion in a rigid cylinder.
The explosive, modeled as a gas bubble, has a diameter of 0.03 m and is placed within a rectangular cylindrical wall with dimensions of 0.2286 m in height and 0.0889 m in diameter. The water in the tank is partially aerated with 1.5% air. The test case can be simulated in two-dimensional axisymmetric form using cylindrical coordinates or in three-dimensional form. In our study, the test is conducted in a three-dimensional setup.
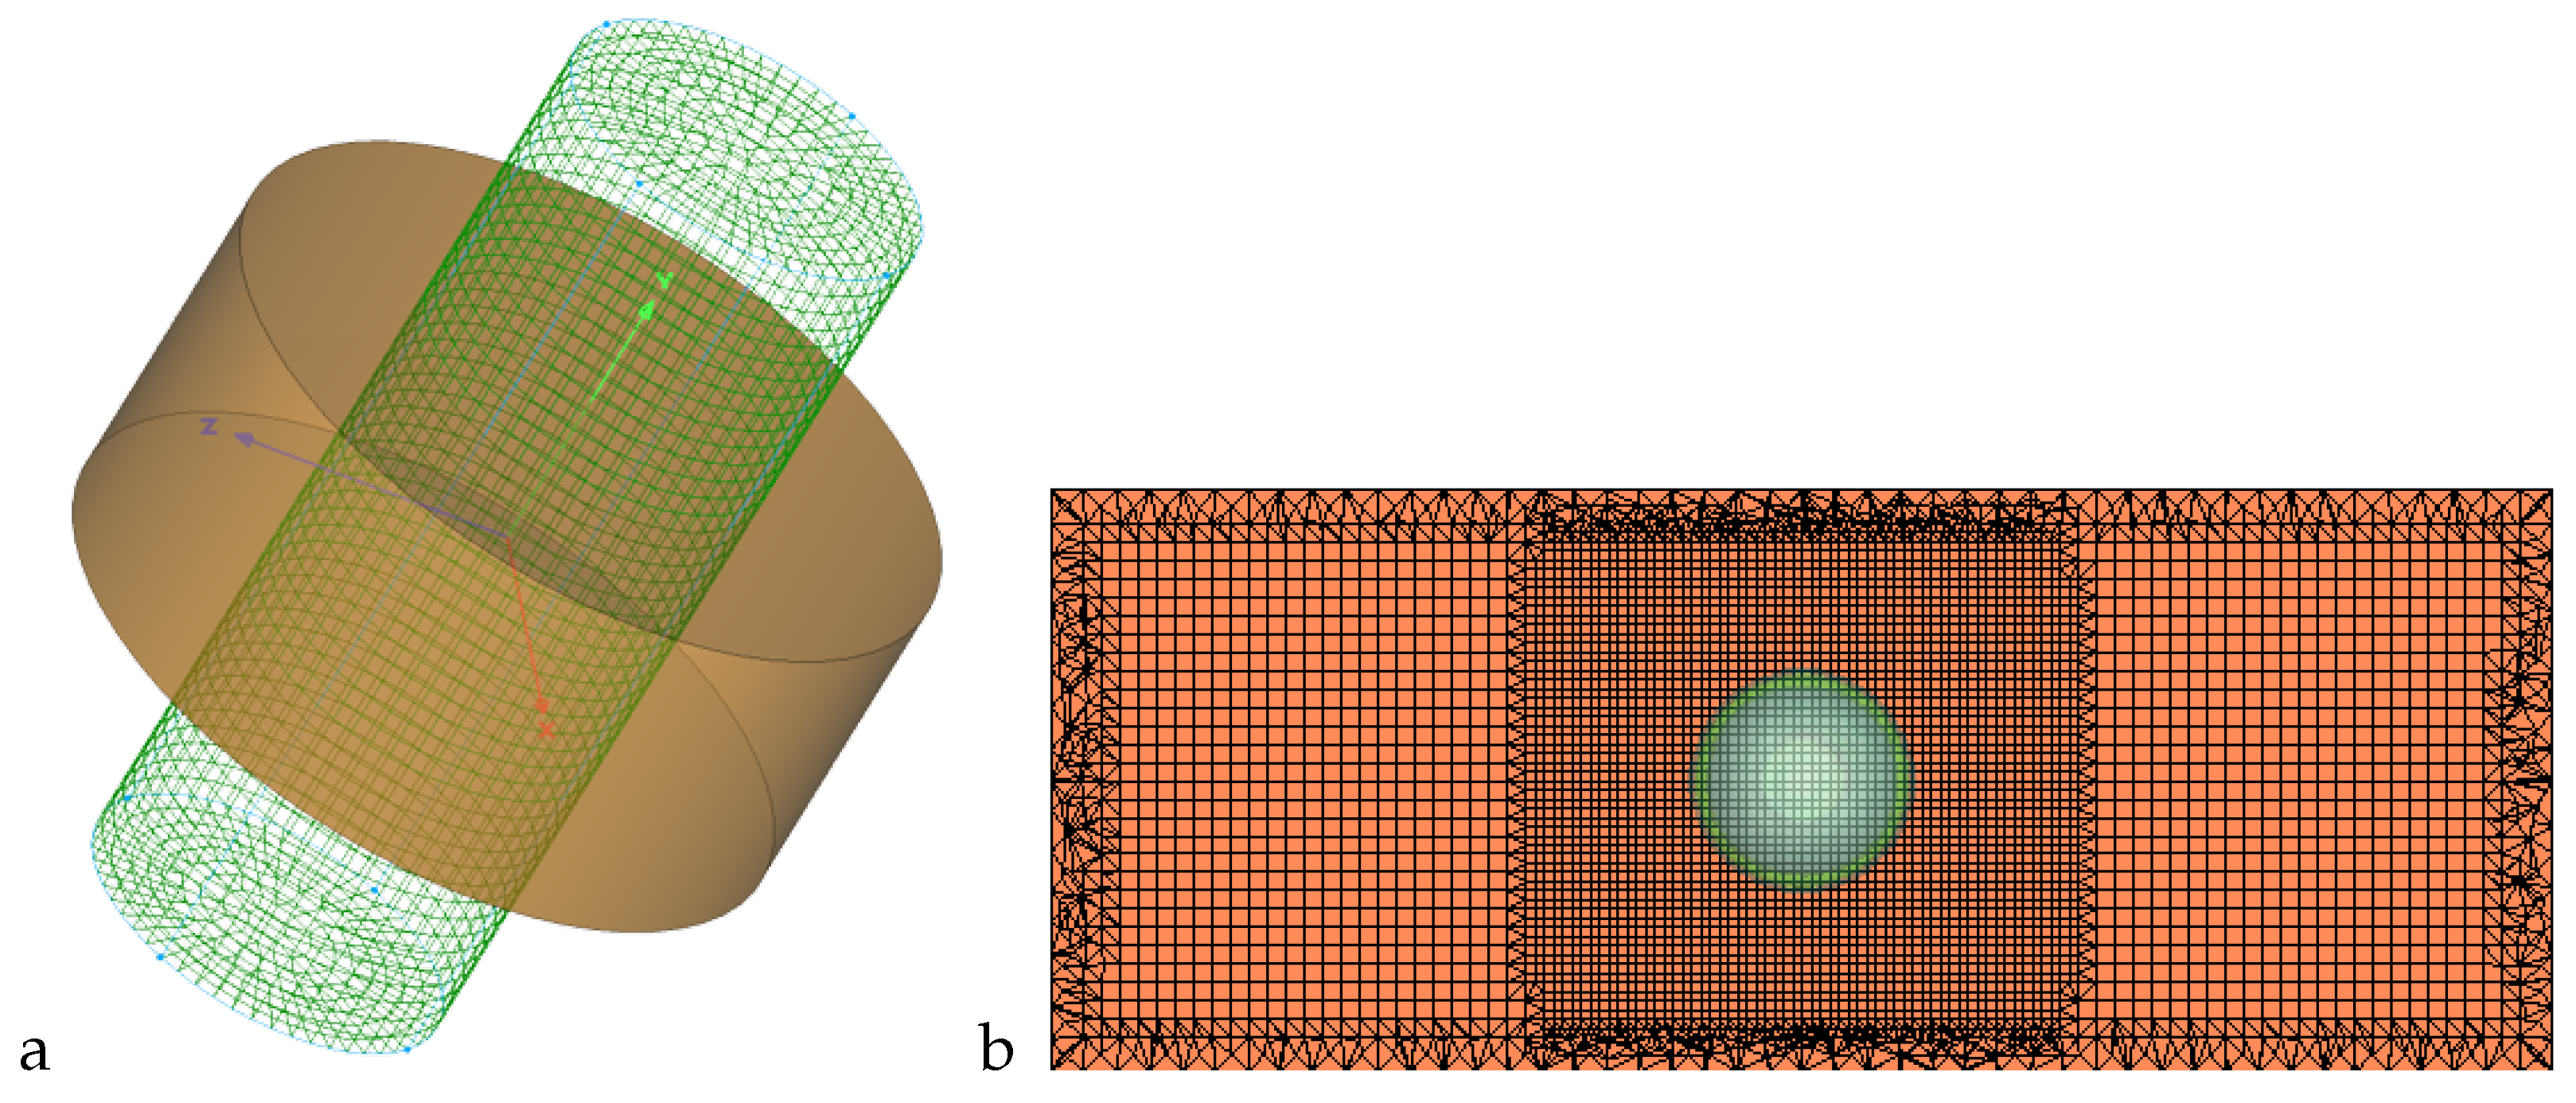
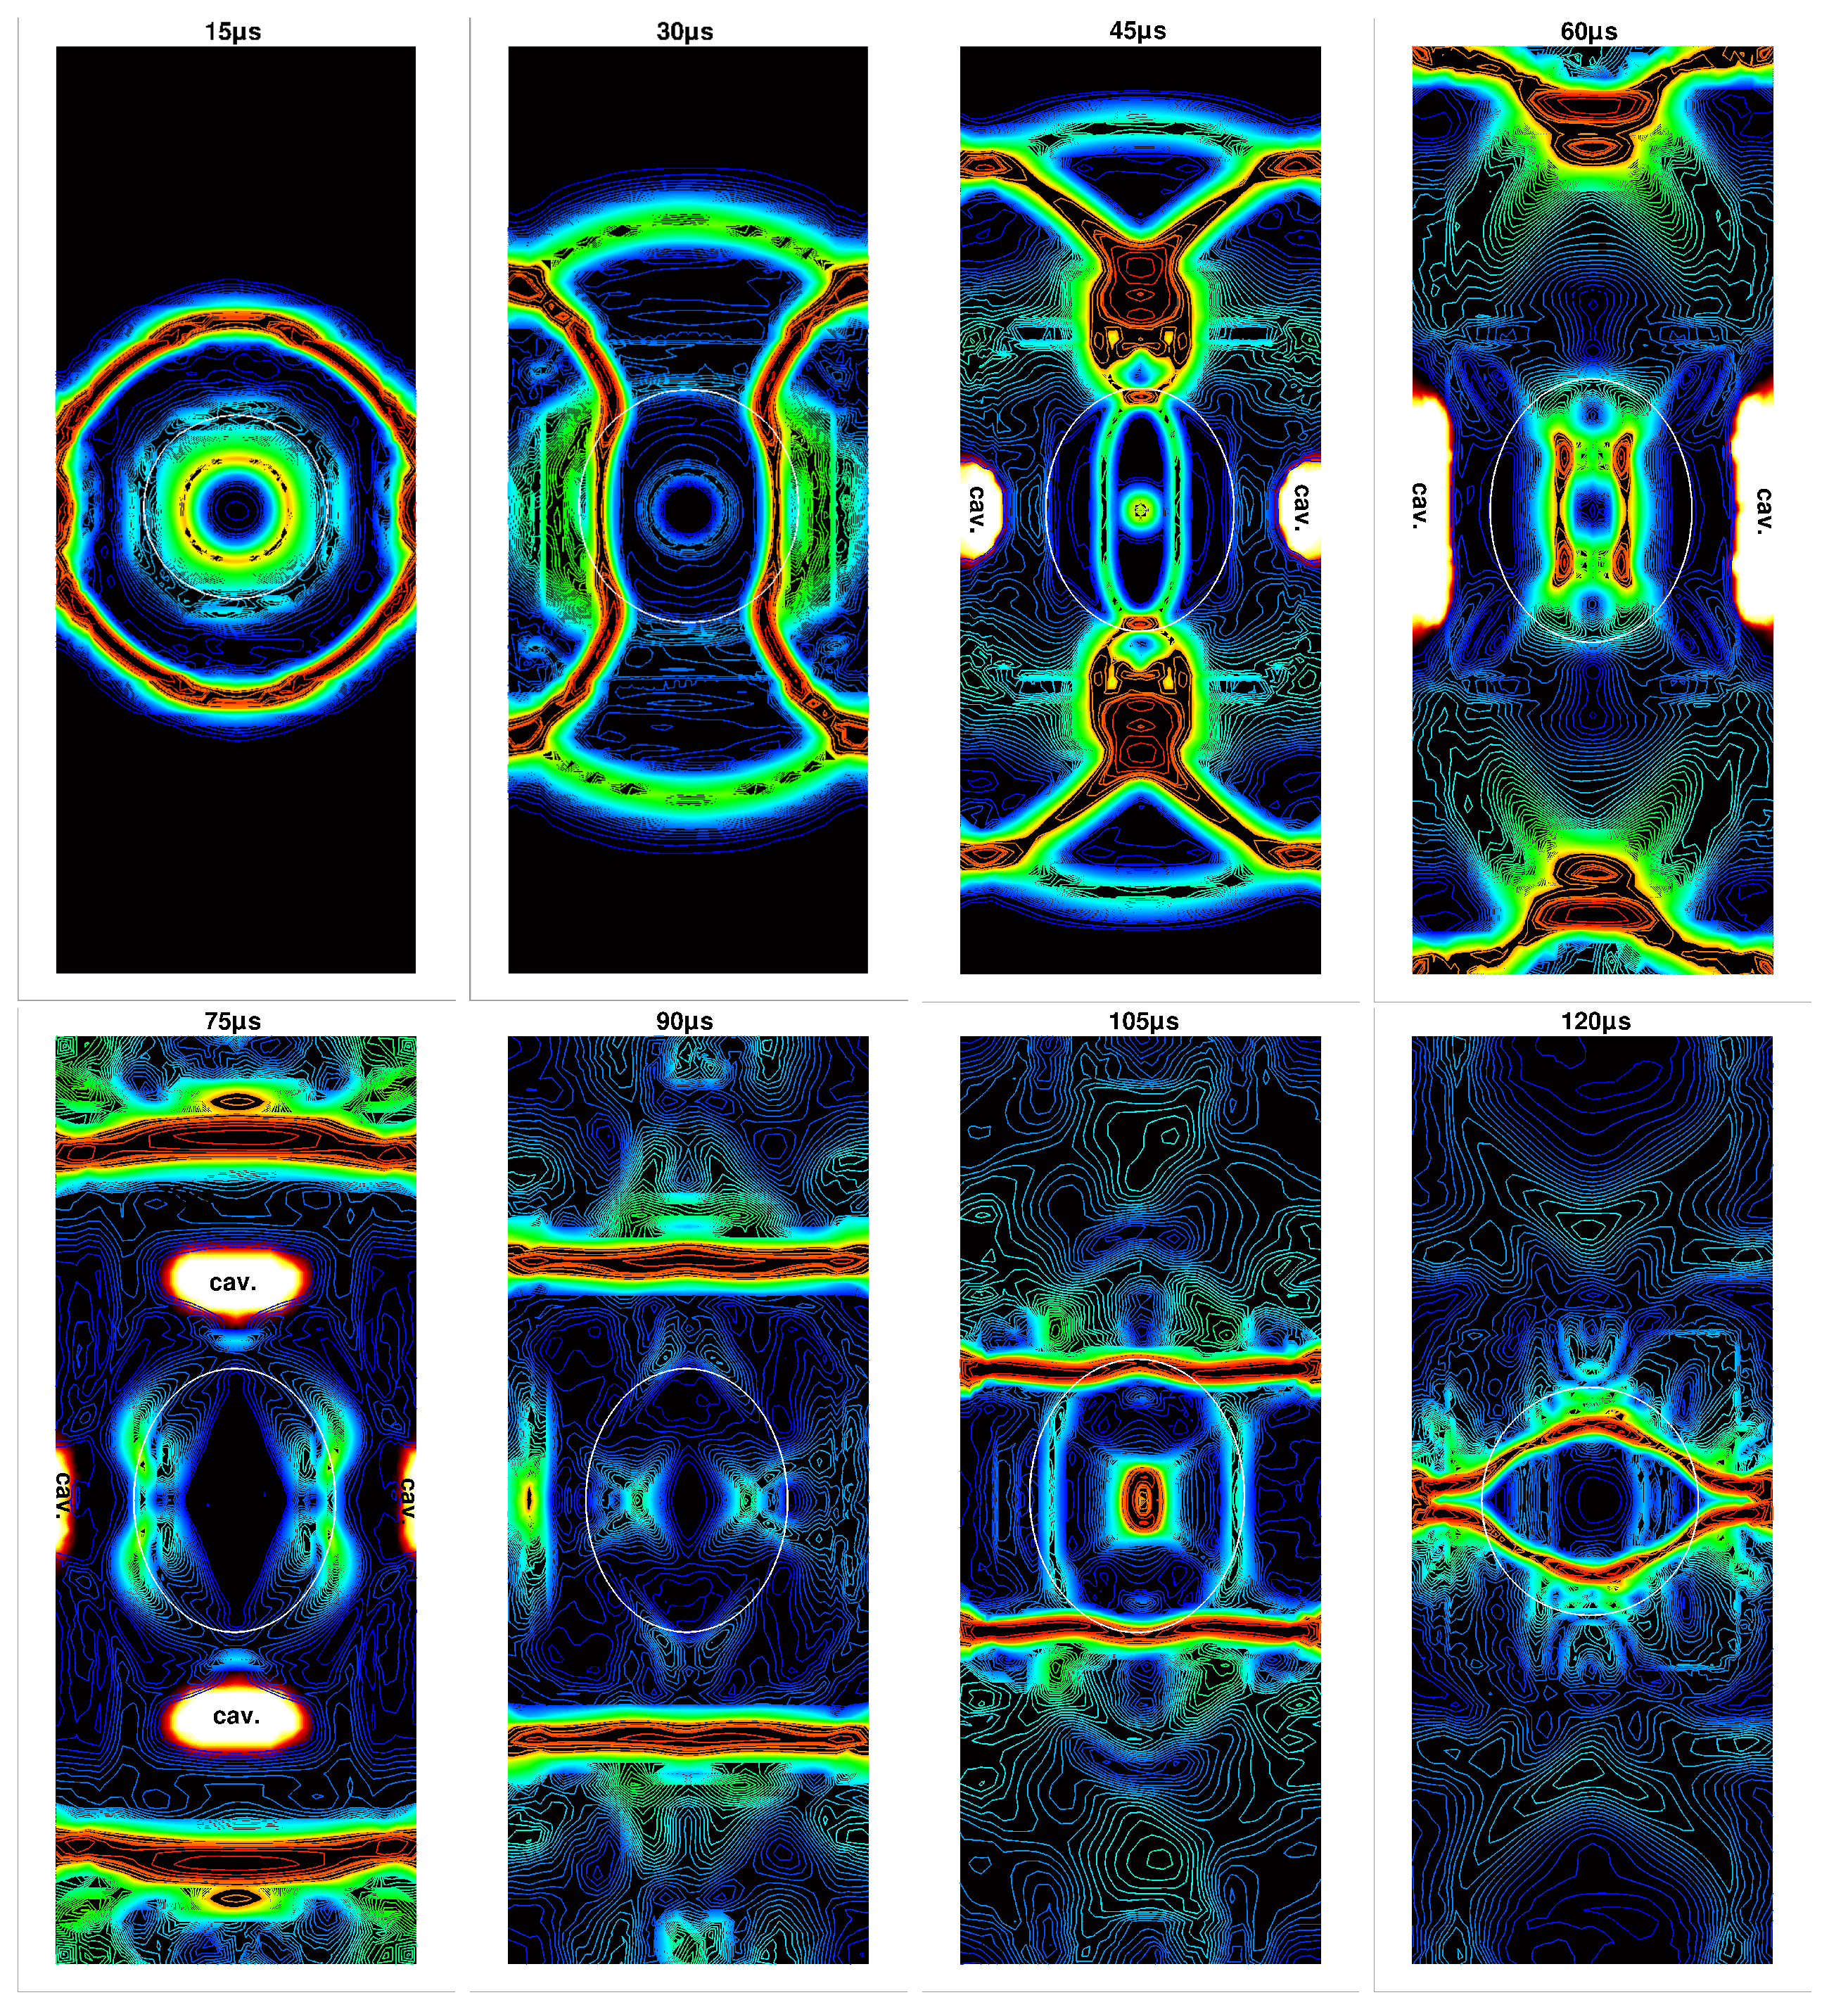
Reflecting boundary conditions are imposed on all surfaces, and a hybrid hexa-dominant mesh is used to discretize the computational domain with approximately 0.5 million cells as shown in Figure 15. A CWENO4 scheme is utilised for numerical simulations, and the simulation is carried out until µs. The time evolution of the gas bubble’s pressure is shown in the pressure contour plot in Figure 16. It can be observed that as the bubble explodes and expands, shock waves are generated and impact the side walls of the cylinder at t = 15 µs. These waves are immediately reflected back into the water, striking the expanding bubble at t = 30 µs. This results in rapid changes in density and rarefaction. At t = 45 µs, the shape of the bubble transforms into an oval. Over time, a low-pressure region is observed around the bubble and close to the centre of the lateral walls at t = 30 µs, leading to cavitation at t = 45 µs, 60 µs, and 70 µs, as evident in Figure 16. The cavitation pocket is most prominent on the wall at t = 60 µs. The violent collapse of cavitation generates reloading pressure on the walls of the cylindrical structure, as depicted in Figure 17. This phenomenon of cavitation-induced reloading can have a significant impact on enclosed structures, with effects comparable to those of the primary shock-wave loading.
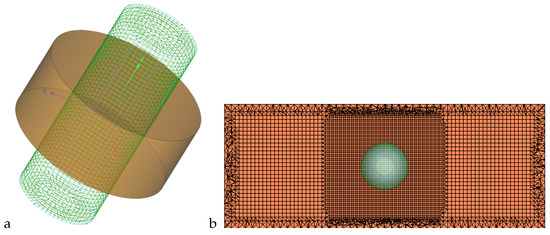
Figure 15.
(a) Mesh used for three-dimensional cylindrical underwater explosions; (b) corresponding mesh refinement for simulation zone.
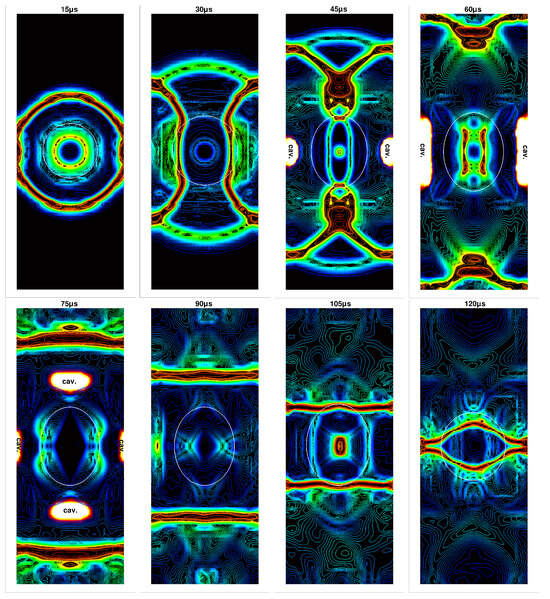
Figure 16.
Underwater explosion in an enclosed cylindrical container; pressure gradient contours for the 3D underwater explosion in an enclosed, rigid cylindrical wall.
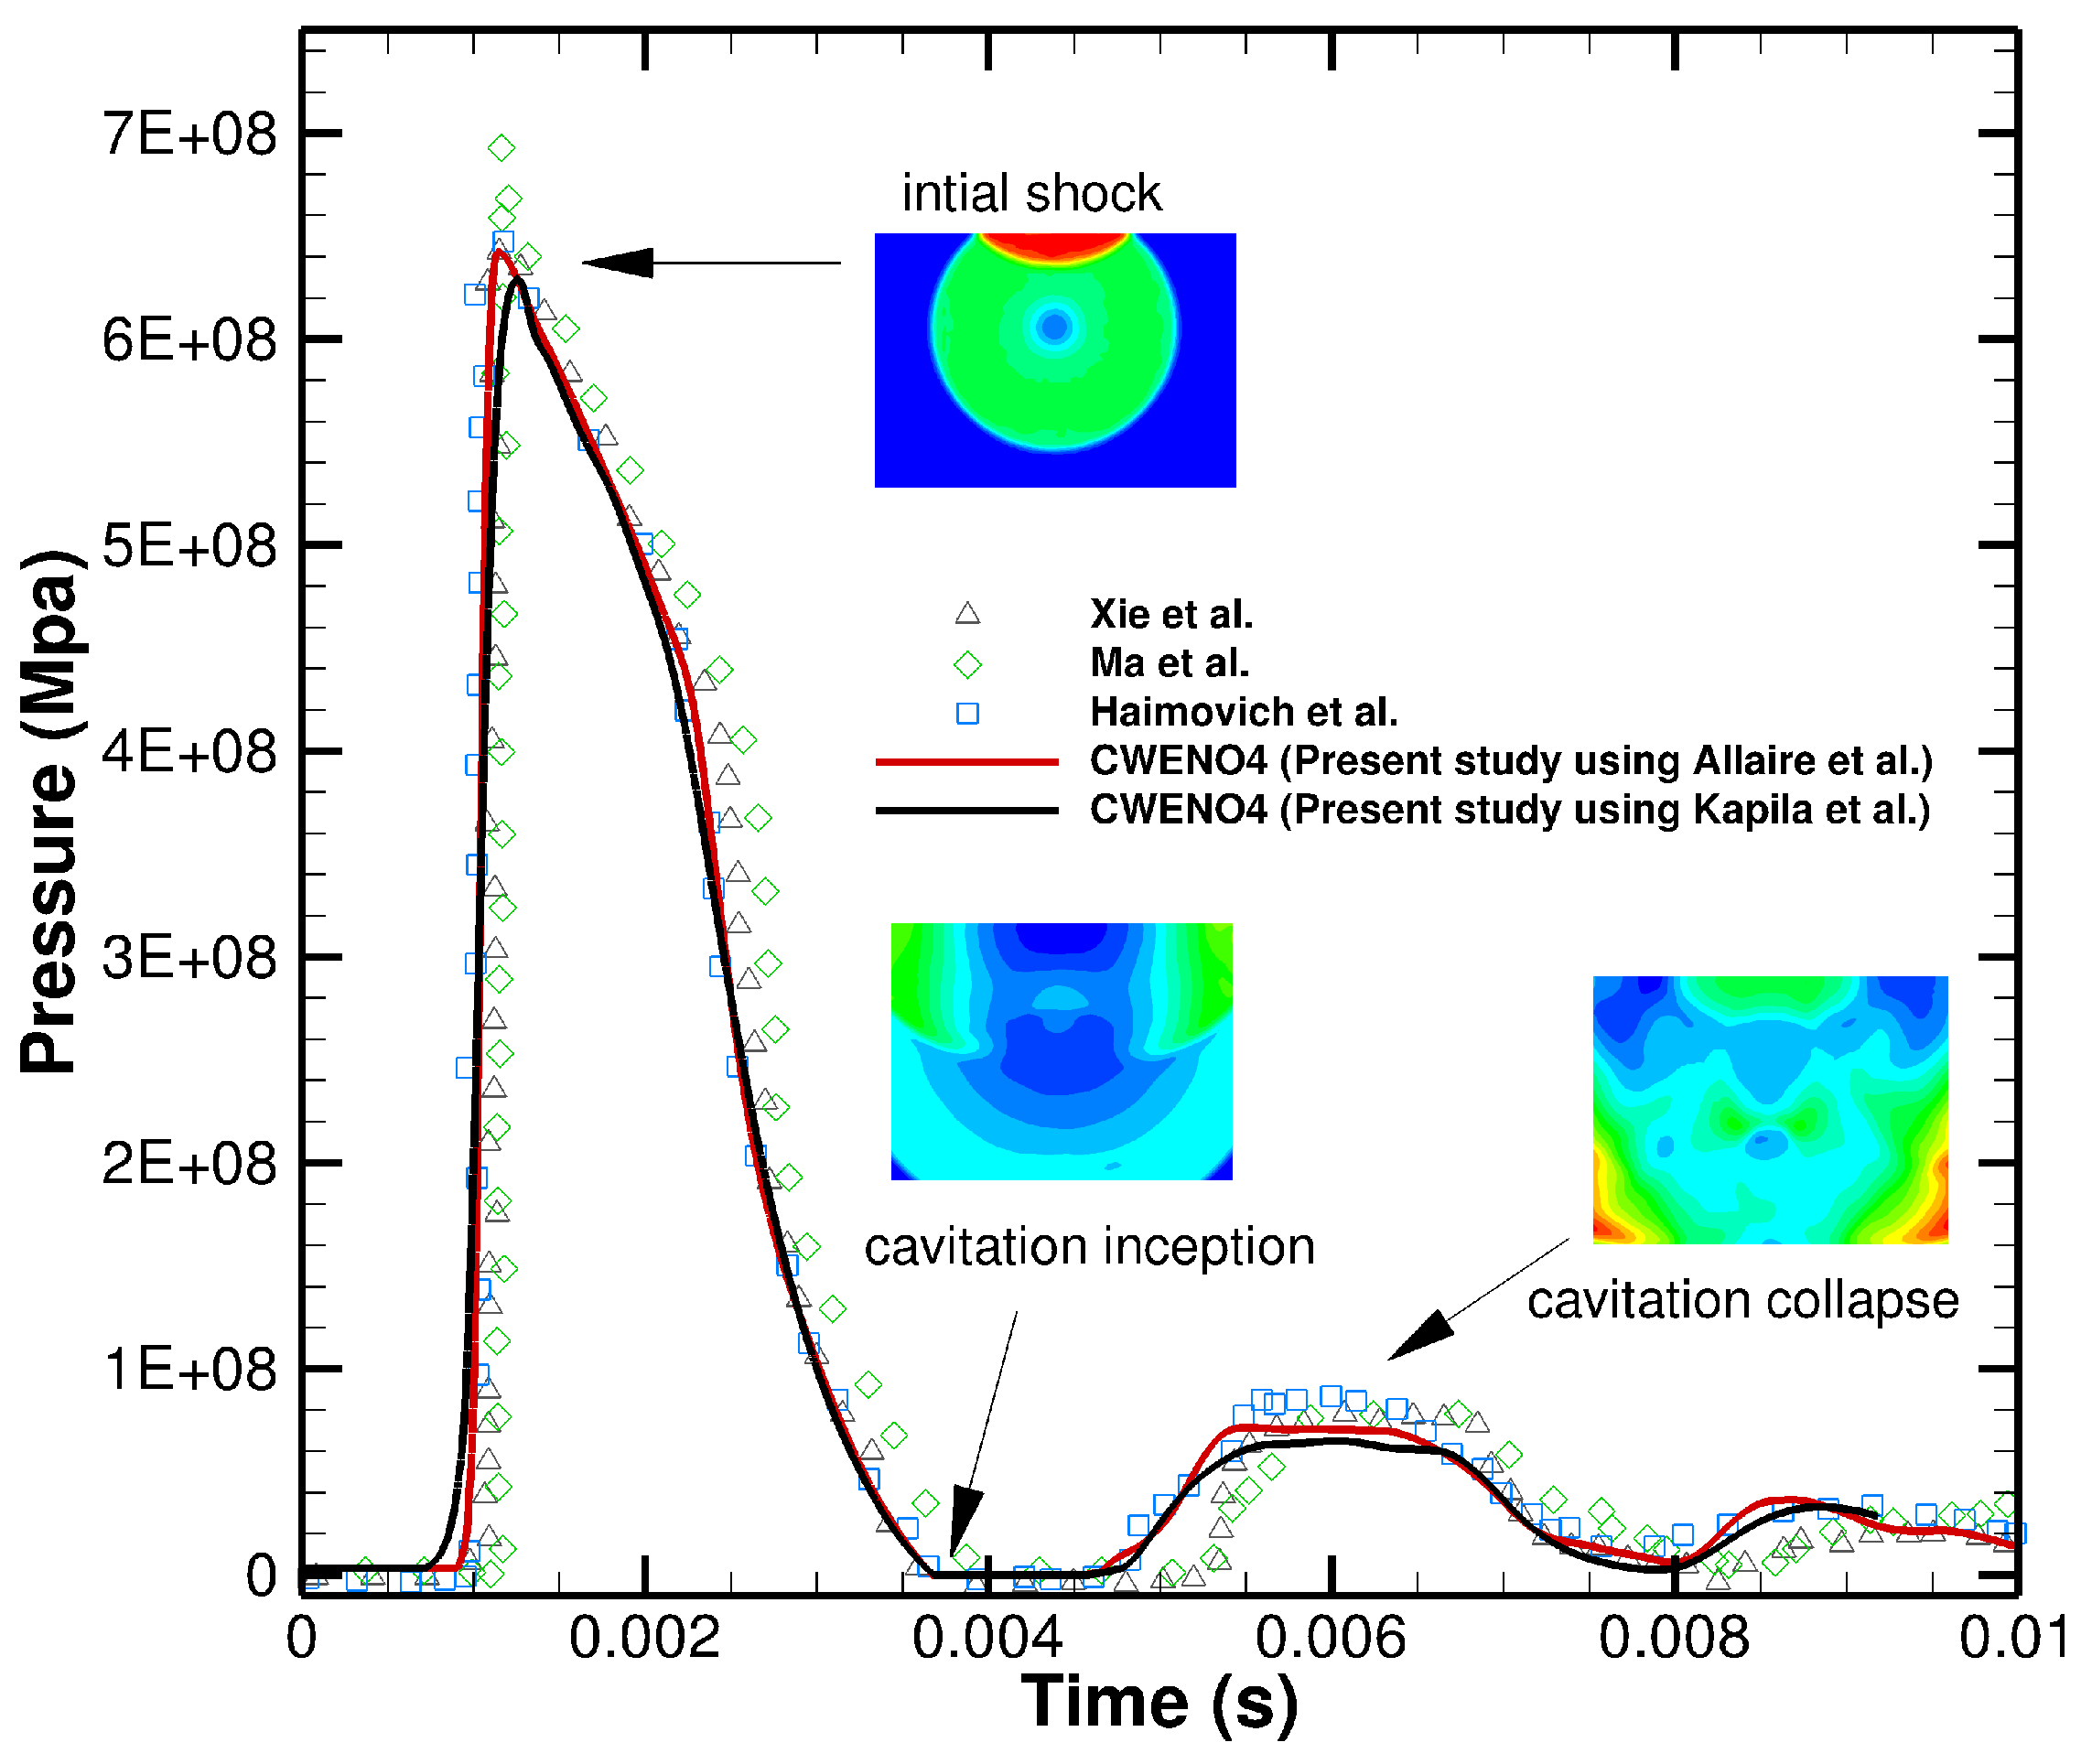
The pressure history plot in Figure 17 reveals that the initial peak pressure obtained in our study using the diffuse interface methods proposed by Allaire et al. is 6600 MPa. This value is in close agreement with the experimental result of Wardlaw et al. [59], where P = 6300 MPa. Other studies by Shyue et al. [9] and Ying et al. [60], which utilised the Allaire et al. diffuse interface methods in conjunction with cut-off cavitation models, reported numerical values in the range of 7000–7200 MPa, respectively.
The second impact of cavitation collapse occurs at a time of 90 µs, with a pressure value of P = 2100 MPa, as evident in our results. This value is lower than the numerical results reported by Shyue et al. [9] and Ying et al. [60] but closer to the experimental value than the latter. Notably, the study conducted by Chen [61] using smoothed particle hydrodynamics (SPH) models exhibited a delay in the cavitation collapse and reload, as the Schmidt model [4,55,62] was employed instead of the cut-off model, as utilised in the present study.
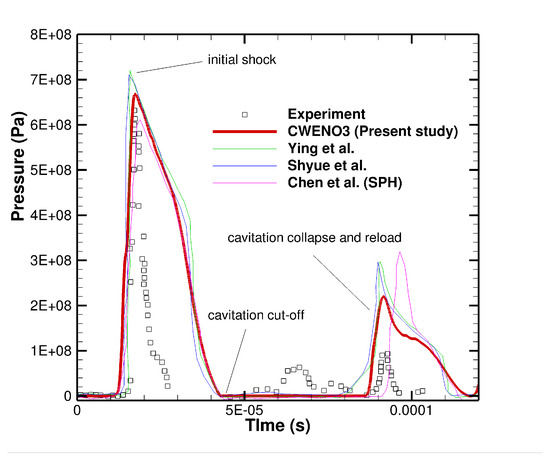
Figure 17.
Underwater explosion in an enclosed cylindrical container; plots of pressure history (at the centre location of the left wall) for the underwater explosion in an enclosed cylindrical wall with CWENO4 schemes, and compared with other published results [9,59,61].
Figure 17.
Underwater explosion in an enclosed cylindrical container; plots of pressure history (at the centre location of the left wall) for the underwater explosion in an enclosed cylindrical wall with CWENO4 schemes, and compared with other published results [9,59,61].
4.4. 2D Underwater Explosion of Two Bubbles Placed Horizontally near a Free Surface
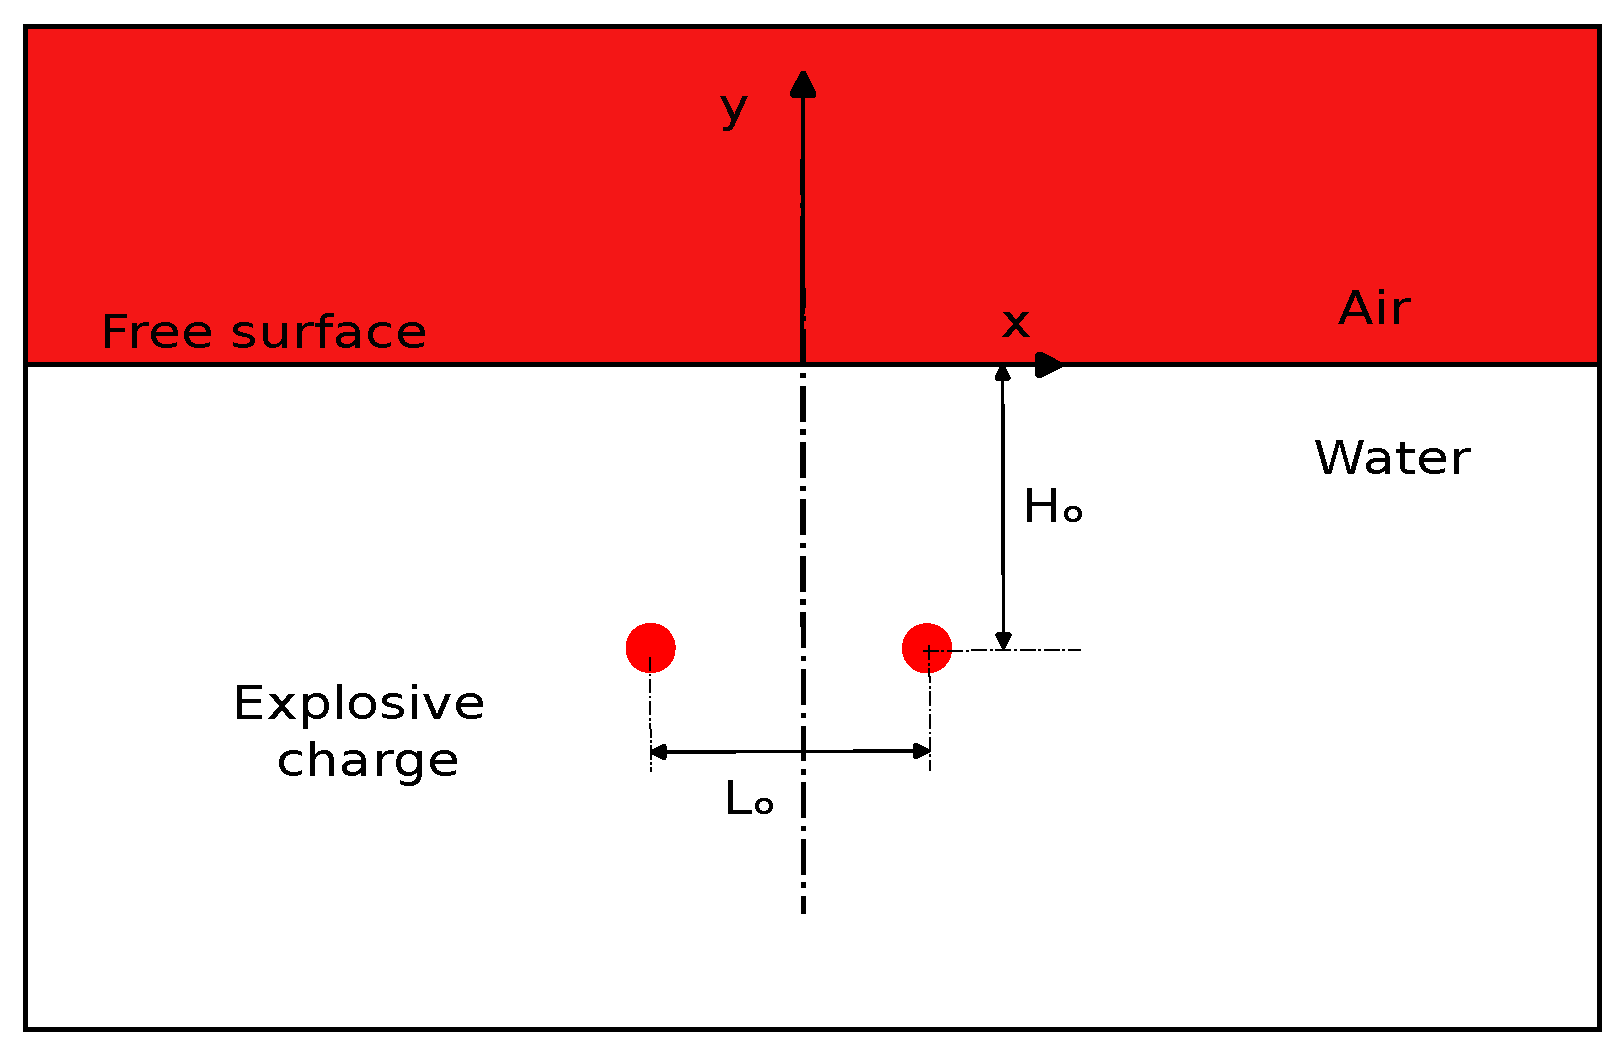
When two bubbles are positioned close to one another, the local pressure field may vary due to the bubble–bubble interactions. The growth, collapse, and oscillation periods of the bubbles, i.e., the time it takes for a bubble to complete one cycle of expansion and collapse can be affected by these changes in pressure. In a two-dimensional setup Figure 18, two bubbles are positioned horizontally in close proximity to each other near a free surface as an attempt to investigate the influence of the separation distance between the bubbles on cavitation. The separation distance, denoted as , is varied at four different values: m, between two identical bubbles located 0.3 m below the free surface. This configuration closely resembles the one utilised by Yu et al. [63]. Additionally, a single bubble with similar computational parameters and dimensions is also simulated for comparative analysis. The domain is discretized using a quadrilateral coarse mesh comprising approximately 0.025 million cells, with all surfaces imposing outflow boundary conditions.
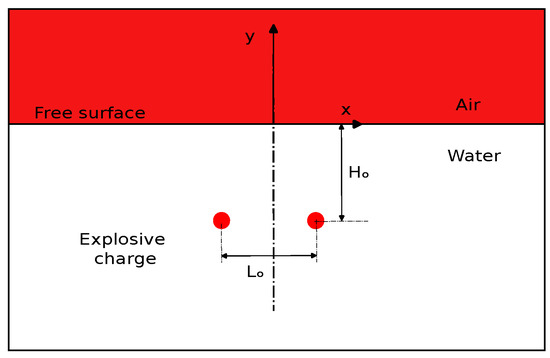
Figure 18.
Computational domain setup for the two-dimensional underwater explosion of two bubbles placed horizontally near a free surface.
The physical characteristics of the fluid involved in these test cases are described below, which includes parameters such as density, velocity, pressure, specific heat ratio (or specific heat capacity ratio), and volume fraction:
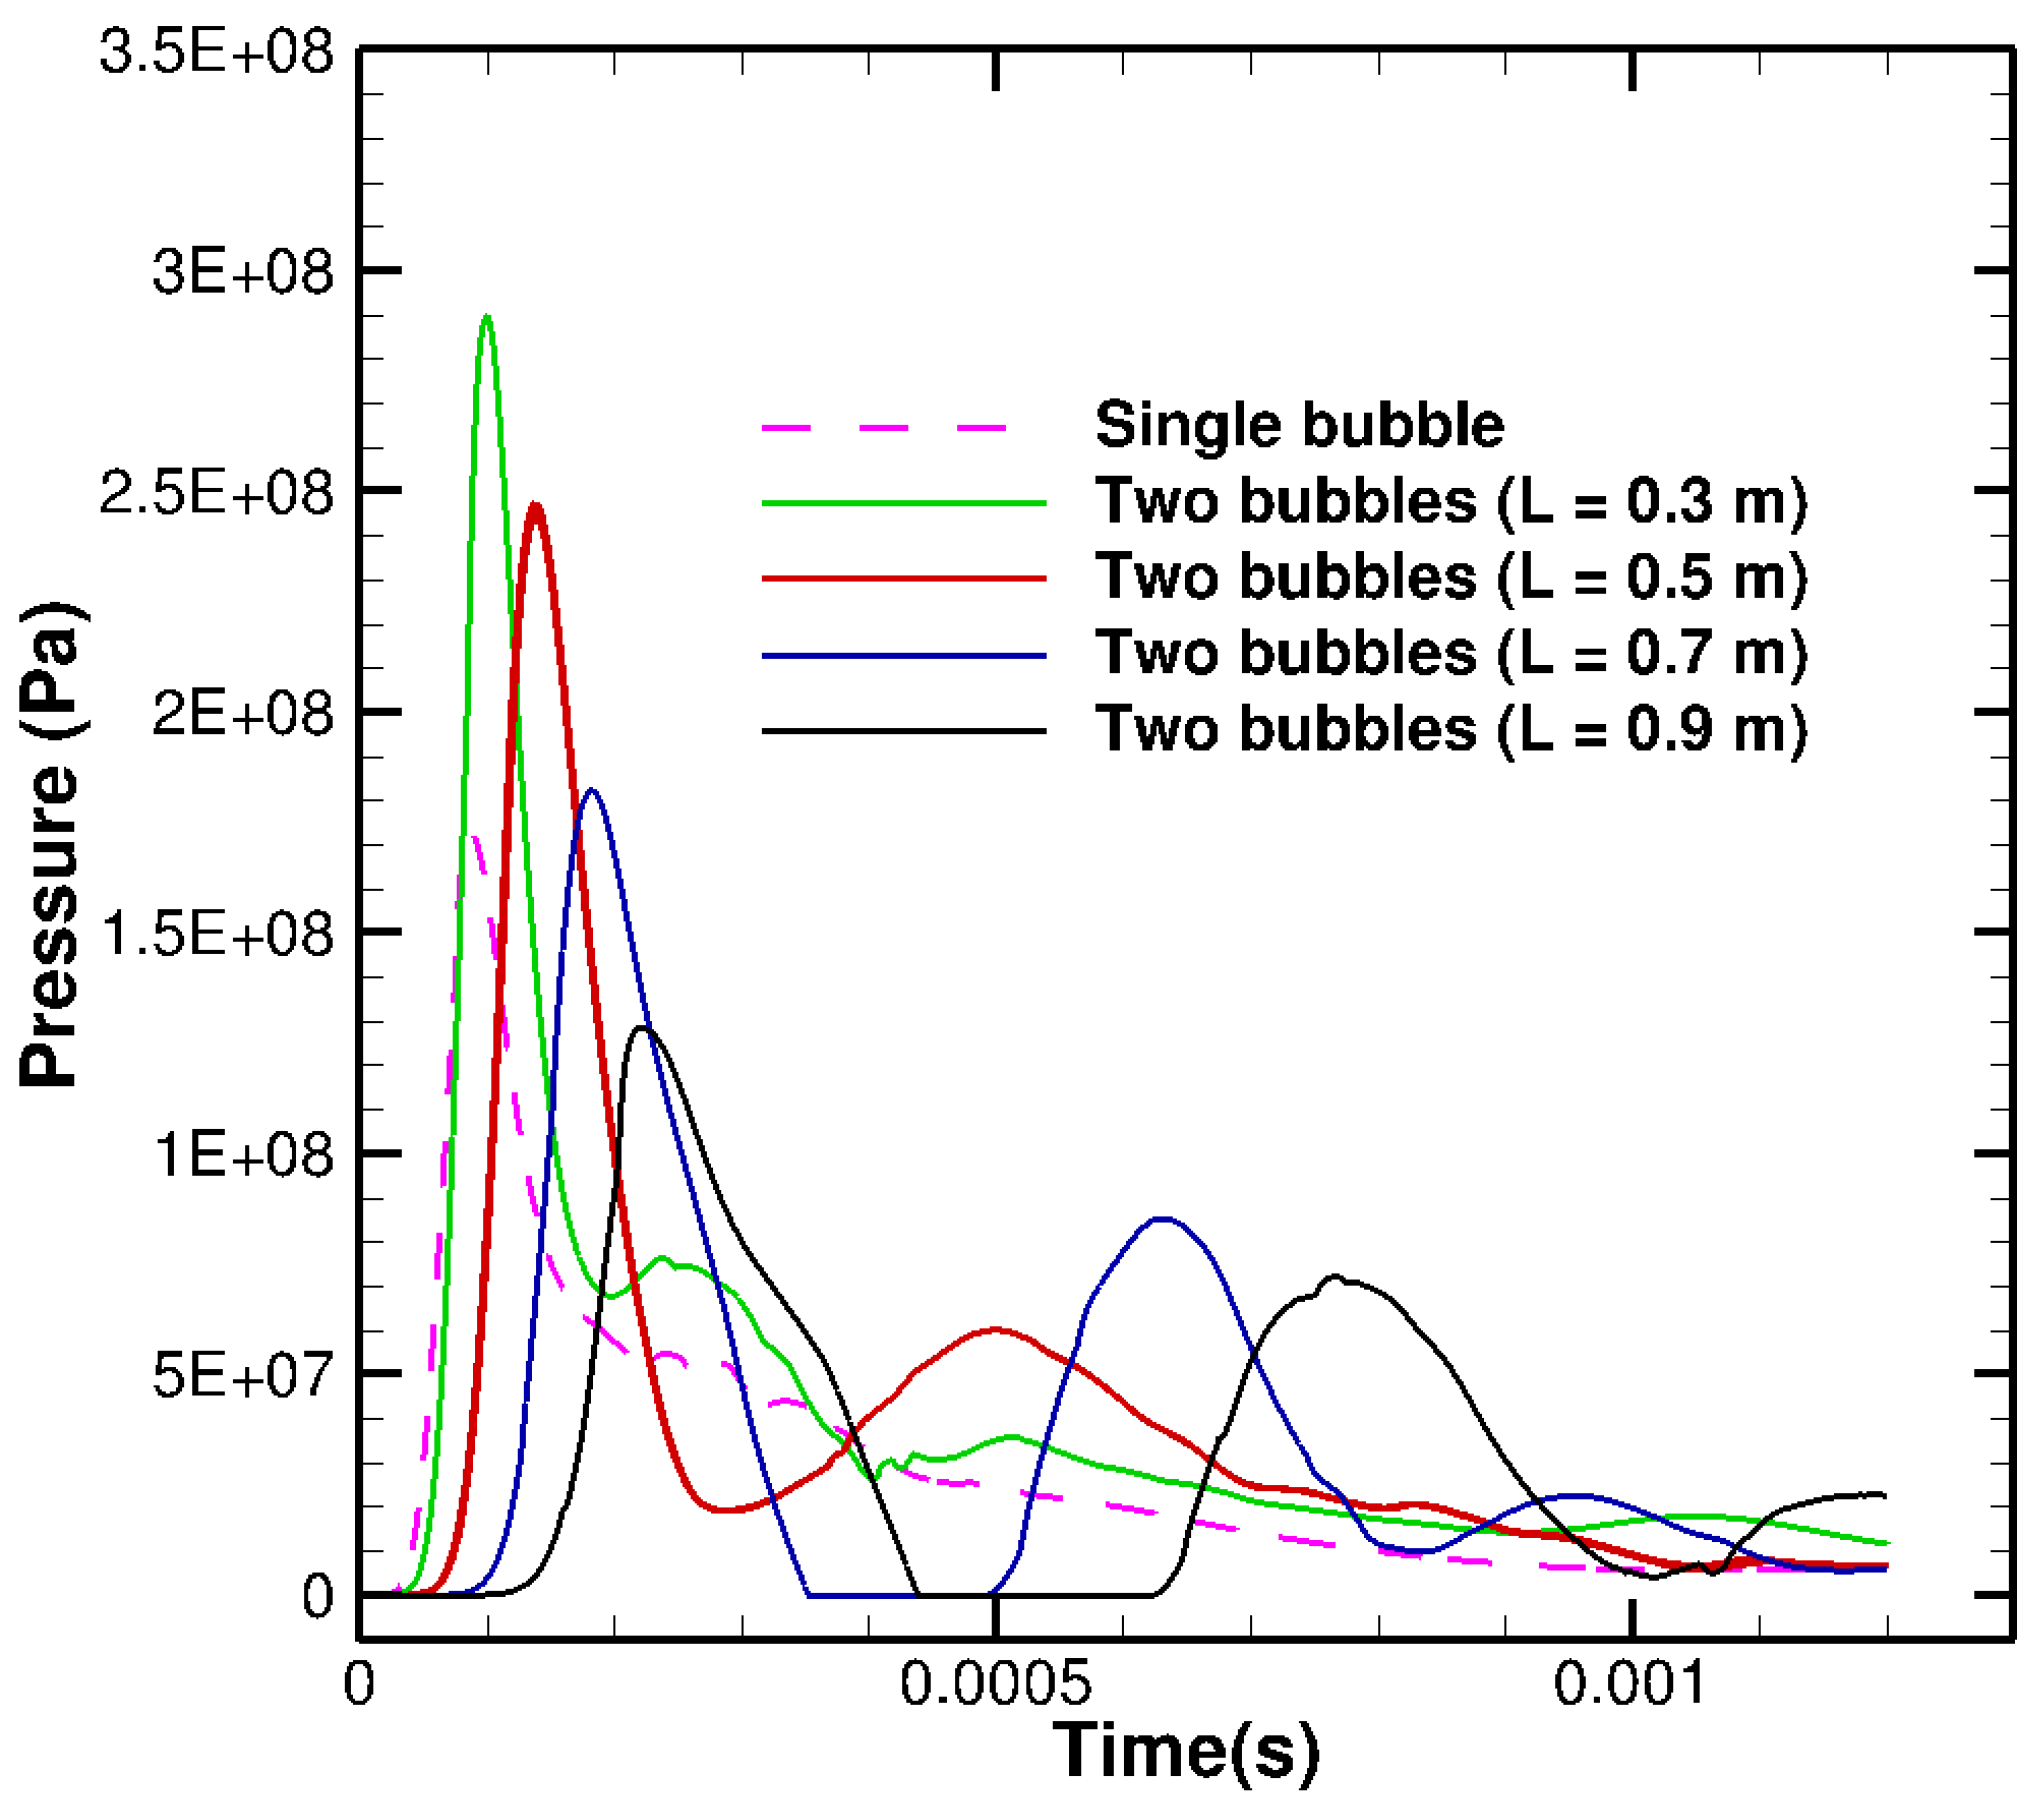
As observed in previous UNDEX (underwater explosion) test cases in this paper, the two bubbles undergo rapid expansion, generating a shock wave that propagates through the water and interacts with the surrounding bubbles. The pressure-time history at the centre of the explosion, depicted in the pressure contour plot Figure 19, reveals that the peak pressure caused by the initial shock wave hitting the free surface for a single bubble is 170 MPa, while for the two-bubble case with the largest inter-bubble distance of m, it reaches 290 MPa, which is 1.7 times higher than that of the single bubble. Furthermore, as evident in Figure 19, the initial peak pressure, which is a result of the intensity of the shock wave on the free surface increases with decreasing inter-bubble distance, from the maximum value at m to the smallest value at m. The close proximity of the two bubbles allows for stronger interaction, leading to a higher shock intensity on the free surface.
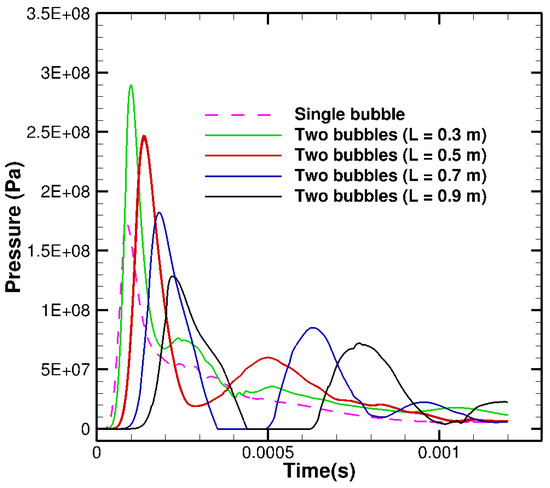
Figure 19.
Underwater explosion of a single and two bubbles configurations placed horizontally near a free surface; plots of pressure history (at the centre location of the left wall) for the underwater explosion in an enclosed cylindrical wall with CWENO4 scheme, different inter-bubble distances m are considered [9,64,65].
The occurrence of cavitation beneath the free surface during a two-bubble explosion is influenced by the size and spacing of the bubbles. In same plot Figure 19, as the inter-distance bubbles increase, the cavitation bubble collapse that results in the cavitation reloading on the free surface is further delayed as seen in the second pressure peak. The second peak pressure associated with cavitation reloading is also more pronounced for the two charged bubbles compared to a single bubble. This observation further supports the conception that two charged bubbles have a higher potential for intensifying structural damage due to cavitation reloading compared to a single bubble. The ratio of the initial peak pressure on the free surface caused by the shock wave to that of the cavitation reloading is about four times for the smaller inter-bubble m, and twice for the larger inter-bubble distances m. This shows that for larger inter-bubble distances, the effect of structural damage caused by cavitation is more comparable to that of the primary shock-wave loading than for smaller inter-bubble distances.
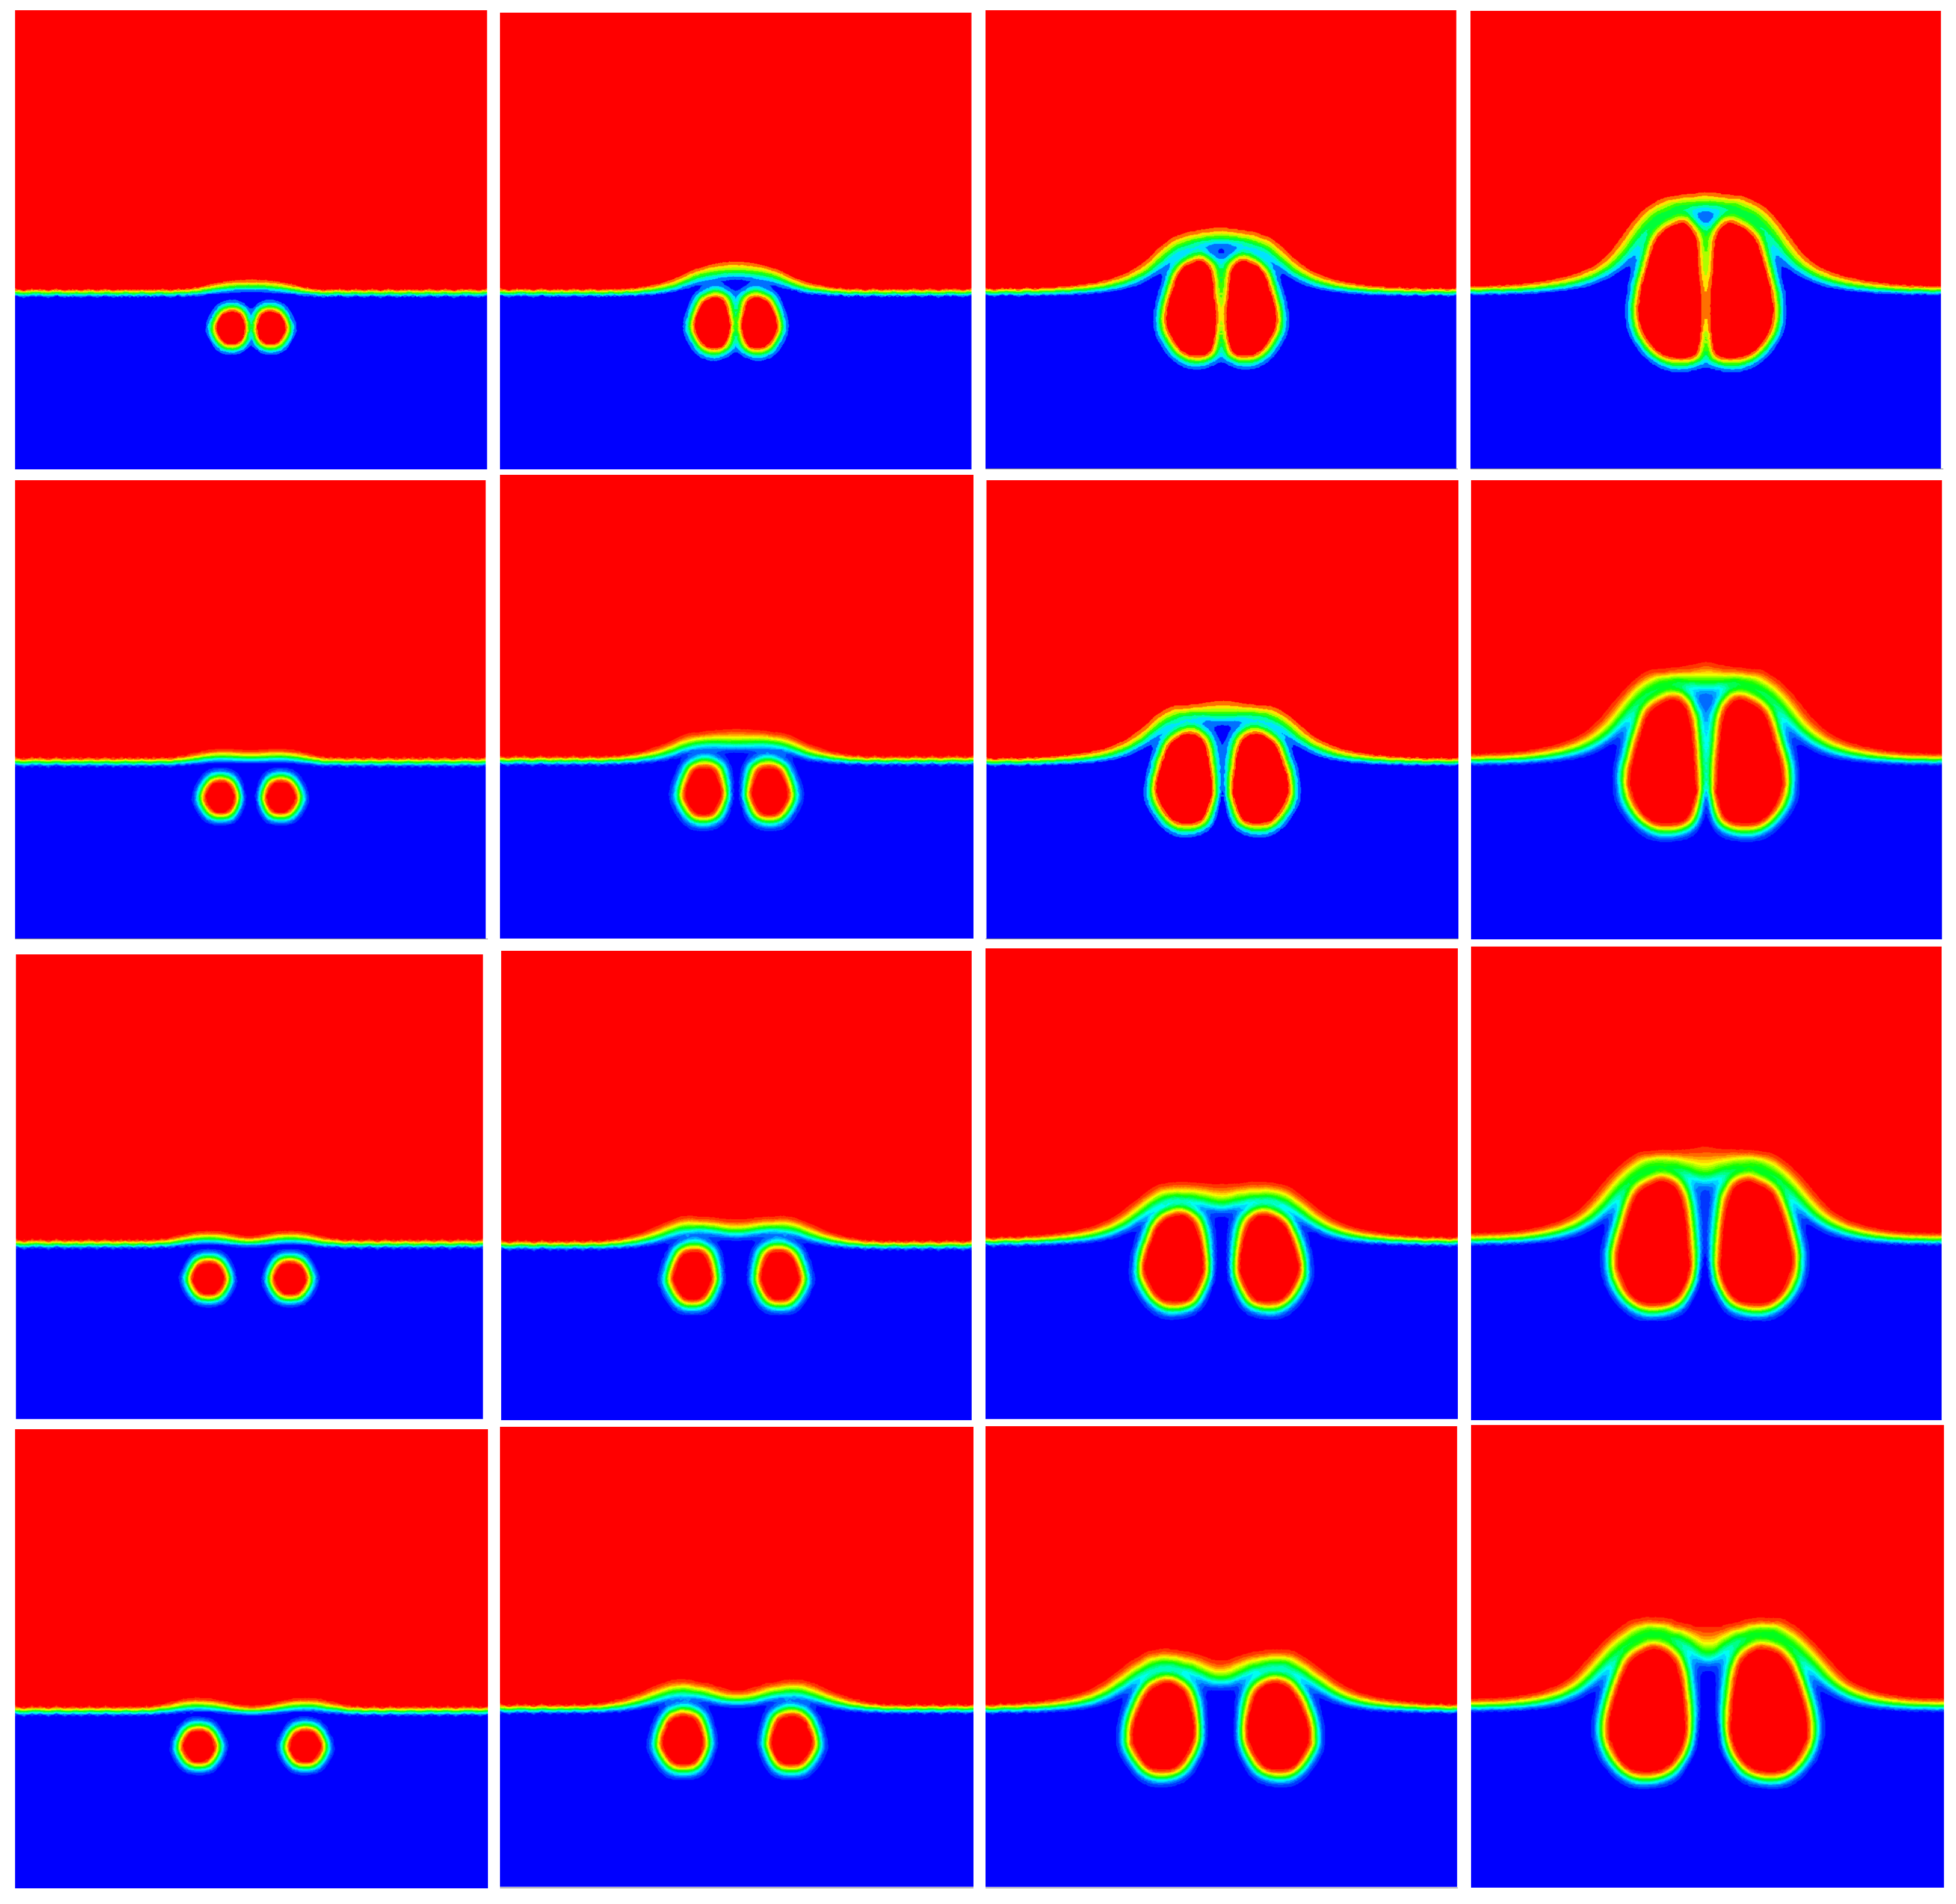
The volume-fraction contours presented in Figure 20 effectively illustrate the temporal evolution of the bubbles with the distances ranging from 0.3 m to 0.9 m. As the separation distance , increases from 0.3 m to 0.9 m, the height of the free surface centre consistently decreases at each time instant. In the same figure, it is observed that for the smallest inter-bubble distances m, the bubbles expand and eventually coalesce or merge.

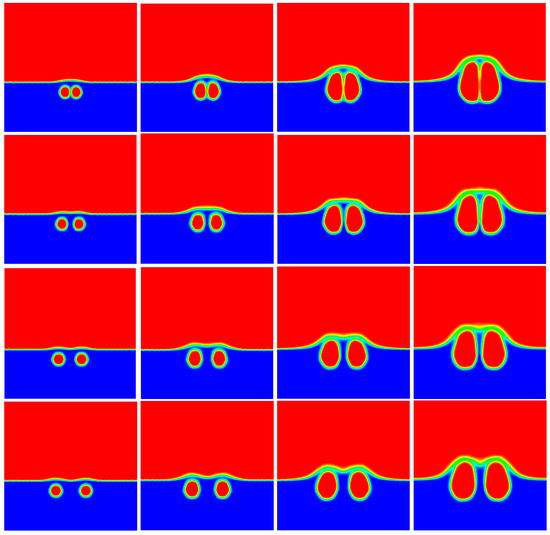
Figure 20.
Underwater explosion of single bubble (top row) and two bubbles configurations placed horizontally near a free surface; contour of volume fraction using a CWENO4 scheme on a medium mesh at t = (0.2, 0.4, 0.8, and 1.2) ms (from left to right) and for inter-bubble lengths of 0.3, 0.5, 0.7, and 0.9 m from top to bottom, respectively.
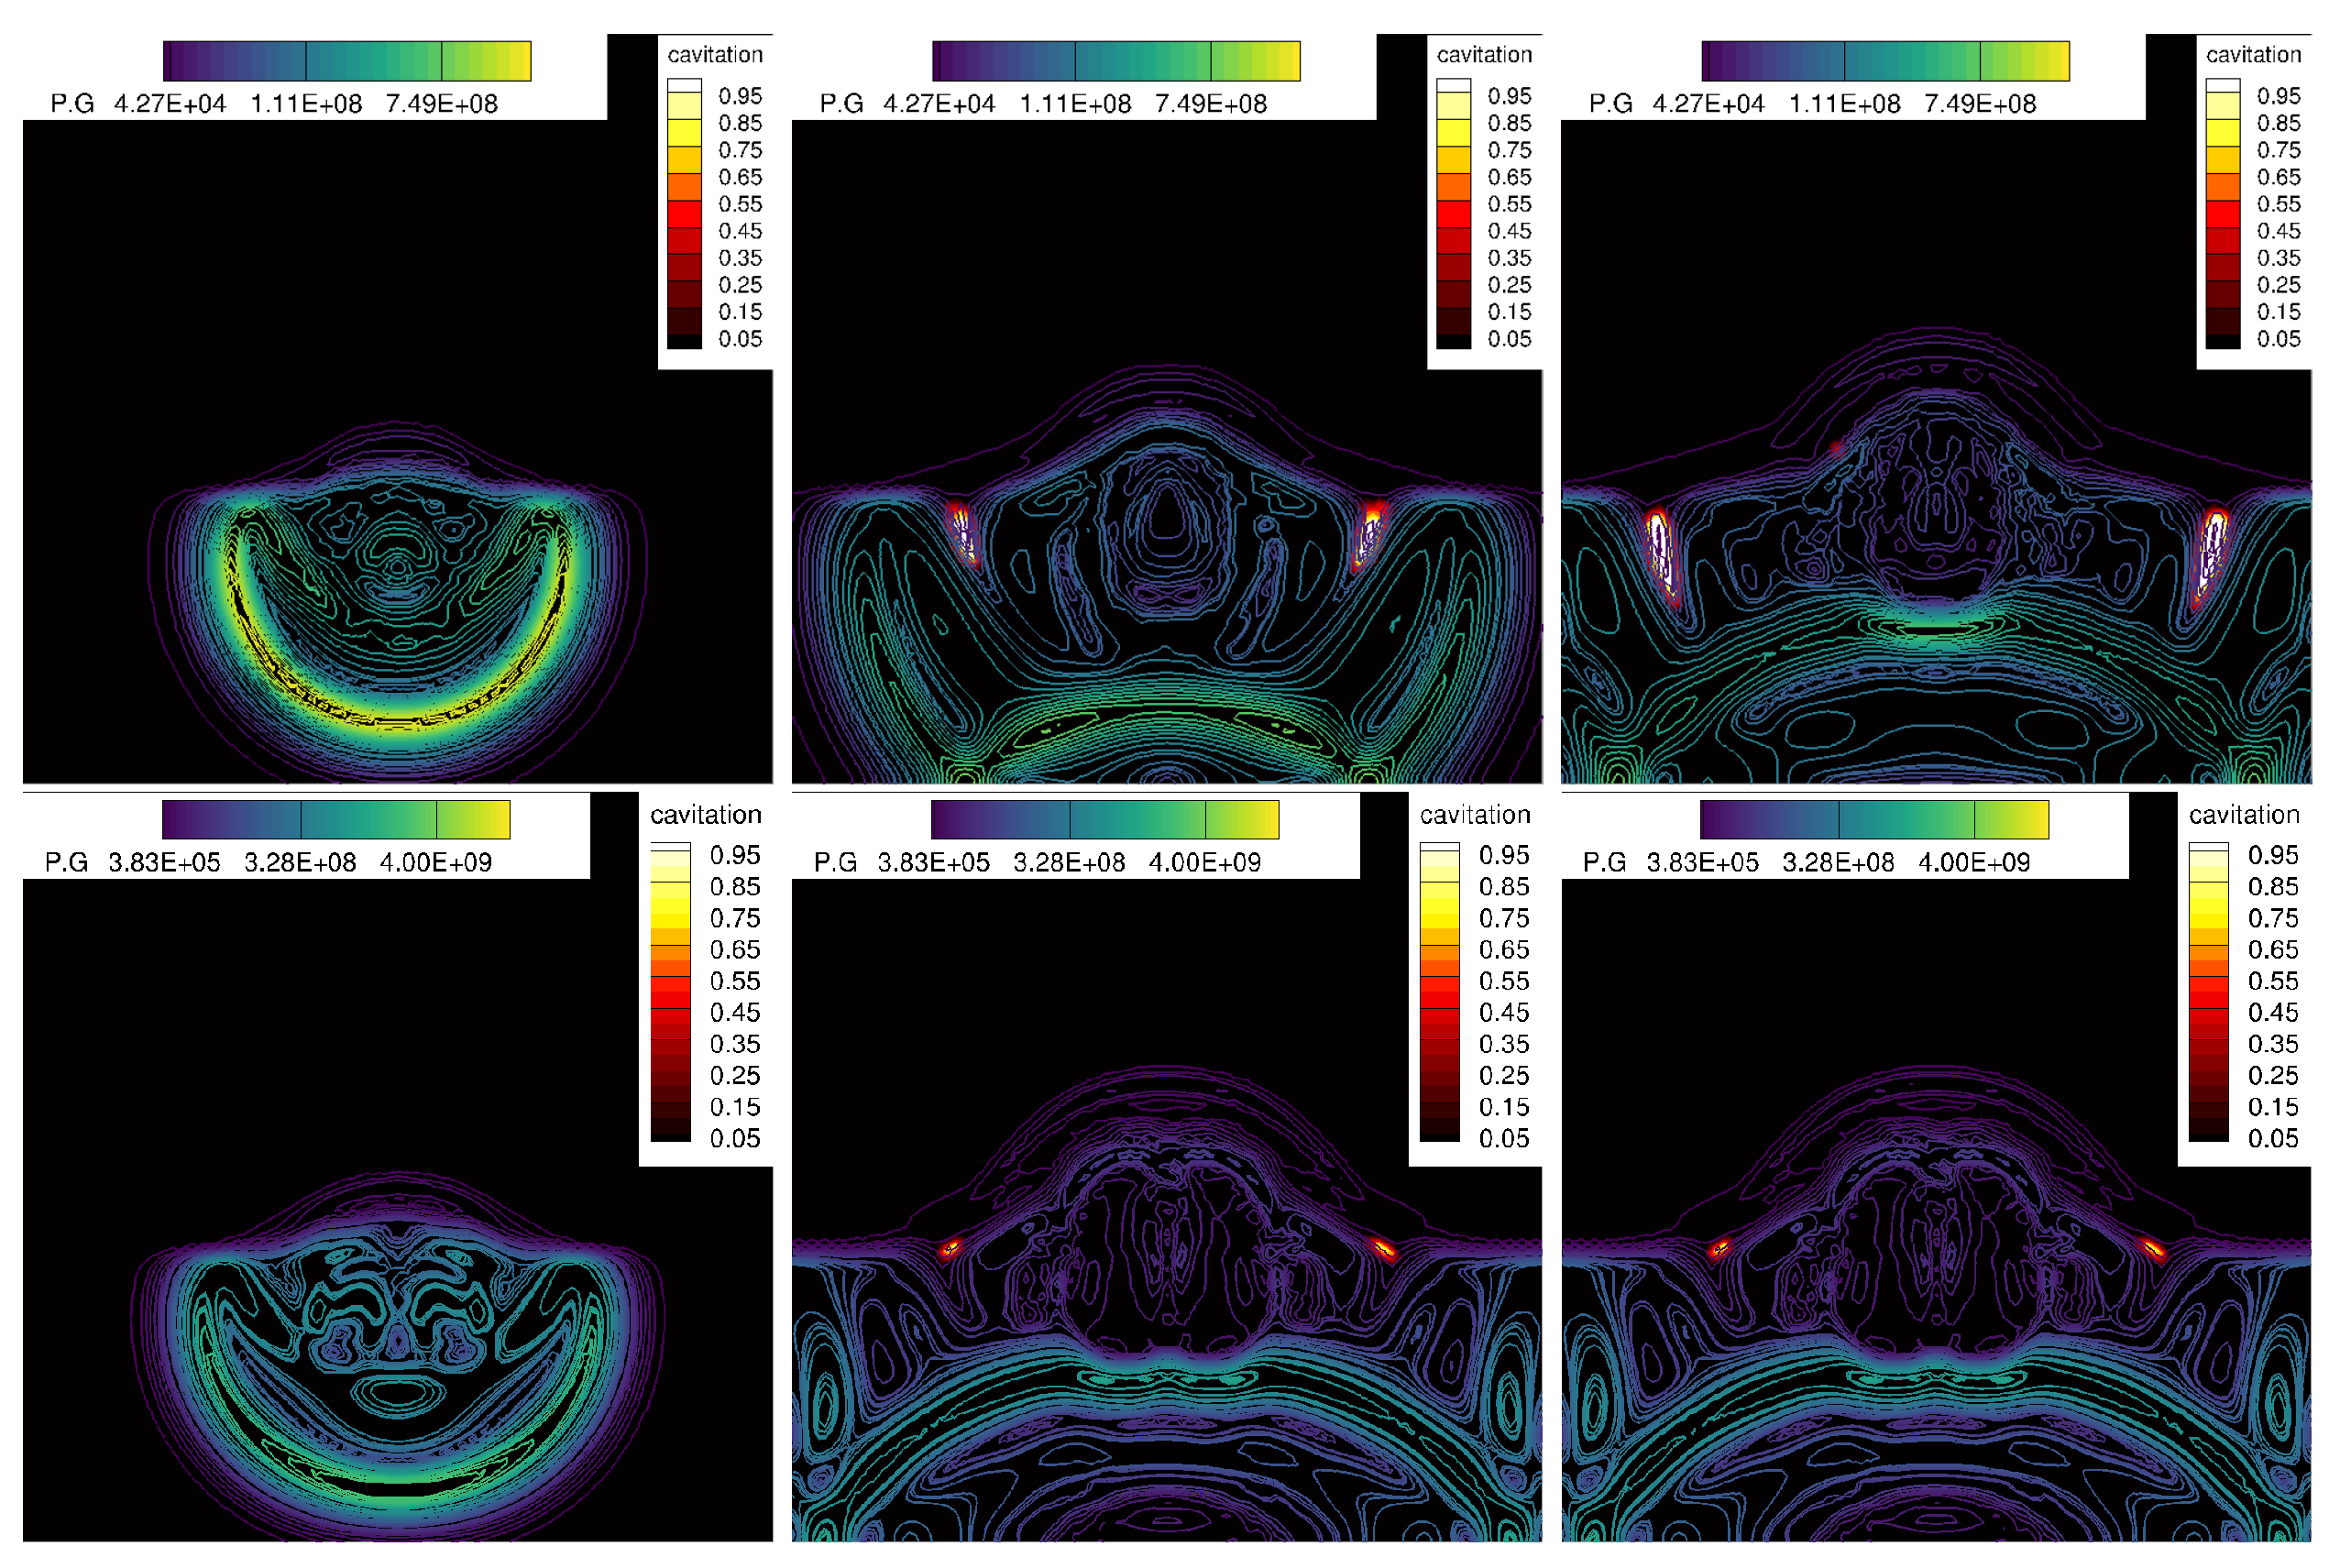
In Figure Figure 21, the pressure gradient contour is depicted for that of a single charge and the two bubbles with varying inter-bubble distances. The contour illustrates a region of higher pressure near bubble(s), while the pressure diminishes further away as the bubbles expand. The magnitude of the pressure gradients varies based on the distance between the bubbles.
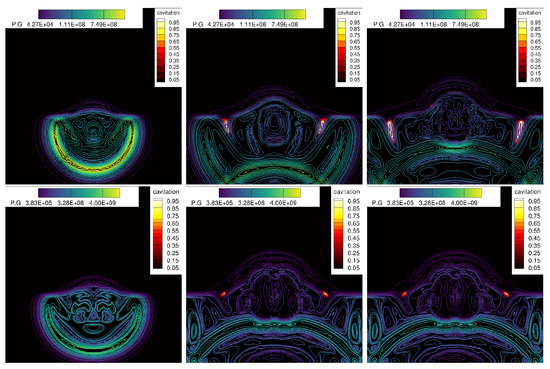
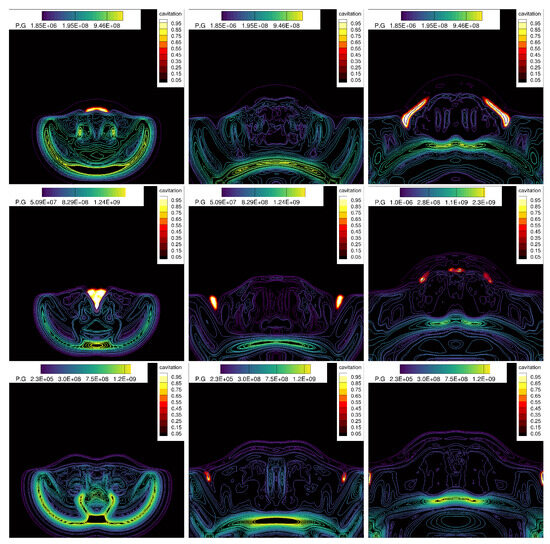
Figure 21.
Underwater explosion of a single and two bubbles configurations placed horizontally near a free surface; contour of pressure gradient for the single bubble (Top) and the two-bubble cases subsequently below for inter-bubble lengths of 0.3, 0.5, 0.7, and 0.9 m, respectively, using a CWENO4 scheme on a medium mesh at t = (0.4, 0.8, and 1.06) ms. The red-yellow areas are cavitation zones. The colour legend represents pressure gradient, measured in units of Pa/m.
4.5. 3D Underwater of Two Bubbles Placed Vertically in an Enclosed Region
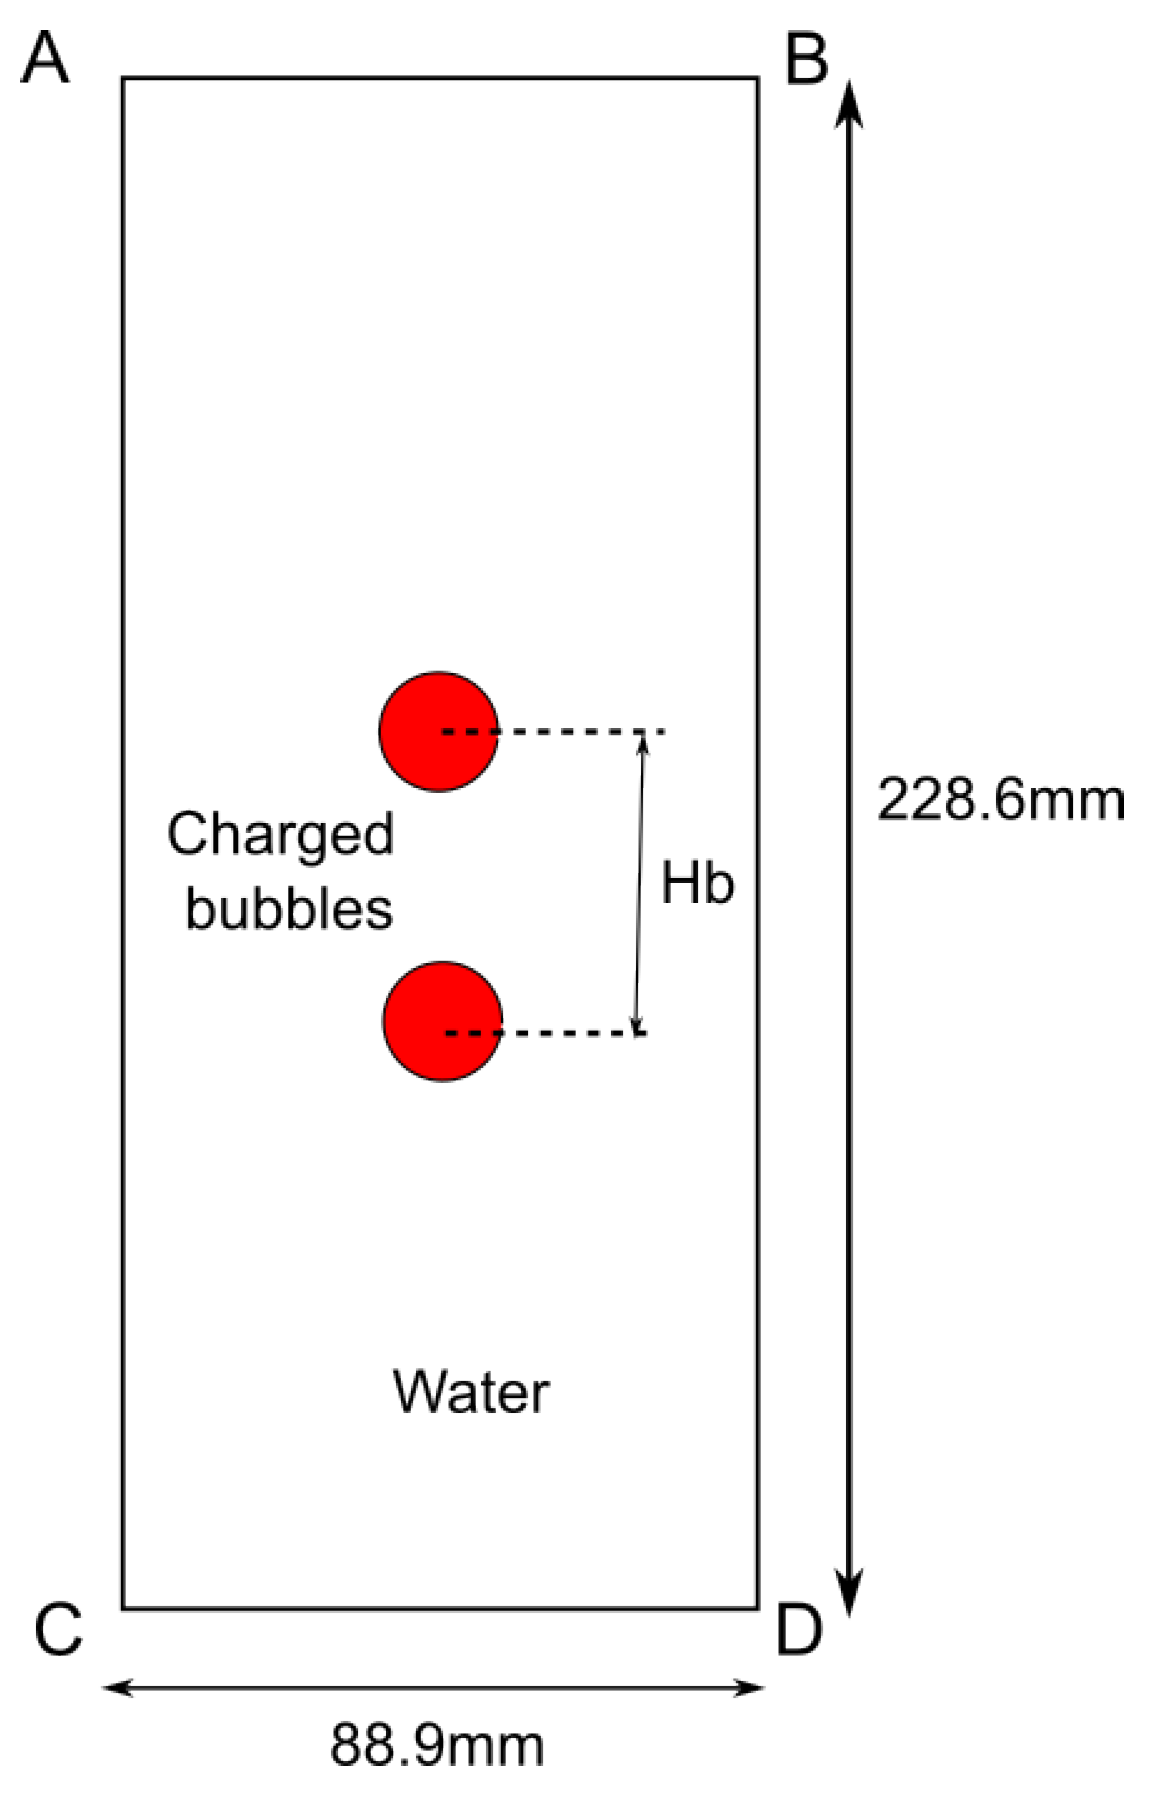
To investigate the interaction between two vertically aligned bubbles in water, enclosed in a region, it is best to consider this test case in either an axis-symmetric or three-dimensional setup, taking into account gravitational effects. The bubbles used in this test case are of smaller and identical diameter (d = 5.3 mm). They are initially positioned one above the other, with the first bubble placed at the bottom of the enclosed region and the second bubble above it.
Our numerical setup (Figure 22) uses similar computational dimensions as the Test Case section (Section 4.3) but with smaller bubble radii. The distance between the first and second bubbles is denoted by , and chosen to be 15, 30, and 60, all of which are given in millimeters. Reflecting boundary conditions are applied to all surfaces, and a quadrilateral mesh discretizes the domain with approximately 0.4 million cells. The initial physical properties of both fluid is given below:
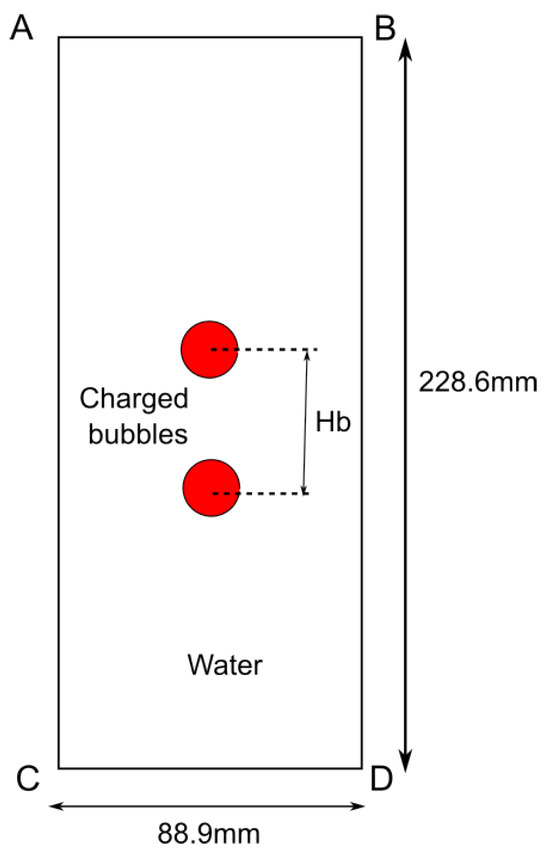
Figure 22.
Computational domain setup for the three-dimensional underwater of two bubbles placed vertically in an enclosed region.
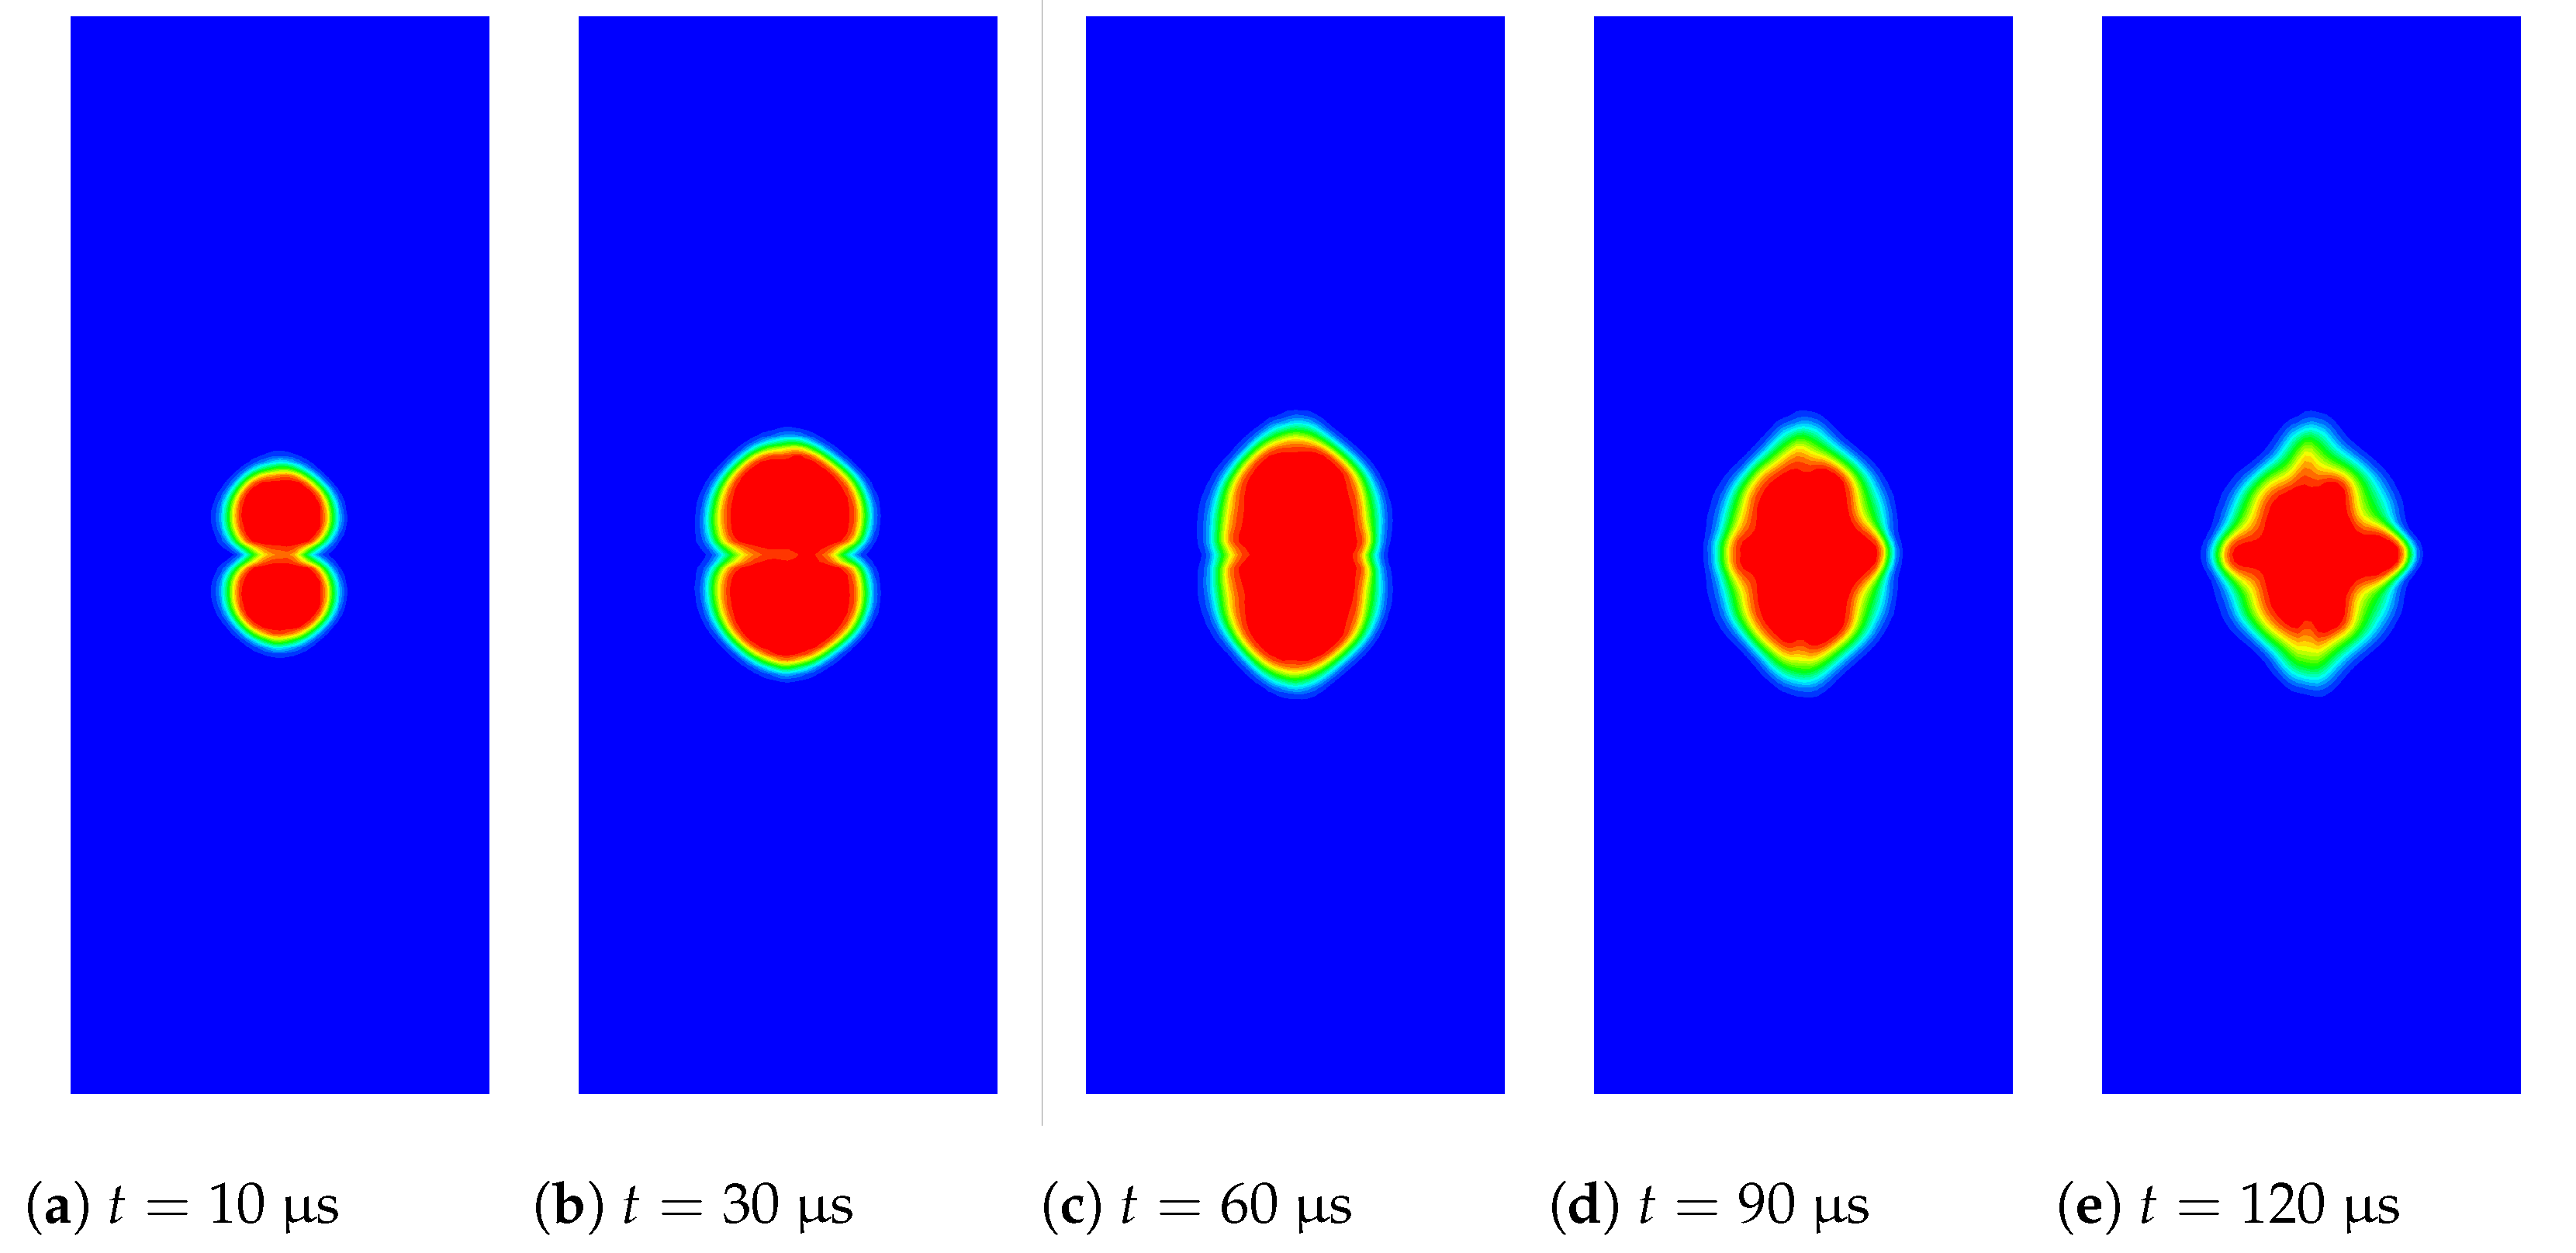
The volume-fraction contour in Figure 23 displays the shortest inter-bubble distance mm, where the bubbles are in close proximity. As the explosion evolves with time, the water film between the interface of the two interacting gaseous bubbles thins out. This causes a surface tension force to pull the bubbles together until the thin film ruptures and the two bubbles merge together. The two bubbles combine to form a single, larger bubble after coalescing.
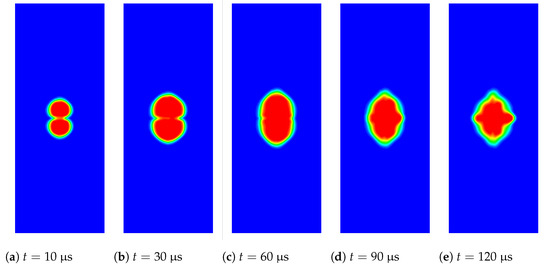
Figure 23.
Underwater explosion of two bubbles vertically placed in an enclosed region; volume-fraction contours for the 3D underwater explosion in an enclosed for mm, rigid cylindrical wall. Captured using CWENO4. The two bubbles interact after explosion and at approximately after initiation, the two bubbles eventually merge into a single larger bubble. Subsequently, the merged bubble continues to expand (, ), reaching its maximum volume. The green-yellow areas show the interface between water and explosive.
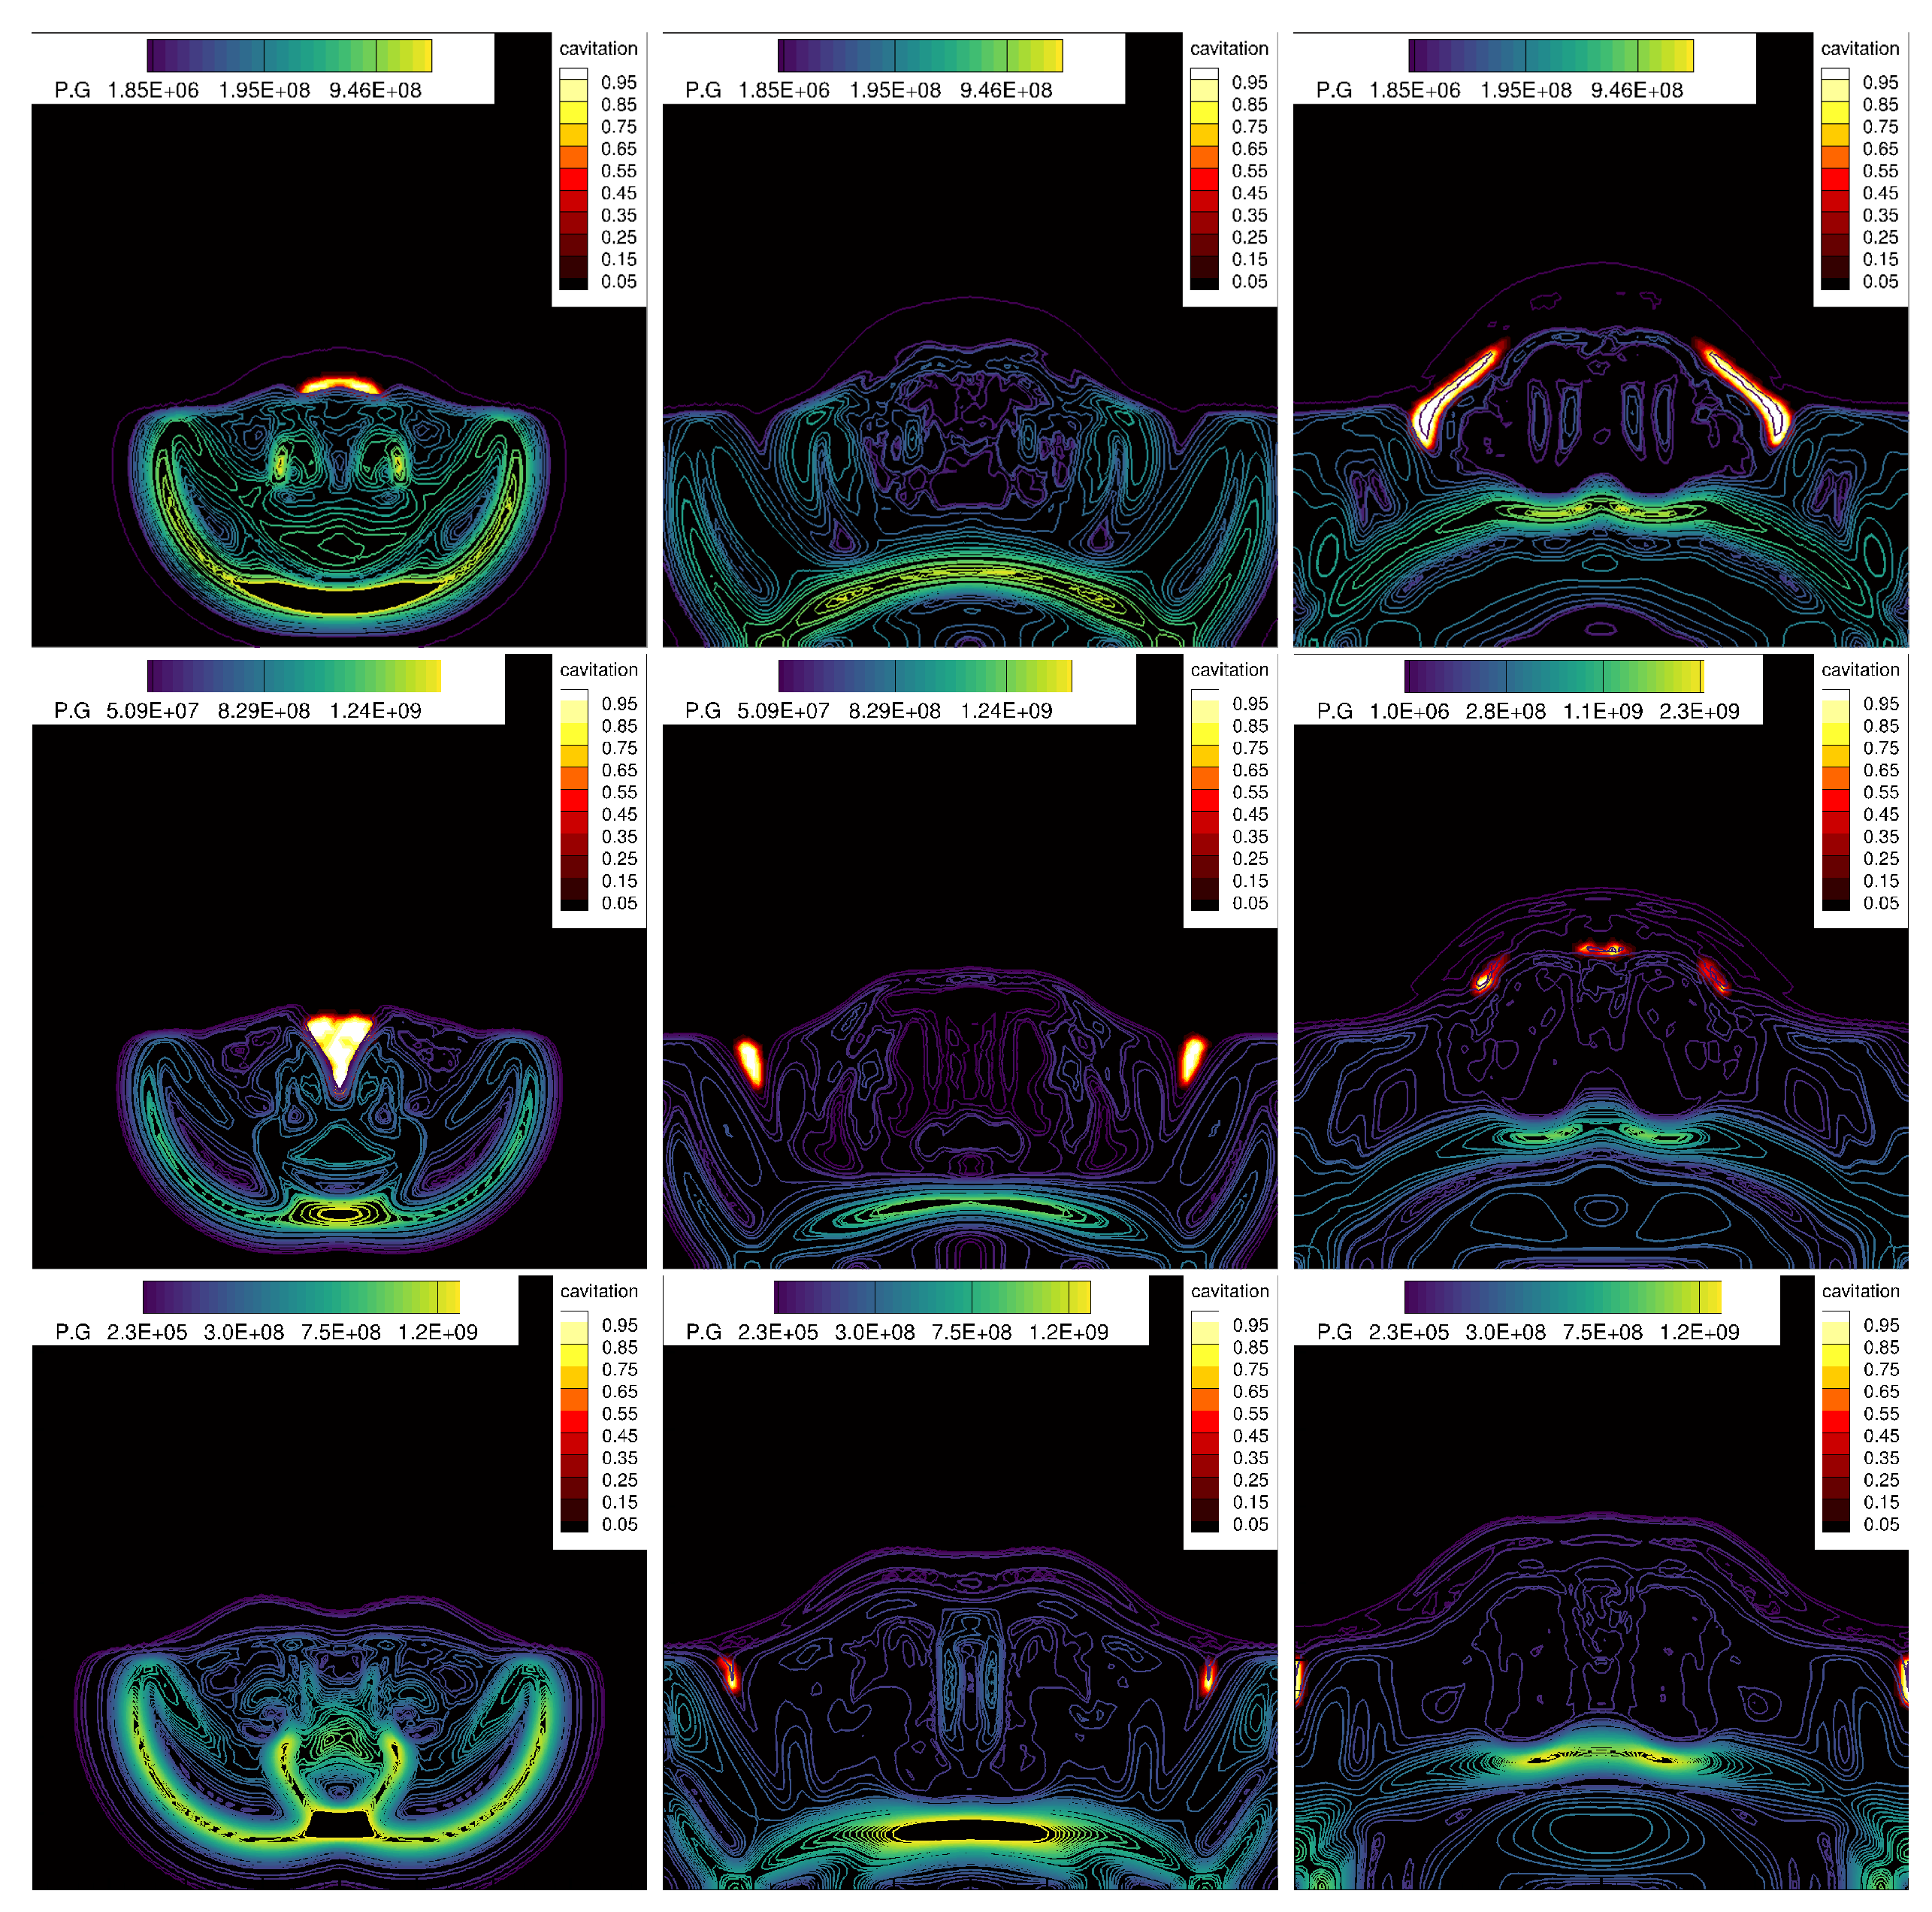
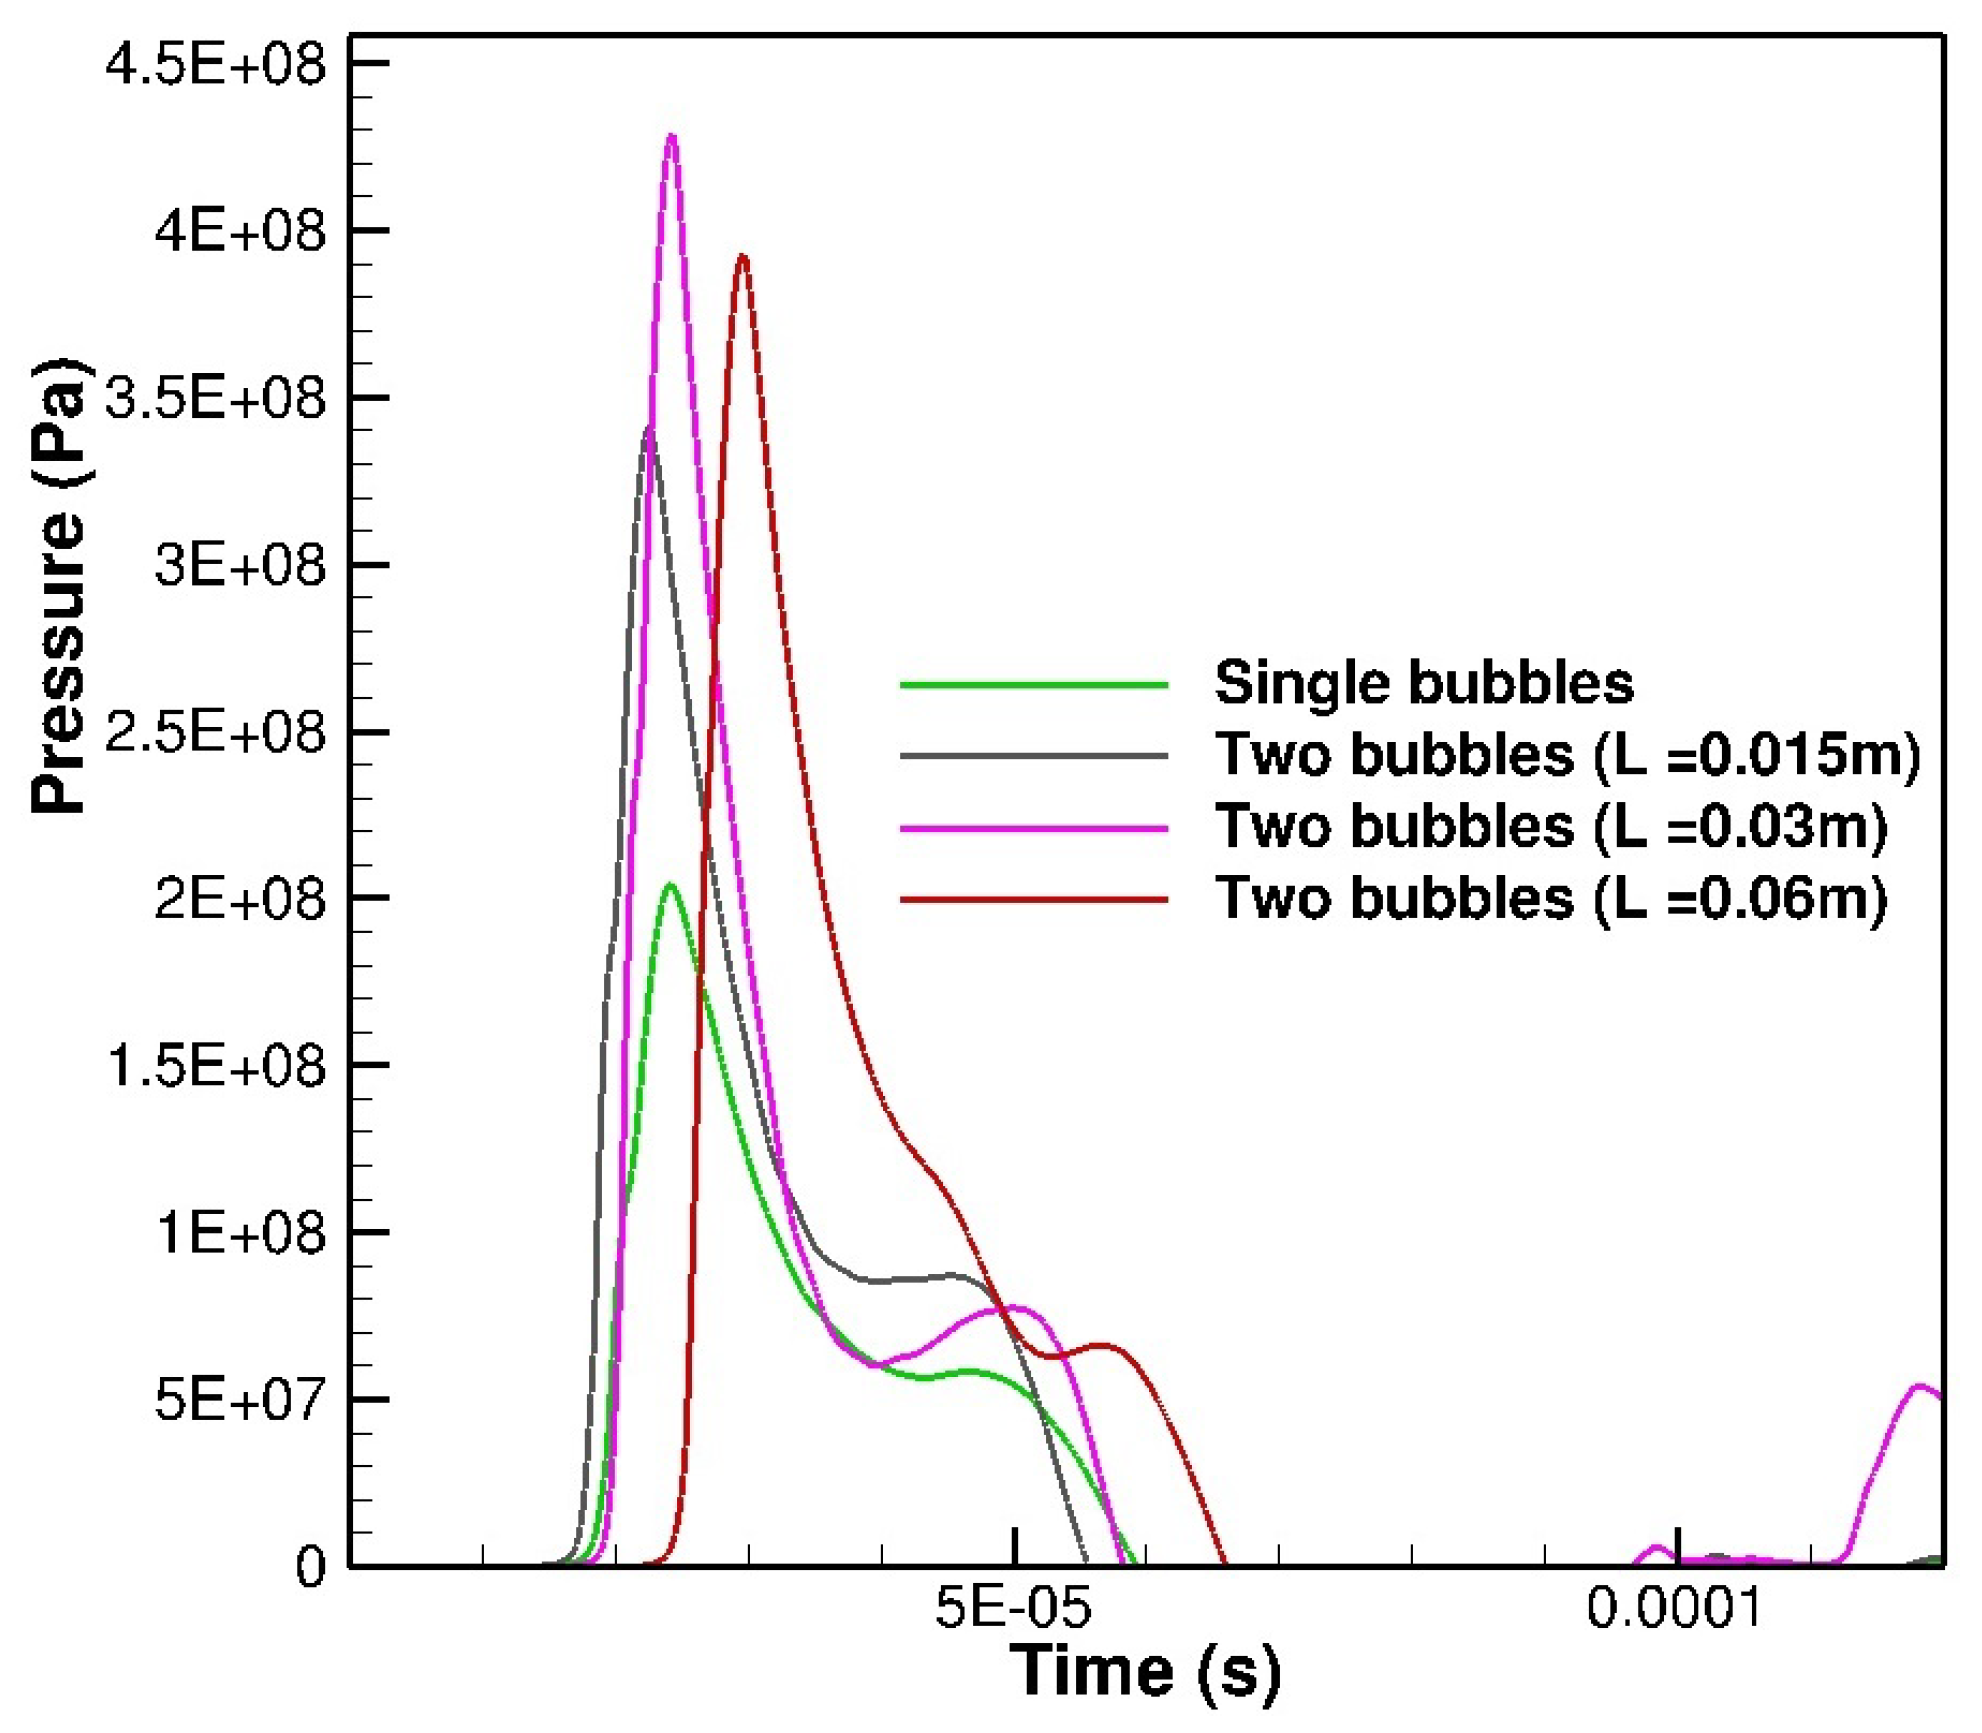
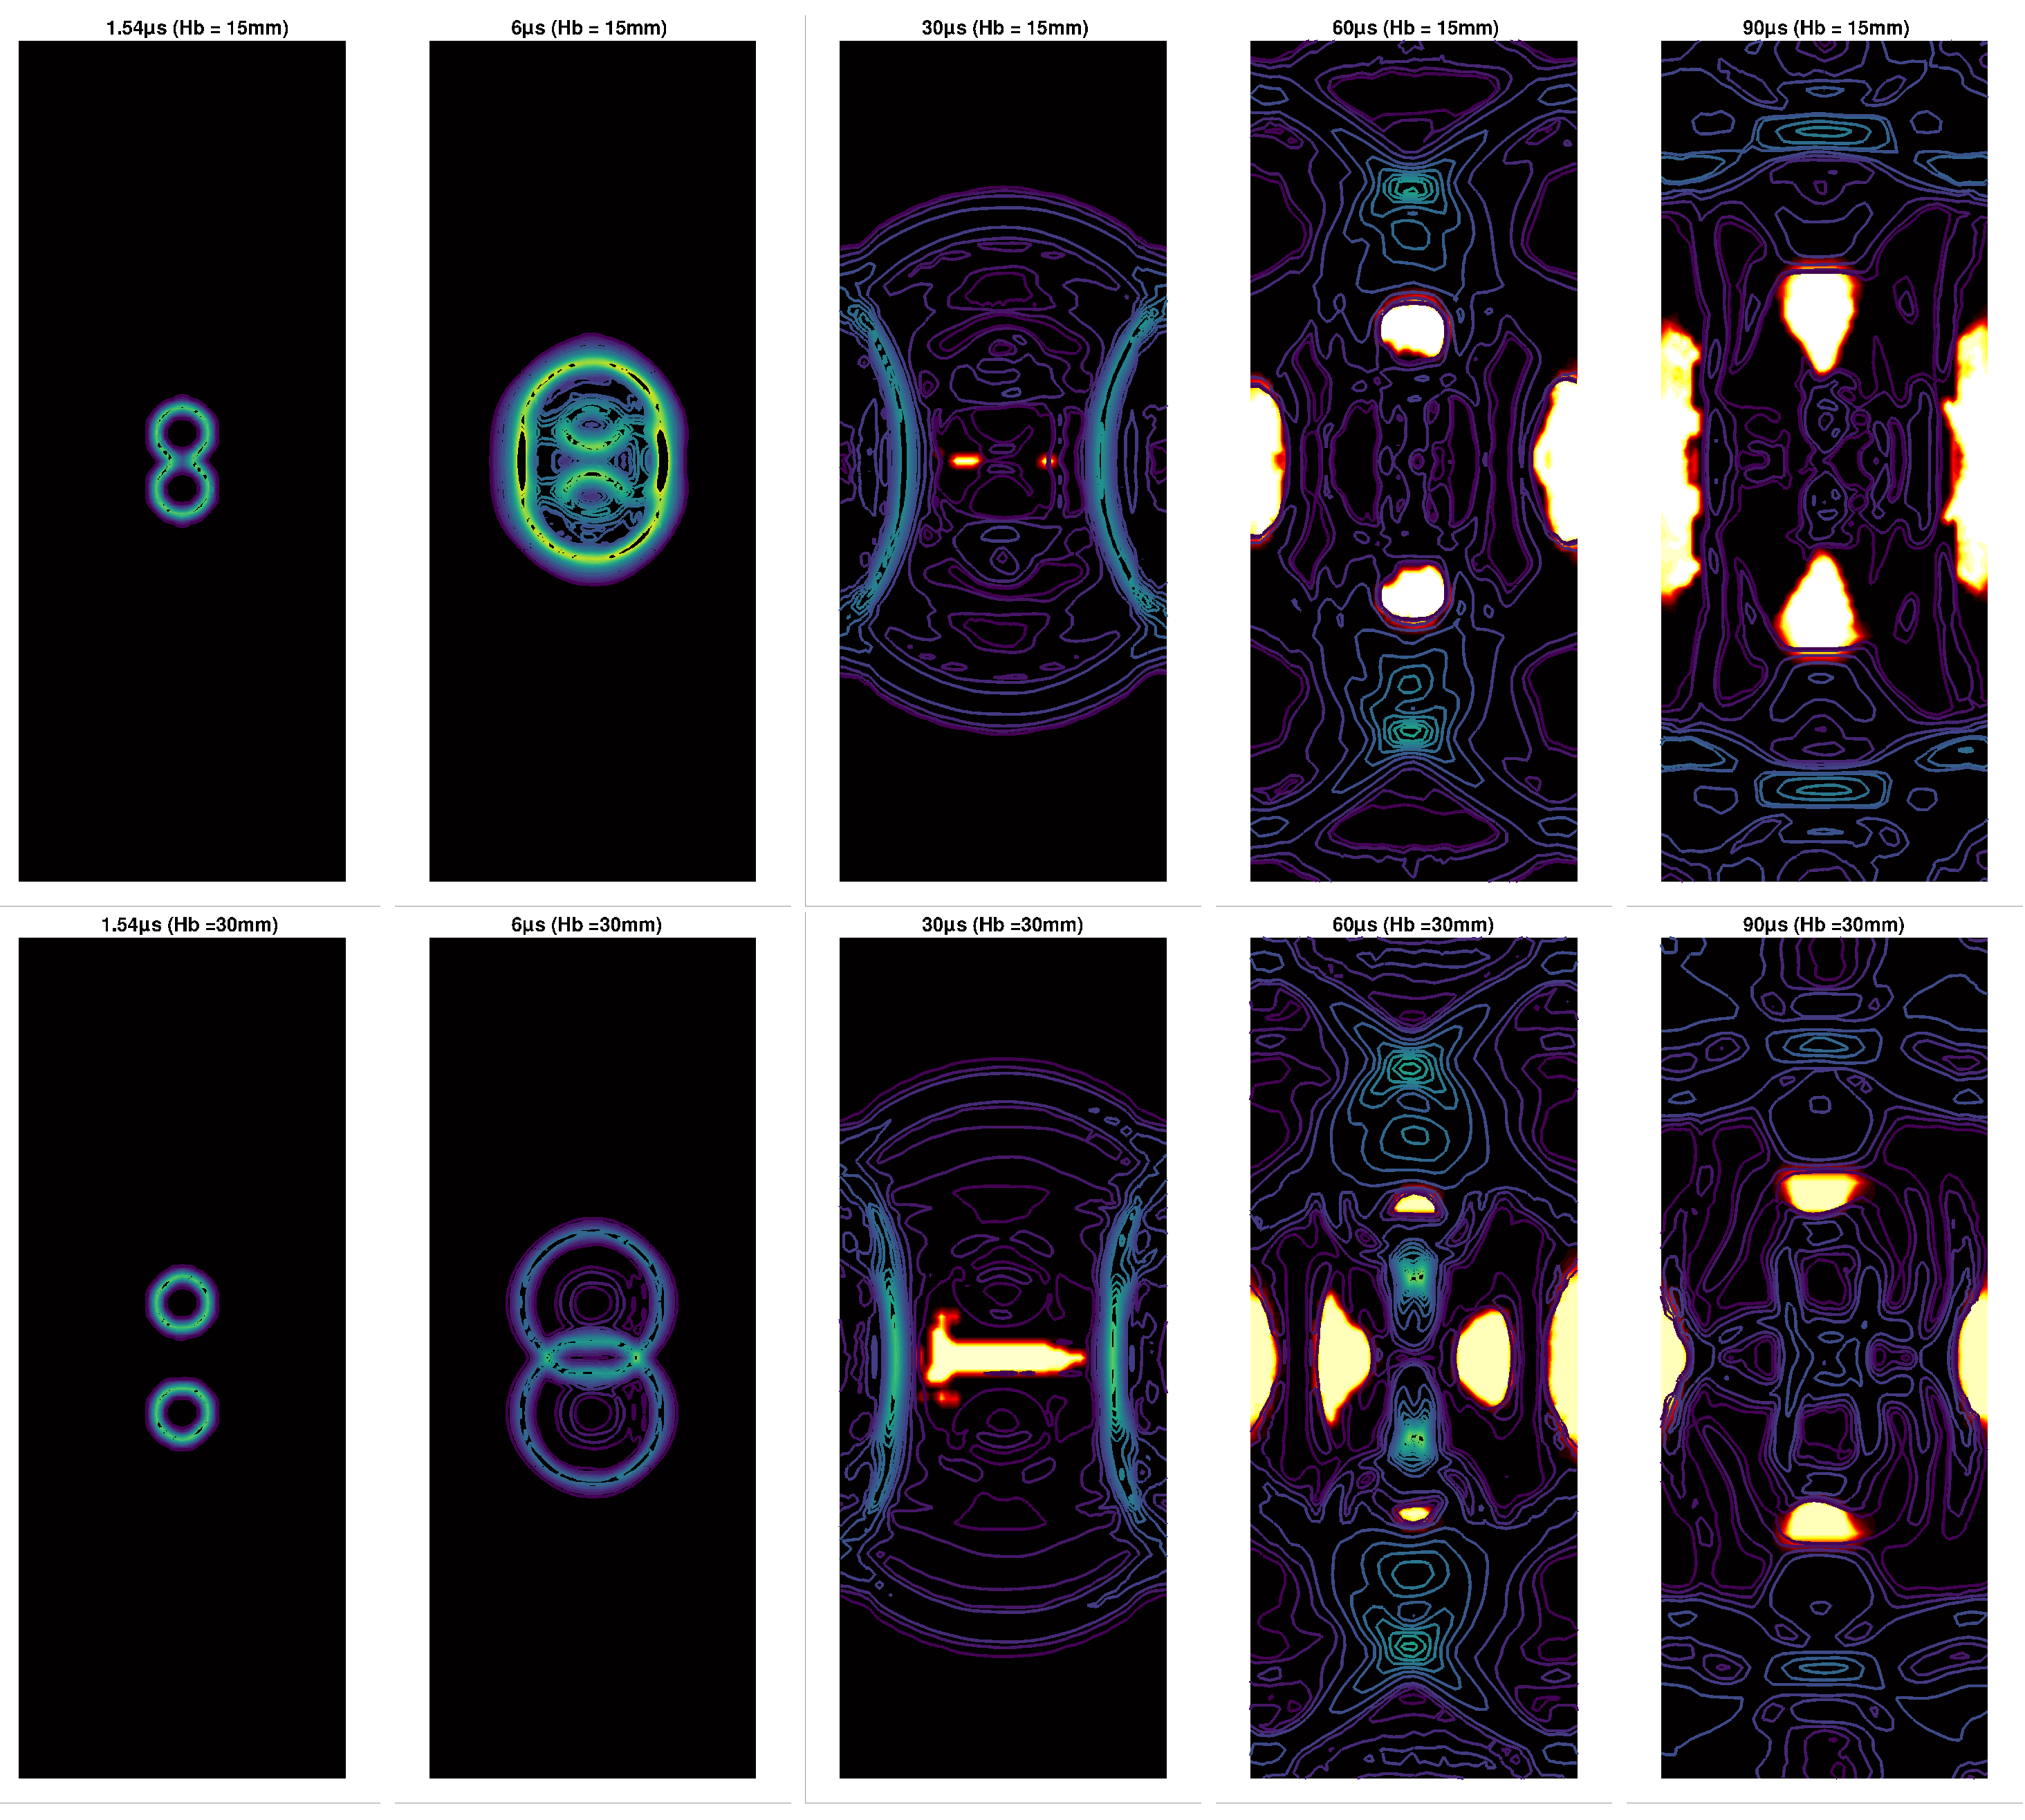
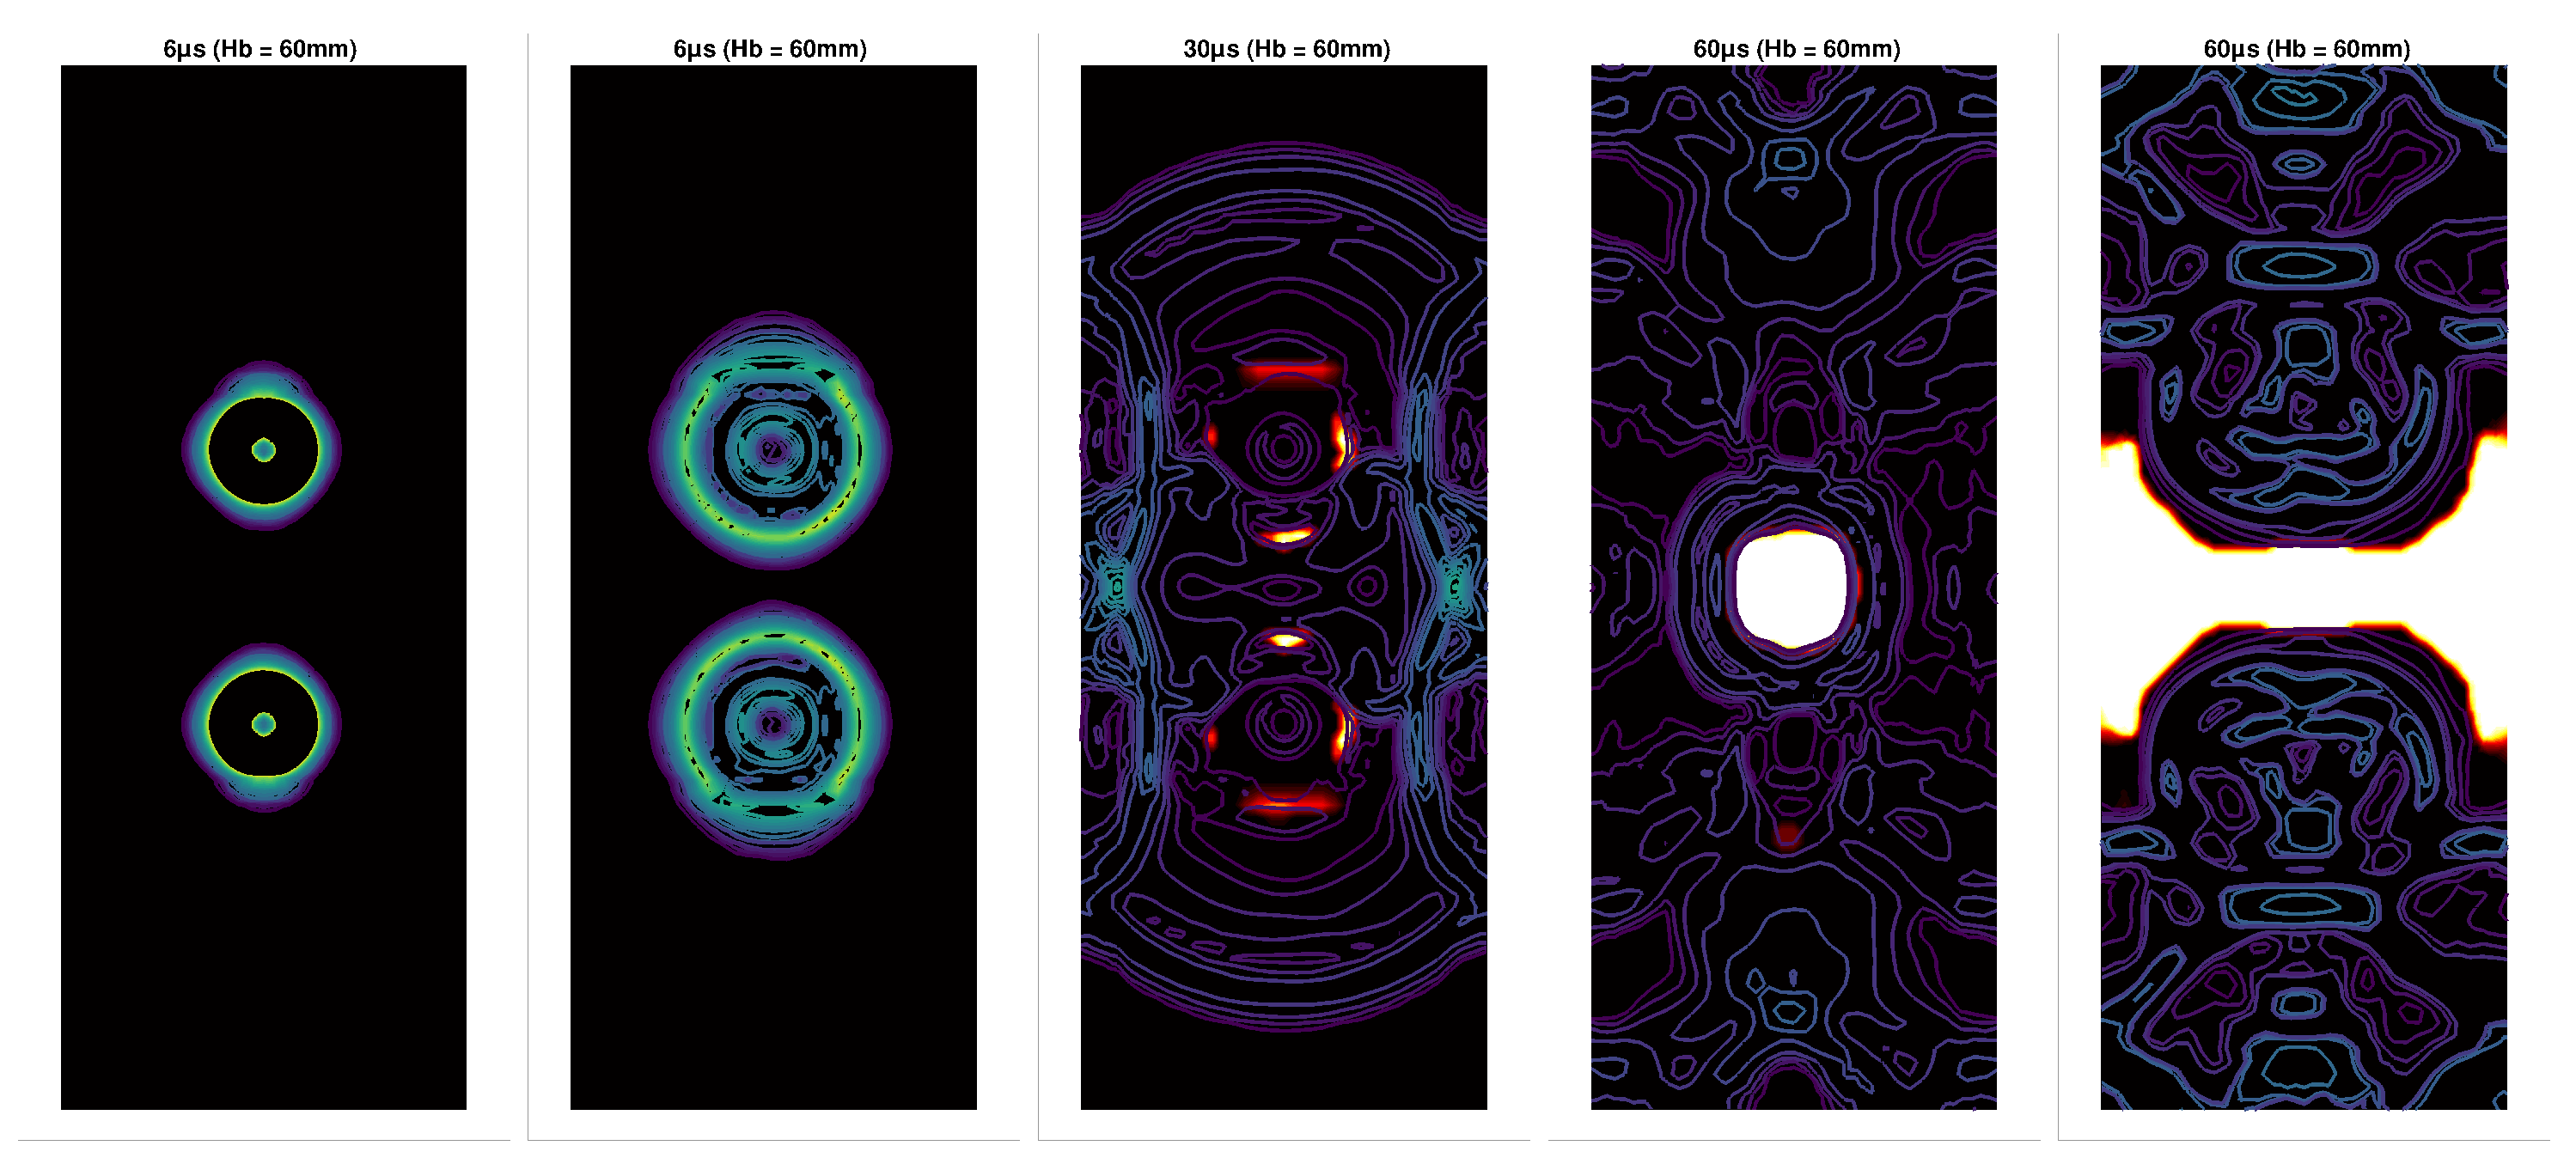
The pressure plot history at the centre of the left wall is displayed in Figure 24 for the three inter-bubble instances ( = 15, 30, and 60 mm). The pressure gradient contours in Figure 25 shows the cavitation regions are more prominent for the shortest inter-bubble distance mm for varying time frames t = (1.54, 6, 30, 60, and 90) µs. The cavitation regions in Figure 25 can be observed to be majorly concentrated at the walls of the cylinder and the surrounding areas close to the bubbles.
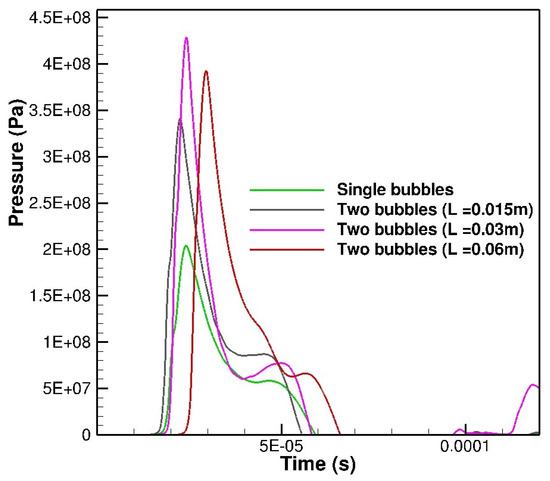
Figure 24.
Underwater explosion of two bubbles vertically placed in an enclosed region; plots of pressure history (at the centre location of the left wall) for the underwater explosion in an enclosed cylindrical wall with CWENO4 schemes for inter-bubble lengths of 15, 30, and 60 mm.
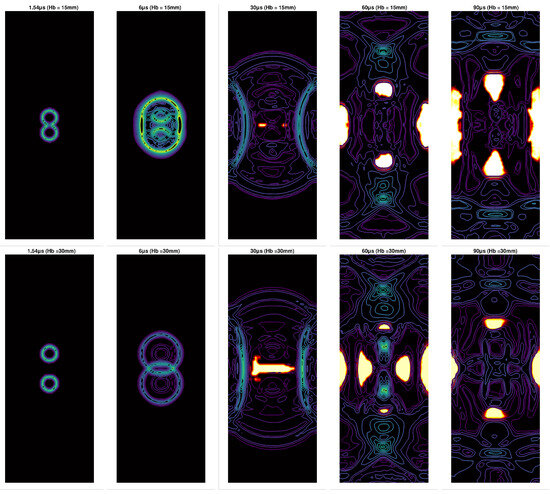
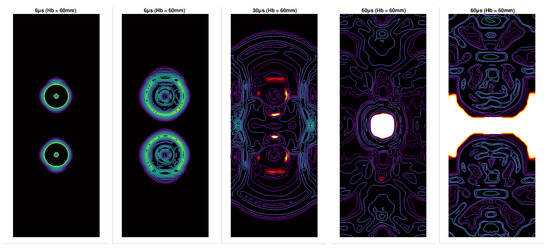
Figure 25.
Underwater explosion of two bubbles vertically placed in an enclosed region; pressure gradient contours for the 3D underwater explosion in an enclosed rigid cylindrical wall with three different inter-bubble distances: = 15 mm (top), 30 mm (middle), and 60 mm (bottom) for varying time frames t = (1.54, 6, 30, 60, and 90) µs. Captured using CWENO4. The white-red-yellow areas are cavitation zones, and the red regions are indicative of potential high cavitation activity.
5. Conclusions
This research extends the CWENO high-order finite-volume numerical framework employed for simulating multicomponent and multiphase flows on unstructured mesh, as detailed in [33], to specifically investigate cavitation phenomena in underwater explosions (UNDEX). The application of the CWENO schemes proved successful across a range of intricate two- and three-dimensional test cases related to underwater explosions, yielding noteworthy observations.
Notably, the CWENO schemes showcase a remarkable capability to provide high-resolution and sharply defined representations of shock–cavitation structures, as well as the infinitesimal interfacial region. This is achieved by resolving material interfaces with minimized numerical smearing, eliminating the necessity for additional interface sharpening [46] or compression [49]. This takes away the increase in computational cost associated with incorporating interface sharpening or compression into the diffuse interface models.
The compressibility effect introduced by the u term in the Kapila et al. five-equation models [20], which distinguishes it from the Allaire five-equation models [21], from our results shows that this additional term does not significantly impact cavitation. The similarity in results between the two models underscores their agreement with other published papers, affirming their reliability in simulating cavitation phenomena.
The results also show that the proximity of the bubbles played a crucial role in intensifying the shock wave impacts and the occurrence of cavitation around free surfaces and rigid boundaries. All these findings contribute valuable insights into the dynamics of cavitation within the context of underwater explosions.
Author Contributions
Conceptualization, E.M.A. and P.T.; methodology, E.M.A. and P.T.; software, E.M.A. and P.T.; validation, E.M.A. and P.T.; formal analysis, E.M.A. and P.T.; investigation, E.M.A. and P.T.; resources, E.M.A., P.T. and K.W.J.; data curation, E.M.A.; writing—original draft preparation, E.M.A. and P.T.; writing—review and editing, E.M.A. and P.T.; visualisation, E.M.A. and P.T.; supervision, K.W.J. and P.T.; project administration, K.W.J. and P.T.; funding acquisition, E.M.A. All authors have read and agreed to the published version of the manuscript.
Funding
This research is partly financially supported by the The Petroleum Trust Development Fund (PTDF) Nigeria through grant number PTDF/ED/OSS/PHD/EMA/1591/19, accessed on 30 September 2019 (https://ptdf.gov.ng) for the first author’s Ph.D. studies.
Data Availability Statement
The data that support the findings of this study are available from the corresponding author upon reasonable request.
Acknowledgments
The authors acknowledge the computing time at Cranfield University Delta2 HPC facility.
Conflicts of Interest
The authors declare that they have no conflicts of interest.
Abbreviations
The following abbreviations are used in this manuscript:
| UNDEX | Underwater Explosion |
| DIM | Diffuse Interface Models |
| UCNS3D | Unstructured Compressible Navier–Stokes 3D |
| CWENO | Central-Weighted Essentially Non-Oscillatory |
| FV | Finite Volume |
References
- Petitpas, F.; Massoni, J.; Saurel, R.; Lapebie, E.; Munier, L. Diffuse interface model for high speed cavitating underwater systems. Int. J. Multiph. Flow 2009, 35, 747–759. [Google Scholar] [CrossRef]
- Petitpas, F.; Saurel, R.; Ahn, B.K.; Ko, S. Modelling cavitating flow around underwater missiles. Int. J. Nav. Archit. Ocean. Eng. 2011, 3, 263–273. [Google Scholar] [CrossRef]
- Kwack, Y.K.; Ko, S.H. Numerical analysis for supercavitating flows around axisymmetric cavitators. Int. J. Nav. Archit. Ocean. Eng. 2013, 5, 325–332. [Google Scholar] [CrossRef]
- Wenfeng, X. A Numerical Simulation of Underwater Shock-Cavitation-Structure Interaction. Ph.D. Thesis, National University of Singapore, Singapore, 2005; pp. 1–207. [Google Scholar]
- Daramizadeh, A.; Ansari, M.R. Numerical simulation of underwater explosion near air-water free surface using a five-equation reduced model. Ocean. Eng. 2015, 110, 25–35. [Google Scholar] [CrossRef]
- Xie, W.F.; Liu, T.G.; Khoo, B.C. The simulation of cavitating flows induced by underwater shock and free surface interaction. Appl. Numer. Math. 2007, 57, 734–745. [Google Scholar] [CrossRef]
- Saurel, R.; Lemetayer, O. A multiphase model for compressible flows with interfaces, shocks, detonation waves and cavitation. J. Fluid Mech. 2001, 431, 239–271. [Google Scholar] [CrossRef]
- Ghidaglia, J.M.; Mrabet, A.A. A regularized stiffened-gas equation of state. J. Appl. Anal. Comput. 2018, 8, 675–689. [Google Scholar] [CrossRef]
- Shyue, K.M. An Anti-Diffusion based Eulerian Interface-Sharpening Algorithm for Compressible Two-Phase Flow with Cavitation. In Proceedings of the 8th International Symposium on Cavitation, Singapore, 13–16 August 2012; Volume 268, pp. 7–12. [Google Scholar] [CrossRef]
- Maltsev, V.; Skote, M.; Tsoutsanis, P. High-order methods for diffuse-interface models in compressible multi-medium flows: A review. Phys. Fluids 2022, 34, 021301. [Google Scholar] [CrossRef]
- Pelanti, M.; Shyue, K.M. A mixture-energy-consistent six-equation two-phase numerical model for fluids with interfaces, cavitation and evaporation waves. J. Comput. Phys. 2014, 259, 331–357. [Google Scholar] [CrossRef]
- Pelanti, M.; Shyue, K.M. A numerical model for multiphase liquid–vapour–gas flows with interfaces and cavitation. Int. J. Multiph. Flow 2019, 113, 208–230. [Google Scholar] [CrossRef]
- Baer, M.; Nunziato, J. A two-phase mixture theory for the deflagration-to-detonation transition (ddt) in reactive granular materials. Int. J. Multiph. Flow 1986, 12, 861–889. [Google Scholar] [CrossRef]
- Saurel, R.; Petitpas, F.; Abgrall, R. Modelling phase transition in metastable liquids: Application to cavitating and flashing flows. J. Fluid Mech. 2008, 607, 313–350. [Google Scholar] [CrossRef]
- Jun, Y.; Jian-qiang, P.; Hai-kun, W.; Hai-bin, M. Application of Compressible Multi-component Flow in Underwater Explosion Problems. Procedia Eng. 2015, 126, 339–343. [Google Scholar] [CrossRef]
- Chiapolino, A.; Saurel, R.; Nkonga, B. Sharpening diffuse interfaces with compressible fluids on unstructured meshes. J. Comput. Phys. 2017, 340, 389–417. [Google Scholar] [CrossRef]
- LeMartelot, S.; Nkonga, B.; Saurel, R. Liquid and liquid–gas flows at all speeds. J. Comput. Phys. 2013, 255, 53–82. [Google Scholar] [CrossRef]
- Zein, A. Numerical Methods for Multiphase Mixture Conservation Laws with Phase Transition. Ph.D. Thesis, Otto von Guericke University Magdeburg, Magdeburg, Germany, 2010. [Google Scholar]
- Ma, Z.H.; Causon, D.M.; Qian, L.; Gu, H.B.; Mingham, C.G.; Martínez Ferrer, P. A GPU based compressible multiphase hydrocode for modelling violent hydrodynamic impact problems. Comput. Fluids 2015, 120, 1–23. [Google Scholar] [CrossRef]
- Kapila, A.K.; Menikoff, R.; Bdzil, J.B.; Son, S.F.; Stewart, D.S. Two-phase modeling of deflagration-to-detonation transition in granular materials: Reduced equations. Phys. Fluids 2001, 13, 3002–3024. [Google Scholar] [CrossRef]
- Allaire, G.; Clerc, S.; Kokh, S. A five-equation model for the simulation of interfaces between compressible fluids. J. Comput. Phys. 2002, 181, 577–616. [Google Scholar] [CrossRef]
- Antoniadis, A.; Drikakis, D.; Farmakis, P.; Fu, L.; Kokkinakis, I.; Nogueira, X.; Silva, P.; Skote, M.; Titarev, V.; Tsoutsanis, P. UCNS3D: An open-source high-order finite-volume unstructured CFD solver. Comput. Phys. Commun. 2022, 279, 108453. [Google Scholar] [CrossRef]
- Tsoutsanis, P.; Dumbser, M. Arbitrary high order central non-oscillatory schemes on mixed-element unstructured meshes. Comput. Fluids 2021, 225, 104961. [Google Scholar] [CrossRef]
- Murrone, A.; Guillard, H. A five equation reduced model for compressible two phase flow problems. J. Comput. Phys. 2005, 202, 664–698. [Google Scholar] [CrossRef]
- Wackers, J.; Koren, B. A fully conservative model for compressible two-fluid flow. Int. J. Numer. Methods Fluids 2005, 47, 1337–1343. [Google Scholar] [CrossRef]
- Schmidmayer, K.; Bryngelson, S.H.; Colonius, T. An assessment of multicomponent flow models and interface capturing schemes for spherical bubble dynamics. J. Comput. Phys. 2020, 402, 109080. [Google Scholar] [CrossRef]
- Zhang, J. A simple and effective five-equation two-phase numerical model for liquid-vapour phase transition in cavitating flows. Int. J. Multiph. Flow 2020, 132, 103417. [Google Scholar] [CrossRef]
- Harlow, F.H.; Amsden, A.A. Numerical calculation of almost incompressible flow. J. Comput. Phys. 1968, 3, 80–93. [Google Scholar] [CrossRef]
- Johnsen, E.; Colonius, T. Implementation of WENO schemes in compressible multicomponent flow problems. J. Comput. Phys. 2006, 219, 715–732. [Google Scholar] [CrossRef]
- Harlow, F.H.; Amsden, A.A. A numerical fluid dynamics calculation method for all flow speeds. J. Comput. Phys. 1971, 8, 197–213. [Google Scholar] [CrossRef]
- Saurel, R.; Abgrall, R. Simple method for compressible multifluid flows. Siam J. Sci. Comput. 1999, 21, 1115–1145. [Google Scholar] [CrossRef]
- Quirk, J.J.; Karni, S. On the dynamics of a shock-bubble interaction. J. Fluid Mech. 1996, 318, 129–163. [Google Scholar] [CrossRef]
- Tsoutsanis, P.; Adebayo, E.; Merino, A.; Arjona, A.; Skote, M. CWENO Finite-Volume Interface Capturing Schemes for Multicomponent Flows Using Unstructured Meshes. J. Sci. Comput. 2021, 89, 64. [Google Scholar] [CrossRef]
- Liu, T.; Khoo, B.; Xie, W. Isentropic one-fluid modelling of unsteady cavitating flow. J. Comput. Phys. 2004, 201, 80–108. [Google Scholar] [CrossRef]
- Ansari, M.; Daramizadeh, A. Numerical simulation of compressible two-phase flow using a diffuse interface method. Int. J. Heat Fluid Flow 2013, 42, 209–223. [Google Scholar] [CrossRef]
- Tsoutsanis, P.; Titarev, V.; Drikakis, D. WENO schemes on arbitrary mixed-element unstructured meshes in three space dimensions. J. Comput. Phys. 2011, 230, 1585–1601. [Google Scholar] [CrossRef]
- Tsoutsanis, P.; Pavan Kumar, M.; Farmakis, P. A relaxed a posteriori MOOD algorithm for multicomponent compressible flows using high-order finite-volume methods on unstructured meshes. Appl. Math. Comput. 2023, 437, 127544. [Google Scholar] [CrossRef]
- Tsoutsanis, P.; Farmakis, P. A posteriori mood limiting approach for multicomponent flows on unstructured meshes. In Proceedings of the World Congress in Computational Mechanics and ECCOMAS Congress, Oslo, Norway, 5–9 June 2022. [Google Scholar] [CrossRef]
- Tsoutsanis, P. Stencil selection algorithms for WENO schemes on unstructured meshes. J. Comput. Phys. 2023, 475, 100037. [Google Scholar] [CrossRef]
- Toro, E.; Spruce, M.; Speares, W. Restoration of the contact surface in the HLL-Riemann solver. Shock Waves 1994, 4, 25–34. [Google Scholar] [CrossRef]
- Tsoutsanis, P.; Antoniadis, A.; Jenkins, K. Improvement of the computational performance of a parallel unstructured WENO finite volume CFD code for Implicit Large Eddy Simulation. Comput. Fluids 2018, 173, 157–170. [Google Scholar] [CrossRef]
- Petrov, N.V.; Schmidt, A.A. Multiphase phenomena in underwater explosion. Exp. Therm. Fluid Sci. 2015, 60, 367–373. [Google Scholar] [CrossRef]
- Haimovich, O.; Frankel, S.H. Numerical simulations of compressible multicomponent and multiphase flow using a high-order targeted ENO (TENO) finite-volume method. Comput. Fluids 2017, 146, 105–116. [Google Scholar] [CrossRef]
- Yeom, G.S.; Chang, K.S. A modified HLLC-type Riemann solver for the compressible six-equation two-fluid model. Comput. Fluids 2013, 76, 86–104. [Google Scholar] [CrossRef]
- Shukla, R.K.; Pantano, C.; Freund, J.B. An interface capturing method for the simulation of multi-phase compressible flows. J. Comput. Phys. 2010, 229, 7411–7439. [Google Scholar] [CrossRef]
- Shukla, R.K. Nonlinear preconditioning for efficient and accurate interface capturing in simulation of multicomponent compressible flows. J. Comput. Phys. 2014, 276, 508–540. [Google Scholar] [CrossRef]
- Zhang, Z.F.; Wang, C.; Zhang, A.M.; Silberschmidt, V.V.; Wang, L.K. SPH-BEM simulation of underwater explosion and bubble dynamics near rigid wall. Sci. China Technol. Sci. 2019, 62, 1082–1093. [Google Scholar] [CrossRef]
- Kleine, H.; Tepper, S.; Takehara, K.; Etoh, T.; Hiraki, K. Cavitation induced by low-speed underwater impact. Shockwaves 2009, 2, 895–900. [Google Scholar] [CrossRef]
- Kokh, S.; Lagoutière, F. An anti-diffusive numerical scheme for the simulation of interfaces between compressible fluids by means of a five-equation model. J. Comput. Phys. 2010, 229, 2773–2809. [Google Scholar] [CrossRef]
- Oomar, M.; Malan, A.; Jones, B.; Horwitz, R.; Langdon, G. An all-Mach number HLLC based scheme for Multi-phase Flow with Surface Tension. Appl. Sci. 2021, 11, 3413. [Google Scholar] [CrossRef]
- Deng, X.; Inaba, S.; Xie, B.; Shyue, K.M.; Xiao, F. High fidelity discontinuity-resolving reconstruction for compressible multiphase flows with moving interfaces. J. Comput. Phys. 2018, 371, 945–966. [Google Scholar] [CrossRef]
- Shyue, K.M. A wave-propagation based volume tracking method for compressible multicomponent flow in two space dimensions. J. Comput. Phys. 2006, 215, 219–244. [Google Scholar] [CrossRef]
- Xie, W.F.; Young, Y.L.; Liu, T.G.; Khoo, B.C. Dynamic response of deformable structures subjected to shock load and cavitation reload. Comput. Mech. 2007, 40, 667–681. [Google Scholar] [CrossRef]
- Qin, Y.; Wang, Y.; Wang, Z.; Yao, X. The Influence of Various Structure Surface Boundary Conditions on Pressure Characteristics of Underwater Explosion. Comput. Model. Eng. Sci. 2021, 126, 1093–1123. [Google Scholar] [CrossRef]
- Xie, W.; Liu, T.; Khoo, B. Application of a one-fluid model for large scale homogeneous unsteady cavitation: The modified Schmidt model. Comput. Fluids 2006, 35, 1177–1192. [Google Scholar] [CrossRef]
- Zhang, Z.F.; Wang, C.; Wang, L.K.; Zhang, A.M.; Silberschmidt, V.V. Underwater explosion of cylindrical charge near plates: Analysis of pressure characteristics and cavitation effects. Int. J. Impact Eng. 2018, 121, 91–105. [Google Scholar] [CrossRef]
- Hong, Y.; Wang, B.; Liu, H. Numerical simulation of compressible multiphase hydrodynamic problems using reduced five-equation model on body-fitted grids. Comput. Fluids 2022, 233, 105243. [Google Scholar] [CrossRef]
- Jafarian, A.; Pishevar, A. An exact multiphase Riemann solver for compressible cavitating flows. Int. J. Multiph. Flow 2017, 88, 152–166. [Google Scholar] [CrossRef]
- Wardlaw, A.B.; Luton, J.A. Fluid-structure interaction mechanisms for close-in explosions. Shock Vib. 2000, 7, 265–275. [Google Scholar] [CrossRef]
- Wang, Y.; Yao, X.; Qin, Y. Investigation on influence factors about damage characteristics of ice sheet subjected to explosion loads: Underwater explosion and air contact explosion. Ocean. Eng. 2022, 260, 111828. [Google Scholar] [CrossRef]
- Chen, J.Y.; Peng, C.; Lien, F.S.; Yee, E.; Zhao, X.H. Simulations for the explosion in a water-filled tube including cavitation using the SPH method. Comput. Part. Mech. 2019, 6, 515–527. [Google Scholar] [CrossRef]
- Schmidt, D.; Rutland, C.; Corradini, M. A fully compressible, two-dimensional model of small, high-speed, cavitating nozzles. At. Sprays 1999, 9, 255–276. [Google Scholar] [CrossRef]
- Yu, J.; Liu, J.h.; Wang, H.k.; Wang, J.; Zhou, Z.t.; Mao, H.b. Application of two-phase transition model in underwater explosion cavitation based on compressible multiphase flows. Aip Adv. 2022, 12, 025209. [Google Scholar] [CrossRef]
- Cheng, J.; Shu, C.W. High Order Schemes for CFD: A Review. Chin. J. Comput. Phys. 2009, 26, 633. Available online: http://www.cjcp.org.cn/EN/abstract/article_825.shtml (accessed on 23 January 2024).
- Yingtang, D.; Lanhao, Z.; Jia, M.; Eldad, A. A resolved CFD-DEM-IBM algorithm for water entry problems. Ocean. Eng. 2021, 240, 110014. [Google Scholar] [CrossRef]
Disclaimer/Publisher’s Note: The statements, opinions and data contained in all publications are solely those of the individual author(s) and contributor(s) and not of MDPI and/or the editor(s). MDPI and/or the editor(s) disclaim responsibility for any injury to people or property resulting from any ideas, methods, instructions or products referred to in the content. |
© 2024 by the authors. Licensee MDPI, Basel, Switzerland. This article is an open access article distributed under the terms and conditions of the Creative Commons Attribution (CC BY) license (https://creativecommons.org/licenses/by/4.0/).

