Abstract
Spray drying of oil-in-water emulsions is a widespread encapsulation technique. The oil droplet size (ODS) significantly impacts encapsulation efficiency and other powder properties. The ODS is commonly set to a specific value during homogenization, assuming that it remains unchanged throughout the process, which is often inaccurate. This study investigated the impact of atomizer geometry and nozzle dimensions on oil droplet breakup during atomization using pressure-swirl atomizers. Subject of the investigation were nozzles that differ in the way the liquid is set in motion, as well as different inlet port and outlet orifice dimensions. The results indicate that nozzle inlet port area may have a significant impact on oil droplet breakup, with x90,3 values of the oil droplet size distribution decreasing from 5.29 to 2.30 µm with a decrease of the inlet area from 2.0 to 0.6 mm. Good scalability of the findings from pilot to industrial-scale was shown using larger nozzles. A simplified theoretical model, aiming to predict the ODS as a function of calculated shear rates, showed reasonable agreement to the experimental data for different atomization pressures with coefficients of determination of up to 0.99. However, it was not able to predict the impact of different nozzle dimensions, most likely due to changes in flow characteristics. These results suggest that the stress history of the oil droplets might have a larger influence than expected. Further studies will need to consider other zones of high stress in addition to the outlet orifice.
1. Introduction
Spray drying of emulsions is a widely used technique for the production of oleaginous powders. An oil-in-water emulsion is first atomized into fine droplets, which are then dried into particles with encapsulated oil droplets by subsequent contact with a hot air stream [1,2,3]. In the food, pharmaceutical, and chemical industries, pressure-swirl nozzles are commonly used for the atomization step, as they are generally more efficient and provide better atomization results in comparison to solid-cone nozzles [4,5]. During atomization, the liquid is strongly accelerated through a narrow gap and subjected to high shear and elongational stresses. The stresses acting on the liquid can cause deformation and breakup of the dispersed oil droplets, leading to a change in the set oil droplet size. The size of the oil droplets in the resulting powder is directly related to physical and sensorial properties of the powder, as well as the release of bioactive compounds in the reconstituted product [6]. Understanding the influence of atomization conditions on the oil droplet breakup is necessary in order to enable a targeted, understanding-based product design. It has been shown in previous studies [7,8,9,10,11,12] that the oil droplet size is influenced by the atomization step, depending on the kind of atomizer and the energy input. For pressure-swirl nozzles, atomization pressure and viscosity ratio between oil and emulsion have been identified as other relevant parameters for oil droplet breakup. Limited impact was found for the initial oil droplet size [7], while no significant impact was found for the emulsion viscosity [8]. When atomizing emulsions with high oil concentrations, the droplet size is not only determined by breakup, but also coalescence [13]. In this study, the effect of coalescence was excluded by working at very low disperse phase fractions. However, especially for pressure swirl atomization, information about the influence of the geometric nozzle design on the oil droplet breakup is scarce. Therefore, the present study investigates the impact of the variation of geometric features of pressure swirl nozzles on oil droplet breakup for different atomization pressures.
In hollow-cone atomizers, liquid is fed into a swirl chamber and an air core is created due to high tangential velocities imparted on the liquid. As the rotating liquid approaches the atomizer exit, a thin liquid lamella is formed in the outlet orifice. Upon exiting the nozzle, the lamella expands outwards, forming a hollow cone and becoming thinner until the conical sheet breaks up into fine spray droplets [5]. While various types of hollow-cone pressure-swirl nozzles have been developed, they are commonly differentiated in the way the liquid is set in a swirling motion [14,15]. This includes pressure-swirl nozzles with an axial inlet and helical slots (Figure 1a), as well as nozzles with tangential inlet holes and a swirl chamber (Figure 1b).
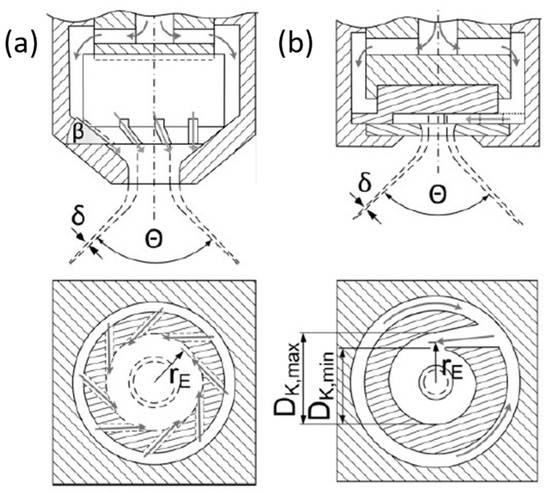
Figure 1.
Schematic representation of pressure-swirl atomizers with (a) axial inlet with helical slots and (b) tangential inlet. Reproduced with the permission from Walzel and Musemic [15] in Chemie Ingenieur Technik, published by John Wiley and Sons, 2011.
The current understanding of oil droplet breakup mechanisms during atomization is based on theories developed for emulsification processes. To achieve oil droplet breakup, the external deformation stresses imparted on the droplets by the surrounding liquid must exceed the droplet capillary pressure [16,17]. These deformation stresses consist mainly of shear and elongational stresses acting on the droplet’s surface. In pressure-swirl nozzles, high shear stresses are expected in areas with small cross-sections, namely, the inlet ports and the outlet orifices. Furthermore, elongational stresses can be expected in areas where the droplet is quickly accelerated, e.g., when the liquid is pushed through a small opening such as a nozzle orifice or inlet ports, and therefore extended in the direction of flow [18].
Oil droplet breakup in laminar flow can be described by the capillary number Ca, which can be calculated for breakup due to either shear or elongational stress. According to the literature [19,20], elongational stresses are expected to be much lower in comparison to shear stresses in the liquid film in the outlet orifice. Due to the small thickness of the liquid film in this area, stresses are generally anticipated to be highest in the nozzle orifice, making them crucial for oil droplet breakup. Additionally, it is well established that changes in inlet port area can affect flow characteristics such as volume flow rate, which in turn could influence stresses and thus oil droplet breakup in the outlet orifice.
Renze et al. [21] showed that predominantly shear stresses determine the flow inside the nozzle orifice. Therefore, this study focuses on the capillary number for breakup in laminar shear flow. Ca is defined according to Equation (1), with the shear rate in s−1, the shear viscosity of the continuous phase measured in Pa·s, the droplet radius x in m, and the interfacial tension σ measured in N/m at the oil-water-interface as influencing parameters (Equation (1)). The viscosity of the continuous phase is used here in place of the emulsion viscosity, as very low disperse phase fractions were worked with.
Oil droplet breakup occurs when a critical capillary number Cacr is exceeded for a sufficiently long time period [13,17]. The value of Cacr highly depends on the type of flow that is acting on the droplet, as well as the emulsion’s viscosity ratio . Grace [17] defined as the ratio of the viscosity of the dispersed phase to the viscosity of the continuous phase . Assuming a simple shear flow at quasi-steady state, Cacr has a minimum of around 0.5 for a viscosity ratio in the range of 0.1 < < 1 [17,22]. For higher values of , the critical capillary number increases, and it is generally assumed that at > 4, drops rotate and do not break up anymore.
The maximum shear stresses in the liquid film in the outlet orifice can be estimated according to a model proposed by Taboada et al. [7]. The model was used to estimate capillary numbers for different atomization conditions and to compare them with the critical capillary numbers Cacr for shear. The results showed increasing oil droplet breakup with increasing shear rates in the liquid lamella at the outlet orifice, and it was concluded that laminar shear stresses in the liquid lamella at the outlet orifice dominate the oil droplet breakup. Furthermore, the model was used in Taboada et al. [8] to estimate capillary numbers for different emulsion viscosities and viscosity ratios. The authors used Equation (2) to fit their experimental data, proving it to be effective in describing oil droplet sizes after atomization.
Many authors state that different nozzle design types and geometrical properties influence nozzle flow characteristics [5,23,24]. Understanding the flow characteristics is essential, as they determine the liquid velocity and the liquid film thickness [25]. These parameters are known to influence the spray droplet size during pressure-swirl atomization. Furthermore, the flow characteristics can be expected to correlate with stresses that may lead to breakup of the oil droplets. As the current mechanistic understanding of the flow characteristics in pressure-flow nozzles is limited, key flow parameters such as liquid velocity and liquid film thickness need to be determined experimentally to estimate the stresses acting on the oil droplets. This can be done by determining the volume flow rate QL measured in L·min−1 and the dimensionless discharge coefficient Cd. The discharge coefficient is described by Equation (3), with do being the nozzle outlet orifice diameter in m, the emulsion density in kg·m−3, and Δp the atomization pressure in Pa.
The discharge coefficient represents the ratio of the actual volume flow rate to the theoretical value [5], and is commonly used to characterize throughput characteristics in pressure-swirl nozzles [15,26]. From the discharge coefficient, the liquid film thickness can be derived using geometrical considerations. When the atomization is performed at low pressures, and a stable air core is not yet formed, the discharge coefficient increases with increasing atomization pressure [27]. As soon as an air core is formed, a part of the outlet orifice is blocked by the air core, and the discharge coefficient is expected to decrease [28]. In general, pressure-swirl atomizers are operated below Cd < 0.6 [15].
Another method to analyse atomization performance and droplet breakup is the energy density model [29], which was originally developed in the emulsification literature to compare emulsification results from different machine types or dispersion geometries [16]. The model correlates the resulting oil droplet diameter with the specific energy that is applied to the volume EV in which stresses are high enough for droplet disruption. As typically broad droplet size distributions result from droplet breakup in industrial emulsification machines, a characteristic value is used in the equation to describe the correlation between resulting droplet size and energy density applied. Very often the Sauter mean diameter SMD is used, simplistically as the mean value of the distribution. However, from the point of view of droplet size reduction theory, the maximum surviving diameter should be calculated. A suitable characteristic value would therefore rather be the x90,3 value of the resulting distribution; see Equation (4):
with C being a constant depending on the viscosity of the dispersed phase, while the exponent b relates to the breakup mechanism. This exponent b strongly depends on the stresses dominating droplet breakup. Stähle et al. [29] showed in their work that the energy density is equal to the liquid pressure difference Δp in pressure swirl nozzles (Equation (5)):
Information about the exponent b of Equation (4) can be used to gain knowledge about the flow characteristics inside the nozzle: For b = 1 a laminar flow can be assumed, while values around b = 0.24 − 0.4 indicate a turbulence-dominated flow [16]. It must be noted that this model only applies when all stresses resulting from the pressure drop in the atomizer are high enough and act long enough for droplet deformation and breakup to occur [16,30]. This may be assumed for pressure-swirl atomizers, as Stähle et al. [29] showed in their work. To predict the resulting droplet diameter, Equation (4) (i.e., the b/C—values) can only be taken if the break-up determining flows do not change significantly [16], i.e., when geometrically similar atomizers are compared. However, the b values give interesting information on the flow conditions inside the atomizer, and thus help in interpreting oil droplet breakup differences when changing atomizer geometry or scaling them up.
The aim of this study is the investigation of the impact of nozzle geometry on oil droplet breakup during pressure swirl atomization and the transfer of the principles found at pilot-scale to industrial-scale. For this, three main hypotheses were formulated:
- Oil droplet breakup decreases with smaller inlet port area at a constant pressure. This hypothesis is based on the assumption that a decrease in inlet port area leads to a decrease in volume flow rate, and consequently to smaller shear stresses in the nozzle outlet, as the liquid velocity decreases.
- Oil droplet breakup increases with smaller outlet orifice area. This hypothesis assumes that a smaller outlet orifice leads to increasing shear rates due to higher liquid velocities, as the cross-sectional flow area decreases.
- Based on the expectation that oil droplet size after atomization is solely dependent on the acting shear rates, it can be hypothesized that the proposed model should also hold up for changes in geometry, as long as geometrical similarity of the nozzles can be assumed and the residence time in the nozzle orifice is sufficient to reach equilibrium conditions.
To investigate these hypotheses, two different nozzles with axial and tangential inlets were used in pilot-scale applications. Additionally, the impact of different inlet port and outlet orifice areas was investigated. To describe the results, two different models were compared to provide insight for an appropriate and practical atomization process design for industrial application. The model developed by Taboada et al. [7] was used to calculate shear rates in the nozzle outlet. For comparison, the energy density model was used for its benefit of ease of use and the knowledge it provides about flow characteristics. As the aim of this study is to improve process design for large-scale applications, further trials at industrial-scale were conducted for selected nozzles to investigate the applicability of the findings at higher volume flow rates in scaled-up nozzles. The model proved successful in describing and predicting oil droplet breakup for changes of atomization pressure and emulsion viscosity at pilot- and industrial-scale. While the model was not readily able to predict the impact of changes in nozzle geometry and dimensions on oil droplet breakup based on the estimated shear rates, the scalability of the findings at pilot-scale were successfully proven.
2. Materials and Methods
2.1. Model Emulsion
Model oil-in-water emulsions were prepared similarly to the procedure described in the work of Taboada et al. [7]. Maltodextrin (Cargill C*DryTM MD 01910, Haubordin, France) and whey protein isolate (Lacprodan DI-9224, Arla Food Ingredients, Viby, Denmark) were chosen as they are commonly used wall materials and emulsifiers for encapsulation applications [31,32], while a medium chain triglyceride oil (MCT oil, WITARIX MCT 60/40, Hamburg, Germany) was chosen as a dispersed phase. The basic manufacturing procedure is divided into two steps: the adjustment of the oil droplet size (ODS) and the adjustment of viscosity and oil concentration. In the first step, concentrated emulsions (50 wt% oil concentration) consisting of water, MCT oil and whey protein isolate (WPI) were prepared using a colloid mill (IKA magic LAB, IKA Werke GmbH & Co. KG, Staufen, Germany). The colloid mill was operated at a gap width of 0.16 mm and 5000 rpm for 2 min to obtain an initial oil droplet size (IODS) of SMD = 23.79 ± 0.99 µm and x90,3 = 41.72 µm. The mass ratio of emulsifier to oil was set to 1:10. Subsequently, this concentrated emulsion was mixed with a maltodextrin solution to adjust the viscosity to 10 mPa·s at 20 °C. Taking the viscosity of the dispersed oil into account, this results in a viscosity ratio of 0.97 and a theoretical critical capillary number Cacr,th of 0.7 according to Grace [17]. An oil concentration of 1 wt% was chosen, as it is documented in the literature that coalescence of oil droplets can be neglected at this concentration.
2.2. Pilot-Scale Pressure-Swirl Nozzles
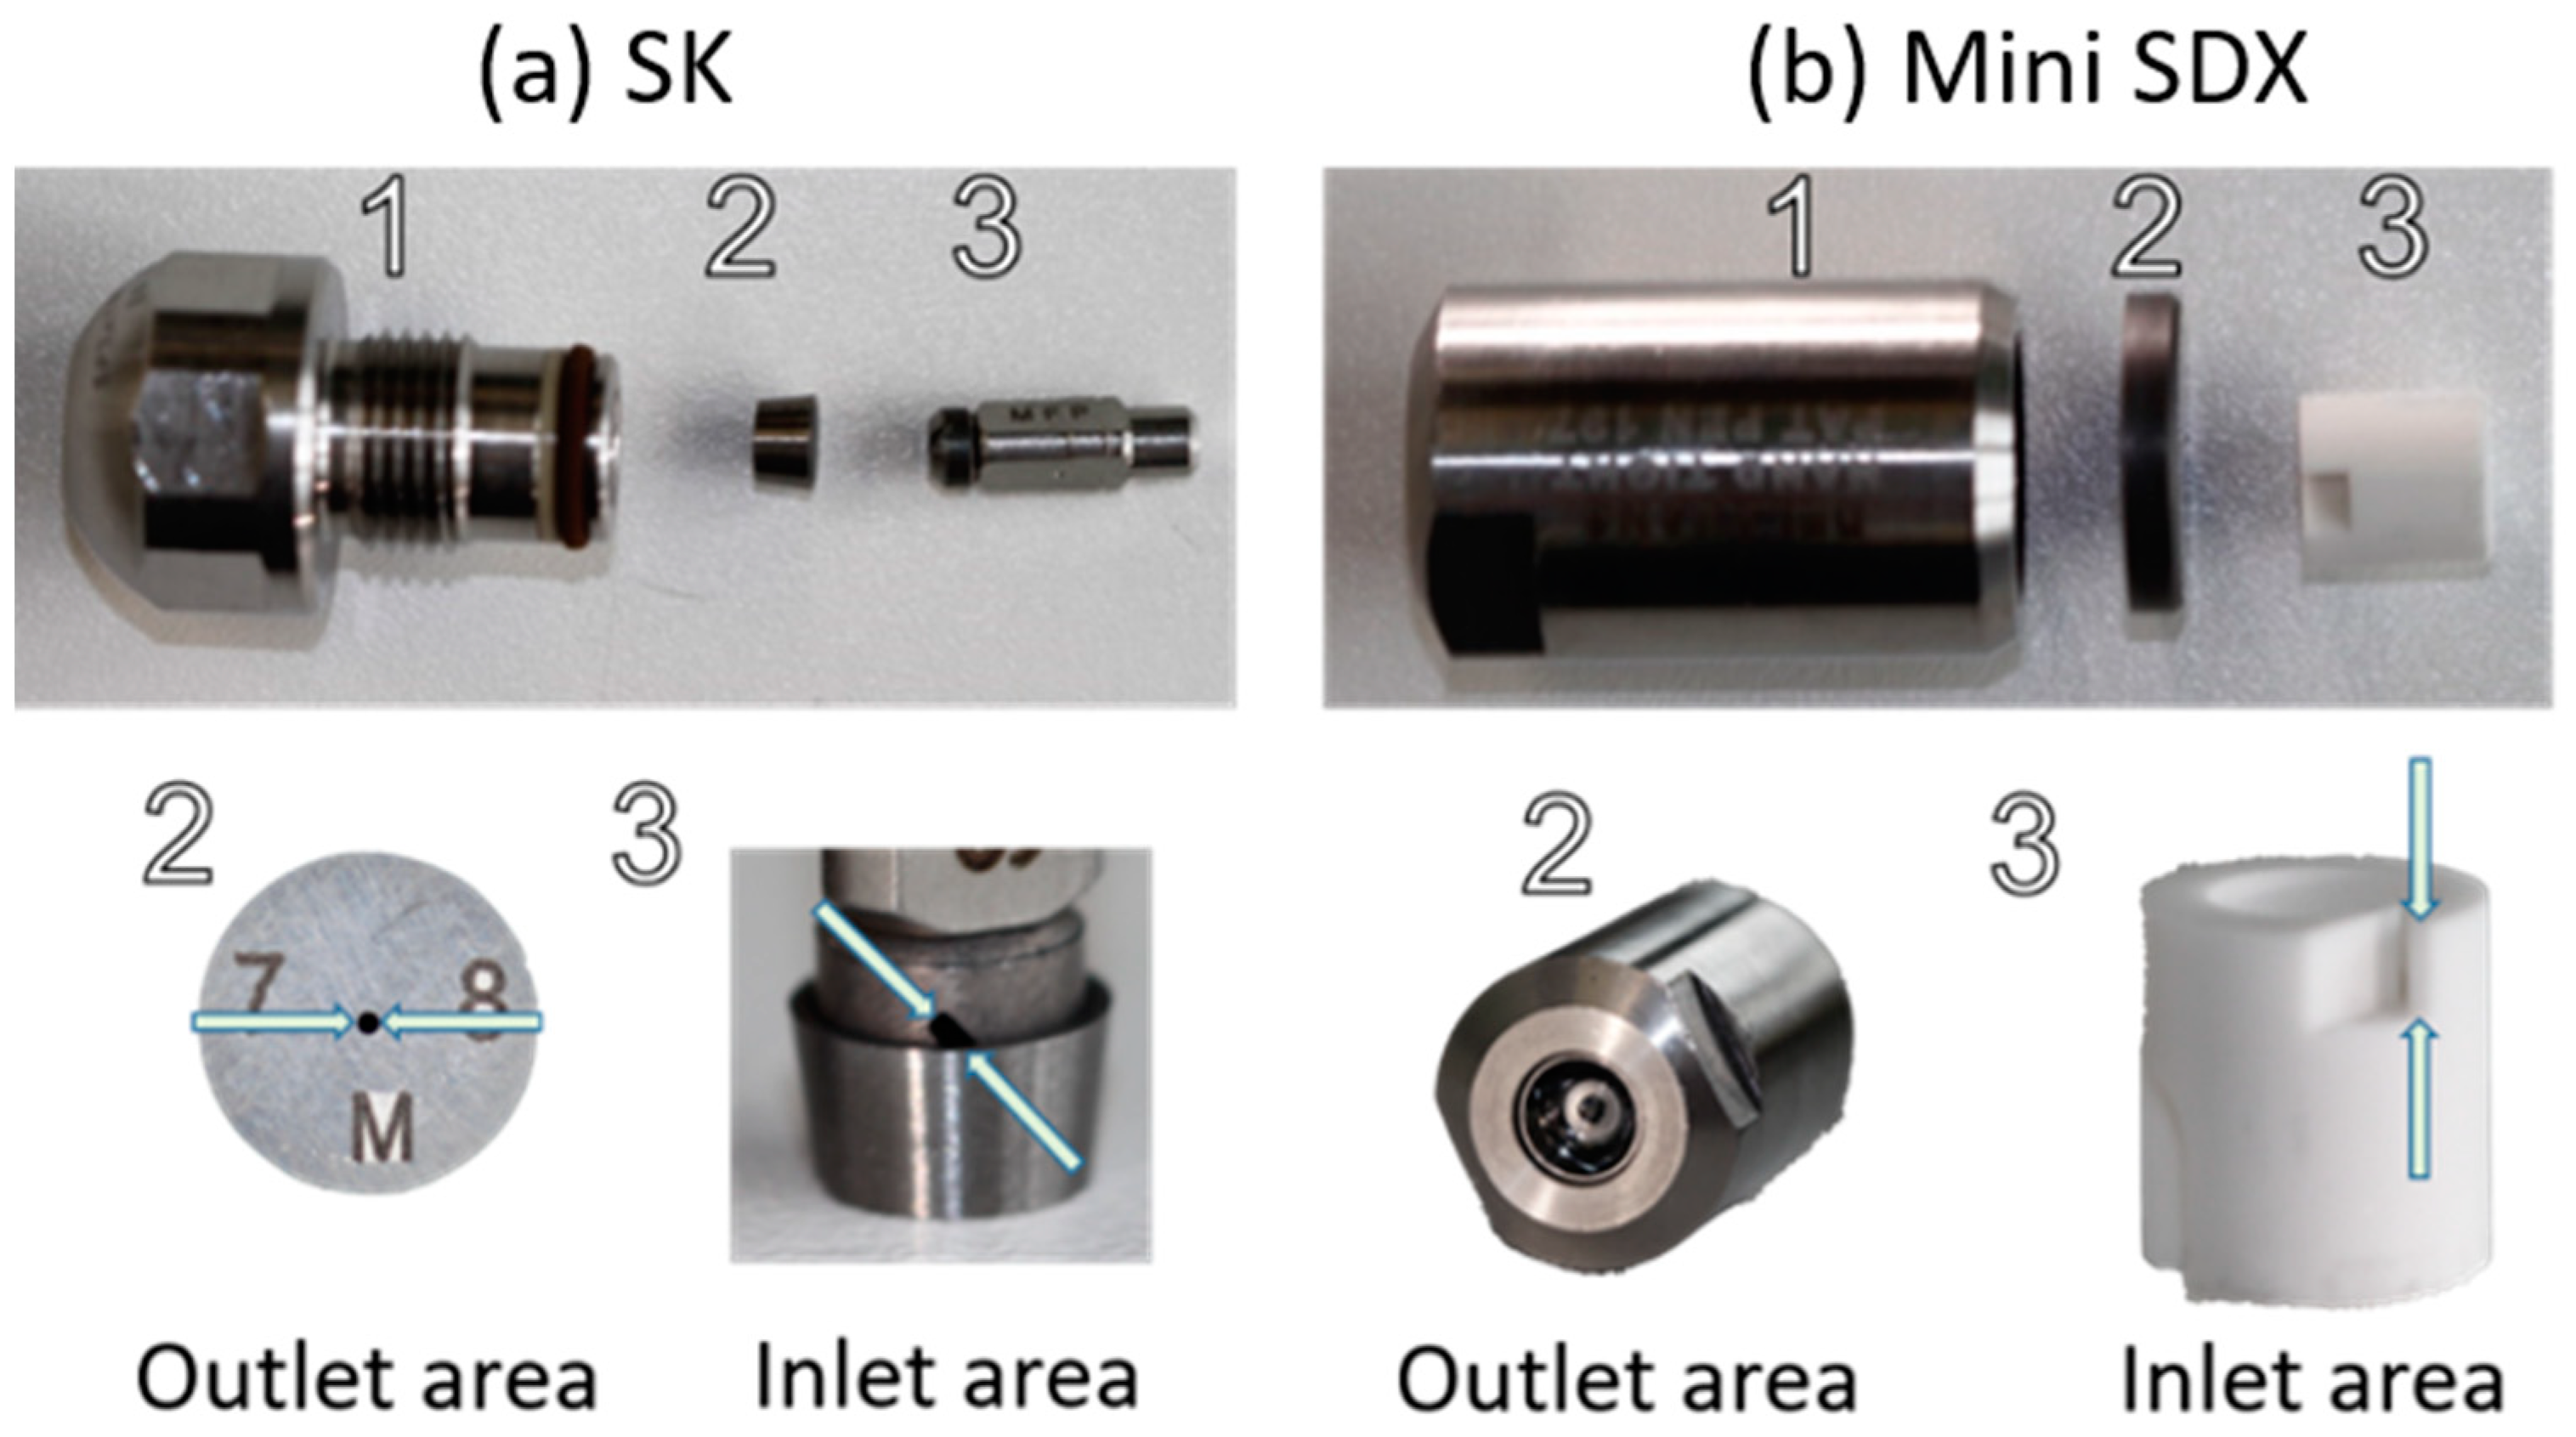
Two pilot-scale pressure-swirl nozzles were used for the experimental study: the Mini SDX nozzle (Delevan Spray LLC, Bamberg, SC, USA) with a tangential inlet port, referred to as Mini SDX, and the nozzle SKHN-MFP SprayDry (Spraying Systems Co., Glendale Heights, IL, USA) with axial inlet slots, referred to as SK. The principles of the nozzles are shown in Figure 1. The nozzles used are shown in Figure 2 and consist of three parts: the nozzle body (1), the orifice (2) insert, and a slotted core with two slots (3). The area of the flow cross-section of the inlet port has been varied for both the SK and Mini SDX. Furthermore, the outlet orifice area was varied for the SK. The dimensions for the investigated inlet ports and outlet orifices can be found in Table 1.
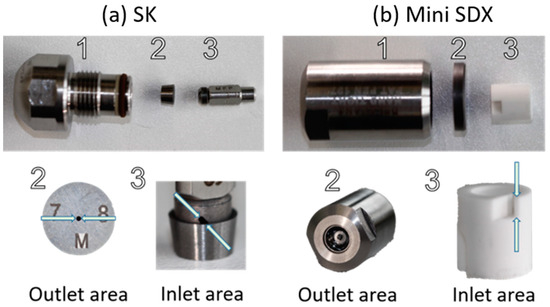
Figure 2.
Features of the examined pressure-swirl nozzles. (a) The SK with the nozzle body (1), the orifice insert (2), and a slotted core with axial inlet slots (3). (b) The Mini SDX with the nozzle body (1), the outlet orifice insert (2), and a core with a single tangential inlet port (3).

Table 1.
Part numbers and cross-sectional area of the inlet ports of the Mini SDX and SK, as well as the outlet orifice of the SK. The dimensions for all nozzle components were either taken from the nozzle specifications or measured in-house. The components written in bold letters were used where it is not further specified.
2.3. Atomization Experiments at Pilot-Scale
The atomization experiments were conducted on an atomization rig following the procedure described by Taboada et al. [7]. The setup of the atomization rig is depicted in Figure 3. The atomization rig consists of a spray booth, and a three-piston pump (Rannie LAB Typ 8.5, SPX FLOW Inc., Charlotte, NC, USA) is used for atomization. Atomization experiments were performed at atomization pressures Δp of 5 to 25 MPa at room temperature. It has to be noted that it was not possible to examine all pressures from 5 to 25 MPa for all inlet geometries. This is due to limitations of the available pump, as it only allows for liquid flow rates of around 0.9 L·min−1, meaning the maximum achievable pressure was limited. The liquid volume flow rates QL were measured with a flow meter (VSE0, 04/16, VSE Volumentechnik GmbH, Neuenrade, Germany). Spray droplet size was measured inline by means of a laser diffraction spectroscope (Spraytec, Malvern Instruments GmbH, Herrenberg, Germany), which measures the spray droplet size 25 cm below the nozzle outlet perpendicular to the nozzle axis line. The measured values were time averaged over a period of 30 s for each atomization condition, with a measurement interval of 1 s. To investigate oil droplet breakup, samples of the atomized emulsions were taken with a beaker 20 cm below the spray. Atomization was done at all operating points three times, resetting the experimental setup between each trial. All samples were taken at room temperature in triplicate. Oil droplet size distributions (ODSDs) were measured offline using a laser diffraction spectroscope (HORIBA LA950, Retsch Technology GmbH, Haan, Germany). A refractive index of 1.4494 was used with an imaginary part of zero. Data points in the ODSDs were connected for readability. Rheological data were obtained with a rotational rheometer (Physica MCR 101, Anton Paar, Graz, Austria) using a double gap geometry (DG26.7) with shear rates in a range of 101 to 103 s−1 at 25 °C. The software OriginPro 2020 (OriginLab Corporation, Northampton, MA, USA) was used to perform statistical analysis.
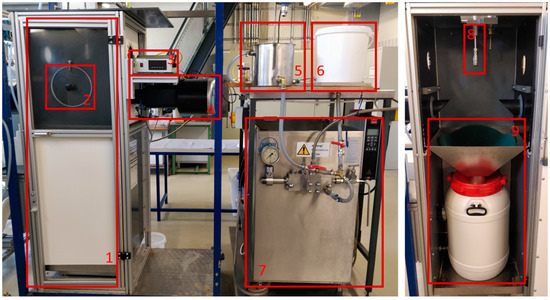
Figure 3.
The atomization rig (left) with an open view of the spray booth (right). The following components are highlighted: the spray booth (1), sampling window (2), flow meter (3), laser diffraction spectrometer (4), feed container (5), water container (6), three piston pump (7), spray lance (8), funnel and keg to collect the emulsion after atomization (9).
2.4. Industrial-Scale Nozzle Design and Atomization Experiments
To verify the applicability of the found principles to larger volume flow rates, a SDX V nozzle was used, which has the same basic design as the Mini SDX. The nozzle dimensions are shown Table 2. Emulsion preparation for atomization followed the same basic procedure as for the pilot-scale trials. WPI was dissolved the day before in an open tank with a Typhoon AL100L/04 (WEG GERMANY GmbH, Kerpen Türnich, Germany) with three-blade-propeller stirrer at around 300 rpm. Maltodextrin was dissolved in an open tank with three-blade-propeller stirrer, using first a higher number of revolutions for mixing and subsequently a lower one for degassing. The concentrated emulsion was prepared on the day of the trial by mixing MCT-oil into the WPI solution at around 300 rpm. The ODS was set to SMD = 19.07 µm with an IKA LABOR PILOT 2000/4 (IKA Werke GmbH & Co. KG, Staufen, Germany) with “4M” “medium toothed” geometry operated at 4700 rpm, before mixing the concentrated emulsion and the maltodextrin solution (Roquette GLUCIDEX IT 12, Roquette, Frères, Lestrem, France) in an open tank with a three-blade-propeller stirrer at around 300 rpm. To pump the emulsion to the atomizer, a three-piston high pressure pump (Bos MC4-350S, Bos Homogenisers B.V., Hilversum, The Netherlands) with a Mohno booster pump was used. ODSD were measured offline via laser diffraction (Malvern Mastersizer 2000 with Hydro 2000G wet dispersion unit, Malvern Panalytical Ltd., Malvern, UK) and viscosity was determined using a rotational rheometer (Physica MCR 302, Anton Paar, Graz, Austria) using a double gap geometry (DG26.7) with the same conditions for shear rate and temperature as in the pilot-scale trials. Due to the heavy material and staff expenditure, the scale-up experiments were conducted only once. The purpose of these experiments is solely the investigation of the applicability of the results from pilot-scale to a larger volume flow scale.
Table 2.
Part numbers and cross-sectional area of the inlet and outlet ports of the SDX V nozzle. The components written in bold letters were used where it is not further specified.
3. Results
3.1. Influence of Nozzle Geometry on the Discharge Coefficient and Key Parameters for Throughput Characteristics in Pilot-Scale
To estimate the stresses that are acting on oil droplets during atomization, knowledge of key parameters such as liquid velocity and liquid film thickness are needed. To estimate the liquid film thickness, the discharge coefficients (Cd) need to be determined for all nozzle configurations at 5–25 MPa. Under the assumption that a proper air core is formed, an increase in atomization pressure is expected to lead to higher tangential velocities, a thinner liquid lamella, and therefore a lower Cd.
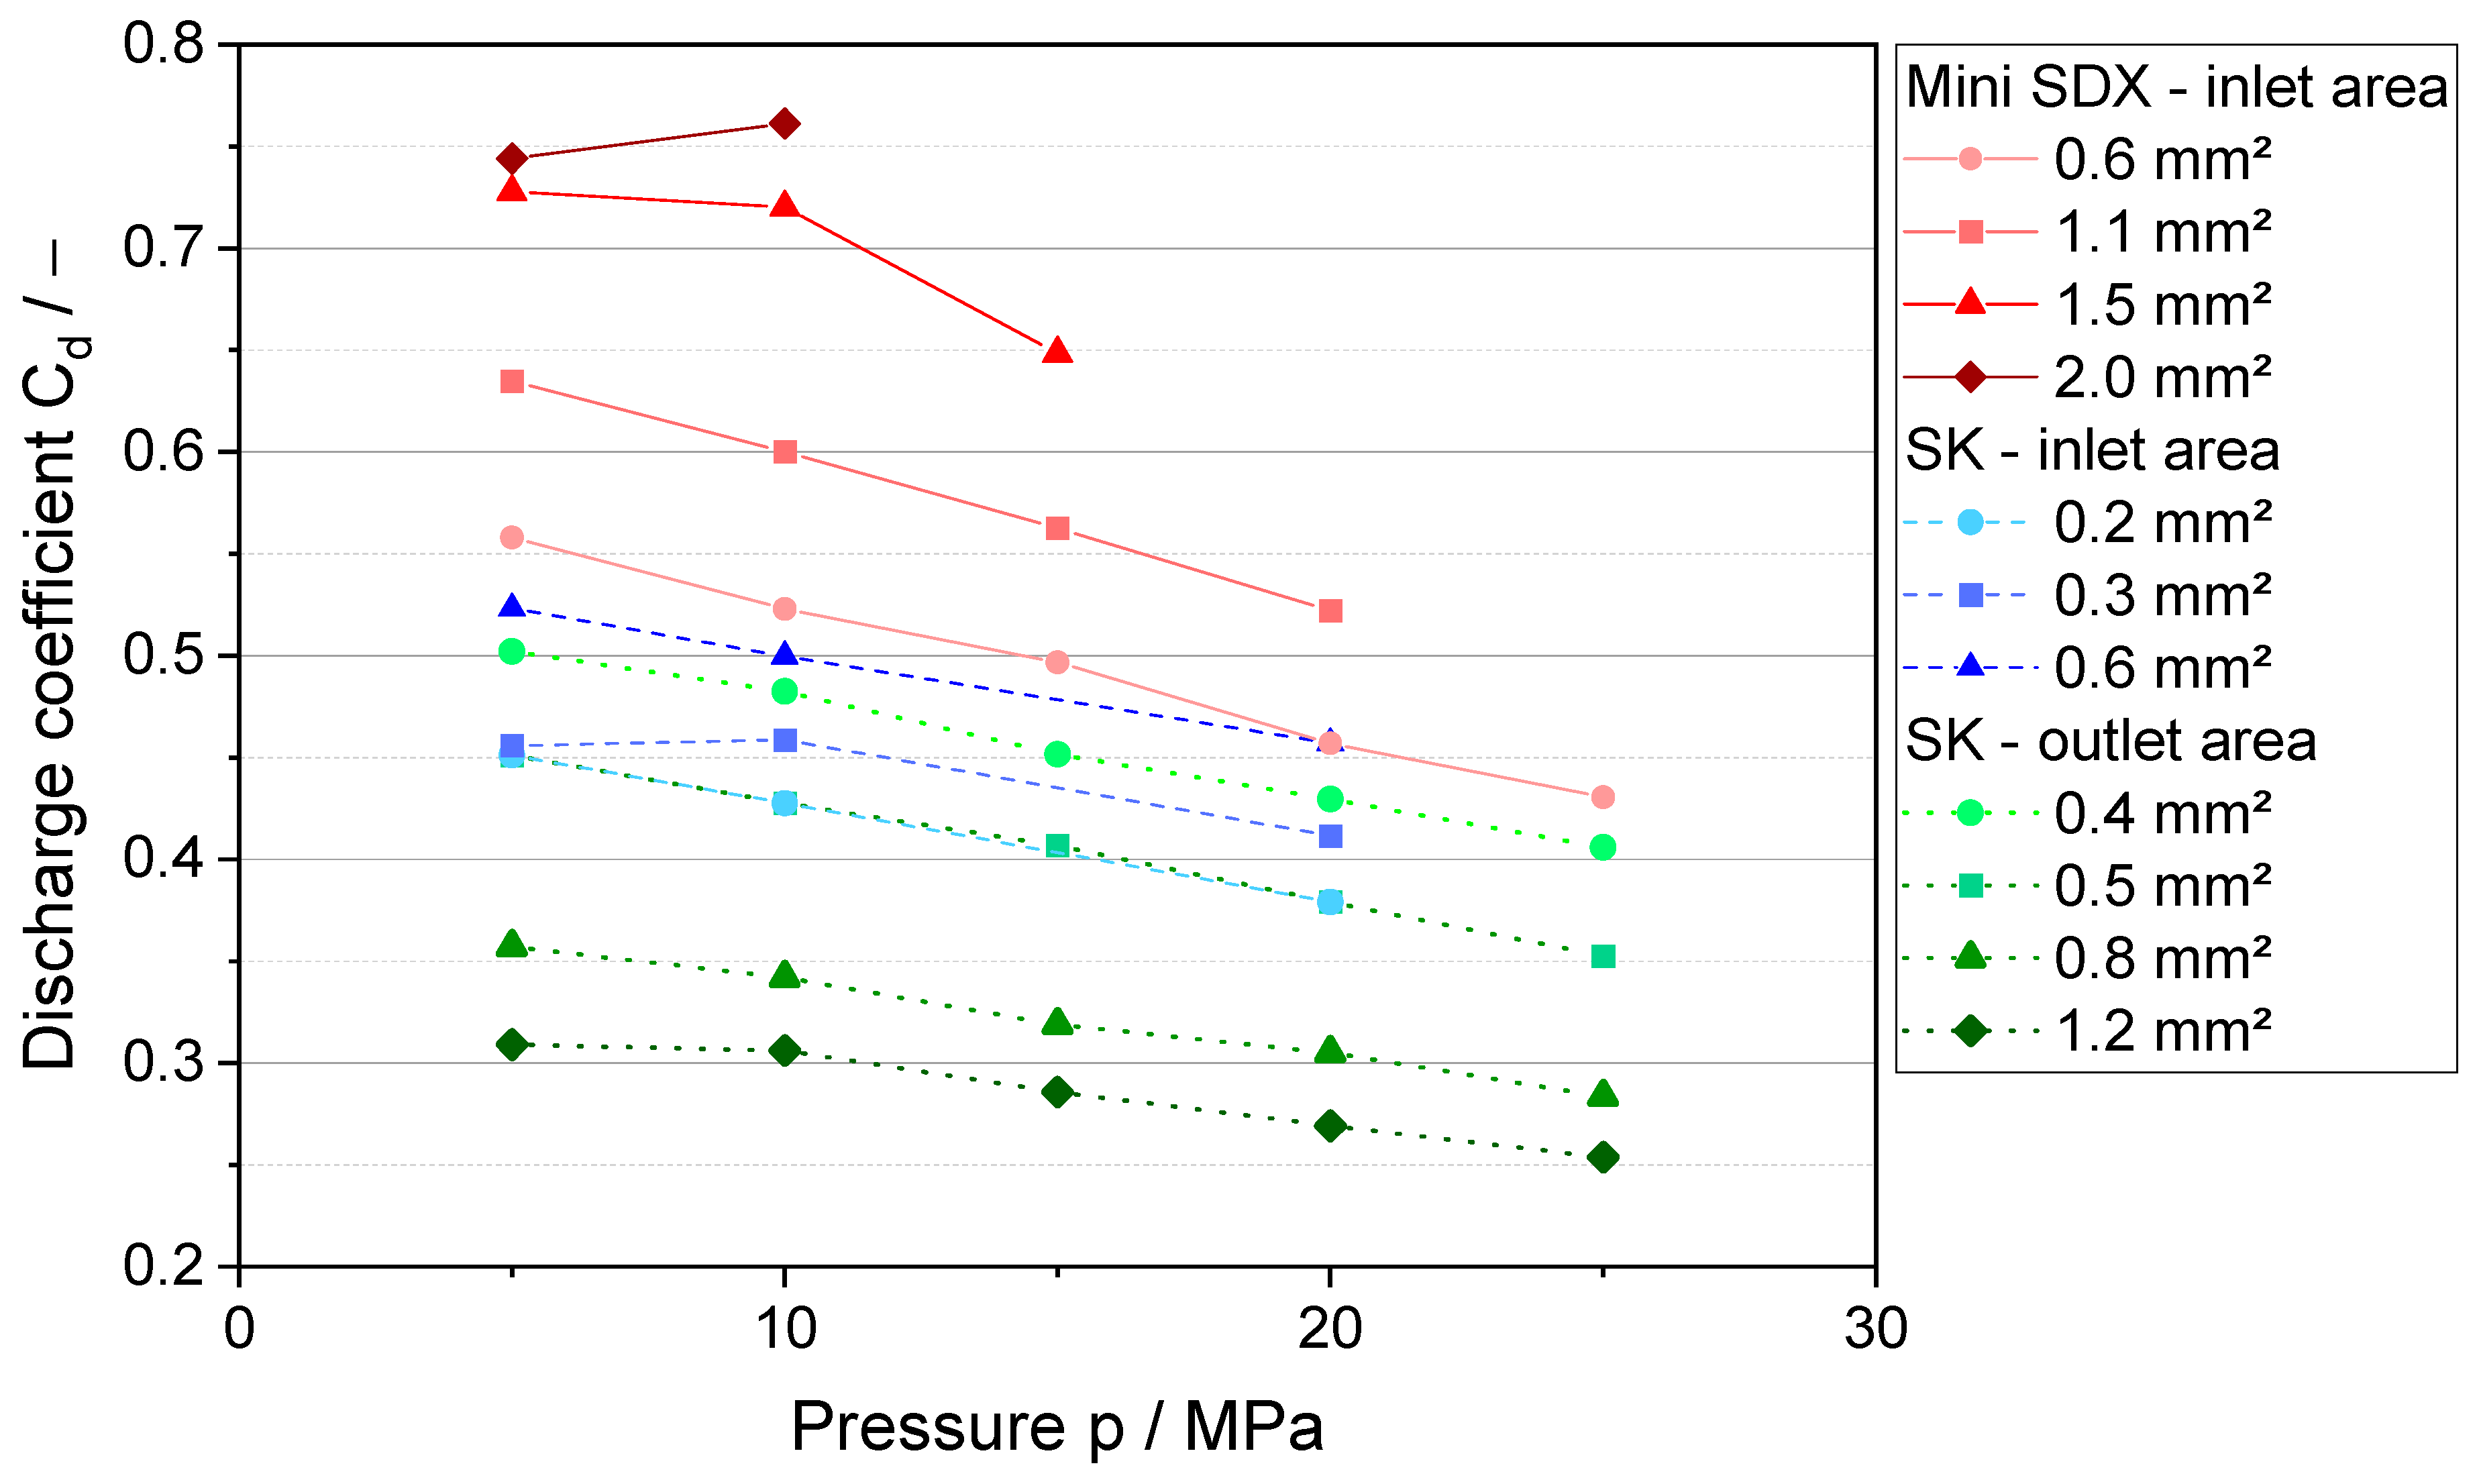
Figure 4 shows the Cd value at different atomization pressures for the examined nozzle geometries. Overall, Cd decreases with increasing atomization pressure, showing good agreement with the expected results. This is also reflected in the values for liquid film thickness (Appendix A). A noticeable deviation from the expected trend of Cd can be observed for the Mini SDX using inlet ports with an area of 2.0 mm2. An increase in atomization pressure from 5 to 10 MPa leads to an increase of Cd. In addition, Cd is above 0.7 for the investigated atomization pressures. These combined effects indicate that a stable air core was probably not fully developed, leading to an improper atomization process. This is further supported by the results for key parameters that describe the throughput characteristics for the atomization experiments at 10 MPa (Table 3). The characteristic spray droplet size x90,3 is with 150.68 µm for an inlet port area of 2.0 mm2, considerably larger than for components with smaller inlet port areas.
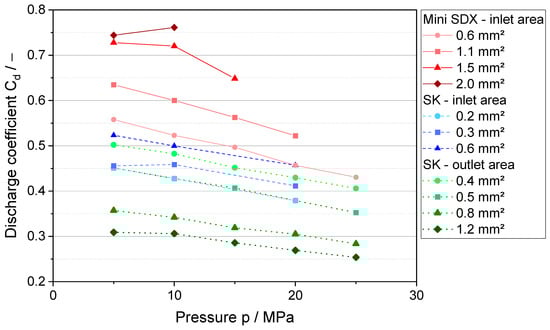
Figure 4.
Discharge coefficients Cd for different inlet areas of the Mini SDX, and for different inlet and outlet areas of the SK at atomization pressures from 5 to 25 MPa.
Table 3.
Values of key parameters for throughput characteristics at an atomization pressure of 10 MPa for different nozzle geometries.
For changes in the nozzle dimensions at constant pressure, larger inlet port areas are anticipated to result in higher discharge coefficients. This phenomenon is attributed to the larger volume flow rate in the nozzle and increased liquid film thickness in the outlet orifice [33]. The results for the measured volume flow rate QL, the mean liquid velocity , and the calculated liquid film thickness t are shown in Table 3, and are all in line with this expectation. With the knowledge of the liquid film thickness, the cross-sectional area of the liquid in the outlet orifice can be calculated. An increase in Cd is observed with increasing inlet port area, thereby showing the expected trends. This correlation is evident for both the Mini SDX and the SK.
When examining the impact of different outlet orifice diameters, the inverse correlation is observed. An increase in orifice diameter allows for a larger air core to form, leading to an effectively smaller Cd [5]. Looking at the results, the discharge coefficient decreases with larger orifice diameter according to the expectation based on the literature. Simultaneously, an increase of the volume flow rate from 0.35 to 0.70 L·min−1 is observed for an increase from 0.4 to 1.2 mm2 outlet orifice area (Table 3). This increase in volume flow rate in combination with slightly lower liquid velocities (107.84–100.18 m·s−1) leads to an increase in liquid film thickness. However, the influence of the film thickness is not of the same magnitude as that of the increase in orifice area, still leading to a proportionally larger air core and, therefore, an overall lower discharge coefficient. Complete results on the film thickness are shown in Appendix A, and volume flow rates in Appendix B.
3.2. Influence of Nozzle Design Type and Geometric Dimensions on Oil Droplet Size
3.2.1. Atomization Experiments at Pilot-Scale
To investigate Hypotheses 1 and 2, atomization experiments were conducted at pilot-scale. Figure 5 displays the resulting ODSD at 10 MPa (left) and values of x90,3 at 5–25 MPa (right) for atomization with different inlet ports of the Mini SDX. Four different nozzle components with inlet port areas Ai in the range of 0.6 to 2.0 mm2 were investigated. The ODSDs are narrow and monomodal for all investigated nozzle components, a result that is consistent for all investigated nozzles (Appendix C). Analysing the results for the oil droplet size distribution at 10 MPa (Figure 5, left), a significant reduction of the ODS can be observed for all geometries. A clear trend for smaller oil droplets with smaller Ai is evident, as indicated by the x90,3 values decreasing from 5.29 to 2.30 µm with a decrease of the Ai from 2.0 to 0.6 mm.
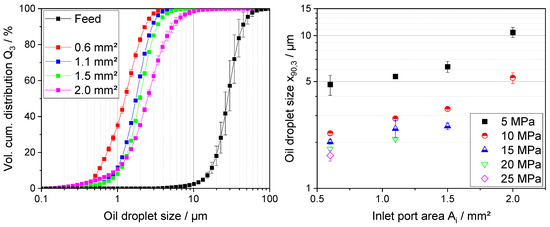
Figure 5.
ODSD for an atomization pressure of 10 MPa (left) and values of x90,3 for different inlet areas of the Mini SDX for 5–25 MPa (right).
Figure 5 (right) illustrates the impact of pressure on x90,3 values for the different nozzle configurations. It is known from the literature [7] that ODS decreases with increasing atomization pressure, as the acting stresses on the oil droplets are expected to increase. This behavior can be observed across all investigated Ai. Furthermore, the correlation of smaller oil droplet sizes when atomizing with smaller Ai at constant pressure remains valid for all investigated atomization pressures of the Mini SDX.
The measured volume flow rates QL, estimated values of film thickness t, and mean liquid velocity (Table 3) were taken into account to calculate the acting shear rates according to Equation (4), assuming a linear shear profile in the liquid lamella. A comprehensive summary of the estimated shear rates for all nozzle geometries and atomization pressures is given in Appendix D.
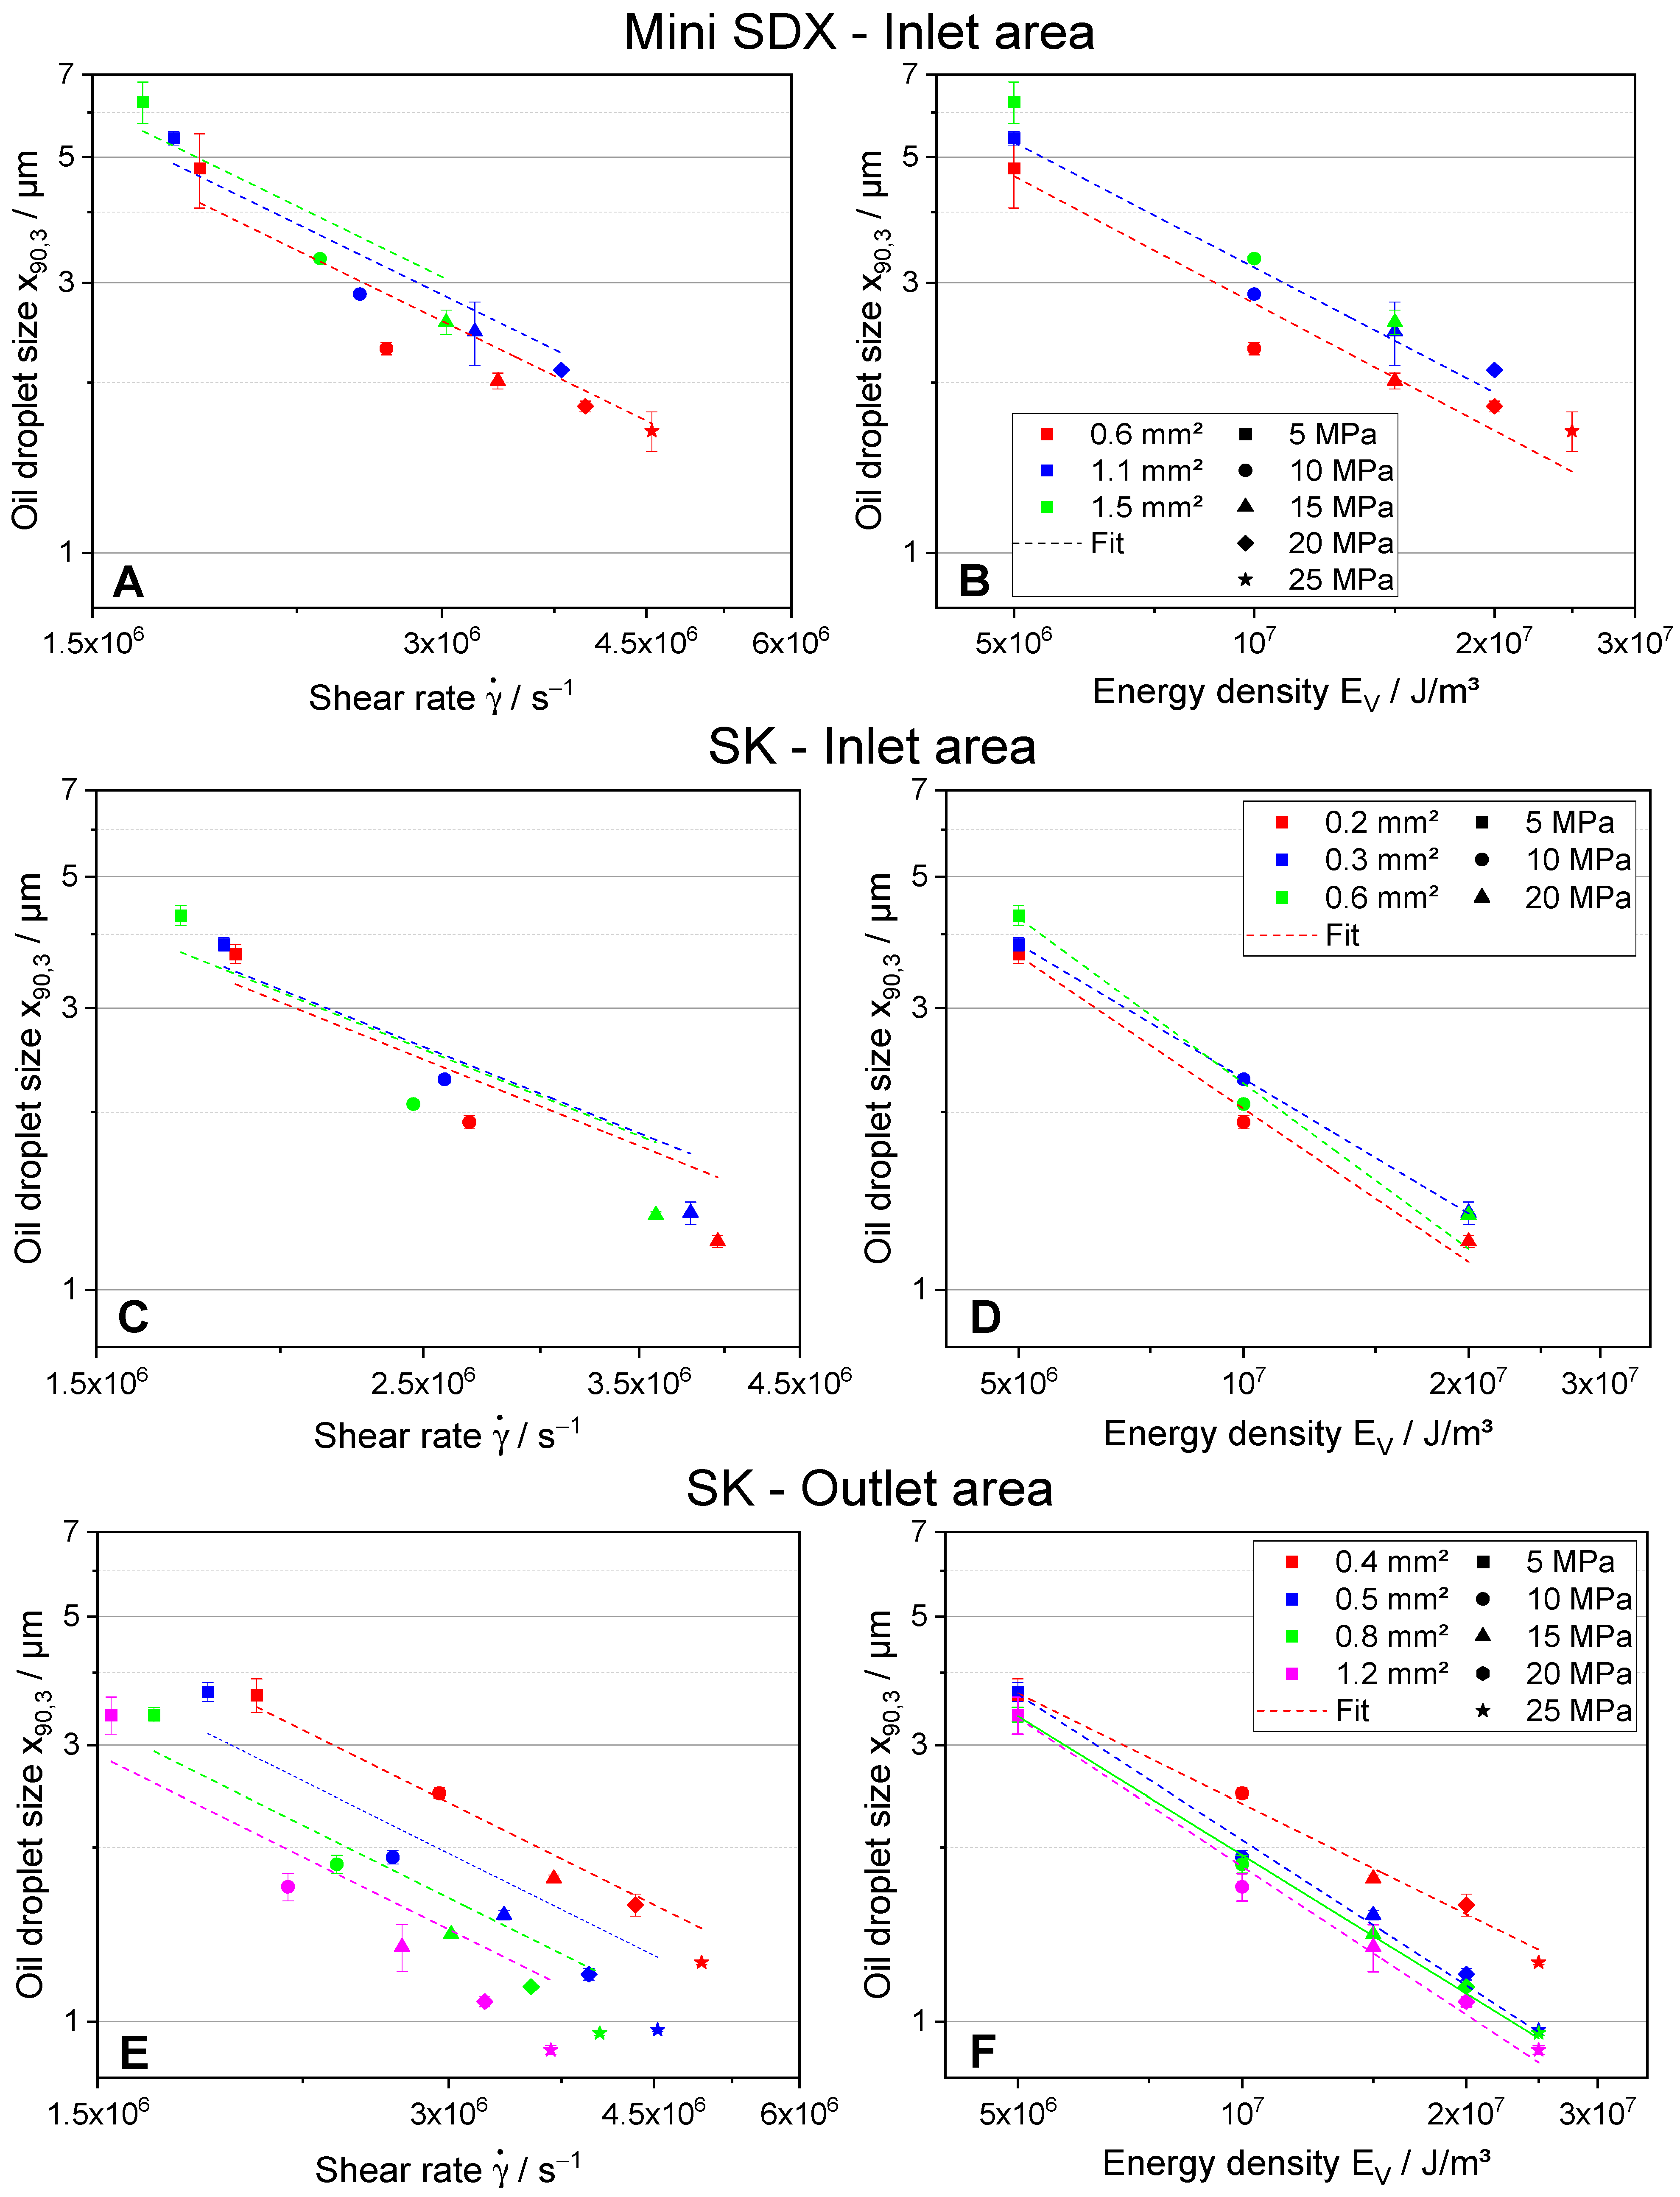
Figure 6 summarizes the results for the values of x90,3 for different inlet port areas of the Mini SDX (A and B), as well as different inlet port areas (C and D) and outlet orifice areas (E and F) of the SK for atomization pressures from 5 up to 25 MPa. In this analysis, the results for an inlet port area of 2.0 mm2 were not taken into account, as the results of the discharge coefficient in Section 3.1 gave clear indication that no stable air core was formed. If no stable air core is present in the outlet orifice, the prerequisites for the model of Taboada et al. [7] are not fulfilled, and it cannot be applied.
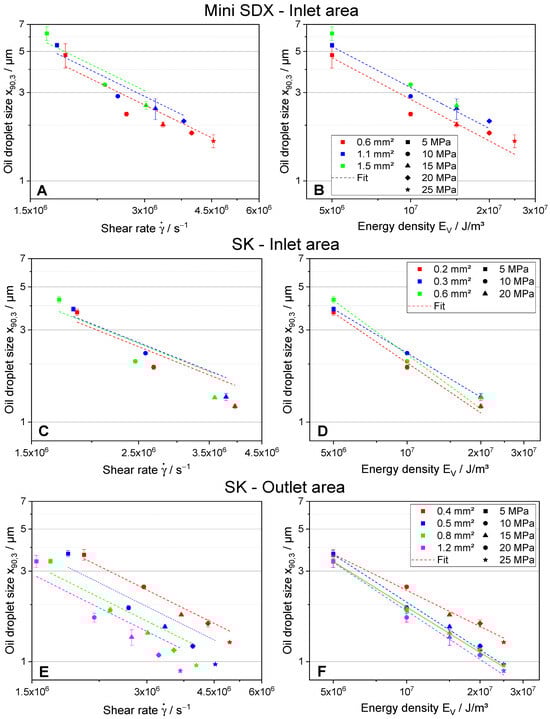
Figure 6.
Values of x90,3 against different estimated shear rates (A,C,E) and energy density (B,D,F) for different inlet ports of the Mini SDX (A,B) and different inlet ports (C,D) as well as outlet orifices (E,F) of the SK.
Figure 6A,C,E shows the x90,3 plotted against the estimated shear rate for each investigated nozzle configuration, while Figure 6B,D,F depicts the x90,3 plotted against the energy density EV. It can generally be observed for all nozzle configurations that ODS decreases with increasing atomization pressure Δp for constant inlet areas Ai or constant outlet areas Ao. Additionally, an increase in shear rate with larger Δp can be seen across all configurations (Figure 6A,C,E). A closer examination of the impact of changes in nozzle geometry at constant Δp reveals different results. For changes in Ai of the Mini SDX, the results display a reduction of ODS with smaller inlet ports at constant Δp, as was observed in Figure 5 (right), while the estimated shear rates are increasing. For changes in Ai of the SK, the same trend of decreasing ODS with decreasing Ai can only be observed for Δp = 5 MPa (Figure 6C,D). When atomizing at higher Δp, no consistent trend can be detected. Looking at different outlet areas Ao of the SK at constant Δp, the ODS increases with decreasing Ao (Figure 6E,F). Nonetheless, the estimated shear rates increase with smaller dimensions at a constant Δp for all investigated configurations of the SK (Figure 6A,C,E).
To assess if the model of Taboada et al. [7] can be applied to describe or even predict the impact of changes in nozzle geometry on oil droplet breakup, the data for each nozzle geometry were fitted according to Equation (2). The resulting fits for all nozzle geometries at pilot-scale are depicted in Figure 6A,C,E, and the associated coefficients of determination and estimated critical capillary numbers are given in Table 4. Overall, R2 is between 0.83 and 0.97. A critical capillary number Cacr based on the estimated shear rates was calculated according to Taboada et al. [7] using the slope of Equation (2). The results for Cacr are overall in a range of 0.94 to 1.79. The highest values are observed for changes in the inlet area Ai of the Mini SDX (1.61 to 1.79), with no discernible trend. For the SK, values of Cacr are around 1.05 to 1.25 for changes in Ai and 0.89 to 1.42 for different Ao. In both cases, the Cacr decreases with increasing inlet or outlet area.
Table 4.
Values for coefficients of determination and estimated Cacr for the fit to Equation (2), as well as coefficients of determination, slope C, and exponent b for the fit to Equation (4) for all pilot-scale nozzle geometries.
For comparison, the energy density model according to Karbstein [16] and Stähle et al. [29] was employed. The data were fitted according to Equation (4) (Figure 6B,D,F). The coefficients of determination R2 for the fits are shown in Table 4, exhibiting excellent values in a range of 0.93 to 1. The values for b (Table 4) are in a range of 0.65 to 1.23. Looking at the Mini SDX, the exponent b decreases from 1.14 to 0.65 for an increase in Ai. In the case of the SK, no clear trend can be observed with values ranging from 1.17 to 1.23 for changes in Ai and from 0.94 to 1.14 for Ao. Values for the slope C were observed for the Mini SDX nozzle from 1.54 × 10⁷ to 2.47 × 10⁷, increasing with increasing Ai. For the SK, no clear trend is discernible again, with C ranging from 1.02 × 10+7 to 1.91 × 10+7. The Reynolds number Re was calculated according to Nonnenmacher et al. [19,20]. Values for different inlet areas of the Mini SDX range from approximately 2000 to 3000. Smaller differences with values from around 1500 to 2000 are estimated for changes in Ai of the SK, while no significant changes were observed for different Ao with relatively constant values of around 1550.
3.2.2. Atomization Experiments at Industrial-Scale
To investigate Hypothesis 3, atomization experiments were conducted at industrial-scale. In lieu of the Mini SDX for pilot-scale trials, the larger SDX V nozzle was used with three different inlet port slots, commonly used for smaller industrial-scale productions.
Similar to the results at pilot-scale, the ODSDs for the SDX V showed monomodal distributions for all parameter combinations, and are shown in Appendix C. The distributions at industrial-scale are slightly wider than the distributions at pilot-scale. These minor differences are most likely caused due to different measurement instruments and emulsification machines at industrial-scale. Atomization was performed at 5, 10, and 20 MPa, though for certain nozzle combinations, a proper atomization could not be ensured at 5 MPa. In these cases, the lowest atomization pressure at which flow was stable was chosen instead. Values of key parameters for atomization are depicted in Table 5, and are exemplary for 10 MPa. The results for the volume flow rate QL, mean liquid velocity , film thickness t, and discharge coefficient Cd all show similar trends compared to the pilot-scale experiments (Table 3) for changes in Ai as well as Ao.
Table 5.
Values for key parameters for throughput characteristics at 10 MPa for all industrial-scale nozzle geometries.
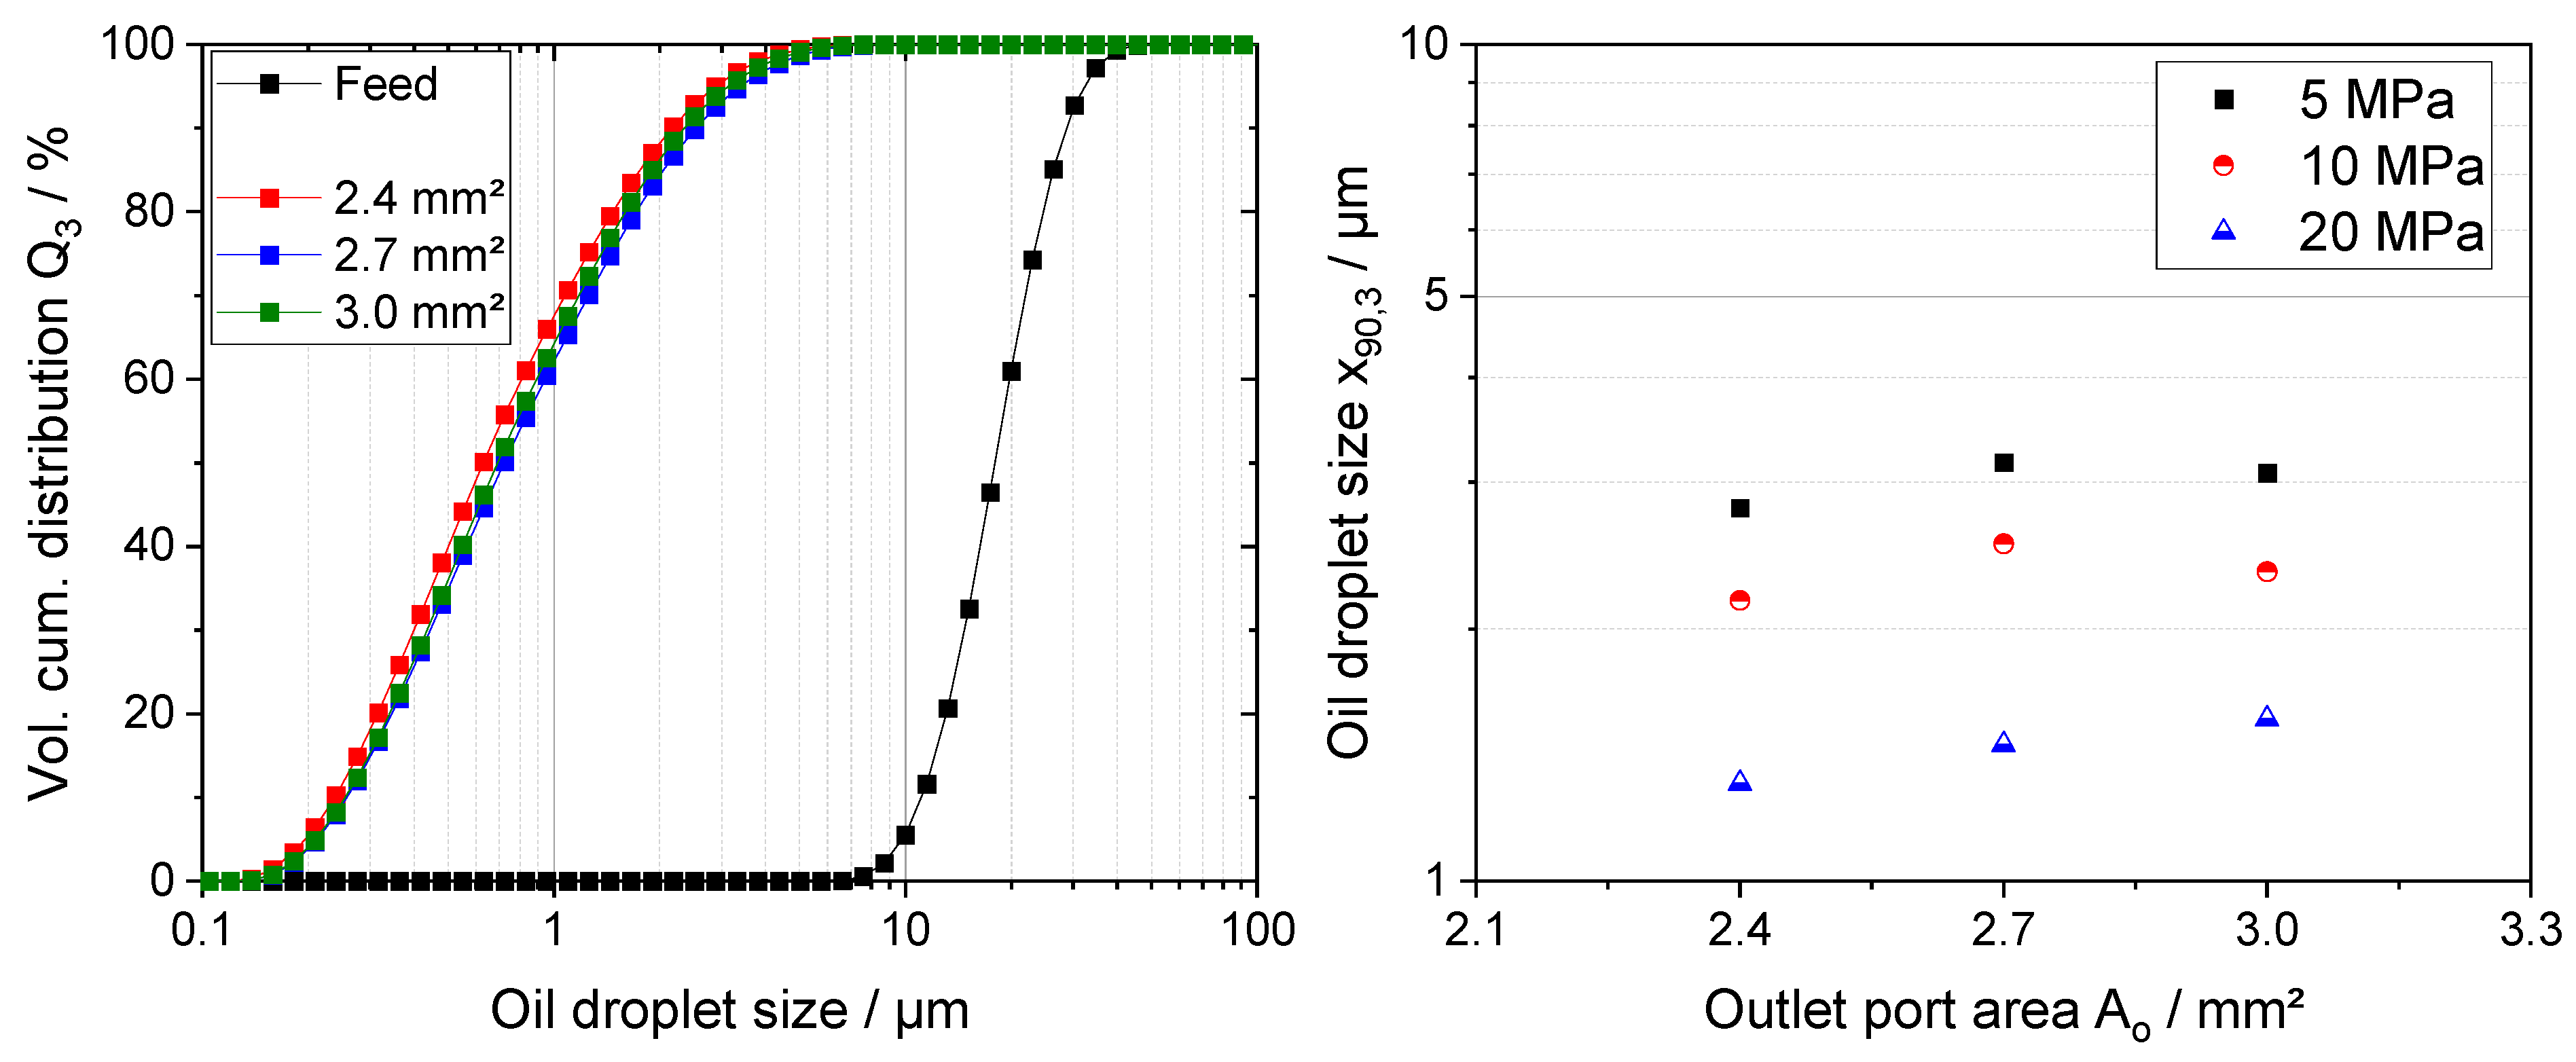
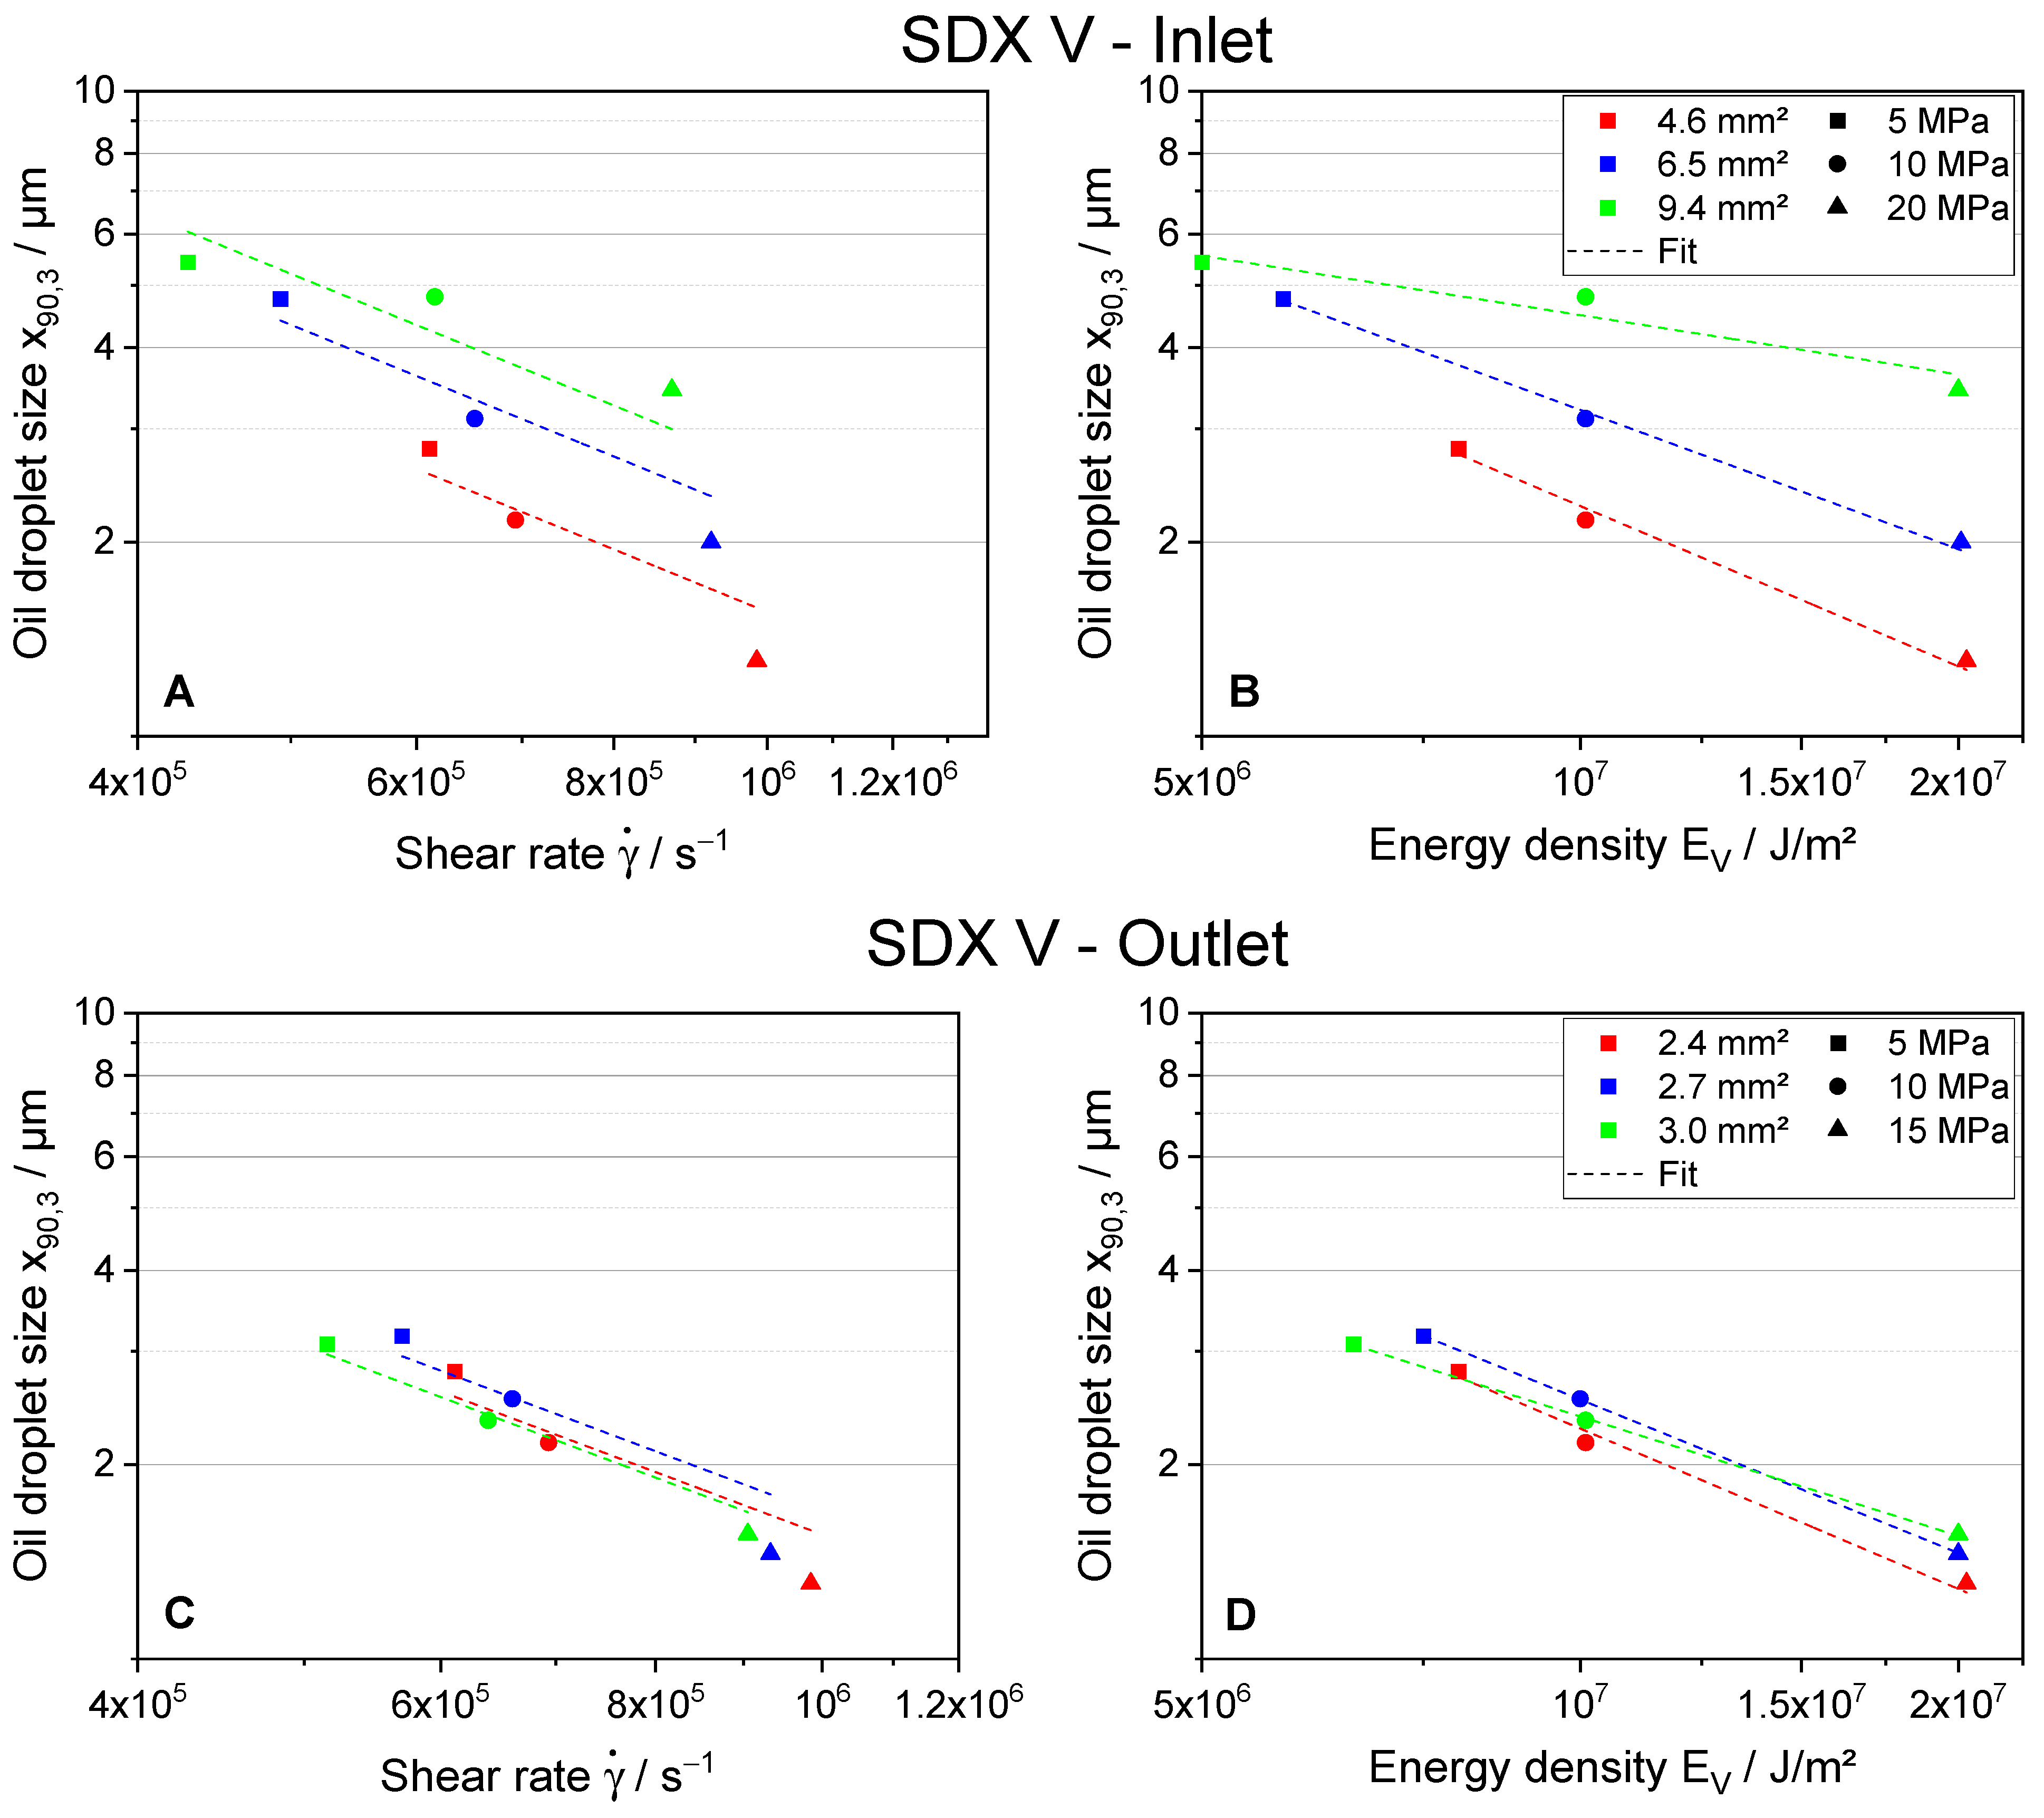
Figure 7 presents the values of x90,3 plotted against the estimated shear rates and energy density for different inlet ports (A and B) and outlet orifices (C and D) at atomization pressures Δp from 5 to 20 MPa. Analysis of the data for each nozzle configuration of the SDX V reveals a reduction in ODS with increasing Δp. Looking at the results on the impact of different inlet ports (Figure 7A,B) at constant Δp, the ODS also decreases with decreasing Ai. For changes in Ao, the results are depicted in Figure 7C,D. Generally, no clear trend was observed. Additionally, changes in Ai lead to overall larger differences in ODS compared to different Ao.
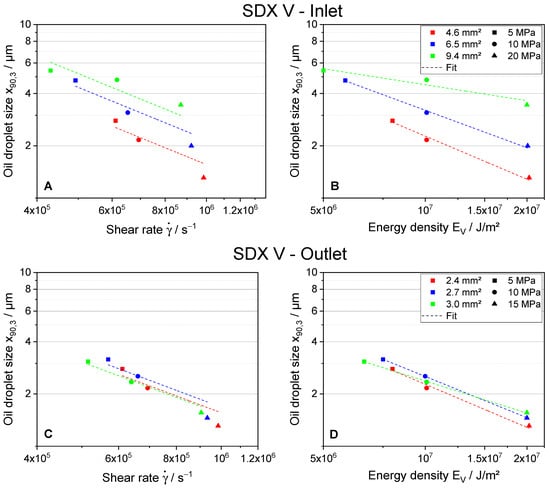
Figure 7.
Values of x90,3 against different estimated shear rates (A,C) and energy density (B,D) for different inlet ports (A,B) and outlet orifices (C,D) of the SDX V.
The data plotted against the shear rate were fitted with Equation (2). The resulting fits are depicted in Figure 7A,C, while R2, C, and b are presented in Table 6. The coefficients of determination are generally in a range of 0.87 to 0.97, with the exception of a lower R2 value of 0.56 when atomizing with the largest inlet port of 9.4 mm2. The values of Cacr increase from 0.36 to 0.60 with increasing Ai, whereas they remain relatively constant at around 0.35 to 0.39 for different Ao. The energy density model was also applied to analyse the scaled-up experimental data and to validate flow characteristics within the nozzle outlet channel. The data were fitted using Equation (4). The calculated fits are shown in Figure 7B,D), and the resulting R2, slope C, and exponent b are presented in Table 6. The fit matches the experimental data exceptionally well, as an R2 of around 0.99 was obtained for most component combinations. Only the fit for an inlet port area of Ai = 9.4 mm2 exhibits a lower R2 of 0.93. The slope C decreases from 1.38 × 10+6 to 6.21 × 10+2 for larger Ai, and from 1.38 × 10+7 to 4.76 × 10+4 for larger Ao. The Reynolds numbers Re were estimated to increase from approximately 4000 to 6000 for different Ai. A change in Ao had no impact on Re, with all values around 4150.
Table 6.
Values for coefficients of determination and estimated Cacr for the fit to Equation (2), as well as coefficients of determination, slope C, and exponent b for the fit to Equation (4) for all industrial-scale nozzle geometries.
4. Discussion
Before going into detailed discussion of the hypotheses, the overall impact of atomization pressure Δp on the ODS is discussed. As the ODS exhibits a narrow and monomodal distribution for all investigated nozzle components, the impact of nozzle geometry and atomization pressure will be discussed further using the characteristic value x90,3 of the droplet size distributions. Considering the individual nozzle configurations, the x90,3 values decrease with increasing Δp and therefore increasing EV, as more energy is available for droplet breakup when atomizing at higher pressures. The coefficients of determination R2 for all investigated nozzle configurations showed values from R2 = 0.83 − 0.97 using the model of Taboada et al. [7]. Similar values for R2 were reported in the literature [8] using the same model system containing MCT-oil. This confirms that the model describes the impact of changes in the atomization pressure on the ODS in a reasonable manner for all nozzle configurations.
Hypothesis 1.
Influence of Changes of Inlet Area Ai on Oil Droplet Breakup.
Decreasing the inlet port area resulted in a reduction of film thickness t and mean liquid velocity for both the Mini SDX and SK (Table 3). Based on these results, no unambiguous expectation on shear rates in the outlet orifice can be extracted, as t and counteract each other. The results for the Mini SDX showed a decrease in x90,3 values with decreasing Ai (Figure 6A). This result implies an increase in shear rates, which is confirmed by the values for the shear rates estimated using the model of Taboada et al. [7]. As a smaller Ai leads to larger shear rates and increased oil droplet breakup at a constant pressure, the expected trend from Hypothesis 1 is not observed for the Mini SDX. Nonetheless, the observed trend for the estimated shear rates fit to the data of the ODS. This is generally not the case for the SK. While an increase in estimated shear rates for smaller Ai is observed for the SK as well (Figure 6C), the ODS does not correlate with the increased shear rates as expected. No clear trend for the ODS depending on the shear rates at constant atomization pressure can be observed. Given the fundamental differences in construction between the Mini SDX and SK, it is assumed that different flow characteristics in the nozzles are responsible for this observation.
To further describe and evaluate the experimental data, the energy density model was employed to assess possible alterations in flow characteristics when atomizing with different nozzle configurations (Figure 6B,D,F). The results for b, C, and R2 (Table 4) already demonstrate the weakness and the strength of this model. The empirical determination of the values b and C compromises theoretical prediction potential, but enhances the model’s ability to fit the experimental data with a higher coefficient of determination R2. This reflects the higher degree of freedom of the energy density model with its two variables (Equation (4)) compared to the model of Taboada et al. [7]. For the Mini SDX, the values for b decrease from the smallest inlet port to the largest at almost constant values for C, potentially indicating a transition in flow characteristics from laminar flow to a more transitional flow (Table 4). This is corroborated by the estimated values for the Reynolds number Re, which also suggest a flow in the transitional regime. A shift in flow characteristics might contribute to the deviation of the Mini SDX results to the anticipated outcome according to Hypothesis 1. In contrast, the energy density model only provides limited additional insights for different Ai of the SK. Only minor differences in b are observed between the different inlet ports at near constant C, in addition to the impact on Re being lower.
Hypothesis 2.
Influence of Changes of Outlet Area Ao on Oil Droplet Breakup.
To investigate if the model by Taboada et al. [7] is specifically limited for SK inlet port variations or for the SK as a whole, atomization experiment using different outlet orifices were conducted. Looking at the results (Figure 6E), the estimated shear rates increase for both decreasing Ao at constant Δp, as well as for increasing Δp at constant Ao. Based on Hypothesis 2, the ODS would be anticipated to decrease with increasing shear rates. Contrary to this expectation, the ODS increases with increasing estimated shear rates for changes in Ao at constant Δp. The model’s simplicity may hinder a reliable estimation of the main stresses responsible for oil droplet breakup. Critical effects such as viscous losses may be misrepresented, leading to shear rate trends not matching the experimental results. Additionally, the flow characteristics and stress profiles throughout the whole nozzle could play a more significant role for droplet breakup than previously anticipated, and should be considered for prediction of oil droplet breakup. The assumption that other zones besides the nozzle orifice influence oil droplet breakup contradicts common reports from the literature [19,20]. It is generally assumed that stresses in the outlet orifice are sufficiently high to override the impact of the rest of the nozzle. This assumption is also challenged by Ballesteros and Gaukel [34]. The authors investigated the local shear and elongation stress as well as stress histories in comparable geometries of the Mini SDX and SK by means of computational fluid dynamics simulation. The results showed that not only in the outlet region of a nozzle high shear rates can be expected, but also in the inlet area. As the oil droplets are larger when they pass the inlet area, a first breakup may happen at this point. In addition, the authors gave a detailed analysis of the stresses and found out that especially in the inlet region, elongational stresses can dominate the breakup. They proposed that oil droplet breakup may happen as a two-step process. A first droplet breakup happens in the inlet ports mainly due to elongational stresses, while another droplet breakup may occur due to shear stresses in the nozzle outlet orifice. This more complex breakup mechanism obviously cannot be properly captured by the simplified model from Taboada et al. [7].
The energy density model shows only minor differences in the exponent b for changes in Ao of the SK at near constant values of C. This indicates similar breakup mechanisms in the outlet orifice, further supporting the assumption that it is an oversimplification to solely investigate the shear rates in the outlet orifice to describe and try to predict oil droplet breakup in pressure-swirl nozzles.
Hypothesis 3.
Scale-up to Industrial Applications.
For scale-up to industrial conditions, the SDX V was chosen for its geometrical similarities to the Mini SDX. The results for the impact of changes in the SDX V on x90,3 align with anticipation based on pilot-scale findings using the Mini SDX. The x90,3 values decrease with higher shear rates. This indicates that the fundamental principles remain valid even for nozzles accommodating larger volume flow rates.
The pilot-scale results demonstrate that the applicability of the model of Taboada et al. [7] is highly dependent on the nozzle that is used. While it failed to accurately capture the impact of different nozzle configurations for the SK, it yielded reasonable results for the Mini SDX for both changes in Δp as well as Ai. To assess if the model applies to SDX-type nozzles at industrial volume flow rates as well, the experimental data of the SDX V was fitted according to the shear-rate-based model proposed by Taboada et al. (Equation (2)). The obtained values of R2 showed generally similar results to the reported R2 for model systems containing MCT oil of [8]. This confirms that the model describes the impact of changes in the atomization pressure on the ODS in a reasonable manner for all nozzle configurations.
Given the assumption of a simple shear flow in quasi-steady state, and that the composition and thus viscosity, as well as interfacial tension, were the same for all experiments, the critical capillary number is constant at Cacr,th = 0.7. Using the estimated shear rate and measured x90,3 values, a value for Cacr was calculated and compared to Cacr,th. These values would ideally coincide, assuming that the model correctly calculates the shear rates. This is not the case for the Mini SDX, as all values of Cacr were above the theoretical value of Cacr,th = 0.7, indicating that the model overestimates the acting shear rates. It is essential to note that the calculated shear rates are maximum shear rates and are neglecting any potential viscous losses that occur at these high-pressure applications, possibly leading to the overestimation of the shear rates. For the SDX V nozzle, the calculated critical capillary numbers Cacr of 0.36 to 0.60 are lower than the expected theoretical value of 0.7, suggesting that shear rates were underestimated by the model. It has to be noted that the calculation of the capillary number assumes a spherical droplet in equilibrium conditions. This is likely not the case, as it was shown by Ballesteros and Gaukel [34] that oil droplets are already partially broken up in the inlet port of the nozzle. Another notable observation is in cases where larger oil droplets were observed despite larger estimated shear rates, both at pilot- and industrial-scale (Figure 6A). A possible explanation could be an insufficient residence time of the oil droplets in the high-stress zone of the nozzle orifice. Based on the results of Ballesteros and Gaukel [34], this is likely not the case, as the residence time in the nozzle orifice is expected to be much higher than the critical breakup time of oil droplets.
To investigate the potential of extrapolating the results from pilot-scale to industrial-scale, the ODSs obtained at specific shear rates are compared for the Mini SDX and SDX V nozzle. One would assume the shear rates to be in a similar range for both nozzles, given the similar magnitude of ODS after atomization. However, the shear rates are estimated to be about four times smaller in the SDX V compared to the Mini SDX. This shows, again, that the values for the estimated shear rates cannot be extrapolated to predict ODS when using a different nozzle or different nozzle components, falsifying Hypothesis 3. As the model fails to accurately predict shear rates, the correlation between shear rates and ODS needs to be investigated for each geometry individually.
The energy density model was employed to assess possible changes in flow characteristics when atomizing with different nozzle configurations of the SDX V. Furthermore, the results show excellent coefficients of determination R2 for the fitted data, with values of up to 0.99. Similar to the Mini SDX, a major decrease in b for decreasing Ai can be observed for the SDX V. In case of the SDX V, the results show a change from droplet breakup in a relatively laminar flow b = 0.83 to a value of 0.31, which is commonly associated with droplet breakup in a more turbulent regime. These results alone do not allow the conclusion that droplet breakup occurs in a turbulent flow regime, a notion that is reinforced when taking the greatly varying results for the constant C into account. As the results using the energy density model are inconclusive, the calculated Reynolds numbers (Table 6) are considered as well. The results show a shift in the Reynolds numbers also indicating a change in flow characteristics. The impact of a change in Ao on the key parameters b and Re is comparatively much smaller.
The energy density model was used to investigate flow characteristics within the nozzles, giving insight into oil droplet breakup mechanisms. Theoretically, it can also be used for extrapolating known relations from a small-scale nozzle to a larger nozzle, offering an alternative parameter for scale-up. However, certain prerequisites have to be met. Firstly, sufficiently high stresses need to act for a sufficient time for breakup to occur. This was shown by Ballesteros and Gaukel [34] to be the case for pilot-scale nozzles. Secondly, the flow conditions responsible for oil droplet breakup have to be similar. The energy density model shows dramatically different values for the slope C and the exponent b when comparing the Mini SDX and SDX V, highlighting the differences in flow characteristics between the pilot- and industrial-scale nozzles. This demonstrates why no reliable prediction of oil droplet breakup can be obtained using the theoretical models.
5. Conclusions
This study focused on the impact of nozzle geometry of pressure-swirl nozzles on oil droplet breakup during atomization of emulsions. Objects of the investigations were at pilot-scale an SK nozzle with an axial inlet and a Mini SDX nozzle with a tangential inlet. A model [7] was employed to estimate the shear stresses inside different nozzles in an idealized and simplified manner, and draw conclusions on oil droplet breakup and oil droplet size after atomization. To gain further insight regarding oil droplet breakup mechanisms and flow conditions in the different nozzles, the energy density model following Karbstein [16] and Stähle et al. [29] was used. To explore the applicability of the findings at industrial-scale, the SDX V nozzle was selected. It was hypothesized that final ODS after atomization depends on the shear rate in the nozzle outlet under the condition that equilibrium conditions can be achieved. Therefore, this study examined different inlet ports, outlet orifices, and atomization pressures, focusing on throughput characteristics, estimated shear rates, and ODS after atomization.
The discharge coefficient generally decreased with higher atomization pressures, smaller inlet areas Ai, and larger outlet areas Ao. Notably, changes in the inlet port area significantly influenced final ODS for the Mini SDX, as the ODS decreases with smaller inlet port areas and higher shear rates in contrast to the anticipation of Hypothesis 1. In contrast to Hypothesis 2, a decrease of the outlet orifice area of the SK leads to an increase in ODS, even though the estimated shear rates increased. These findings suggest that the flow characteristics in high-stress zones besides the nozzle outlet orifice, such as the inlet ports, may play a crucial role in oil droplet breakup. Applying these principles to larger volume flow rates using the industrial-scale SDX V nozzle generally reflected the principles found in pilot-scale.
In general, the simplified model of Taboada et al. [7] showed acceptable agreement with ODS results for describing the impact of the atomization pressure. The model also showed acceptable agreement for the results obtained with the SDX V, obtaining fits with a similar coefficient of determination compared to pilot-scale. However, the model was not able to properly predict the impact of changes in the nozzle geometry on oil droplet breakup in pressure-swirl nozzles, ultimately falsifying Hypothesis 3. It is assumed that the limitations of the model are two-fold. On one hand, the results by the energy density model indicate changing flow characteristics. On the other hand, the relationship between shear rate and ODS needs to be established for each nozzle individually. The energy density model generally proved to be more effective in describing oil droplet sizes depending on atomization pressure, as it has a higher degree of freedom with its two variables.
To validate the observed phenomena and gain further insight into the flow characteristics in the atomizer, local stress histories during atomization should be deduced over the whole nozzle geometry for different nozzle configurations. This could give further insight into the dominating stresses leading to oil droplet breakup, namely, shear or elongation stresses. The knowledge gained could be used to improve predictions of oil droplet breakup.
This study provides valuable insights into the influence of nozzle geometry and dimensions on oil droplet breakup during atomization of emulsions. Exploring different nozzle geometries and investigating the scale-up potential of the observed phenomena, these findings open avenues for further research, utilizing further CFD simulations to unravel flow characteristics in the nozzle, as well as the impact of changes in nozzle geometry on the stress history of an oil droplet.
Author Contributions
Conceptualization, S.H. and V.G.; methodology, S.H., M.L.T., J.S. and C.G.; formal analysis, S.H.; investigation, S.H., M.L.T. and J.S.; resources, J.S. and V.G.; data curation, S.H.; writing—original draft preparation, S.H.; writing—review and editing, S.H., M.L.T., J.S., C.G., H.P.K. and V.G.; visualization, S.H.; supervision, V.G.; project administration, V.G.; funding acquisition, V.G. All authors have read and agreed to the published version of the manuscript.
Funding
Funding of the research project (AiF 21539 N) within the programme for promoting the Industrial Collective Research (IGF) of the German Federal Ministry for Economic Affairs and Climate Action (BMWK), supported via the Research Association of the German Food Industry (FEI) based on a resolution of the German Parliament.
Data Availability Statement
Data are contained within the article.
Acknowledgments
The authors would like to thank Danone Nutricia Research for providing the facilities for the industrial-scale trials and the trial support of Marcel Arbon and Memet Ustunel. The authors acknowledge support by the KIT-Publication Fund of the Karlsruhe Institute of Technology.
Conflicts of Interest
The authors declare no conflicts of interest. The funders had no role in the design of the study; in the collection, analyses, or interpretation of data; in the writing of the manuscript; or in the decision to publish the results.
Appendix A. Overview of Liquid Film Thickness during Atomization Experiments
Table A1.
Values of liquid film thickness t for all atomization experiments.
Table A1.
Values of liquid film thickness t for all atomization experiments.
| Mini SDX Inlet Port Area | 0.6 mm2 | 1.1 mm2 | 1.5 mm2 | 2.0 mm2 |
|---|---|---|---|---|
| 5 MPa | 96.73 | 107.83 | 122.07 | 124.70 |
| 10 MPa | 91.75 | 102.77 | 120.85 | 127.54 |
| 15 MPa | 88.08 | 97.37 | 109.85 | - |
| 20 MPa | 82.50 | 91.63 | - | - |
| 25 MPa | 78.81 | - | - | - |
| SK inlet port area | 0.2 mm2 | 0.3 mm2 | 0.6 mm2 | - |
| 5 MPa | 81.69 | 82.34 | 91.80 | - |
| 10 MPa | 78.38 | 82.76 | 88.41 | - |
| 20 MPa | 71.57 | 76.15 | 82.50 | - |
| SK outlet port area | 0.4 mm2 | 0.5 mm2 | 0.8 mm2 | 1.2 mm2 |
| 5 MPa | 75.44 | 81.69 | 85.58 | 92.32 |
| 10 MPa | 73.09 | 78.38 | 82.88 | 91.71 |
| 15 MPa | 69.49 | 75.48 | 78.70 | 87.23 |
| 20 MPa | 66.88 | 71.57 | 76.22 | 83.55 |
| 25 MPa | 64.05 | 67.81 | 72.27 | 80.07 |
| SDX V inlet port area | 4.6 mm2 | 6.5 mm2 | 9.4 mm2 | - |
| 5 MPa | 250.70 | 283.94 | 325.26 | - |
| 10 MPa | 245.61 | 280.39 | 319.48 | - |
| 20 MPa | 244.57 | 281.10 | 317.05 | - |
| SDX V outlet port area | 2.4 mm2 | 2.7 mm2 | 3.0 mm2 | - |
| 5 MPa | 250.70 | 255.23 | 259.36 | - |
| 10 MPa | 245.61 | 252.84 | 257.52 | - |
| 20 MPa | 244.57 | 253.55 | 254.07 | - |
Appendix B. Overview of Volume Flow Rate during Atomization Experiments
Table A2.
Values of volume flow rate QL for all atomization experiments.
Table A2.
Values of volume flow rate QL for all atomization experiments.
| Mini SDX Inlet Port Area | 0.6 mm2 | 1.1 mm2 | 1.5 mm2 | 2.0 mm2 |
|---|---|---|---|---|
| 5 MPa | 0.40 | 0.46 | 0.52 | 0.53 |
| 10 MPa | 0.53 | 0.61 | 0.73 | 0.78 |
| 15 MPa | 0.62 | 0.70 | 0.81 | - |
| 20 MPa | 0.66 | 0.75 | - | - |
| 25 MPa | 0.69 | - | - | - |
| SK inlet port area | 0.2 mm2 | 0.3 mm2 | 0.6 mm2 | - |
| 5 MPa | 0.32 | 0.33 | 0.38 | - |
| 10 MPa | 0.43 | 0.47 | 0.51 | - |
| 20 MPa | 0.54 | 0.59 | 0.66 | - |
| SK outlet port area | 0.4 mm2 | 0.5 mm2 | 0.8 mm2 | 1.2 mm2 |
| 5 MPa | 0.26 | 0.32 | 0.40 | 0.50 |
| 10 MPa | 0.35 | 0.43 | 0.54 | 0.70 |
| 15 MPa | 0.40 | 0.51 | 0.62 | 0.80 |
| 20 MPa | 0.45 | 0.54 | 0.68 | 0.87 |
| 25 MPa | 0.47 | 0.57 | 0.71 | 0.92 |
| SDX V inlet port area | 4.6 mm2 | 6.5 mm2 | 9.4 mm2 | - |
| 5 MPa | 4.88 | 4.93 | 5.50 | - |
| 10 MPa | 5.33 | 6.40 | 7.63 | - |
| 20 MPa | 7.52 | 9.07 | 10.63 | - |
| SDX V outlet port area | 2.4 mm2 | 2.7 mm2 | 3.0 mm2 | - |
| 5 MPa | 4.88 | 5.02 | 4.97 | - |
| 10 MPa | 5.33 | 5.72 | 6.08 | - |
| 20 MPa | 7.52 | 8.12 | 8.4 | - |
Appendix C. Q3-Distributions of the ODS for Atomization Experiments
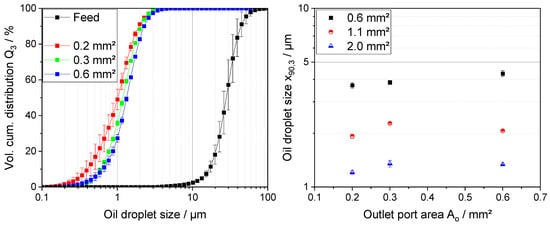
Figure A1.
ODSD for the atomization with different inlet ports of the SK nozzle at a constant atomization pressure of 10 MPa.
Figure A1.
ODSD for the atomization with different inlet ports of the SK nozzle at a constant atomization pressure of 10 MPa.
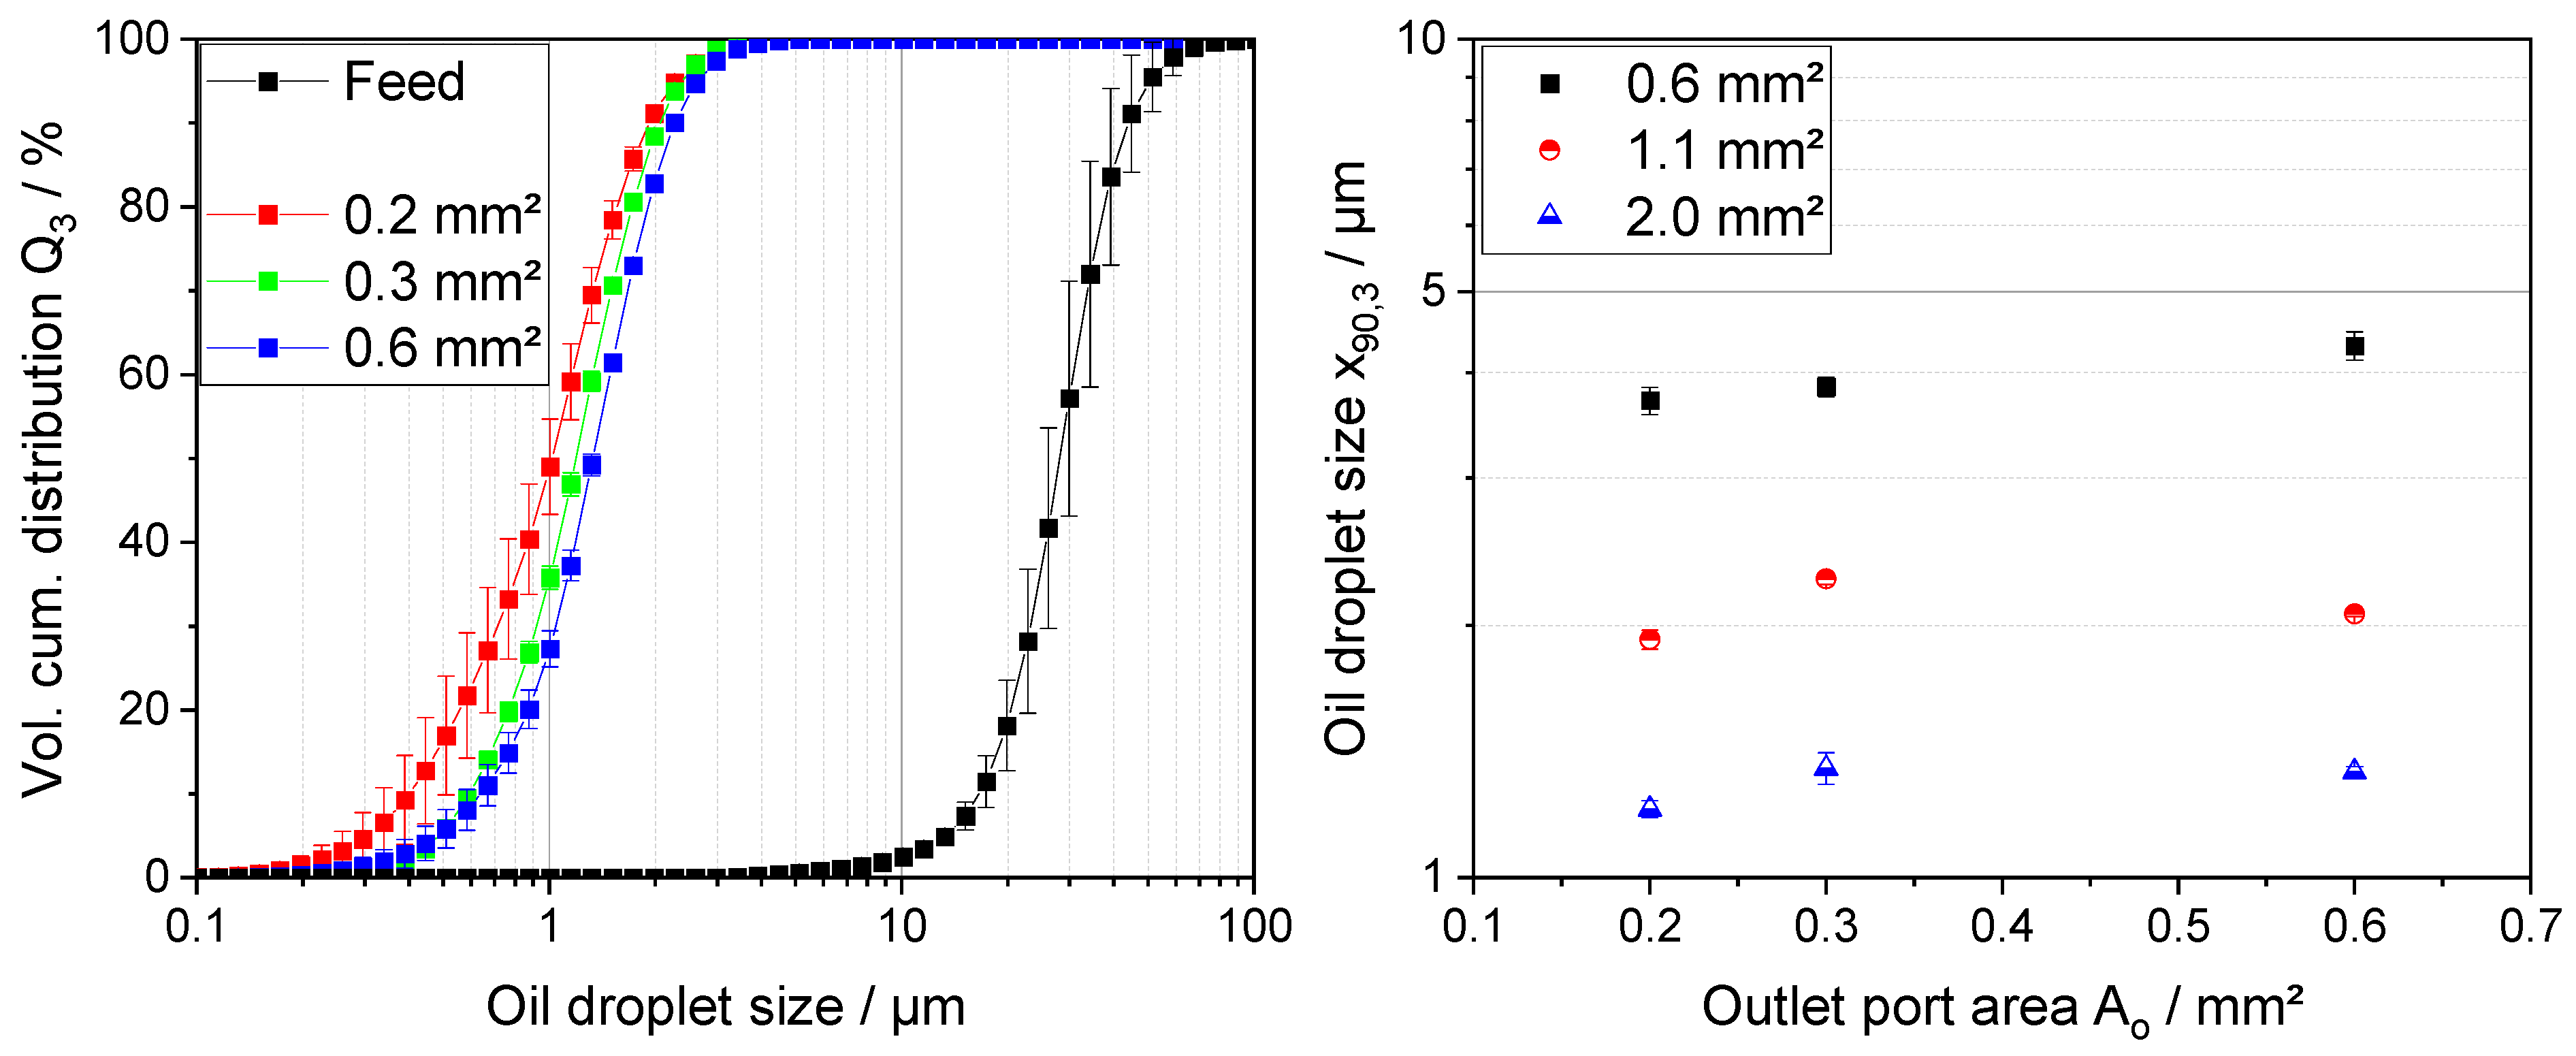
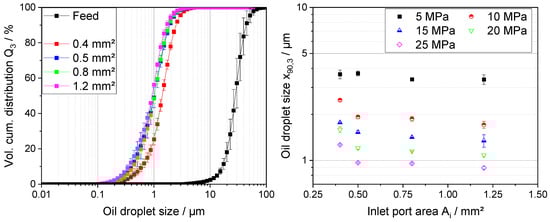
Figure A2.
ODSD for the atomization with different outlet ports of the SK nozzle at a constant atomization pressure of 10 MPa.
Figure A2.
ODSD for the atomization with different outlet ports of the SK nozzle at a constant atomization pressure of 10 MPa.
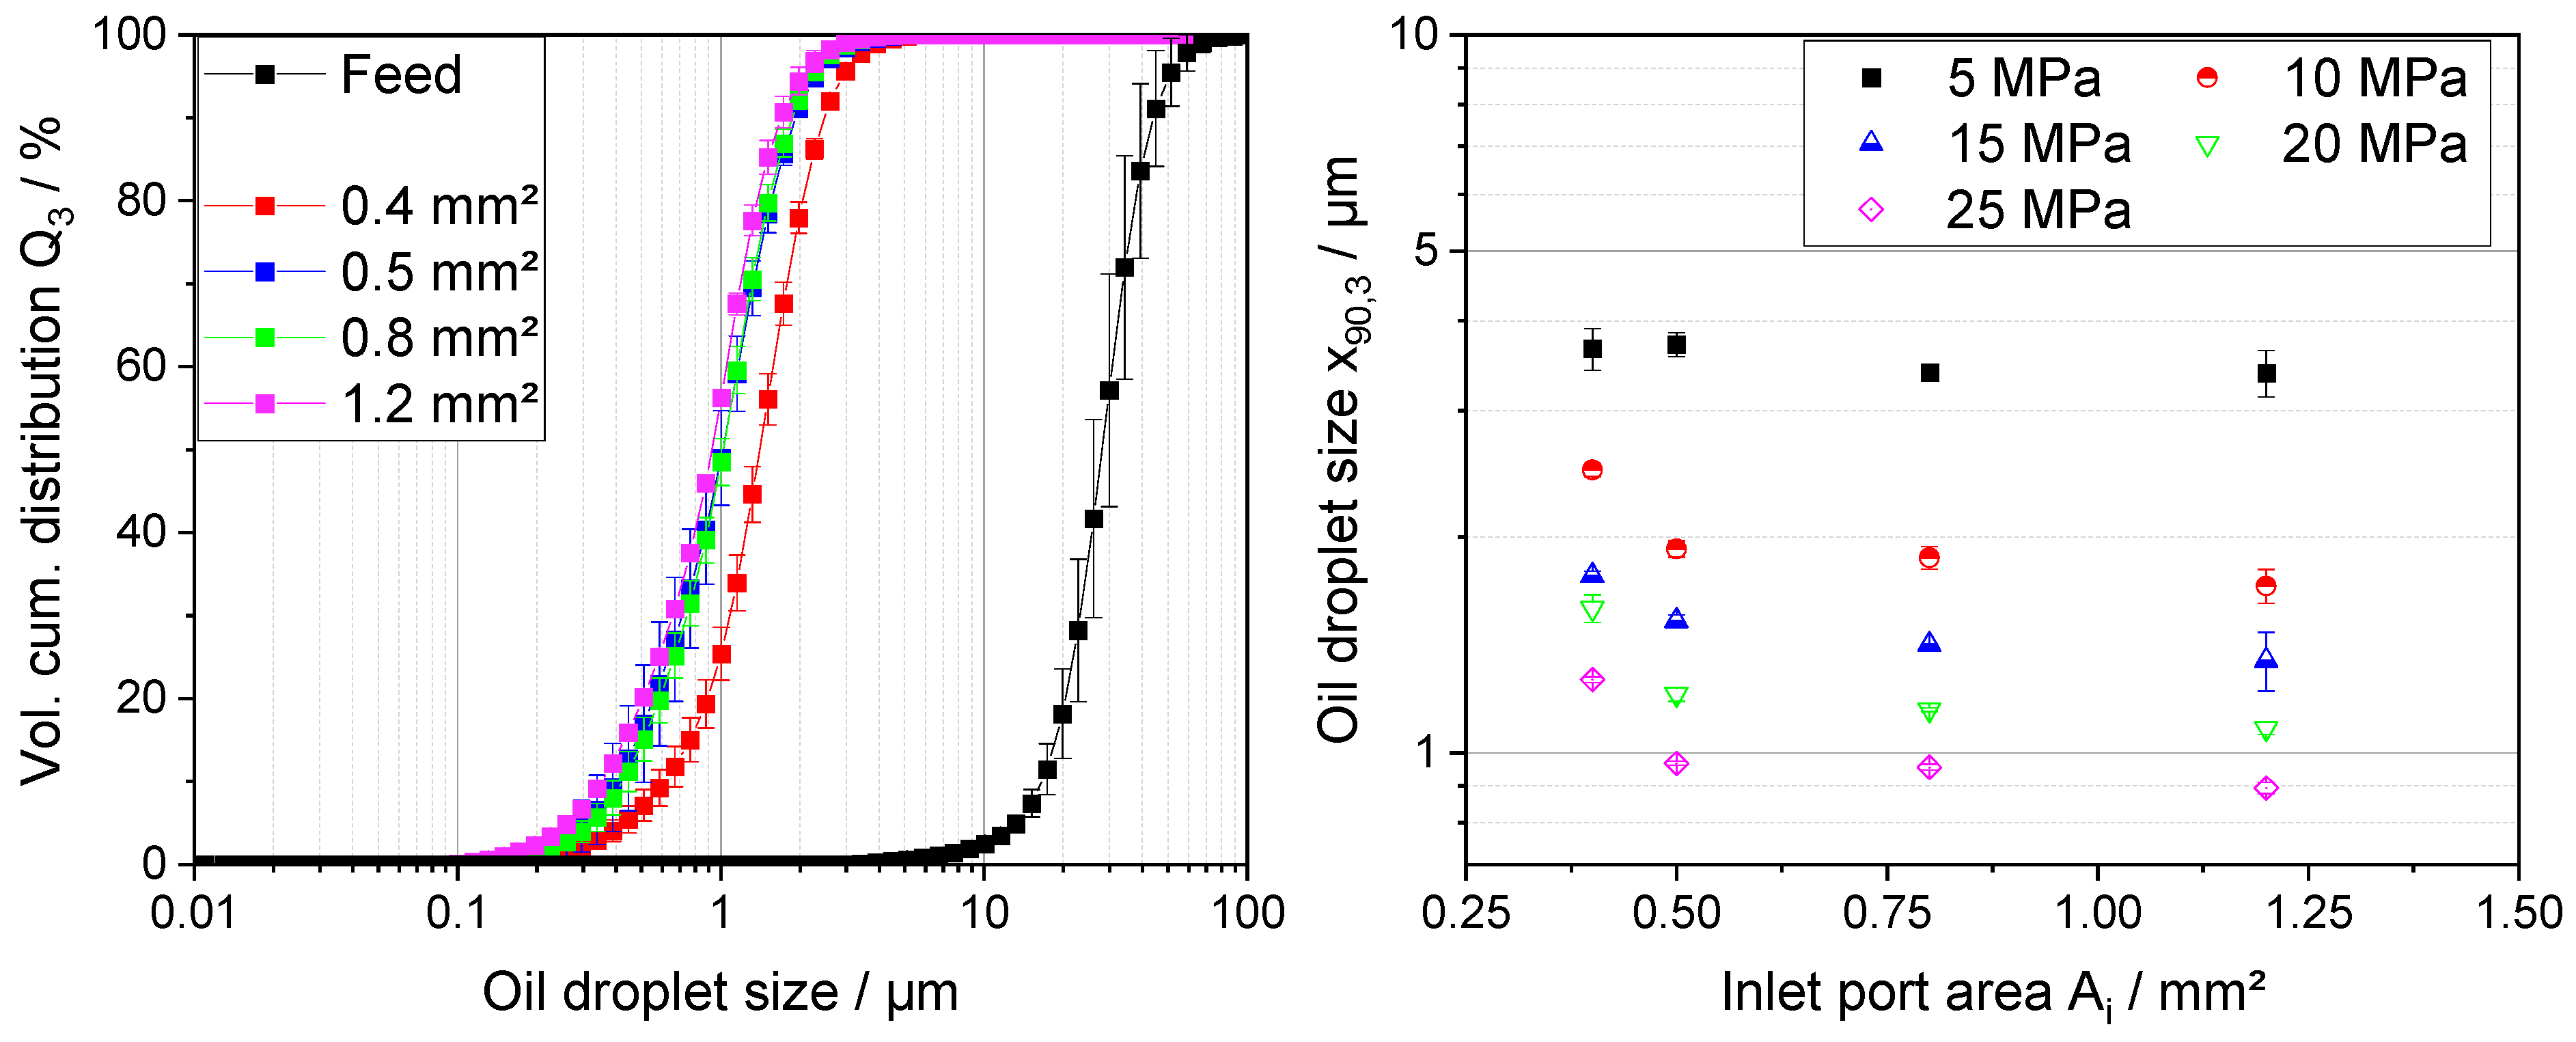
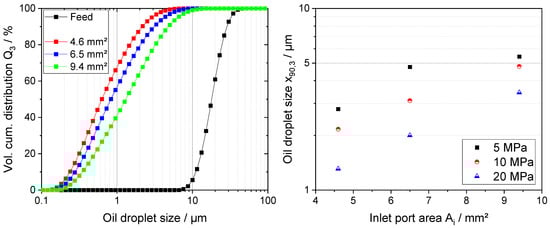
Figure A3.
ODSD for the atomization with different inlet ports of the SDX V nozzle at a constant atomization pressure of 10 MPa.
Figure A3.
ODSD for the atomization with different inlet ports of the SDX V nozzle at a constant atomization pressure of 10 MPa.
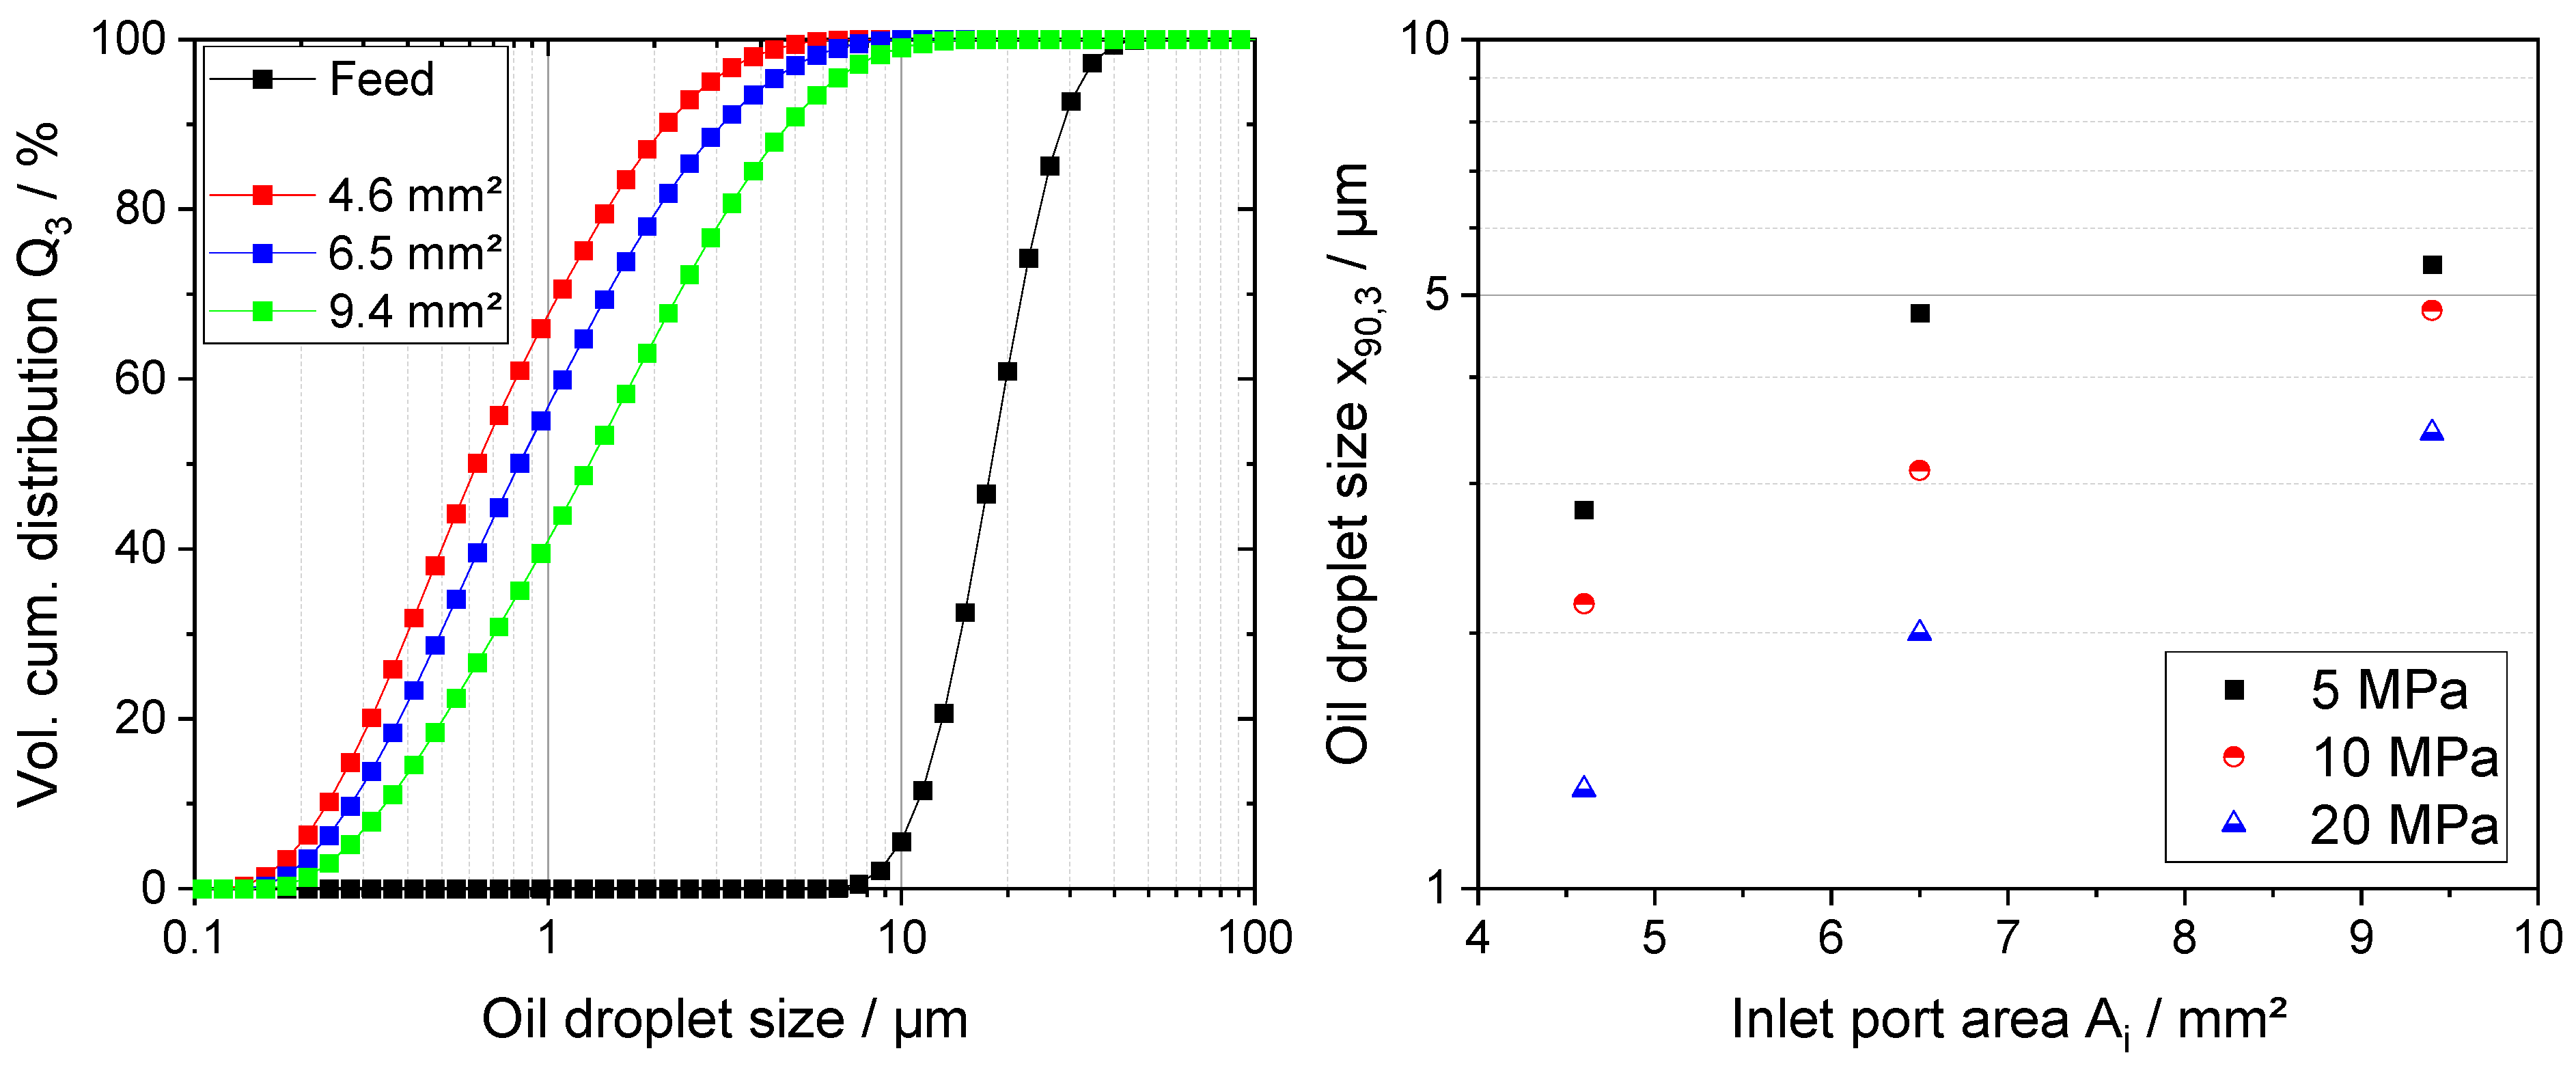
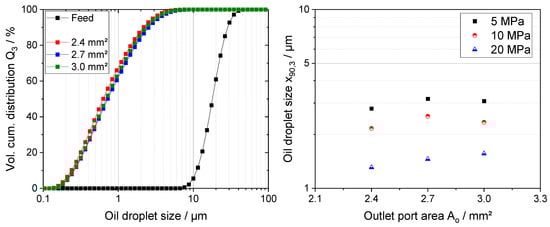
Figure A4.
ODSD for the atomization with different outlet ports of the SDX V nozzle at a constant atomization pressure of 10 MPa.
Figure A4.
ODSD for the atomization with different outlet ports of the SDX V nozzle at a constant atomization pressure of 10 MPa.
Appendix D. Overview of Estimated Shear Rates during Atomization Experiments
Table A3.
Values of shear rates for all atomization experiments.
Table A3.
Values of shear rates for all atomization experiments.
| Mini SDX Inlet Port Area | 0.6 mm2 | 1.1 mm2 | 1.5 mm2 | 2.0 mm2 |
|---|---|---|---|---|
| 5 MPa | 1.85 × 10+6 | 1.76 × 10+6 | 1.66 × 10+6 | 1.64 × 10+6 |
| 10 MPa | 2.69 × 10+6 | 2.55 × 10+6 | 2.36 × 10+6 | 2.29 × 10+6 |
| 15 MPa | 3.35 × 10+6 | 3.20 × 10+6 | 3.03 × 10+6 | - |
| 20 MPa | 3.99 × 10+6 | 3.80 × 10+6 | - | - |
| 25 MPa | 4.55 × 10+6 | - | - | - |
| SK inlet port area | 0.2 mm2 | 0.3 mm2 | 0.6 mm2 | - |
| 5 MPa | 1.86 × 10+6 | 1.83 × 10+6 | 1.71 × 10+6 | - |
| 10 MPa | 2.69 × 10+6 | 2.58 × 10+6 | 2.46 × 10+6 | - |
| 20 MPa | 3.96 × 10+6 | 3.79 × 10+6 | 3.59 × 10+6 | - |
| SK outlet port area | 0.4 mm2 | 0.5 mm2 | 0.8 mm2 | 1.2 mm2 |
| 5 MPa | 2.06 × 10+6 | 1.86 × 10+6 | 1.68 × 10+6 | 1.54 × 10+6 |
| 10 MPa | 2.95 × 10+6 | 2.69 × 10+6 | 2.41 × 10+6 | 2.18 × 10+6 |
| 15 MPa | 3.69 × 10+6 | 3.35 × 10+6 | 3.01 × 10+6 | 2.74 × 10+6 |
| 20 MPa | 4.34 × 10+6 | 3.96 × 10+6 | 3.53 × 10+6 | 3.22 × 10+6 |
| 25 MPa | 4.94 × 10+6 | 4.53 × 10+6 | 4.04 × 10+6 | 3.67 × 10+6 |
| SDX V inlet port area | 4.6 mm2 | 6.5 mm2 | 9.4 mm2 | - |
| 5 MPa | 1.48 × 10+4 | 1.04 × 10+4 | 7.91 × 10+3 | - |
| 10 MPa | 1.62 × 10+4 | 1.35 × 10+4 | 1.10 × 10+4 | - |
| 20 MPa | 2.28 × 10+4 | 1.91 × 10+4 | 1.53 × 10+4 | - |
| SDX V outlet port area | 2.4 mm2 | 2.7 mm2 | 3.0 mm2 | - |
| 5 MPa | 1.48 × 10+4 | 1.52 × 10+4 | 1.51 × 10+4 | - |
| 10 MPa | 1.62 × 10+4 | 1.73 × 10+4 | 1.84 × 10+4 | - |
| 20 MPa | 2.28 × 10+4 | 2.46 × 10+4 | 2.55 × 10+4 | - |
References
- Mujumdar, A.S. (Ed.) Handbook of Industrial Drying; CRC Press: Boca Raton, FL, USA, 2020; ISBN 9780429289774. [Google Scholar]
- Masters, K. Spray Drying in Practice; SprayDryConsult International ApS: Charlottenlund, Denmark, 2002; ISBN 87-9866-06-8-3. [Google Scholar]
- Vega, C.; Roos, Y.H. Invited Review: Spray-Dried Dairy and Dairy-Like Emulsions—Compositional Considerations. J. Dairy Sci. 2006, 89, 383–401. [Google Scholar] [CrossRef] [PubMed]
- Walzel, P. L4.4 Zerstäuben von Flüssigkeiten mit Einstoff-Druckdüsen. In VDI-Wärmeatlas; Stephan, P., Kabelac, S., Kind, M., Mewes, D., Schaber, K., Wetzel, T., Eds.; Springer: Berlin/Heidelberg, Germany, 2019; pp. 1661–1682. ISBN 978-3-662-52988-1. [Google Scholar]
- Lefebvre, A.H.; McDonell, V.G. Atomization and Sprays, 2nd ed.; CRC Press Taylor & Francis Group: Boca Raton, FL, USA; New York, NY, USA, 2017; ISBN 9781315120911. [Google Scholar]
- McClements, D.J.; Li, Y. Structured emulsion-based delivery systems: Controlling the digestion and release of lipophilic food components. Adv. Colloid Interface Sci. 2010, 159, 213–228. [Google Scholar] [CrossRef] [PubMed]
- Taboada, M.L.; Schäfer, A.-C.; Karbstein, H.P.; Gaukel, V. Oil droplet breakup during pressure swirl atomization of food emulsions: Influence of atomization pressure and initial oil droplet size. J. Food Process Eng. 2021, 44, e13598. [Google Scholar] [CrossRef]
- Taboada, M.L.; Müller, E.; Fiedler, N.; Karbstein, H.P.; Gaukel, V. Oil droplet breakup during pressure swirl atomization of emulsions: Influence of emulsion viscosity and viscosity ratio. J. Food Eng. 2022, 321, 110941. [Google Scholar] [CrossRef]
- Taboada, M.L.; Zapata, E.; Karbstein, H.P.; Gaukel, V. Investigation of Oil Droplet Breakup during Atomization of Emulsions: Comparison of Pressure Swirl and Twin-Fluid Atomizers. Fluids 2021, 6, 219. [Google Scholar] [CrossRef]
- Schröder, J.; Kleinhans, A.; Serfert, Y.; Drusch, S.; Schuchmann, H.P.; Gaukel, V. Viscosity ratio: A key factor for control of oil drop size distribution in effervescent atomization of oil-in-water emulsions. J. Food Eng. 2012, 111, 265–271. [Google Scholar] [CrossRef]
- Bolszo, C.D.; Narvaez, A.A.; McDonell, V.; Dunn-Rankin, D.; Sirignano, W.A. PRESSURE—SWIRL ATOMIZATION OFWATER-IN-OIL EMULSIONS. At. Sprays 2010, 20, 1077–1099. [Google Scholar] [CrossRef]
- Munoz-Ibanez, M.; Azagoh, C.; Dubey, B.N.; Dumoulin, E.; Turchiuli, C. Changes in oil-in-water emulsion size distribution during the atomization step in spray-drying encapsulation. J. Food Eng. 2015, 167, 122–132. [Google Scholar] [CrossRef]
- Walstra, P.; Smulders, P.E. Chapter 2. Emulsion Formation. In Modern Aspects of Emulsion Science; Binks, B.P., Ed.; Royal Society of Chemistry: Cambridge, UK, 2007; pp. 56–99. ISBN 978-0-85404-439-9. [Google Scholar]
- Písecký, J. Handbook of Milk Powder Manufacture, 2nd ed.; GEA Process Engineering A/S: Copenhagen, Denmark, 2012; ISBN 87-87036-74-6. [Google Scholar]
- Musemic, E.; Walzel, P. Durchsatzverhalten von Hohlkegeldüsen. Chem. Ing. Tech. 2011, 83, 237–246. [Google Scholar] [CrossRef]
- Karbstein, H.; Schubert, H. Developments in the continuous mechanical production of oil-in-water macro-emulsions. Chem. Eng. Process. Process Intensif. 1995, 34, 205–211. [Google Scholar] [CrossRef]
- Grace, H.P. Dispersion Phenomena in High Viscosity Immiscible Fluid Systems and Application of Static Mixers as Dispersion Devices in such Systems. Chem. Eng. Commun. 1982, 14, 225–277. [Google Scholar] [CrossRef]
- Schroën, K.; de Ruiter, J.; Berton-Carabin, C. The Importance of Interfacial Tension in Emulsification: Connecting Scaling Relations Used in Large Scale Preparation with Microfluidic Measurement Methods. ChemEngineering 2020, 4, 63. [Google Scholar] [CrossRef]
- Nonnenmacher, S.; Piesche, M. Design of hollow cone pressure swirl nozzles to atomize Newtonian fluids. Chem. Eng. Sci. 2000, 55, 4339–4348. [Google Scholar] [CrossRef]
- Rezaeimoghaddam, M.; Elahi, R.; Modarres Razavi, M.R.; Ayani, M.B. Modeling of Non-Newtonian Fluid Flow Within Simplex Atomizers. In Proceedings of the ASME 2010 10th Biennial Conference on Engineering Systems Design and Analysis, Istanbul, Turkey, 12–14 July 2010; ASME: Washington, DC, USA, 2010; Volume 3, pp. 549–556, ISBN 978-0-7918-4917-0. [Google Scholar]
- Renze, P.; Heinen, K.; Schönherr, M. Experimental and Numerical Investigation of Pressure Swirl Atomizers. Chem. Eng. Technol. 2011, 34, 1191–1198. [Google Scholar] [CrossRef]
- Bentley, B.J.; Leal, L.G. An experimental investigation of drop deformation and breakup in steady, two-dimensional linear flows. J. Fluid Mech. 1986, 167, 241. [Google Scholar] [CrossRef]
- Xue, J.; Jog, M.A.; Jeng, S.M.; Steinthorsson, E.; Benjamin, M.A. Effect of Geometric Parameters on Simplex Atomizer Performance. AIAA J. 2004, 42, 2408–2415. [Google Scholar] [CrossRef]
- Giffen, E.; Muraszew, A. The Atomisation of Liquid Fuels; Chapman & Hall: London, UK, 1953. [Google Scholar]
- Lefebvre, A.H.; Ballal, D.R. Gas Turbine Combustion: Alternative Fuels and Emissions, 3rd ed.; Taylor & Francis: Boca Raton, FL, USA, 2010; ISBN 9781420086058. [Google Scholar]
- Walzel, P. Spraying and Atomizing of Liquids. In Ullmann’s Encyclopedia of Industrial Chemistry, 6th ed.; Wiley-VCH: Weinheim, Germany, 2019. [Google Scholar]
- Halder, M.R.; Dash, S.K.; Som, S.K. Initiation of air core in a simplex nozzle and the effects of operating and geometrical parameters on its shape and size. Exp. Therm. Fluid Sci. 2002, 26, 871–878. [Google Scholar] [CrossRef]
- Kang, Z.; Wang, Z.; Li, Q.; Cheng, P. Review on pressure swirl injector in liquid rocket engine. Acta Astronaut. 2018, 145, 174–198. [Google Scholar] [CrossRef]
- Stähle, P.; Schuchmann, H.P.; Gaukel, V. Performance and Efficiency of Pressure-Swirl and Twin-Fluid Nozzles Spraying Food Liquids with Varying Viscosity. J. Food Process Eng. 2017, 40, e12317. [Google Scholar] [CrossRef]
- Schuchmann, H.P. Advances in Hydrodynamic Pressure Processing for Enhancing Emulsification and Dispersion. In Innovative Food Processing Technologies: Extraction, Separation, Component Modification and Process Intensification; Knoerzer, K., Juliano, P., Smithers, G.W., Eds.; Woodhead Publishing is an imprint of Elsevier: Duxford, UK, 2016; pp. 387–412. ISBN 9780081002988. [Google Scholar]
- Murugesan, R.; Orsat, V. Spray Drying for the Production of Nutraceutical Ingredients—A Review. Food Bioprocess Technol. 2012, 5, 3–14. [Google Scholar] [CrossRef]
- Gharsallaoui, A.; Roudaut, G.; Chambin, O.; Voilley, A.; Saurel, R. Applications of spray-drying in microencapsulation of food ingredients: An overview. Food Res. Int. 2007, 40, 1107–1121. [Google Scholar] [CrossRef]
- Sakman, A.T.; Jog, M.A.; Jeng, S.M.; Benjamin, M.A. Parametric study of simplex fuel nozzle internal flow and performance. AIAA J. 2000, 38, 1214–1218. [Google Scholar] [CrossRef]
- Ballesteros Martínez, M.Á.; Gaukel, V. Using Computation Fluid Dynamics to Determine Oil Droplet Breakup Parameters during Emulsion Atomization with Pressure Swirl Nozzles. Fluids 2023, 8, 277. [Google Scholar] [CrossRef]


Disclaimer/Publisher’s Note: The statements, opinions and data contained in all publications are solely those of the individual author(s) and contributor(s) and not of MDPI and/or the editor(s). MDPI and/or the editor(s) disclaim responsibility for any injury to people or property resulting from any ideas, methods, instructions or products referred to in the content. |
© 2024 by the authors. Licensee MDPI, Basel, Switzerland. This article is an open access article distributed under the terms and conditions of the Creative Commons Attribution (CC BY) license (https://creativecommons.org/licenses/by/4.0/).