Article

Passive Control of Vortices in the Wake of a Bluff Body

1
Center of Aviation and Space Research, Czech Technical University in Prague, Technická 4, 160 00 Prague, Czech Republic
2
Department of Mechanical and Aerospace Engineering, Politecnico di Torino, Corso Duca degli Abruzzi 24, 10129 Turin, Italy
*
Author to whom correspondence should be addressed.
Fluids 2024, 9(6), 131; https://doi.org/10.3390/fluids9060131
Submission received: 3 May 2024 / Revised: 24 May 2024 / Accepted: 28 May 2024 / Published: 31 May 2024

Abstract

:
Vortices belong to the most important phenomena in fluid dynamics and play an essential role in many engineering applications. They can act detrimentally by harnessing the flow energy and reducing the efficiency of an aerodynamic device, whereas in other cases, their presence can be exploited to achieve targeted flow conditions. The control of the vortex parameters is desirable in both cases. In this paper, we introduce an optimization strategy for the control of vortices in the wake of a bluff body. Flow modelling is based on RANS and DES computations, validated by experimental data. The algorithm for vortex identification and characterization is based on the triple decomposition of motion. It produces a quantitative measure of vortex strength which is used to define the objective function in the optimization procedure. It is shown how the shape of an aerodynamic device can be altered to achieve the desired characteristics of vortices in its wake. The studied case is closely related to flame holders for combustion applications, but the conceptual approach has a general applicability to vortex control.

1. Introduction

The identification and control of vortices is highly desirable in a wide range of engineering applications. The interaction of vortices with suspended bridges can cause vortex induced vibrations, unless proper mitigating measures are implemented [1]. Rotating vortex ropes in hydraulic turbines at partial load are known to exert pressure pulsations with the risk of detrimental effects on longevity [2]. Secondary flows in blade channels and over blade tips impact negatively the aerodynamic efficiency of turbines [3]. On the other hand, vortices can enhance the performance of an aerodynamic device, for example by delaying stall on the blades of wind turbines [4]. The listed examples show that the optimization of an aerodynamic device targeting the control of vortices has a great potential for improving its performance and operational life span.
Theoretical approaches to vortex dynamics modelling are often based on point-vortex models. The flow is assumed incompressible and inviscid, with vorticity concentrated on several singularities in an otherwise irrotational flow. Elcrat et al. [5] modelled asymmetric wakes past bluff bodies with point vortices in equilibrium and found the existence of multiple flow configurations that are representative of cross-flow past rocket bodies, delta wings and aircraft fuselages at high angle of attack. Protas [6] adopted the Föppl point vortex system to study the transition of an unstable wake flow to vortex shedding. The reduced-order model served as a basis for the development of a theoretical flow control approach. An alternative approach to low-order wake modelling was adopted by Illingworth et al. [7], who used a linearized model to study a gain window phenomenon in the active closed-loop control of vortex shedding. Point vortex models are also relevant as a simplified representation of geophysical flows. Balsa et al. [8] considered a passive particle that is convected by atmospheric circulation or oceanic currents. He approximated the flow by modelling point vortices on a sphere and formulated a control problem for the minimization of energy needed to displace the particle between two points during a fixed time.
The methods for vortex control are classified as either passive or active, depending on whether they consume energy in their operation. An older review by Mitchell and Délary [9] focuses on techniques historically applied to the control of vortex breakdown, such as mechanical devices and steady or unsteady suction or blowing. A more recent work of Rashidi et al. [10] lists various modern approaches related to the control of vortex shedding, including plasma actuators, magnetic field, rotary oscillations or thermal effects. The inspiration for novel approaches to vortex control can also be obtained by studying the physical principles used by various animals for manoeuvring. For example, Gursul and Wang [11] used imaging methods to provide insights into the mechanisms used by jellyfish for the modulation of vortex rings during turning.
The application of an optimization strategy to the direct control of vortices in real flows requires that a method for their identification and characterization is available. However, this task is complicated by the lack of a universally accepted vortex definition. Disparate physical concepts are commonly adopted to define a vortex, including regions of low pressure [12], high vorticity magnitude [13], vorticity overcoming strain [14], coherence of particle motion [15] or the swirling of a set of particles around another set of particles [16]. Depending on the underlying vortex definition, different identification techniques are obtained. Local techniques [14,17] operate on a pointwise analysis of the local flow-field, whereas non-local approaches [18,19] evaluate a finite-sized flow pattern. Some methods search for a volumetric region of vortical flow [14,19], in contrast to line-type criteria [17,20] that identify the axis or core-line of the vortex. Most methods adopt the Eulerian perspective and analyze a snapshot of the instantaneous flow field, whereas Lagrangian approaches involve particle tracking over some finite time [15,21]. A comprehensive overview of existing vortex detection methods is beyond the scope of this study and the reader is referred to the papers of Epps [22] or Günther and Theisel [23].
Most popular techniques are region-type, local and Eulerian. They are straightforward to implement and computationally cheap, but the detection of a non-local phenomenon on a pointwise basis bears inherent limitations. Methods of this type struggle to distinguish between the rotation of a particle around its own axis (shear), and the swirling of a set of particles around a common center (vortex) [16]. The outcome of vortex identification may therefore be misleading, with false positives identified in shear layers [24]. This issue is the most prominent with approaches based on vorticity magnitude, but remains significant also with the ”second generation” methods based on velocity gradient analysis, such as the Q- [14], λ 2 - [25] or Δ - [26] criterion. A superior performance in this regard offers the more recent Triple Decomposition of Motion (TDM) which performs an explicit removal of shear from the velocity gradient tensor [24]. A similar idea is also at the core of the rortex method [27], later renamed to liutex [28].
In this study, we adopt the TDM for vortex identification. The underlying idea is to reduce false positives in shear flows by subtracting a pure shear component from the velocity gradient tensor. This procedure yields a shear-free residual vorticity tensor which can be used for region-type vortex detection in a manner similar to conventional vorticity. In contrast with the scalar Q-, λ 2 - or Δ -criteria, residual vorticity is expressed by a tensor or a vector which contains information about the axis and sense of particle swirling. Additionally, the magnitude of residual vorticity corresponds to the angular velocity of rigid body rotation and represents thus a convenient measure for vortex strength. Residual vorticity provides superior performance in distinguishing shearing from swirling, but it inherits some shortcomings typical for local region-type methods. A user-specified threshold is required to determine vortex boundaries in real flows, which makes the outcome subjective. The flow-field segmentation into individual vortices is problematic and multiple different structures are often wrapped in a single bounding surface. Application of the TDM to 3D flow fields is associated with high computational costs due to a numerical iterative procedure. Indeed, this does not concern the present case of planar flows. In spite of these limitations, residual vorticity has been successfully used as a criterion for vortex identification in 2D [29,30,31,32] as well as 3D [33,34] flows.
The present paper elaborates on the methodology for a shape optimization of a bluff body. A passive control of its wake is targeted, with a focus on vortex characteristics and aerodynamic drag. Flow computations within the optimization procedure are based on a planar flow model using Reynolds-Averaged Navier-Stokes (RANS) equations. A validation of the simulation model by comparison with experimental data and higher-fidelity Direct Eddy Simulations (DES) is provided. Vortex strength is evaluated with an in-house postprocessing tool based on Kolář’s TDM. The optimization is performed in the ANSYS Workbench environment, using the Response Surface Method (RSM). The routine is applied to a triangular bluff body in a straight duct and several designs obtained with different objective functions are discussed.

2. Methodology

2.1. Computational Domain and Mesh

The baseline configuration is based on the experimental setup used by Fujii et al. [35], representing a bluff body flameholder in a straight duct. The flameholder is a rod with an equilateral triangular cross-section, positioned such that one vertex points upstream the incoming flow and the back face is perpendicular to the flow (Figure 1). The length of the triangle edge is H = 25   mm and the duct has a square cross-section 50   mm × 50   mm .
Two different approaches were taken in the flow modelling. The optimization procedure involves a high number of evaluations and a simplified planar representation of the problem was adopted to maintain reasonable computational demands. A higher fidelity computational model was used to verify whether the effect of geometry change on the flow field is predicted correctly by the simplified model. In this case, a three-dimensional representation of the domain was adopted, obtained by extruding the planar domain by 50   m m along the z-axis.
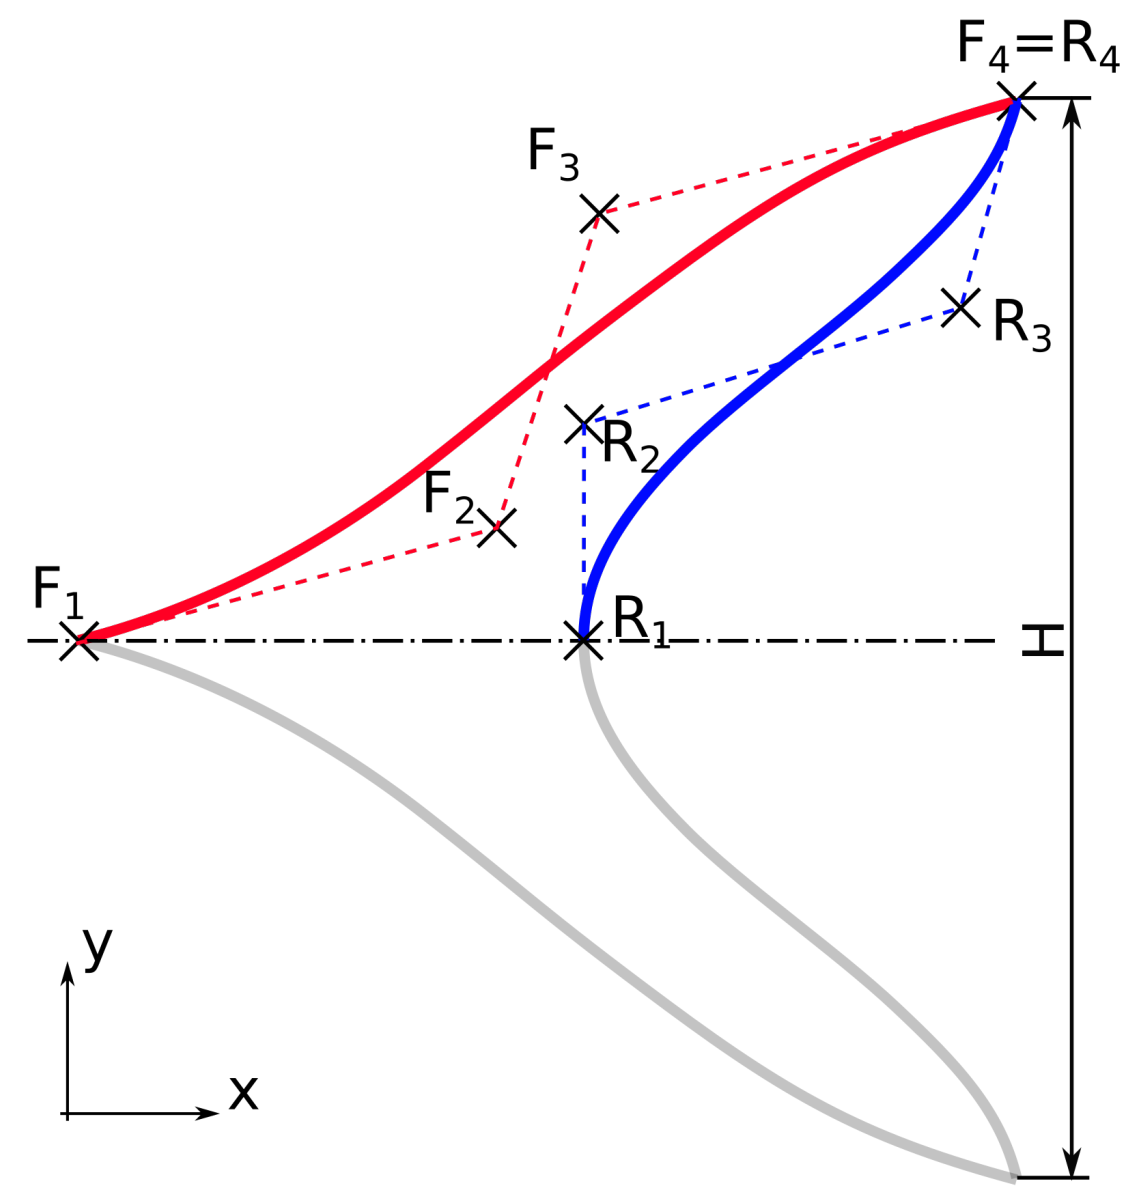
To enable a modification of the bluff body shape in the optimization procedure, the edges of the baseline triangle are parameterized with Bézier curves. The geometry is symmetrical with respect to the x-axis which splits it into the upper and lower half. Figure 2 shows control points of the two Bézier curves that form the upper half of the body. The upstream-facing Bézier curve has control points F 1 , . . . , F 4 , while the downstream-facing one has control points R 1 , . . . , R 4 . Various configurations can be obtained by moving the control points, as illustrated in Figure 3. The vertices of the original triangle remain fixed in the process.
The optimization procedure requires using a fully automatic discretization method and places high demands on its efficiency, flexibility and resulting grid quality. In view of these requirements, a structured multiblock meshing strategy was selected for the planar domain. The grids were generated in ICEM CFD 2022 R2 (ANSYS, Inc, Canonsburg, PA, USA) and contained 19 blocks each. Three discretization levels were considered in a grid convergence study, characterized by the cell-counts of 56k, 128k and 292k. The height of the first cell layer was set to achieve y + < 1 on the walls of the bluff body as well as the duct. The flow field predicted by the RANS model was qualitatively consistent on all three refinement levels. Richardson extrapolation provided error estimates of 1.7 for the bluff body drag force and 1.1 for the recirculation zone length on the middle grid. These errors are by more than one order of magnitude lower than the variation of the parameters with geometry change, therefore the middle grid provides a sufficient accuracy for the optimization procedure. Figure 3 shows examples of meshes generated for three bluff body geometries.
The numerical simulations with DES were conducted on an unstructured grid composed of approximately 5 million polyhedral elements with prism layers stretched to ensure a y + around 1, utilizing wall function treatment.

2.2. Flow Solution Method

The flow simulations within the geometry optimization procedure were performed in Fluent 2022 R2 (ANSYS, Inc, Canonsburg, PA, USA).The flow was modelled with RANS equations combined with the k- ω SST turbulence model. Thanks to the grid refinement near walls, the boundary layer was resolved without using wall functions. An initially performed unsteady simulation showed that the solution converges to steady state, therefore a steady configuration was selected for the optimization runs. A coupled second-order pressure-based solver was used and the working fluid was modelled as a constant density gas with density ρ = 1.225   kg / m 3 and dynamic viscosity η = 1.7894 × 10 5   kg / m · s . Boundary conditions were selected to approximate the experimental setup of Fujii et al. [35]. A no-slip wall boundary condition was imposed on the duct walls as well as on the bluff body surface. A velocity inlet was prescribed at the left boundary of the domain, with a horizontally aligned velocity vector of a magnitude u 0 = 10   m / s . The prescribed inflow was characterized by a turbulent intensity 5% and a turbulent viscosity ratio 10. The outflow on the right boundary of the domain was modelled as a pressure outlet. The simulations were run on a personal workstation, using 8 cores of the AMD Ryzen 7 5800H processor (AMD, Santa Clara, CA, USA). The wall time on the grid with 128k cells was 143   s per simulation.
The Detached Eddy Simulation (DES) was conducted using a time-dependent finite volume approach, integrating the unsteady governing equations in the commercial solver STAR-CCM+ 18.04.009 (Siemens, Plano, TX, USA). The computation of inviscid fluxes is based on the upwind concept and accounts for local flow characteristics to ensure the accurate propagation of physical information within the domain [36]. The simulations were unsteady as required by the DES approach. A second-order discretization in space as well as in time was employed for solving the set of equations. The simulations utilize an implicit, dual time-stepping solver for the unsteady time marching. Within this framework, a preconditioned pseudo-time derivative term within the equation system diminishes as convergence is achieved in the inner loop, enabling the computation of the solution at the subsequent physical time level. Boundary conditions were imposed following the guidelines of Poinsot and Lele [37]. Turbulence and turbulent mixing were modeled using the Spalart-Allmaras one-equation “eddy-viscosity” model [38,39]. In this paper, the time-averaged results of the unsteady DES simulations are presented. The simulations were run on a HPC cluster of Politecnico di Torino, using 2 processors with 32 cores each, and the wall time was 24 h.

2.3. Vortex Identification Method

The vortex detection algorithm adopted in this study is based on the Triple Decomposition of Motion devised by Kolář [24]. It has already been used for the identification and control of vortices in the wake of a flat plate [32]. The concept is motivated by the realization that vorticity cannot distinguish between shearing and swirling, hence it is not a suitable vortex measure. Instead of the classical decomposition of velocity gradient into vorticity and strain, Kolář proposed a decomposition into three elementary motions: pure shearing, rigid rotation and irrotational straining:
u = ( u ) S H + ( u ) R R + ( u ) E L ,
where u is the velocity vector.
By subtracting the pure shear tensor from the velocity gradient tensor, one obtains a residual tensor which is subsequently decomposed into the symmetric (residual strain ( u ) E L ) and antisymmetric (residual vorticity ( u ) R R ) parts. The residual vorticity tensor can be used as a vortex measure similarly to the vorticity tensor, but without being skewed by shear. An important aspect of the procedure is that the TDM has to be performed in the so called basic reference frame (BRF), in order to maximize the effect of shear removal. The search for the BRF can become rather costly on large meshes in 3D flows, as it requires an iterative evaluation for each individual grid cell. In this study, vortex identification is performed only for planar incompressible flows where residual vorticity can be calculated directly [24]. The 2D principle rate of strain s and the vorticity tensor component in 2D ω fulfill the relations:
| s | = 4 u x 2 + ( u y + v x ) 2 / 2 ,
ω = v x u y / 2 ,
where u and v are the x- and y- components of the velocity vector u . The planar residual vorticity is then obtained as:
ω res = 0 , | s | | ω | ( sgn ω ) [ | ω | | s | ] , | s | < | ω | .
Vortices can be theoretically defined by the condition | | ω res | | > 0  ; rad / s . In real flows, however, such definition might result in identifying a large part of the domain as a vortex and a non-zero threshold needs to be used. The sensitivity of the criterion to the threshold value was evaluated for a qualitatively similar flow in [32]. It was concluded that if the threshold is set sufficiently low, the outcome shows little sensitivity to its value. We adopt the threshold setting from [32] and identify vortices as regions where | | ω res | | > 1  ; rad / s . The strength of the vortex is computed by integrating residual circulation within the vortex region [40]:
Γ res = A ω res d A .
The sign of Γ res indicates the sense of rotation. The methodology for an automatic vortex identification and characterization was implemented as a plugin for the open source postprocessing software ParaView 5.9.0. (Kitware, Inc, NY, USA).

2.4. Parametrization and Optimization Method

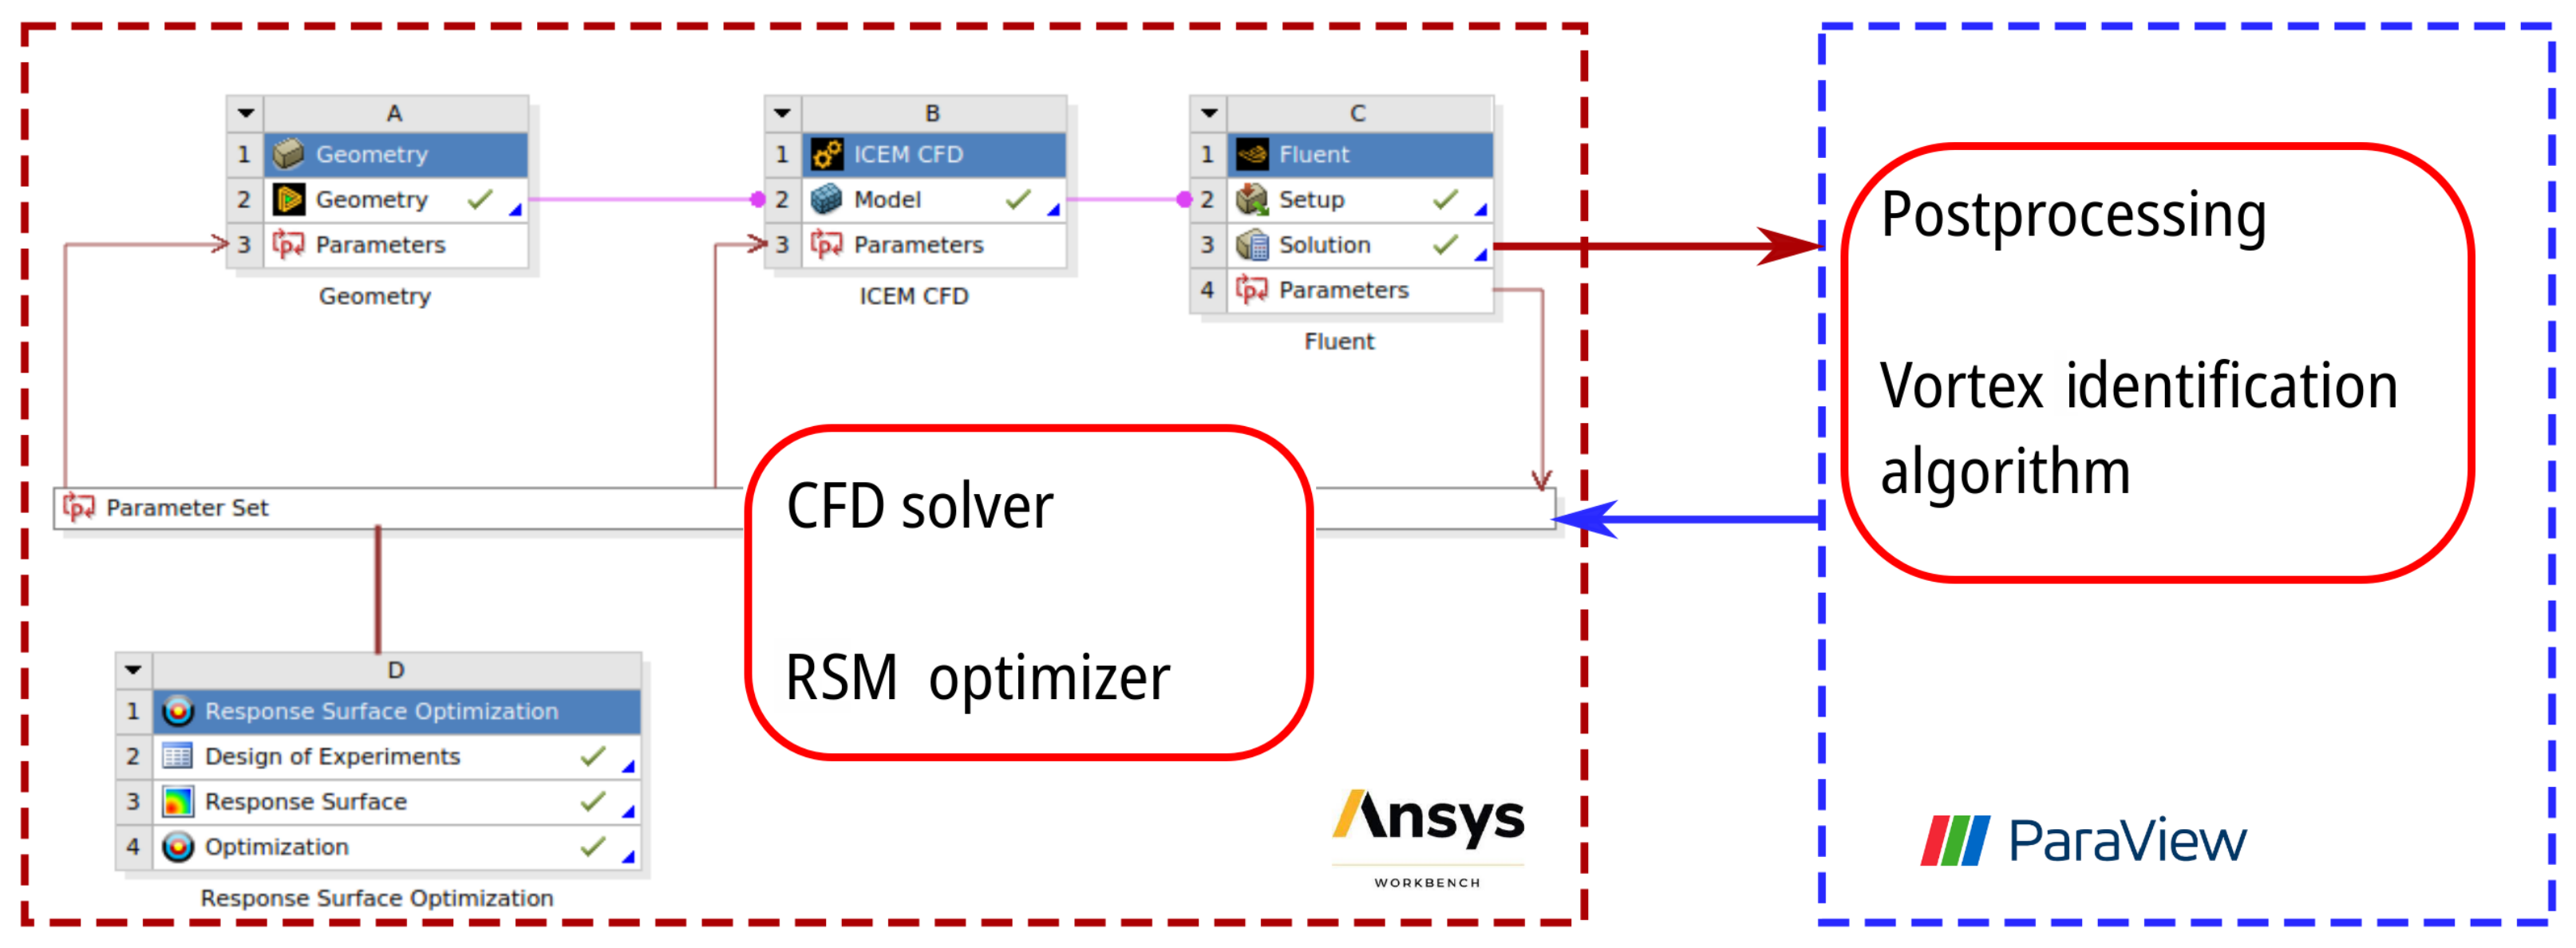
The optimization procedure involves connecting the individual tasks of geometry modification, mesh generation, flow solution, postprocessing and vortex identification into an interconnected automated loop, shown in Figure 4. The individual tasks are performed with a combination of commercial tools by ANSYS, Inc., Canonsburg, PA, USA, version 2022 R2 (geometry and mesh generation, flow solution, optimization), the open source postprocessing software ParaView and an in-house tool for vortex identification created by the authors. The whole procedure is driven by a Response Surface Optimization in the commercial DesignXplorer tool within the ANSYS Workbench environment and involves three steps: Design of Experiments (DOE), Response Surface and Optimization.
The design space is defined by 4 geometrical parameters, controlling the shape of the bluff body. For the front (red) Bézier curve, the tangents at the endpoints are set by moving the inner control points along circles centered at the endpoints (Figure 5-left). The ranges for the angle of the tangents are α 1 [ 15 ° , 90 ° ] , α 2 [ 1 ° , 60 ° ] . The tangent at the upper endpoint of the rear (blue) Bézier curve is varied similarly, β [ 2 ° , 90 ° ] . At its lower endpoint, the tangent remains vertical and the x-coordinate of the endpoint is changed, x r [ 0.56 H , 0 ] (Figure 5-right). The bluff body is symmetrical with respect to the x-axis.
The design space is first sampled in the DOE, using a Central Composite Design Strategy. This deterministic method combines one center point, points along the axis of the input parameters and points generated by a fractional factorial design for an efficient exploration of the design space. For the present case with 4 input parameters, 25 design points are sampled in the Design of Experiments. The evaluation of each design points involves a geometry update in ANSYS Design Modeler, remeshing in ANSYS ICEM and flow solution in ANSYS Fluent. The results are exported in the Ensight Case Gold format and loaded to ParaView where the vortex identification procedure is performed with the in-house tool based on Kolář’s TDM. Vortex characteristics are then used to update the parameters in ANSYS Workbench and provide thus the evaluation of objectives for the optimization procedure.
In the next step, a response surface is generated from the input and output values of the design points evaluated in the Design of Experiments. The response surface fits the output parameters as a function of the input parameters and serves as a quick approximation of the output values throughout the design space. A Kriging response surface type is used, combining a global polynomial model of the design space with local deviations for an accurate interpolation of the DOE points. A benefit of the Kriging approach is the possibility of an automatic refinement for a reduced predicted error. This way, additional 5 design points are generated and directly evaluated using the same procedure as in the DOE.
Finally, a Multi-Objective Genetic Algorithm based on controlled elitism concepts is run to find an optimum of input parameters for the defined objectives. This genetic optimization algorithm can be used for single or multi-objective optimizations and supports constraint handling. New populations are generated with cross-over and mutation mechanisms and 800 samples are generated in each iteration. Convergence is assessed by the stability of the Pareto front. For more details on the mathematical concepts of the whole optimization procedure, the reader is referred to the ANSYS DesignXplorer User’s Guide [41].

3. Results and Discussion

3.1. Validation of the Numerical Model

Flow simulations in the geometry optimization procedure are based on a planar flow model described by RANS equations. This setup is favored for its low computational costs that are needed to make the evaluation of a large number of design points feasible. The validity of the flow model is established in two steps. First, a higher-fidelity DES model is validated by comparison with experimental data reported by Fujii et al. [35]. Next, the DES model is used to generate benchmark results on a modified geometry, for which experimental data are not available, to assess whether the simpler RANS setup predicts correctly the trends that occur with a geometry change. The DES simulations are inherently unsteady, therefore the comparison with the steady-state RANS computations is based on time-mean results. The study involves the baseline triangular bluff body and a design optimized for enhanced vortex strength.
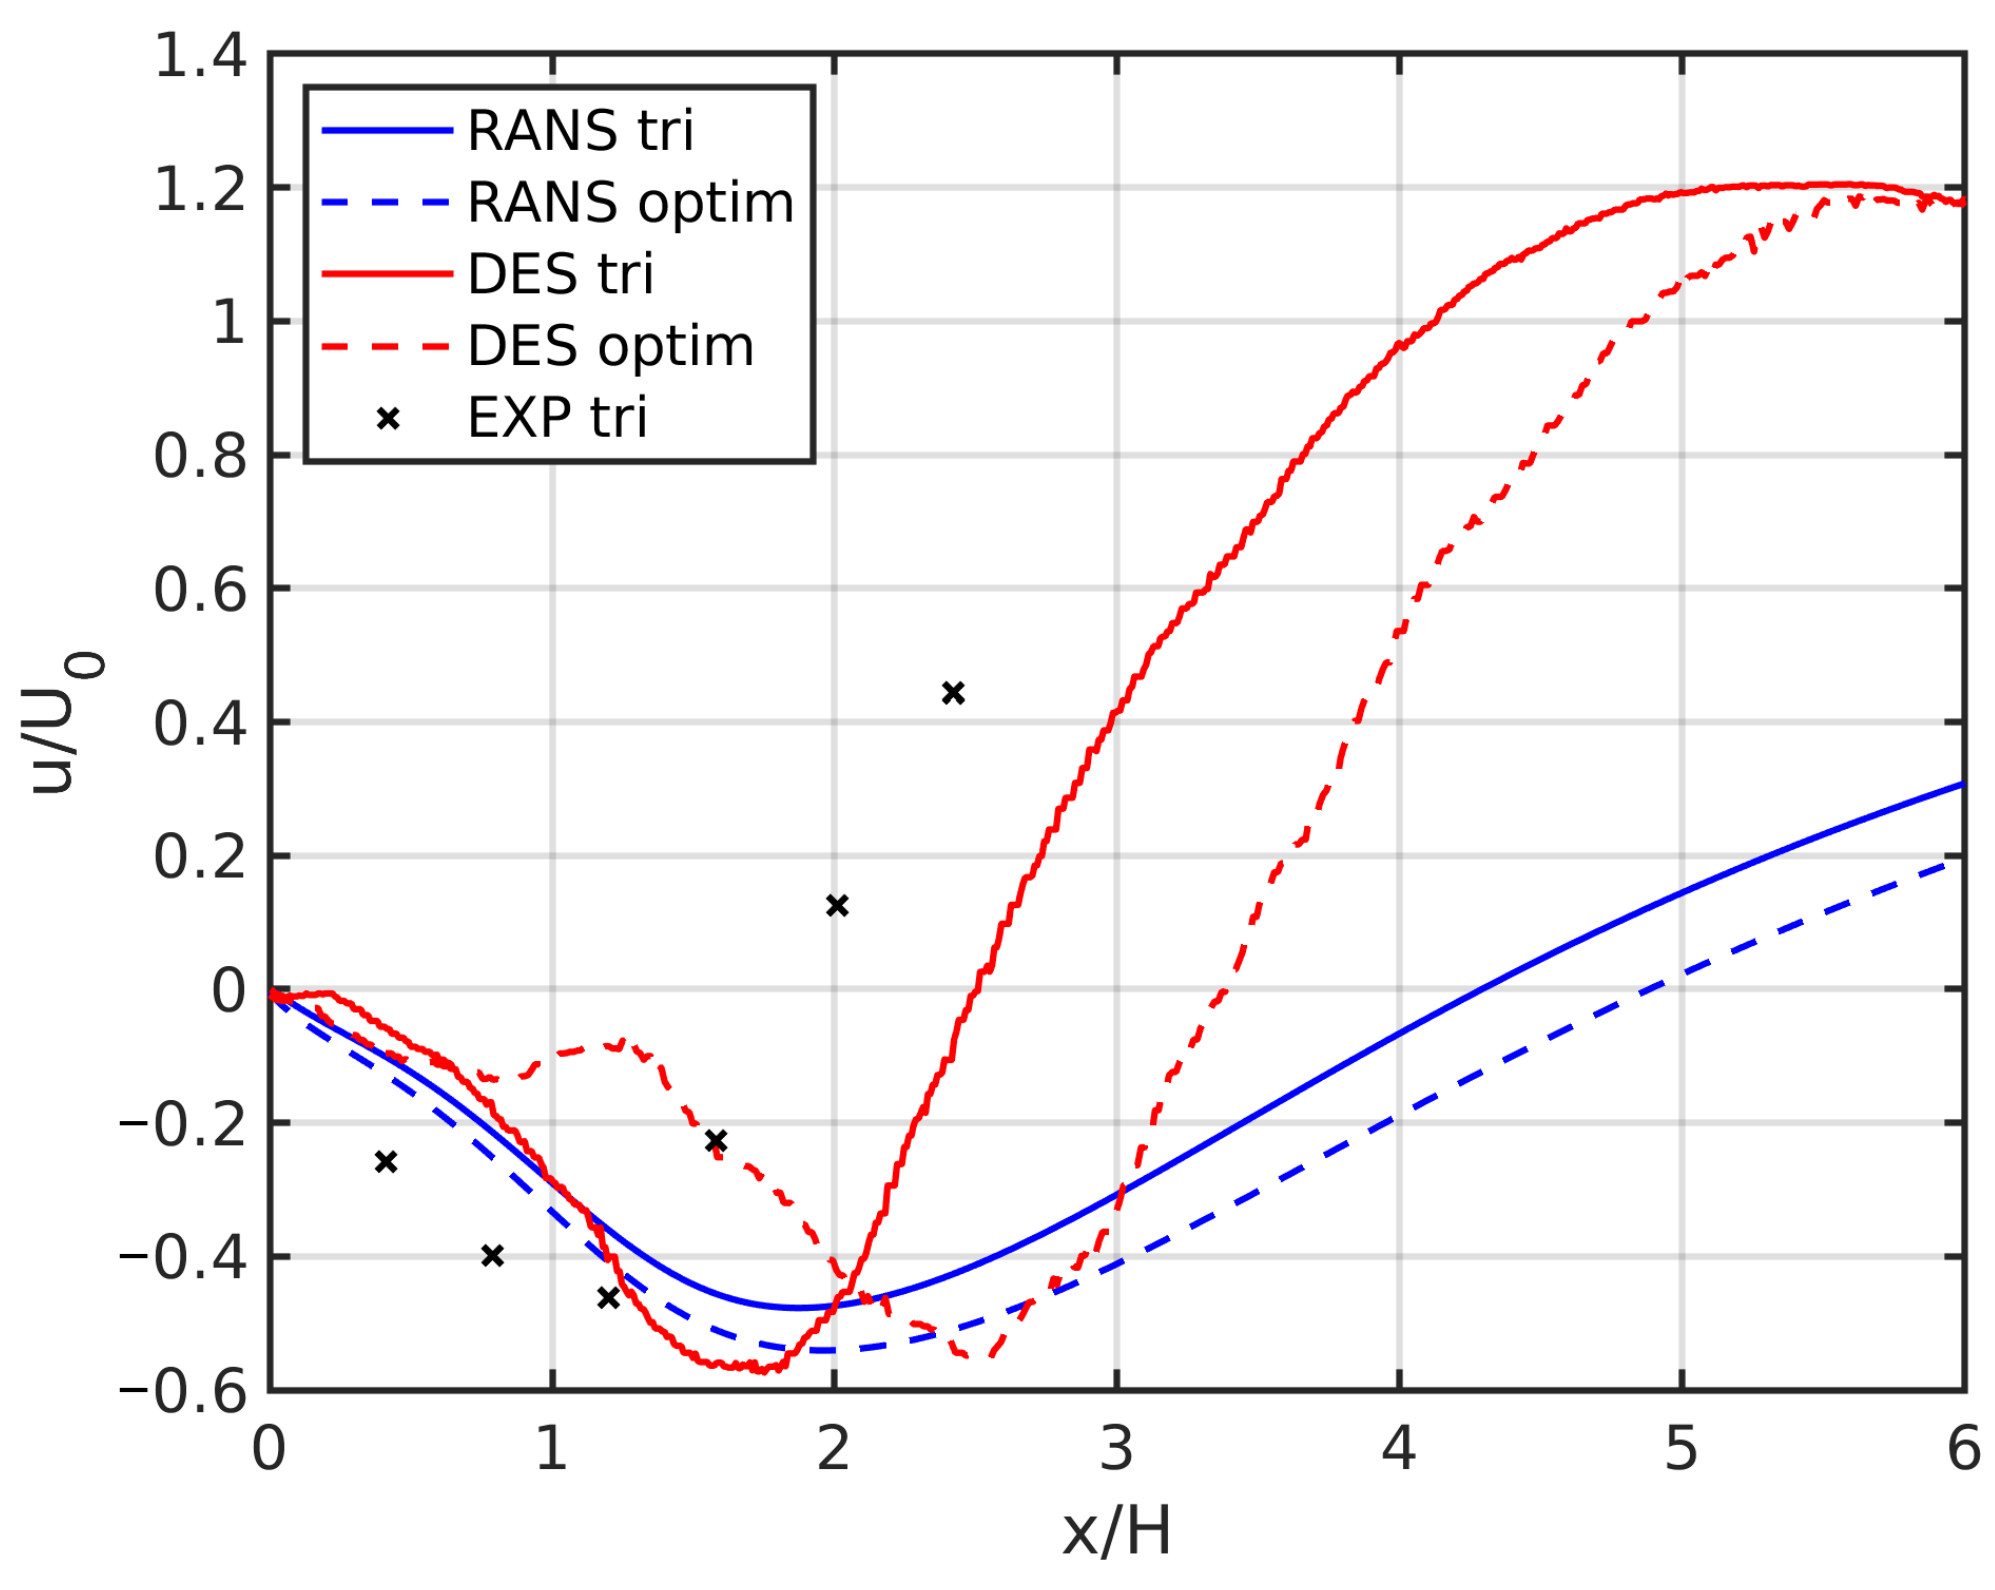
A comparison of numerical results with experimental data is presented in Figure 6. The figure shows an evolution of the axial component of velocity along the axis of symmetry in the bluff body wake. The RANS and DES results for the baseline triangular (tri) and the optimized (optim) geometries are included, as well as experimental data for the baseline from Fujii et al. [35]. The velocity profiles from both numerical models are qualitatively consistent with the measurements, but differ in terms of the predicted recirculation zone length. The experimental data indicate a recirculation zone length x r 1.9 H , while the RANS model overpredicts it significantly at x r = 4.3 H . The DES result is x r = 2.5 H , which is notably closer to the measured value, although still an overprediction by 35%.
The accuracy of the present RANS predictions is in accordance with the results reported by Kim et al. [42]. They compared a Large Eddy Simulation (LES) and a RANS simulation with the same experimental dataset. In their case, the RANS model also overestimated the recirculation zone length, whereas the LES results matched closely the measured data. The superior accuracy of the LES model was attributed to its ability to represent the unsteady vortex shedding that occurs downstream of the bluff body. This phenomenon is not resolved by the RANS simulations, as they converge to a steady solution even when run in a transient configuration. Although the present DES model did not completely match the accuracy of the LES by Kim et al., it captured correctly the occurrence of vortex shedding and provided a faithful representation of the flow physics. Therefore, it can be used as a benchmark for assessing the performance of the RANS model in other configurations.
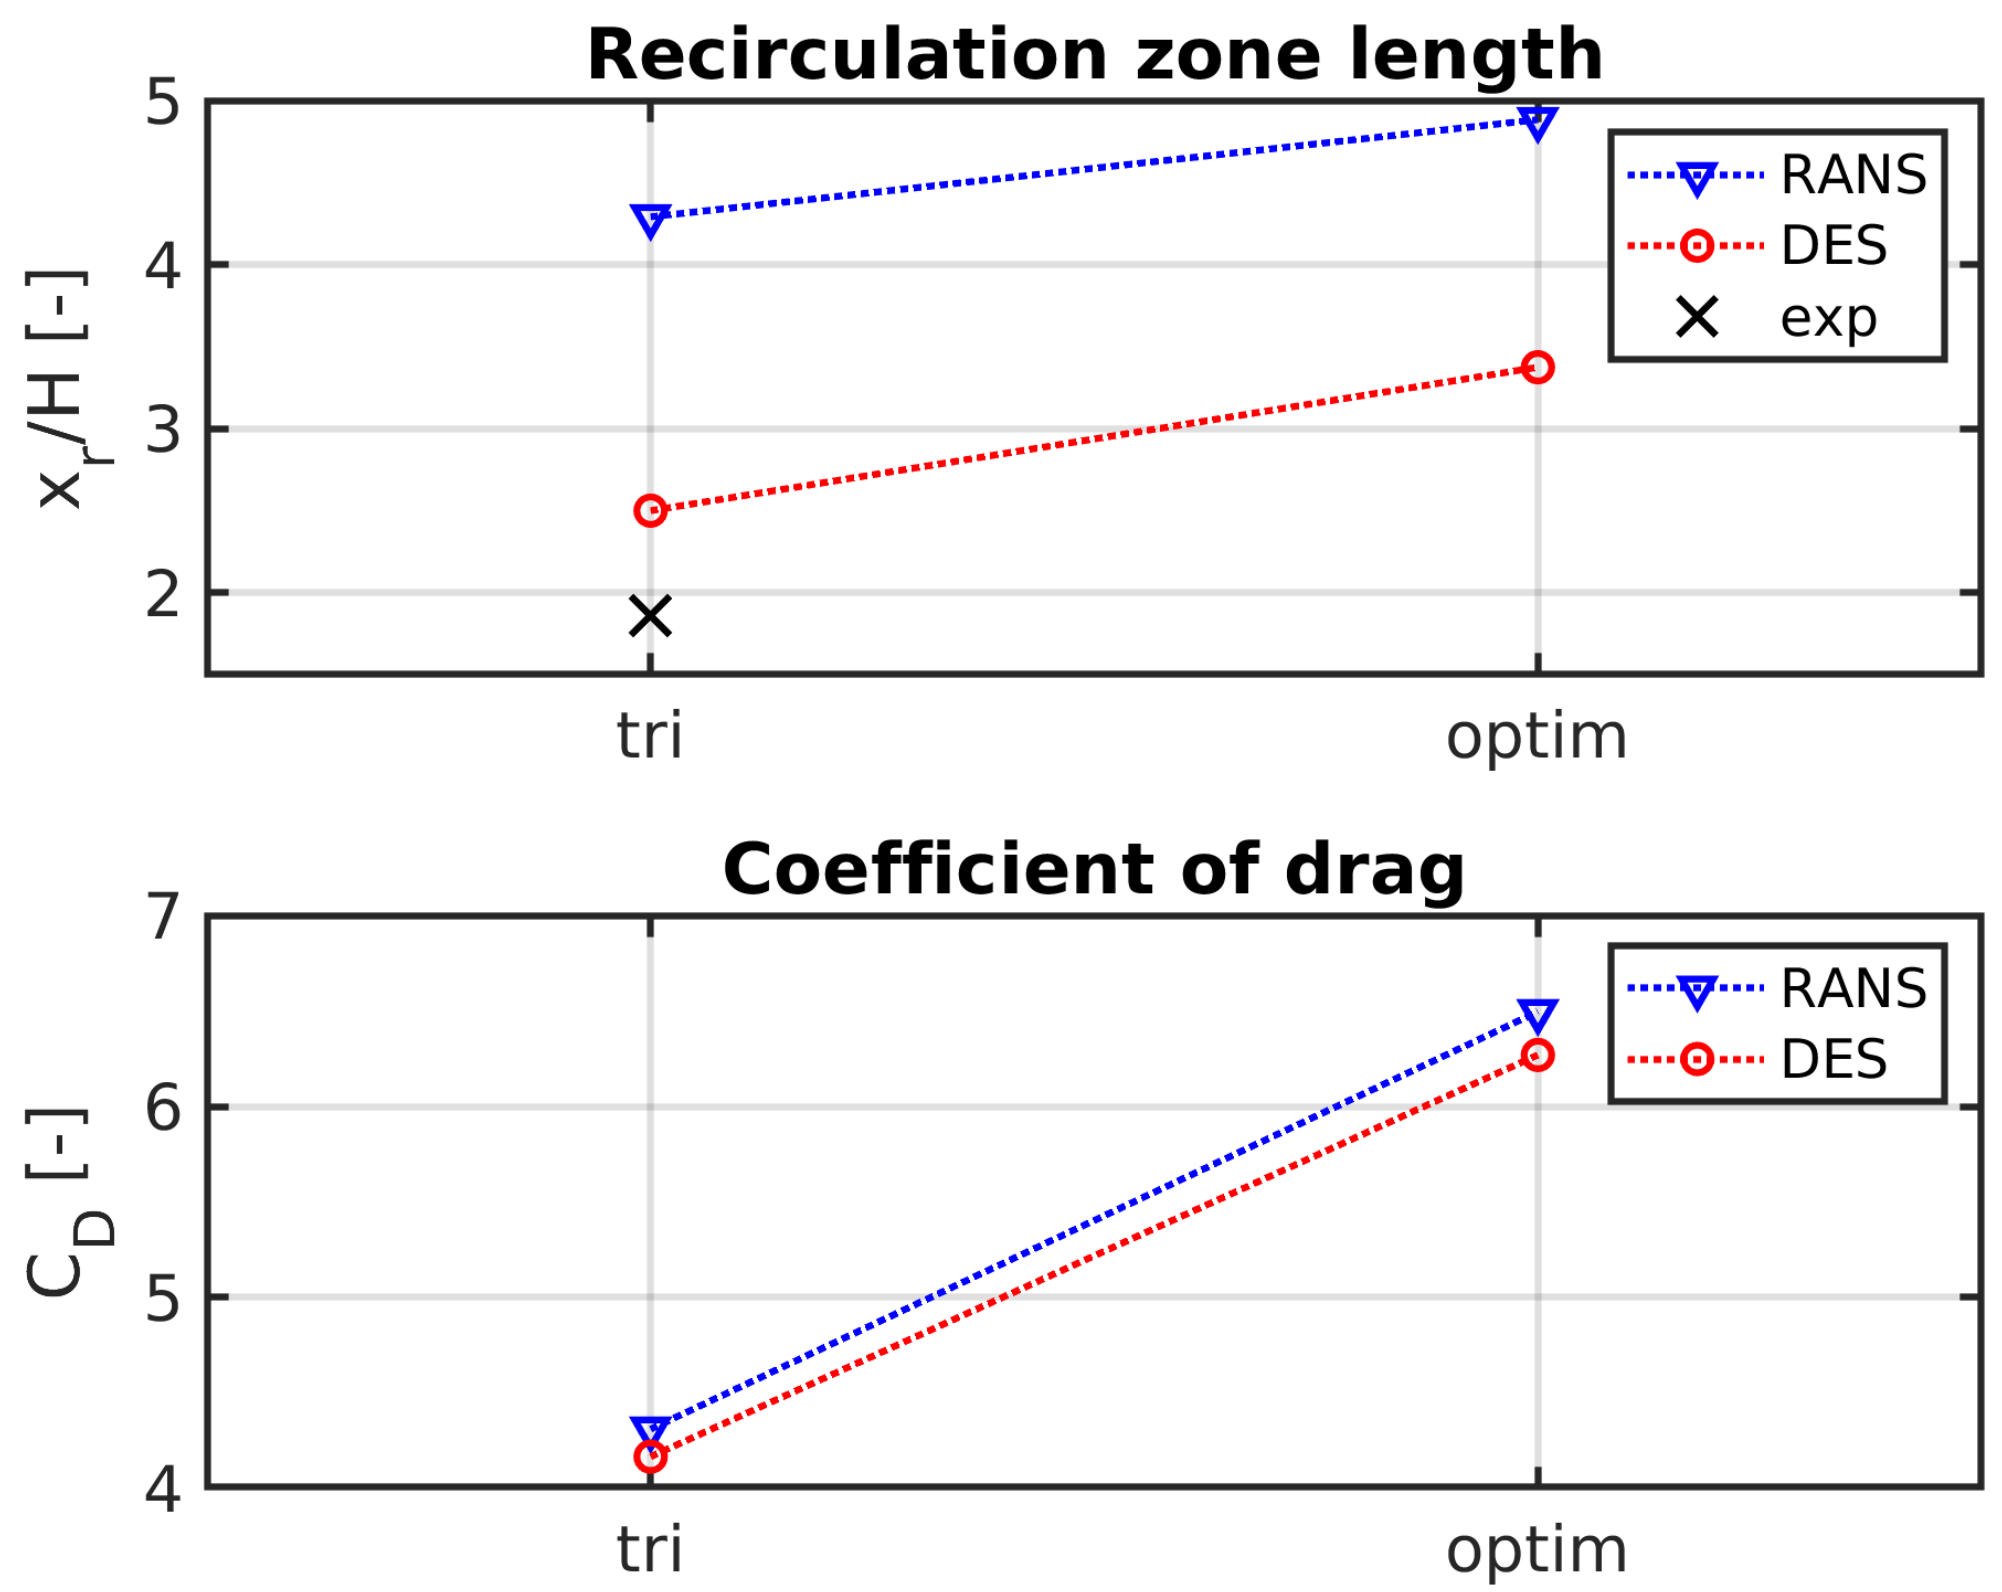
The RANS and DES computations differ quantitatively in the predicted recirculation zone length, but they are consistent in terms of the trends that occur with a geometry change. Figure 7-top shows that both models predict an enlargement of the recirculation zone for the optimized geometry. An excellent agreement between RANS and DES is achieved in terms of the predicted drag force acting on the bluff body (Figure 7-bottom). The RANS simulation predicts an increase of the drag force by 50.7% for the optimized geometry, which matches very closely the increase by 50.5% in the DES results. Moreover, the predictions are very close also in terms of absolute values, as the drag coefficient evaluations agree within 3.5% on both geometries.
Figure 8 shows the velocity fields obtained with the two simulation setups on the two geometries. A large wake is formed behind the bluff body and the flow is accelerated in the gap between the wake and the tunnel walls up to u = 2.8 u 0 . The RANS and DES simulations capture the fundamental patterns of the time-averaged flow field consistently, in spite of the discussed discrepancy in the predicted extent of the wake zone. The enlarged recirculation zone of the optimized design is apparent in the velocity contours obtained with both models. In both cases, this change is accompanied by an increase of velocity magnitude in the jets between the wake and the tunnel walls.
The present results indicate that in spite of their limitations, the planar RANS simulations are able to predict correctly the trends in time-averaged aerodynamics that occur with geometrical changes. The drag force is predicted in accordance with the DES model, both in terms of absolute value and the relative difference between the baseline and optimized designs. Although the RANS model overestimates the recirculation zone length, it is consistent with DES in predicting its increase for the optimized geometry. The present results give confidence for using the RANS flow model as a tool for evaluating the aerodynamic performance of the bluff body in the optimization procedure.

3.2. Vortex Detection

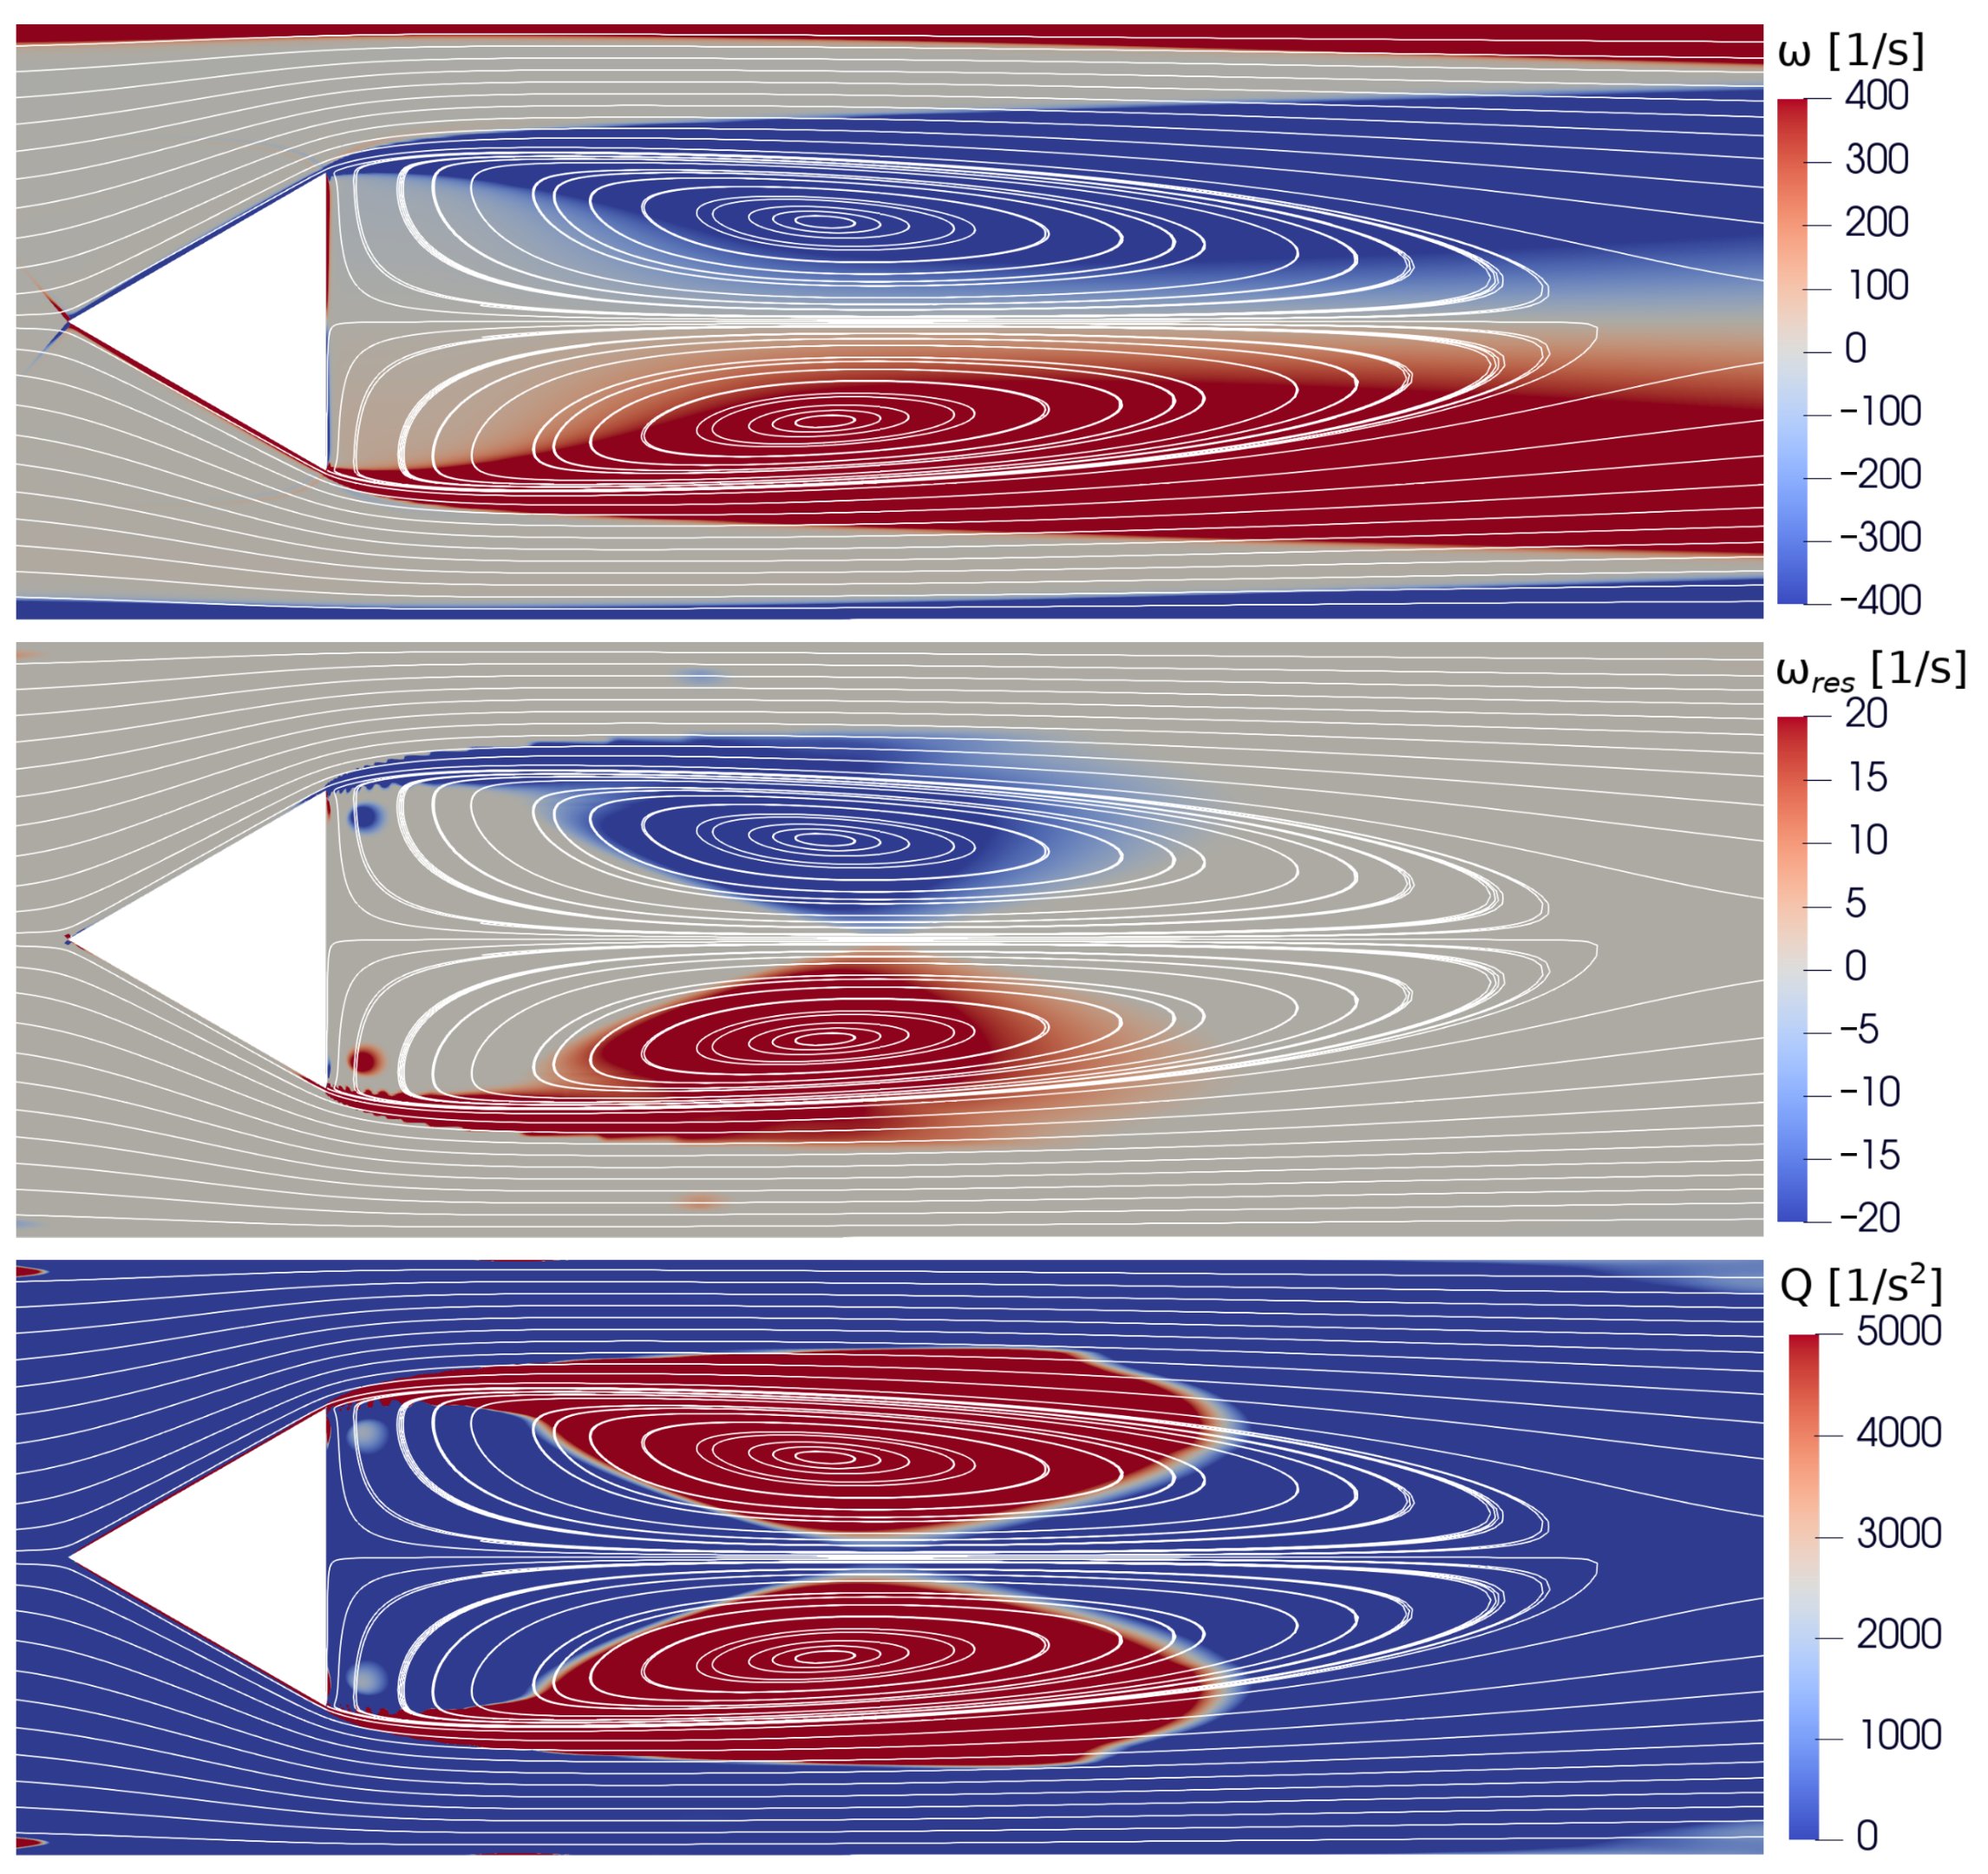
Residual vorticity obtained with the TDM is used as a measure for vortex identification in the present study. To assess how it performs in capturing vortices in the bluff body wake, it was compared with two classical approaches to vortex detection: vorticity and the Q-criterion. Results obtained with the three criteria for the baseline triangular bluff body are presented in Figure 9. Contours of magnitude of the respective quantities are displayed, together with streamlines. Although streamlines are not representative of vortices in general 3D unsteady flows [23], they provide an illustrative visualization in steady planar incompressible flows, such as the present case. Here, a pattern of closed nested streamlines marks regions of swirling fluid, which corresponds well to the intuitive concept of a vortex. Therefore, it is meaningful to use streamlines as a reference vortex measure in flows of this type.
It has been well established that vortex identification with vorticity magnitude can produce misleading results [24]. Also in the present case, false positives appear in boundary layers along walls and in a major part of the bluff body wake, downstream of the actual recirculation zone (Figure 9-top). Residual vorticity reduces significantly the false positives in boundary layers induced by shear. It identifies the two symmetrical vortices as distinct structures whose centers align well with the center of the recirculation zones marked by closed nested streamlines (Figure 9-middle). Nevertheless, inaccuracies remain in the outcome. Only the central region of the recirculation zone is detected, while further from the center, residual vorticity has zero magnitude. False positives are detected as the jet passing between the bluff body and the tunnel wall interacts with the wake and forms a region of high shear. Small spurious structures appear in some parts of the domain, creating a false impression that multiple vortices exist within the actual recirculation zone.
The inaccuracies of vortex detection with residual vorticity are attributed to the limitations of identifying a non-local flow pattern with a local method [16]. They are common to local vortex detection criteria, such as the popular Q-criterion plotted in Figure 9-bottom. If zero thresholds are selected, vortex boundaries identified by ω r e s and by Q are identical in planar incompressible flows. In both cases, vortex boundary is defined by the condition that the planar strain-rate is equal to the planar vorticity magnitude [24]. Although the zero-threshold vortex boundaries are identical, residual vorticity is in several aspects superior to the Q-criterion. It is valid in compressible as well as incompressible flows, indicates the sense (and in 3D the axis) of the swirling motion and its magnitude has an illustrative physical meaning related to the angular speed of rigid body rotation [24,40].
In spite of the discussed limitations, residual vorticity identifies vortices with a reasonable accuracy in the present case. Consequently, it can be used as a quantitative vortex measure in the objective function of the optimization procedure.

3.3. Optimization of the Bluff Body Geometry

The objective of the optimization was to shape the bluff body geometry to maximize the strength of vortices in its wake and to minimize the drag force. An example where such optimization could be useful is a flame holder, for which the amplification of vortices can enhance mixing and improve combustion quality, while a low drag force needs to be maintained to avoid excessive pressure losses.
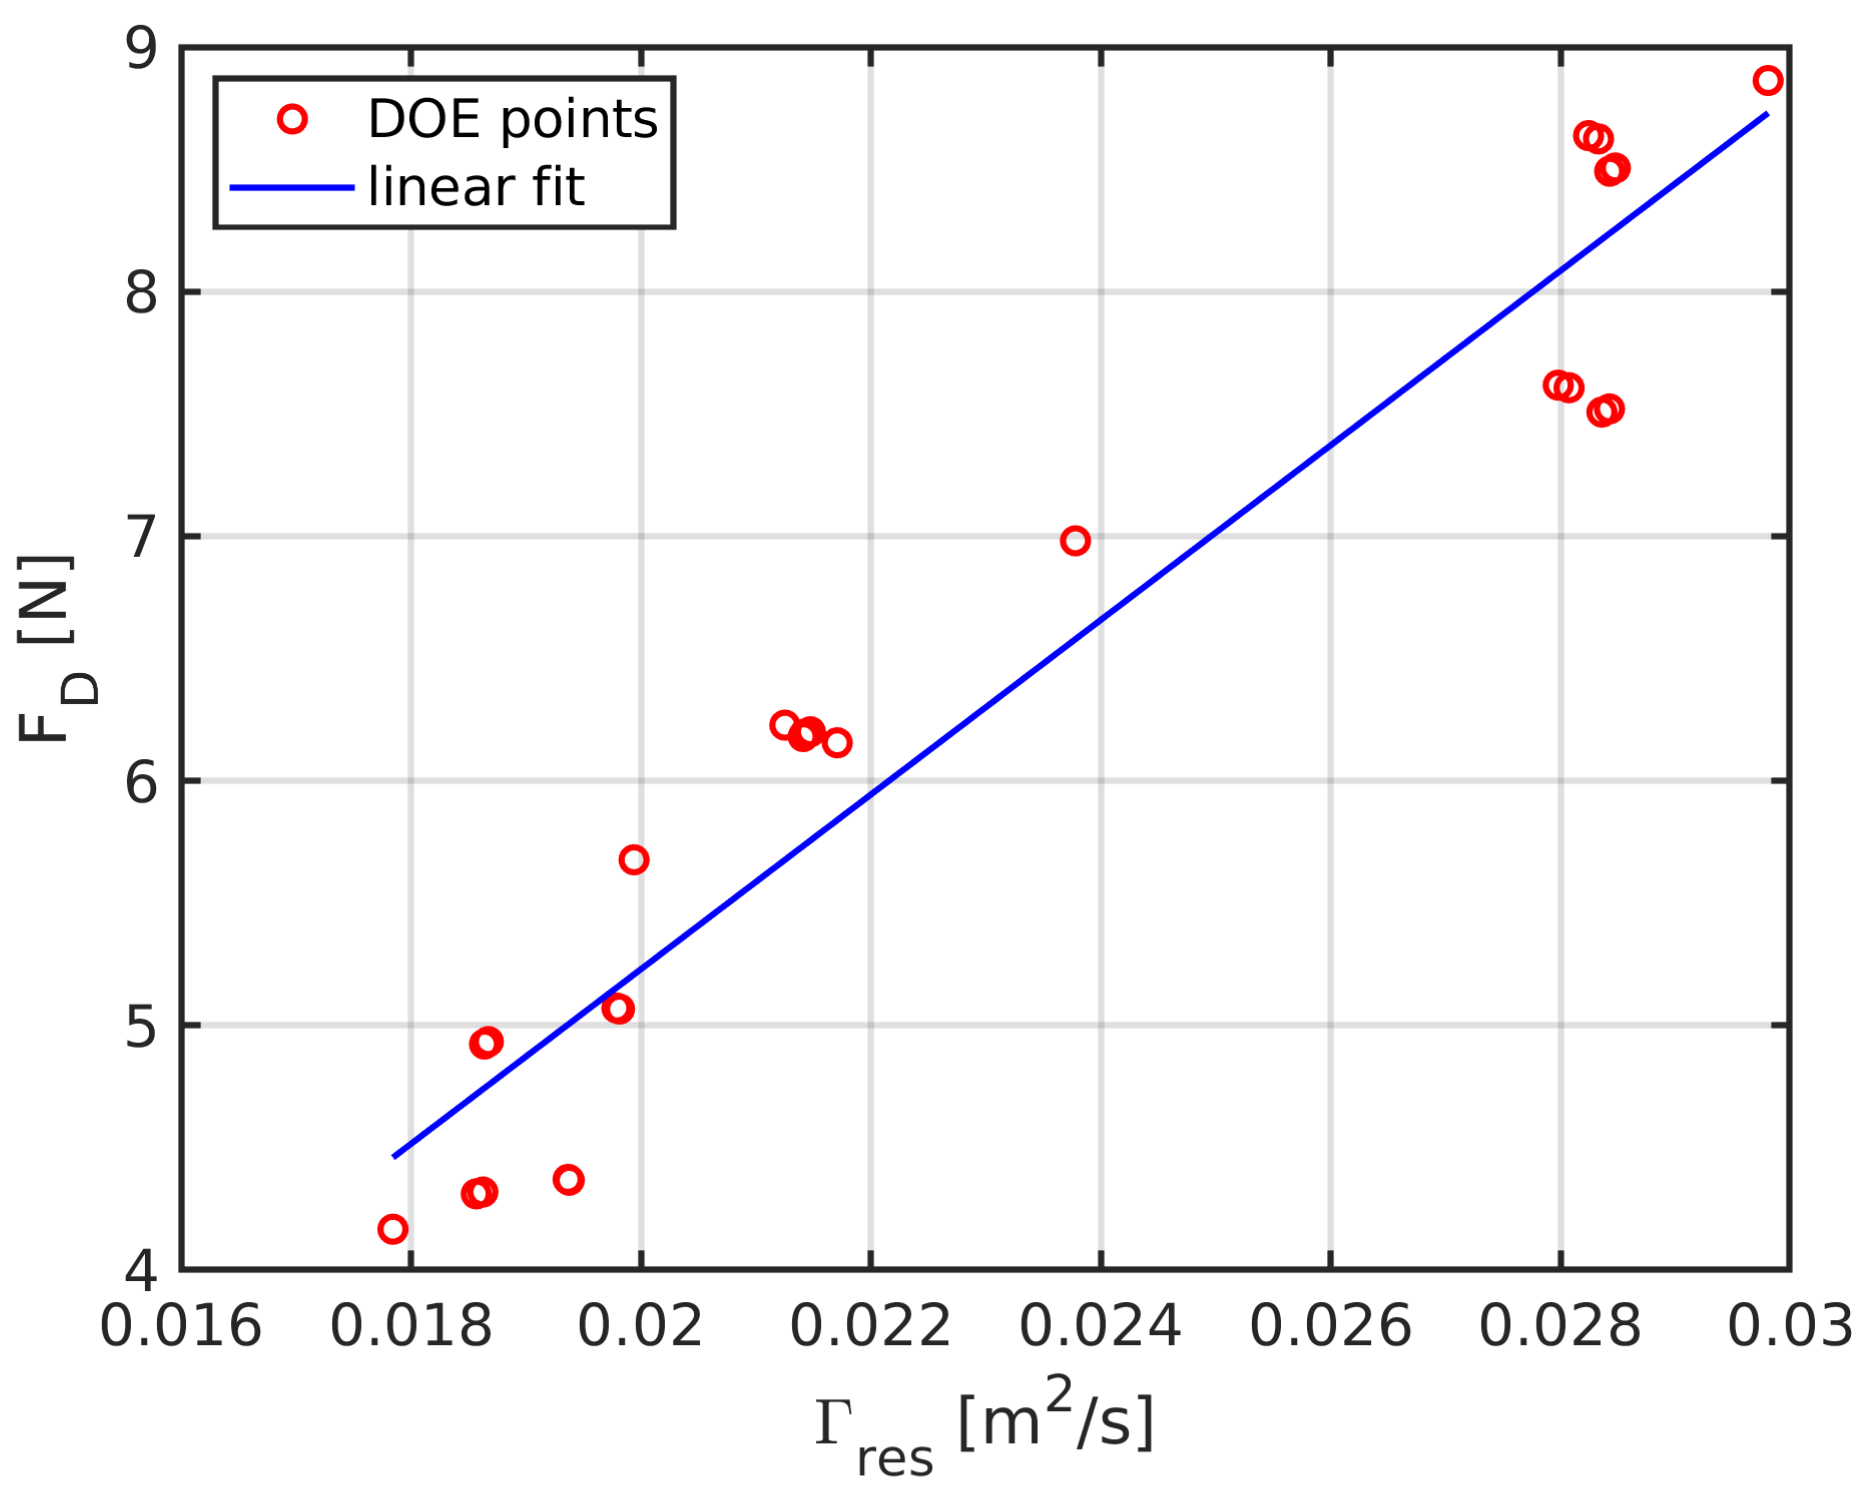
As described in Section 2.4, the geometry was parameterized by Bézier curves and 4 input parameters were considered: the tangent angles α 1 , α 2 at the endpoints of the front curve, the tangent angle β at the upper endpoint of the rear curve and the axial position x r of its midpoint (Figure 5). The design space was first explored by generating 25 design points in the Design of Experiments (DOE). Figure 10 shows that there is a high correlation between the bluff body drag force and the vortex strength, indicating that one of the output parameters cannot be greatly changed without affecting the other. Linear interpolation of the datapoints provides a close approximation of the results. An example of convergence of one optimization run is shown in Figure 11.
The triangular bluff body geometry served as a baseline for three single-objective optimization runs. One targeted a maximum vortex strength (Max. Γ r e s ) and another a minimum drag force (Min. F D ). In the third optimization, the two parameters were combined into a single objective. The target was to maximize the ratio of vortex strength to the square root of drag force (Max. Γ r e s / F D ).
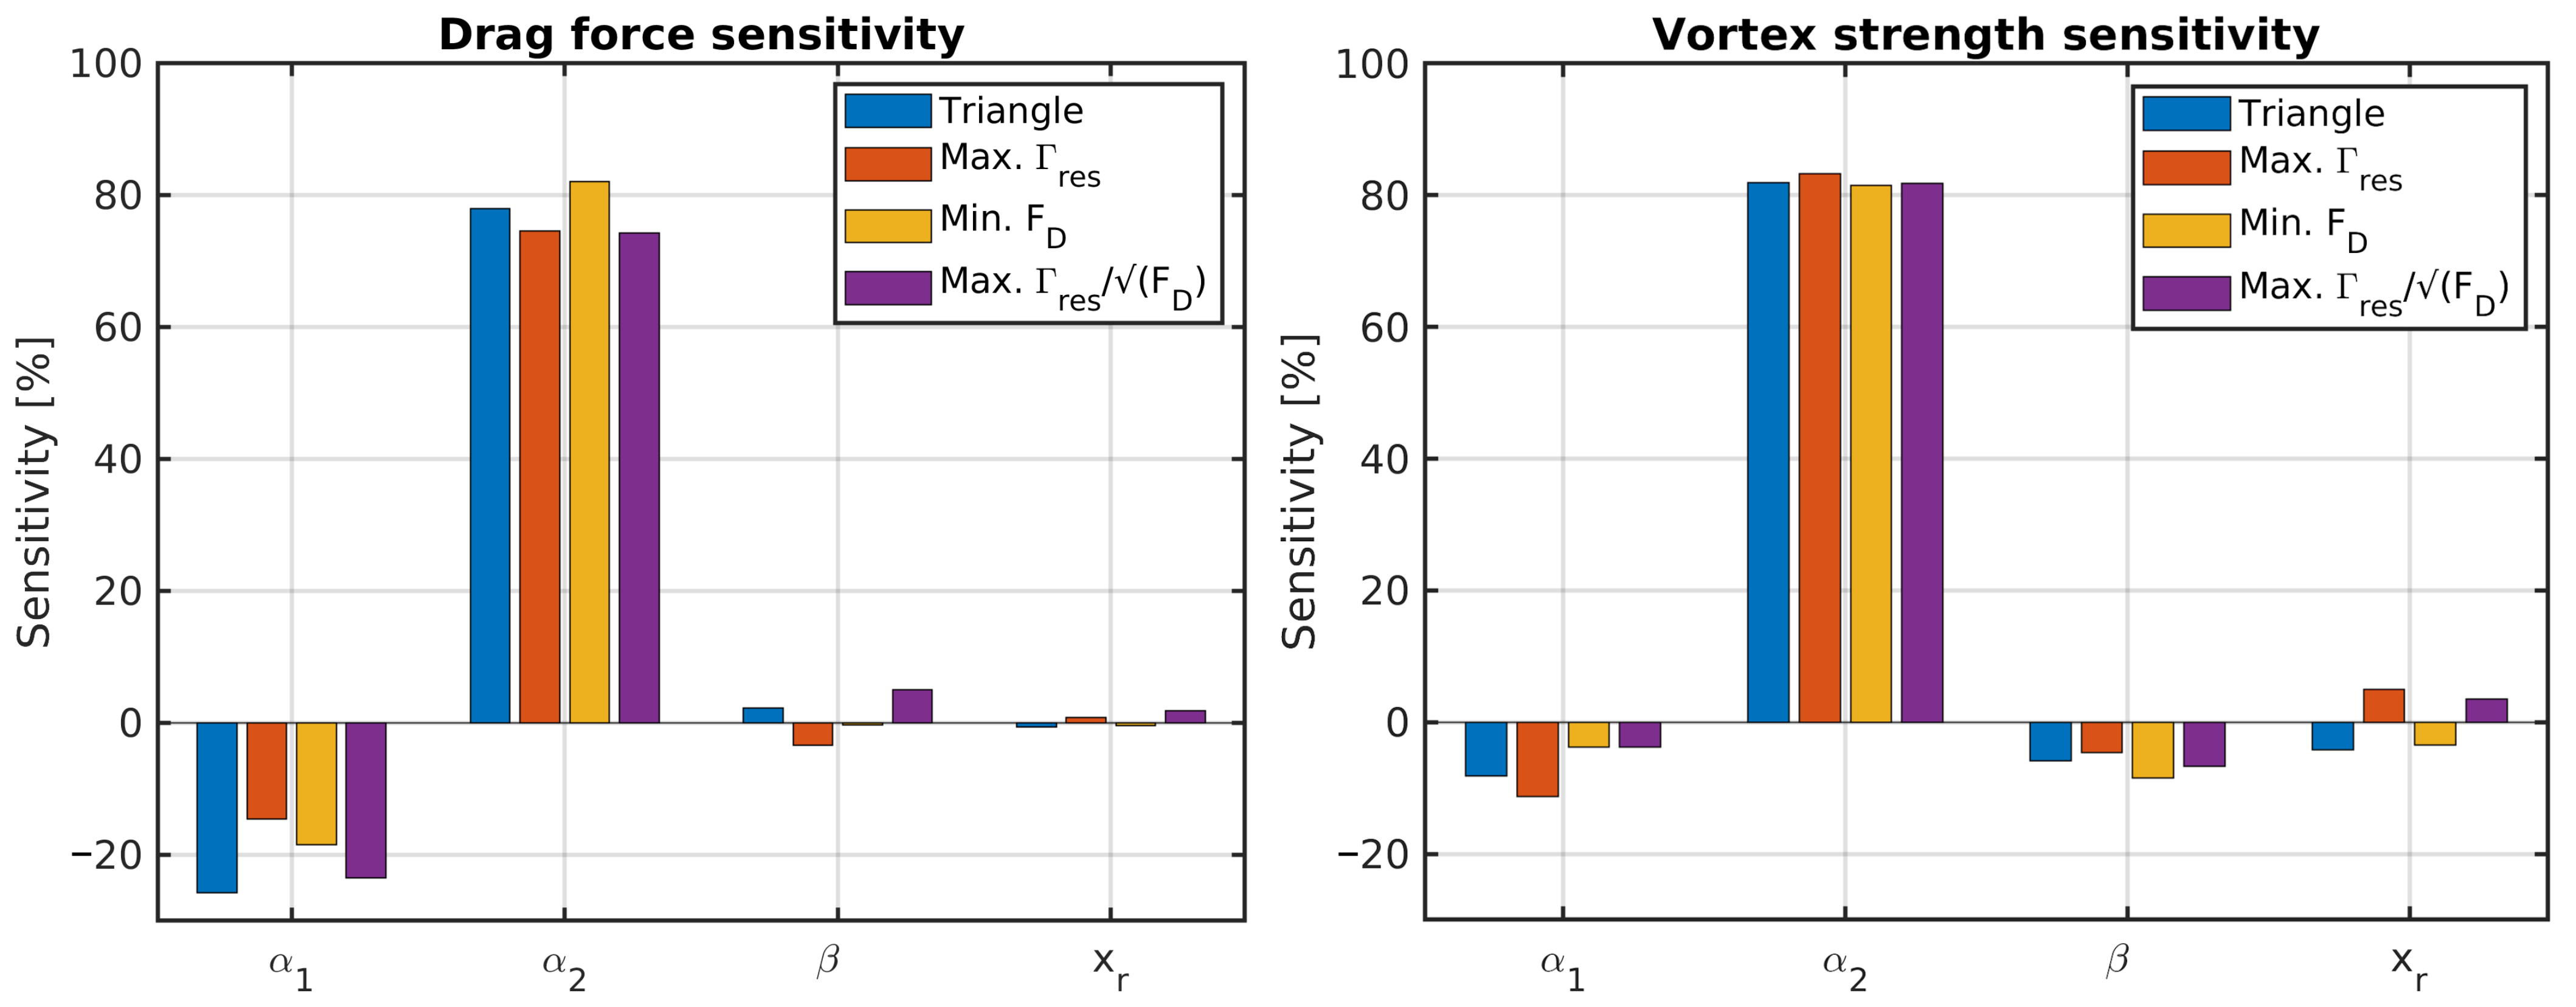
To analyze why a particular design was obtained for the given objective, the local sensitivities of drag force and vortex strength to the 4 input parameters were evaluated. The local sensitivity of an output parameter P o u t to an input parameter P i n , k is calculated as a ratio of the maximum variation of P o u t achievable by changing only the parameter P i n , k , to the maximum variation of P o u t with all input parameters:
s = Δ m a x ( P o u t ( P i n , k ) ) Δ m a x ( P o u t ( P i n , 1 , P i n , 2 , . . . , P i n , N ) )
The local sensitivity is always evaluated at a particular design point, defined by a specific combination of the input parameters.
The local sensitivities of drag force and vortex strength to input parameters at the 4 design points are plotted in Figure 12. Both quantities have the highest sensitivity (≈80%) to the angle α 2 which directs the jet of fluid departing at the rear vertices of the bluff body. A lower value implies a more horizontally aligned flow and a smaller wake width, leading to a reduced drag force and weaker vortices. The second most influential input parameter is the angle α 1 which controls the sharpness of the front wedge. On average, it affects the drag force by ≈21%, while its influence on the vortex strength is markedly smaller at ≈7%. A blunter wedge reduces both the drag force and the vortex strength.
The shaping of the rear part of the bluff body has a much less pronounced effect on either output parameter. Especially the drag force is affected only very mildly, with average sensitivities of 2.7% to the angle β and 0.9% to the rear midpoint position x r . In both cases, the variation is not monotonous and its sign depends on the design point. A slightly larger effect is observed for the vortex strength, whose sensitivity to β is comparable to α 1 . A smaller value of the angle, meaning a sharper corner at the rear vertex, generates stronger vortices. The influence of x r on vortex strength is positive for some design points and negative for others. On average, the sensitivity amounts to 4.1%, implying that the rear.
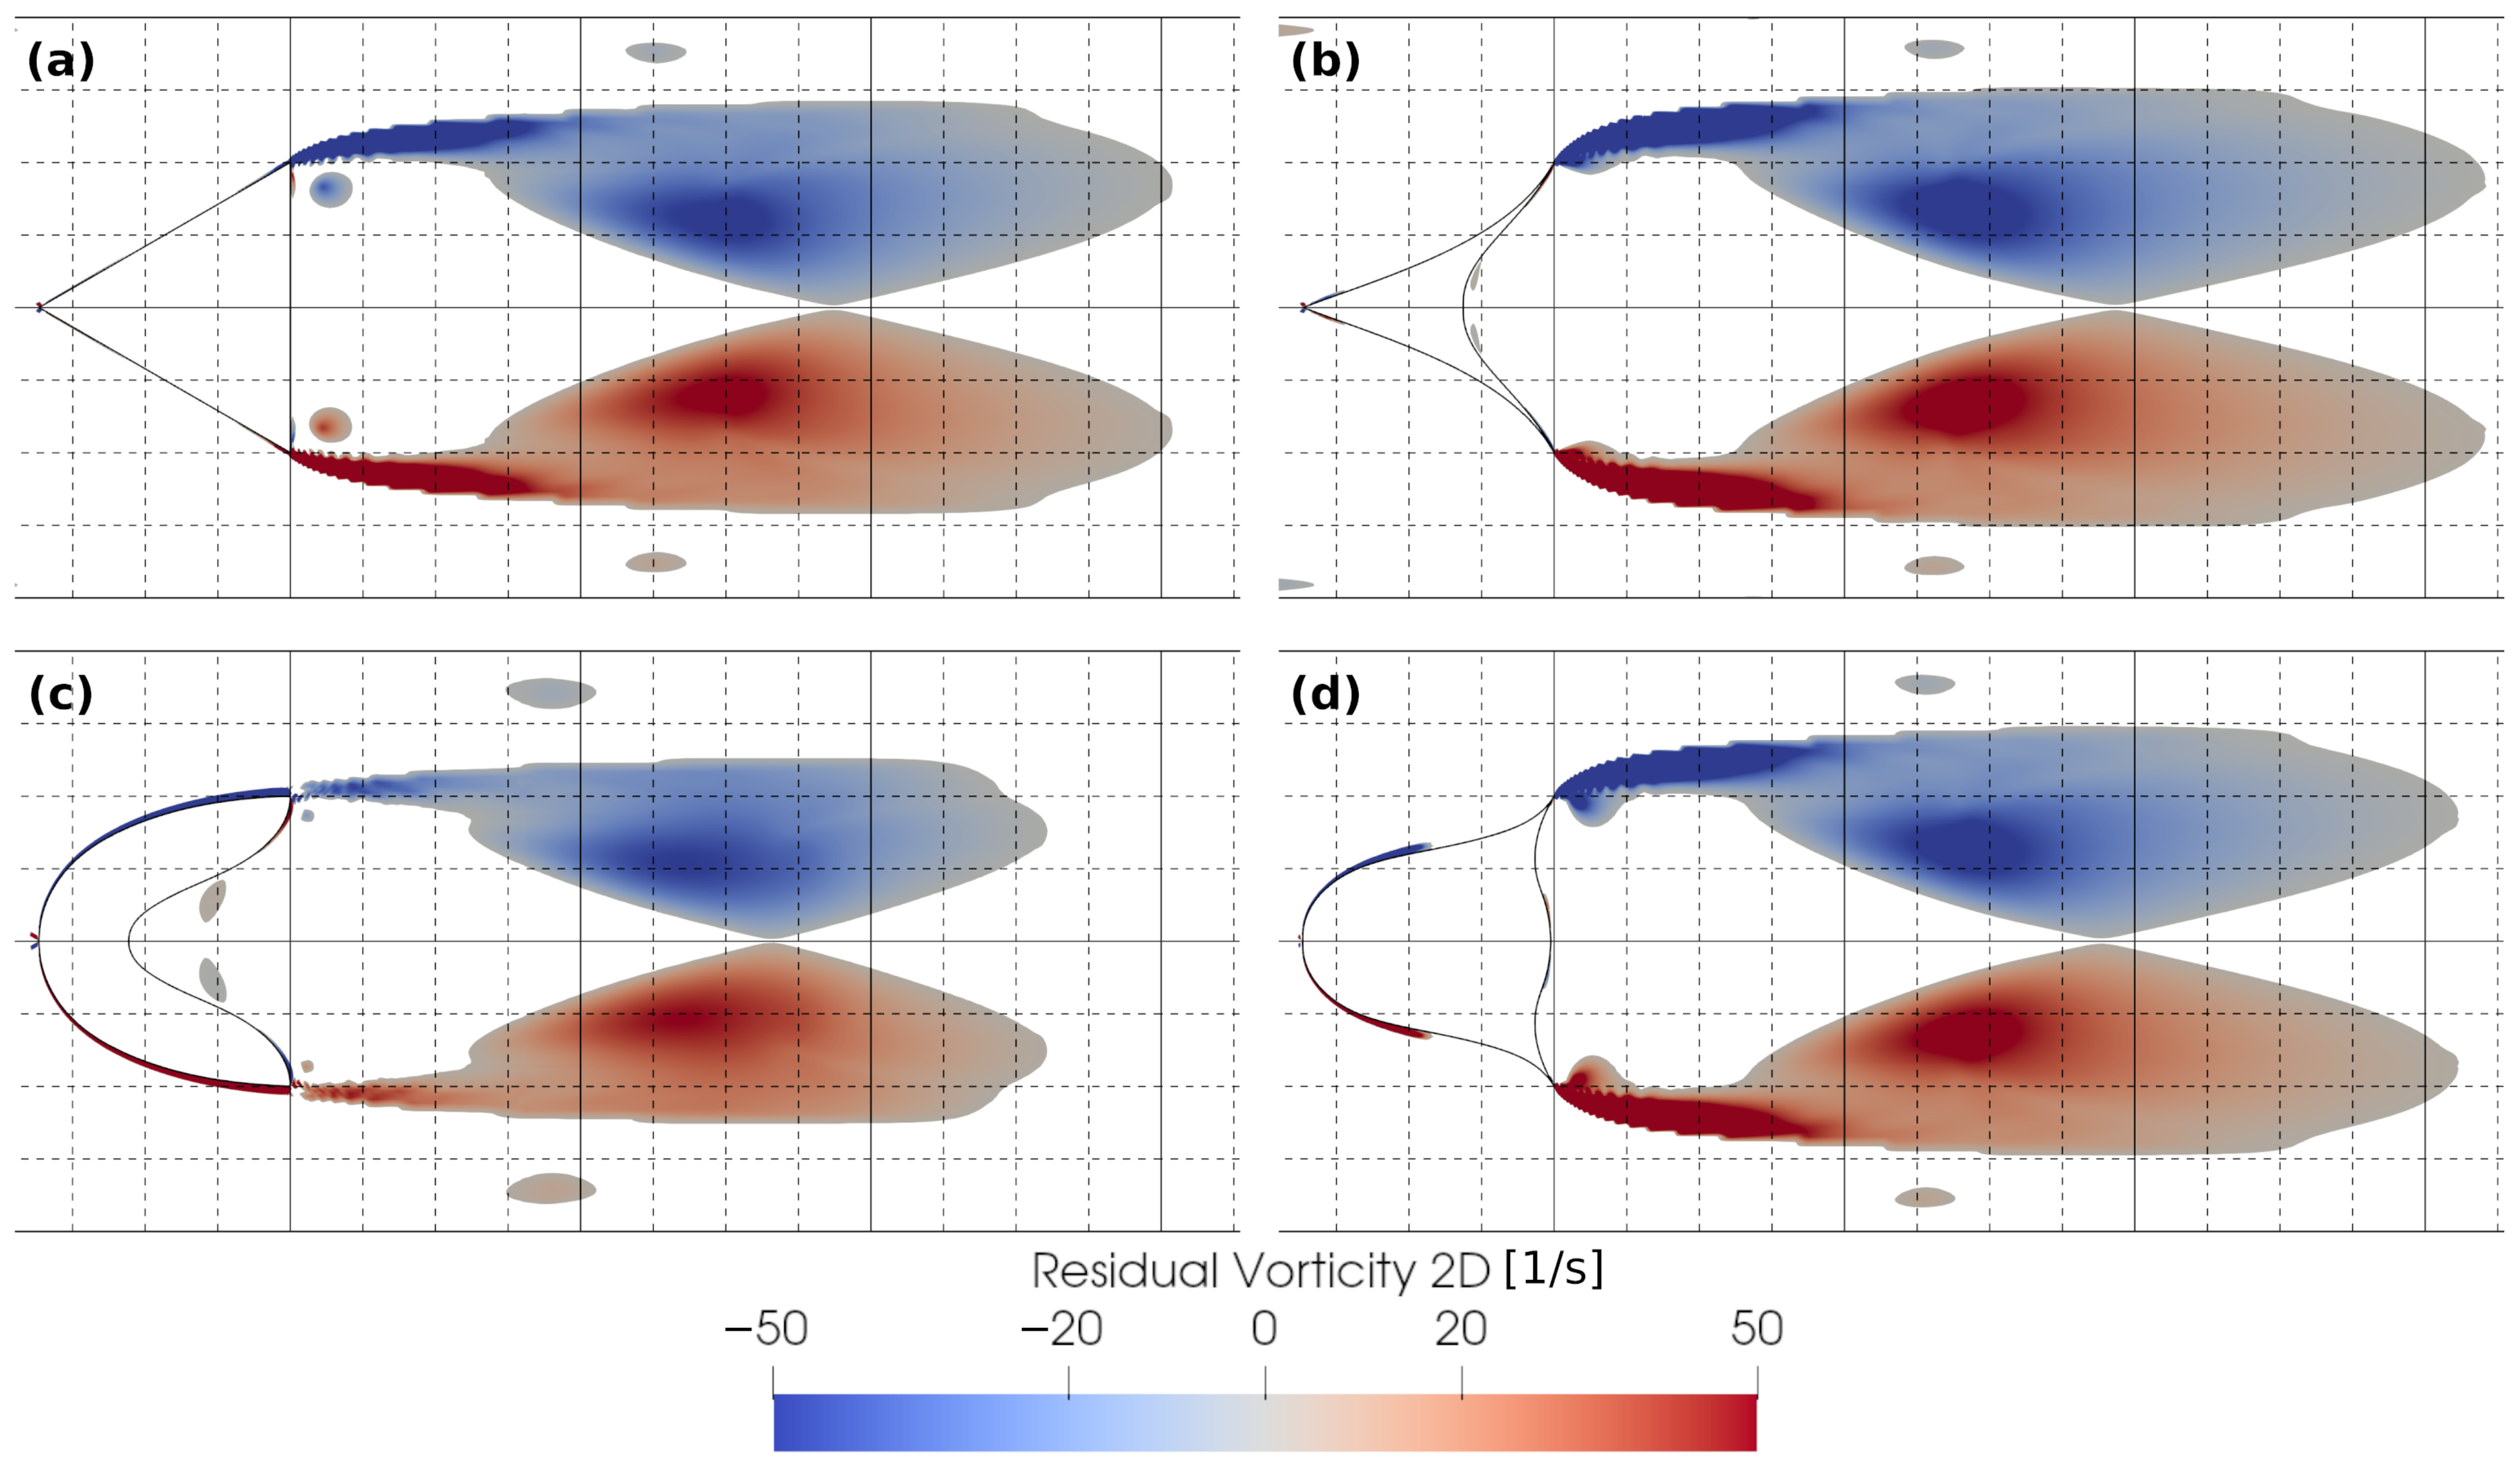
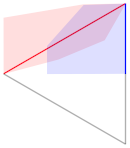
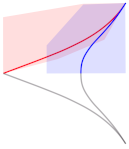
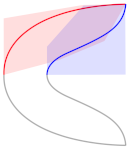
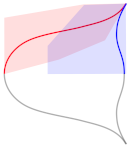
An overview of the results achieved by the optimization is provided in Table 1, together with sketches of the resulting bluff body shapes. Figure 13 shows vortices extracted by the vortex detection tool for each geometry. Contours of residual vorticity are plotted inside the identified vortex regions.
The sensitivities of vortex strength to input parameters (Figure 12-right) indicate that in order to generate stronger vortices, the bluff body should feature a sharp front wedge angle α 1 , guide the flow away from the horizontal direction by a large angle α 2 and have a sharp corner at the rear vertices (small β ). The optimization for maximum vortex strength yields a design that combines all these elements. Figure 13b shows that the vortices in the bluff body wake are both longer and wider in comparison with the baseline bluff body. Vortex strength is increased by 40%, which is accompanied by a drag force rise of 44%.
When optimizing for minimum drag, the three parameters are at the other end of the design space. The resulting shape features a rounded front and the flow is nearly horizontally aligned as it detaches at the rear corners of the body (Figure 13c). The only common feature between the Max. Γ res and Min. F D designs is the positioning of the rear midpoint far upstream, which forms an inward protruding rear face of the bluff body. As discussed before, the parameter x r has a nearly negligible effect on drag force and only a very mild influence on vortex strength. The wake width is reduced, the drag force decreases by 42% and the vortices become by 44% weaker.
The cost function in the last optimization case is set to search for bluff body geometries with a favorable ratio between vortex strength and drag force. By considering vortex strength linearly as opposed to drag force under square root, the emphasis is put more towards the vortex strength enhancement. In spite of that, the front of the optimized bluff body is rounded similarly to the Min. F D design (Figure 13d). The reason is that the sensitivity of drag force to α 1 is on average 3 times higher than that of vortex strength. At the rear vertices, the emphasis on vortex strength maximization prevails and the sharp corners directing the flow towards the tunnel walls resemble the Max. Γ res design. Uniquely to this optimization run, the rear midpoint is placed as far downstream as allowed by the design space. Both the vortex strength and the drag force are increased relatively to the baseline case, by 37% and 22% respectively. The targeted parameter Γ res / F D reaches the highest value of all cases.

4. Conclusions

The present paper discusses a methodology for the shape optimization of an aerodynamic device, targeting a passive control of vortices in its wake. The flow model based on 2D incompressible RANS equations was validated by comparison with experimental data and with a higher-fidelity DES model. Although the RANS model overestimated the wake length, it predicted correct trends of the target parameters with geometry change, which is essential for its use in the optimization procedure.
The identification of vortices was performed with an in-house tool based on residual vorticity. Compared to conventional vorticity, this approach achieved a superior performance in distinguishing swirling from shear. The extracted vortex shapes were qualitatively similar to the Q-criterion, but the use of residual vorticity in the optimization procedure offered significant advantages. It extracted the sense of vortex swirling and, crucially, provided a straightforward means for the quantification of vortex strength. On the other hand, the inherent limitations of its local character resulted in the detection of some small spurious structures and the vortex region boundaries were not captured exactly. A non-local method would probably have to be used to achieve a more accurate vortex extraction, albeit at the cost of a much higher complexity.
The application of the optimization procedure to a bluff body showed a strong correlation between the drag force and the strength of vortices in the wake. Both quantities exhibited a high sensitivity to the shaping of the front part of the body. The most significant parameter was the angle α 2 which controls the flow direction as it separates from the bluff body at its rear vertex. The geometry of the rear part had only a very limited effect on the vortex strength and an even smaller one on the drag force.
The study successfully demonstrated that vortex characteristics can be used as objectives in the shape optimization of an aerodynamic body. Such approach could be useful for example in controlling fuel mixing conditions in the wake of a flame holder. Further research is needed to extend the present approach to three-dimensional flows and to investigate its potential in applications to passive and active flow control.

Author Contributions

Conceptualization, M.P., M.V., R.M. and M.F.; methodology, M.P., R.M. and M.F.; software, M.P., R.M. and E.R.; validation, M.P., R.M. and E.R.; formal analysis, M.P., R.M. and E.R.; investigation, M.P., R.M. and E.R.; resources, M.P., R.M. and E.R.; data curation, M.P., R.M. and E.R.; writing—original draft preparation, M.P., R.M., E.R. and M.F.; writing—review and editing, M.P., R.M., E.R., M.F. and M.V.; visualization, M.P., R.M. and E.R.; supervision, M.P., R.M., M.F. and M.V. All authors have read and agreed to the published version of the manuscript.

Funding

Authors acknowledge support from the ESIF, EU Operational Programme Research, Development and Education, and from the Center of Advanced Aerospace Technology (CZ.02.1.01/0.0/0.0/16_019/0000826), Faculty of Mechanical Engineering, Czech Technical University in Prague.

Data Availability Statement

The raw data supporting the conclusions of this article will be made available by the authors on request.

Acknowledgments

Computational resources were provided by [email protected], a project of Academic Computing within the Department of Control and Computer Engineering at the Politecnico di Torino (http://www.hpc.polito.it, accessed on 29 May 2024).

Conflicts of Interest

The authors declare no conflict of interest.

Abbreviations

The following abbreviations are used in this manuscript:
DESDetached Eddy Simulation
DOEDesign of Experiments
LESLarge Eddy Simulationokes
SSTShear Stress Transport
TDMTriple Decomposition of Motion

References

  1. Gao, D.; Deng, Z.; Yang, W.; Chen, W. Review of the excitation mechanism and aerodynamic flow control of vortex-induced vibration of the main girder for long-span bridges: A vortex-dynamics approach. J. Fluids Struct. 2021, 105, 103348. [Google Scholar] [CrossRef]
  2. Shtork, S.; Suslov, D.; Skripkin, S.; Litvinov, I.; Gorelikov, E. An Overview of Active Control Techniques for Vortex Rope Mitigation in Hydraulic Turbines. Energies 2023, 16, 5131. [Google Scholar] [CrossRef]
  3. Yang, B.; Newton, P.; Martinez-Botas, R. Understanding of Secondary Flows and Losses in Radial and Mixed Flow Turbines. J. Turbomach. 2020, 142, 081006. [Google Scholar] [CrossRef]
  4. De Tavernier, D.; Ferreira, C.; Viré, A.; LeBlanc, B.; Bernardy, S. Controlling dynamic stall using vortex generators on a wind turbine airfoil. Renew. Energy 2021, 172, 1194–1211. [Google Scholar] [CrossRef]
  5. Elcrat, A.; Ferlauto, M.; Zannetti, L. Point vortex model for asymmetric inviscid wakes past bluff bodies. Fluid Dyn. Res. 2014, 46, 031407. [Google Scholar] [CrossRef]
  6. Protas, B. Linear feedback stabilization of laminar vortex shedding based on a point vortex model. Phys. Fluids 2004, 16, 4473–4488. [Google Scholar] [CrossRef]
  7. Illingworth, S.J.; Naito, H.; Fukagata, K. Active control of vortex shedding: An explanation of the gain window. Phys. Rev. E 2014, 90, 043014. [Google Scholar] [CrossRef] [PubMed]
  8. Balsa, C.; Otero-Espinar, M.V.; Gama, S. Exploring Controlled Passive Particle Motion Driven by Point Vortices on a Sphere. Computation 2024, 12, 23. [Google Scholar] [CrossRef]
  9. Mitchell, A.M.; Délery, J. Research into vortex breakdown control. Prog. Aerosp. Sci. 2001, 37, 385–418. [Google Scholar] [CrossRef]
  10. Rashidi, S.; Hayatdavoodi, M.; Esfahani, J.A. Vortex shedding suppression and wake control: A review. Ocean Eng. 2016, 126, 57–80. [Google Scholar] [CrossRef]
  11. Gursul, I.; Wang, Z. Flow Control of Tip/Edge Vortices. AIAA J. 2018, 56, 1731–1749. [Google Scholar] [CrossRef]
  12. Miura, H.; Kida, S. Identification of Tubular Vortices in Turbulence. J. Phys. Soc. Jpn. 1997, 66, 1331–1334. [Google Scholar] [CrossRef]
  13. Ducci, A.; Yianneskis, M. Vortex Identification Methodology for Feed Insertion Guidance in Fluid Mixing Processes. Chem. Eng. Res. Des. 2007, 85, 543–550. [Google Scholar] [CrossRef]
  14. Hunt, J. Vorticity and Vortex Dynamics in Complex Turbulent Flows. Trans. Can. Soc. Mech. Eng. 1987, 11, 21–35. [Google Scholar] [CrossRef]
  15. Haller, G. Lagrangian Coherent Structures. Annu. Rev. Fluid Mech. 2015, 47, 137–162. [Google Scholar] [CrossRef]
  16. Portela, L.M. Identification and Characterization of Vortices in the Turbulent Boundary Layer. Ph.D. Thesis, Stanford University, Stanford, CA, USA, 1998. [Google Scholar]
  17. Sujudi, D.; Haimes, R. Identification of swirling flow in 3-D vector fields. In Proceedings of the 12th Computational Fluid Dynamics Conference, San Diego, CA, USA, 19–22 June 1995. [Google Scholar] [CrossRef]
  18. Sadarjoen, I.A.; Post, F.H. Geometric Methods for Vortex Extraction. In Data Visualization ’99; Proceedings of the Joint EUROGRAPHICS and IEEE TCVG Symposium on Visualization, Vienna, Austria, 26–28 May 1999; Gröller, E., Löffelmann, H., Ribarsky, W., Eds.; Springer: Vienna, Austria, 1999; pp. 53–62. [Google Scholar]
  19. Haller, G.; Hadjighasem, A.; Farazmand, M.; Huhn, F. Defining coherent vortices objectively from the vorticity. J. Fluid Mech. 2016, 795, 136–173. [Google Scholar] [CrossRef]
  20. Banks, D.; Singer, B. Vortex tubes in turbulent flows: Identification, representation, reconstruction. In Proceedings of the Proceedings Visualization ’94, Washington, DC, USA, 21 October 1994; pp. 132–139. [Google Scholar] [CrossRef]
  21. Hadjighasem, A.; Farazmand, M.; Blazevski, D.; Froyland, G.; Haller, G. A critical comparison of Lagrangian methods for coherent structure detection. Chaos Interdiscip. J. Nonlinear Sci. 2017, 27, 053104. [Google Scholar] [CrossRef]
  22. Epps, B. Review of Vortex Identification Methods. In Proceedings of the 55th AIAA Aerospace Sciences Meeting, Grapevine, TX, USA, 9–13 January 2017. [Google Scholar] [CrossRef]
  23. Günther, T.; Theisel, H. The State of the Art in Vortex Extraction: The State of the Art in Vortex Extraction. Comput. Graph. Forum 2018, 37, 149–173. [Google Scholar] [CrossRef]
  24. KolÁř, V. Vortex Identification: New Requirements and Limitations. Int. J. Heat Fluid Flow 2007, 28, 638–652. [Google Scholar] [CrossRef]
  25. Jeong, J.; Hussain, F. On the identification of a vortex. J. Fluid Mech. 1995, 285, 69–94. [Google Scholar] [CrossRef]
  26. Chong, M.S.; Perry, A.E.; Cantwell, B.J. A general classification of three-dimensional flow fields. Phys. Fluids A Fluid Dyn. 1990, 2, 765–777. [Google Scholar] [CrossRef]
  27. Liu, C.; Gao, Y.; Tian, S.; Dong, X. Rortex—A new vortex vector definition and vorticity tensor and vector decompositions. Phys. Fluids 2018, 30, 035103. [Google Scholar] [CrossRef]
  28. Liu, C.; Gao, Y.s.; Dong, X.r.; Wang, Y.q.; Liu, J.m.; Zhang, Y.n.; Cai, X.s.; Gui, N. Third generation of vortex identification methods: Omega and Liutex/Rortex based systems. J. Hydrodyn. 2019, 31, 205–223. [Google Scholar] [CrossRef]
  29. Morajkar, R.R.; Klomparens, R.L.; Eagle, W.E.; Driscoll, J.F.; Gamba, M.; Benek, J.A. Relationship Between Intermittent Separation and Vortex Structure in a Three-Dimensional Shock/Boundary-Layer Interaction. AIAA J. 2016, 54, 1862–1880. [Google Scholar] [CrossRef]
  30. Morajkar, R.R.; Gamba, M. Turbulence Characteristics of Supersonic Corner Flows in a Low Aspect Ratio Rectangular Channel. In Proceedings of the 54th AIAA Aerospace Sciences Meeting, San Diego, CA, USA, 4–8 January 2016. [Google Scholar]
  31. Wang, F.; Li, W.; Wang, S. Polar Cyclone Identification from 4D Climate Data in a Knowledge-Driven Visualization System. Climate 2016, 4, 43. [Google Scholar] [CrossRef]
  32. Pátý, M.; Resta, E.; Ferlauto, M.; Marsilio, R. On the Use of Vortex Identification for the Optimisation of Trapped Vortex Devices. In Proceedings of the AIAA SCITECH 2024 Forum, Orlando, FL, USA, 8–12 January 2024. [Google Scholar] [CrossRef]
  33. Pátý’, M.; Lavagnoli, S. A Novel Vortex Identification Technique Applied to the 3D Flow Field of a High-Pressure Turbine. J. Turbomach. 2020, 142, 031004. [Google Scholar] [CrossRef]
  34. Nagata, R.; Watanabe, T.; Nagata, K.; da Silva, C.B. Triple decomposition of velocity gradient tensor in homogeneous isotropic turbulence. Comput. Fluids 2020, 198, 104389. [Google Scholar] [CrossRef]
  35. Fujii, S.; Gomi, M.; Eguchi, K. Cold Flow Tests of a Bluff-Body Flame Stabilizer. J. Fluids Eng. 1978, 100, 323–332. [Google Scholar] [CrossRef]
  36. Liou, M.S. A sequel to AUSM: AUSM+. J. Comput. Phys. 1996, 129, 364–382. [Google Scholar] [CrossRef]
  37. Poinsot, T.; Lele, S. Boundary conditions for direct simulations of compressible viscous reacting flows. J. Comput. Phys. 1992, 101, 104–129. [Google Scholar] [CrossRef]
  38. Spalart, P.; Allmaras, S. A One-Equation Turbulence Model for Aerodynamic Flows. Rech. Aerosp. 1994, 1, 5–21. [Google Scholar]
  39. Spalart, P.; Deck, S.; Shur, M.; Squires, K.; Strelets, M.; Travin, A. A New Version of Detached-eddy Simulation, Resistant to Ambiguous Grid Densities. Theor. Comput. Fluid Dyn. 2006, 20, 181–195. [Google Scholar] [CrossRef]
  40. Kolář, V. A note on integral vortex strength. J. Hydrol. Hydromech. 2010, 58, 23–28. [Google Scholar] [CrossRef]
  41. ANSYS, Inc. DesignXplorer User’s Guide, 2022. Release 2022 R2. Available online: https://ansyshelp.ansys.com/ (accessed on 1 May 2024).
  42. Kim, W.W.; Lienau, J.J.; Van Slooten, P.R.; Colket, M.B.; Malecki, R.E.; Syed, S. Towards Modeling Lean Blow Out in Gas Turbine Flameholder Applications. J. Eng. Gas Turbines Power 2006, 128, 40–48. [Google Scholar] [CrossRef]
Figure 1. Computational domain.
Fluids 09 00131 g001
Figure 2. Parametric modelling of the bluff body geometry with Bézier curves.
Fluids 09 00131 g002
Figure 3. Grids generated for different bluff body shapes.
Fluids 09 00131 g003
Figure 4. Sketch of the optimization procedure. From [32]. Copyright 2024 by Marek Pátý, Emanuele Resta, Michele Ferlauto and Roberto Marsilio.
Fluids 09 00131 g004
Figure 5. Design space for shape optimization of the bluff body.
Fluids 09 00131 g005
Figure 6. Axial velocity from RANS and DES simulations and experimental data [35].
Fluids 09 00131 g006
Figure 7. Recirculation zone length (top) and drag coefficient (bottom) from RANS and DES simulations. Experimental data from [35].
Fluids 09 00131 g007
Figure 8. Velocity fields from the RANS and DES simulations on two geometries: (a) RANS, baseline, (b) DES, baseline, (c) RANS, optimized, (d) DES, optimized.
Fluids 09 00131 g008
Figure 9. Comparison of vortex identification criteria. From top to bottom: vorticity, residual vorticity, Q-criterion.
Fluids 09 00131 g009
Figure 10. Drag as a function of vortex strength for the points generated during the design of experiments, together with a linear interpolation.
Fluids 09 00131 g010
Figure 11. Convergence history during optimization for maximum vortex strength.
Fluids 09 00131 g011
Figure 12. Local sensitivity of output to input parameters in the optimization.
Fluids 09 00131 g012
Figure 13. Vortex regions with residual vorticity contours for (a) the baseline triangular bluff body and geometries optimized for (b) maximum vortex strength, (c) minimum drag force, (d) maximum ratio of vortex strength to the square root of drag.
Fluids 09 00131 g013
Table 1. Drag force, vortex strength and ratio of vortex strength to the square root of drag for the following configurations: (1) Baseline triangle, (2) Optimized for maximum vortex strength, (3) Optimized for minimum drag, (4) Optimized for maximum ratio of vortex strength to the square root of drag. All values normalized by the baseline.
Triangle
Fluids 09 00131 i001
Max.  Γ res
Fluids 09 00131 i002
Min.  F D
Fluids 09 00131 i003
Max.  Γ res / F D
Fluids 09 00131 i004
F D 1.01.440.581.22
Γ res 1.01.40.561.37
Γ res / F D 1.01.170.731.24
Disclaimer/Publisher’s Note: The statements, opinions and data contained in all publications are solely those of the individual author(s) and contributor(s) and not of MDPI and/or the editor(s). MDPI and/or the editor(s) disclaim responsibility for any injury to people or property resulting from any ideas, methods, instructions or products referred to in the content.