Article

Comparison of Libration- and Precession-Driven Flows: From Linear Responses to Broadband Dynamics

1
School of Mathematical Science, University of Electronic Science and Technology of China, Chengdu 611731, China
2
School of Mathematical and Statistical Sciences, Arizona State University, Tempe, AZ 85287, USA
*
Author to whom correspondence should be addressed.
Fluids 2024, 9(7), 151; https://doi.org/10.3390/fluids9070151
Submission received: 20 May 2024 / Revised: 15 June 2024 / Accepted: 20 June 2024 / Published: 23 June 2024
(This article belongs to the Section Geophysical and Environmental Fluid Mechanics)

Abstract

:
Libration and precession are different body forces that are ubiquitous in many rapidly rotating systems, particularly in geophysical and astrophysical flows. Libration is a modulation of the background rotation magnitude, whereas precession is a modulation of the background rotation direction. Assessing the consequences of these body forces in large-scale flows is challenging. The Ekman number, the ratio of the rotation time scale to the viscous time scale quantifying the rotation speed, is extremely small, leading to extremely thin and intense shear layers in the flows even when the amplitudes of the body forces are very small. We consider the consequences of libration and precession numerically in a geometrically simple container, a cube, which lends itself to very efficient, accurate, and robust numerical treatment, with the axis of rotation passing through opposite vertices, so that all walls of the cube are at oblique angles to the rotation axis. This results in the geometric focusing of inertial wavebeams reflecting off the walls, whereby the energy density of the wavebeams increases along with the magnitude of their wavevector. The nature of this focusing depends on the forcing frequency but not on the body force. In the inviscid setting, wavebeams form infinitesimally thin vortex sheets, and their energy density becomes unbounded upon focusing. We present linear inviscid ray tracing to set the scene for the focusing of wavebeams and then consider viscous problems at an Ekman number that is typical of current state-of-the-art laboratory experiments. We begin by considering the linear responses, which are comprised of focusing viscous shear layers, of which their details are mostly captured via ray tracing, and particular solutions accounting for the body forces. These have complicated spatio-temporal structures, which differ for libration and precession. Increasing the forcing amplitude from zero introduces nonlinear interactions, enhances the focusing effects via vortex tilting and stretching when the shear layers reflect at the walls, and also introduces temporal superharmonics and a mean flow. When the magnitude of the mean flow is within a few percent of the magnitude of the instantaneous flow, instabilities breaking the spatio-temporal symmetries set in. These are localized in the oscillatory boundary layers where the reflections are concentrated and introduce broadband dynamics in the boundary layers, with additional inertial wavebeams emitted into the interior. The details again depend on the specifics of the body forces.

1. Introduction

Precession and libration are two forcing mechanisms that play fundamental roles in driving inertial oscillations in rapidly rotating bodies, such as in the liquid cores of planets and other astrophysical bodies [1]. Their rapid rotation, characterized by an Ekman number of order 10−15 corresponding to the ratio of their rotation and viscous time scales, makes the theoretical study of these inertial oscillations very challenging. These types of flows are studied using laboratory experiments in simple enclosed geometries, but typically at Ekman numbers of order 10−5 and subjected to precession or libration at forcing amplitudes that are relatively large, characterized by a Rossby number of order 10−2, close to the critical value for the onset of instabilities. In axisymmetric containers, libration and precession result in fundamentally different primary response flows: at low forcing amplitudes, the primary response to libration is axisymmetric, whereas the flow due to precession is three-dimensional with azimuthal wavenumber one. On the other hand, for a very fast mean rotation subjected to vanishingly small forcing amplitudes, the linear inviscid theory of inertial oscillations is independent of the form of the forcing. How do the different symmetries associated with precession and libration impact the nature of instabilities as the forcing amplitudes are increased? We are unaware of any direct head-to-head comparisons between instabilities due to precession and libration. The review articles [1,2] provide overviews of flows driven by libration and precession, as well as other forcing mechanisms, but no direct comparison. Part of the problem with such a comparison is that the libration of axisymmetric containers drives a response flow via viscous torques on the boundaries, and a relatively large forcing amplitude is typically required to drive instabilities, whereas precession has pressure torques also contributing to the driving and so smaller amplitudes lead to stronger responses.
A rapidly rotating cube is a simple geometry for which both precession and libration exert a significant pressure torque. The effects of libration and precession have been studied separately for a cube oriented relative to the rotation axis with all walls either parallel or orthogonal to the mean rotation axis [3,4]. This orientation allows for a partial separation of variables in the linear inviscid limit and the existence of intrinsic container modes with a discrete but dense spectrum [5]. The intrinsic modes that are resonantly excited by very small amplitude forcing are those with symmetries that are consistent with the spatio-temporal symmetries of the forcing, which are different for libration and precession [3,4]. When viscosity is accounted for, the linear problem becomes ambiguous; if the forcing is ignored, then the intrinsic modes are viscously damped, and solid-body rotation occurs. On the other hand, if the forcing is taken into account, then beams are emitted from edges and vertices, with a continuous spectrum in the inertial range. At forcing frequencies corresponding to resonances with low-order intrinsic modes, both beams and the resonated mode are present [6] and interact nonlinearly [3].
Here, we consider a non-axisymmetric container consisting of a cube with mean rotation along an axis through its center and two opposite vertices, called the north and south polar vertices. As with the orientation of the cube with walls orthogonal or parallel to the mean rotation, both libration and precession drive response flows via a combination of both viscous and pressure torques. In the present case, the primary responses are dominated by shear layers emitted into the interior from some edges and vertices (which ones emit depends on the forcing frequency), and in the context of linear inviscid theory, these responses are independent of the nature of the forcing [7]. Furthermore, the obliqueness between the wall normals and the rotation axis leads to the focusing of these shear layers upon reflection [8], whereby the thickness of the shear layer decreases whilst its energy and enstrophy densities increase. Following successive reflections, the shear layers tend to converge to the edges and vertices of the cube to form so-called point attractors [7,9], much as in the wedge and conical flows considered in [10,11]. Greenspan [10] noted that there is no linear inviscid mechanism that allows the wavebeams that focus onto the point attractor to return to the interior except total reflection from an intense singularity at the focusing vertex. So what actually happens in a real flow subjected to either precession or libration for small but finite Ekman and Rossby numbers? This is addressed here using direct numerical simulations (DNSs) of the three-dimensional Navier–Stokes equations, solved using a high-accuracy spectral code that is optimized for the cube geometry.

2. Governing Equations, the Numerics to Solve Them, and Their Symmetries

2.1. Governing Equations

A cube of side length L, filled with an incompressible fluid of kinematic viscosity ν , rotates at a mean angular velocity Ω 0 about an axis passing through its center and two diagonally opposite vertices. The system is non-dimensionalized using the length scale L and time scale 1 / Ω 0 , and is described in terms of a non-dimensional Cartesian coordinate system x = ( x , y , z ) [ 0.5 , 0.5 ] 3 that is fixed in the cube, with the origin at its center. The non-dimensional mean rotation axis is
Ω 0 = ( 1 , 1 , 1 ) / 3 .
The ratio of the rotation time, 1 / Ω 0 , and the viscous time, L 2 / ν , produces the Ekman number:
E = ν Ω 0 L 2 .
Two types of parametric forcing, libration and precession, are considered. Schematics of the two set-ups are shown in Figure 1.
For librational forcing, the mean rotation axis Ω 0 is harmonically modulated by the librational angular velocity vector in the same direction, given by
Ω l ( t ) = Ro cos ( 2 ω t ) Ω 0 ,
where 2 ω is the libration frequency with a corresponding libration period τ = π / ω , the Rossby number
Ro = δ ϑ Ω l / Ω 0 ,
is the libration forcing amplitude, and δ ϑ is the libration angular displacement.
For precessional forcing, the mean rotation axis Ω 0 rotates with non-dimensional angular velocity Ω p / Ω 0 about another axis that is tilted by an angle ϑ . The non-dimensional precession angular velocity can be expressed as
Ω p ( t ) = Po P Θ ( t ) ,
where
Po = Ω p / Ω 0
is the Poincaré number, and the matrix
P = 1 / 6 1 / 2 1 / 3 1 / 6 1 / 2 1 / 3 2 / 3 0 1 / 3
rotates the standard unit vectors in the x, y, and z directions of the rotating frame into an orthogonal frame, consisting of the mean rotation axis Ω 0 (the last column of P ) and two vectors orthogonal to Ω 0 , and
Θ ( t ) = sin ( ϑ ) cos ( t ) sin ( ϑ ) sin ( t ) cos ( ϑ ) .
While Ω l has variable magnitude but fixed direction Ω 0 , Ω p has fixed magnitude | Po | but variable direction. The component Po cos ( ϑ ) Ω 0 of Ω p parallel to Ω 0 alters the solid-body rotation of the cube. The component of Ω p orthogonal to Ω 0 has modulus | Po | sin ( ϑ ) , providing a non-dimensional measure of the precessional forcing amplitude.
The non-dimensional Navier–Stokes equations in the cube reference frame are
u t + ( u · ) u + 2 Ω × u + q E 2 u = d Ω d t × x , · u = 0 ,
with no-slip boundary conditions u = 0 , where
Ω ( t ) = Ω 0 + Ω l ( t ) for libration , Ω 0 + Ω p ( t ) for precession .
In both cases, the centrifugal force Ω × ( Ω × x ) is a gradient field with potential that is absorbed into the pressure q.
For sufficiently small forcing amplitudes, the response is a synchronous flow with a velocity magnitude that is proportional to the forcing amplitude. It is then convenient to rescale the velocity by a factor α that is commensurate with the forcing amplitude [12]. In letting u = α v and q = α p , (9) becomes
v t + α ( v · ) v + 2 Ω × v + p E 2 v = f , · v = 0 ,
with no-slip boundary conditions v = 0 , and the forcing amplitude
α = Ro for libration , | Po | sin ( ϑ ) for precession ,
and the Euler force
f = 2 ω sin ( 2 ω t ) Ω 0 × x for libration , Po | Po | P sin ( t ) cos ( t ) 0 × x for precession ,
is independent of α .
In order to compare libration and precession response flows, the forcing amplitudes and frequencies need to be matched. For libration, the forcing amplitude and frequency can be set independently by selecting values for Ro and ω . For precession, this is not so straightforward. For given Ro and ω , we shall determine Po and ϑ by matching the amplitudes, | Po | sin ϑ = Ro , and matching the ratio of the non-dimensional forcing angular frequency to the non-dimensional mean angular velocity of the cube in the mean rotation axis direction, 1 / [ 1 + Po cos ( ϑ ) ] = 2 ω . This leads to
Po = 1 2 ω 2 ω 1 + 2 ω Ro 1 2 ω 2 and ϑ = arctan 2 ω Ro | 1 2 ω | .

2.2. Numerics

The governing Equation (11) is solved using a spectral spatial discretization scheme together with a third-order temporal scheme. At each time-step, a third-order backward difference formula with a third-order extrapolation scheme (BDF3-EX3) is used to advance the velocity components. The body forces and the viscous terms are treated implicitly, while the nonlinear terms and the pressure gradient are treated explicitly, resulting in an elliptic system of equations. The pressure is updated by solving a Poisson equation. The elliptic and Poisson systems of equations are discretized in space using Legendre polynomials of degree in each of the three directions for the velocity and degree ( 2 ) for the pressure. The Legendre polynomials are combined into base functions for the velocity that enforce the no-slip boundary conditions, while the lower-degree polynomials for the pressure guarantee the well-posedness of the resulting discrete problems. The details of the numerical method are described in [13].
All the results to be presented are for a fixed Ekman number E = 10 5 . This is small enough to be in a fast-rotation regime dominated by inertial oscillations, and is typical of currently accessible laboratory experiments. It would correspond to a cube of side length L = 22 cm , filled with water at room temperature with a kinematic viscosity of ν = 0.01 c m 2 / s , rotating at Ω 0 = 2 r a d / s . We consider three forcing half frequencies, ω = 0.70 , ω = 1 / 3 , and ω = 0.24 , that display qualitatively different response behaviors.
The spatial and temporal resolutions used depend on E , Ro , and ω . In keeping E = 10 5 , the polynomial degree used is = 100 for Ro < Ro c 10 2 , where Ro c is the critical Ro for instability, and = 150 for Ro > Ro c , for the three values of ω considered. The number of time steps per forcing period, N t , also varies with ω . For ω = 0.24 , N t = 400 for Ro < Ro c and N t = 1600 for Ro > Ro c , while for ω = 1 / 3 and ω = 0.70 , N t = 200 for Ro < Ro c and N t = 800 for Ro > Ro c .
To assess the spatio-temporal characteristics of the flows, we use the enstrophy density ω 2 = | × v | 2 and, for global measures, the enstrophy and the kinetic energy
E ( v ) = V ω 2 d x and K = 0.5 V v 2 d x .

2.3. Symmetries

The librationally forced system (11) is invariant to a discrete rotation of angle 2 π / 3 about the rotation axis Ω 0 ,
R 0 : [ v , p ] ( x , t ) [ J v , p ] ( J x , t ) ,
where
J = 0 0 1 1 0 0 0 1 0 ,
and a reflection through the origin,
C : [ v , p ] ( x , t ) [ v , p ] ( x , t ) .
The centrosymmetry C generates a cyclic group Z 2 consisting of { I , C } , and the rotation R 0 generates a cyclic group Z 3 consisting of { I , R 0 , R 0 2 } , where I is the identity, and C 2 = R 0 3 = I . Since C R 0 = R 0 C , the symmetry group of the system is Z 2 × Z 3 . As the system is periodically forced with period τ , it is invariant to the time translation symmetry:
T τ : [ v , p ] ( x , t ) [ v , p ] ( x , t + τ ) .
The precessionally forced system is invariant to C but not R 0 . Instead, it is invariant to the spatio-temporal symmetry
T τ / 3 R 0 : [ v , p ] ( x , t ) [ J v , p ] ( J x , t + τ / 3 ) ,
corresponding to the composition of R 0 with a time shift of a third of a period. The symmetry (20) of the Navier–Stokes system (11) results from the property of the rotation vector Ω p
Ω p ( t + 2 π / 3 ) = Po P Θ ( t + π / 3 ) = Po P Q Θ ( t ) = Po J P Θ ( t ) = J Ω p ( t )
with P given by (7) and
Q = 1 / 2 3 / 2 0 3 / 2 1 / 2 0 0 0 1 .
While J represents a rotation of angle 2 π / 3 around Ω 0 , Q represents a rotation of angle 2 π / 3 around ( 0 , 0 , 1 ) , with J 3 = Q 3 = I , the identity matrix. The relation P Q = J P used in (21) reflects the similarity between J and Q via the transition matrix P between the orthonormal frame associated with the axis of rotation and that associated with the ( x , y , z ) coordinate system.

3. Linear Responses to Librational and Precessional Forcings

In this section, we consider the primary responses for vanishingly small forcing amplitudes α . Formally setting α = 0 in (11) results in the forced linear system
v t + 2 γ Ω 0 × v + p E 2 v = f , · v = 0 ,
with
γ = 1 for libration , 1 + Po for precession .
For libration, setting α = 0 corresponds to setting Ro = 0 , and for precession, this corresponds to setting ϑ = 0 . The boundary conditions remain no-slip, v = 0 . The solutions of this linear system are the superpositions of the solutions to the homogeneous system, with f = 0 , plus a particular solution accounting for f . This forced response is a synchronous non-inertial wave for which the left-hand-side of (23) does not vanish.
The linear system (23) is solved numerically as an initial valued problem using the same numerics, described in Section 2.2, used for the nonlinear system (11). However, before presenting these results, it is instructive to first consider linear inviscid ray tracing.

3.1. Linear Inviscid Ray Tracing

Applying ( t E 2 ) × × to (23) eliminates both the pressure gradient and the (scaled) Euler force f , resulting in the homogeneous equation
( t E 2 ) 2 2 v + 4 γ 2 ( Ω 0 · ) 2 v = 0 .
In the idealized inviscid setting, with E = 0 , non-trivial solutions of (25) include plane wave solutions v = a e i φ + c . c , with c . c . denoting complex conjugate. Here, a 0 , phase φ = k · x 2 γ σ t , and wavevector k = | k | k ^ , provided that the dispersion relation
σ = ± Ω 0 · k ^ = cos ( β )
holds, where 0 < β < π / 2 is the Euclidean angle between ± Ω 0 and the wavevector k . The dispersion relation (26) is independent of the factor γ and, hence, of the type of forcing. Also, system (25), with E = 0 , has additional symmetries compared to linear system (23) forced by either libration or precession, particularly time-reversal symmetry t t , since it does not have the viscous term or the Euler force term.
Not all plane wave solutions of (25) satisfy (23) with f = 0 and E = 0 . For those that do, the complex vector a and real wavevector k must also satisfy
σ a + i Ω 0 × a = p k , a · k = 0 ,
with p = 2 σ p e i φ + c . c . Relations (27) lead to the constraint a = ± i a × k ^ , i.e., that the wave be circularly polarized, v = a sin ( φ ) + b cos ( φ ) , with a = i ( a a * ) and b = a + a * = ± a × k ^ representing the imaginary and real parts of 2 a * , respectively [14] (compare with Appendix A). Without loss of generality, the direction a can be taken to be that of the wave group velocity that controls the propagation of energy, σ / k T = ± [ Ω 0 ( Ω 0 · k ^ ) k ^ ] / | k | , since both are orthogonal to the wavevector k . This direction forms an angle ( π / 2 β ) with ± Ω 0 and can be followed via ray tracing.
The Vertex and Edge Beam Analysis (VEBA) described in [7] is an ensemble of ray tracings that follow a , with the sites and directions of the emitted inertial rays informed by geometric and viscous considerations. For small-amplitude libration or precession, viscous interactions between the oscillatory boundary layers on adjoining walls lead to inertial wavebeams being emitted into the cube from vertices and/or edges. In general, a vertex may emit along a double cone of directions with its apex at the emission point forming a conical sheet. However, a point on an edge may only emit in at most four directions because of continuity requirements with beams emitted from neighboring points. Here, the direction of emission is selected, as in [15], using a tangentiality condition with conical sheets emitted from the endpoints of the edge, if any, rather than enforcing the time-reversal symmetry of (23) with E = 0 and f = 0 pointwise, as was originally performed in [14]. This results in slightly different sections, with the current approach better matching the DNS. Which vertices and/or edges emit depends on the forcing frequency. For the harmonic forcing f from (13), only those inertial waves that are resonated come into play, and σ = ω in the phase φ of v and p.
For the present configuration, the inviscid linear theory shows that beams are emitted from the polar vertices for 0 < ω < 2 / 3 and from the tropical vertices for 1 / 3 < ω < 1 , while beams are emitted from polar edges for 0 < ω < 1 / 3 and from tropical edges for 1 / 3 < ω < 1 . The ω -limits of these regimes correspond to 1 / 3 , which is the cosine of the angle between the rotation axis and the edges, and to 2 / 3 , which is the cosine of the angle between the rotation axis and the walls. Appendix A describes how the direction a of a beam emitted from a polar edge is determined in the regime ω < 1 / 3 .
Following a sequence of wall reflections, the emitted beams focus onto tropical edges or vertices for 0 < ω < 1 / 3 and onto polar edges or vertices for 1 / 3 < ω < 1 [4]. At exactly ω = 1 / 3 , all beams emitted from edges are trapped in the walls [16]. In the intermediate regime 1 / 3 < ω < 2 / 3 , the poles each emit all but three beams into the interior of the cube. At ω = 1 / 3 , these beams critically reflect on the walls, with themselves becoming trapped.
Figure 2 shows the intersections of wavebeams predicted via VEBA with the surface of the cube viewed from the top, a meridional plane viewed from the side, and the equatorial plane viewed from the top, for three representative values of ω : 0.70 , 1 / 3 , and 0.24 . The meridional view contains the rotation axis, pointing upward in the page, and the north and south poles corresponding to the top and bottom vertices. Both the surface and equatorial views have the rotation axis pointing out of the page, with the north pole in the middle of the image. The color represents the enstrophy density of a circularly polarized wave, which increases upon each reflection. The initial density is arbitrary and set to 10, corresponding to a light blue color in both surface and interior colorbar scales. All beams eventually focus toward tropical edges for ω < 1 / 3 and polar edges or vertices for ω > 1 / 3 , where the enstrophy density becomes large, corresponding to saturated red locations in the views.
All rays and their reflections propagate along straight lines. The collection of rays from edges form planar sheets, and those from vertices they form conic sheets. The intersection of the conic sheets (and their reflections) with any plane are conic sections. In the meridional and equatorial planes, the cross-sections of beams emitted from edges form straight lines, while beams emanating from vertices form curves that are not straight, unless the viewing plane contains both the emission point and the axis of rotation, as, for example, in the meridional plane for ω = 0.24 and ω = 1 / 3 . In such cases, it is easy to mistake the beams emitted from the pole, which are entirely contained in the plane, at an angle ( π / 2 β ) with the axis of rotation determined by the dispersion relation (26) (with σ = ω ), for the trace of planar sheets emitted from polar edges, which are further away from the rotation axis.

3.2. Viscous Linear Responses

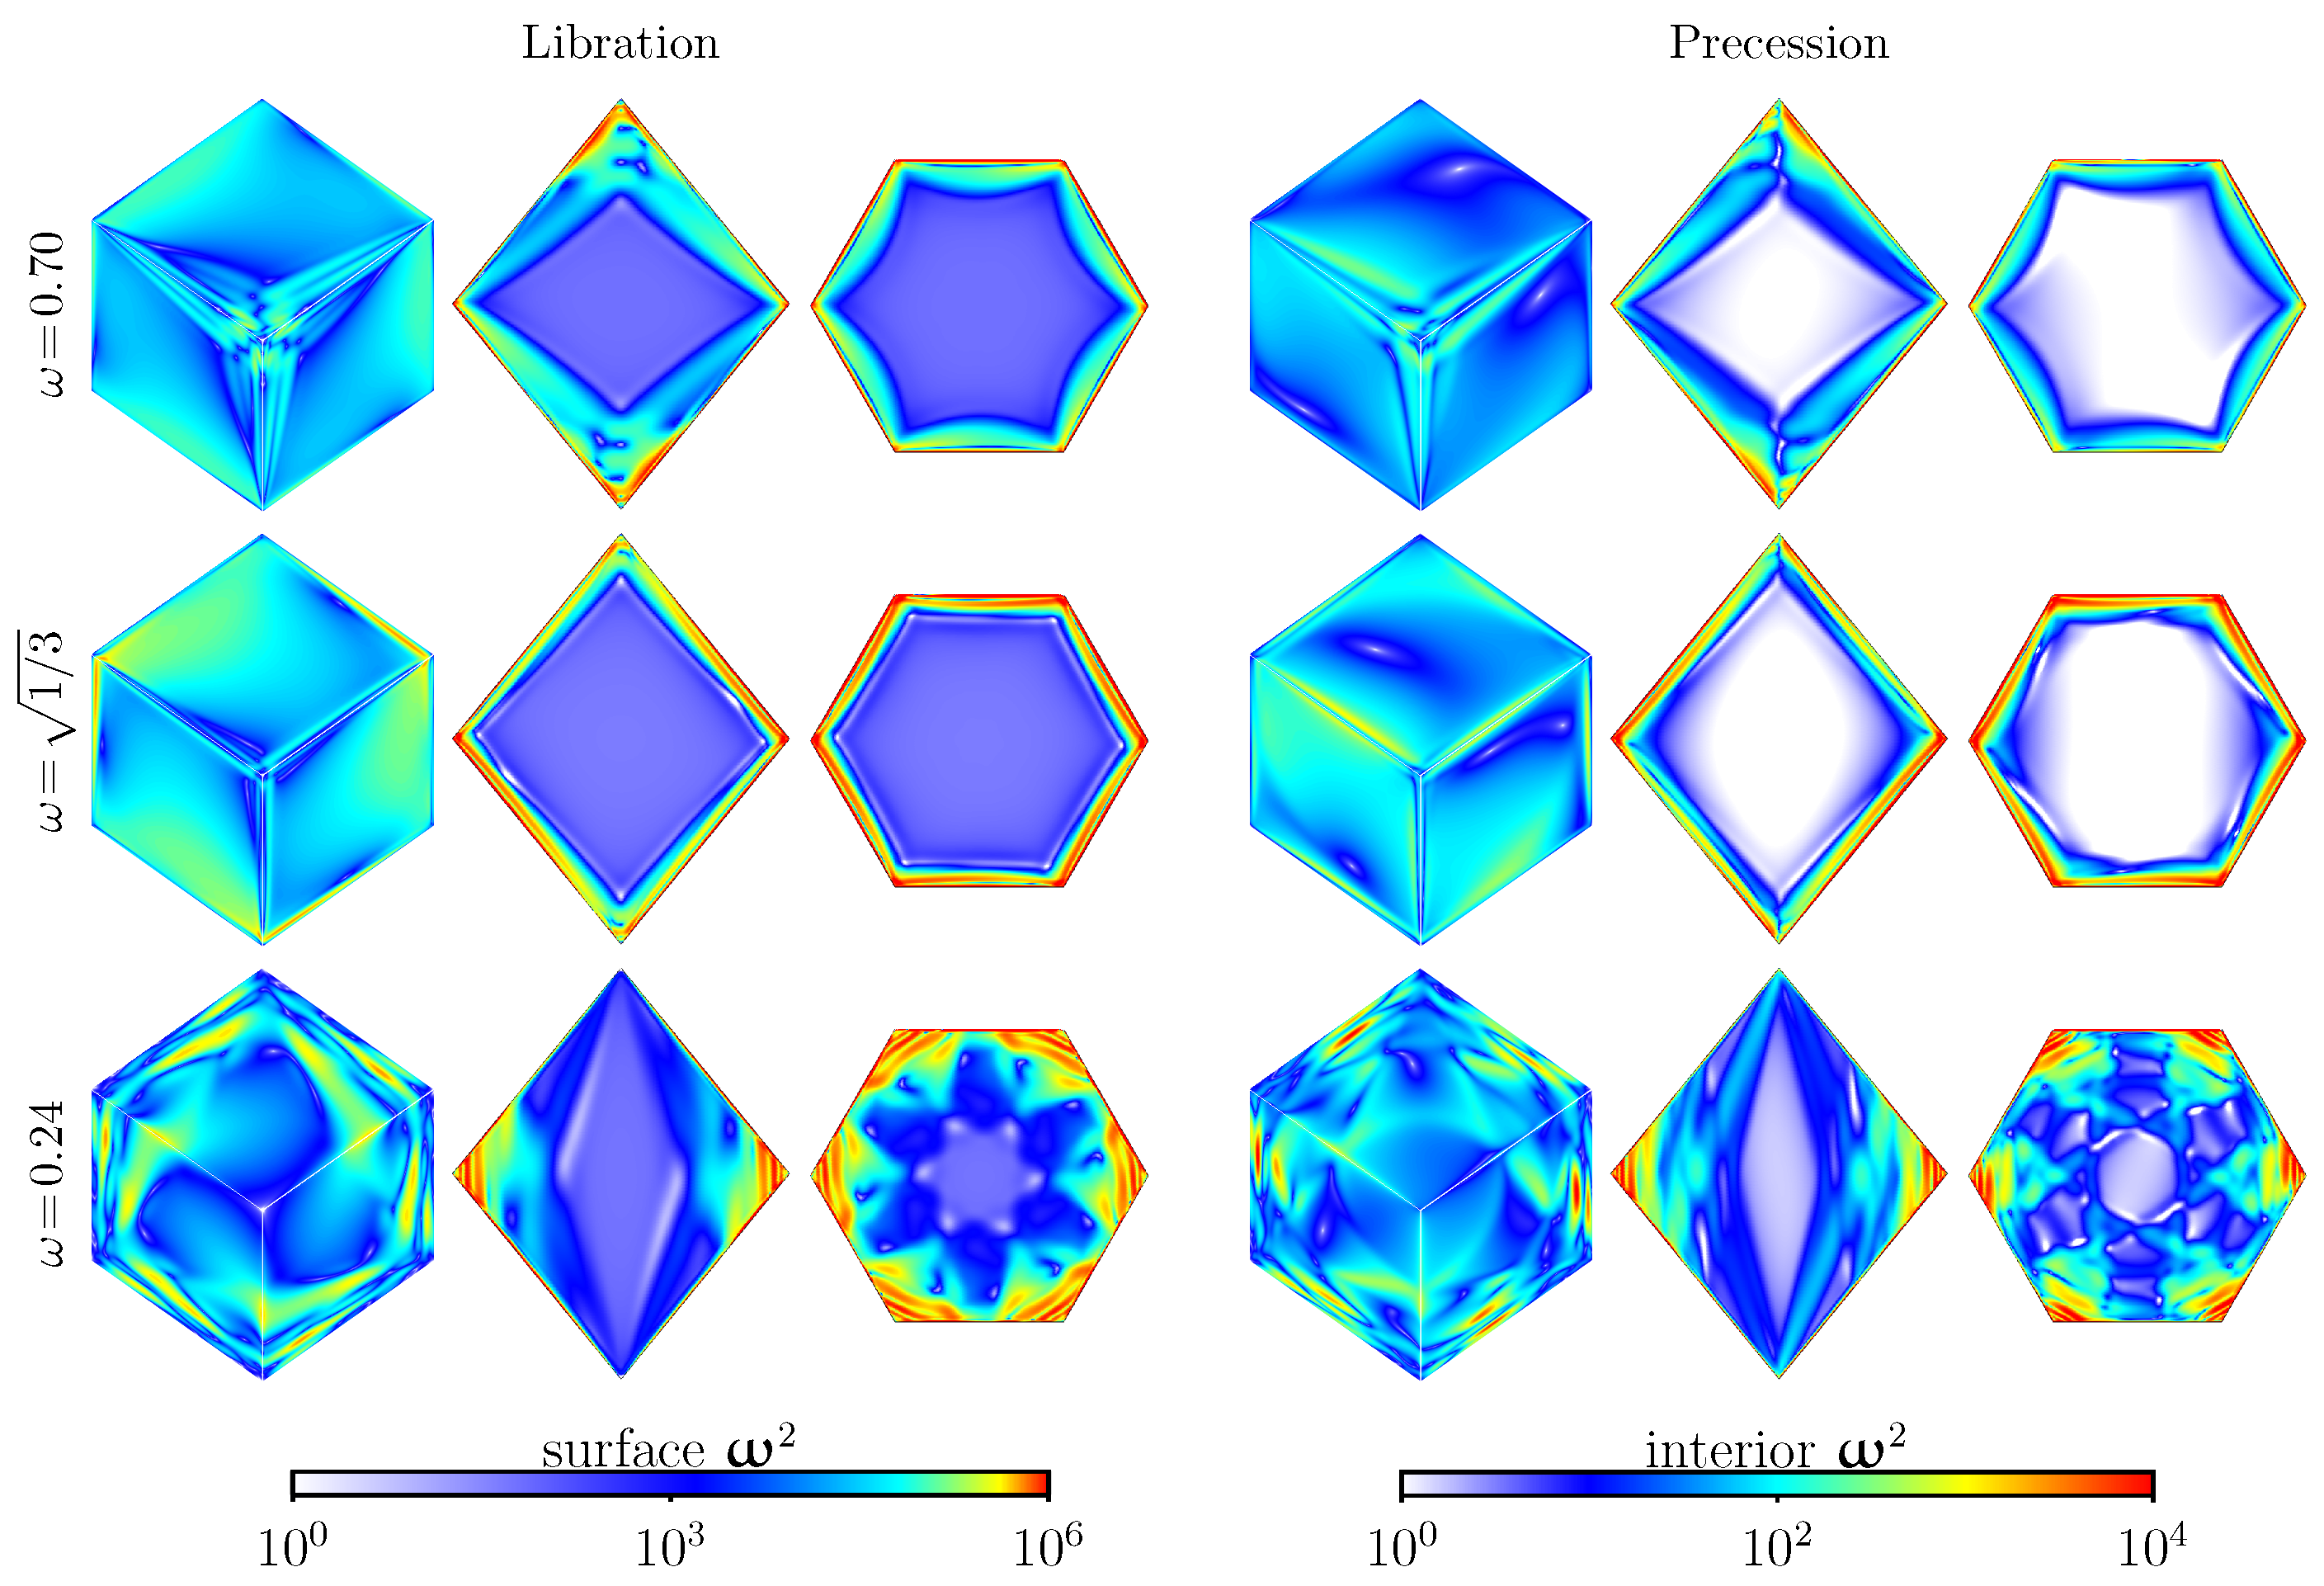
We now return to the forced linear viscous system (23) for values of ω used to obtain the VEBA results shown in Figure 2, for both libration and precession at E = 10 5 . Figure 3 shows snapshots of the enstrophy density ω 2 on the cube surface and in the meridional and equatorial planes for the forced linear response flows. The flows are symmetric synchronous limit cycles, but nevertheless, their spatio-temporal structures are far from trivial. Several features are well captured by VEBA. These include the shear layers coming from the equatorial region and focusing toward the poles for ω = 0.70 , from the poles toward the equatorial region for ω = 0.24 , and ω 2 being concentrated in the boundary layers for ω = 1 / 3 for either type of forcing. Supplementary Video S1 animates these states over one forcing period and reveals additional features that are not present in the VEBA results, consisting of the oscillatory boundary layers, large-scale oscillations in the interior, and, for ω = 0.24 , bands of high ω 2 propagating into the interior from the equatorial region. The usual approximations used to study oscillatory boundary layers break down when the system is subjected to rapid background rotation ( E 1 ) and the forcing frequency is less than twice the background rotation ( ω < 1 ) [17]. The situation is even worse when inertial wavebeams reflect on the boundaries, further invalidating the boundary layer approximation that gradients tangential to the boundary are negligible.
For libration, the interior oscillations are akin to standing waves. For precession, the oscillations are akin to prograde rotating waves; these are not rotating waves as their spatial structure changes throughout the period, primarily due to the non-axisymmetric geometry of the cube. For libration, all faces of the cube are the same at any instant in time modulo a spatial rotation, whereas for precession, each of the faces are multiples of τ / 6 apart in phase, rather than τ / 3 -associated with the spatio-temporal symmetry (20) due to ω 2 being a squared quantity. This is consistent with the internal oscillations; for libration, the boundary layer waves are all in phase, whereas for precession, they are also multiples of τ / 6 apart in phase.
For Ro = 0 , the system is linear with zero mean flow:
v ¯ = 1 τ t * t * + τ v d t = 0 ,
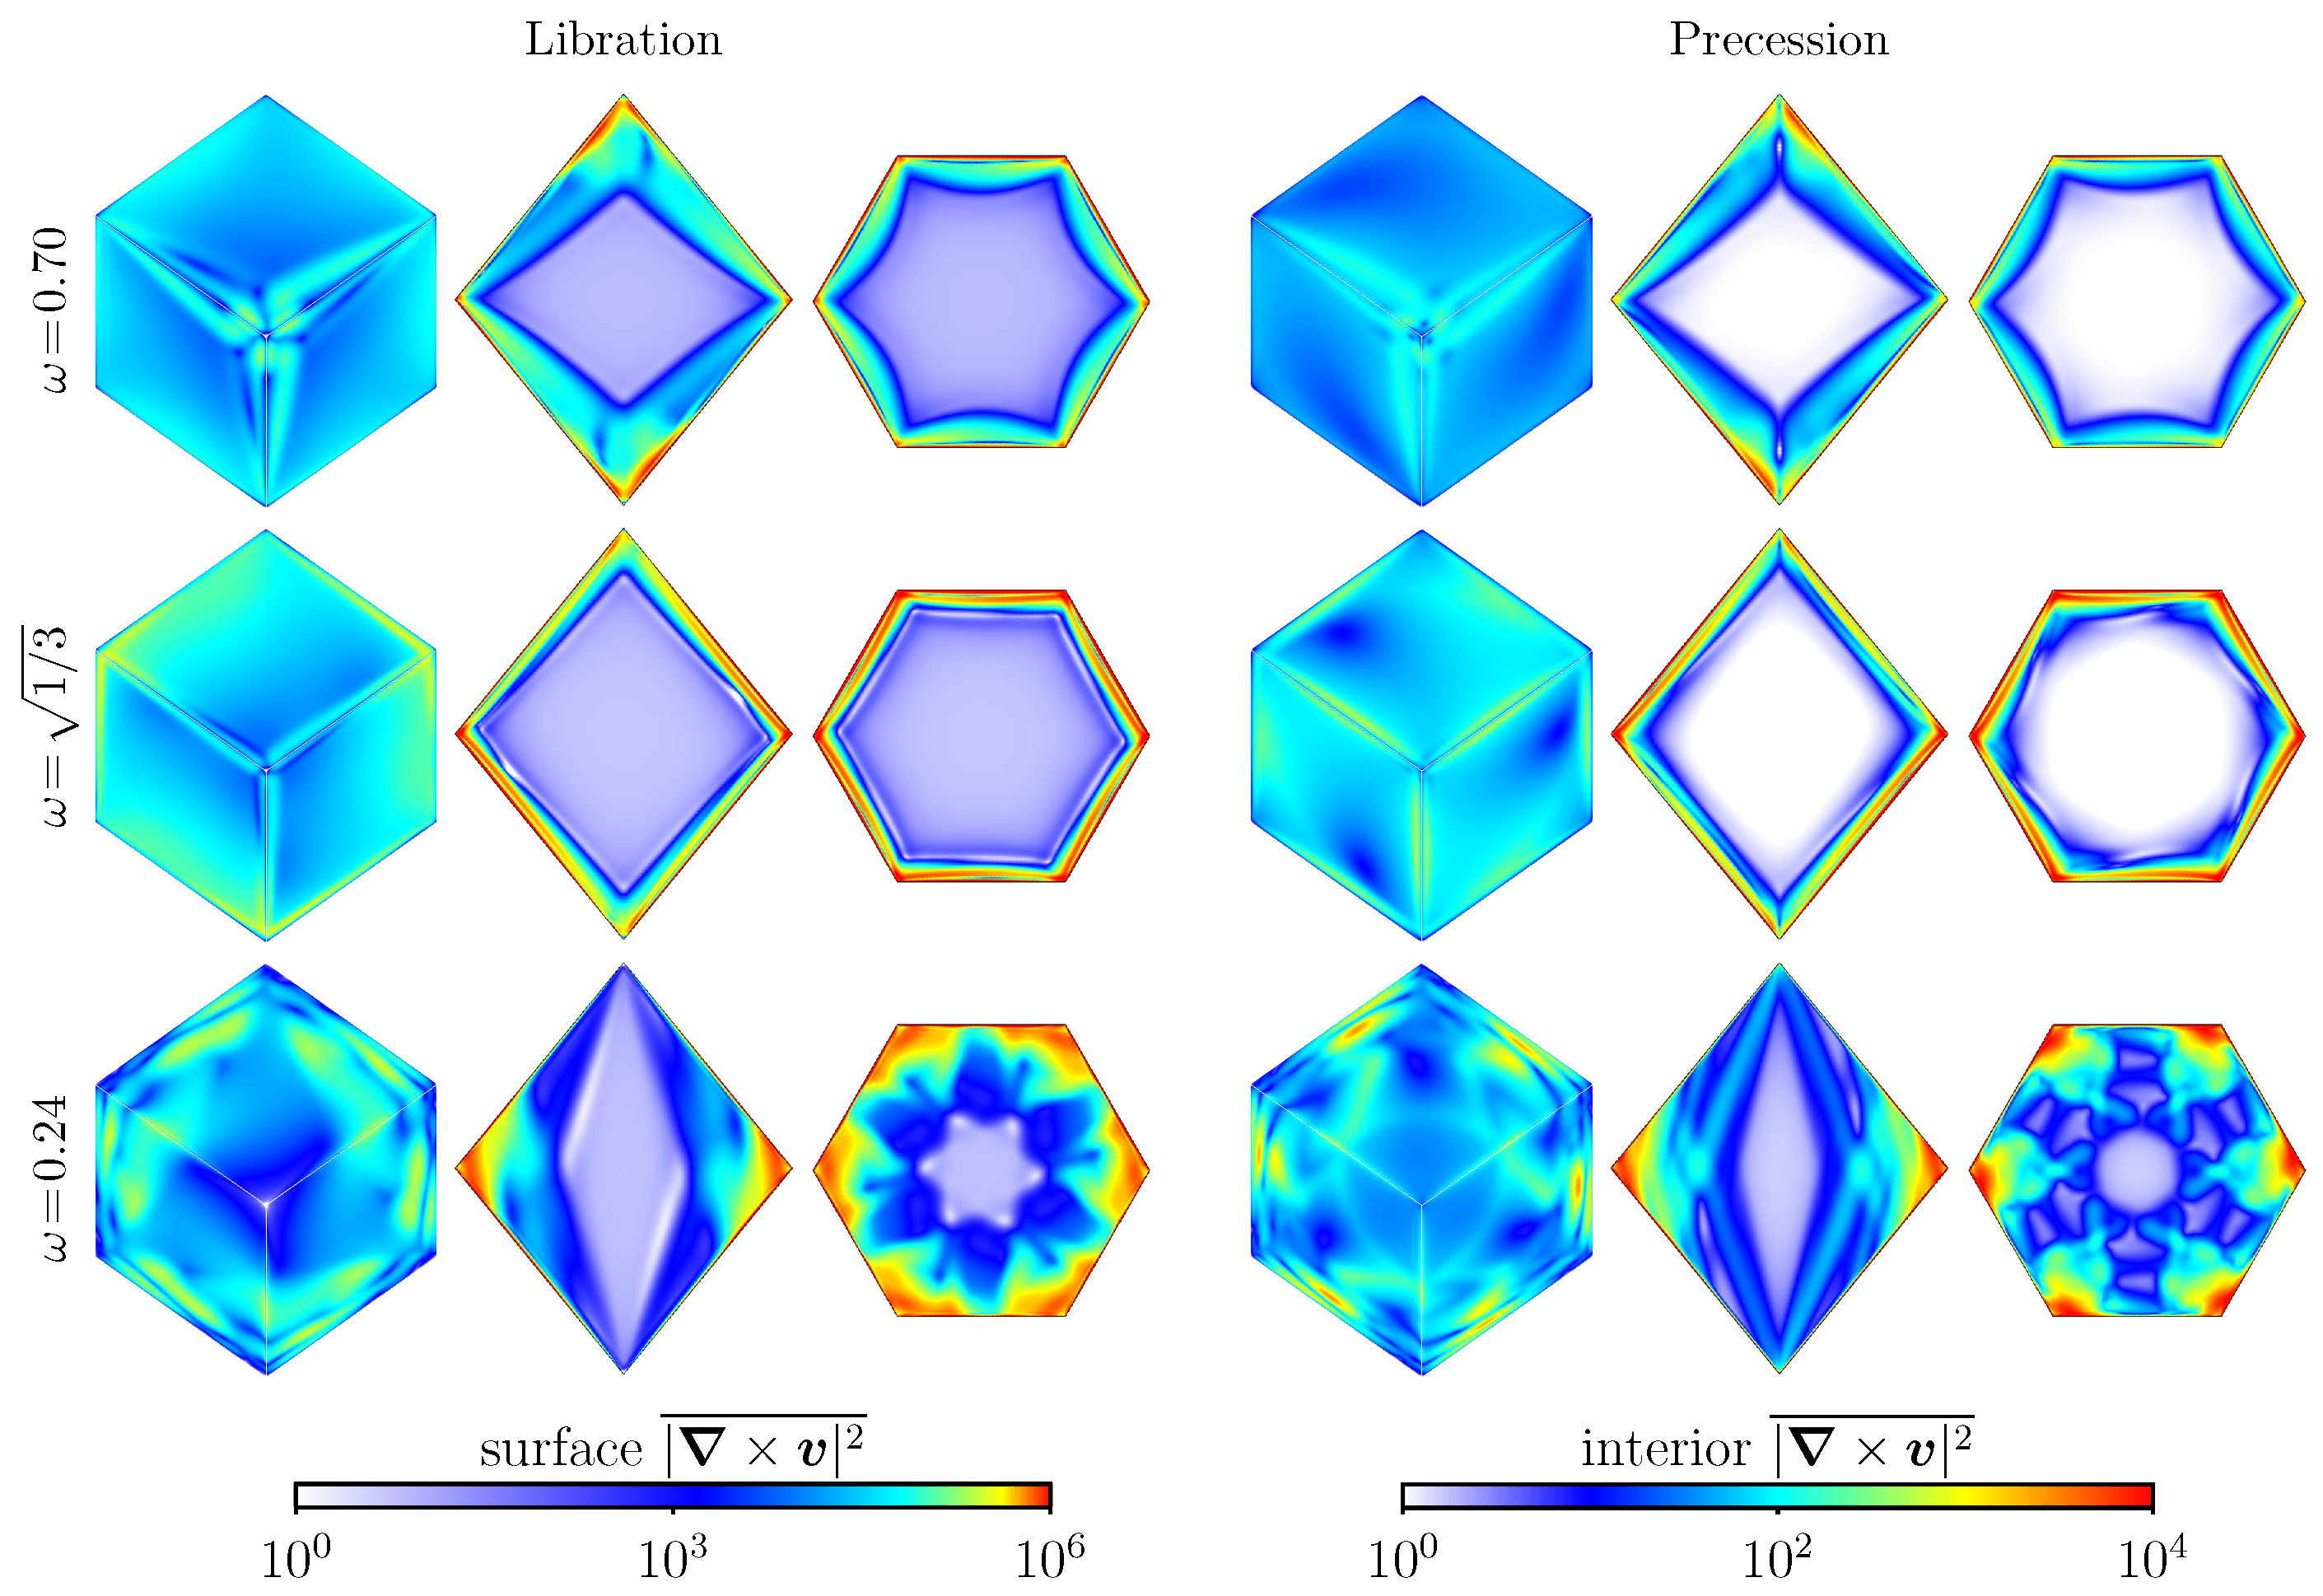
where t * is some time after the initial transients have damped out sufficiently. For the E = 10 5 considered here, this time corresponds to a few hundred forcing periods, for which the strobed kinetic energy varies by less than one part in a million. The enstrophy density of the mean flow is also zero, | × v ¯ | 2 = 0 , but the time average of the enstrophy density, | × v | 2 ¯ , is not zero and is shown in Figure 4. For temporally harmonic v , | × v | 2 ¯ is the variance of vorticity and is largest where the oscillations in the enstrophy density are largest.
Viscous effects include more than the viscous broadening of the wavebeams considered in VEBA into smooth thick shear layers. The additional viscous effects are best illustrated for ω = 0.24 , where the focusing of wavebeams toward tropical edges stops short of reaching these edges, contrary to VEBA predictions. This occurs due to viscous effects acting on the wavevector k , of which its magnitude increases with each reflection due to focusing. When k 2 reaches a certain threshold (which may be expected to depend on E ), the focusing is viciously arrested. Moreover, Video S1 shows that additional waves in the regions where focusing no longer takes place radiate in from the tropical edges. These waves are seen in the equatorial plane emerging from the six “corners” as high- ω 2 bands. The meridional plane shows these bands to be essentially invariant in the direction of the rotation axis, and their footprints are evident as the surface ω 2 bands. The structures of these bands are similar for both libration and precession, albeit more localized for precession. For ω = 0.70 , the arrested focusing toward the poles due to viscous effects is blurry, and there are radiating structures propagating into the poles. The surface ω 2 shows a superposition of the footprints of where the wavebeams reflect on the walls, a surface wave associated with the viscous oscillatory boundary layer, and, particularly for the ω = 0.24 cases, the footprints of the bands radiating out from the equatorial region. All of these—the interior oscillations, the boundary waves, and the axially invariant bands—correspond to the particular solution to (23).

4. Primary Viscous Nonlinear Responses

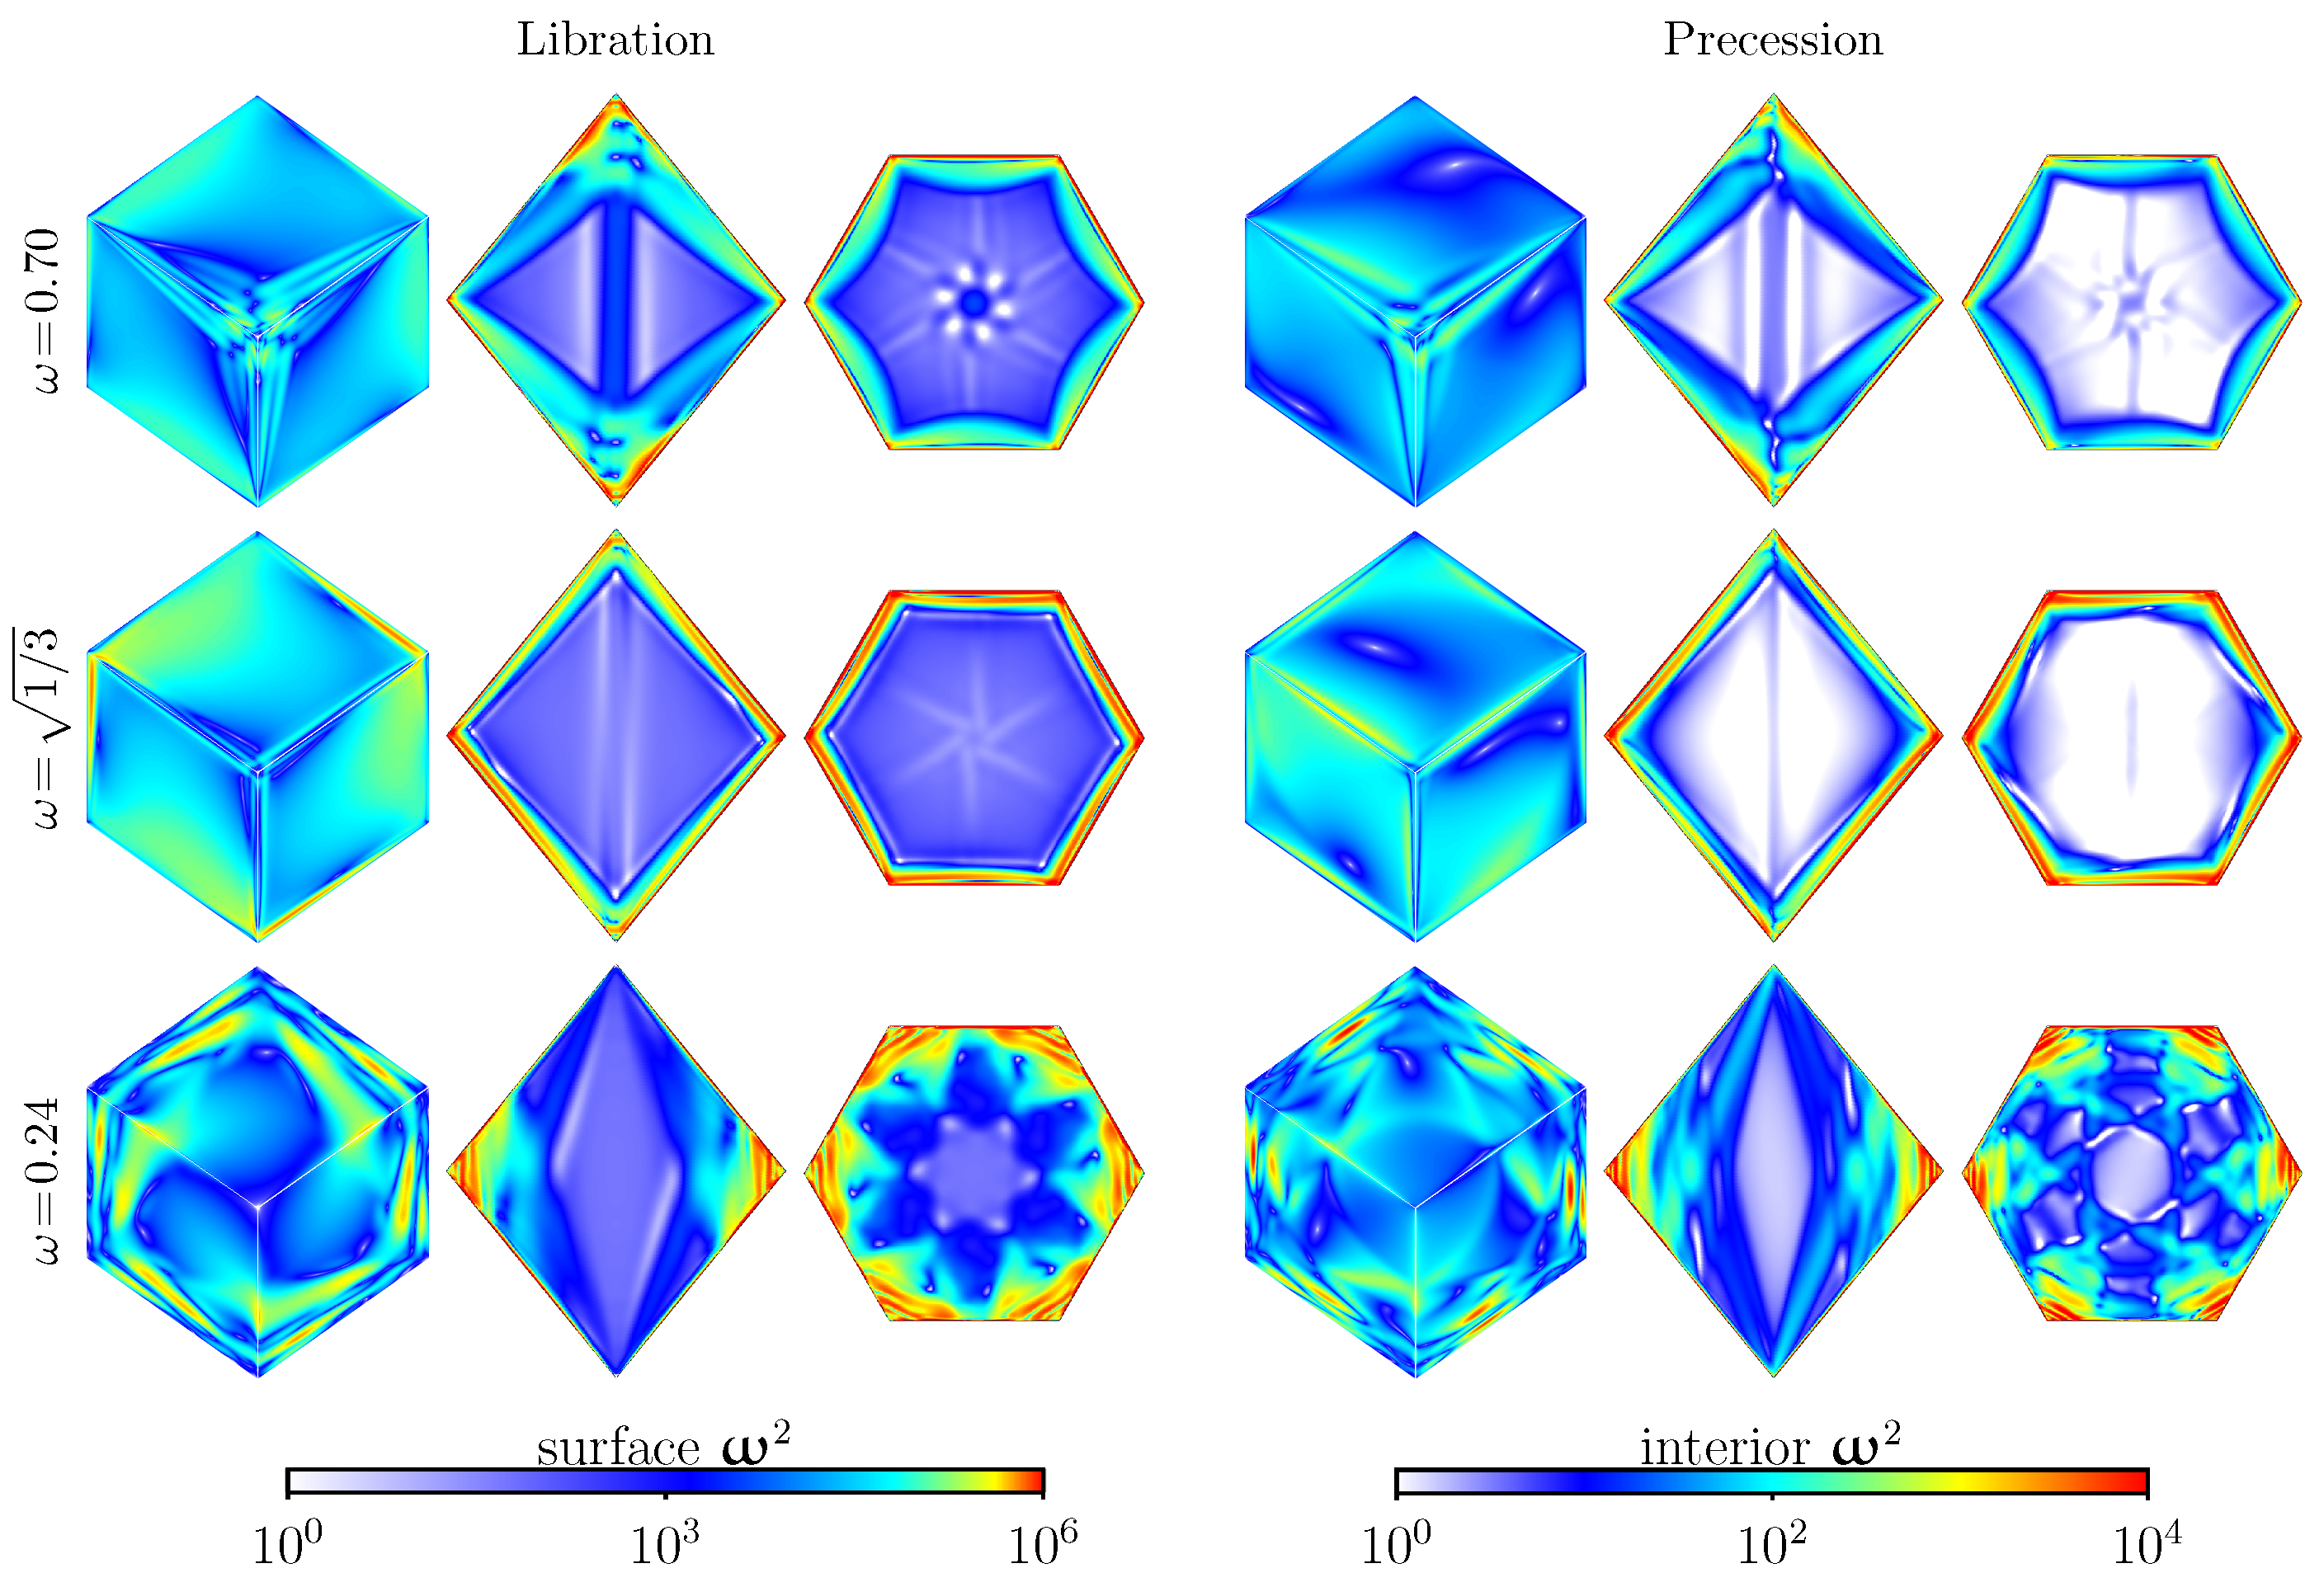
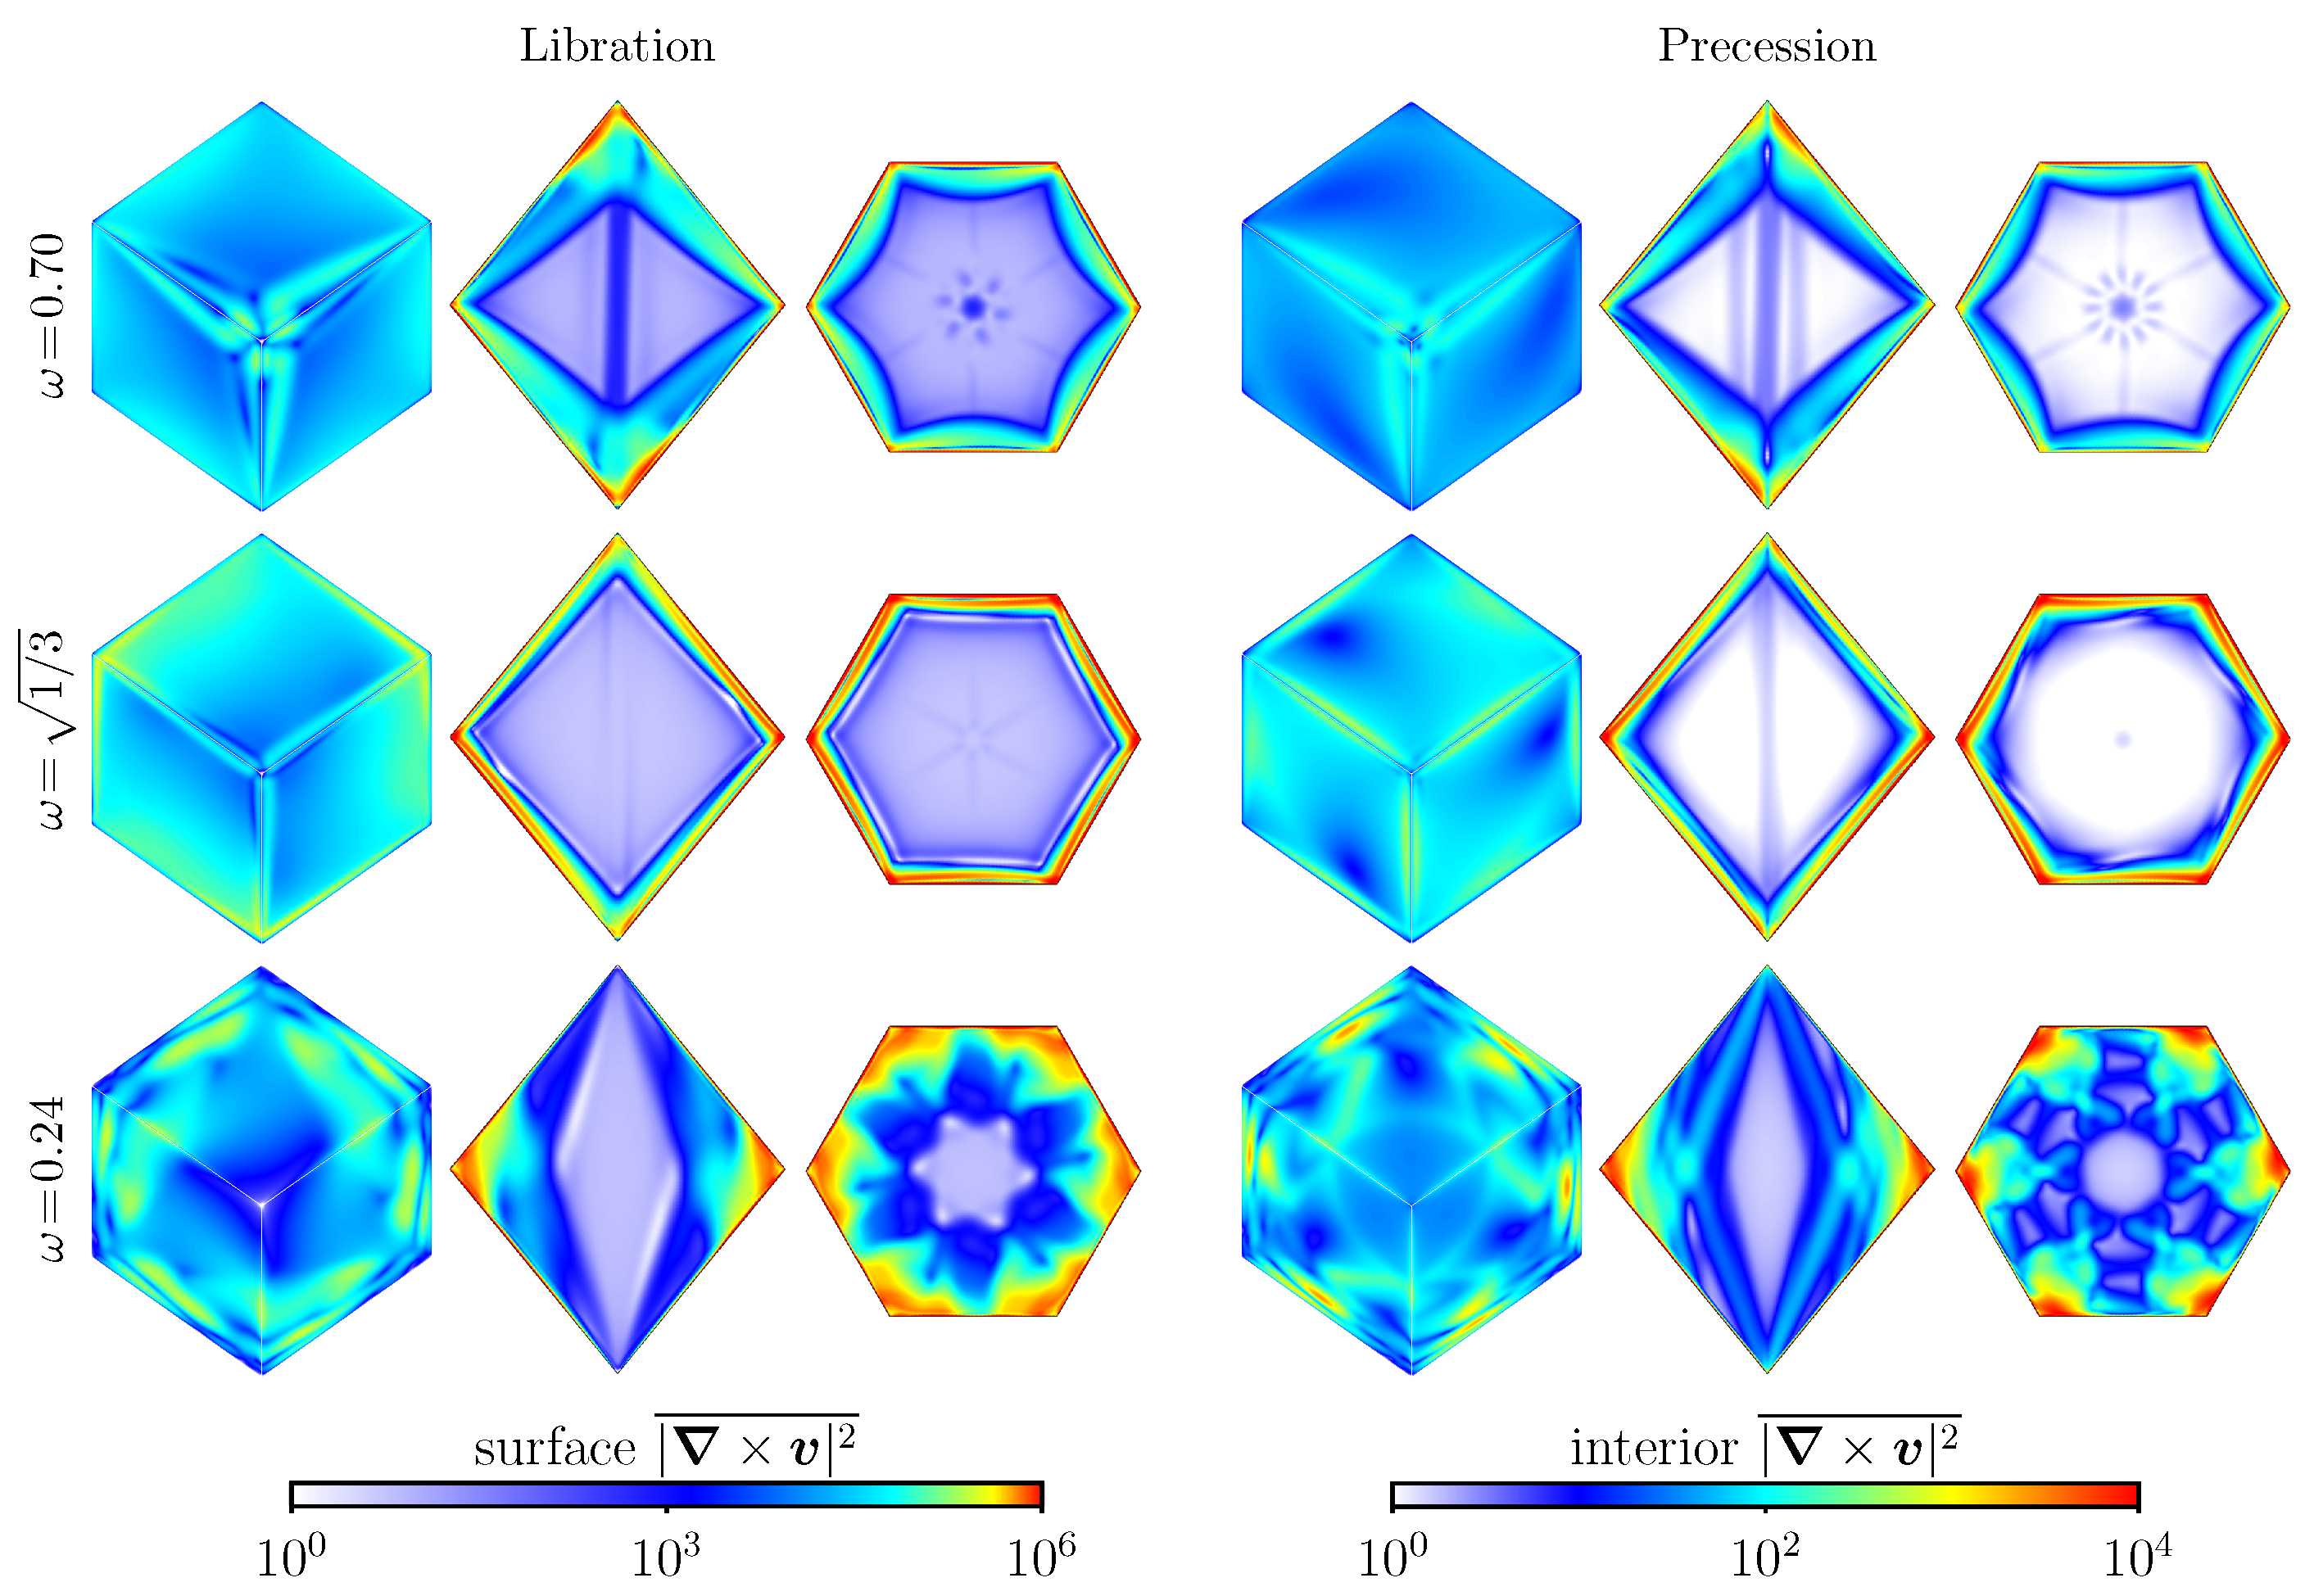
Figure 5 shows the same quantities as Figure 3, but for Ro = 0.01 . This value of Ro is quite close to Ro c , where the symmetric periodic states lose stability. The most striking differences between the cases for the two Ro are for the responses at ω = 0.70 and ω = 1 / 3 , which have additional structures aligned parallel to the rotation axis. These are localized near the axis in the meridional plane, but their cross-sections in the equatorial plane show them to have six spokes extending to the walls. Three of the spokes emerge from the three north tropical edges and the other three from the three south tropical edges. Apart from these features, the images at Ro = 0 and Ro = 0.01 are very similar. Supplementary Video S2 also animates these states over one forcing period. It shows that these new features remain stationary in space, even for the precession cases, and only weakly interact with the internal oscillations and the emitted shear layers that undergo focusing. The new features are due to the mean shear that comes about via the quadratic nonlinearity in the Navier–Stokes equations at the larger Ro . The surface ω 2 in Figure 3 and Figure 5 and in the animations of Videos S1 and S2 show virtually no difference between Ro = 0 and Ro = 0.01 , indicating that any mean ω 2 on the surface is overwhelmed by the large instantaneous ω 2 . Figure 6 shows the time-averaged enstrophy density, | × v | 2 ¯ , for the nonlinear flows at Ro = 0.01 . They are very similar to those for the linear Ro = 0 flows shown in Figure 4, differing primarily in the aforementioned mean shears. These nonlinear flows have v ¯ 0 .
The mean shears come about due to nonlinear interactions at the walls where the shear layers reflect and focus. In a related flow with a cuboid rapidly rotating in an orientation with some walls oblique to the rotation axis and subjected to libration, Wu et al. [9] showed that vortex stretching and tilting (inherently 3D nonlinear processes) were most active where the shear layers of the inertial attractor reflect on the wall, leading to the local enhancement of ω 2 well beyond that due to the geometric focusing. Recent experiments in librationally forced spherical shells and cylinders with sloping endwalls have observed similar nonlinear interactions at reflection sites leading to mean shear flows [18,19,20,21,22]. Here, for ω = 0.24 , these reflections occur in the equatorial region, and since the mean shears are aligned parallel to the rotation axis, their presence is localized to this region and not readily distinguishable from the focusing shear layers. In contrast, for ω = 0.70 , these reflections are at the north and south polar regions, and so there is a strong mean shear localized along the rotation axis. Figure 7 shows the enstrophy density of the mean flows, | × v ¯ | 2 , illustrating the above discussion.
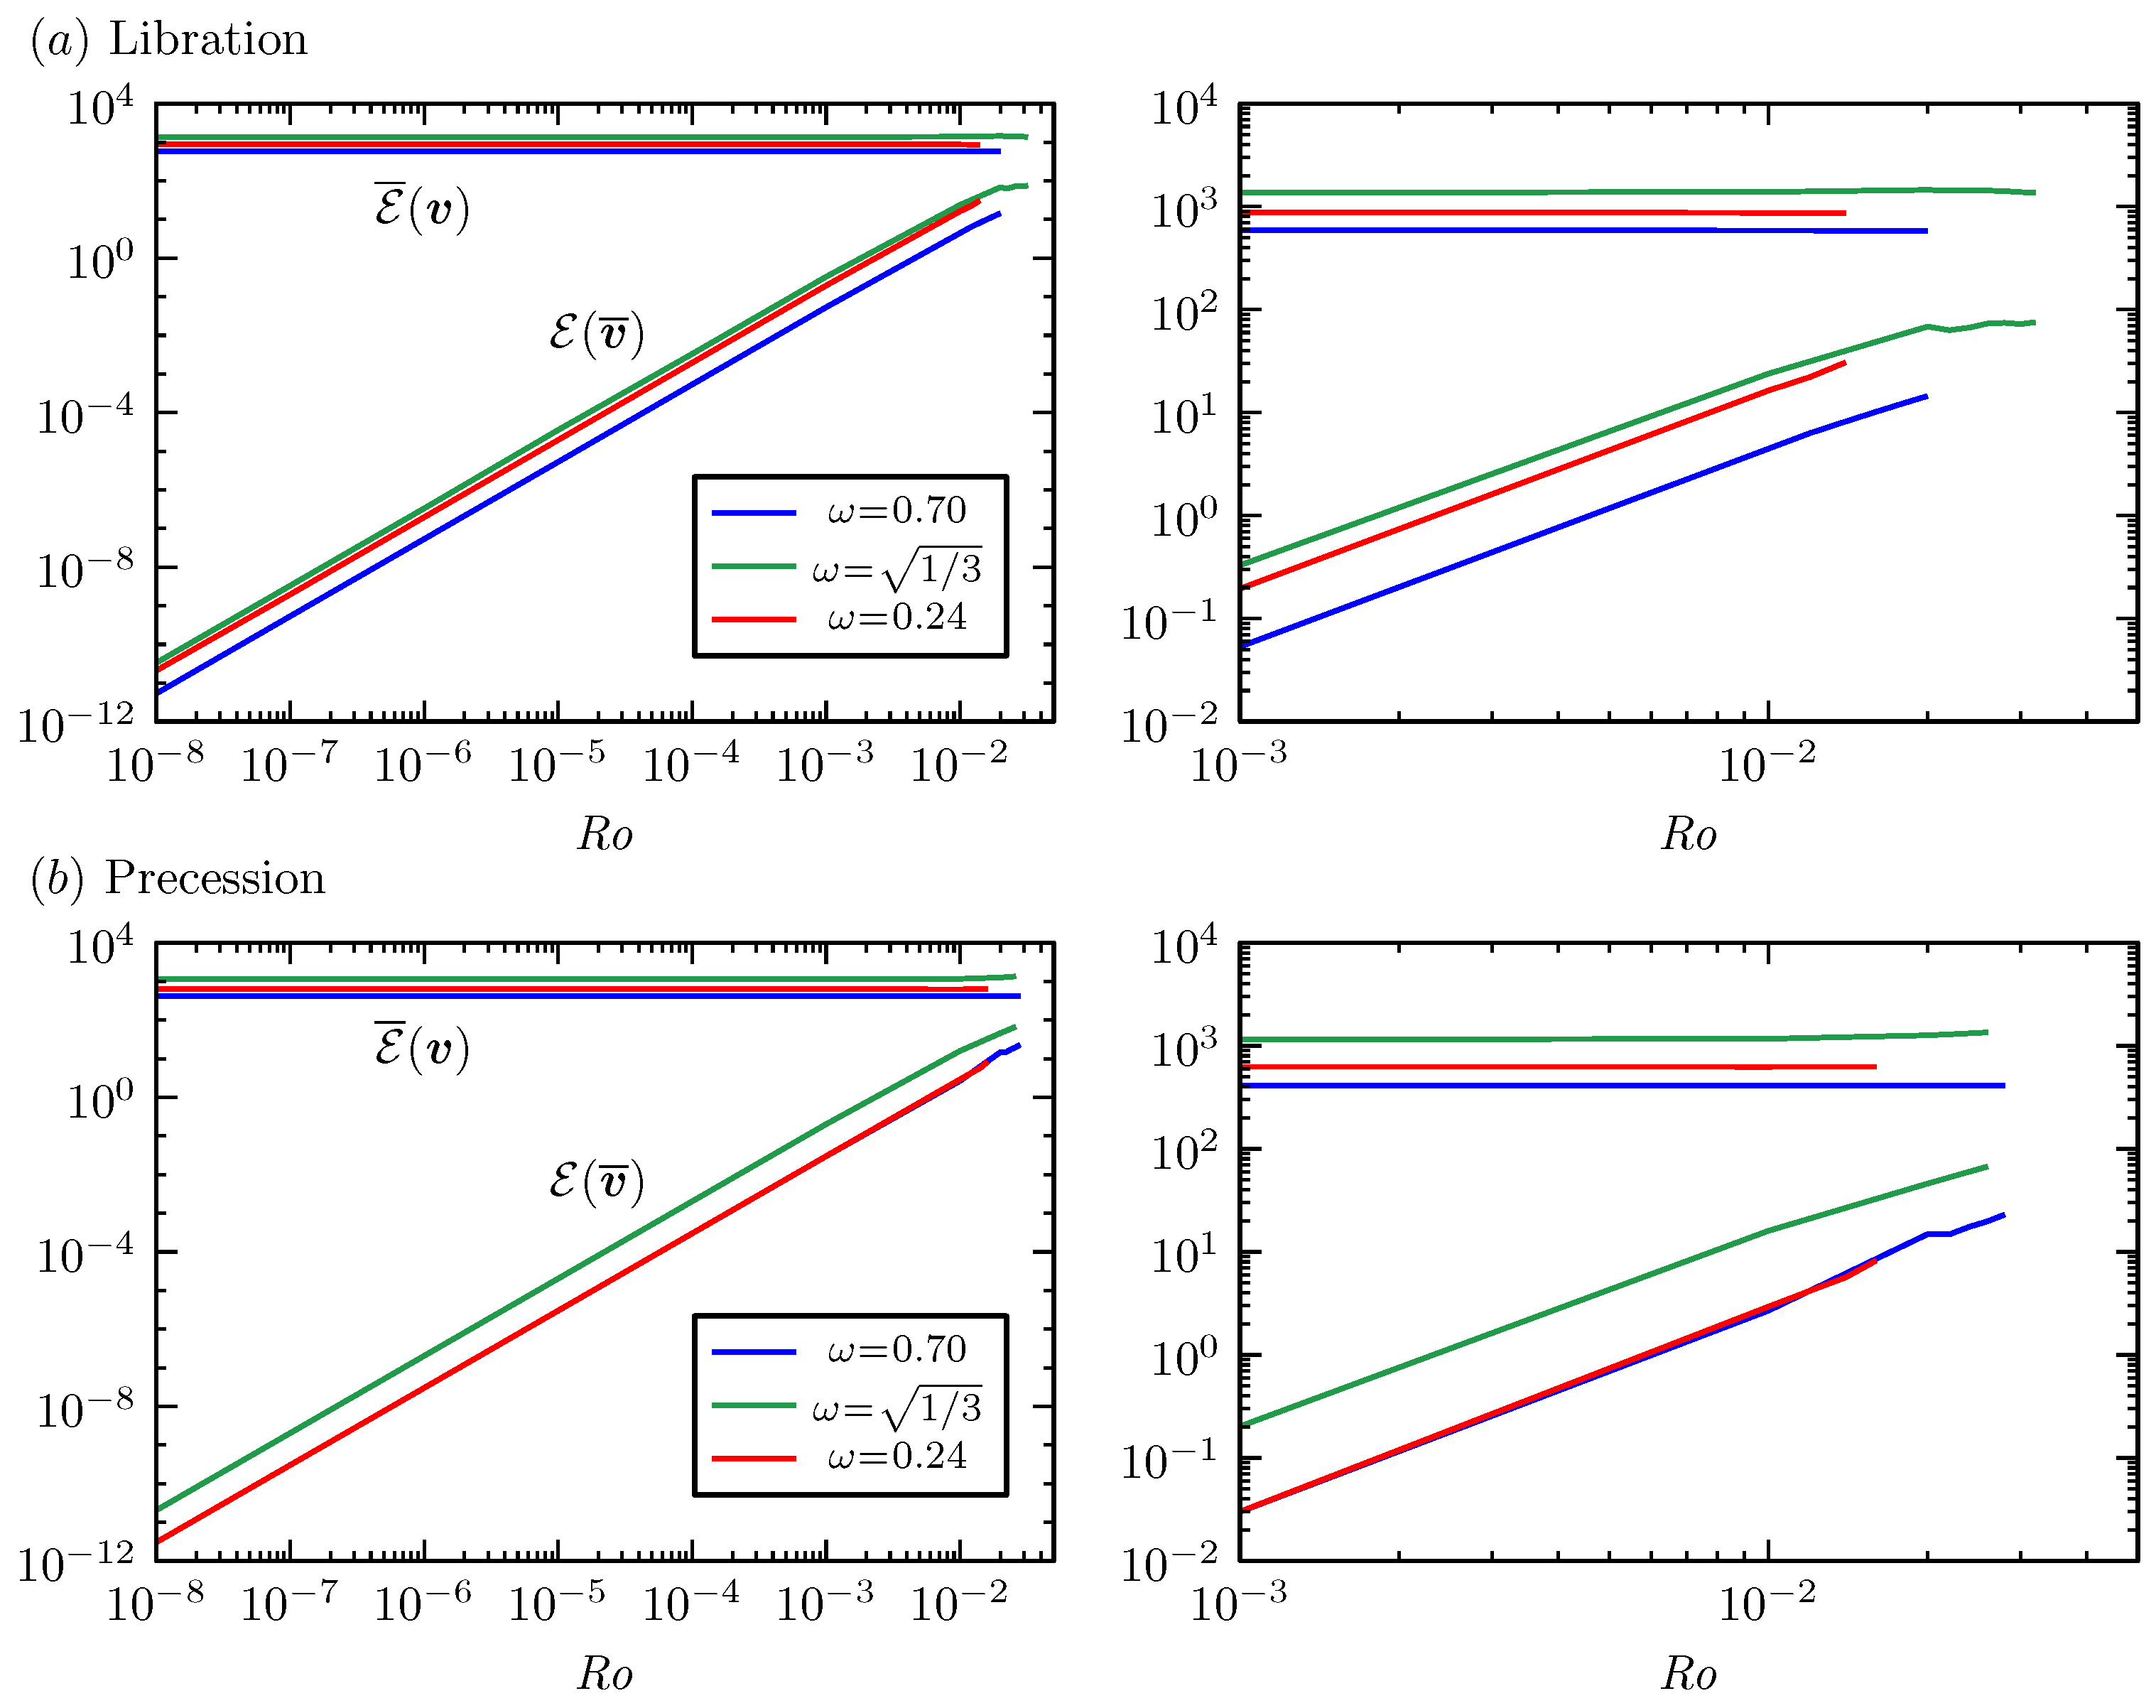
Figure 8 shows how the time-averaged enstrophy, E ¯ ( v ) , and the enstrophy of the mean flow, E ( v ¯ ) , vary with Ro for both libration and precession at E = 10 5 and the three values of ω considered. For Ro 10 2 , E ¯ ( v ) is independent of Ro as v is independent of Ro . In contrast, E ( v ¯ ) Ro 2 , which is indicative of the flow becoming increasingly nonlinear with increasing Ro . The form of these behaviors is a result of the scaling and non-dimensionalization of the velocity, where u = Ro v Ro and u ¯ = Ro v ¯ Ro 2 with v ¯ Ro . These follow from the scaled Euler force (13) being independent of the forcing amplitude α Ro and being temporally harmonic with the vanishing mean and the nonlinear advection term in (11) being proportional to α ; these are general results for periodically forced flows [23]. Generically, mean flows are generated via the nonlinear advection term in the Navier–Stokes equations. When the oscillatory flows in rapidly-rotating containers are driven by low-amplitude harmonic forcing, such as libration or precession at low Ro , the flow in the interior of the container is predominantly solid-body rotation plus small amplitude inertial oscillations of an amplitude that is of order Ro . In the interior, the Coriolis force constrains the mean flow to be axially invariant. In the viscous oscillatory boundary layers of the container, the Coriolis force is not dominant and does not constrain the mean flow to be axially invariant.

5. Instabilities to Broadband Dynamics

The flows become unstable when Ro is increased so that E ( v ¯ ) reaches a few percent of E ¯ ( v ) . The instabilities are symmetry-breaking and result in non-periodic flows. With the various instabilities, additional frequencies are introduced. For Ro values just slightly beyond the instability threshold, the flow has, in some of the cases, a quasi-periodic nature before the frequency content becomes broadband as Ro is increased further. In other cases, broadband frequency content is observed immediately following the onset of instability.
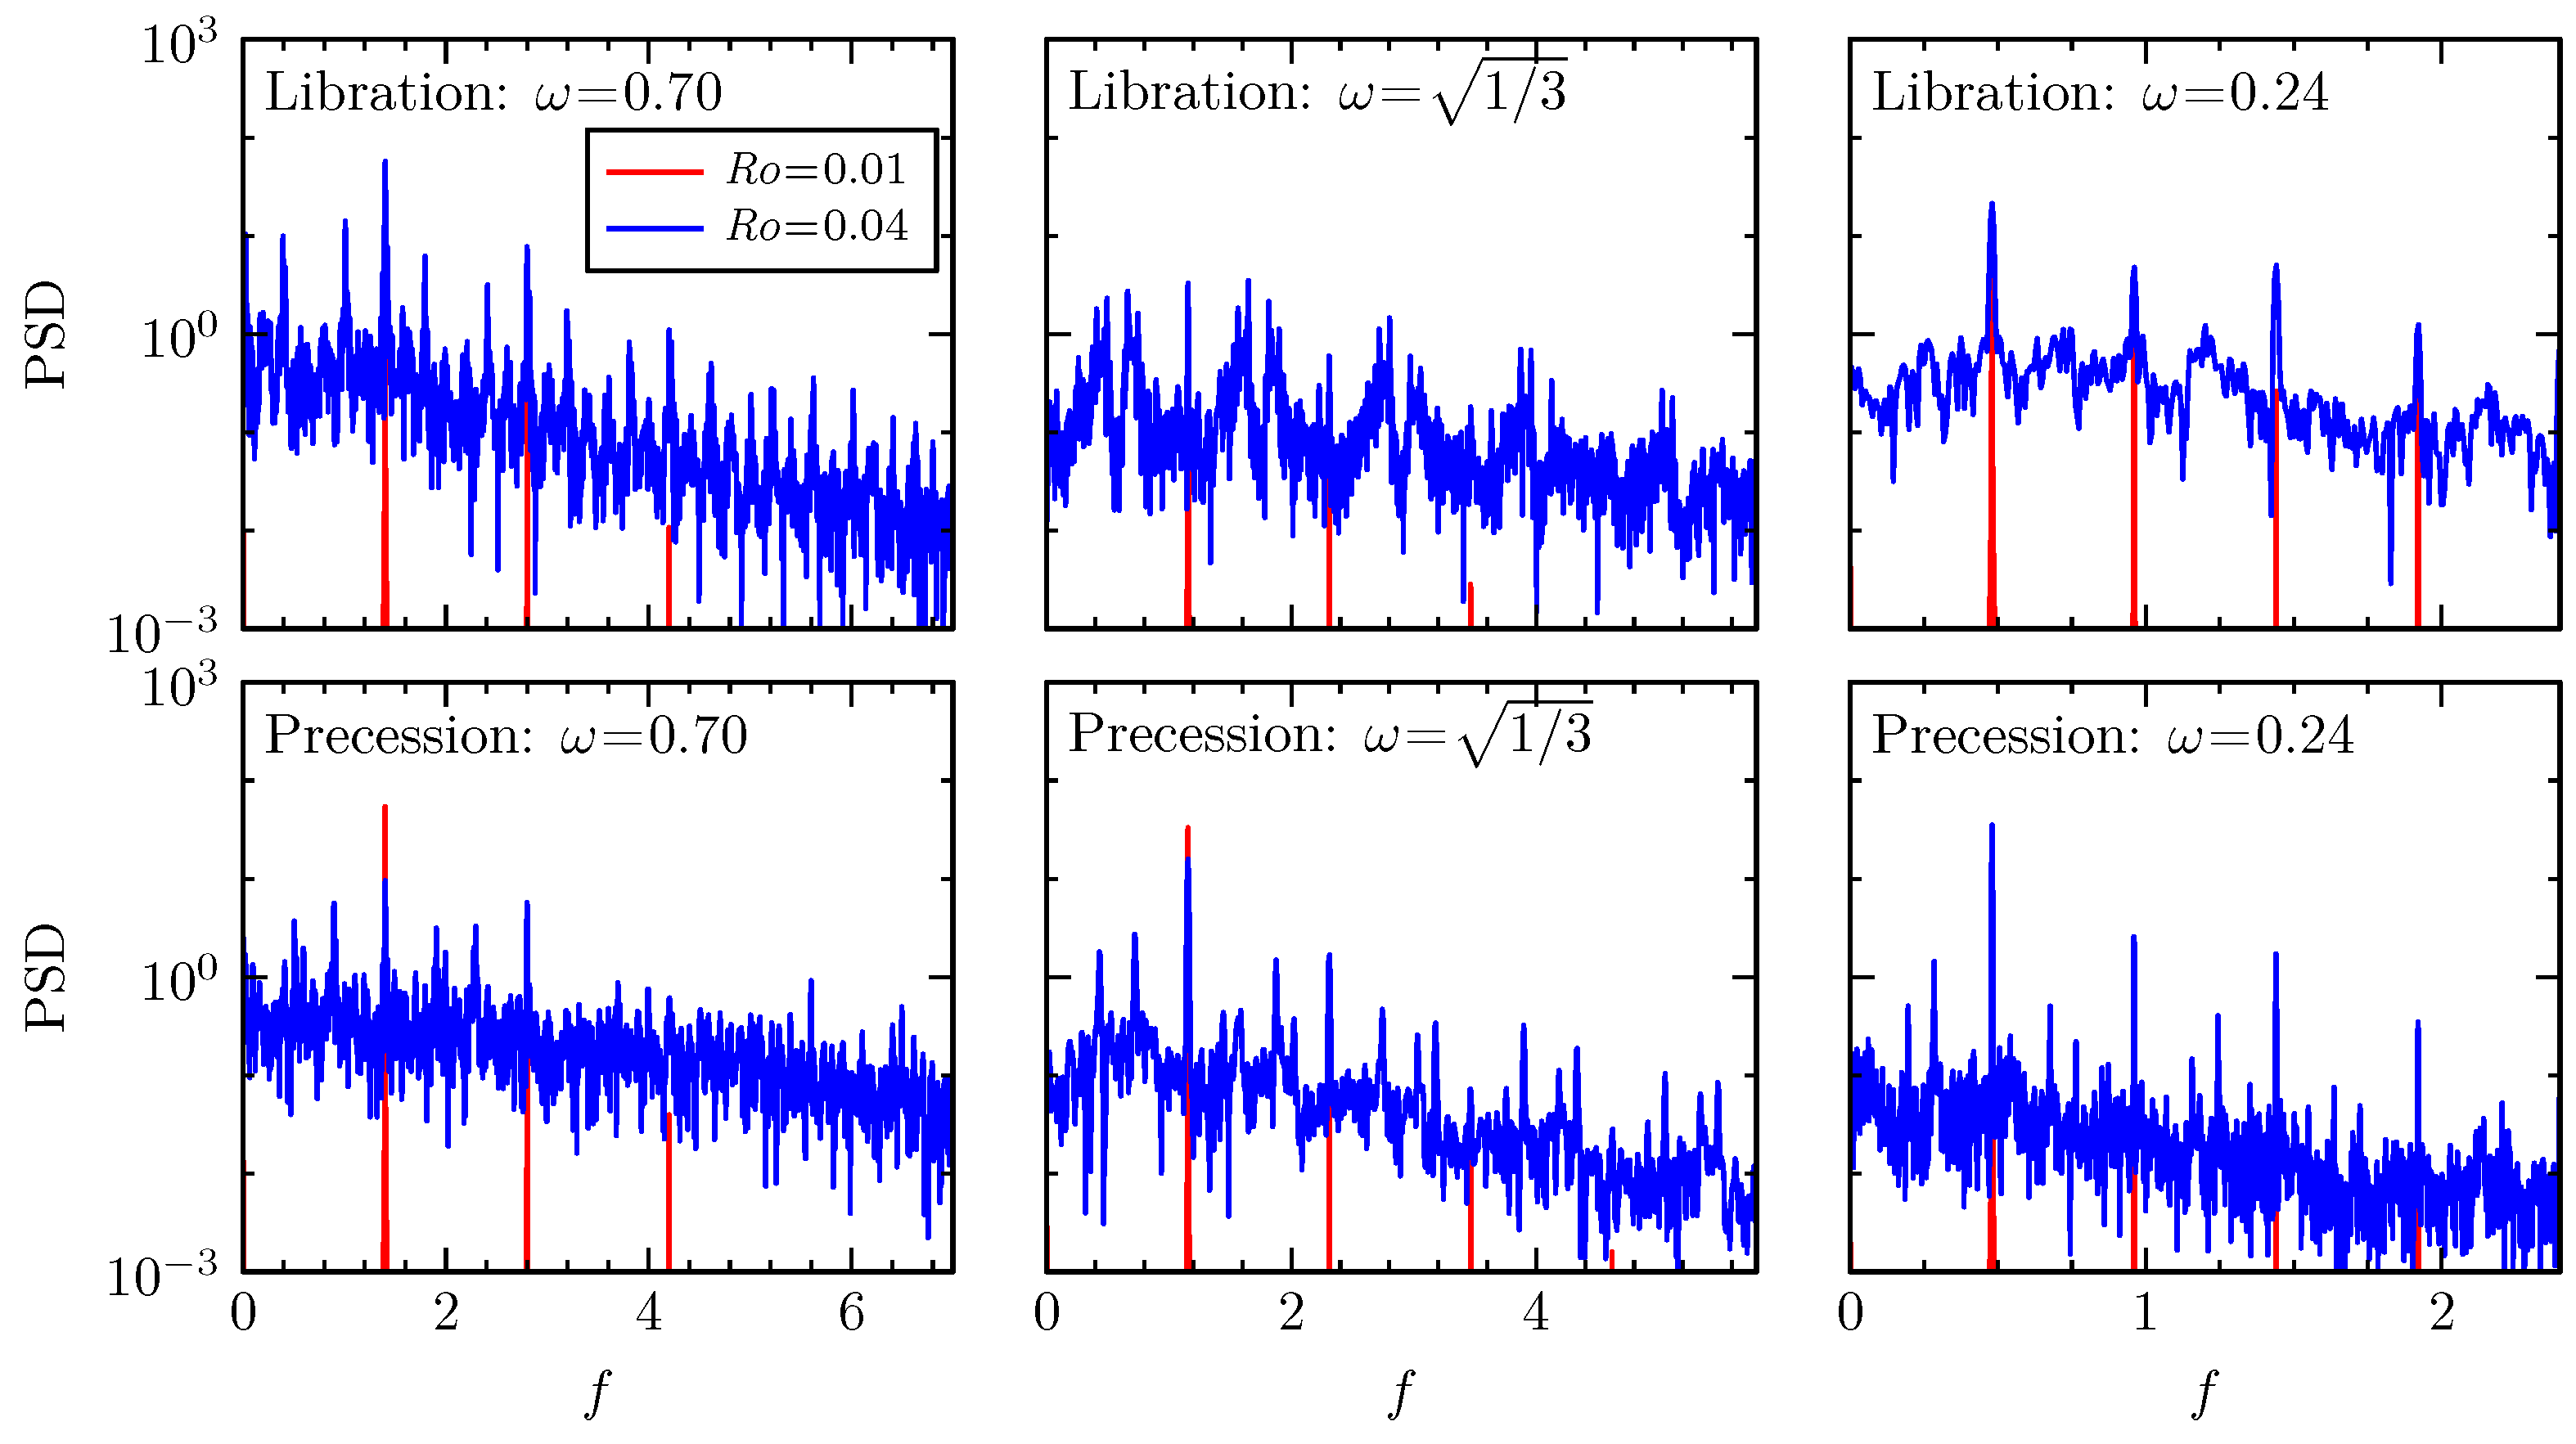
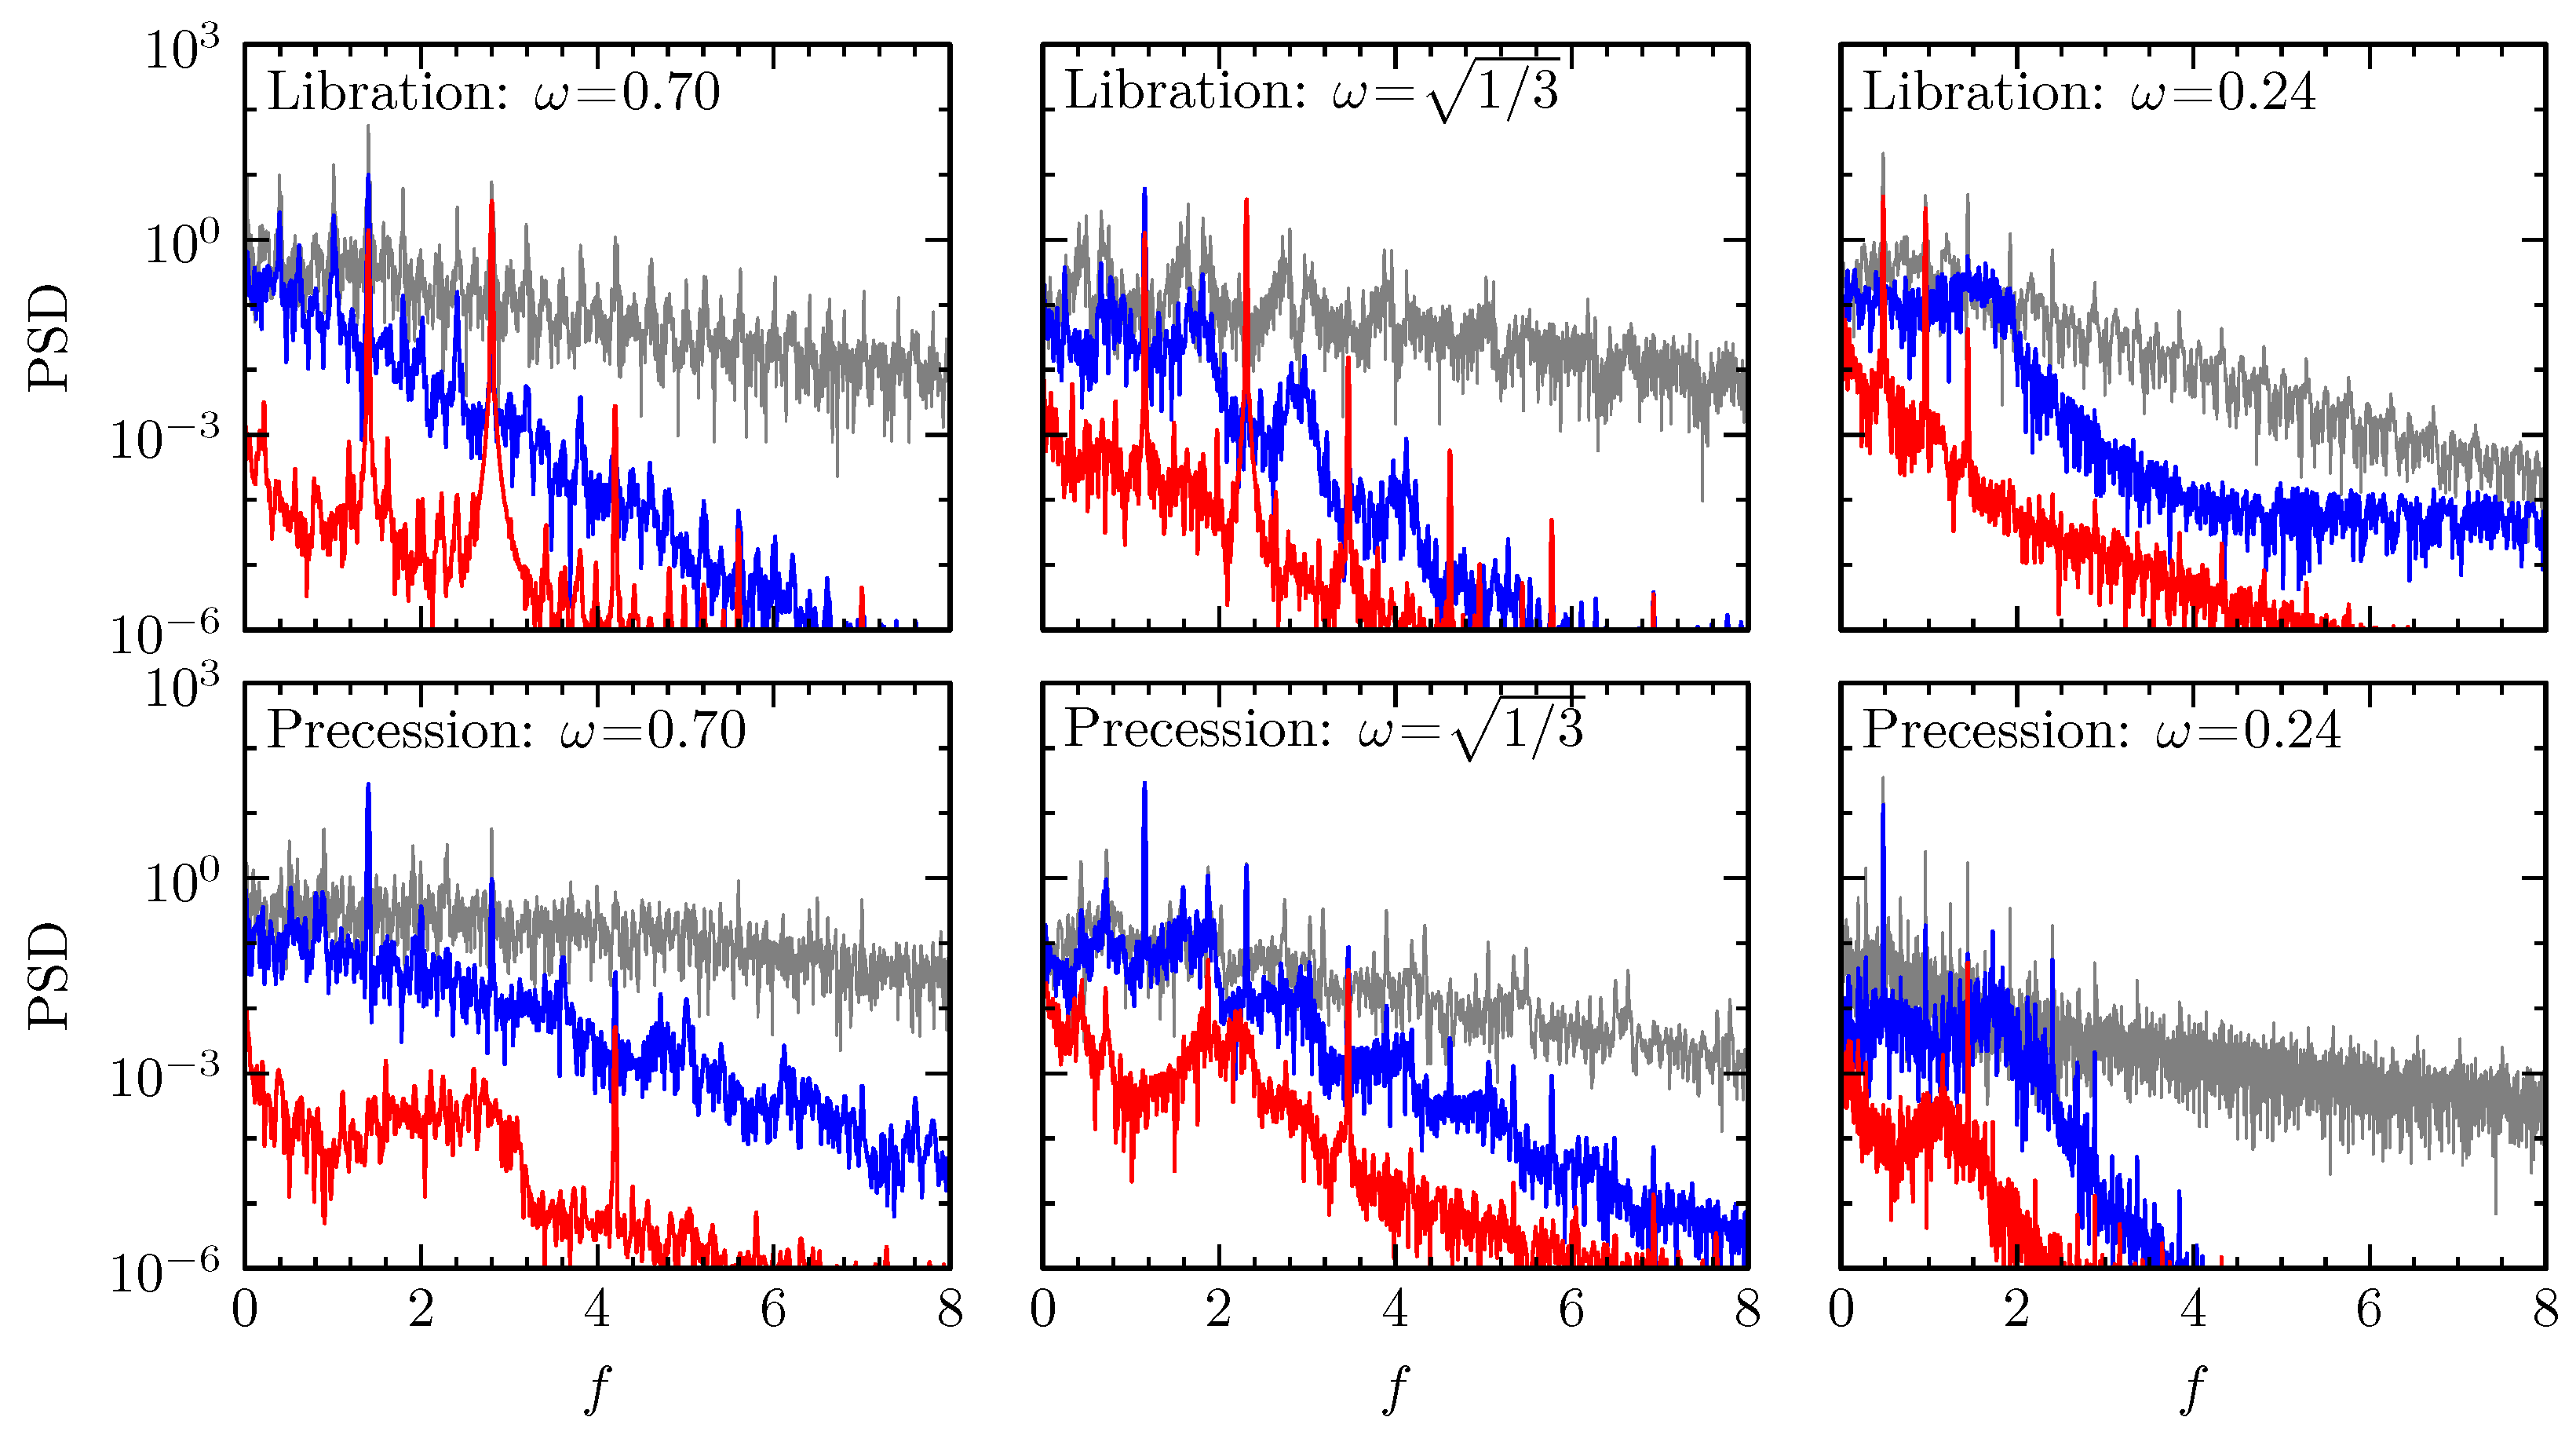
Figure 9 shows the power spectral density (PSD) determined from the time series of the y-component of velocity at points ( x , y , z ) = ( 0.456 , 0.456 , 0.456 ) for ω = 0.24 (near an equatorial vertex), ( 0.475 , 0 , 0 ) for ω = 1 / 3 (near the center of one wall), and ( 0.456 , 0.456 , 0.456 ) for ω = 0.70 (near the south polar vertex), for both libration and precession. These points are within the viscous boundary layer and close to where the velocity oscillations are of large amplitude for each ω . For each ω and forcing type (libration or precession), two Ro values are chosen for the FFTs: ( i ) Ro = 0.01 corresponding to that used in Figure 5 where the flows are very nonlinear, but still symmetric synchronous limit cycles—the large powers in the superharmonics attest to the nonlinearity; and ( i i )   Ro = 0.04 > Ro c , with FFTs that have a broad spectrum of peaks—the most prominent are at the forcing frequency 2 ω and its superharmonics, as is true for the high- Ro symmetric limit cycles, along with a few subharmonic peaks due to the modulations associated with symmetry-breaking. Choosing points remote from these locations results in FFTs that consist of peaks at 2 ω and its superharmonics until Ro is well beyond the onset of symmetry-breaking. Figure 10 shows the spectra for Ro = 0.04 , reproducing the boundary spectra from Figure 9 (gray), together with the y-velocity spectra at an interior point x = y = z = 0.25 (blue), and spectra of the global kinetic energy in the cube (red). The interior spectra are dominated by the forcing frequency and its superharmonics; the broadband seen in the boundary spectra is greatly diminished and the subharmonic peaks from the boundary spectra are still evident, but weaker, corresponding to inertial oscillations in the interior driven by the boundary instability. The global K spectra are dominated by the boundary spectra, where the largest oscillations reside, as is evident from Video S3. Notice, however, that for precession, the various peaks in the global K spectra are 3 × the frequencies of those for the local spectra; this is due to the spatio-temporal symmetry (20).
The onset of instability appears to be due to a symmetry-breaking Neimark–Sacker bifurcation, a secondary Hopf-like bifurcation from a limit cycle that introduces a new second frequency ω NS [24]. Due to the quadratic nonlinearity in the Navier–Stokes equations, the temporal spectrum of the bifurcating two-torus state typically has peaks at ω , ω NS and all their linear combinations, with the peaks at low-order combinations typically being largest. With further increases in Ro , the two-torus breaks up, typically introducing a broad spectrum [25].
The presence of dominant peaks at 2 ω , ω NS , and 2 ω ω NS in the boundary spectra at Ro = 0.04 in Figure 9 is suggestive of a triadic resonance of inertial waves, but this is not the case. Such a triadic resonance would require the wavenumbers of the three inertial waves involved to also “add up”. The problem here is that we do not have these wavenumbers; the shear layer thickness (“wavenumber”) changes upon each reflection. The instability is of the oscillatory boundary layer interacting with the reflecting shear layers; at the points of reflection, the nonlinearity is large, and vortex stretching and tilting is strongly localized.
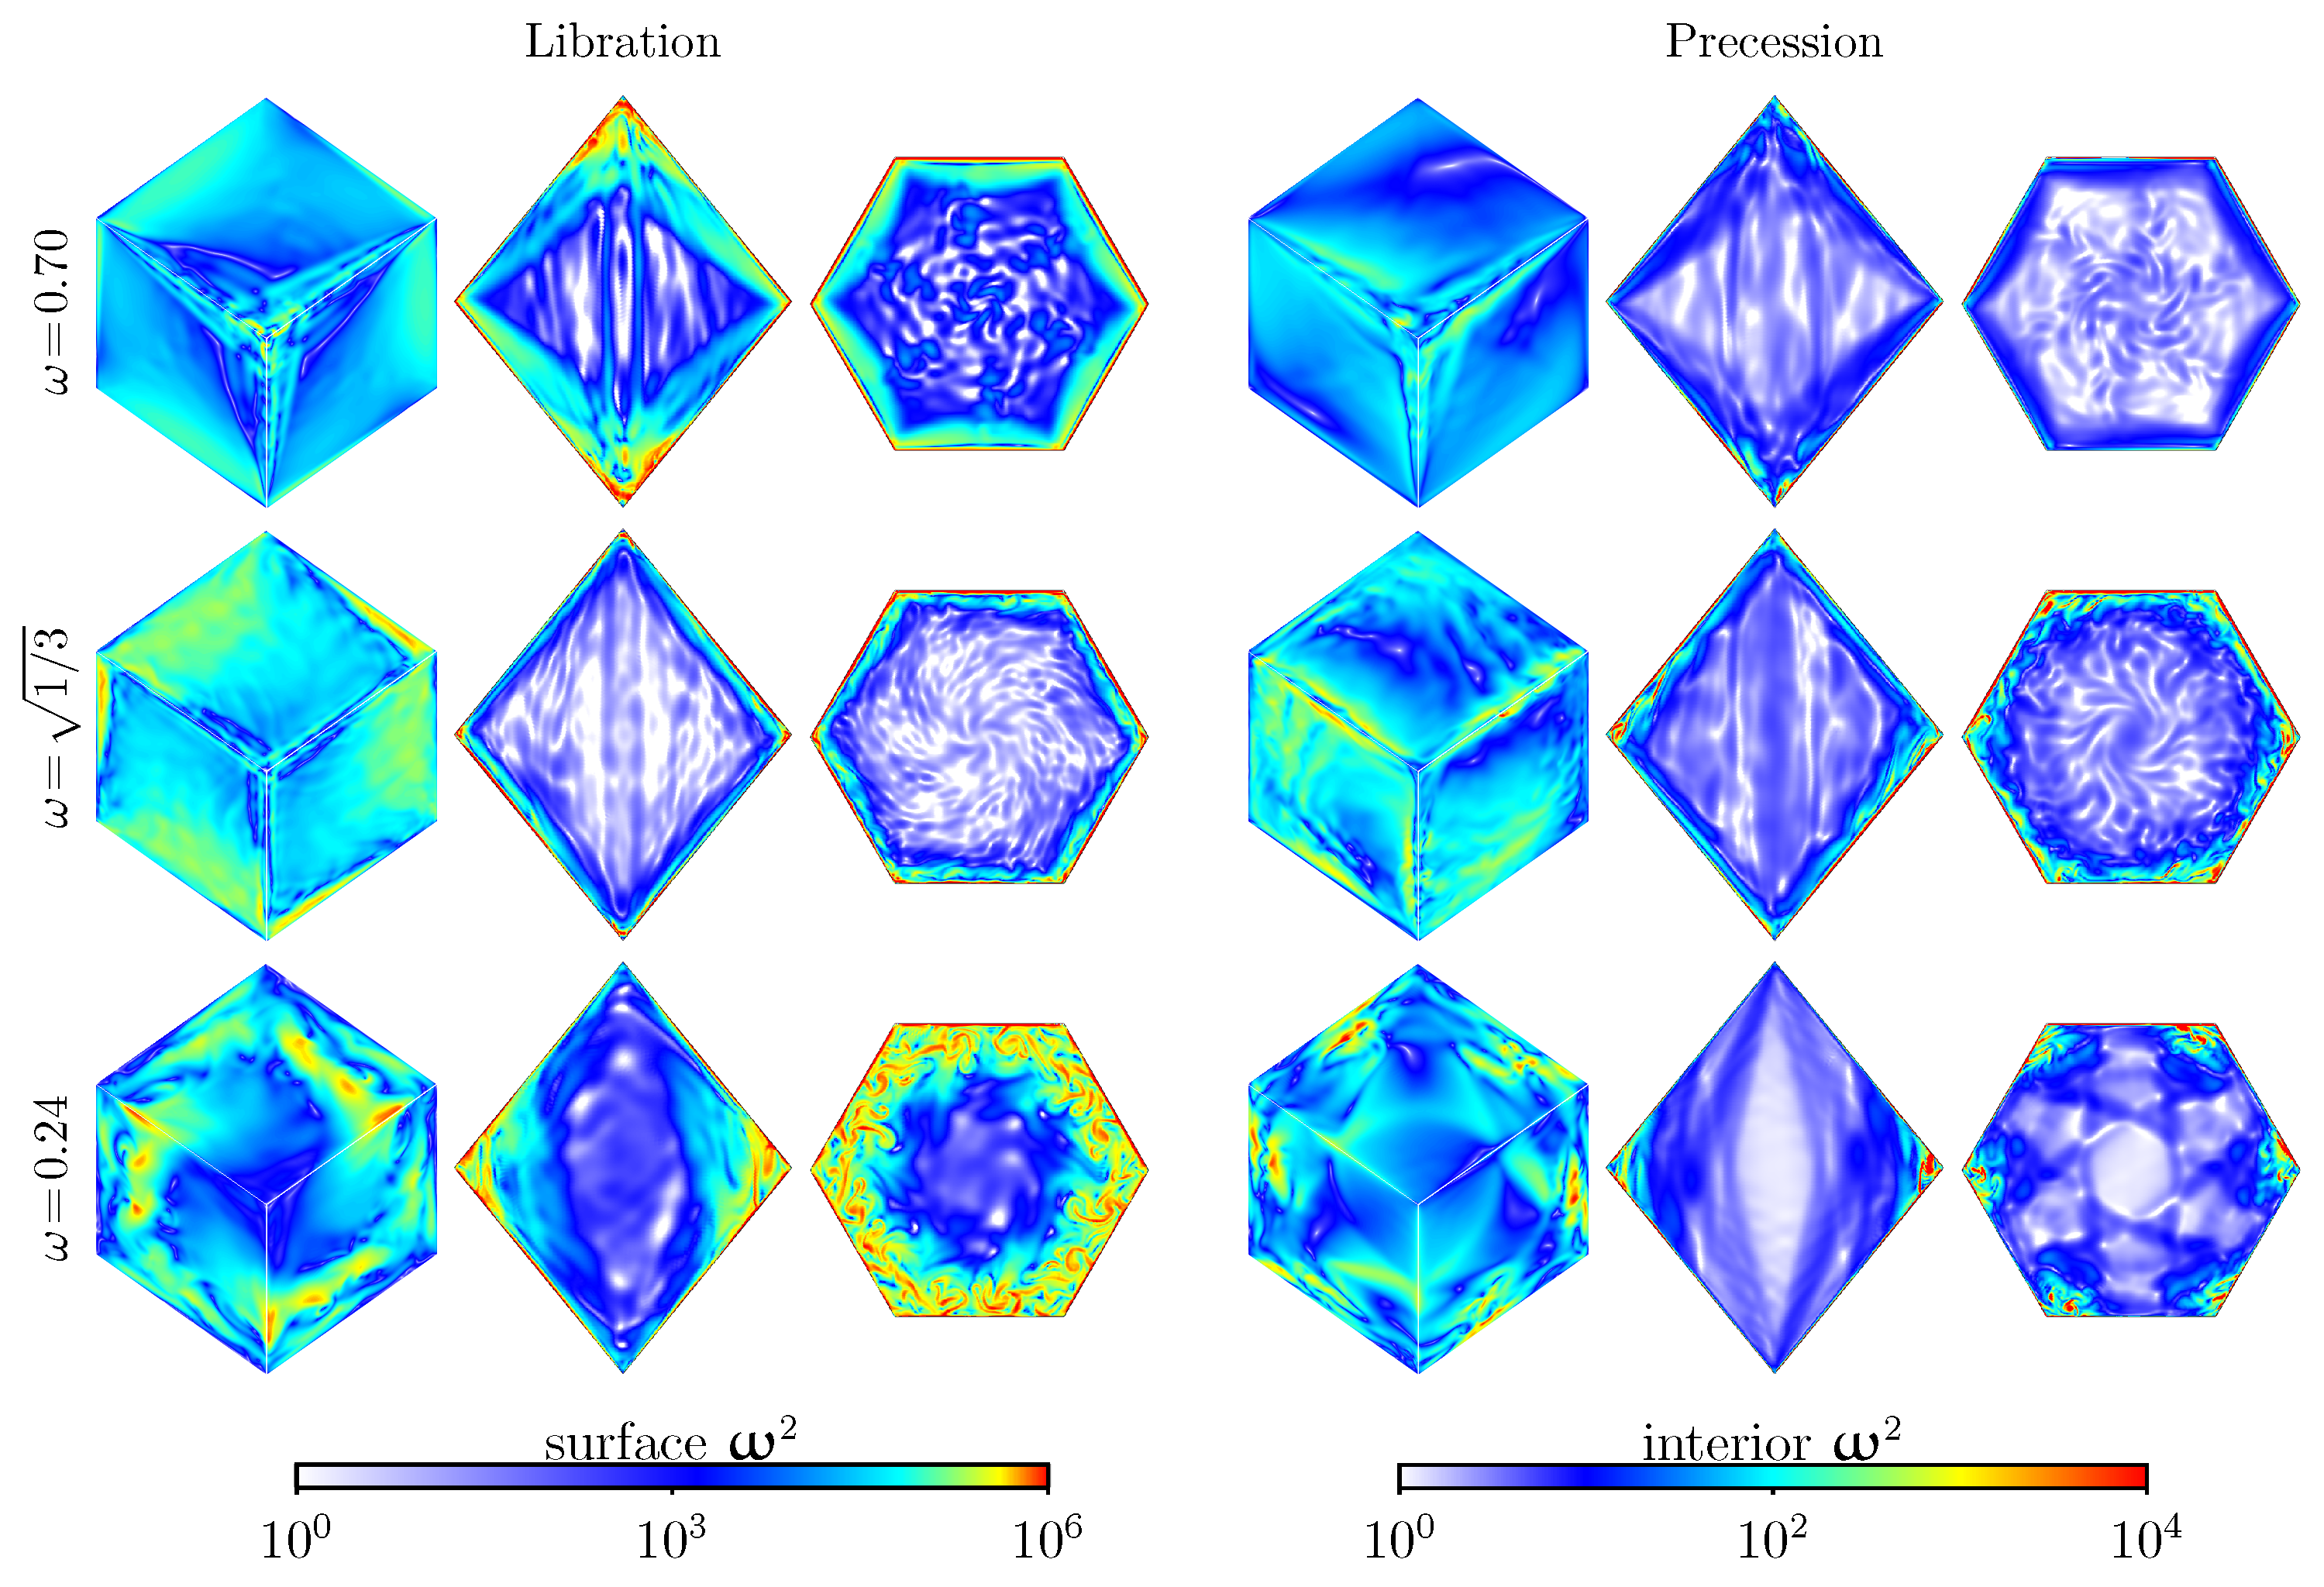
Figure 11 shows snapshots of ω 2 on the cube surface and in the meridional and equatorial planes for Ro = 0.04 . Supplementary Video S3 animates these symmetry-broken, non-periodic states over four forcing periods. The spatio-temporal details of these states are quite intricate, and the snapshots in the figure are inadequate for appreciating these; it is strongly recommended to view the video alongside reading this text.
In all cases, the instabilities are localized in the cube boundary layers. For ω = 0.70 , this is near the poles; for ω = 0.24 it is near the equator; while for ω = 1 / 3 , it is more widespread over the entire faces of the cube, but more prominent along the polar edges. These are all regions where the emitted shear layers tend to focus. With Ro = 0.04 , the nonlinear vortex stretching and tilting mechanisms are very active in these regions, contributing to the instability. The increased flow inertia at Ro = 0.04 manifests as a sloshing motion in the boundary layers, the details of which differ between libration and precession, akin to the difference between shaking and stirring. This leads to a lagged response between the boundary layer flows, which directly respond to the libration or precession, and the interior flow. The subharmonic peaks in the FFTs manifest as inertial oscillations in the interior. In the meridional planes, weak ω 2 bands are evident. These bands are roughly aligned at small angles relative to the rotation axis for ω = 0.70 , almost orthogonal to the rotation axis for ω = 0.24 , and in between for ω = 1 / 3 . These are consistent with the dispersion relation for linear inviscid inertial wavebeams (26). However, the equatorial plane shows these structures to be complicated and fully three-dimensional, manifesting swirling and sloshing motions. These additional inertial oscillations also interact with the mean shears, which break up into irregular columnar vortex structures principally aligned with the rotation axis. These are very similar to the so-called vortex clusters associated with the instability of inertial wave attractors observed in the experiments and simulations of Boury et al. [26]. A theoretical treatment of inertial wave instabilities in fully three-dimensional flows in finite containers is still lacking [27,28].

6. Discussion and Conclusions

Direct comparisons between the flow responses in a rapidly rotating container to libration and precession were investigated numerically. Such a comparison is not straightforward, as libration modulates the magnitude, and precession modulates the direction of the rotation vector. These differences result in systems with different spatio-temporal symmetries, which can generally be expected to result in distinct response flows. By matching the amplitudes and frequencies of the two forcing protocols, we explored differences in the resulting responses in a geometrically simple container, a cube, rotating around its diagonal.
Inertial wavebeams are beams of energy, associated with circularly polarized wave solutions of the linear, inviscid, unforced system obtained by setting α = 0 , E = 0 , and f = 0 in (11). These beams can be traced using our VEBA protocol, an informed ray tracing technique that takes into account points and the direction of emission from the vertices and edges of the cube and follows the beams’ reflections. As such, VEBA is identical for libration and precession. In the current configuration, with all walls oblique to the rotation axis, all beams eventually focus upon successive reflections to edges or vertices, whereby their wavevector magnitude and energy density increase. This focusing results in singular energy distributions called attractors [29], which are typical in containers with at least one oblique wall [30,31,32] or curved walls with positive net focusing [33,34].
In the linear but viscous setting, α = 0 and E > 0 , the (scaled) Euler force f is needed to sustain the oscillations and prevent the system from reverting to the static equilibrium v = 0 , very much like in a forced damped spring-mass system. Both E > 0 and f 0 contribute to the modifications of the polarized wave solutions obtained in the inviscid setting. While it is generally accepted that viscous regularization results in a broadening, of order E 1 / 3 , of the shear layers, our simulations show that these shear layers are also annihilated before reaching the inviscid attractor location, as viscous dissipation exceeds Coriolis effects upon focusing due to the increase in the beams’ wavenumber. This arresting of the focusing leaves room for the particular solution of the linear system due to the non-trivial forcing to manifest itself, in the form of synchronous, non-inertial waves. Such waves are clearly visible in Supplementary Video S1, where they are found along each tropical edge at ω = 0.24 , moving inward until eventually dissipating. They are quasi-geostrophic, essentially invariant in the axial direction, akin to topographic Rossby waves. The six waves originating from the six tropical edges are in phase for libration but 1/6 of a period out of phase with each other for precession. Their footprints in the core are quasi-standing waves for libration and quasi-rotating waves for precession.
For small forcing amplitudes α > 0 , the dynamics are essentially the same as in the linear α = 0 case, except for the appearance of a weak mean flow, which is more prominent, especially for libration, in the core along the axis of rotation at the largest of the forcing frequencies considered because of focusing near the poles. At the smallest forcing frequency considered, the mean flow is localized in oscillatory boundary layers in the equatorial region, away from the axis of rotation, and is completely dominated by the focusing and/or the linear non-inertial waves.
With increasing α , the limit cycle response flows become increasingly nonlinear, progressively deviating from temporal harmonic behavior, with both temporal superharmonics and a stronger mean flow developing as a result of inertial wave–wave interactions, including at reflection sites due to vortex tilting and stretching. The nonlinear limit cycles eventually lose stability with increasing α as the enstrophy of the mean flow grows to within a few percent of the mean enstrophy. The corresponding critical Ro varies with the type of forcing and the frequency. However, in all cases, the instability is symmetry-breaking and introduces additional frequencies in the response flows. These are broadband with subharmonic peaks. Recently, ref. [35] reported similar broadband behavior of instabilities in experiments with interior inertial wave attractors, interpreting the subharmonic peaks using the classic triadic resonance theory of inertial waves, with limited success. In our case, the instabilities appear to develop at the edges of the boundary layers as a result of interactions between the focusing inertial waves and the non-inertial boundary waves generated by the Euler force, for which no theory currently exists. Extending the present study to configurations that support both a wider “equatorial” region with shallow depth where inertial waves are annihilated and interior attractors exist would be of interest.

Supplementary Materials

The following supporting information can be downloaded at: https://www.mdpi.com/article/10.3390/fluids9070151/s1, Video S1: movie01, Video S2: movie02, Video S3: movie03.

Author Contributions

Conceptualization, K.W., B.D.W. and J.M.L.; methodology, K.W., B.D.W. and J.M.L.; software, K.W., B.D.W. and J.M.L.; formal analysis, K.W., B.D.W. and J.M.L.; writing—original draft preparation, K.W., B.D.W. and J.M.L.; writing—review and editing, K.W., B.D.W. and J.M.L.; visualization, K.W., B.D.W. and J.M.L. All authors have read and agreed to the published version of the manuscript.

Funding

This research received no external funding.

Data Availability Statement

Data is contained within the article or Supplementary Materials.

Acknowledgments

The authors thank ASU Research Computing and National Supercomputing Center in Chengdu for use of their facilities.

Conflicts of Interest

The authors declare no conflicts of interest.

Appendix A. Emission Direction of an Edgebeam

In general, determining the direction of emission of an edgebeam, i.e., a wavebeam emitted at a point along an edge, is complicated. For a straight edge bounded by two vertices A and B such that A emits a (half) cone of beams inside the cube while B emits none, this direction is determined by the tangentiality of the planar edge vortex sheet formed by all edgebeams emanating from the edge A B in the same direction, due to continuity constraints, with the cone with apex A [15]. The direction of emission a along the cone is parameterized by the azimuthal angle φ as in [15] (compare, eq4.5:)
a = ± 1 ω 2 Ω 0 + ω ( cos ( φ ) i + sin ( φ ) j ) ,
where { i , j , Ω 0 } forms a positively oriented orthonormal basis so that points M = A + t a lie on the cone. The tangentiality condition is then equivalent to the collinearity (∼) of the normal vectors to the planar edge sheet and the cone:
a × AB M t × M φ a × ( sin ( φ ) i + cos ( φ ) j ) = ω Ω 0 1 ω 2 ( cos ( φ ) i + sin ( φ ) j ) ,
i.e., equivalent to the orthogonality condition
AB · [ ω Ω 0 1 ω 2 ( cos ( φ ) i + sin ( φ ) j ) ] = 0 ,
which determines φ (mod π ). In using (A1), condition (A3) can also be written as AB · a = ± AB · Ω 0 / 1 ω 2 .
For ω < 1 / 3 , A = ( 0.5 , 0.5 , 0.5 ) (south pole), B = ( 0.5 , 0.5 , 0.5 ) (tropical vertex), i = ( 1 , 1 , 2 ) / 6 , and j = Ω 0 × i = ( 1 , 1 , 0 ) / 2 ( i , j , and Ω 0 are the three columns of P from (7)), condition (A3) with = (corresponding to the positive cone associated with ± = + in (A1)) yields
sin φ + π 6 = 1 2 cos ( φ ) + 3 2 sin ( φ ) = ω 2 ( 1 ω 2 ) .
Observe that (A4) admits two solutions φ , associated with supplementary angles φ + π / 6 , provided that ω < 2 / 3 , i.e., the edge is outside the cone. These two solutions correspond to two directions a ^ associated with the two planar edge sheets emitted from the edge. Note that (A4) differs from the values obtained from the protocol used in Wu et al. [3], which enforces the equality between components of a ^ . For small ω , variations in φ only impact (A1), slightly due to the presence of the factor ω in the component orthogonal to Ω 0 .

References

  1. Le Bars, M.; Cebron, D.; Le Gal, P. Flows driven by libration, precession, and tides. Annu. Rev. Fluid Mech. 2015, 47, 163–193. [Google Scholar] [CrossRef]
  2. Le Bars, M.; Barik, A.; Burmann, F.; Lathrop, D.P.; Noir, J.; Schaeffer, N.; Triana, S.A. Fluid Dynamics Experiments for Planetary Interiors. Surv. Geophys. 2022, 43, 229–261. [Google Scholar] [CrossRef]
  3. Wu, K.; Welfert, B.D.; Lopez, J.M. Librational forcing of a rapidly rotating fluid-filled cube. J. Fluid Mech. 2018, 842, 469–494. [Google Scholar] [CrossRef]
  4. Wu, K.; Welfert, B.D.; Lopez, J.M. Precessing cube: Resonant excitation of modes and triadic resonance. J. Fluid Mech. 2020, 887, A6. [Google Scholar] [CrossRef]
  5. Maas, L.R.M. On the amphidromic structure of inertial waves in a rectangular parallelepiped. Fluid Dynam. Res. 2003, 33, 373–401. [Google Scholar] [CrossRef]
  6. Boisson, J.; Lamriben, C.; Maas, L.R.M.; Cortet, P.P.; Moisy, F. Inertial waves and modes excited by the libration of a rotating cube. Phys. Fluids 2012, 24, 076602. [Google Scholar] [CrossRef]
  7. Welfert, B.D.; Lopez, J.M.; Wu, K. Inertial wave attractors in rapidly rotating tilted cuboids. Proc. R. Soc. A 2023, 479, 20220876. [Google Scholar] [CrossRef]
  8. Phillips, O.M. Energy transfer in rotating fluids by reflection of inertial waves. Phys. Fluids 1963, 6, 513–520. [Google Scholar] [CrossRef]
  9. Wu, K.; Welfert, B.D.; Lopez, J.M. Inertial wave attractors in librating cuboids. J. Fluid Mech. 2023, 973, A20. [Google Scholar] [CrossRef]
  10. Greenspan, H.P. On inviscid theory of rotating fluids. Stud. Appl. Math. 1969, 48, 19–28. [Google Scholar] [CrossRef]
  11. Beardsley, R.C. An experimental study of inertial waves in a closed cone. Stud. Appl. Math. 1970, 49, 187–196. [Google Scholar] [CrossRef]
  12. Greenspan, H.P. The Theory of Rotating Fluids; Cambridge University Press: Cambridge, UK, 1968. [Google Scholar]
  13. Wu, K.; Huang, F.K.; Shen, J. A new class of higher-order decoupled schemes for the incompressible Navier–Stokes equations and applications to rotating dynamics. J. Comput. Phys. 2022, 458, 111097. [Google Scholar] [CrossRef]
  14. Wu, K.; Welfert, B.D.; Lopez, J.M. Reflections and focusing of inertial waves in a librating cube with the rotation axis oblique to its faces. J. Fluid Mech. 2020, 896, A5. [Google Scholar] [CrossRef]
  15. Wu, K.; Welfert, B.D.; Lopez, J.M. Reflections and focusing of inertial waves in a tilted librating cube. J. Fluid Mech. 2022, 947, A10. [Google Scholar] [CrossRef]
  16. Lopez, J.M.; Shen, J.; Welfert, B.D.; Wu, K. Boundary-confined waves in a librating cube. J. Fluid Mech. 2022, 952, R2. [Google Scholar] [CrossRef]
  17. Wang, C.Y. Cylindrical tank of fluid oscillating about a state of steady rotation. J. Fluid Mech. 1970, 41, 581–592. [Google Scholar] [CrossRef]
  18. Lin, Y.; Noir, J. Libration-driven inertial waves and mean zonal flows in spherical shells. Geophys. Astrophys. Fluid Dyn. 2021, 115, 258–279. [Google Scholar] [CrossRef]
  19. Subbotin, S.; Shiryaeva, M. On the linear and non-linear fluid response to the circular forcing in a rotating spherical shell. Phys. Fluids 2021, 33, 066603. [Google Scholar] [CrossRef]
  20. Subbotin, S.; Shiryaeva, M. Steady vortex flow induced by inertial wave attractor in a librating cylinder with sloping ends. Microgravity Sci. Technol. 2022, 34, 89. [Google Scholar] [CrossRef]
  21. Subbotin, S.; Shmakova, N.; Kozlov, V.; Ermanyuk, E. Nonlinear regimes of inertial wave attractors generated by a precessing lid: Zonal flows and Rossby waves. Phys. Fluids 2023, 35, 074110. [Google Scholar] [CrossRef]
  22. Shiryaeva, M.; Subbotina, M.; Subbotin, S. Linear and non-Linear dynamics of inertial waves in a rotating cylinder with antiparallel inclined ends. Fluid Dyn. Mater. Process. 2024, 20, 787–802. [Google Scholar] [CrossRef]
  23. Rubio, A.; Lopez, J.M.; Marques, F. Interacting oscillatory boundary layers and wall modes in modulated rotating convection. J. Fluid Mech. 2009, 625, 75–96. [Google Scholar] [CrossRef]
  24. Kuznetsov, Y.A. Elements of Applied Bifurcation Theory, 3rd ed.; Springer: Berlin/Heidelberg, Germany, 2004. [Google Scholar]
  25. Afrajmovich, V.S.; Shil’nikov, L.P. Invariant two-dimensional tori, their breakdown and stochasticity. Am. Math. Soc. Transl. 1991, 149, 201–212. [Google Scholar]
  26. Boury, S.; Sibgatullin, I.; Ermanyuk, E.; Shmakova, N.; Odier, P.; Joubaud, S.; Maas, L.R.M.; Dauxois, T. Vortex cluster arising from an axisymmetric inertial wave attractor. J. Fluid Mech. 2021, 926, A12. [Google Scholar] [CrossRef]
  27. Sibgatullin, I.N.; Ermanyuk, E.V. Internal and inertial wave attractors: A review. J. Appl. Mech. Tech. Phys. 2019, 60, 284–302. [Google Scholar] [CrossRef]
  28. Mora, D.O.; Monsalve, E.; Brunet, M.; Dauxois, T.; Cortet, P.P. Three-dimensionality of the triadic resonance instability of a plane inertial wave. Phys. Rev. Fluids 2021, 6, 074801. [Google Scholar] [CrossRef]
  29. Rieutord, M.; Georgeot, B.; Valdettaro, L. Wave attractors in rotating fluids: A paradigm for ill-posed Cauchy problems. Phys. Rev. Lett. 2000, 85, 4277–4280. [Google Scholar] [CrossRef]
  30. Maas, L.R.M. Wave focusing and ensuing mean flow due to symmetry breaking in rotating fluids. J. Fluid Mech. 2001, 437, 13–28. [Google Scholar] [CrossRef]
  31. Maas, L.R.M. Wave attractors: Linear yet nonlinear. Int. J. Bifurc. Chaos 2005, 15, 2757–2782. [Google Scholar] [CrossRef]
  32. Borcia, I.D.; Harlander, U. Inertial waves in a rotating annulus with inclined inner cylinder: Comparing the spectrum of wave attractor frequency bands and the eigenspectrum in the limit of zero inclination. Theor. Comput. Fluid Dyn. 2013, 27, 397–413. [Google Scholar] [CrossRef]
  33. Rieutord, M.; Georgeot, B.; Valdettaro, L. Inertial waves in a rotating spherical shell: Attractors and asymptotic spectrum. J. Fluid Mech. 2001, 435, 103–144. [Google Scholar] [CrossRef]
  34. Favier, B.; Le Dizès, S. Inertial wave super-attractor in a truncated elliptic cone. J. Fluid Mech. 2024, 980, A6. [Google Scholar] [CrossRef]
  35. Brunet, M.; Dauxois, T.; Cortet, P.P. Linear and nonlinear regimes of an inertial wave attractor. Phys. Rev. Fluids 2019, 4, 034801. [Google Scholar] [CrossRef]
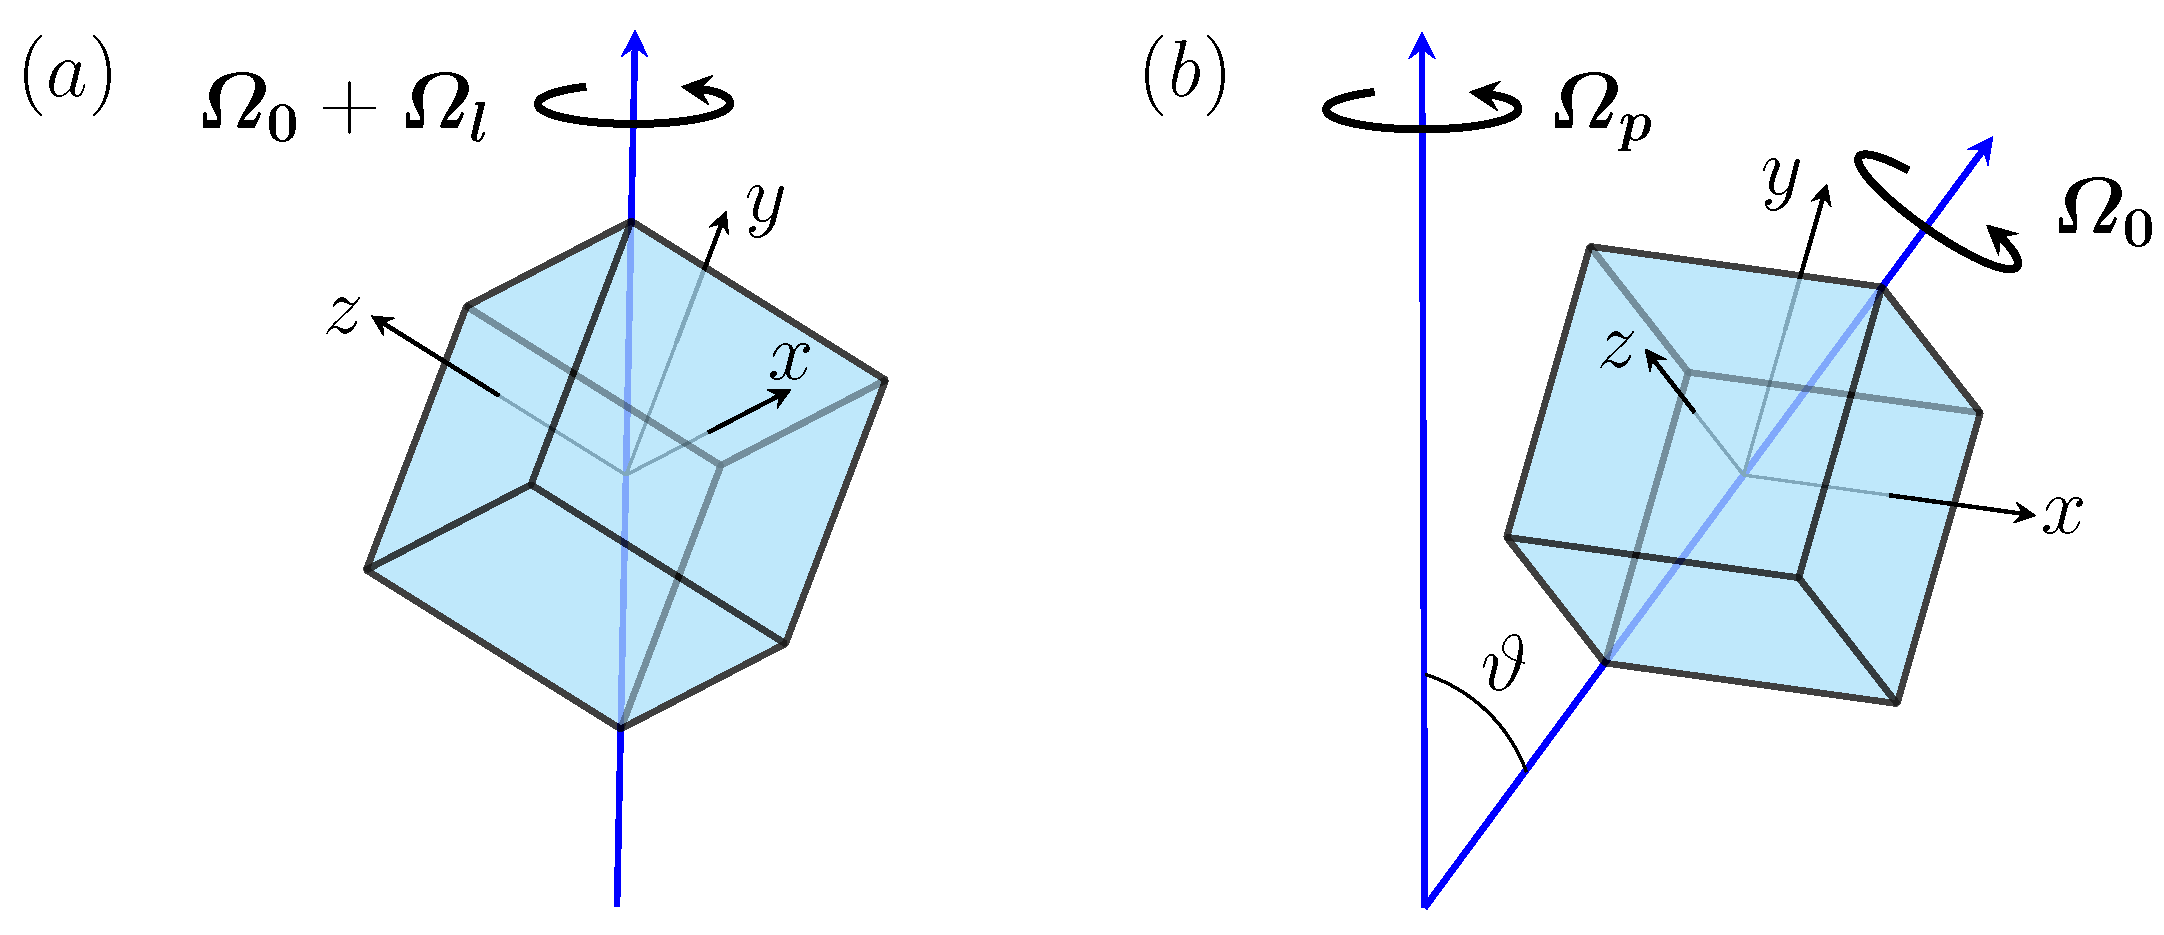
Figure 1. Schematics of (a) the librating cube and (b) the precessing cube.
Fluids 09 00151 g001
Figure 2. Intersections of wavebeams on (a) the cube surface (rotation axis pointing out of the page), (b) in the meridional plane (rotation axis vertical in the page), and (c) in the equatorial plane (rotation axis pointing out of the page), for ω as indicated, as determined using the vertex and edge beam analysis VEBA in the E = α = 0 linear inviscid setting. The colors from blue to red indicate the increase in the wavebeam enstrophy density due to the focusing on the successive wall reflections. See [14] for illustrations of trajectories of selected beams from vertices and edges (albeit with a slightly different direction of emission, as discussed in Section 3.1).
Fluids 09 00151 g002
Figure 3. Snapshot of ω 2 on the surface and in the meridional and equatorial planes at E = 10 5 and Ro = 0 for both libration and precession at ω as indicated. Supplementary Video S1 animates these states over one forcing period.
Fluids 09 00151 g003
Figure 4. Time-averaged enstrophy density, | × v | 2 ¯ , on the surface and in the meridional and equatorial planes at E = 10 5 and Ro = 0 for both libration and precession at ω as indicated.
Fluids 09 00151 g004
Figure 5. Snapshot of ω 2 on the surface and in the meridional and equatorial planes at E = 10 5 and Ro = 0.01 for both libration and precession at ω as indicated. Supplementary Video S2 animates these states over one forcing period.
Fluids 09 00151 g005
Figure 6. Time-averaged enstrophy density, | × v | 2 ¯ , on the surface and in the meridional and equatorial planes at E = 10 5 and Ro = 0.01 for both libration and precession at ω as indicated.
Fluids 09 00151 g006
Figure 7. Enstrophy density of the mean flow, | × v ¯ | 2 , on the surface and in the meridional and equatorial planes at E = 10 5 and Ro = 0.01 for both libration and precession at ω as indicated.
Fluids 09 00151 g007
Figure 8. Variation with Ro of the mean enstrophy, E ¯ ( v ) , and the enstrophy of the mean flow, E ( v ¯ ) , for (a) libration and (b) precession at E = 10 5 and ω as indicated; the second panel in each part is a zoom-in of the first panel.
Fluids 09 00151 g008
Figure 9. Power spectral densities (PSDs) from the time series of the y-component of velocity at points ( 0.456 , 0.456 , 0.456 ) for ω = 0.24 (near an equatorial vertex), ( 0.475 , 0 , 0 ) for ω = 1 / 3 (near the center of one wall), and ( 0.456 , 0.456 , 0.456 ) for ω = 0.70 (near the south polar vertex), for libration and precession at Ro as indicated.
Fluids 09 00151 g009
Figure 10. Power spectral densities (PSDs) at Ro = 0.04 from the time series of the y-component of velocity at the points used in Figure 9 (gray), from the y-velocity at an interior point, x = y = z = 0.25 (blue), and from the global kinetic energy K (red).
Fluids 09 00151 g010
Figure 11. Snapshot of ω 2 on the surface and in the meridional and equatorial planes at E = 10 5 and Ro = 0.04 for both libration and precession at ω as indicated. Supplementary Video S3 animates these states over four forcing periods.
Fluids 09 00151 g011
Disclaimer/Publisher’s Note: The statements, opinions and data contained in all publications are solely those of the individual author(s) and contributor(s) and not of MDPI and/or the editor(s). MDPI and/or the editor(s) disclaim responsibility for any injury to people or property resulting from any ideas, methods, instructions or products referred to in the content.